Article

Numerical Investigation of Stage Separation Control of Tandem Hypersonic Vehicles Based on Lateral Jet

1
Key Laboratory of Unsteady Aerodynamics and Flow Control, Ministry of Industry and Information Technology, Nanjing University of Aeronautics and Astronautics, Nanjing 210016, China
2
Shenyang Aircraft Design & Research Institute, Shenyang 110000, China
*
Author to whom correspondence should be addressed.
Aerospace 2025, 12(4), 286; https://doi.org/10.3390/aerospace12040286
Submission received: 15 February 2025 / Revised: 25 March 2025 / Accepted: 25 March 2025 / Published: 28 March 2025

Abstract

:
The stage separation of hypersonic vehicles is critically challenged by severe aerodynamic interference, which induces significant attitude deviations and jeopardizes subsequent flight missions. This study investigates open-loop and closed-loop attitude control methods utilizing lateral jets to stabilize the forebody during separation. Dynamic CFD-based numerical simulations were conducted for a tandem hypersonic vehicle, analyzing trajectories and aerodynamic characteristics under free separation, open-loop, and closed-loop control. Results show that open-loop control achieves a maximum forebody pitch angle of only 0.27° at α = 0 ° , but performance degrades drastically to 24.88° at α = 2.5 ° , highlighting its sensitivity to freestream variations. In contrast, a cascade PID-based closed-loop control system dynamically adjusts lateral jet total pressure, reducing the maximum pitch angle to 0.006° at α = 0 ° and maintaining it below 0.2° even at α = 5.0 ° . The closed-loop system exhibits periodic fluctuations in jet pressure, with amplitude increasing alongside angle of attack, yet demonstrates superior robustness against aerodynamic disturbances. Flow field analysis reveals enhanced shockwave interactions and vortex dynamics under closed-loop control, effectively mitigating pitch instability. While open-loop methods are constrained to specific conditions, closed-loop control significantly broadens applicability across variable flight environments.

1. Introduction

The stage separation of hypersonic vehicles is crucial to the success of flight, thus it has gradually become one of the research hotspots. The stage separation process of hypersonic vehicles typically occurs in a high-altitude, high-speed environment, where complex aerodynamic interferences such as shock– shock and shock– boundary layer interactions exist between the vehicle and the booster during separation [1]. The aerodynamic forces acting on the vehicle change dramatically, which may lead to significant changes in the vehicle’s attitude, resulting in a collision with the booster and ultimately failure of the separation. Therefore, researching the stage separation problem of hypersonic vehicles is significant. Currently, the main research methodologies in this field include flight tests, wind tunnel experiments [2,3,4], and numerical simulations [5,6,7].
Flight tests are capable of replicating real flight environments and generating high-fidelity data, which are critical for validating wind tunnel experiments and numerical simulations. In 2005, the United States successfully conducted a stage separation flight test of the X-43A vehicle [8]. In 2009, the new generation Ares I launch vehicle in the United States successfully achieved stage separation during its inaugural flight test, validating the feasibility of retro-propulsion separation [9]. However, flight tests are not only costly but also carry significant risks, and therefore only used as the final means of validating design objectives. Compared to flight tests, wind tunnel experiments offer advantages such as higher safety and better repeatability. Until now, wind tunnel testing remains an important method for studying stage separation issues. Bordelon et al. [10] conducted static wind tunnel tests on a two-stage-to-orbit (TSTO) vehicle model and found that the aerodynamic forces on the booster were primarily influenced by complex shockwaves at the nose, and that the relative positioning of the two stages affected the static stability of the booster. Since the majority of existing studies have focused on analyzing transverse stage separation between parallel stages in TSTO systems, Wang et al. [11] conducted a systematic investigation on the separation of TSTO vehicles during longitudinal stage separation (LSS). Through experimental validation, their research demonstrated both the operational safety and technical feasibility of implementing LSS in TSTO configurations. Hohn O. M. [12] conducted experiments on the stage separation process of the VEGA rocket in the H2K hypersonic wind tunnel at the German Aerospace Center, studying the effects of the retrorocket injection pressure ratio and angle of attack on stage separation. The results indicated significant flow separation around nearly the entire upper stage due to the retrorocket plumes already at low injection pressure ratios. As the angle of attack swept, the flow field structure changed dramatically. However, despite being an important method for studying stage separation, wind tunnel experiments have limitations, such as support interference and model differences, which lead to discrepancies between wind tunnel data and actual flight results.
Since the 1990s, with the development of computer technology and numerical solution methods, numerical simulation has gradually become an important research tool for studying stage separation issues. Moelyadi et al. [13,14] conducted a study on the aerodynamic characteristics of two-stage systems under both steady and unsteady conditions. The simulation results indicated that the interaction of incident shockwaves, reflected shockwaves, and expansion waves can cause significant aerodynamic interference, leading to severe effects on stage separation. Wang et al. [15] investigated the effect of the orbiter’s center of gravity on the trajectory and aerodynamic characteristics during separation. They found that safe separation is only possible when the center of gravity lies within a specific range; in other cases, it can lead to collisions between the orbiter and booster or excessive changes in the orbiter’s attitude. Liu et al. [16] employed dynamic overset grid technology to investigate the effect of angle of attack on the safety of stage separation. The results showed that safe separation is only possible when the angle of attack is α = 2°. Wang et al. [17] conducted numerical simulations on a TSTO model to explore the impact of the orbiter’s lift-off angle on stage separation. They found that the intensity of aerodynamic interference between the two stages increases with the lifting angle of the orbiter, and safe separation can only be achieved when the orbiter’s lifting angle is between 6° and 8°. Li et al. [18] coupled computational fluid dynamics (CFD) with flight mechanics to conduct numerical simulations of multi-stage rocket hot separation under various initial conditions. The results demonstrated that the two stages generally remained stable during the separation. However, the second stage exhibited a significant pitch angular velocity during separation, which must be taken into consideration when designing rocket control systems. The aforementioned literature indicates that factors such as aerodynamic interference, the center of gravity, and angle of attack have a significant impact on stage separation. Variations in these parameters can lead to separation failure, thus requiring attitude control of the spacecraft during the stage separation. Lateral jet, as the most used control method in reaction control systems, not only offers rapid response and high efficiency but also effectively operates in high-altitude regions. It is currently widely used in hypersonic vehicles such as space shuttles, spacecraft re-entry capsules, and boost glide missiles. Prior to the implementation of the lateral jet for attitude control in hypersonic vehicles, substantial research efforts were devoted to the investigation of the lateral jet [19,20,21]. Erdem et al. [22] conducted experimental investigations on various lateral jet mediums, revealing that air and CO2 jets exhibited comparable penetration patterns in both nearfield and farfield regions, whereas the helium jet demonstrated minimal propagation within the nearfield domain. Zhang et al. [23] conducted numerical simulations to investigate the influence of nozzle geometry on lateral jet flow characteristics. Their findings revealed that the flow field generated by circular nozzles demonstrated the closest agreement with experimental data. In contrast, elliptical nozzles exhibited a larger separation region ahead of the nozzle exit, which significantly enhanced control efficiency. Based on extensive research into the mechanisms of lateral jet interactions and the structural characteristics of disturbed flow fields, scholars have further investigated the application of the lateral jet in stage separation. Kontis et al. [24] conducted an experimental investigation into the effects of the lateral jet on the aerodynamic characteristics of slender missiles. Min et al. [25] studied the effects of jet pressure ratio, jet Mach number, and nozzle position on the missile’s normal force and pitch moment. Graham et al. [26] investigated the effects of different angles of attack, jet mass flow rate, and jet velocity on lateral jet control effectiveness. The results indicated that the angle of attack has a minor effect on lateral jet control, while the jet mass flow rate and jet velocity have a significant impact on lateral jet control effectiveness. Regarding the influence of angle of attack on lateral jet control effectiveness, Liang Wei’s [27] study reached a different conclusion. He conducted a study on the effect of angle of attack on the aerodynamic interference of the lateral jet used for attitude control. The findings showed that when the lateral jet is located on the windward side, the aerodynamic interference varies significantly, weakening the control capability of the lateral jet. However, when located on the leeward side, the aerodynamic interference is smaller, and the lateral jet control capability is stronger. Jia M. et al. [28] conducted a steady-state numerical study on the lateral jet interference field for a double-cone missile model at different Mach numbers and angles of attack. The results indicated that as the Mach number increases, the control effectiveness of the lateral jet improves. Additionally, the interference forces/moments do not change linearly with the angle of attack, and significant differences in flow characteristics were observed when the lateral jet was positioned on the windward and leeward sides. Gao et al. [29] performed numerical simulations of the jet flow interference field under both non-rotating and rotating conditions, analyzing the impact of rotation on lateral jet control effectiveness.
The existing literature has extensively studied the control capabilities of the lateral jet under steady-state conditions, laying the foundation for its application. However, in the actual stage separation process, unsteady issues occur, such as the startup and shutdown of pulse engines, as well as the movement of vortices and shockwaves. The control effectiveness of the lateral jet is affected by the unsteady changes in the spacecraft’s attitude and flow field. Currently, there is limited research on lateral jet control under dynamic flight conditions. Therefore, studying the control effectiveness of the lateral jet under unsteady conditions is important.
To address these issues, this study conducted numerical simulations of the stage separation in an uncontrolled state, and based on these results, research was carried out on lateral jet-based stage separation control methods. The study first selected a tandem hypersonic vehicle as the research object and analyzed the trajectory and aerodynamic characteristics of the two stages in the uncontrolled state. Then, to reduce the pitch angle of the forebody after separation, lateral jet was used for open-loop control of the forebody’s pitch angle. Finally, to further enhance the applicability of lateral jet control, a study was conducted on lateral jet-based stage separation closed-loop attitude control methods, based on a cascade PID control method. The remainder of this paper is organized as follows: Section 2 presents the numerical methodology employed for simulating stage separation. Section 3 conducts a comparative analysis of the trajectory and aerodynamic characteristics under free separation, open-loop control, and closed-loop control. The concluding remarks are provided in Section 4.

2. Numerical Method for Multi-Body Separation

2.1. Governing Equations and Numerical Methods

The governing equations for the numerical simulation of stage separation are the three-dimensional compressible Navier–Stokes (NS) equations, expressed as follows [30]:
t Ω W d Ω + Ω F c F v d S = 0
where W represents the vector of conservative variables, F c is the vector of convective fluxes, and F v is the vector of viscous fluxes which are defined in the following equation:
W = ρ ρ u ρ v ρ w ρ E ,   F c = ρ V r ρ u V r + n x p ρ v V r + n y p ρ w V r + n z p ρ H V r + p V g ,   F v = 0 n x τ x x + n y τ x y + n z τ x z n x τ y x + n y τ y y + n z τ y z n x τ z x + n y τ z y + n z τ z z n x Θ x + n y Θ y + n z Θ z
where ρ represents the fluid density; p denotes the static pressure; τ i j is the viscous stress; E and H are the total energy and total enthalpy per unit mass, respectively; u ,   v , and w represent the velocity components in the x ,   y , and z directions, respectively; n x ,   n y , and n z denote the components of the unit outward normal vector of the boundary; Θ x ,   Θ y , and Θ z are the heat flux components; and V r is the contravariant velocity relative to the motion of the grid:
V r = V V g = u u g n x + v v g n y + w w g n z
where V g = u g n x + v g n y + w g n z is the contravariant velocity at the surface Ω of the control volume.
To close the governing equations, it is also necessary to add the ideal gas equation of state, which is
p = ρ R T
In this work, the governing equations are solved by using a cell-vertex finite volume method, where the convective flux F c is calculated using the AUSM+ scheme, while the viscous flux F v is calculated using cell-centered methods. Pseudotime marching is implemented with the implicit lower-upper symmetric Gauss–Seidel (LU-SGS) scheme, and the dual time-stepping method is selected for the temporal march. The pressure far-field condition is used as the inflow boundary condition when simulating freestream, and the pressure inlet boundary condition is applied at the jet inlet. The Spalart–Allmaras (SA) turbulence model is extensively utilized in aerospace numerical simulations owing to its low computational requirements and superior stability. Consequently, this study employs the SA turbulence model for simulating turbulence. A detailed description of the numerical methods and CFD solver can be found in [31].

2.2. Rigid Body Dynamics Motion Model

In this study, the elastic deformation of the moving object is not considered. The motion of the moving object can be described using the rigid body six degrees of freedom equations, including the translational equations of the mass center and the rotational equations around the mass center.
In the inertial coordinate system, the rigid body six degrees of freedom equations can be represented as follows:
m d V x d t V y ω z + V z ω y = F x m d V y d t V z ω x + V x ω z = F y m d V z d t V x ω y + V y ω x = F z
I x x d ω x d t I y y I z z ω y ω z = M x I y y d ω y d t I z z I x x ω z ω x = M y I z z d ω z d t I x x I y y ω x ω y = M z
Equation (5) represents the translational equation of the mass center, and (6) represents the rotational equation about the mass of center. In these equations, m is the mass of the body; V x ,     V y , and V z represent the velocities of the body in the three directions of the body coordinate system; ω x ,     ω y , and ω z represent the angular velocities of the body in the three directions of the body coordinate system; F x ,     F y , and F z are the forces on the body in the three directions of the body coordinate system, including aerodynamic force, external force, and gravity; I x x ,     I y y , and I z z are the principal moments of inertia of the separated body; M x ,     M y , and M z are the moments acting on the body in the three directions of the body coordinate system.

2.3. Dynamic Grid Method for Moving Boundaries

In the problem of multi-body separation, there are multiple objects in relative motion, requiring the adjustment of the grid to handle moving boundary issues. Compared with other methods, the overset grid method is suitable for simulating large displacement problems and can maintain good grid quality, so this paper adopts the overset grid method to address the moving boundary problems in stage separation [32]. The overset grid method, first proposed by Benek et al. [33], involves dividing the computational domain into several overlapping subdomains, generating grids for each subdomain separately, and using grid interpolation within overlapping regions to transfer flow information between subdomains during computation. This method features low grid generation difficulty and high grid quality.
For the stage separation problem, this paper couples flow governing equations and six degrees of freedom motion equations. The moving boundary problem is handled using the overset grid method. The diagram of this simulation is shown in Figure 1.

2.4. Validation of Numerical Methods

Before conducting numerical simulations, it is crucial to validate the numerical methods. The wing/pylon/finned-store (WPFS) model serves as a standard benchmark for validating dynamic overset grids [34]. This model consists of a delta wing, a pylon, and a finned store, as shown in Figure 2. In this study, we utilize this model to verify the numerical methods. When the drop distance is less than 0.1 m, the store moves downward under additional forces and then transitions into free fall. The mass properties of the store and the parameters for ejection forces are set according to [35].
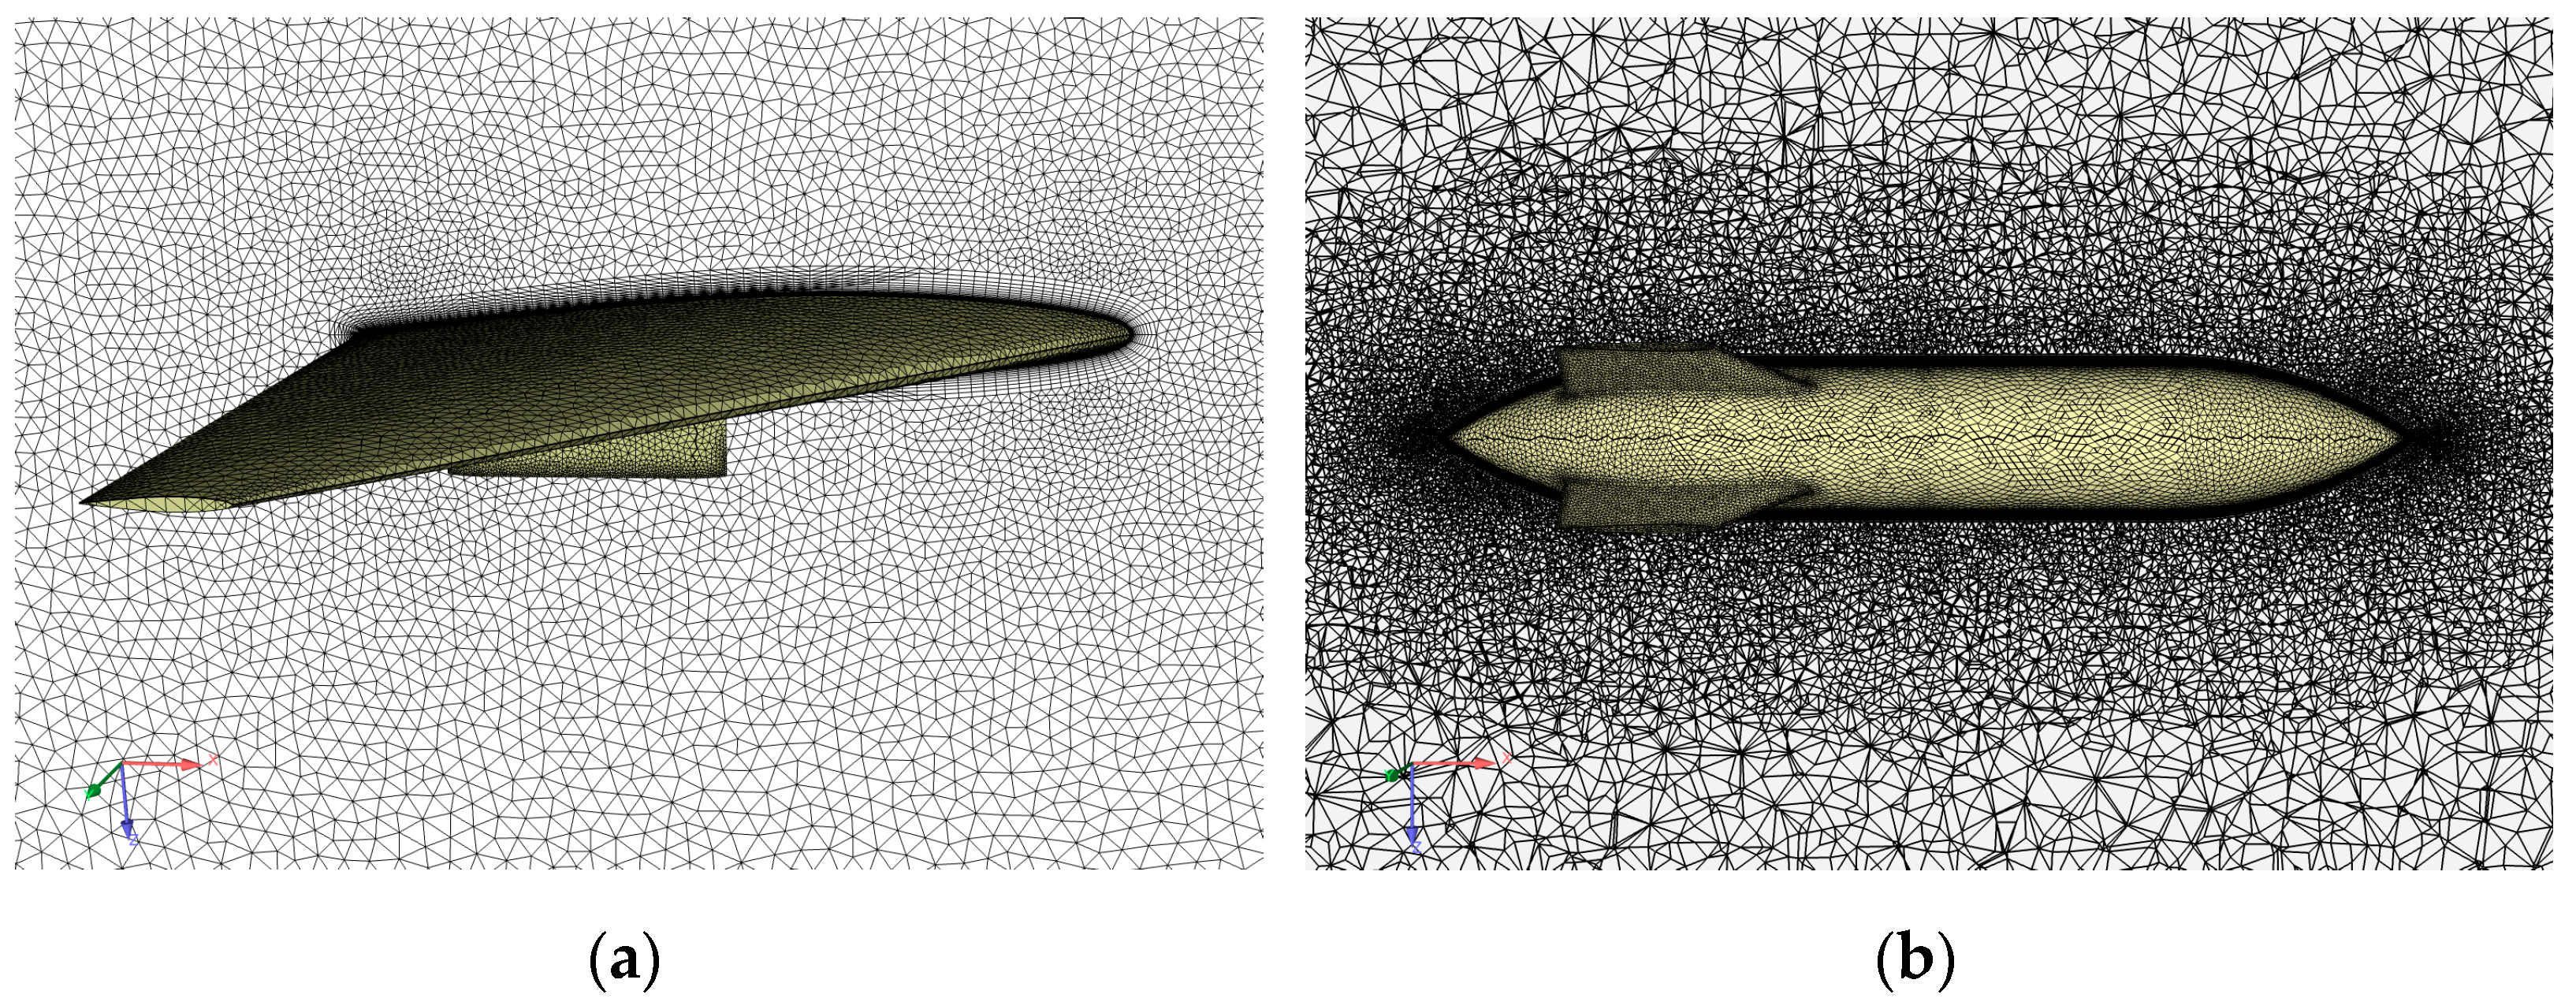
This paper utilizes unstructured grids for meshing the WPFS model, dividing the grid into two components: the wing/pylon grid and the store grid. The wing/pylon grid serves as the background grid, while the store grid functions as the foreground grid. The number of grid cells in the wing/pylon grid is 3.3 million, and the store grid has 3.48 million cells. To enhance computational efficiency while maintaining high accuracy, grid refinement was applied to the leading and trailing edges as well as the tail of the store. Figure 3 illustrates the details of these two grids.
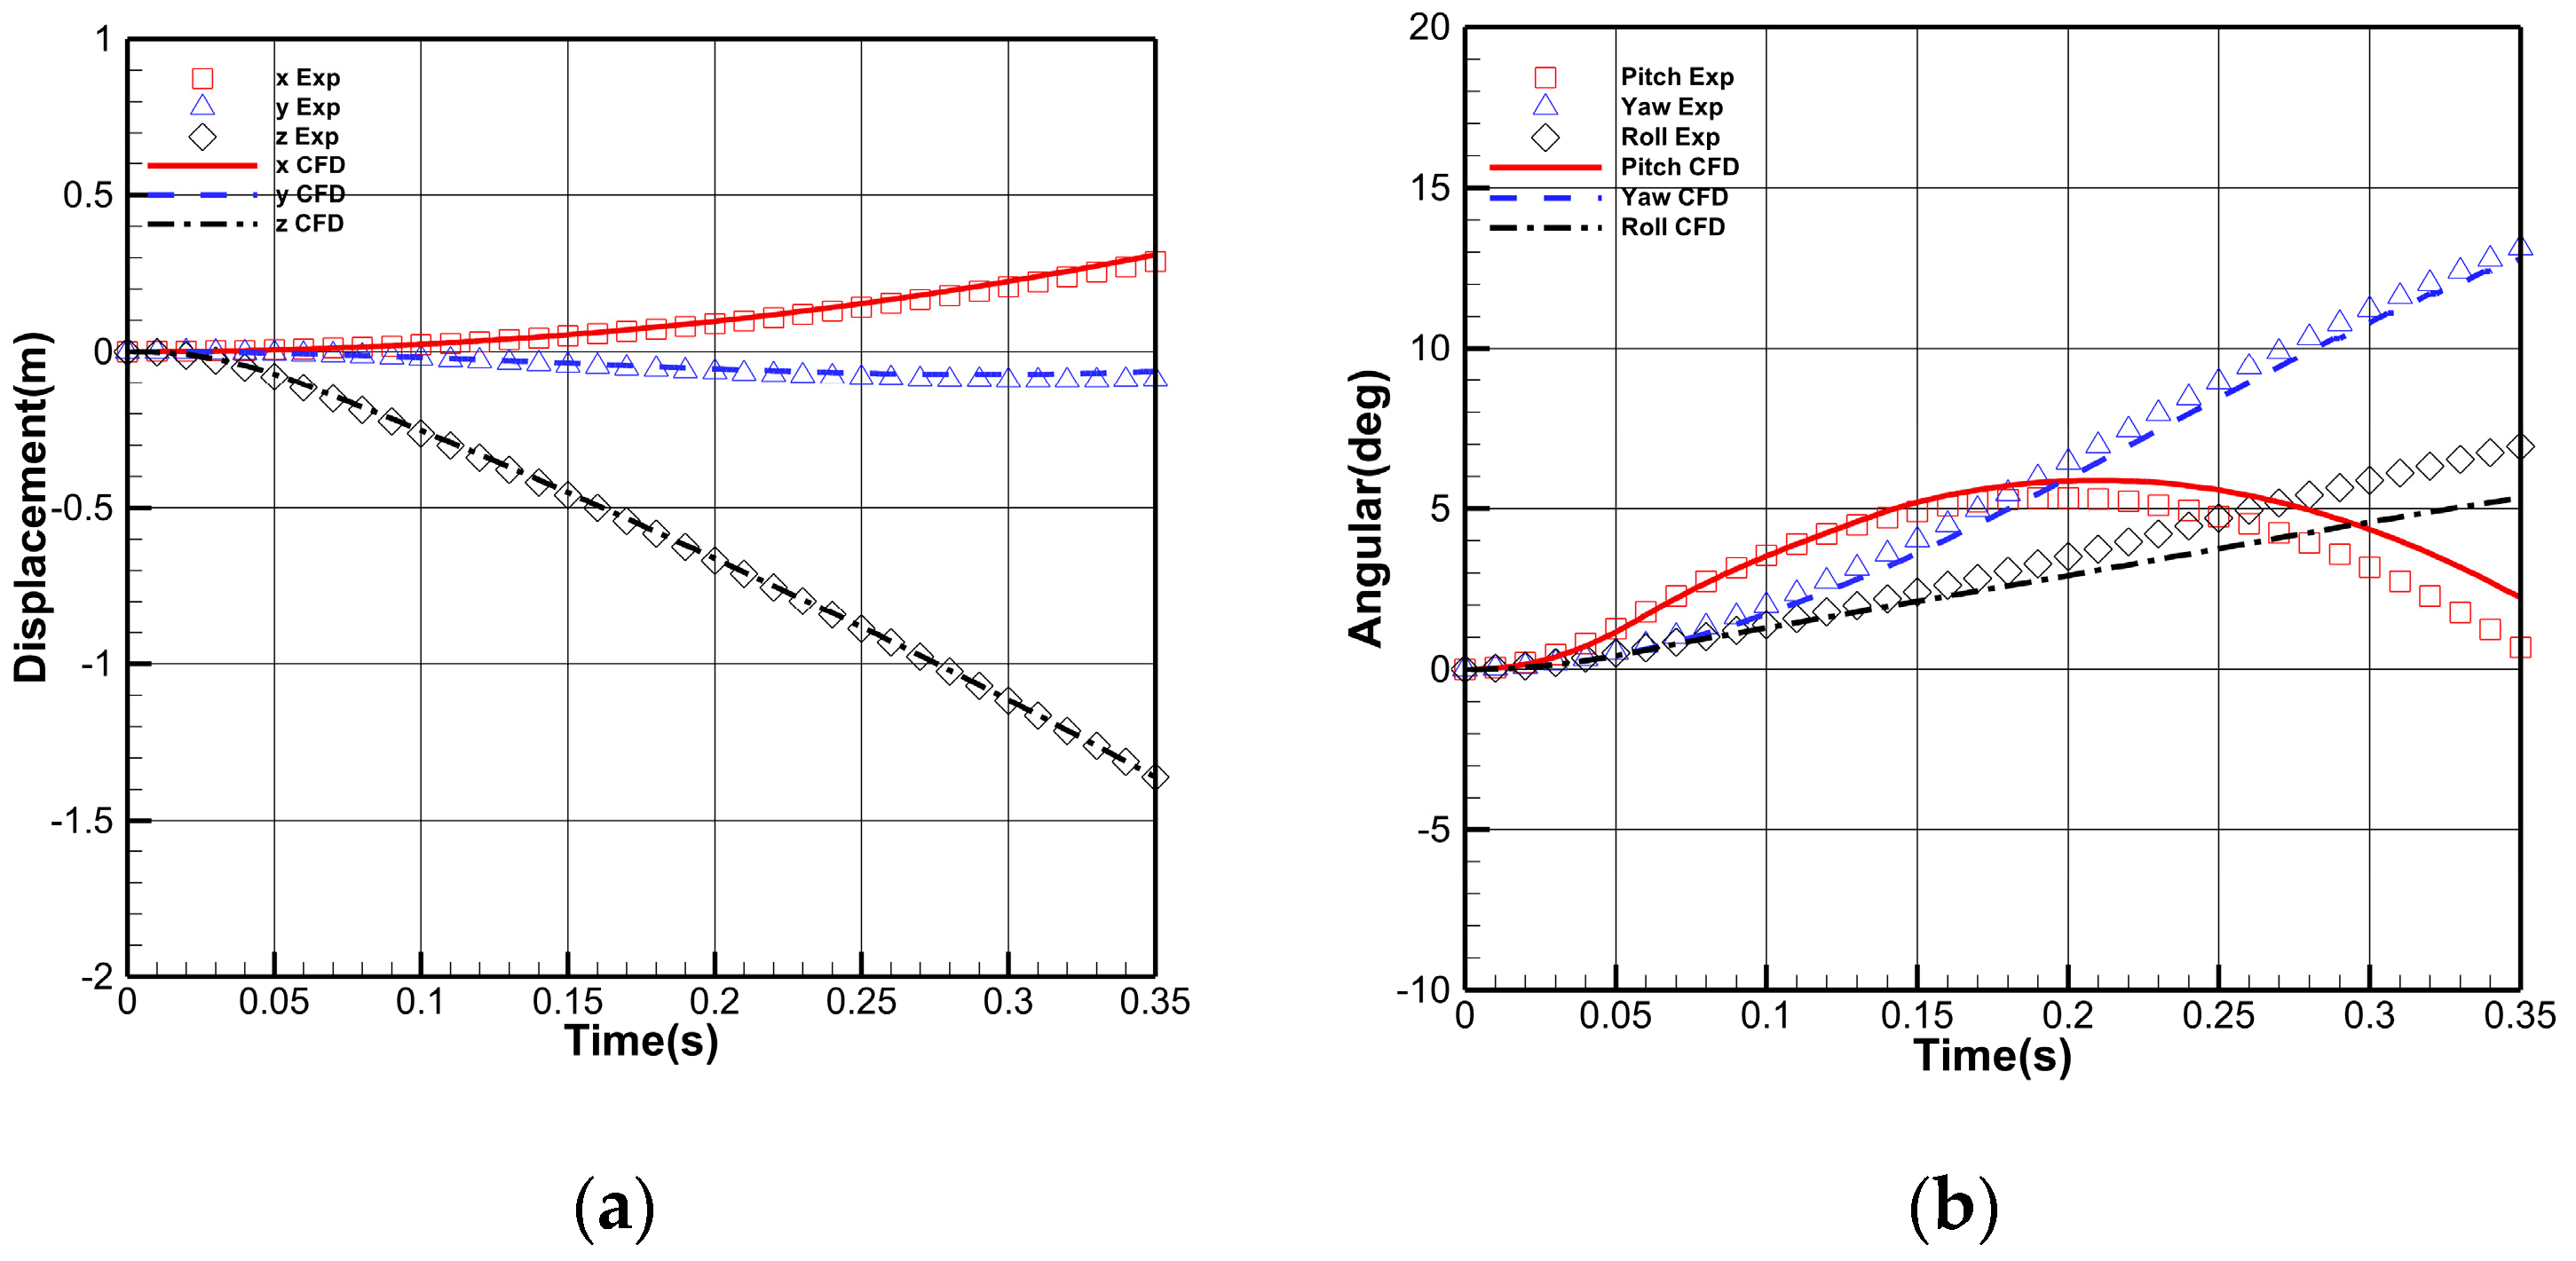
The calculation conditions are the same as the CTS test, the freestream Mach number is 0.95, the angle of attack is 0°, the flight altitude is 7.924 km, and the physical time step is 0.002 s. Figure 4 shows the displacement and Euler angles of the stores, as obtained from both numerical simulations and experiments. To quantitatively evaluate the numerical method, this paper employs two metrics: the mean absolute error (MAE) and the coefficient of determination (R2). The MAE values for displacements in the x, y, and z directions are 0.0077, 0.0105, and 0.0057, respectively, while the corresponding R2 values are 0.9999, 0.9958, and 0.9999. The relatively small MAEs and R values close to 1 demonstrate the high accuracy of the numerical simulation. For the pitch angle and roll angle, the MAE values are 0.5284 and 0.5872, with R2 values of 0.9616 and 0.9982, respectively. This indicates deviations in the numerical simulation results for the pitch and roll angles. The potential reasons for these differences include two aspects: First, the moment of inertia I x x in the roll direction is smaller than the moments of inertia I y y and I z z , which may cause calculation errors to gradually amplify; second, the CTS used in the wind tunnel tests is a quasi-steady test technique that cannot account for the additional effects of angle of attack and sideslip angle caused by the motion speed of the store during the separation process.
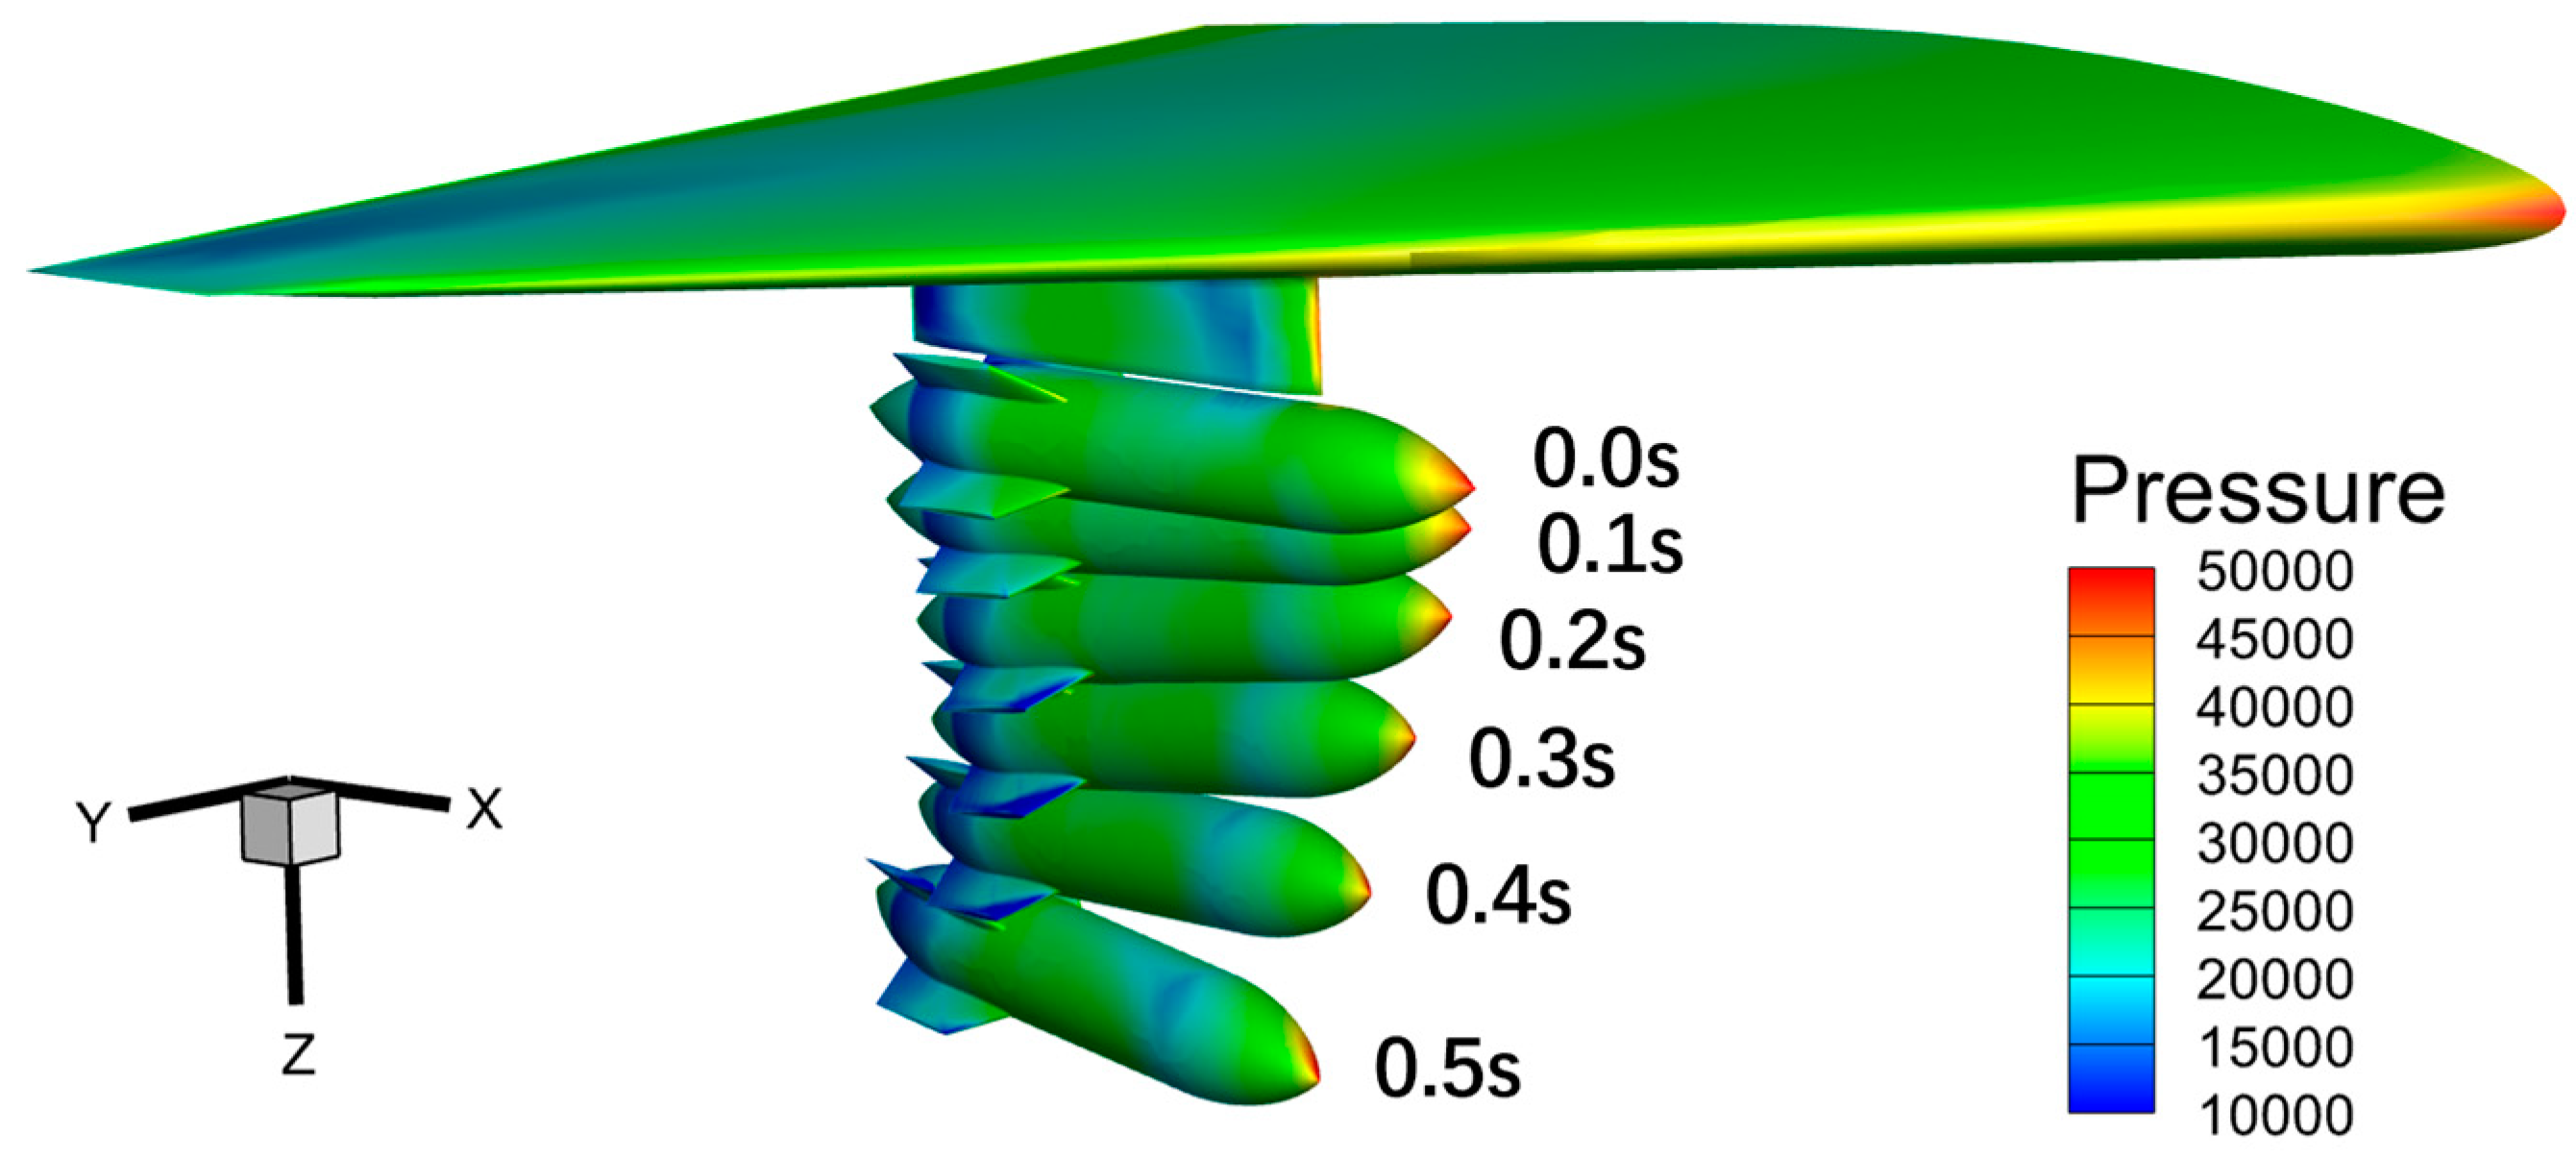
Figure 5 shows the relative positions of the store and the wing at different moments during the separation. As can be seen in the figure, the store rapidly separates from the wing under the action of the ejection force.
In conclusion, the numerical simulation results of WPFS separation are in good agreement with experimental results, meeting the accuracy requirements. This demonstrates that the numerical simulation method used in this study can accurately simulate complex aerodynamic interference and multi-body separation. Therefore, it can be applied to subsequent numerical simulations of stage separation.

3. Numerical Simulation of Stage Separation Control Based on Lateral Jet

To investigate the effect of the lateral jet on the attitude control of forebody, a numerical simulation of stage separation under free separation state was first conducted, obtaining the aerodynamic characteristics and separation flow field. Subsequently, open-loop attitude control of the forebody using lateral jet was performed, and a comparative analysis was conducted with the free separation state. Finally, a study on the closed-loop attitude control method for stage separation based on lateral jet was carried out, and its effectiveness was verified.

3.1. Computational Models and Conditions

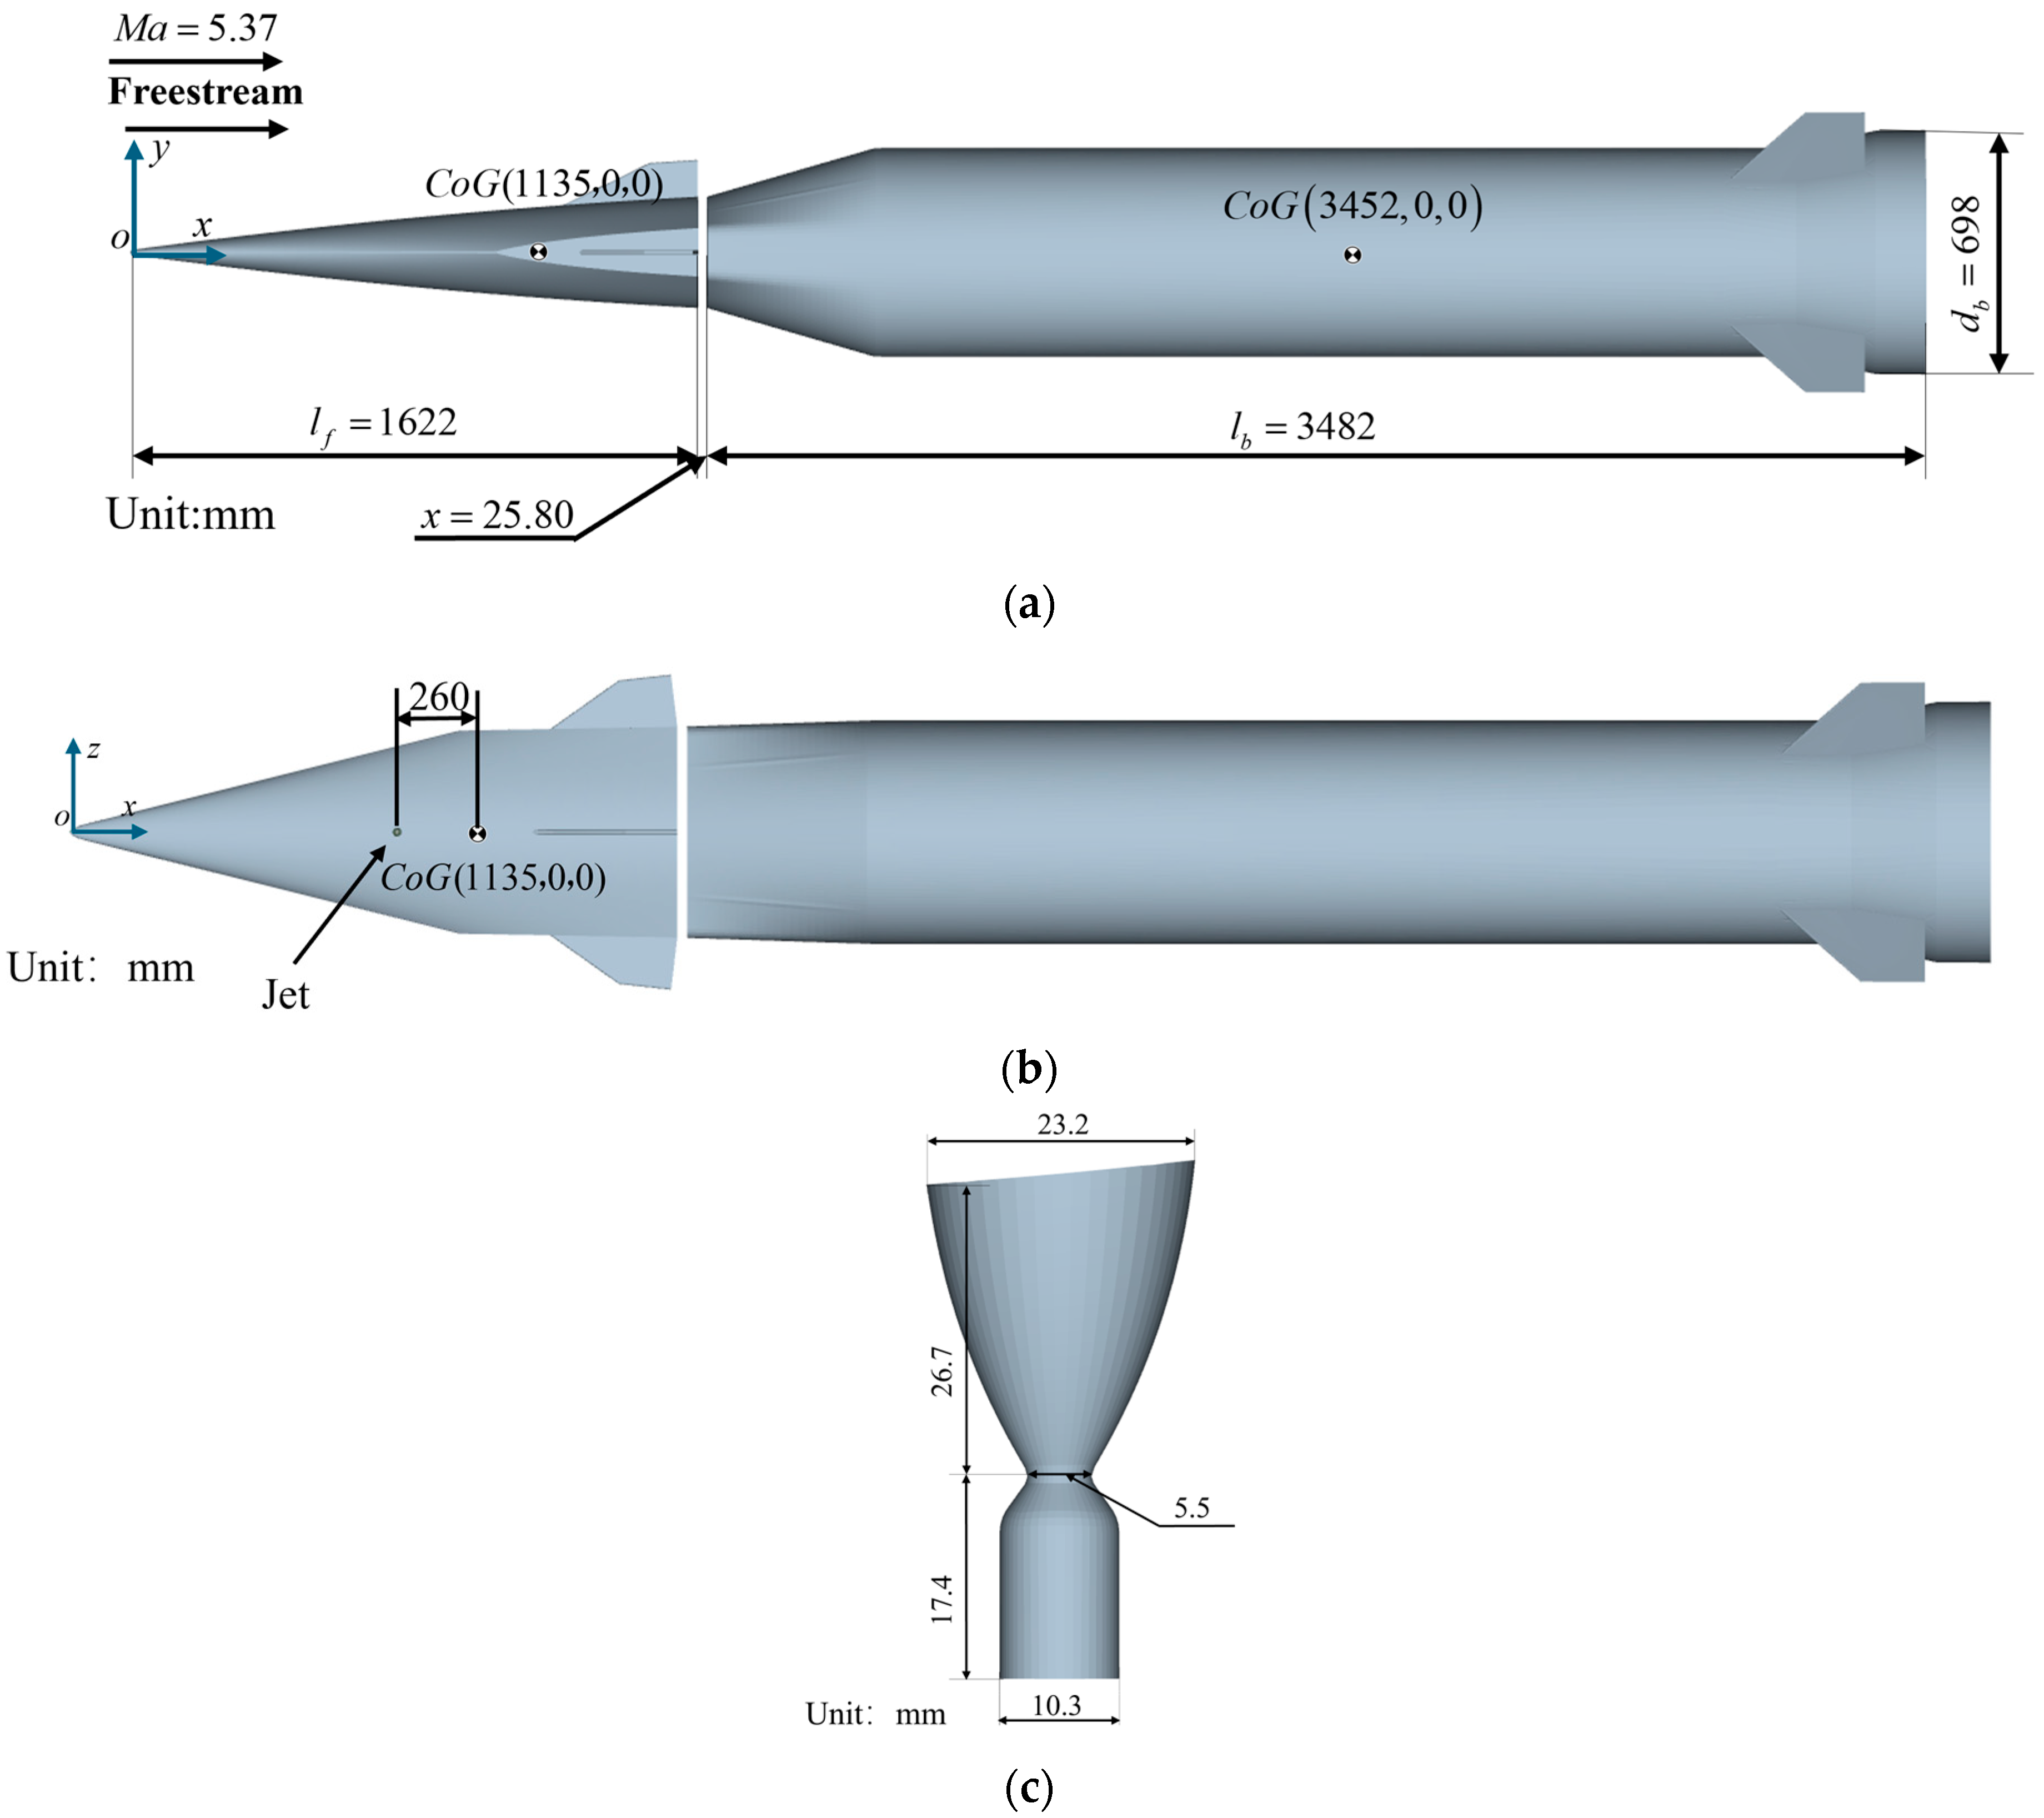
In this paper, the hypersonic vehicle model used for stage separation research consists of a forebody and a booster, as shown in Figure 6, and C o G denotes the center of gravity. During stage separation, the booster has nearly depleted its fuel, resulting in relatively low mass. Table 1 presents the size and mass characteristics of the forebody and booster. This paper neglects the products of inertia of the aircraft because I x z = I y z = 0 , and I x y has no effect on the pitch angle of the aircraft. The center of gravity of the forebody is located at 70% of its own length, while the center of gravity of the booster is positioned at 52% of its own length. The initial distance between the two stages is 25.80 mm.
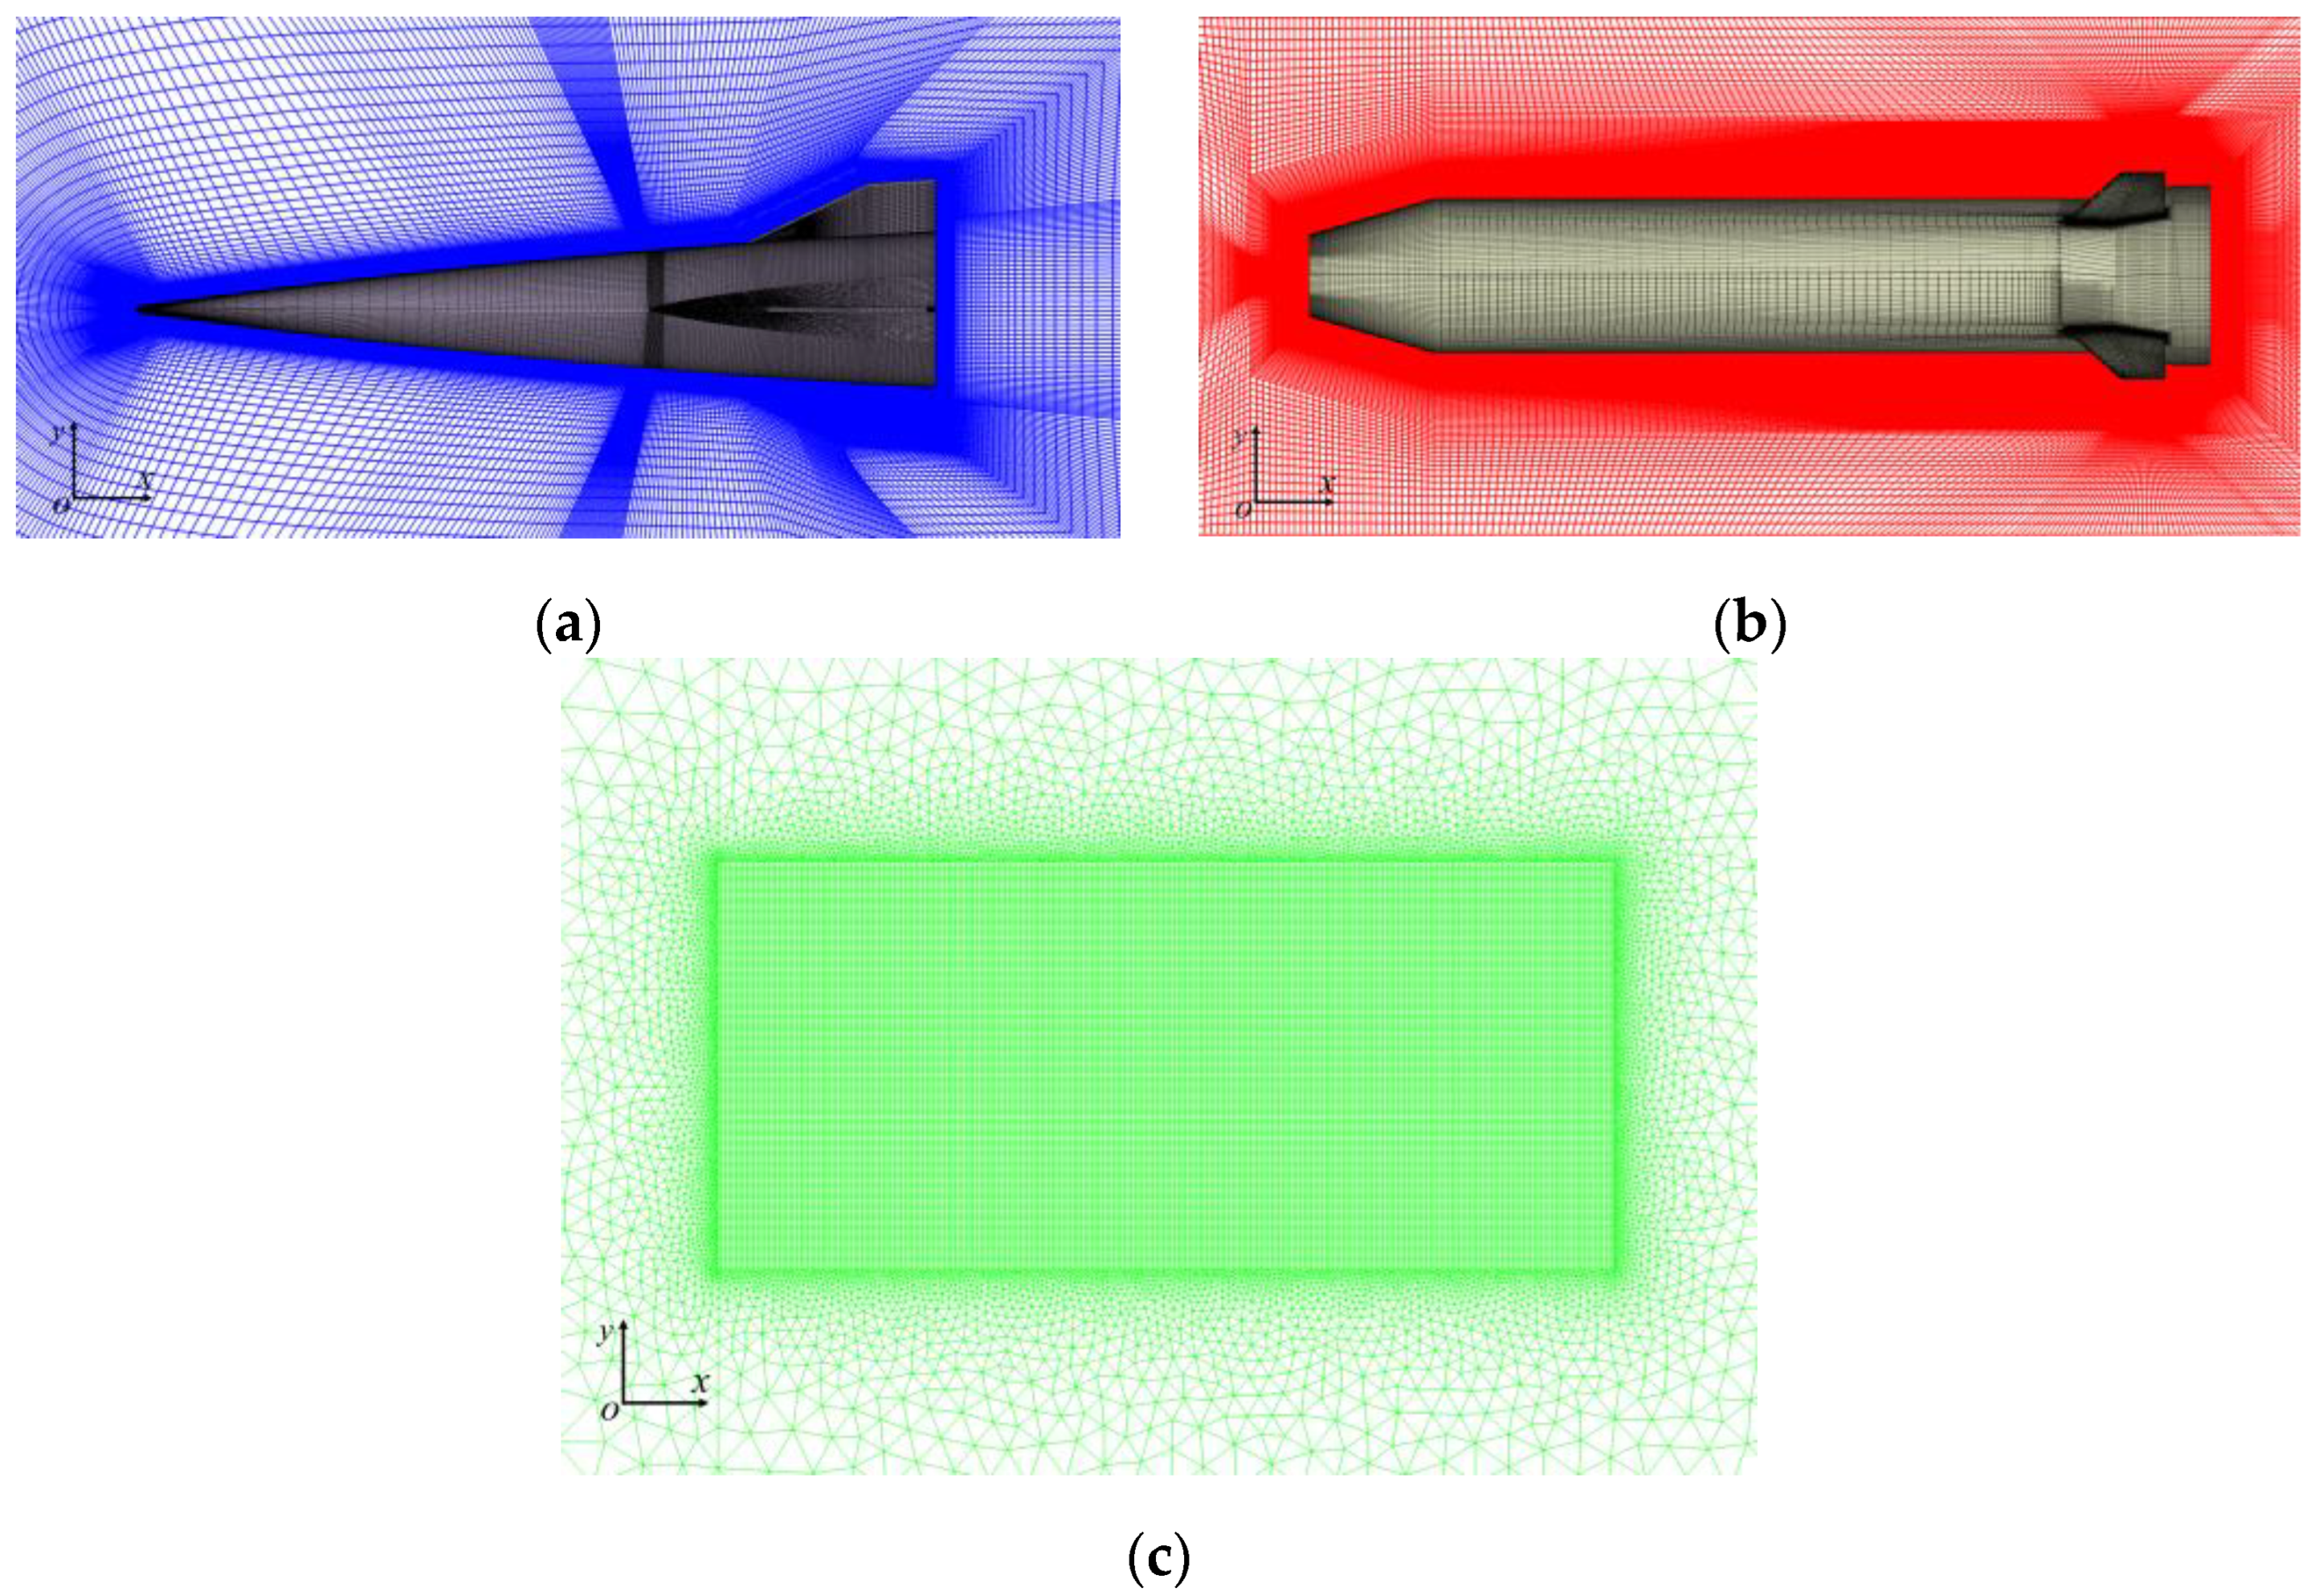
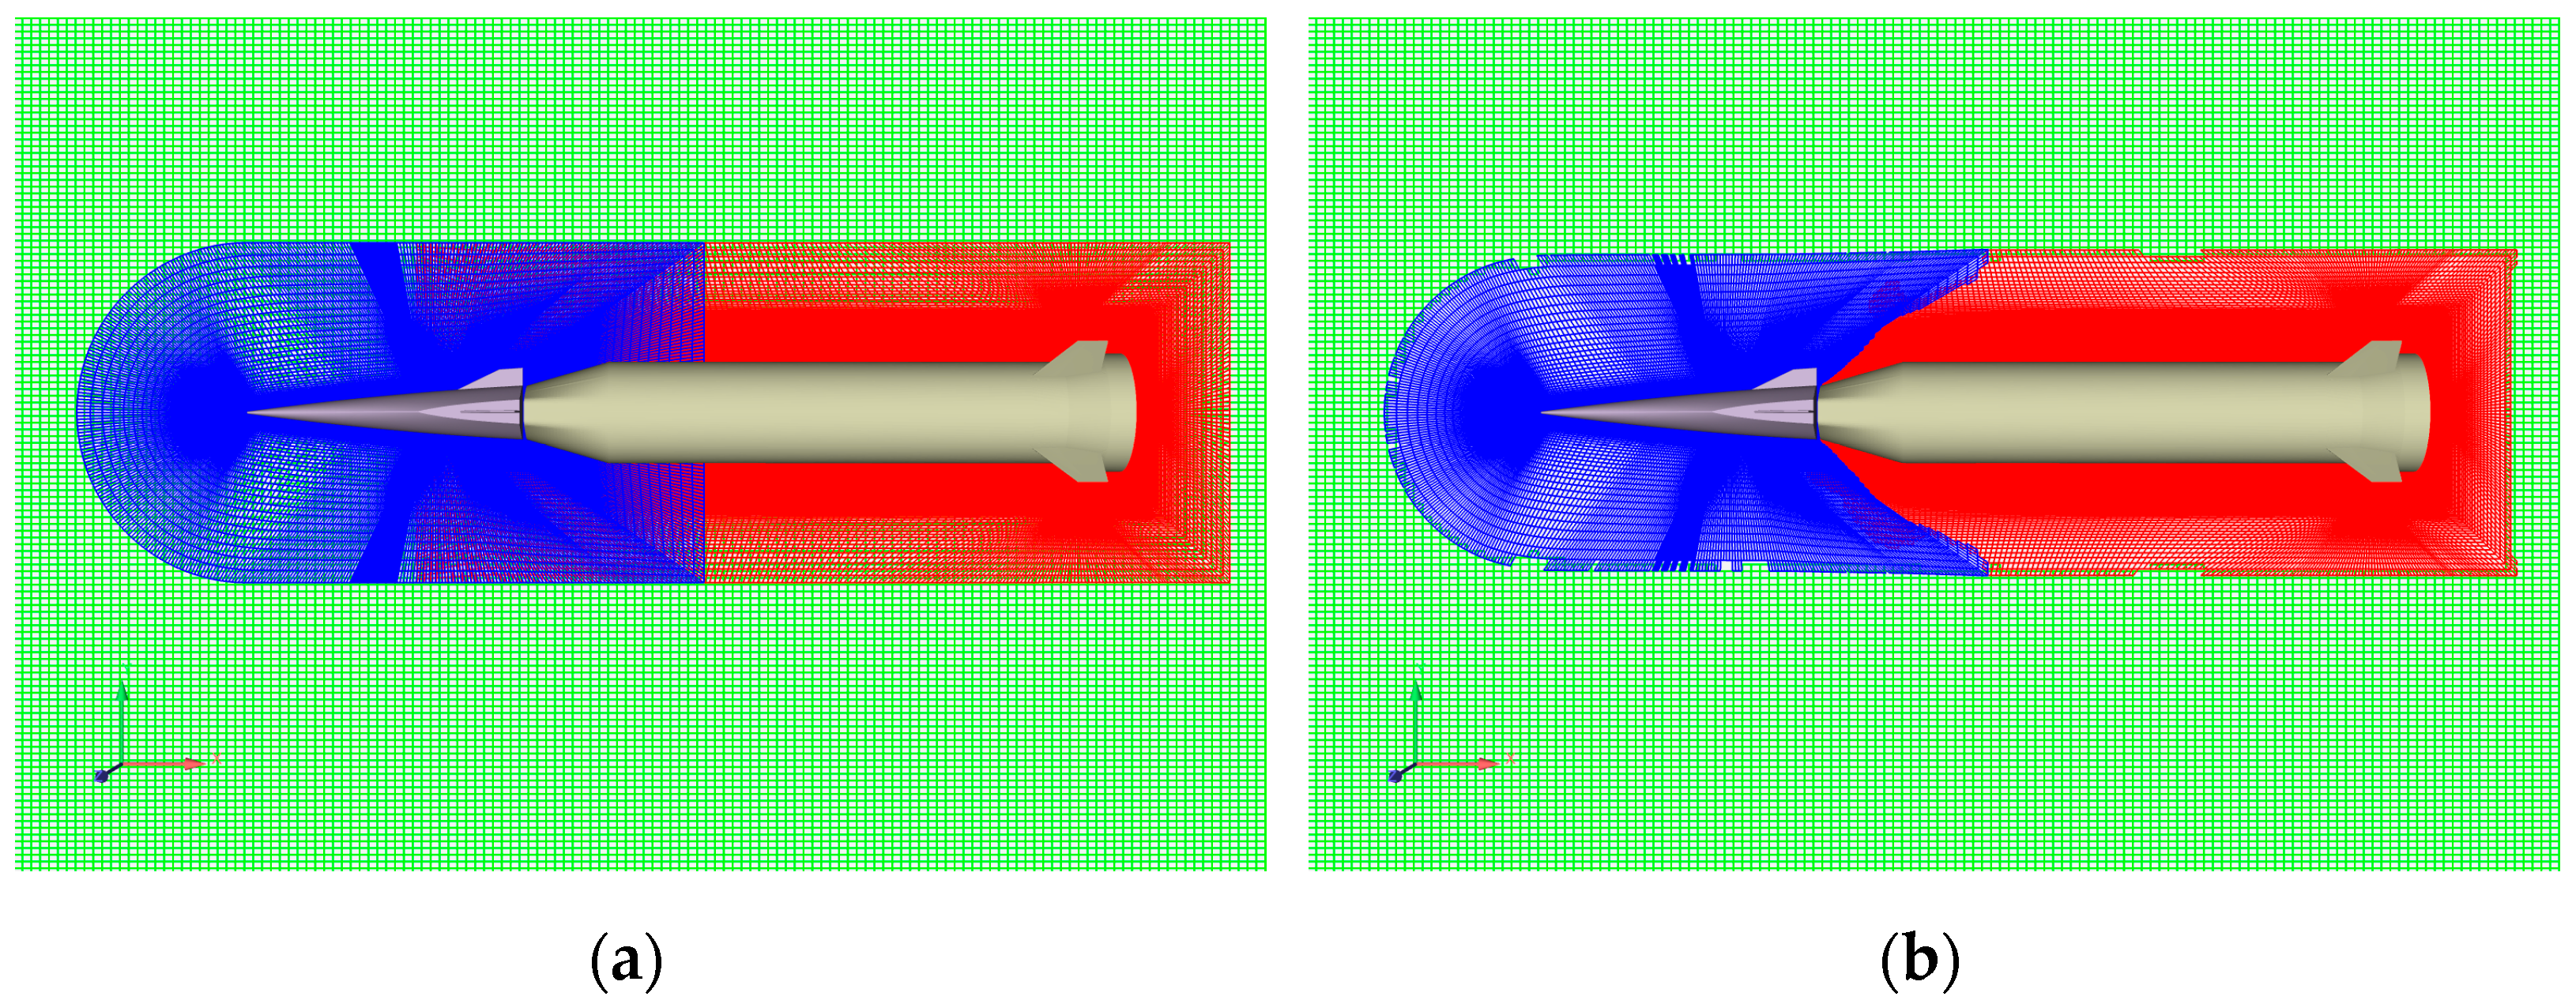
Based on overset grid technology, the computational grids are divided into three parts—the grid of forebody, the grid of booster, and the background grid—with grid numbers of 2.09 million, 1.87 million, and 4.04 million, respectively, as shown in Figure 7. The forebody grid and the booster grid are structured grids, consisting exclusively of hexahedral cell types. The background grid is a hybrid grid, containing both tetrahedral and hexahedral cell types. For complex flows, a uniform y+ cannot be guaranteed. However, our code has undergone wall-insensitive treatment. Therefore, the first grid layer height in this paper is set to 0.001 m, with a progression ratio of approximately 1.05 applied radially outward from the wall. The grids around the forebody’s nose, interstage section, and separation regions of the background grid are refined to ensure computational accuracy. To reduce computational cost, a half-model approach is used during simulations, and unstructured grids are employed outside the separation region. The grid after hole-cutting is shown in Figure 8, where the grids inside the wall of the forebody and booster are removed. Flow field data are interpolated at grid boundaries, and the grid scales in overlapping regions are kept as consistent as possible to ensure interpolation accuracy. To closely simulate actual flight conditions, based on relevant references [10], this paper selects a flight altitude of 43.6 km with an incoming Mach number of 5.37. Under these conditions, the freestream static pressure is 178.49 Pa, and the static temperature is 260.30 K. The stage separation calculations in this study are conducted using a DELL T7920 workstation manufactured in China, featuring 48 Intel Xeon Platinum 8331C CPU cores and 256 GB of RAM. equipped with 256 GB of RAM. During numerical simulations, it utilizes 40 cores (equivalent to 80 threads), and each simulation case requires approximately 36 h to complete.

3.2. Principle of Cascade PID Controller

Compared with other control algorithms, the PID algorithm is simple in structure, stable and reliable, and has been widely applied in industry. The PID controller controls the process variable through three components: proportional, integral, and derivative. The proportional component eliminates the current error in the system by amplifying the error by a certain factor and transmitting it to the controller for adjustment of the controlled object. A larger proportional coefficient shortens the system’s response time. However, an excessively large proportional coefficient can lead to oscillations, longer response times, or even divergent oscillations. Due to the limitations of the proportional component, there is always an error between the process variable and the setpoint. The integral component eliminates the steady-state error of the system. However, as the integral coefficient increases, the ability to eliminate steady-state error improves, but an excessively large integral coefficient may cause increased overshoot and even oscillations. The output of the derivative component is the derivative of the system error. It monitors the rate of change of the error, allowing for prediction and anticipatory control. An appropriate derivative coefficient can effectively reduce overshoot and shorten response time. The principle of the PID controller is shown in Figure 9.
In the figure, r ( t ) represents the desired setpoint, e ( t ) is the deviation between the setpoint and the actual output of the controlled object, u ( t ) is the output of the PID controller, and y ( t ) is the output of the controlled object. The expression for the output signal of the PID controller is as follows:
u t = K p e t + K i 0 t e t d t + K d d e t d t
Here, K p ,   K i , and K d represent the proportional coefficient, integral coefficient, and derivative coefficient, respectively.
As shown in Figure 10, the cascade PID controller is divided into two loops: the outer loop for angle control and the inner loop for angular velocity control. Cascade control not only offers high control accuracy but also adjusts the inertia of the outer loop via the inner loop, improving the overall response speed. In addition, the cascade PID control demonstrates strong anti-interference capabilities, effectively mitigating modeling errors, external disturbances, and similar factors. After multiple iterations of numerical simulations and comparison of the results, the inner and outer loop parameters for the cascade PID control were selected as shown in Table 2.

3.3. Numerical Simulation of Stage Separation

Lateral jets, characterized by rapid response and high efficiency, are commonly used for attitude control of hypersonic vehicles. They influence the aerodynamic characteristics of the vehicle through reaction forces and jet interaction effects, thereby achieving attitude control objectives. In Section 3.3.1, no lateral jet is present on the forebody, corresponding to free stage separation. In Section 3.3.2, a lateral jet with fixed total pressure is implemented on the forebody for pitch angle control, representing open-loop attitude control. In Section 3.3.3, a lateral jet with variable total pressure adjusted by a cascade PID controller is employed on the forebody, constituting closed-loop attitude control. The boundary conditions used in each section are shown in Table 3.

3.3.1. Free Stage Separation

To study the stage separation process under free conditions, this section conducts a numerical simulation of the stage separation process at an angle of attack α = 0 ° . In the unsteady numerical simulation, the physical time step is set to 0.02 s, and the number of iterations is fixed at 150. According to the safety separation criteria from reference [36], the hypersonic vehicle can be considered to have safely separated when Δ x / D > 2.5 3 (where Δ x is the distance between the two stages after separation, and D is the bottom diameter of the forebody, which is 0.56 m in this study).
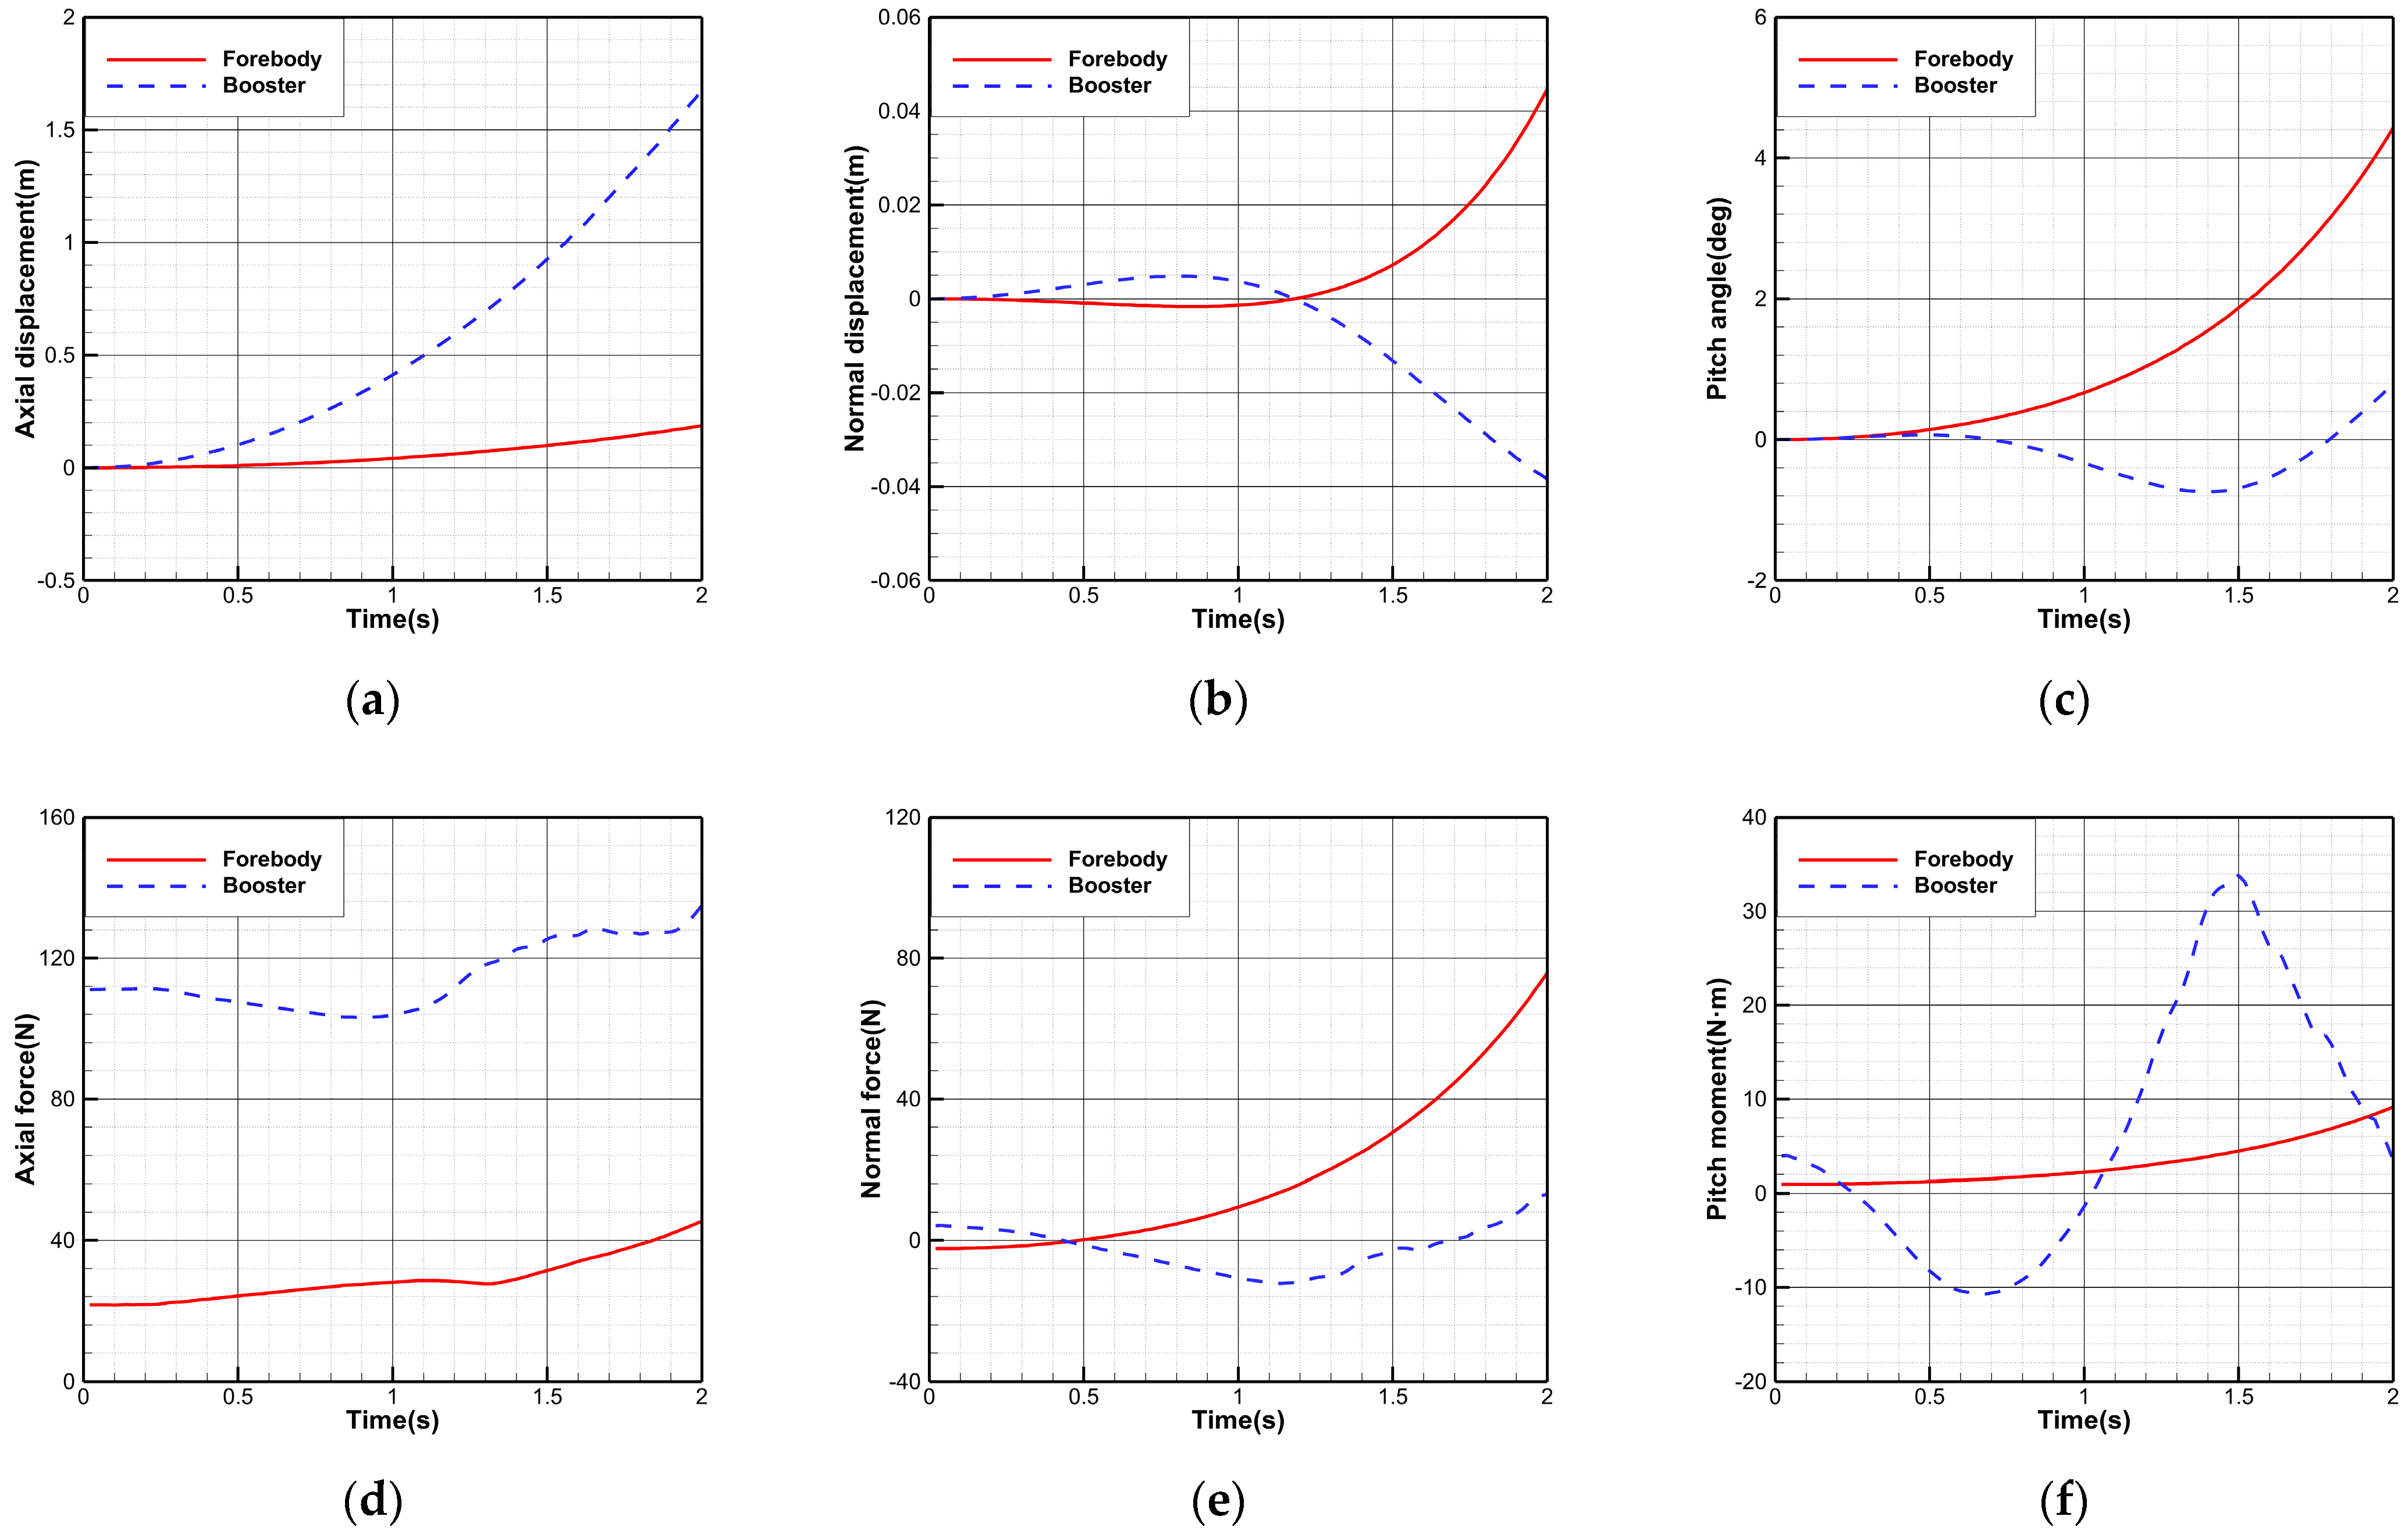
Figure 11 shows the separation trajectories and aerodynamic characteristics of the forebody and booster. The axial forces of both stages remain greater than zero, with the booster experiencing a larger axial force than the forebody. Consequently, the axial displacements of both stages increase over time, with the booster having a larger displacement. The forebody’s normal force gradually increases with the pitch angle. However, since the normal force is initially negative during separation, the forebody’s normal displacement decreases initially and then increases. At the start of separation, the booster’s pitch angle is 0° and its normal force is positive. At t = 0.70 s, the booster’s pitch angle returns to 0°, but its normal force becomes negative, indicating that aerodynamic interference from the forebody alters the aerodynamic characteristics of the booster. The forebody’s pitch moment increases over time, resulting in a gradual increase in the forebody’s pitch angle. Moreover, after separation, the forebody’s pitch angle reaches 4.43°, which is highly detrimental to the next phase of the flight mission. During separation, the booster’s pitch angle changes in a more complex manner, but the variation is only 1.53°, indicating that the booster maintains relatively stable attitude during the stage separation.
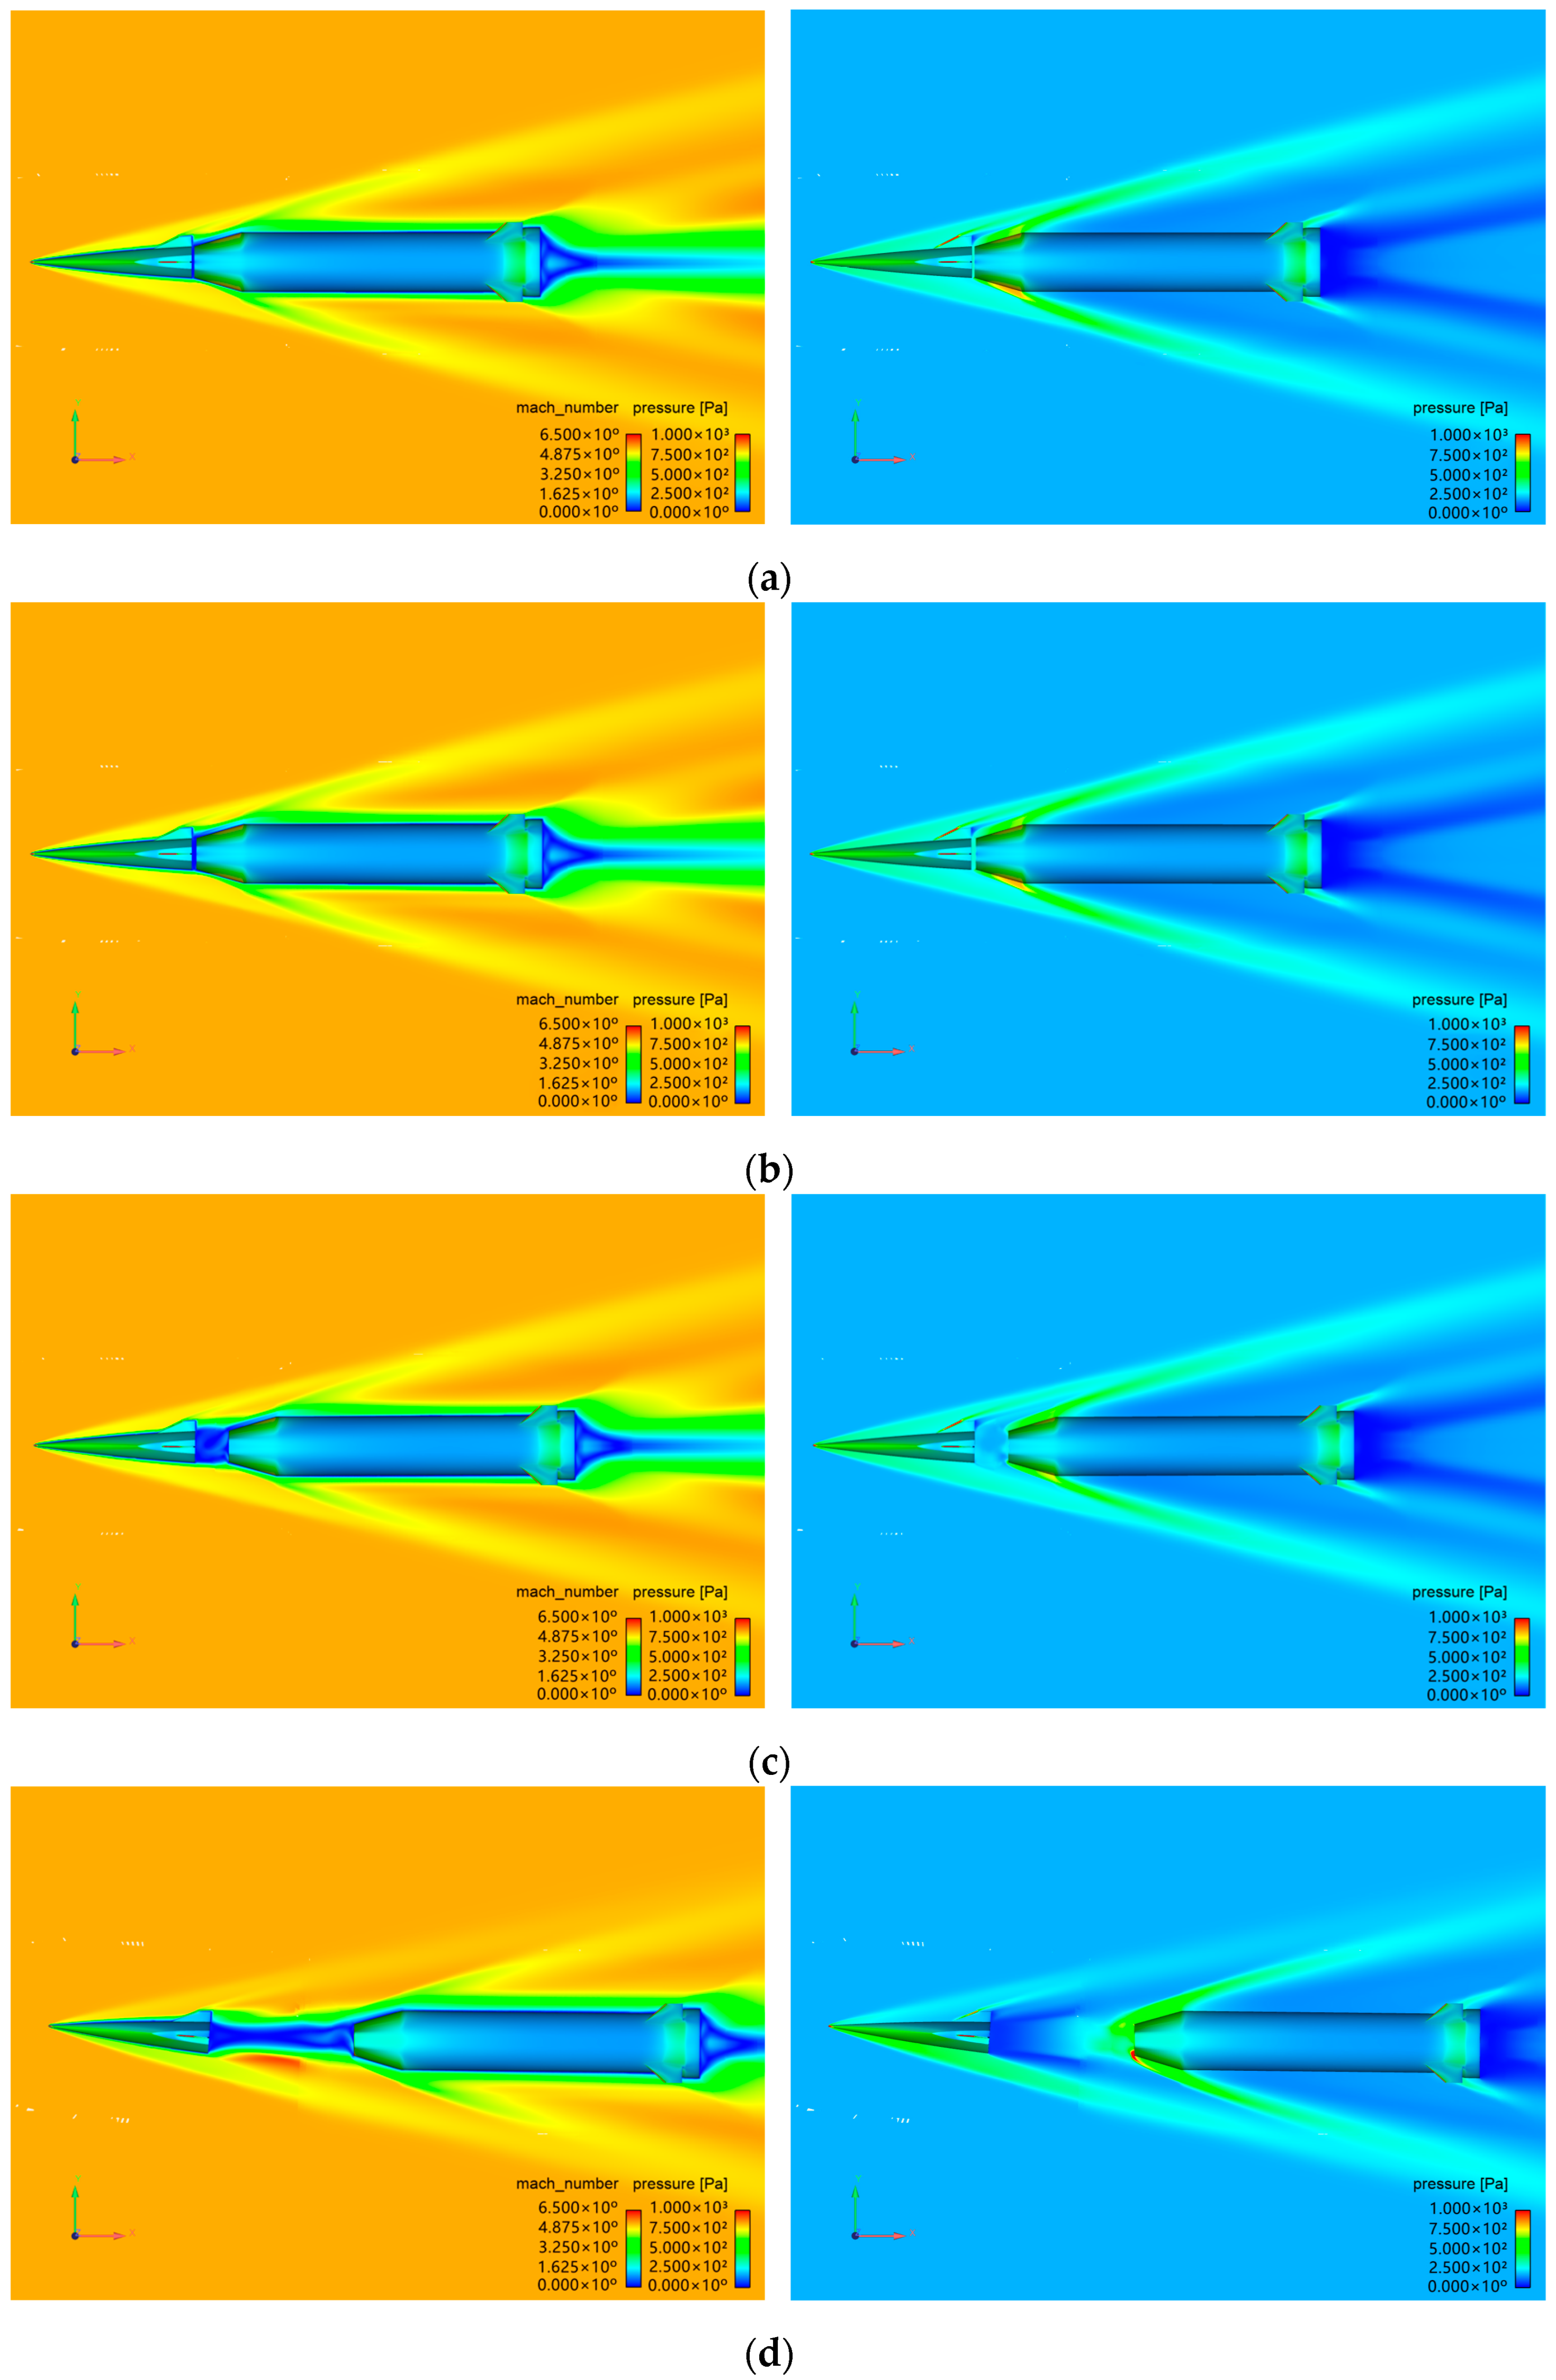
Figure 12 illustrates the instantaneous flow fields at four typical locations during the stage separation. As can be seen in the figure, the freestream is obstructed by the forebody’s nose, forming a detached shock, and inclined shockwaves and expansion waves are generated near the forebody’s vertical tail and the booster’s nose. These complex wave structures, such as detached shockwaves interacting with inclined shocks and detached shockwaves interacting with expansion waves, interfere with each other.
At t = 0.24 s, the axial displacement and pitch angle of both stages change only slightly compared to t = 0.04 s, and therefore, the aerodynamic characteristics of both stages also exhibit minimal change. From 0.24 s to 0.92 s, as the stage separation progresses, the pressure in the interstage section gradually decreases, causing the forebody’s axial force to increase while the booster’s axial force decreases. When t > 0.92 s, after the freestream flows past the forebody’s lower surface, it is obstructed by the booster’s nose, resulting in a rapid increase in pressure at the booster’s nose, causing a sharp rise in the booster’s axial force. Additionally, when the interstage distance is large enough, a distinct expansion wave is present at the forebody’s tail.
Figure 13 presents the surface pressure contours of the forebody and the streamline of the interstage section at several time points. In the early stages of stage separation, the pressure in the interstage section gradually decreases, leading to a gradual increase in the forebody’s axial force. At t = 1.12 s, three vortex structures are present in the interstage section. The largest vortex structure is located near the upper region of the interstage section, extending from the forebody’s tail to the booster’s nose. A relatively large vortex structure is located near the lower region of the booster’s nose, close to the booster. Additionally, a smaller vortex structure is found near the lower region of the forebody’s tail. At t = 1.16 s, as the interstage distance increases, the vortex structure near the forebody’s tail disappears, leaving only two vortex structures in the interstage section. This increases the pressure at the forebody’s tail, reducing the forebody’s axial force. When t = 1.28 s, the vortex structures in the interstage section are located farther from the forebody’s tail. At this point, the high-pressure region and pressure at the forebody’s tail reach their maximum, resulting in the minimum forebody axial force.

3.3.2. Open-Loop Attitude Control Based on Lateral Jet

When the vehicle is in a free separation, the forebody’s pitch angle becomes significantly large after separation, which is highly unfavorable for the next stage of the forebody’s flight mission. Therefore, attitude control of the forebody is required during the stage separation. However, since the vehicle is usually at a high altitude after stage separation, the aerodynamic forces acting on it are relatively small, making it difficult to adjust the vehicle’s attitude solely using aerodynamic control surfaces. The lateral jet offers advantages such as rapid response and high efficiency while maintaining effectiveness at high altitudes. Therefore, based on previous research on free stage separation, this section employs lateral jet with fixed parameters to perform open-loop attitude control of the forebody’s pitch angle. In this study, the control objective is set such that the forebody’s pitch angle θ = 0 ° after the separation. According to [10], the jet pressure is set to 100,000 Pa. Through preliminary steady-state numerical simulations, it was found that the pitch moment of the forebody is relatively smaller when the total pressure reaches 155,000 Pa. Therefore, the total jet pressure is selected as 155,000 Pa, with the other parameters specified in Table 4.
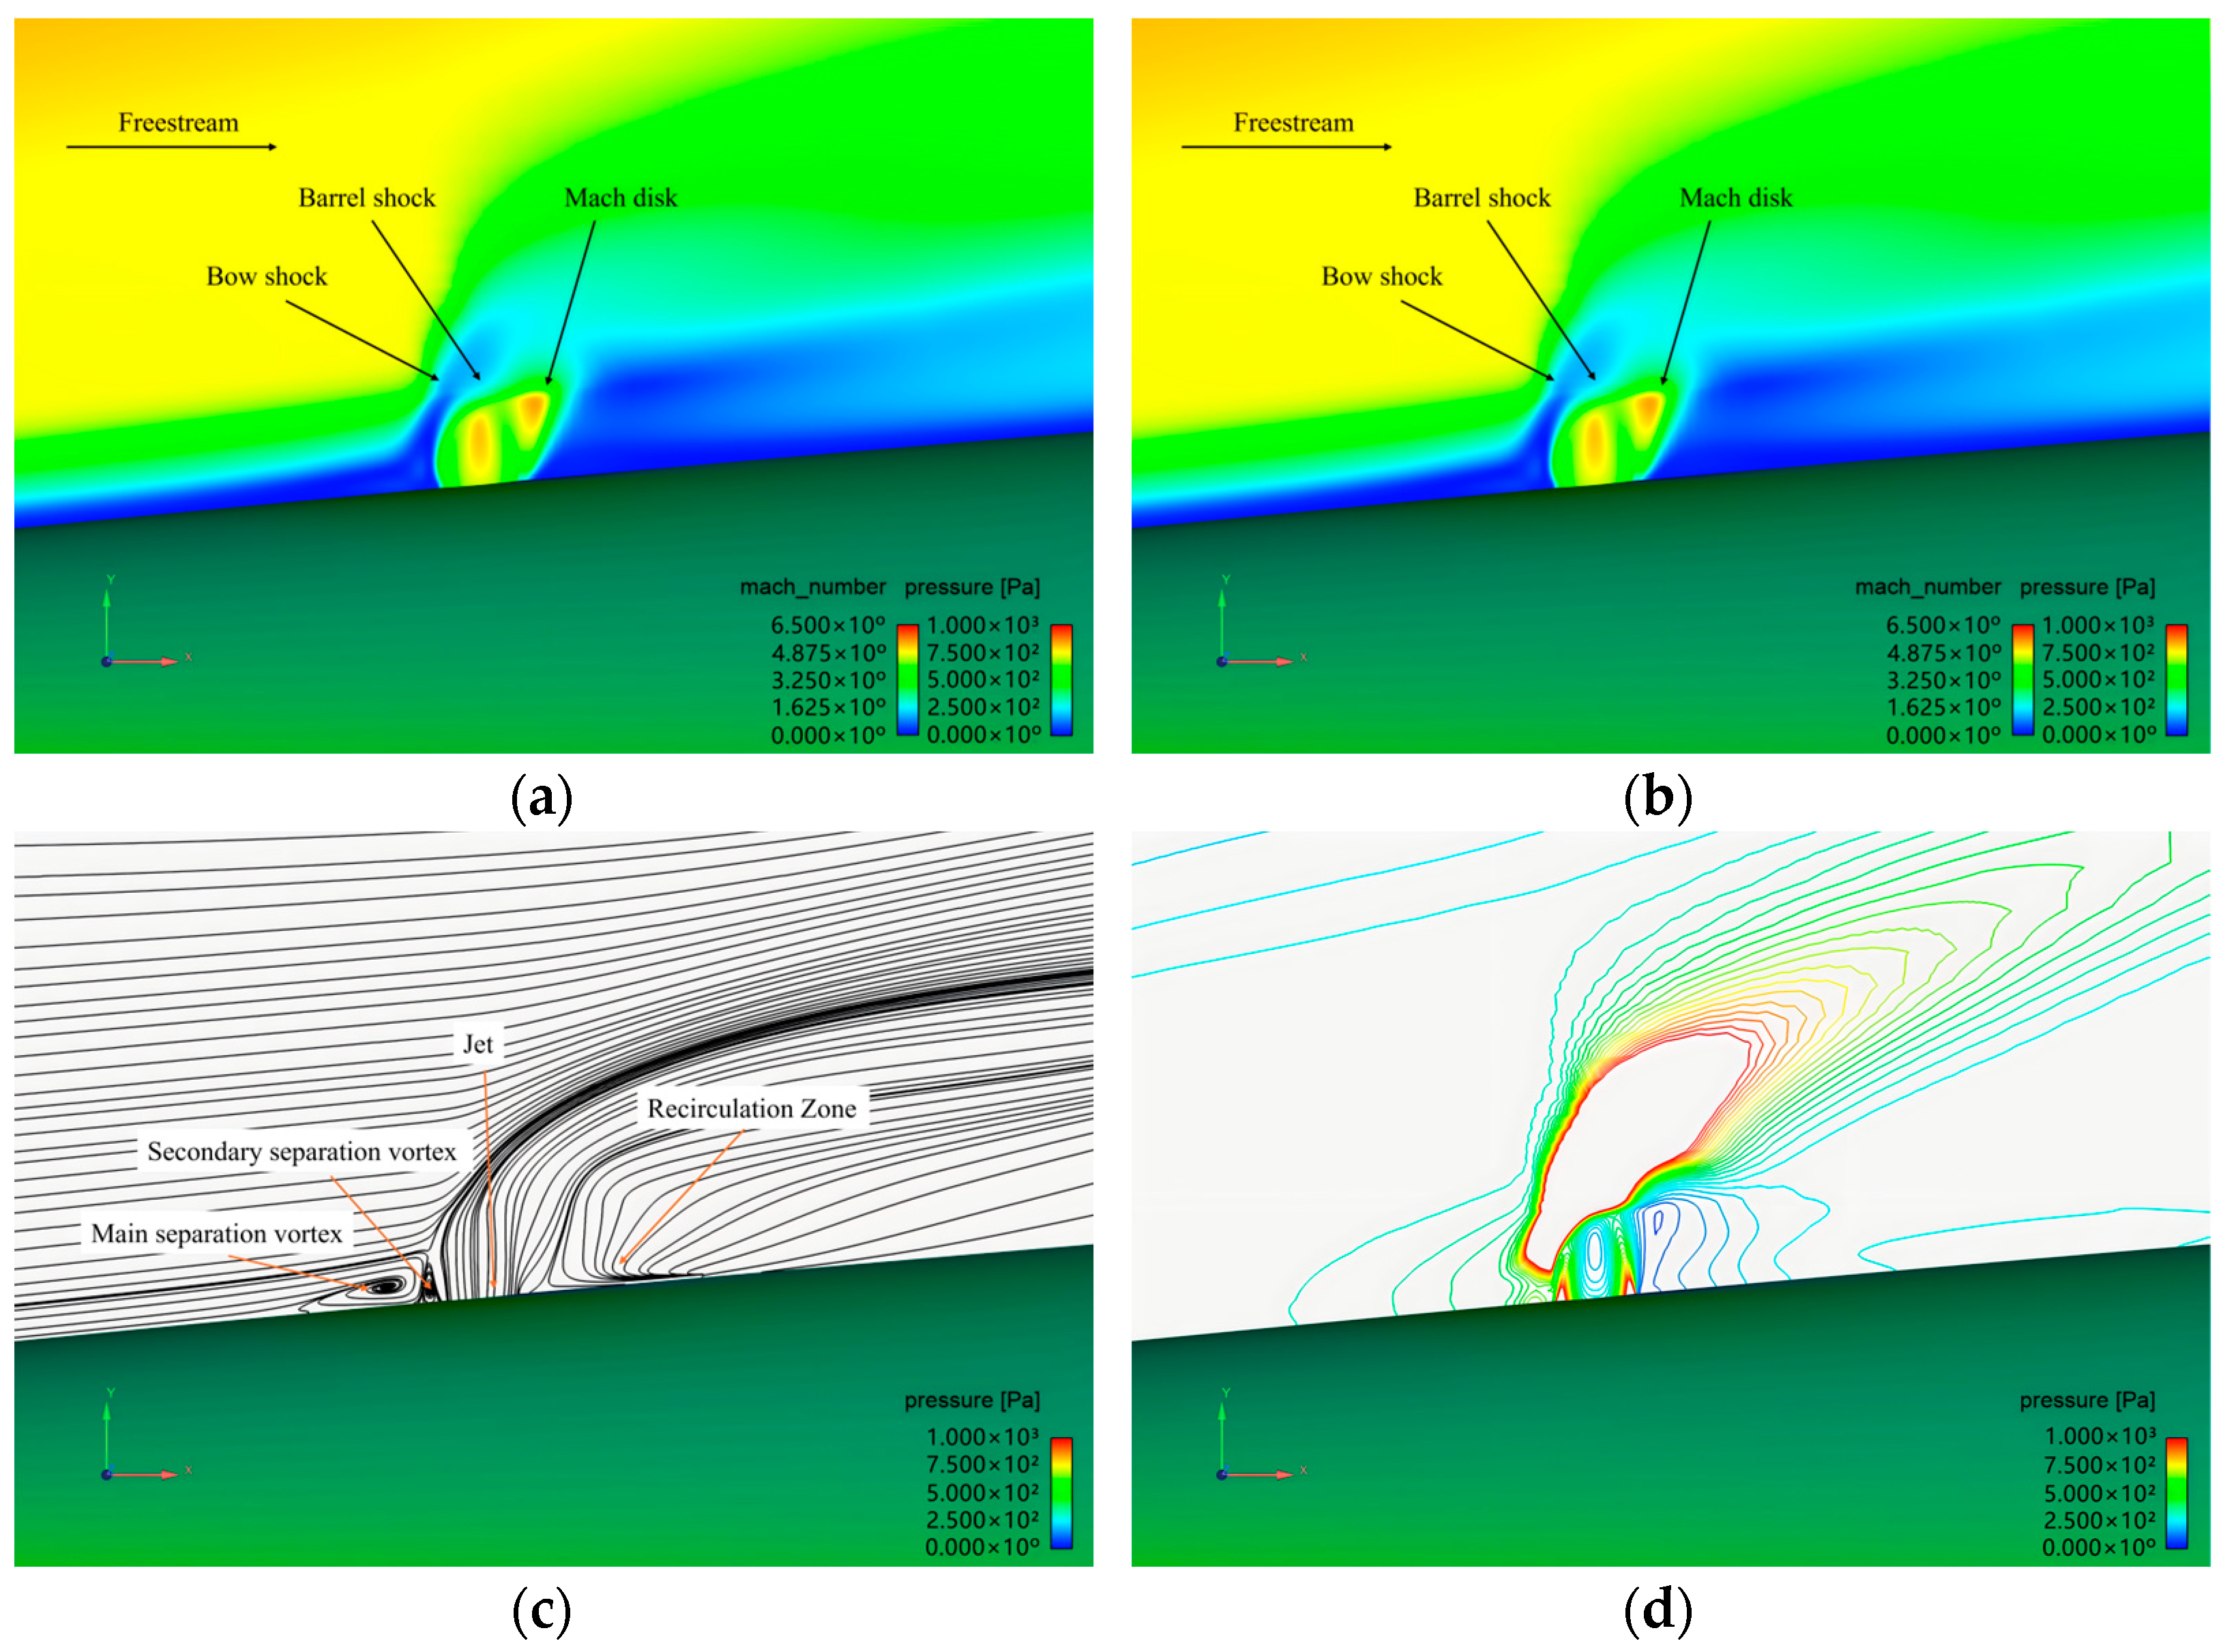
Figure 14 presents the Mach number contour, pressure contour, streamline, and pressure contour sheet around the lateral jet. The interaction between the supersonic freestream and the lateral jet creates a bow shock. The high pressure behind the shock is transmitted to the boundary layer, increasing the surface pressure upstream of the nozzle. This propagates upstream through the subsonic region of the boundary layer, forming an adverse pressure gradient that induces flow separation and the formation of the primary separation vortex. Freestream is obstructed and entrained by the lateral jet, resulting in shearing interactions that form a secondary separation vortex. Additionally, due to the influence of the adverse pressure gradient, a large recirculation zone develops within the boundary layer downstream of the nozzle. The high-speed, high-pressure gas at the nozzle rapidly expands, forming a barrel shock and a Mach disk. As can be seen in Figure 14b,d, the pressure is high and varies dramatically at the jet exit and the intersection of the freestream and lateral jet. Furthermore, due to the obstruction caused by the jet to the freestream, a distinct low-pressure region exists downstream of the nozzle.
Figure 15 shows the distribution of limiting streamlines on the forebody surface. Due to the adverse pressure gradient, a high-pressure separation zone forms upstream of the nozzle, and before the separation zone is the undisturbed zone. The two regions are separated by a separation line, which extends downstream in a parabolic shape around the nozzle. The boundary between the main and secondary separation zone is defined by the reattachment line, which extends downstream in a C-shape around the nozzle. From Figure 15b, it can be observed that the pressure in the undisturbed zone is lower than that in the main separation zone, and the pressure is highest near the reattachment line. Streamlines adjacent to the nozzle bypass it and converge downstream, forming a recirculation zone, where the pressure is the lowest.
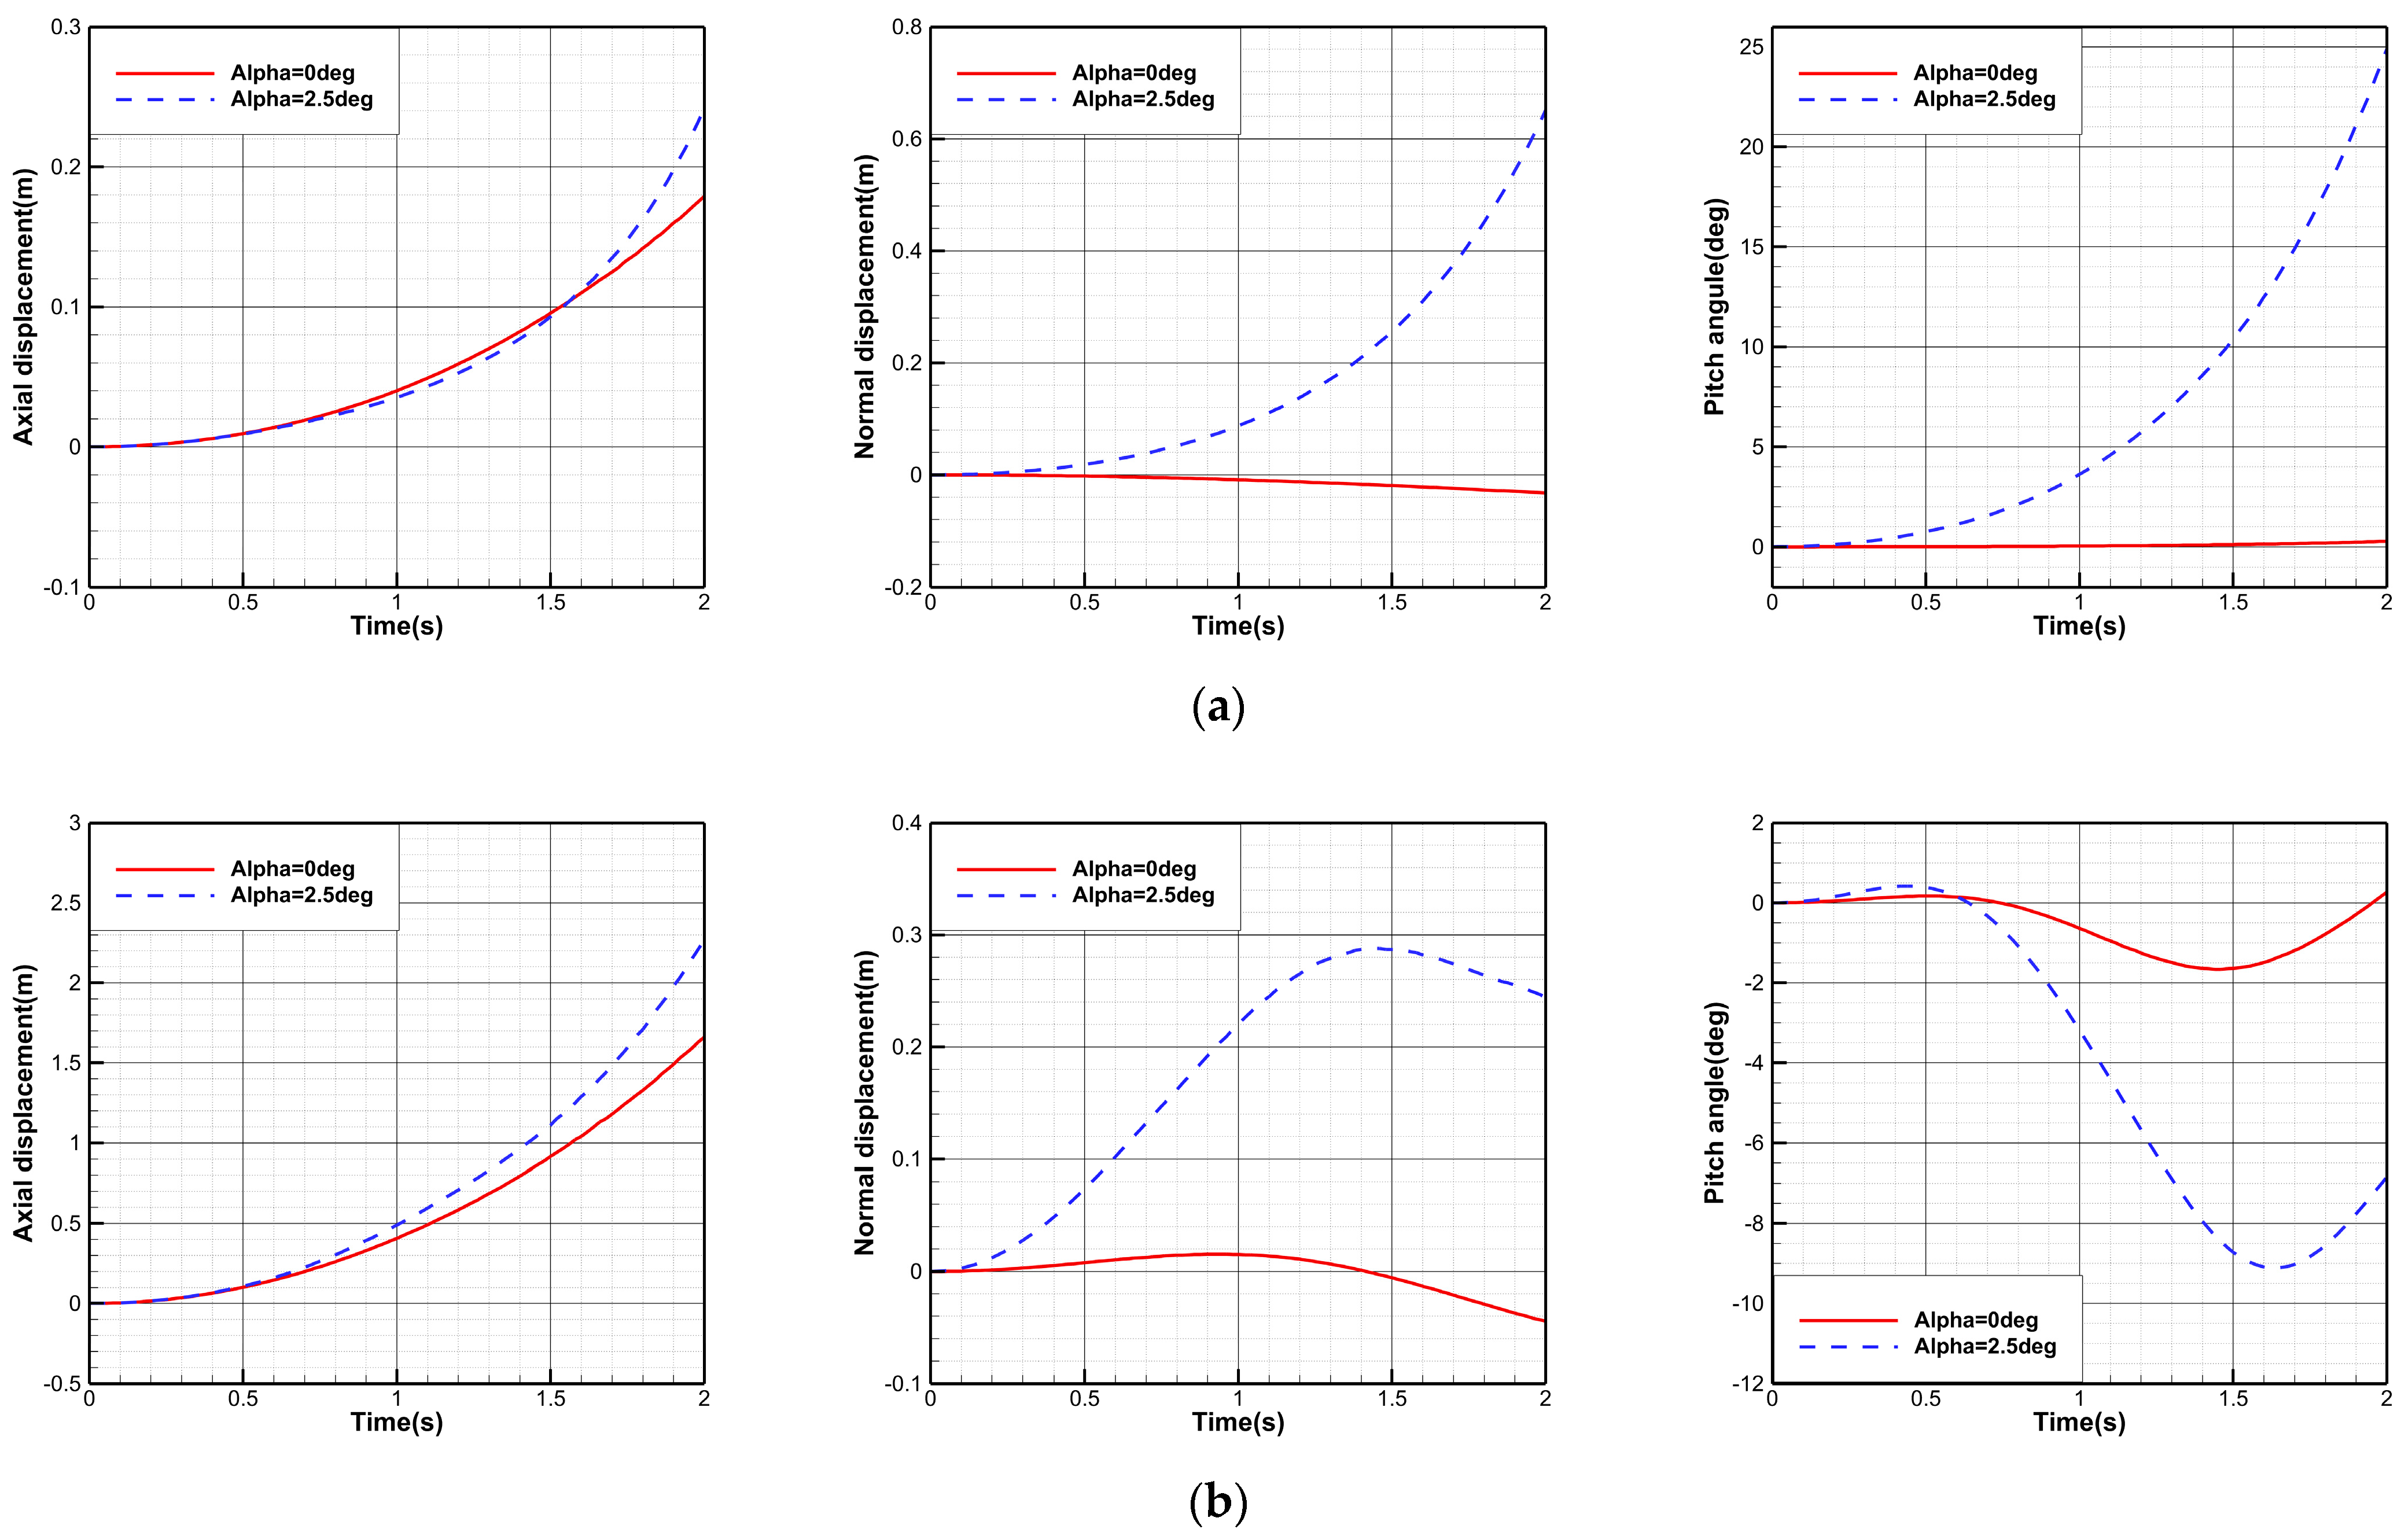
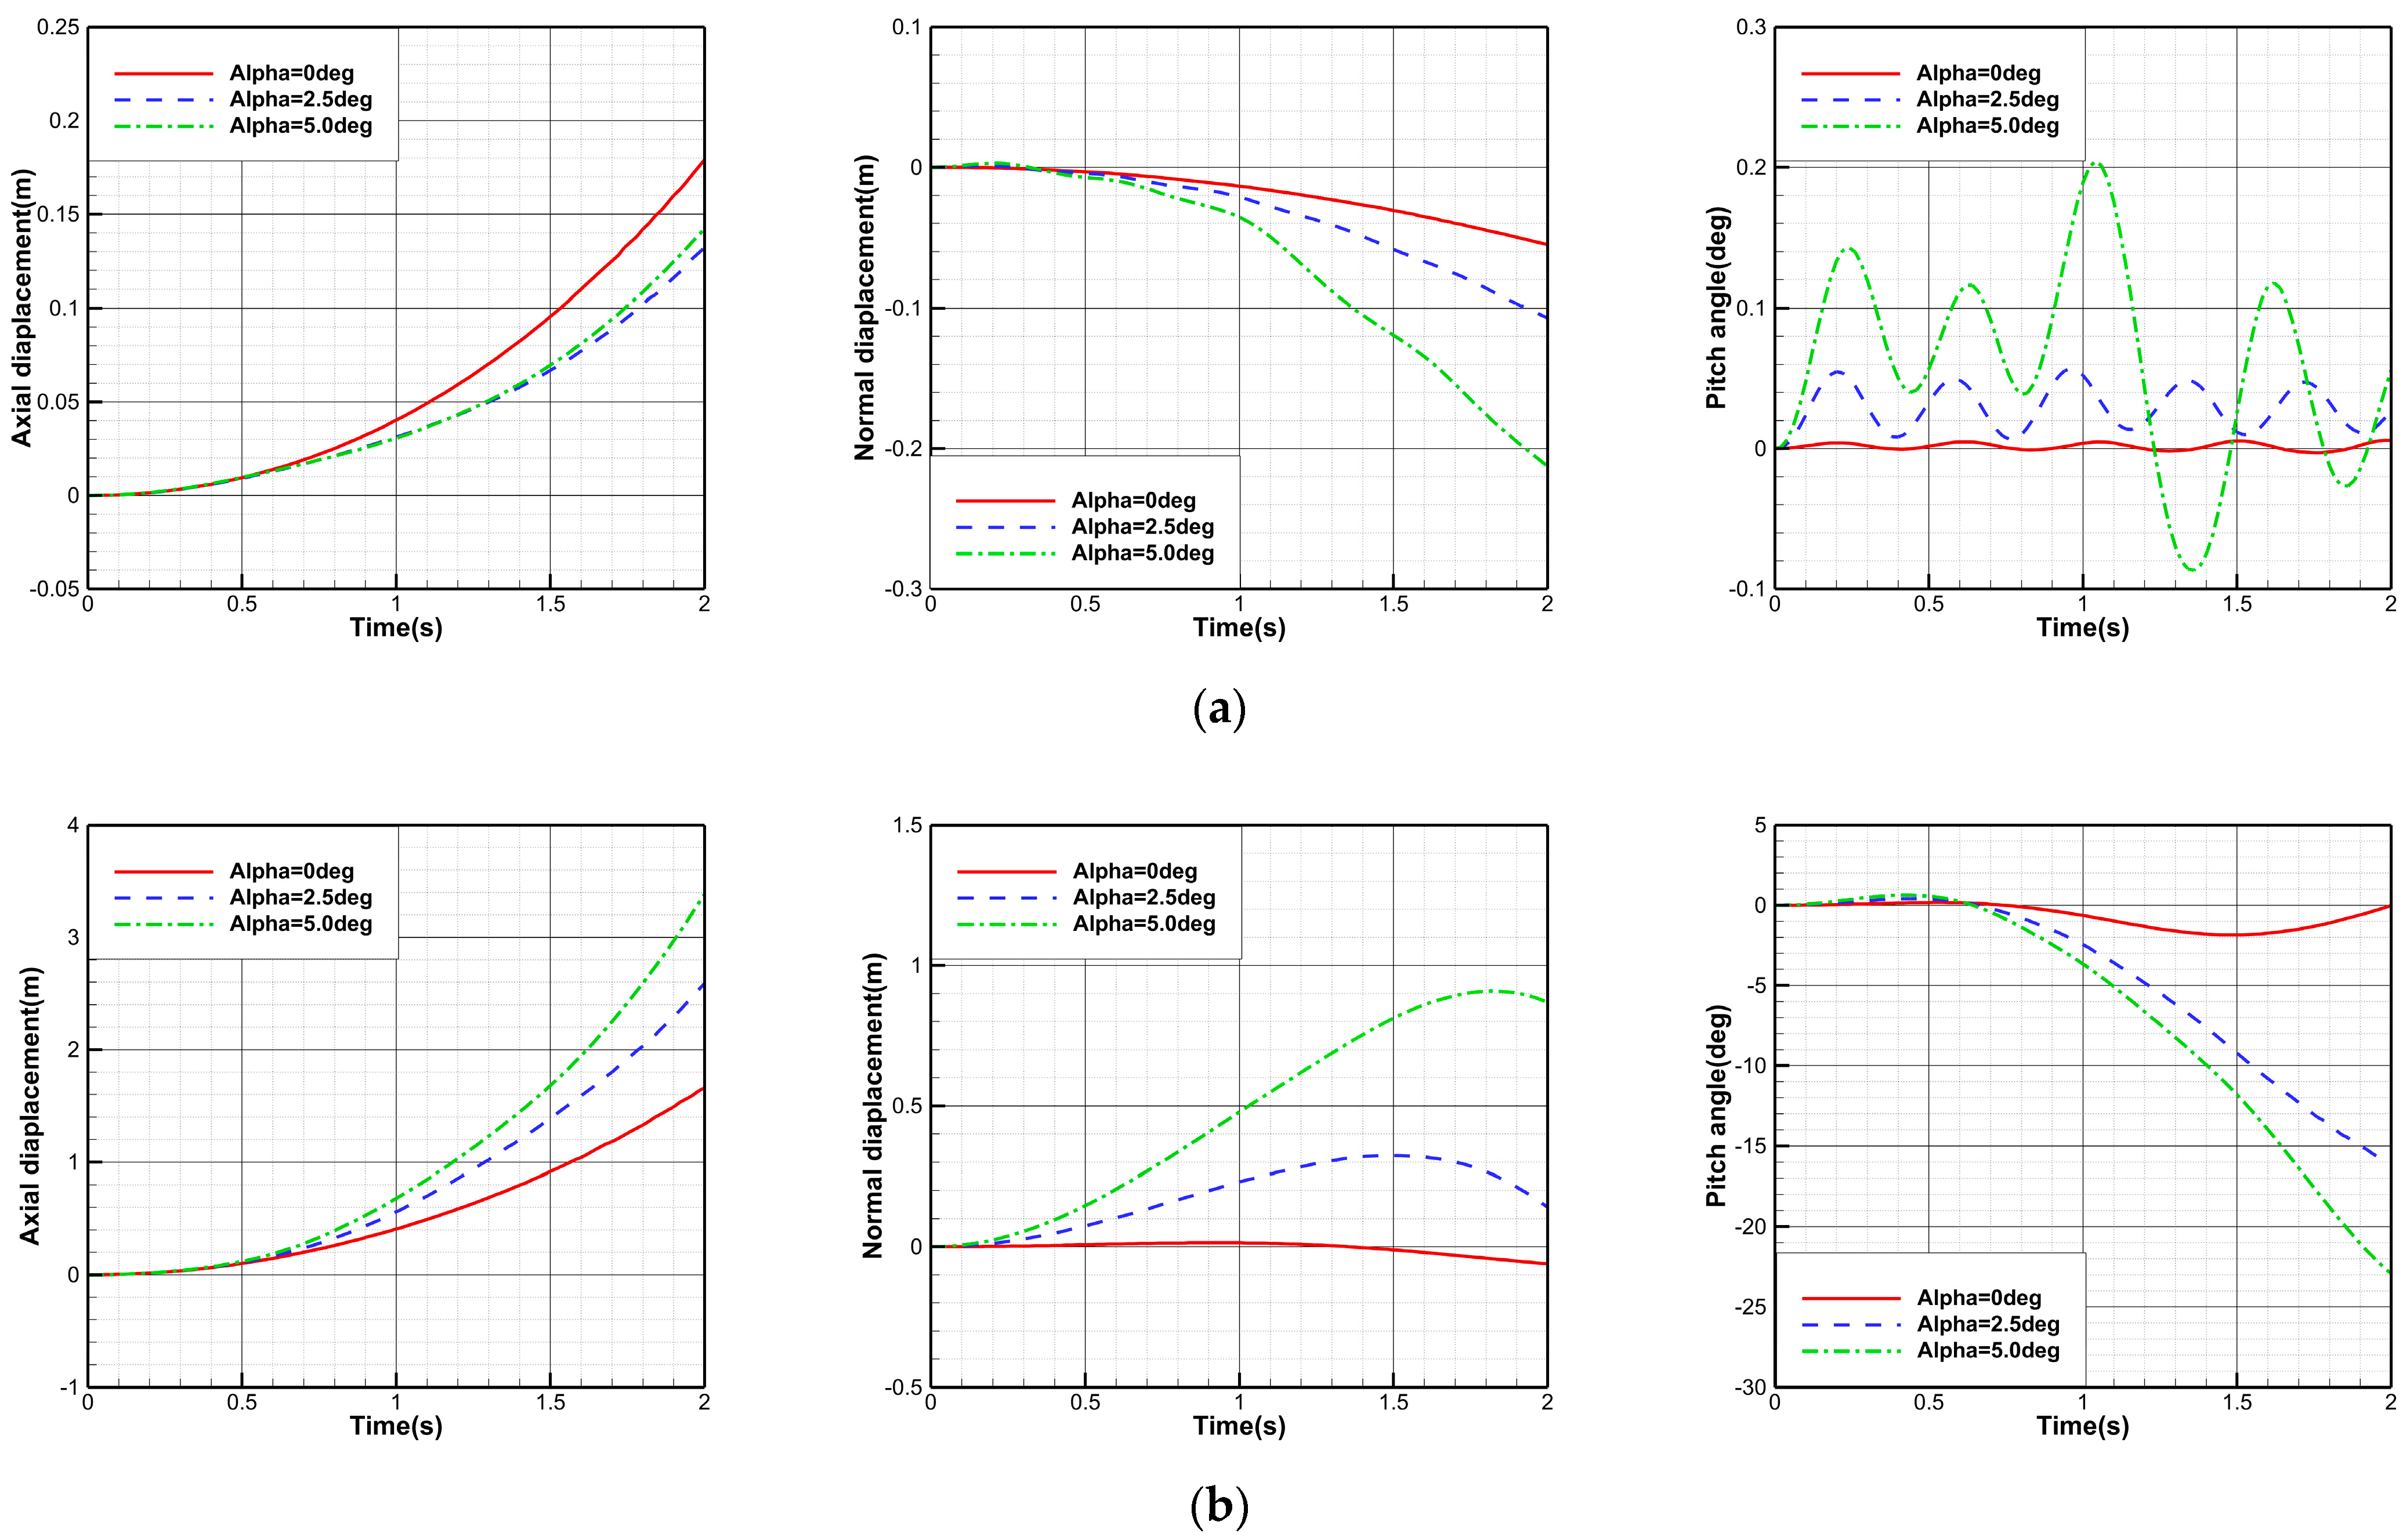
This section investigates the control effectiveness of the open-loop attitude control method under two states of angle of attack α = 0 ° and α = 2.5 ° . The axial displacement, normal displacement, and pitch angle variation curves of the two stages during the stage separation are shown in Figure 16. Except for the forebody normal displacement, the forebody and booster trajectories in both states exhibit the same trend. However, because the aerodynamic forces on the stages are larger when α = 2.5 ° , the range of variation in the forebody and booster trajectories is greater. Additionally, the angle of attack has a more pronounced effect on normal displacement and pitch angle compared to its influence on axial displacement. From the forebody pitch angle variation curve, it can be seen that when α = 0 ° , the forebody pitch angle after separation is only 0.27°, and under the open-loop attitude control method, the forebody pitch angle effectively reaches the control target. However, when α = 2.5 ° , the forebody pitch angle reaches 24.88° after separation.
The large variation in the forebody pitch angle causes significant changes in the aerodynamic parameters, which is highly detrimental to the next phase of the flight mission. Therefore, it can be seen that the open-loop attitude control method is only effective under specific freestream conditions. However, in actual flight, the freestream conditions are highly uncertain, making the applicability of the open-loop attitude control method limited.
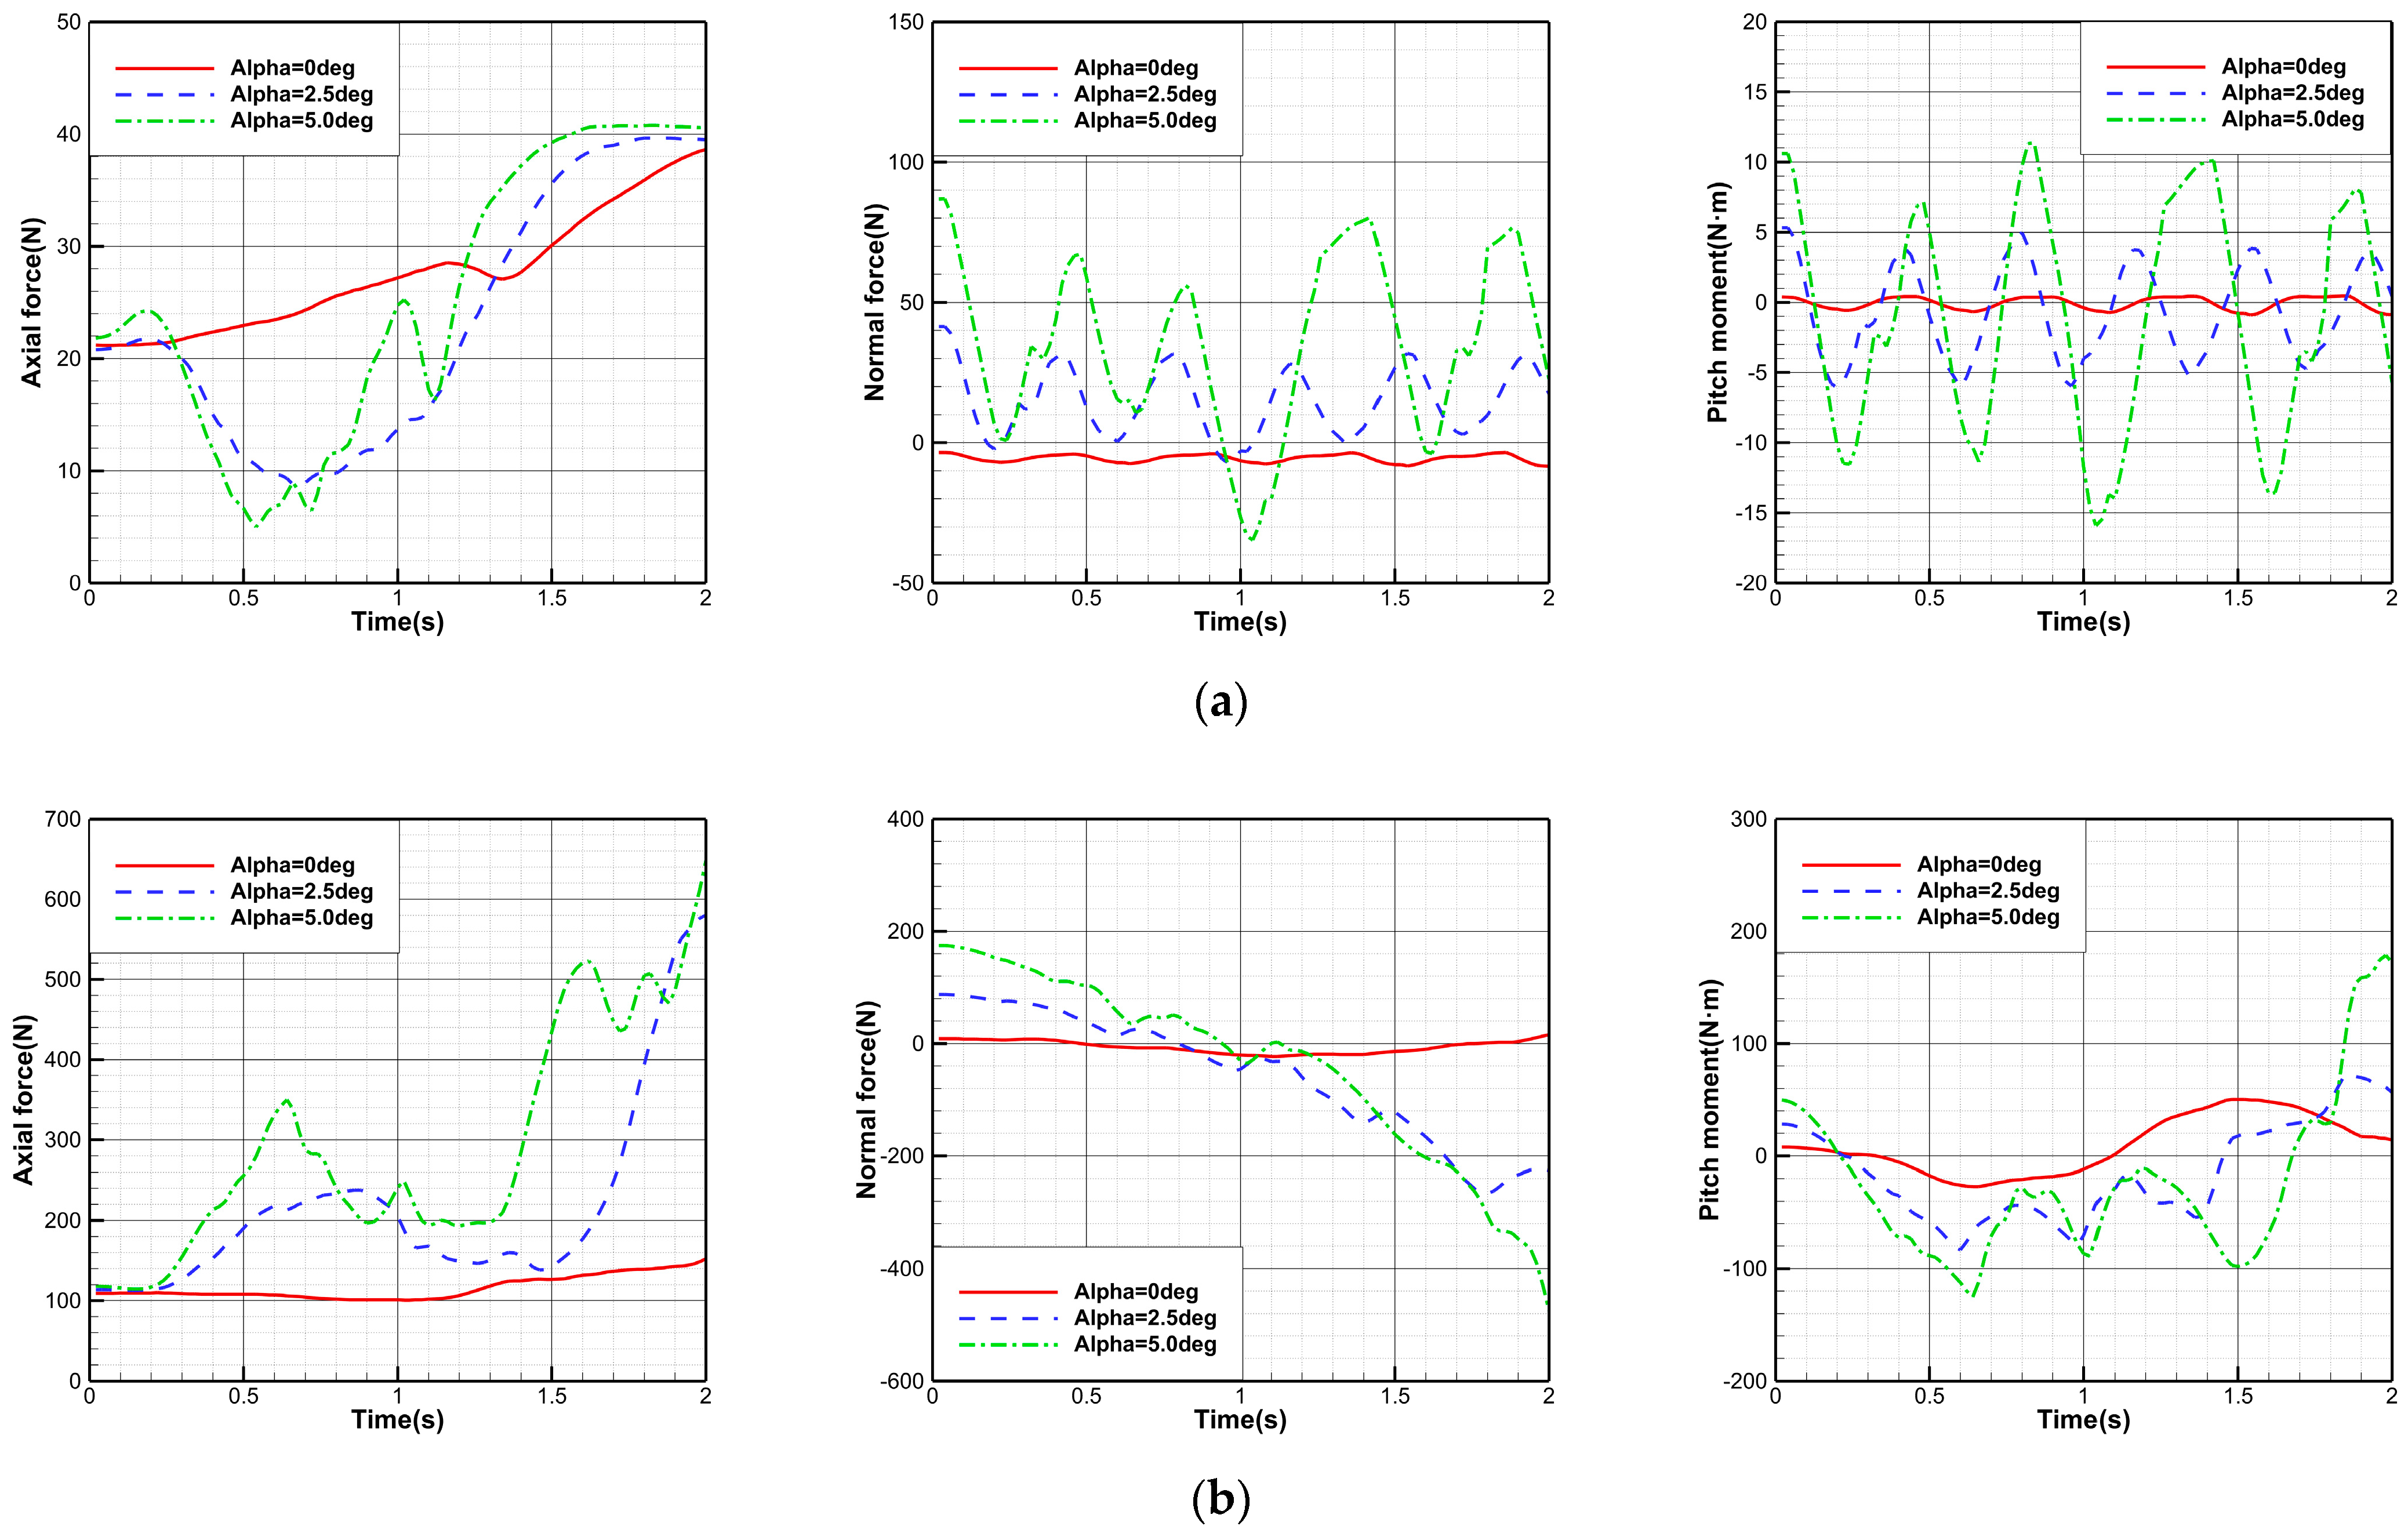
Figure 17 shows the variation curves of the aerodynamic parameters of the two stages during the separation, including axial force, normal force, and pitch moment. As shown in the figure, during the initial phase of stage separation, the axial forces on the forebody show minimal variation across different angles of attack, while significant differences are already observed in the normal forces and pitching moments. Throughout the separation, the aerodynamic forces on the vehicle remain relatively small at α = 0°. However, when α = 2.5°, due to the limited control effectiveness of the open-loop attitude control method on the forebody pitch angle, the forebody pitch angle increases rapidly during the separation, leading to significant variations in the aerodynamic parameters of the forebody. Furthermore, from Figure 11d, it can be seen that in the free stage separation, the forebody axial force decreases slightly at t = 1.12 s, then stops decreasing and starts to increase at t = 1.28 s. In contrast, for the stage separation under open-loop attitude control, the time delay between the decrease and increase of the forebody axial force is 0.04 s.
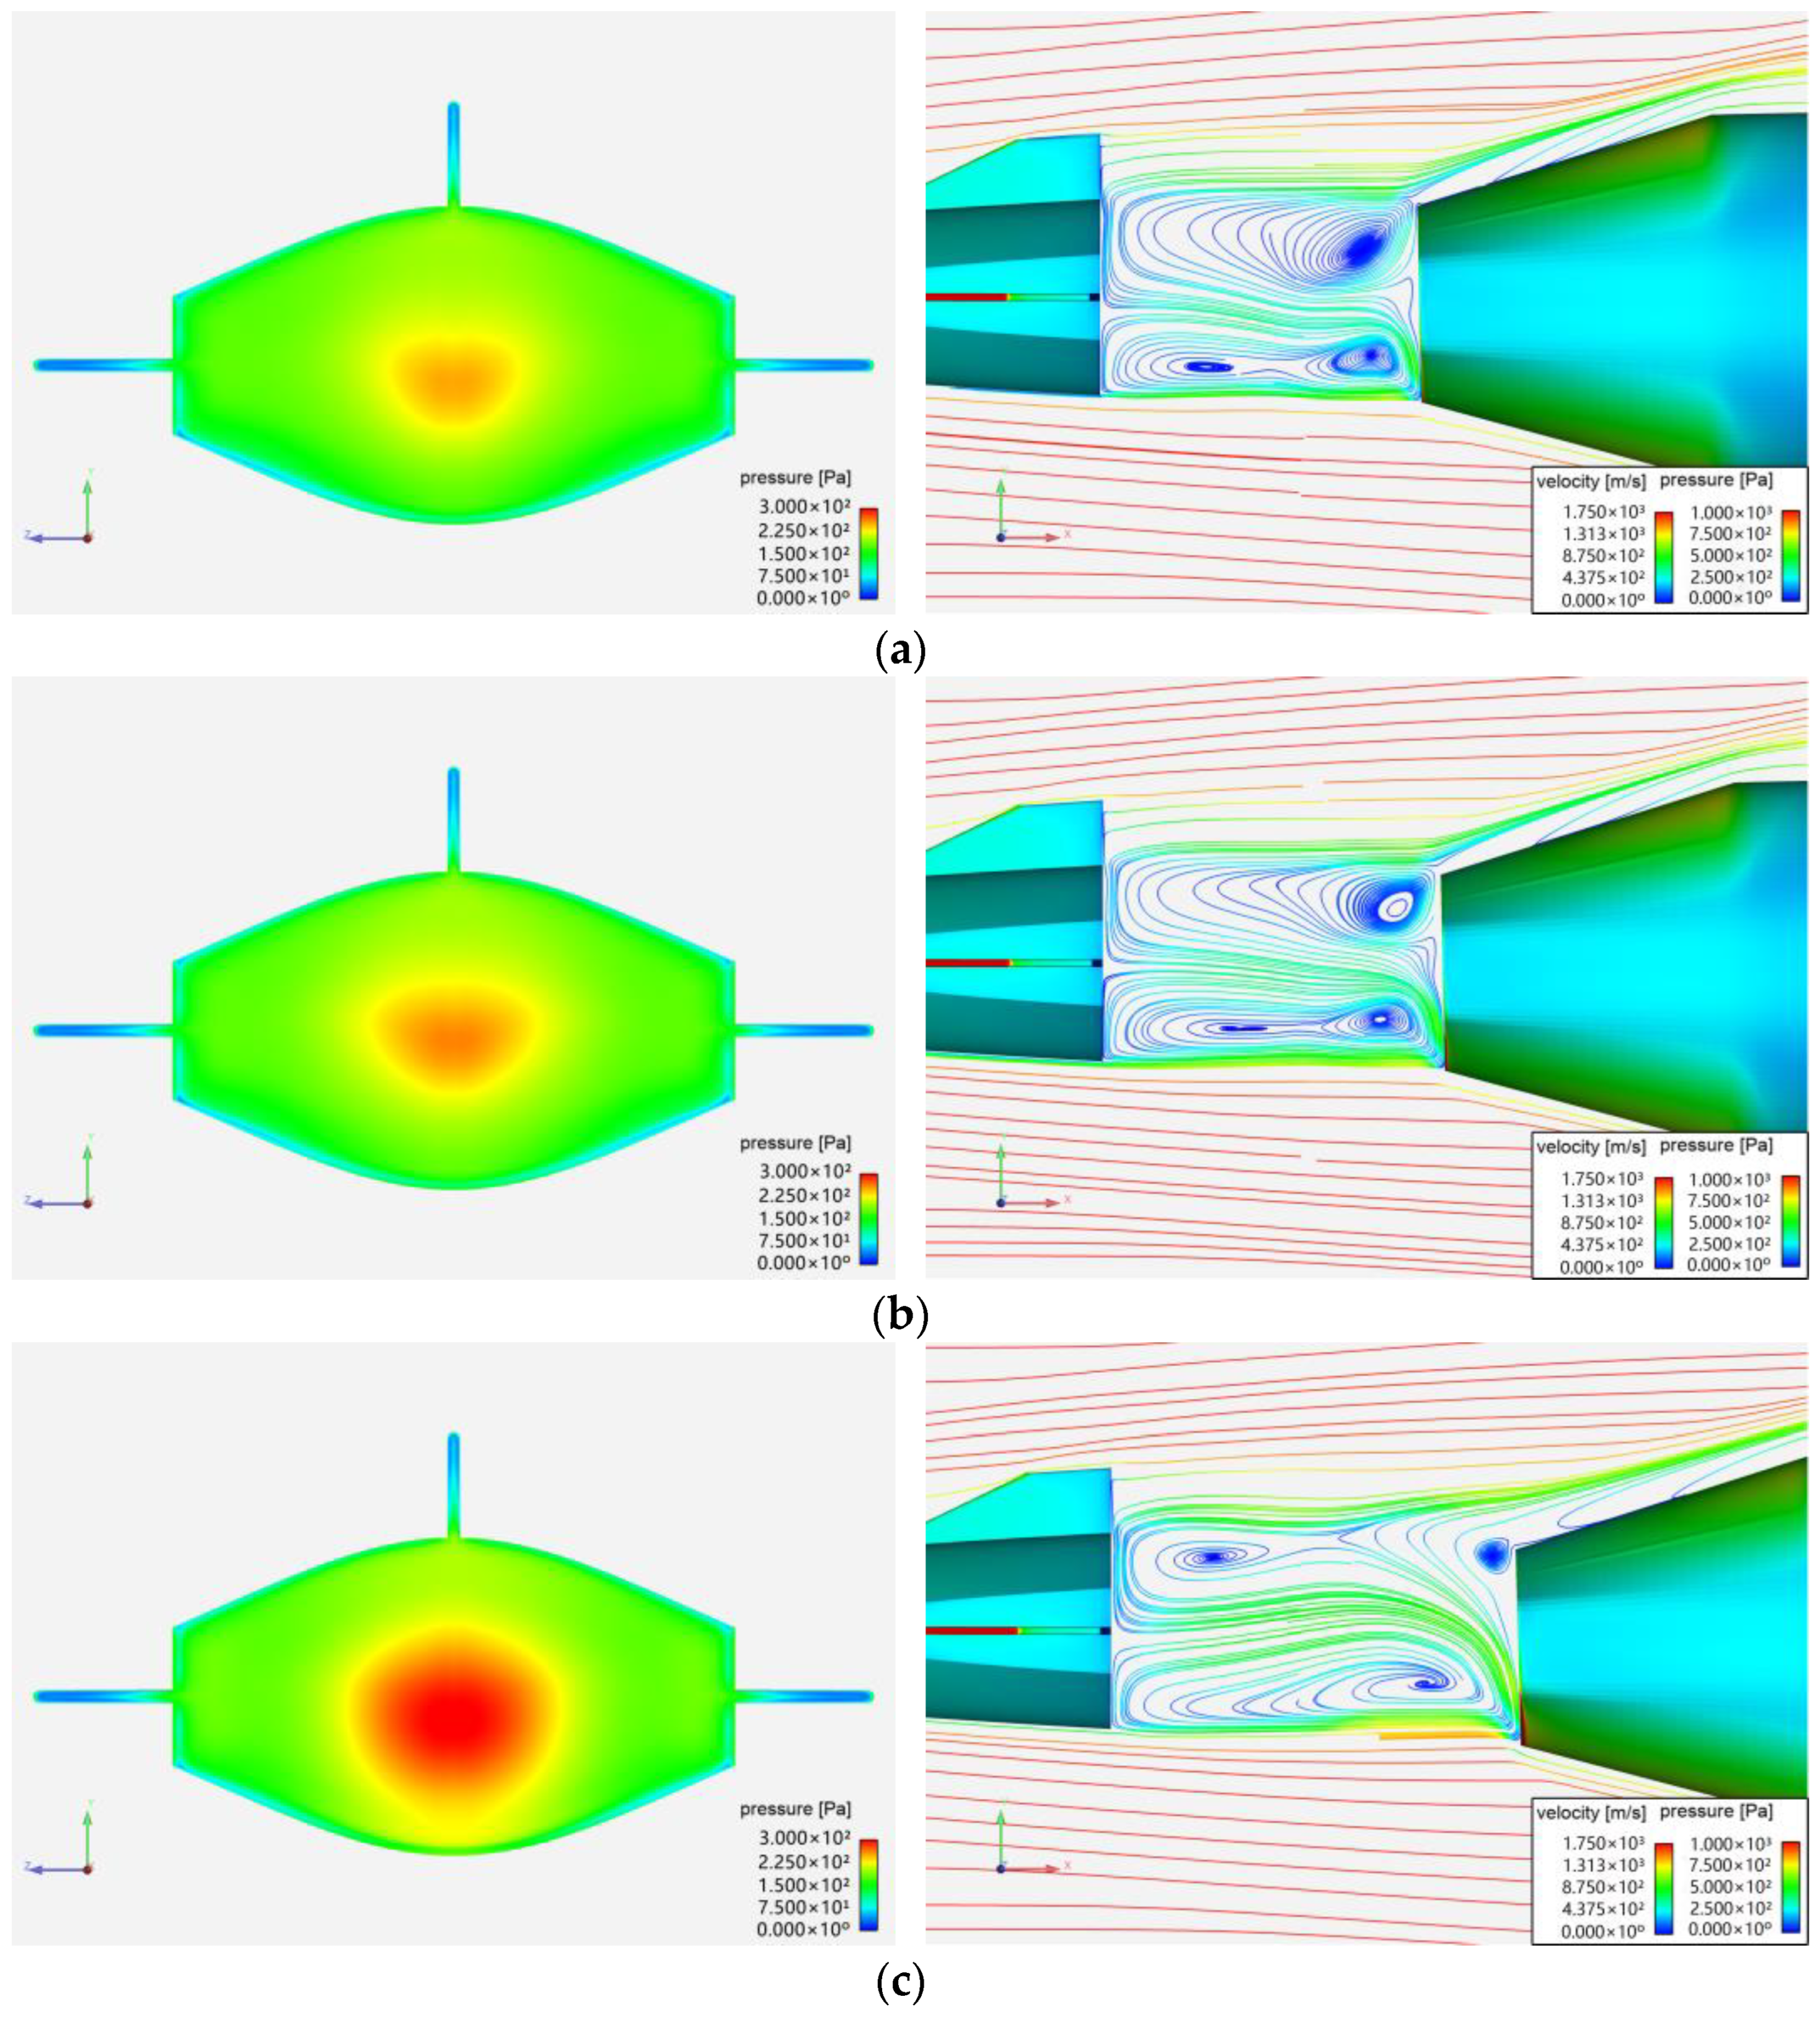
Figure 18 shows the surface pressure contours and velocity streamlines at the forebody tail. Compared with Figure 13, it can be observed that under open-loop attitude control, the time when the high-pressure region at the forebody tail enlarges is delayed by 0.04 s; thus, the time for the forebody axial force to decrease is also delayed by 0.04 s.
Additionally, the time when the influence range of the high-pressure region at the forebody tail reaches its maximum is also delayed by 0.04 s.
Under the control of open-loop attitude control, the flow field structure at t = 1.16 s is similar to the flow field structure at t = 1.12 s in the free stage separation, but the influence range of the vortex at the forebody tail has significantly increased. At t = 1.20 s, the vortex at the forebody tail has not disappeared, but the distance between the vortex core and the forebody tail increases, causing the high-pressure region at the forebody tail to expand, thus reducing the forebody axial force. Due to the influence of the lateral jet, the vortex at the upper position of the interstage region splits into two. At this point, the influence range of the high-pressure region at the forebody tail reaches its maximum value, causing the axial force to reach its minimum at this moment. In the subsequent stage separation, the high-pressure region at the forebody tail gradually decreases, causing the forebody axial force to gradually increase with time.

3.3.3. Closed-Loop Attitude Control Based on Lateral Jet

In the previous section, an open-loop attitude control method based on lateral jet was used to control the forebody’s pitch angle. When the angle of attack α = 0 ° , the open-loop attitude control method reduced the forebody’s pitch angle and effectively achieved the control target. However, when the angle of attack α = 2.5 ° , the open-loop control method was less effective in controlling the forebody pitch angle. To better control the forebody’s pitch angle in a complex inflow environment and increase the applicability of the attitude control method, this section uses a cascade PID algorithm to perform closed-loop control of the total pressure of the lateral jet. During the numerical simulation, the pitch angle of the forebody is input into the program incorporating a closed-loop attitude control method. The system subsequently computes and outputs the pressure of the lateral jet, with the jet pressure being dynamically updated at each time step. The closed-loop attitude control performance of the cascade PID algorithm is then compared and analyzed for the three states of α = 0 ° , α = 2.5 ° , and α = 5.0 ° . Furthermore, since the rate of change in the engine’s total pressure is affected by factors such as the response speed of the control mechanism and fuel combustion rate, the engine’s total pressure in this study is set to vary by no more than 0.5 MPa within 0.02 s.
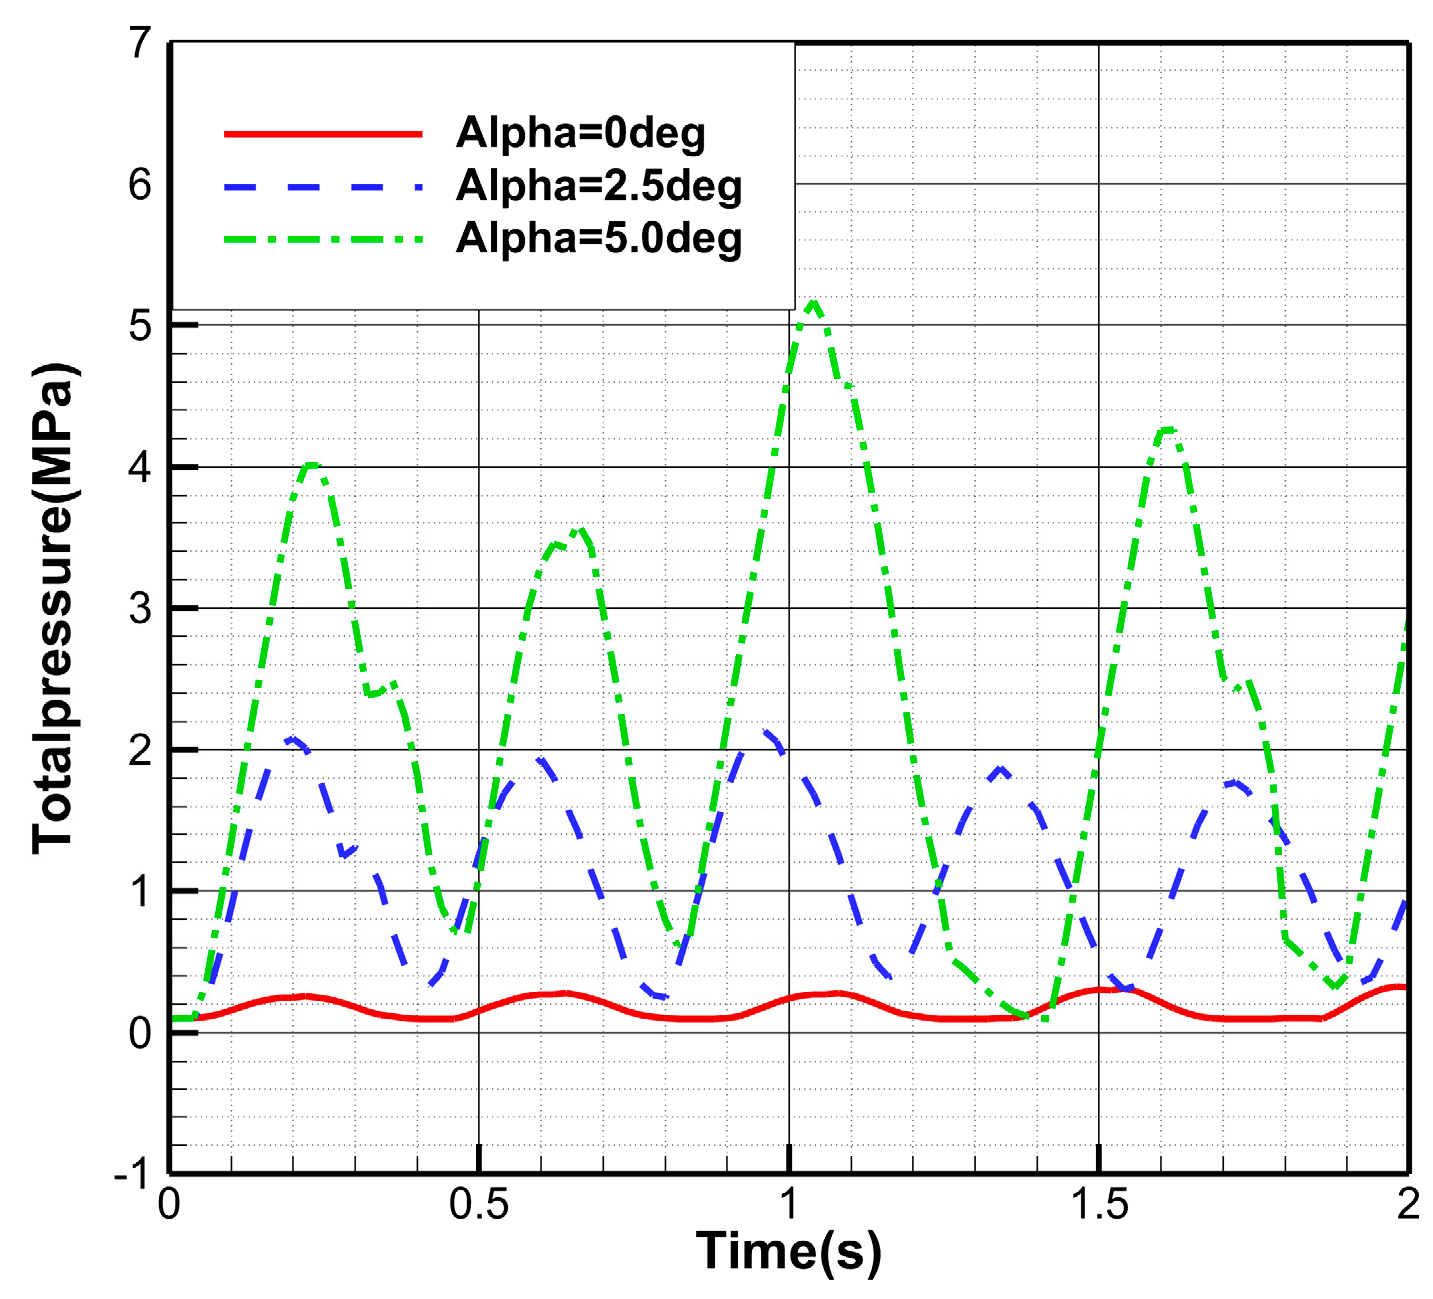
Figure 19 shows the variation curve of the total pressure of the lateral jet during the stage separation. Under the cascade PID closed-loop attitude control algorithm, the total pressure of the lateral jet exhibits a wave-like variation. Moreover, due to the larger aerodynamic forces experienced by the vehicle at higher angles of attack, larger control forces/moments are required, resulting in a larger variation range of the jet’s total pressure. Additionally, when the angle of attack α = 0 ° and 2.5°, five peaks appear within the calculation time, while for α = 5.0 ° , the jet’s total pressure variation curve only shows four peaks.
Figure 20 shows the axial displacement, normal displacement, and pitch angle variation curves of the two stages during the stage separation. As shown in the figure, for the forebody, the axial displacement increases monotonically, but there is no obvious correlation between the angle of attack and axial displacement. The normal displacement of the forebody decreases monotonically over time, and as the angle of attack increases, the normal displacement decreases progressively, leading to greater altitude loss. During the stage separation, the forebody’s pitch angle exhibits oscillatory changes, and the amplitude of these changes increases as the angle of attack increases. When α = 0 ° , the maximum pitch angle observed during separation is only 0.006°, which is significantly smaller compared to the maximum pitch angle of 0.27° achieved under the open-loop control algorithm. This demonstrates that the cascade PID closed-loop control algorithm achieves the control objective more effectively. When α = 5.0 ° , the forebody experiences larger aerodynamic forces, and the aerodynamic interference between the two stages becomes more severe, making attitude control of the forebody extremely challenging. However, under the cascade PID closed-loop control algorithm, the maximum pitch angle of the forebody during separation is only 0.20°, which still meets the control objective effectively. This shows that the cascade PID closed-loop control algorithm can achieve the control goal within a certain range of angles of attack and is more widely applicable than the open-loop attitude control algorithm. For the booster, the axial displacement increases gradually over time, and the axial displacement is larger with a greater angle of attack. The rapid increase in interstage distance helps reduce aerodynamic interference, which is beneficial for the interstage separation process. However, the normal displacement of the booster increases with the angle of attack, which, in turn, increases the aerodynamic interference between the forebody and the booster. When t < 0.60 s, the pitch angle curves of the booster in all three states are nearly identical. When t > 0.60 s, the pitch angle of the booster rapidly decreases, showing significant differences. At this point, the booster’s pitch angle decreases as the angle of attack increases.
The variation curves of aerodynamic parameters for the forebody and booster during stage separation are shown in Figure 21. As shown in the figure, with the increase in angle of attack, the variation range of aerodynamic parameters for the forebody and booster gradually increases. For the forebody, there are significant differences in the axial force variation curves under different states. When α = 0 ° , the axial force of the forebody gradually increases with time, decreases slightly at t = 1.16 s, and then gradually increases again at t = 1.32 s. However, for α = 2.5 ° and α = 5.0 ° , the axial force of the forebody shows a decreasing trend at t = 0.20 s, with large fluctuations in amplitude. The forebody normal force and pitch moment exhibit wave-like variations, and their variation trends are generally consistent. This indicates that the center of pressure of the forebody changes little during the stage separation process. Compared with Figure 18, it can be seen that the peaks of the total jet pressure curve correspond to the troughs of the forebody normal force and pitch moment curves, and similarly, the peaks of the forebody normal force and pitch moment curves correspond to the troughs of the total jet pressure curve. For the booster, as the aerodynamic force on the forebody increases with the angle of attack, the lateral jet needs to provide greater control force and moment, leading to an increased variation range in the total pressure of the lateral jet, which, in turn, amplifies the effect on the aerodynamic parameters of the booster, causing larger fluctuations in the aerodynamic parameter curves.
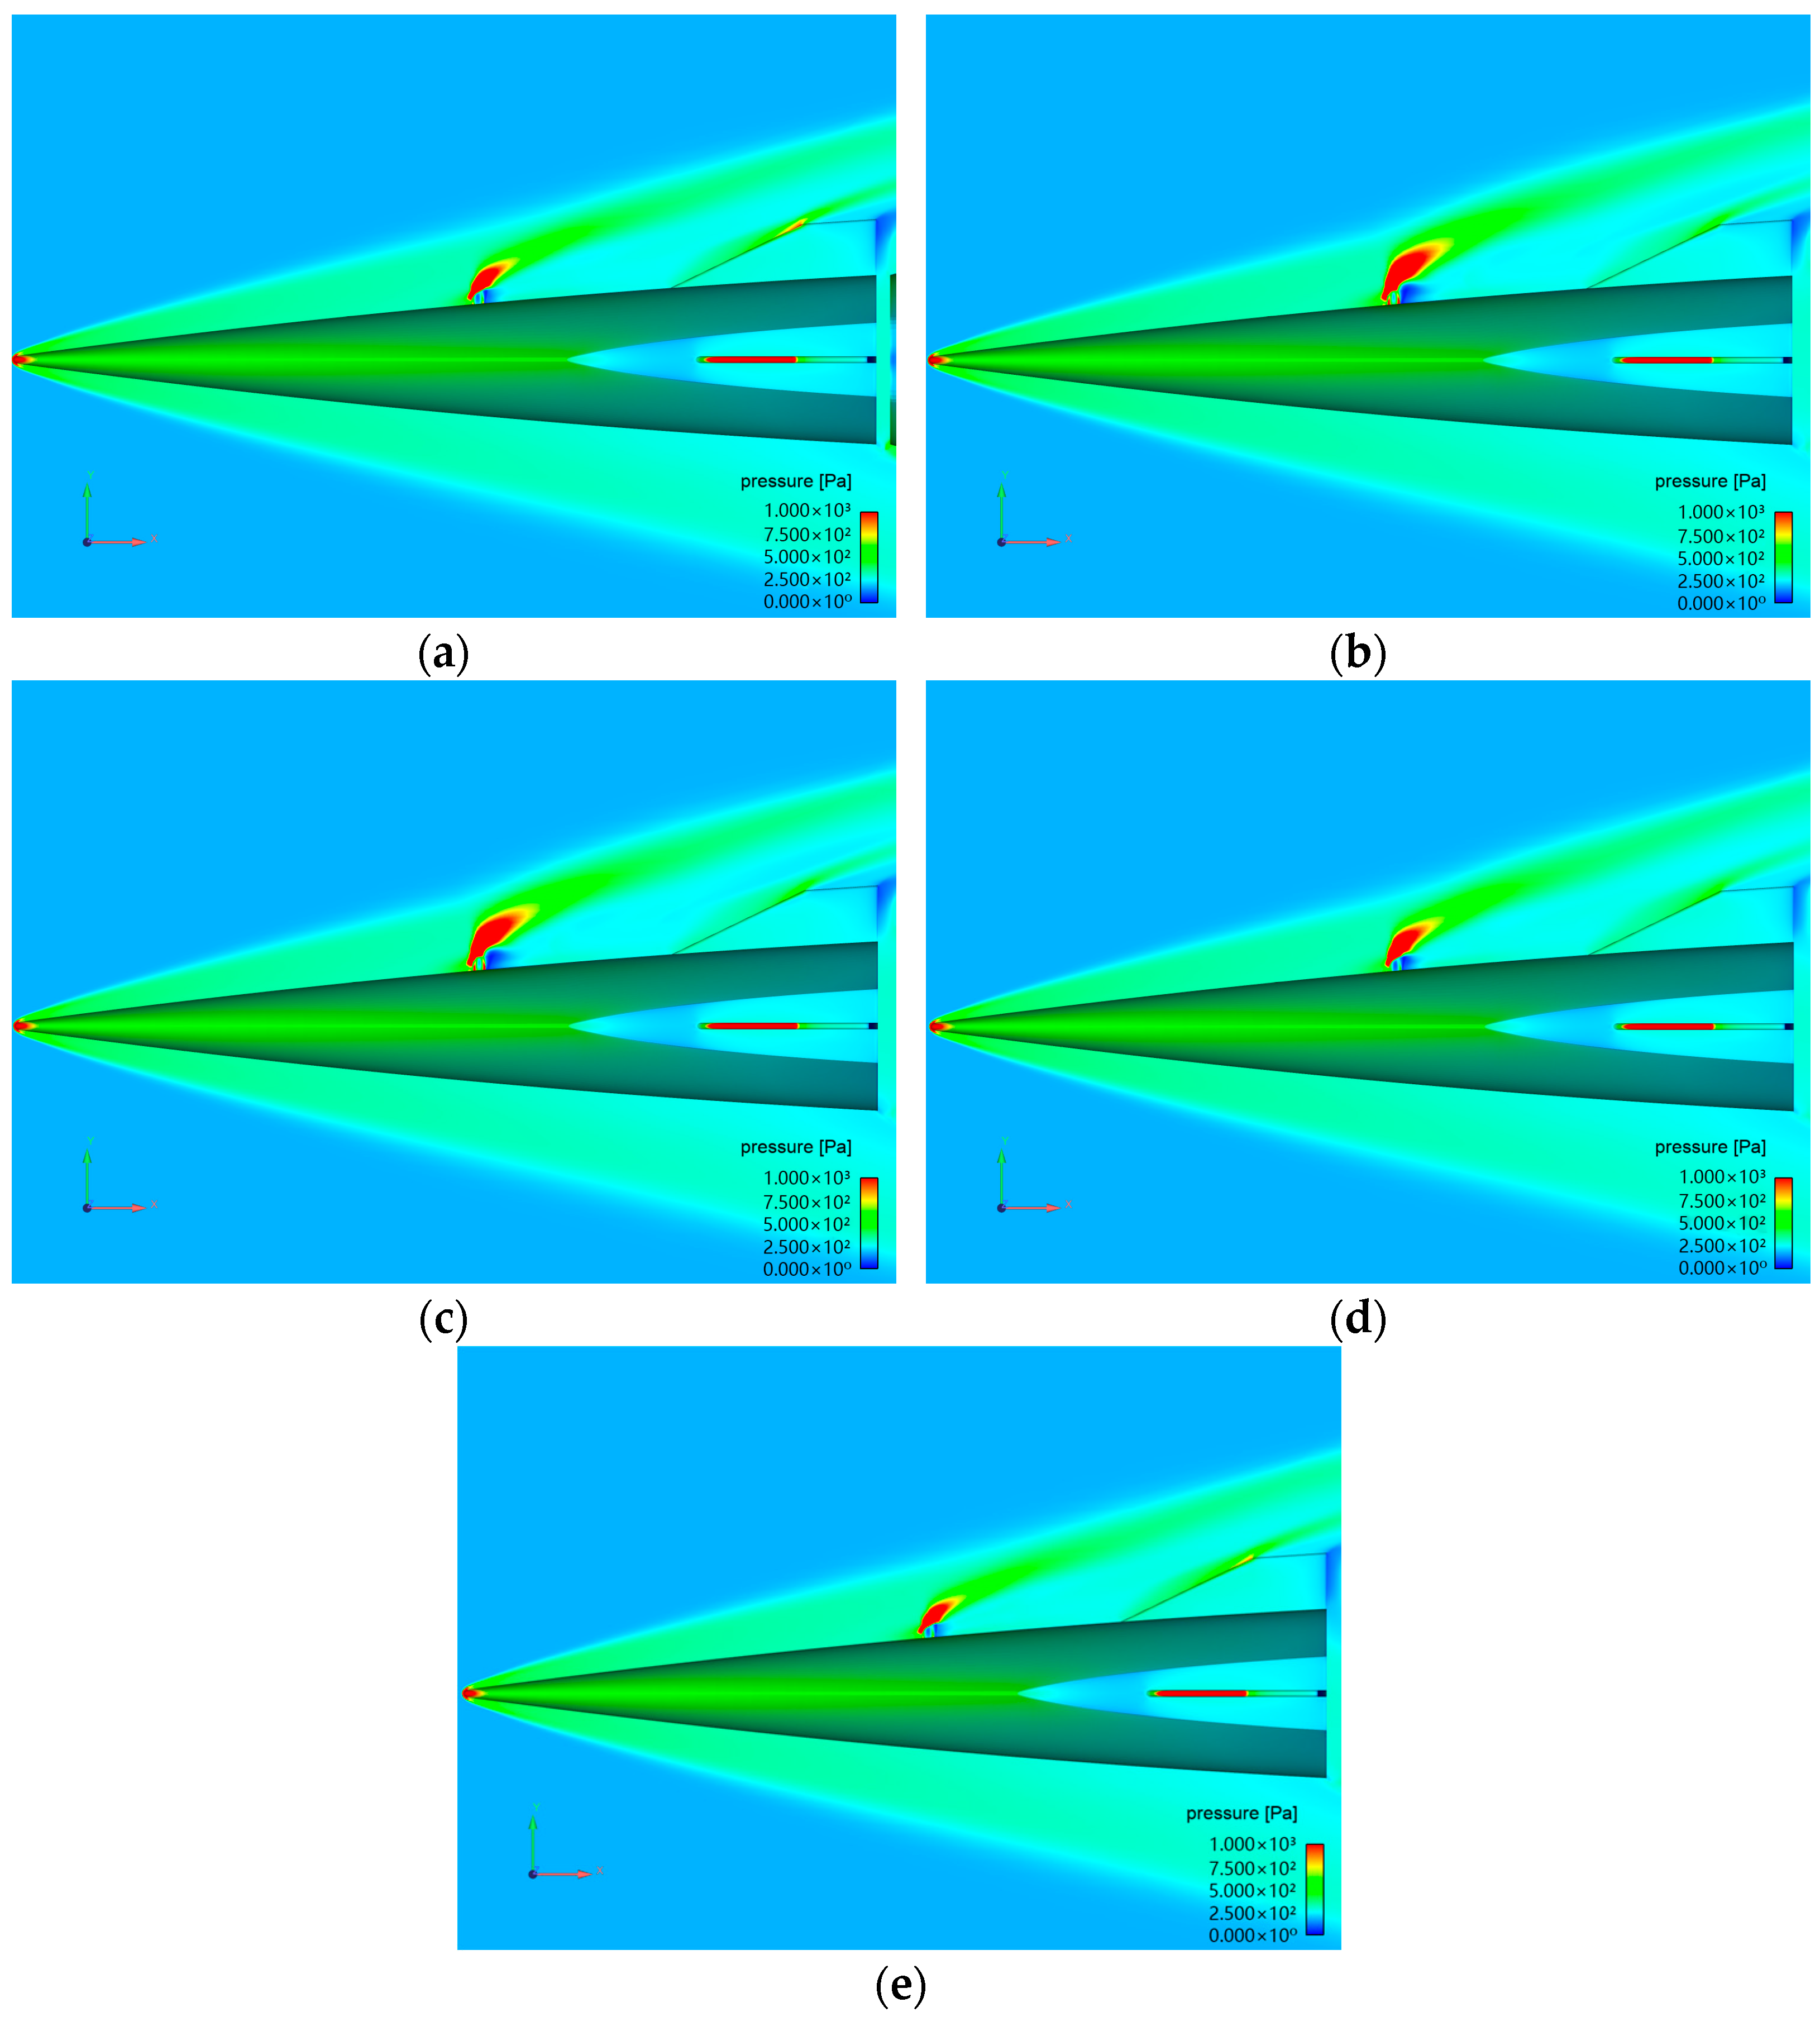
Figure 22 presents the pressure contours of the flow field at several characteristic moments. As shown in the figure, with the increase in total jet pressure, the flow structure of the field remains unchanged, but the range of barrel shockwaves formed by jet expansion gradually increases, indicating enhanced jet penetration capability. Additionally, the obstruction effect of the jet on the incoming flow increases, resulting in an increase in both the intensity and height of the bow shock.
At t = 0.04 s, the jet total pressure curve is at its first trough. At this moment, the control force/moment of the lateral jet on the forebody is relatively small, resulting in the forebody’s normal force and pitch moment curves reaching their first peaks. When 0.04 s < t < 0.20 s, the forebody exhibits a nose-up tendency, causing the jet total pressure to gradually increase. Consequently, the reactive force/moment of the jet on the forebody increases, and the bow shock intensity formed by the incoming flow being obstructed by the jet also increases. At t = 0.20 s, the jet total pressure curve reaches its first peak, with a total pressure of 0.25 MPa. However, at t = 0.28 s, the high-pressure region near the nozzle reaches its maximum extent, delayed by 0.08 s compared to the peak in jet total pressure, indicating that the lateral jet’s interference with the external flow field lags behind changes in jet total pressure. Furthermore, the detached shockwave at the forebody’s nose is disturbed by the bow shock near the nozzle, leading to a slight increase in the shock angle of the detached shockwave. When 0.30 s < t < 0.40 s, the jet total pressure gradually decreases, resulting in an increase in the forebody’s normal force and pitch moment. Although the jet total pressure curve is at a trough at t = 0.40 s, due to the lag in the lateral jet’s interference with the external flow field, the high-pressure region reaches its minimum extent at t = 0.48 s.
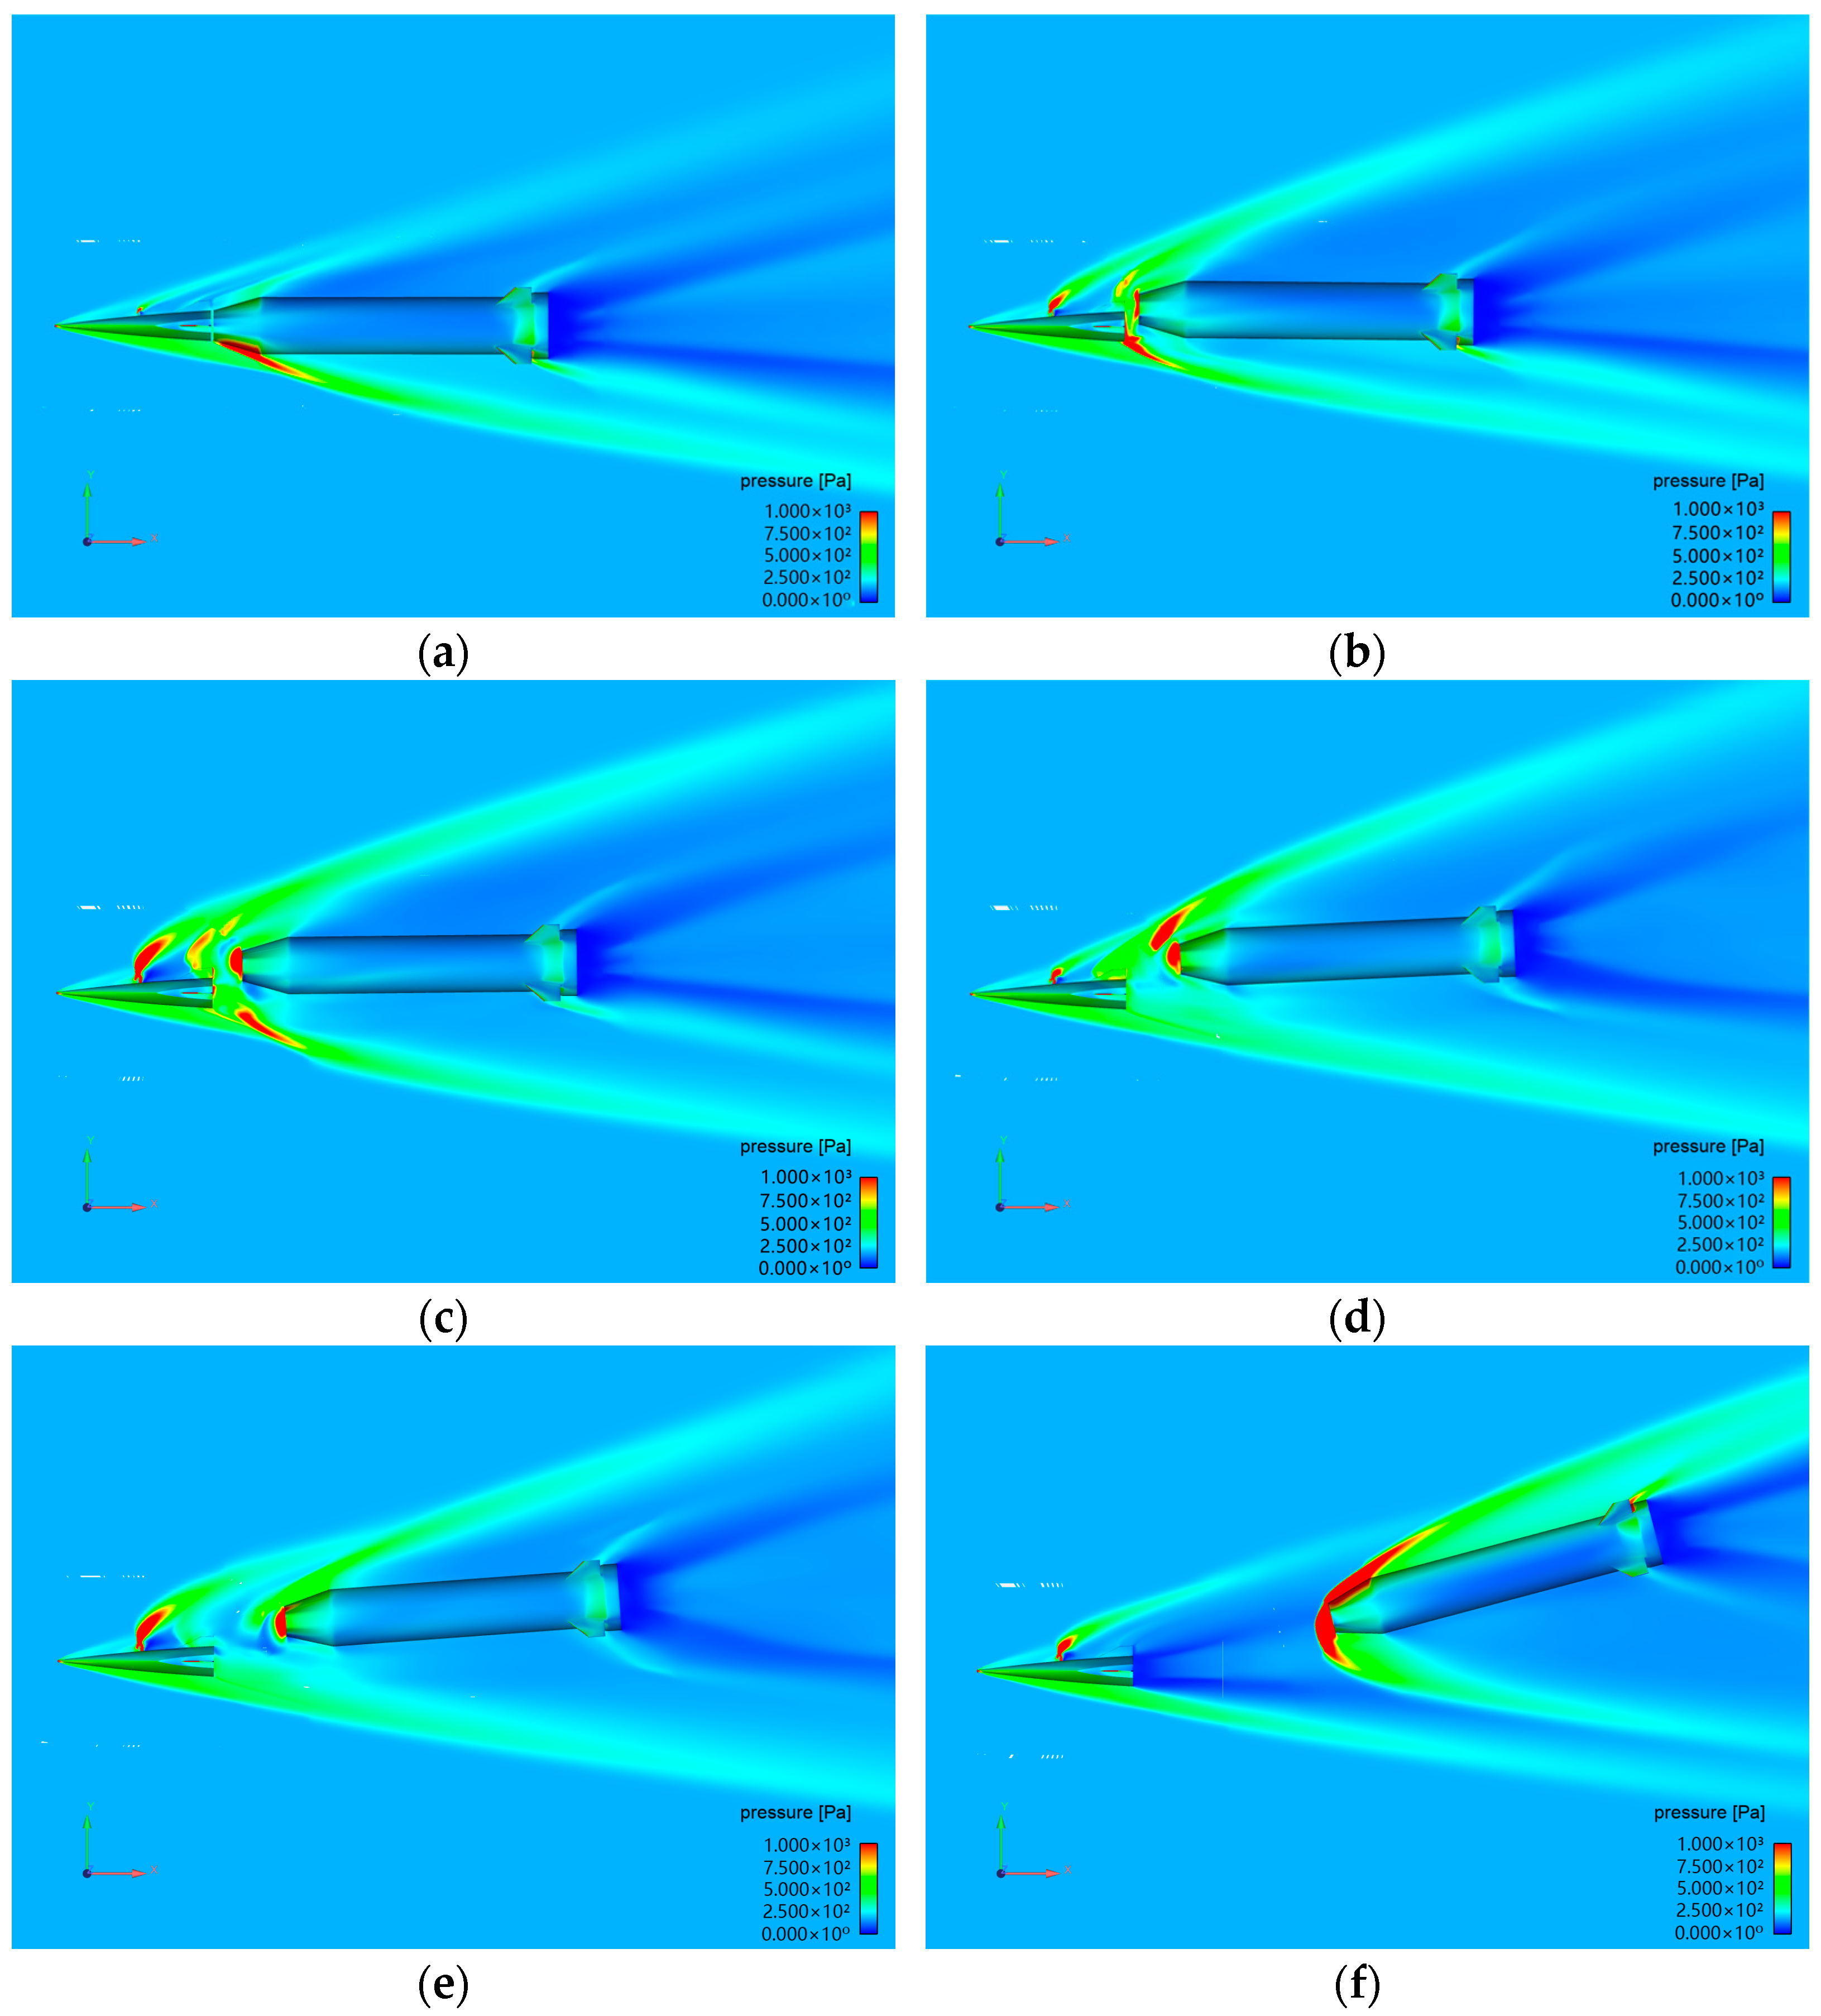
Figure 23 presents the pressure contours of the flow field at several moments when the angle of attack α = 5.0 ° . As can be seen in the figure, the interstage separation flow field becomes more complex at α = 5.0 ° , with intense aerodynamic interactions between the two stages reducing the effectiveness of the closed-loop attitude control method. During the initial stage of stage separation, the hypersonic incoming flow is obstructed by the forebody’s nose, forming a detached shockwave. This shockwave interacts with the oblique shock and expansion waves at the booster nose. As separation progresses, the booster’s normal displacement increases rapidly, intensifying its obstruction of the incoming flow and resulting in increased pressure within the interstage region. Furthermore, due to the significant aerodynamic forces acting on the vehicle and the strong aerodynamic interference between the two stages, the lateral jet must exert greater control forces/moments, leading to a rapid increase in jet total pressure and a larger high-pressure region in the flow field. Between 0.52 s < t < 1.04 s, high-pressure regions within the interstage region appear and disappear, causing significant fluctuations in the forebody’s aerodynamic characteristics. When t > 1.60 s, the aerodynamic interference of the booster on the forebody diminishes, resulting in the forebody’s axial force remaining essentially constant.

4. Conclusions

The stage separation of hypersonic vehicles is confronted with severe aerodynamic interference, resulting in substantial attitude instabilities that threaten the success of subsequent flight missions. To address this issue, this study investigates open-loop and closed-loop attitude control methods utilizing lateral jets to stabilize the forebody during separation. Numerical simulations based on dynamic CFD were conducted for the stage separation of a tandem hypersonic vehicle under an incoming flow Mach number of 5.37 and a flight altitude of 43.6 km. Through comparative analysis of the trajectories and aerodynamic characteristics under free separation, open-loop, and closed-loop control, the following conclusions are drawn:
(1)
During free stage separation, the forebody’s pitch angle still reached 4.43° at an angle of attack α = 0 ° , which could adversely affect its subsequent flight missions.
(2)
The open-loop attitude control method based on lateral jet can effectively control the pitch angle of the forebody only when the angle of attack is 0°. However, since the angle of attack may change during actual flight, the applicability of the open-loop control method is limited.
(3)
Under the control of the closed-loop attitude control algorithm, the total pressure of the lateral jet exhibits a wave-like variation, and the amplitude of the total pressure increases with the angle of attack. Consequently, the overshoot of the forebody pitch angle and the pitch angle after separation also increases, leading to a decline in the control effectiveness of the closed-loop algorithm. However, when the angle of attack is 5.0°, the forebody pitch angle after separation is only 0.06°, indicating that the closed-loop attitude control method based on lateral jet outperforms the open-loop method in both control effectiveness and applicability.
This study primarily investigates the control performance of the closed-loop attitude control method under different angles of attack, without considering the effects of incoming flow conditions such as altitude and Mach number. Furthermore, although the PID algorithm is well-established, interference may occur when measurement instruments assess and differentiate the parameters of the vehicle during actual flights, adversely impacting the effectiveness of the PID algorithm. Future research could explore the use of more advanced and effective control algorithms.

Author Contributions

Methodology, J.F., W.G. and S.T.; investigation, W.G. and J.F.; data curation, P.H.; writing—review & editing, W.G. and J.F. All authors have read and agreed to the published version of the manuscript.

Funding

This research received no external funding.

Data Availability Statement

The original contributions presented in this study are included in the article. Further inquiries can be directed to the corresponding authors.

Conflicts of Interest

The authors declare no conflict of interest.

References

  1. Xiang, G.X.; Wang, C.; Teng, H.H.; Jiang, Z.L. Shock/shock interactions between bodies and wings. Chin. J. Aeronaut. 2018, 31, 255–261. [Google Scholar] [CrossRef]
  2. Lungu, C.; Ramasamy, S.; Scarborough, D.; Jagoda, J.; Menon, S. Experimental studies of stage separation in a Mach 2.5 free stream. In Proceedings of the 47th AIAA Aerospace Sciences Meeting Including The New Horizons Forum and Aerospace Exposition, Oriando, FL, USA, 5–8 January 2009. [Google Scholar] [CrossRef]
  3. McQuellin, L.P.; Kennell, C.M.; Sytsma, J.M.; Choudhury, R.; Neely, A.; Buttsworth, D.R.; Slivester, T. Investigating endo-atmospheric separation of a hypersonic flyer-sustainer using wind tunnel based free-flight. In Proceedings of the 23rd AIAA International Space Planes and Hypersonic Systems and Technologies Conference, Montreal, QC, Canada, 10–12 March 2020. [Google Scholar] [CrossRef]
  4. Qian, F.X.; Guo, P.; Gao, P.; Liu, Q.; Wang, Y.J.; Yi, G.Q. Stage separation trajectory simulation test technique in high speed wind tunnel. J. Exp. Fluid Mech. 2021, 35, 90–98. [Google Scholar]
  5. Li, J.P.; Chen, S.S.; Cai, F.J.; Yan, C. Numerical investigation of vented plume into a supersonic flow in the early stage of rocket hot separation. Aerosp. Sci. Technol. 2020, 107, 106249. [Google Scholar] [CrossRef]
  6. Wang, Y.; Wang, Y.P.; Xue, X.P.; Jiang, Z.L. Numerical investigation on safe stage separation problem of a TSTO model at Mach 7. Chin. J. Theor. Appl. Mech. 2022, 54, 526–542. [Google Scholar]
  7. Jia, J.H.; Fu, D.B.; He, Z.P.; Yang, J.F.; Hu, L.J. Hypersonic aerodynamic interference investigation for a two-stage-to-orbit model. Acta Astronaut. 2020, 168, 138–145. [Google Scholar] [CrossRef]
  8. Bahm, C.; Baumann, E.; Martin, J.; Bose, D.; Beck, R.; Strovers, B. The X-43A Hyper-X Mach 7 flight 2 guidance, navigation, and control overview and flight test results. In Proceedings of the AIAA/CIRA 13th International Space Planes and Hypersonics Systems and Technologies Conference, Capua, Italy, 16–20 May 2005. [Google Scholar] [CrossRef]
  9. Pinier, J.T.; Niskey, C.J. Ares I and Ares I-X stage separation aerodynamic testing. J. Spacecr. Rocket. 2012, 49, 842–852. [Google Scholar] [CrossRef]
  10. Bordelon, W.; Frost, A.; Reed, D. Stage separation wind tunnel tests of a generic TSTO launch vehicle. In Proceedings of the 21st AIAA Applied Aerodynamics Conference, Oriando, FL, USA, 23–26 June 2003. [Google Scholar] [CrossRef]
  11. Wang, Y.; Wang, Y.; Jiang, Z. Experimental study of longitudinal stage separation of two-body configuration in shock tunnel. AIAA J. 2022, 60, 6940–6946. [Google Scholar] [CrossRef]
  12. Hohn, O.M.; Gülhan, A. Impact of retrorocket plumes on upper-stage aerothermodynamics during stage separation. J. Spacecr. Rocket. 2017, 54, 640–651. [Google Scholar] [CrossRef]
  13. Moelyadi, M.A.; Breitsamter, C.; Laschka, B. Stage-separation aerodynamics of two-stage space transport systems. Part 1: Steady-state simulations. J. Spacecr. Rocket. 2008, 45, 1230–1239. [Google Scholar] [CrossRef]
  14. Moelyadi, M.A.; Breitsamter, C.; Laschka, B. Stage-separation aerodynamics of two-stage space transport systems part 2: Unsteady simulation. J. Spacecr. Rocket. 2008, 45, 1240–1250. [Google Scholar] [CrossRef]
  15. Wang, Y.; Wang, Y.P.; Jiang, Z.L. Unsteady interaction mechanism of transverse stage separation in hypersonic flow for a two-stage-to-orbit vehicle. Phys. Fluids 2023, 35, 488–503. [Google Scholar] [CrossRef]
  16. Liu, Y.; Qian, Z.S.; Lu, W.B.; He, S. Numerical investigation on the safe stage-separation mode for a TSTO vehicle. Aerosp. Sci. Technol. 2020, 107, 106349. [Google Scholar] [CrossRef]
  17. Wang, Y.; Wang, Y.; Jiang, Z. Numerical investigation of aerodynamic separation schemes for two-stage-to-orbit-like two-body system. Aerosp. Sci. Technol. 2022, 131, 107995. [Google Scholar] [CrossRef]
  18. Li, Y.; Reimann, B.; Eggers, T. Coupled Simulation of CFD and Flight Mechanics with a Two-Species-Gas-Model for the Hot Staging of a Multistage Rocket. In Proceedings of the 19th AIAA International Space Planes and Hypersonic Systems and Technologies Conference, Atlanta, GA, USA, 16–20 June 2014. [Google Scholar]
  19. Erdem, E.; Kontis, K. Numerical and experimental investigation of transverse injection flows. Shock. Waves 2010, 20, 103–118. [Google Scholar]
  20. Ukai, T.; Zare-Behtash, H.; Erdem, E.; Lo, K.H.; Kontis, K.; Obayashi, S. Effectiveness of jet location on mixing characteristics inside a cavity in supersonic flow. Exp. Therm. Fluid Sci. 2014, 52, 59–67. [Google Scholar] [CrossRef]
  21. Erdem, E.; Kontis, K. Experimental investigation of sonic transverse jets in Mach 5 crossflow. Aerosp. Sci. Technol. 2021, 110, 106419. [Google Scholar] [CrossRef]
  22. Erdem, E.; Kontis, K.; Saravanan, S. Penetration characteristics of air, carbon dioxide and helium transverse sonic jets in Mach 5 cross flow. Sensors 2014, 14, 23462–23489. [Google Scholar] [CrossRef]
  23. Zhang, J.M.; Cai, J.; Cui, Y. Effect of nozzle shapes on lateral jets in supersonic cross-flows. In Proceedings of the 47th AIAA Aerospace Sciences Meeting Including the New Horizons Forum and Aerospace Exposition, Orlando, FL, USA, 5–8 January 2009. [Google Scholar]
  24. Kontis, K.; Stollery, J.L. Control effectiveness of a jet-slender body combination at hypersonic speeds. J. Spacecr. Rocket. 1997, 34, 762–768. [Google Scholar]
  25. Min, B.Y.; Lee, J.W.; Byun, Y.H. Numerical investigation of the shock interaction effect on the lateral jet controlled missile. Aerosp. Sci. Technol. 2006, 10, 385–393. [Google Scholar] [CrossRef]
  26. Graham, M.J.; Weinacht, P.; Brandeis, J. Numerical investigation of supersonic jet interaction for finned bodies. J. Spacecr. Rocket. 2002, 39, 376–383. [Google Scholar] [CrossRef]
  27. Liang, W.; Zhang, X.; Zhao, W.L.; Li, X.; Duan, X. Research on the interference of side jet plume to a slenderbody in a subsonic or transonic freestream condition at large angle of attack. Air Space Def. 2022, 5, 38–43. [Google Scholar]
  28. Jia, M.L.; Chen, S.S.; Li, J.P.; Yuan, W.; Lin, B.X.; Gao, Z.H. Uncertainty and sensitivity study on lateral jet interaction for hypersonic missile. J. Spacecr. Rocket. 2024, 61, 458–472. [Google Scholar] [CrossRef]
  29. Gao, Y.; Lei, J.M. Numerical investigation on transient effect of jet interference characteristics of lateral-jet-controlled spinning missile. Aerospace 2022, 9, 430. [Google Scholar] [CrossRef]
  30. Blazek, J. Computational Fluid Dynamics: Principles and Applications, 3rd ed.; Butterworth-Heinemann: Oxford, UK, 2001; pp. 15–25. [Google Scholar]
  31. Tian, S.L.; Xu, K.; Xia, J.; Chen, L. Efficient parallel dynamic overset unstructured grid for flow simulation with moving bodies. AIAA J. 2023, 61, 2135–2166. [Google Scholar]
  32. Li, X.F.; Liu, Y.; Qian, Z.S. Applications of overset grid technique to CFD simulation of high Mach number multi-body interaction/separation flow. Procedia Eng. 2015, 99, 458–476. [Google Scholar] [CrossRef]
  33. Benek, J.; Buning, P.; Steger, J. A 3-D chimera grid embedding technique. In Proceedings of the 7th Computational Physics Conference, Cincinnati, OH, USA, 15–17 July 1985. [Google Scholar]
  34. Snyder, D.; Koutsavdis, E.; Anttonen, J. Transonic store separation using unstructured CFD with dynamic meshing. In Proceedings of the 33rd AIAA Fluid Dynamics Conference and Exhibit, Orlando, FL, USA, 23–26 June 2003. [Google Scholar]
  35. Tian, S.; Fu, J.; Chen, J. A numerical method for multi-body separation with collisions. Aerosp. Sci. Technol. 2021, 109, 106426. [Google Scholar] [CrossRef]
  36. Huang, Z.H. Aerospace Aerodynamics; Astronautic Publishing House: Beijing, China, 1994. [Google Scholar]
Figure 1. Diagram of the numerical simulation for moving boundary problems.
Aerospace 12 00286 g001
Figure 2. WPFS model.
Aerospace 12 00286 g002
Figure 3. Unstructured component grids of the wing and store: (a) wing grid; (b) store grid.
Aerospace 12 00286 g003
Figure 4. Displacement and Euler angles of the store during the separation: (a) displacement of the store; (b) Euler angles of the store.
Aerospace 12 00286 g004
Figure 5. Several locations of the store during the separation.
Aerospace 12 00286 g005
Figure 6. Model used for numerical simulation: (a) side view of the vehicle; (b) top view of the vehicle; (c) nozzle schematic.
Aerospace 12 00286 g006
Figure 7. Component grids: (a) grid of forebody; (b) grid of booster; (c) grid of background.
Aerospace 12 00286 g007
Figure 8. Computational grid: (a) grid before hole-cutting; (b) grid after hole-cutting.
Aerospace 12 00286 g008
Figure 9. PID controller schematic.
Aerospace 12 00286 g009
Figure 10. Cascade PID controller schematic.
Aerospace 12 00286 g010
Figure 11. Time history of the trajectory and aerodynamic characteristic of two stages: (a) axial displacement; (b) normal displacement; (c) pitch angle; (d) axial force; (e) normal force; (f) pitch moment.
Aerospace 12 00286 g011
Figure 12. Mach number contours (left) and pressure contours (right) of the flow field: (a) t = 0.04 s; (b) t = 0.24 s; (c) t = 0.92 s; (d) t = 2.00 s.
Aerospace 12 00286 g012
Figure 13. Pressure contour of the forebody (left) and velocity streamline of the interstage (right): (a) t = 1.12 s; (b) t = 1.16 s; (c) t = 1.28 s.
Aerospace 12 00286 g013
Figure 14. Flow field structure around the lateral jet: (a) Mach number contour; (b) pressure contour; (c) streamline; (d) pressure contour sheet.
Aerospace 12 00286 g014
Figure 15. Limiting streamline and pressure contour of the forebody surface: (a) limiting streamline; (b) pressure contour.
Aerospace 12 00286 g015
Figure 16. Axial displacement (left), normal displacement (middle), and pitch angle (right) of the forebody and booster: (a) forebody; (b) booster.
Aerospace 12 00286 g016
Figure 17. Axial force (left), normal force (middle), and pitching moment (right) of the forebody and booster: (a) forebody; (b) booster.
Aerospace 12 00286 g017
Figure 18. Pressure contour of the forebody (left) and velocity streamline of the interstage (right): (a) t = 1.16 s; (b) t = 1.20 s; (c) t = 1.32 s.
Aerospace 12 00286 g018
Figure 19. History of total pressure of the lateral jet.
Aerospace 12 00286 g019
Figure 20. Axial displacement (left), normal displacement (middle), and pitch angle (right) of the forebody and booster: (a) forebody; (b) booster.
Aerospace 12 00286 g020
Figure 21. Axial force (left), normal force (middle), and pitching moment (right) of the forebody and booster: (a) forebody; (b) booster.
Aerospace 12 00286 g021
Figure 22. Pressure contours on the symmetry plane at α = 0 ° : (a) t = 0.04 s; (b) t = 0.20 s; (c) t = 0.28 s; (d) t = 0.40 s; (e) t = 0.48 s.
Aerospace 12 00286 g022
Figure 23. Pressure contours of the flow field during separation at α = 5.0 ° : (a) t = 0.04 s; (b) t = 0.52 s; (c) t = 0.72 s; (d) t = 0.92 s; (e) t = 1.02 s; (f) t = 1.60 s.
Aerospace 12 00286 g023
Table 1. Hypersonic vehicle size and mass characteristics.
ParametersForebodyBooster
Length (mm)16223482
Center of gravity (mm)(1135, 0, 0)(3452, 0, 0)
Mass (kg)270130
Moment   of   inertia   I x x (kg·m2)10.111.9
Moment   of   inertia   I y y (kg·m2)53.6180.5
Moment   of   inertia   I z z (kg·m2)47.7180.5
Table 2. Parameters of cascade PID.
ParametersOut LoopInner Loop
K p 20500
K i 0.11
K d 0.10.5
Table 3. Boundary conditions adopted for each situation.
Boundary ConditionsFree SeparationOpen-LoopClosed-Loop
FreestreamPressure farfieldPressure farfieldPressure farfield
Surface of aircraftWallWallWall
Plane of symmetrySymmetrySymmetrySymmetry
Jet inlet.NonePressure inletPressure inlet
Table 4. Parameters of the lateral jet.
ParametersLateral Jet
Total pressure (Pa)155,000
Static pressure (Pa)100,000
Total temperature (K)800
Gas constant (J/(kg·K))287
Specific heat ratio1.4
Disclaimer/Publisher’s Note: The statements, opinions and data contained in all publications are solely those of the individual author(s) and contributor(s) and not of MDPI and/or the editor(s). MDPI and/or the editor(s) disclaim responsibility for any injury to people or property resulting from any ideas, methods, instructions or products referred to in the content.