Article

Residual Stress Distribution and Its Effect on Fatigue Crack Path of Laser Powder Bed Fusion Ti6Al4V Alloy

1
State IJR Center of Aerospace Design and Additive Manufacturing, School of Mechanical Engineering, Northwestern Polytechnical University, Xi’an 710072, China
2
School of Aeronautics, Northwestern Polytechnical University, Xi’an 710072, China
*
Author to whom correspondence should be addressed.
Aerospace 2025, 12(2), 103; https://doi.org/10.3390/aerospace12020103
Submission received: 5 December 2024 / Revised: 23 January 2025 / Accepted: 27 January 2025 / Published: 30 January 2025
(This article belongs to the Section Aeronautics)

Abstract

:
Residual stress (RS) in laser powder bed fusion (LPBF) additive manufactured structures can significantly affect mechanical performance, potentially leading to premature failure. The complex distribution of residual stresses, combined with the limitations of full-field measurement techniques, presents a substantial challenge in conducting damage tolerance analyses of aircraft structures. To address these challenges, this study developed a comprehensive simulation framework to analyze the 3D distribution of residual stresses and fatigue crack growth in LPBF parts. The 3D residual stress profiles of as-built samples in 15° and 75° build directions were computed and compared to experimental data. The fatigue crack propagation behavior of the 75° sample, considering 3D residual stress, was predicted, and the effects of residual stress redistribution under cyclic loading were discussed. It shows that the anisotropy of residual stress, influenced by the build direction, can lead to mixed-mode fracture and subsequent crack deflection. Tensile residual stress in the near-surface region and compressive stress in the inner region can cause an inverted elliptical crack front and accelerate fatigue crack growth.

1. Introduction

Laser powder bed fusion (LPBF), one of the most popular additive manufacturing (AM) techniques, has been widely used in the aerospace industry with the advantage of its high precision. It is expected that the AM components can be easily integrated into the structure without any additional post-processing steps subsequent to the printing process. However, residual stress (RS), as one of the inherent characteristics of AM alloys, is acknowledged as a significant obstacle, and its impact on fatigue performance should be carefully assessed in the damage tolerance analysis of aircraft structures.
During LPBF, specific laser beams are used to repeatedly melt the metal powder to form the desired part. The temperature gradient caused by the heat flux and the phase transformation due to solidification result in significant thermal stresses [1,2,3]. Several studies have been done on the relationship between process parameters and residual stress magnitude [4,5,6,7,8], as well as efforts to reduce residual stress by optimizing scanning strategies [9,10]. On one hand, residual stress can be mitigated by controlling the temperature gradient, such as decreasing the scanning speed [9], shortening the scan vector length [11,12], and increasing the layer thickness [13,14]. On the other hand, preheating the base plate [10] and increasing the rescanning cycles [15] are also effective methods by reducing the cooling rate. However, most of these methods degrade the quality of AM parts by introducing defects and a critical laser energy density was introduced to describe this phenomenon by Mostafa [2]. The combined effect of the process parameters on residual stress along different directions was also discussed. It was also found that the laser beam power density was positively correlated with the size of the heat affected zone and the magnitude of residual stress [16,17].
At the microscopic level, the residual stress of the LPBF alloy may be generated due to the local strain and dislocation network [18], whose spatial distribution and its relationship were revealed by Sravya [19]. At the macroscopic level, the distribution of residual stress has attracted much attention, as it may lead to different fracture modes of the AM structure. It has been found that residual stress shows a strong anisotropy, and the main factor responsible for this state is the difference in the temperature gradient along the build direction and the scanning direction [9,10]. It is generally shown that the temperature gradients during LPBF are notably higher in the build direction compared to the scanning direction. As a result, the magnitude of residual stress along the build direction is more than twice as high as that of the stress along the scanning direction [2], and the longitudinal and transverse residual stresses are almost the same in the same deposited layer. However, it was also found that the higher scanning speed may cause a higher thermal gradient along the melt pool, and then lead to higher stress in the scanning direction [9]. Higher compressive residual stress was prone to generating in the wall–baseplate transition zone [20], while tensile residual stress was located at the top of the printed structure [21,22].
The complex distribution of residual stress poses a significant challenge to the structural safety of AM parts, particularly in relation to fatigue crack propagation. The effect of residual stress can be expressed by residual stress intensity factor (SIF) K r e s , which can alter the fatigue crack growth rate (FCGR) by changing the effective load ratio [23]. When the applied load ratio is high enough, the influence of residual stress can be neglected [24]. In AM parts, the anisotropic residual stress state may enlarge the difference of the FCGR in different build directions [25], especially in the as-built sample [26]. Residual stresses in the AM part are in a state of self-equilibrium, which means that both compressive and tensile residual stresses coexist [27]. The compressive residual stress shows a positive effect, while the tensile stress enlarges the FCGR and reduces the fatigue life. In particular, residual stresses can produce a three-dimensional (3D) fatigue crack path twist, which significantly affects the FCGR via a combination of closure and crack deflection effects [28,29,30]. It should be noticed that the redistribution of residual stress under fatigue load also plays a vital role, and this redistribution mainly depends on the distance from the crack tip [31,32]. However, the effect of residual stress on fatigue properties is somewhat unresolved due to the uncertainty in RS measurement and the conflicting experimental results [33].
X-ray diffraction, one of the non-destructive measurements, can easily obtain residual stress distribution [34,35]. Compared to destructive methods, the fatigue performance in the as-built residual stress state can be tested. Some new measurements are being developed to analyze the full-field residual stress of AM parts [36,37]. However, current experimental methods, except the neutron diffraction method, are limited in their ability to non-destructively assess internal residual stress distribution within solid structures. Therefore, the finite element method is required to accurately represent the 3D residual stress distribution and its influence on fatigue crack behavior in AM alloys. The effect of process parameters and geometric parameters on residual stress distribution can be easily investigated [16,38,39]. One of the most efficient methods is the thermo-mechanical model [40], in which the detailed scanning strategies can be considered. The inherent stain can also be used to calculate the RS and the results can be well verified with the experimental data [41,42,43,44,45]. In recent years, some other approaches have also been established, such as the peridynamics [46], the phase-field [47], and the machine learning method [48]. The effect of residual stress on the fatigue crack growth behavior can be simulated by the theory of linear elastic fracture mechanics and numerical simulation methods [49], wherein residual stress was incorporated into the calculation of SIF. However, there are still some limitations in fully understanding fatigue performance under 3D residual stress states, especially in the AM structures due to the complex residual stress distribution.
X-ray diffraction is limited to measuring only surface residual stresses, making it difficult to assess the effect of 3D residual stress state on fatigue crack propagation and AM structural integrity. To address this, a combined approach involving both experimental measurements and numerical simulations provides a comprehensive and effective method. In this study, surface residual stresses of as-built Ti6Al4V samples in 15° and 75° build directions were measured and compared using X-ray diffraction. Thermo-mechanical simulations were then used to analyze the 3D residual stress distribution and its anisotropic characteristics, with the results validated against the measured surface stress values. Subsequently, residual stress data were incorporated into a finite element model to predict the fatigue crack propagation behavior using linear elastic fracture mechanics. The fracture surface, crack path, and K r e s distribution along the crack length were analyzed and compared with experimental observations. Additionally, the effect of residual stress relaxation caused by fatigue crack propagation was discussed.

2. Materials and Methods

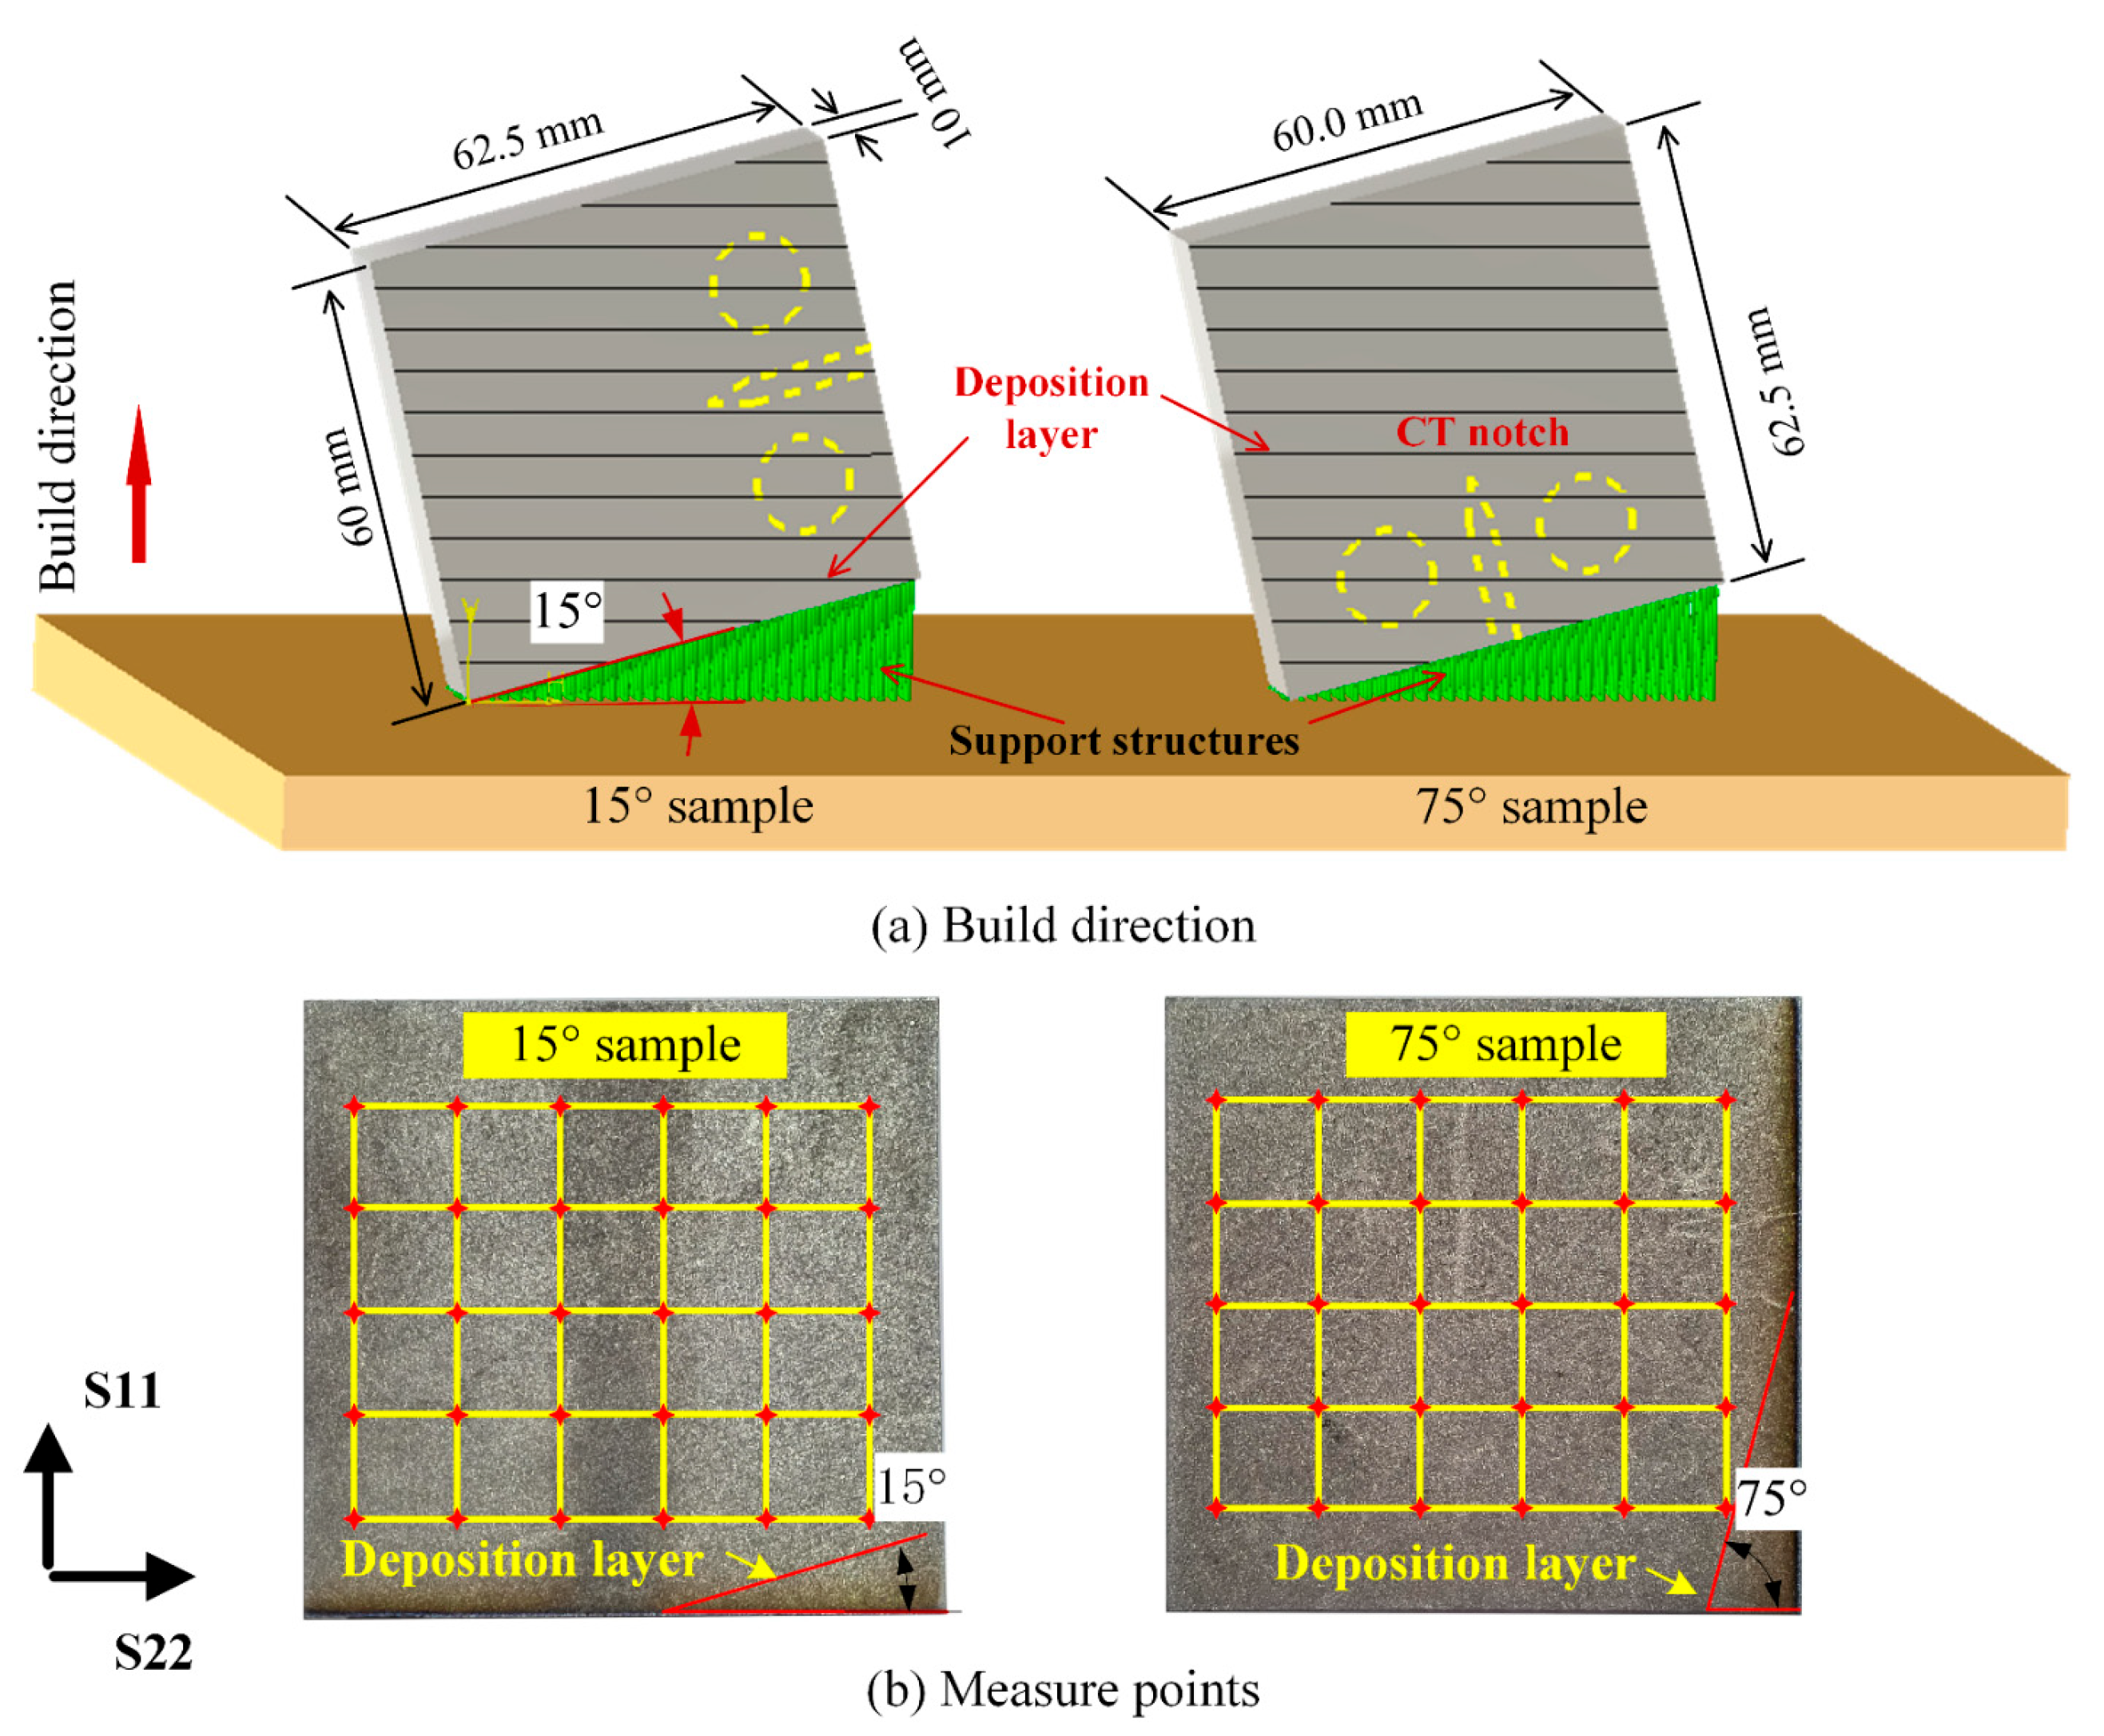
2.1. Sample Design and Residual Stress Test Setup

The LPBF samples were manufactured using a BLT-S310 machine (Bright Laser Technologies Co., Ltd., Xi’an, China). The particle size distribution of the Ti6Al4V powder ranged from 20 to 53 μm, and the chemical composition is presented in Table 1. The cross-directional scanning strategy on successive layers was adopted, and the processing parameters are listed in Table 2. All samples were cooled to room temperature under Argon gas conditions without any further treatment.
Rectangular blocks (62.5 × 60 × 10 mm³) were fabricated in the 15° and 75° build directions, considering the angle between the crack growth direction and the scanning direction, as illustrated in Figure 1a. A compact tensile (CT) specimen was machined from the 75° sample according to the ASTM E647-11 standard [50]. The fatigue crack growth behavior was tested under room conditions using an Instron 8872 servo-hydraulic testing machine (Instron corporation, Norwood, MA, US). The sample was subjected to a sinusoidal load with a frequency of 20 Hz and a constant amplitude. The maximum applied load was 5.19 kN, with a stress ratio (R) of 0.1.
The surface residual stresses were quantified by the X-ray diffraction (XRD) method, with 30 points measured on each sample, as shown in Figure 1b. The Xstress Robot machine was employed, operating at a voltage of 30 kV and an electrical current of 6.7 mA. The measurements were taken at different tilt angles (Ψ= −45°, −30°, 0°, 30°, 45°) with a diffraction angle range of 130° to 145°. The collection time at each measured point was 30 s. Residual stresses along the loading direction (S11) and the crack direction (S22) at each point were measured and repeated three times.

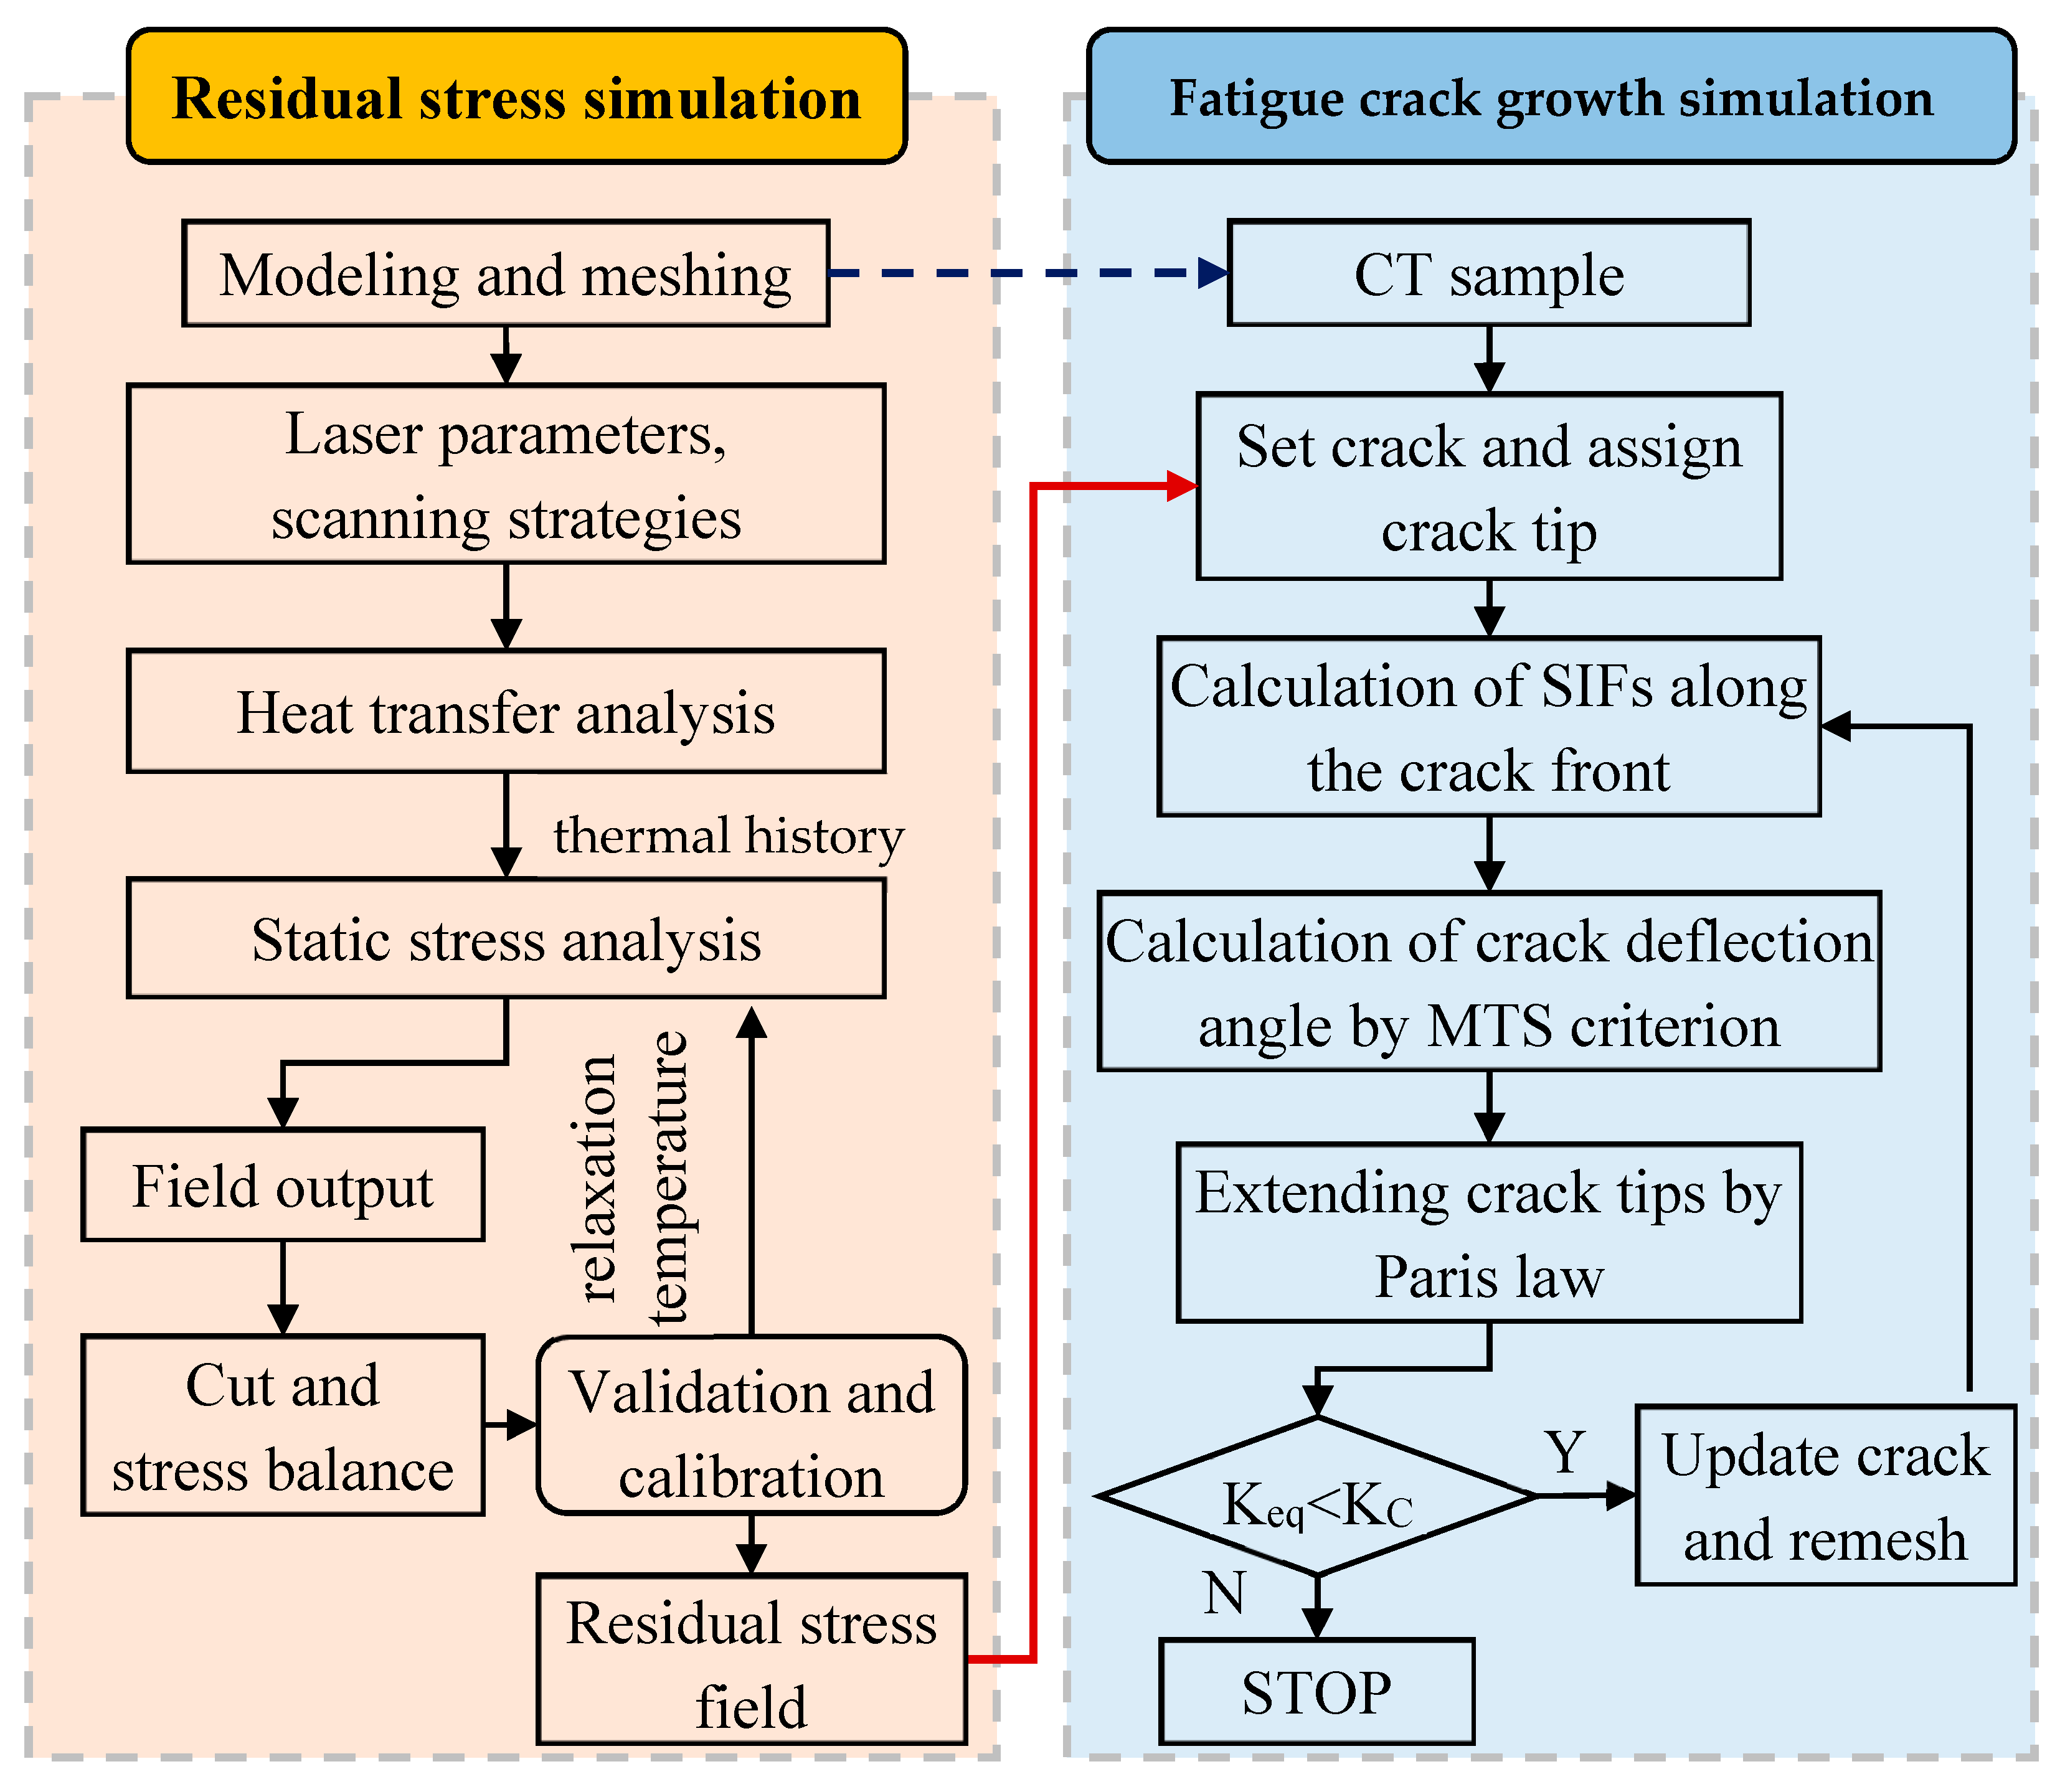
2.2. Numerical Analysis Methodology

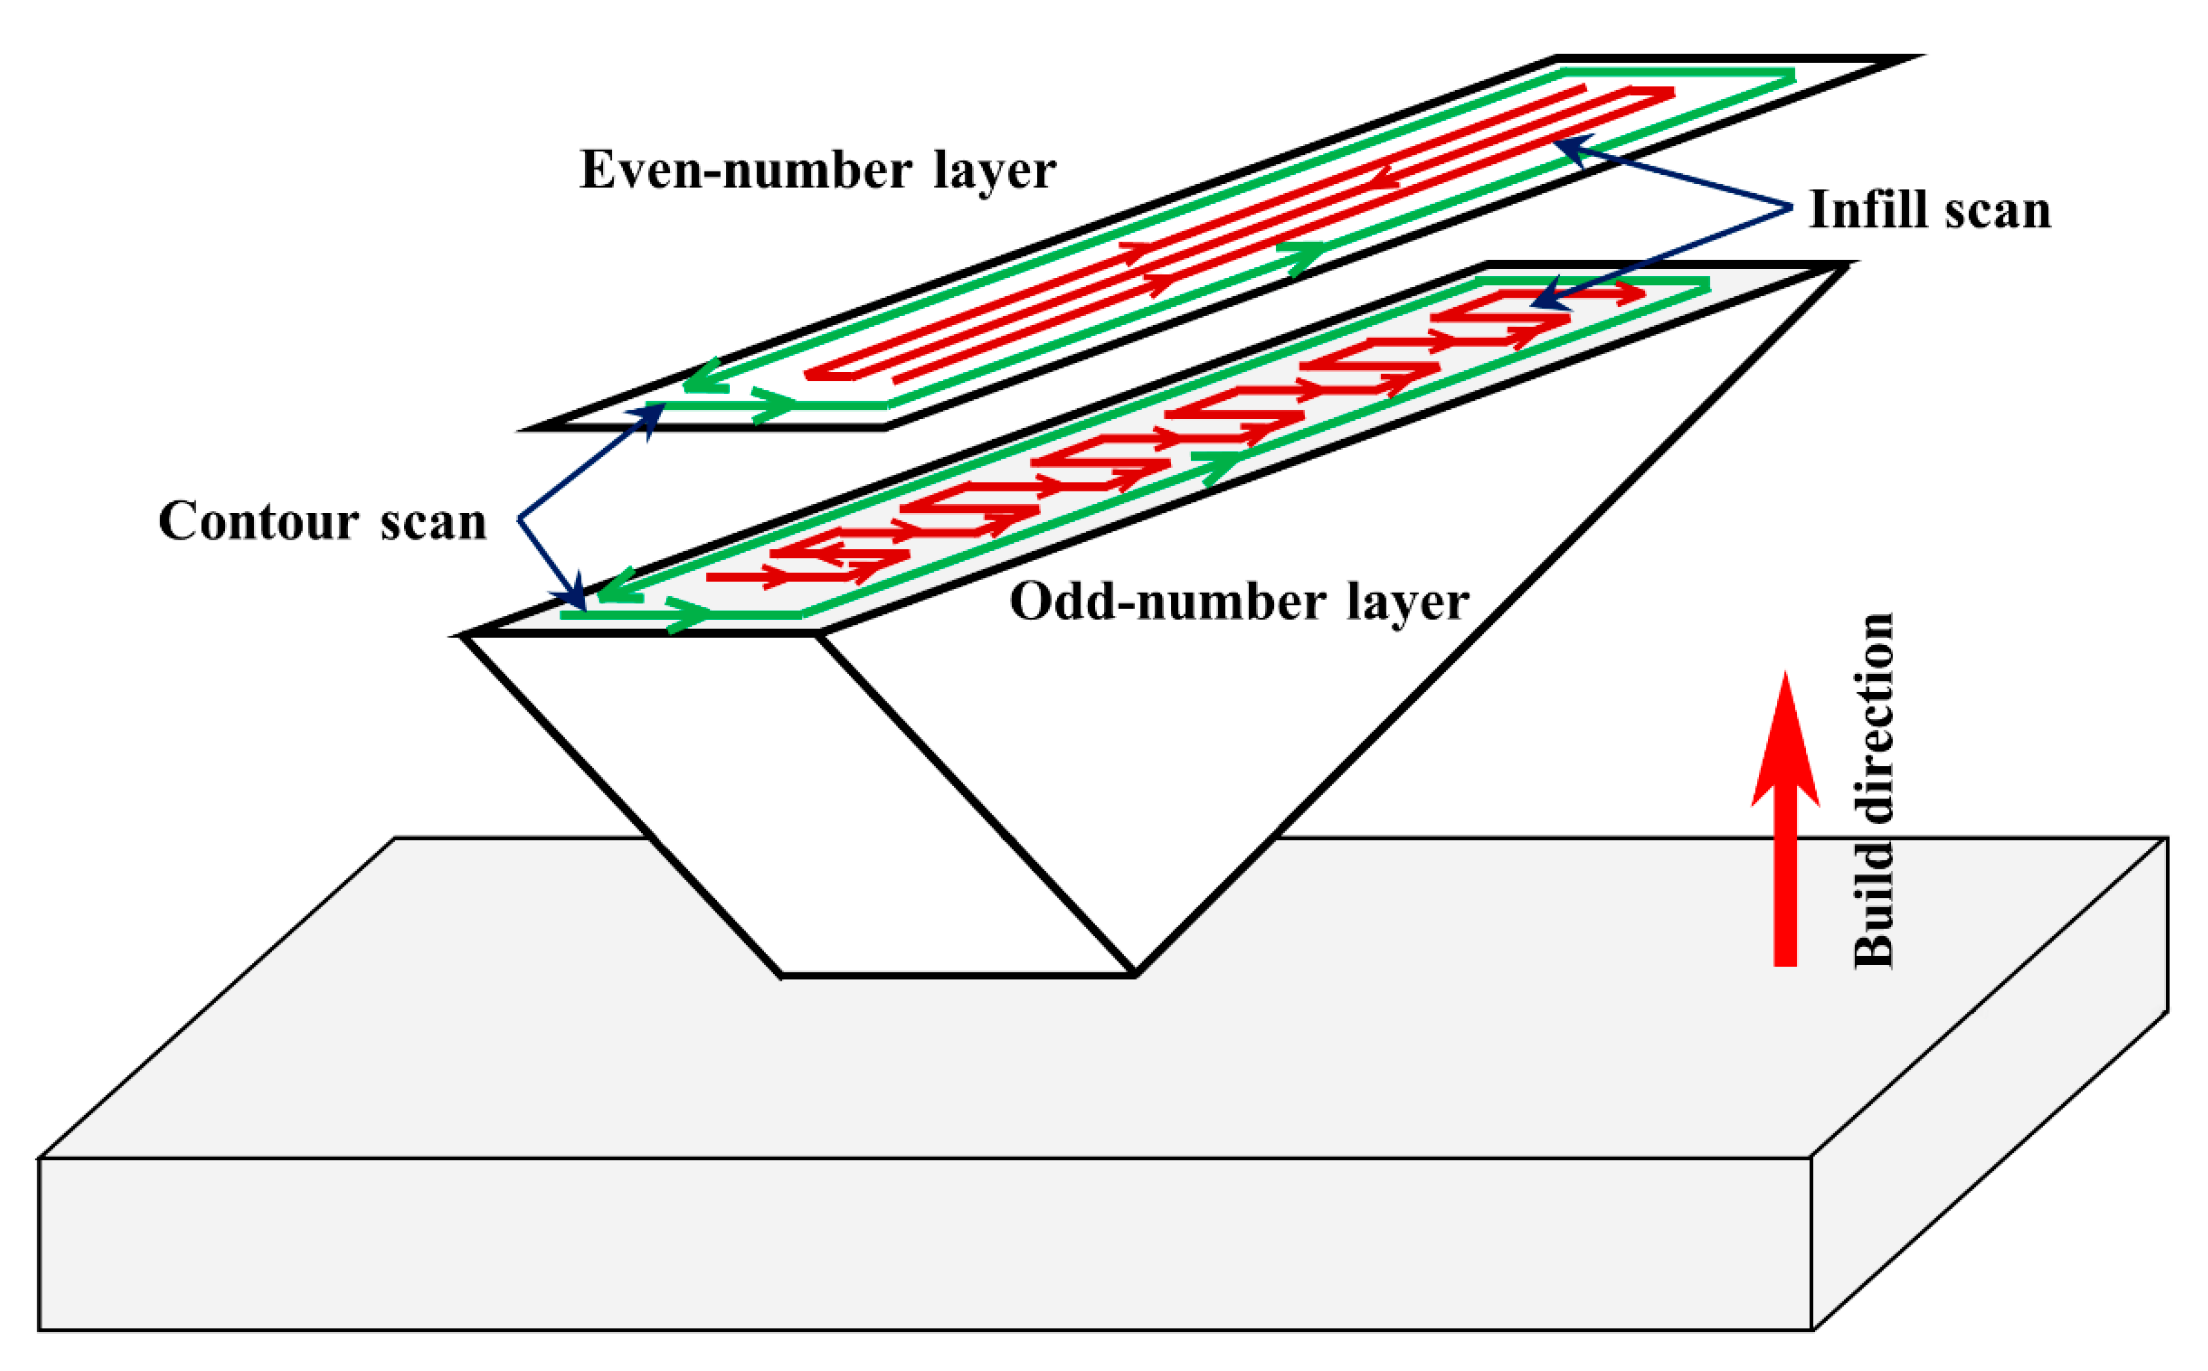
2.2.1. Residual Stress Simulation

A thermo-mechanical simulation was adopted in this study, and there are two main steps: Firstly, a transient heat transfer analysis was conducted to obtain the temperature distribution during the process. Secondly, a static stress analysis was performed to determine the residual stress field. The toolpath-mesh intersection module and progressive element activation in Abaqus/Standard were used to simulate the recoater and progressive material deposition.
In the heat transfer analysis step, a concentrated moving heat flux was used to simulate the laser beam. The processing parameters matched those outlined in Table 2. The laser trajectory was simulated with a 0.1 mm hatch space, and the detailed scanning strategy is illustrated in Figure 2. Each layer was constructed with an infill scan followed by a contour scan. For the odd-numbered layer, the infill scans were aligned with the sample depth, whereas those for the even-numbered layers have a much longer scanning length. Once each layer was finished, the thermal results were recorded.
In the static stress analysis, a relaxation temperature was assigned to define the threshold above which thermal stresses were ignored. During the analysis, the temperature in the printed parts, obtained in the heat transfer analysis step, was applied as the predefined fields to the active elements. The stress redistribution, which occurs after removing the sample from the substrate plate and machining it into a CT sample, was simulated in the subsequent steps.
A tie constraint was used to model the connection between the bottom surface of the block sample and the top surface of the substrate plate. The bottom of the substrate plate was fixed in all degrees of freedom, and the initial temperature for the substrate plate was set to 80 °C. Eight-node linear brick diffusive heat transfer elements (DC3D8) were used in the heat transfer analysis step, while eight-node brick elements with reduced integration (C3D8R) were used in the static stress analysis step. The element size of the block sample was 0.6 mm. The substrate plate was more coarsely meshed. The dimensions of the substrate plate are 300 mm in length, 300 mm in width, and 20 mm in height. The detailed element and node numbers are shown in Figure 3.

2.2.2. Fatigue Crack Propagation Simulation

The M-integral was employed in conjunction with linear elastic fracture mechanics to determine the SIFs for the three different modes of fracture caused by the 3D complex residual stress distribution in the AM alloy.
The J-integral was given by [51,52]
J = V σ i j u i , 1 W δ 1 j q , j d V
where q is a function that equals one at the crack tip and zero at the boundary of the integration domain. δ is the Kronecker delta, σ i j are the Cauchy stress components, u i are the displacement components, and the partial derivative · , i = · / X i denotes the spatial derivative of · with respect to X i of the local coordinate system. W is the strain energy density given by Equation (2).
W = 1 2 δ i j ε i j
where ε i j are the strain components. In 3D, the J-integral is evaluated within a cylindrical domain centered on a portion of the crack front, and its relationship to the energy release rate G can be expressed as follows:
G = 1 v 2 E K I 2 + 1 v 2 E K I I 2 + 1 + v E K I I I 2 = J A q
where Aq is the area of the virtual crack extension in the plane ahead of the crack. K I , K I I , and K I I I are the SIF for mode I, II, and III, respectively.
According to the principal of superposition for elasticity, the SIFs, the stress, the strain, and the displacement field can be defined as follows:
K I = K I 1 + K I 2 ,   K I I = K I I 1 + K I I 2 ,   K I I I = K I I I 1 + K I I I 2
σ i j = σ i j 1 + σ i j 2 ,   ε i j = ε i j 1 + ε i j 2 ,   u i = u i 1 + u i 2
Substituting Equations (4) and (5) into Equation (3), G can be expressed in the following terms:
G = G 1 + G 2 + M 1 , 2
where M 1 , 2 is the interaction integral. The superscripts (1) and (2) correspond to the field variables in terms of the actual field and the auxiliary field, respectively. In this paper, the actual field is a consequence of both the applied load and residual stress field.
M 1 , 2 = 1 v 2 E K I 1 K I 2 + K I I 1 K I I 2 + 1 + v E K I I I 1 K I I I 2 = V σ i j 1 u i , 1 2 + σ i j 2 u i , 1 1 W 1 , 2 δ 1 j q , j d V / A q
The interaction strain energy density is given by
W 1 , 2 = σ i j 1 ε i j 2 = σ i j 2 ε i j 1
When setting one of the values of K I , K I I , and K I I I to 1 while the other two are set to zero, K I 1 , K I I 1 , and K I I I 1 can be obtained, respectively.
K I 1 = E 1 v 2 M 1 , 2 ,   K I I 1 = E 1 v 2 M 1 , 2 ,   K I I I 1 = E 1 + v M 1 , 2
The superposition approach was used, whereby the total SIF ( K I , K I I , and K I I I ) encompasses the SIF resulting from the applied stress ( K I l o a d ) and residual stress ( K I r e s , K I I r e s , and K I I I r e s ).
The maximum tangential stress (MTS) criterion was used to calculate the fatigue crack propagation. The circumferential stress σ θ θ in polar coordinates around the crack tip can be expressed as an equation involving SIFs as follows:
σ θ θ = 1 2 π r cos θ 2 K I cos 2 θ 2 3 2 K I I sin θ
The stress intensity factor values at multiple nodes along the crack front were computed when reaching the peak load, and then these values were substituted into Equation (11) to calculate the crack deflection angles Δ θ c by setting the shear stress τ to zero. The crack increments were then updated based on the corresponding deflection angles. The updated crack front nodes were smoothed, and the crack surface was updated. This process was repeated iteratively until the termination condition was satisfied.
τ = 1 2 2 π r cos θ c 2 K I sin θ c + K I I ( 3 cos θ c 1 ) = 0
Δ θ c = 2 tan 1 1 1 + 8 K I I / K I 2 4 K I I / K I

2.2.3. Material Properties and Flowchart

The mechanical properties of LPBF Ti6Al4V at room condition are obtained from our previous work [53,54], as shown in Table 3. The temperature-dependent material properties were derived from the references [45,55], as shown in Table 4.
The flowchart for the fatigue crack propagation analysis in the residual stress field is shown in Figure 4. Once residual stresses in the CT sample were self-equilibrated in the residual stress simulation module, this state was introduced as the predefined field in the fatigue crack growth simulation module.
An initial crack of 2 mm was introduced at the notch root. The Paris equation was selected as the fatigue crack growth model, with the crack extension increasement set to 0.2 mm. The stress ratio was set to 0.1, and the maximum load was 5.19 kN.
d a / d N = C Δ K n  
where C is 2.9 × 10⁻¹¹ and n is 2.8. These parameters were tested on the sample without residual stress but manufactured using the same processing parameters [54].

3. Results and Discussion

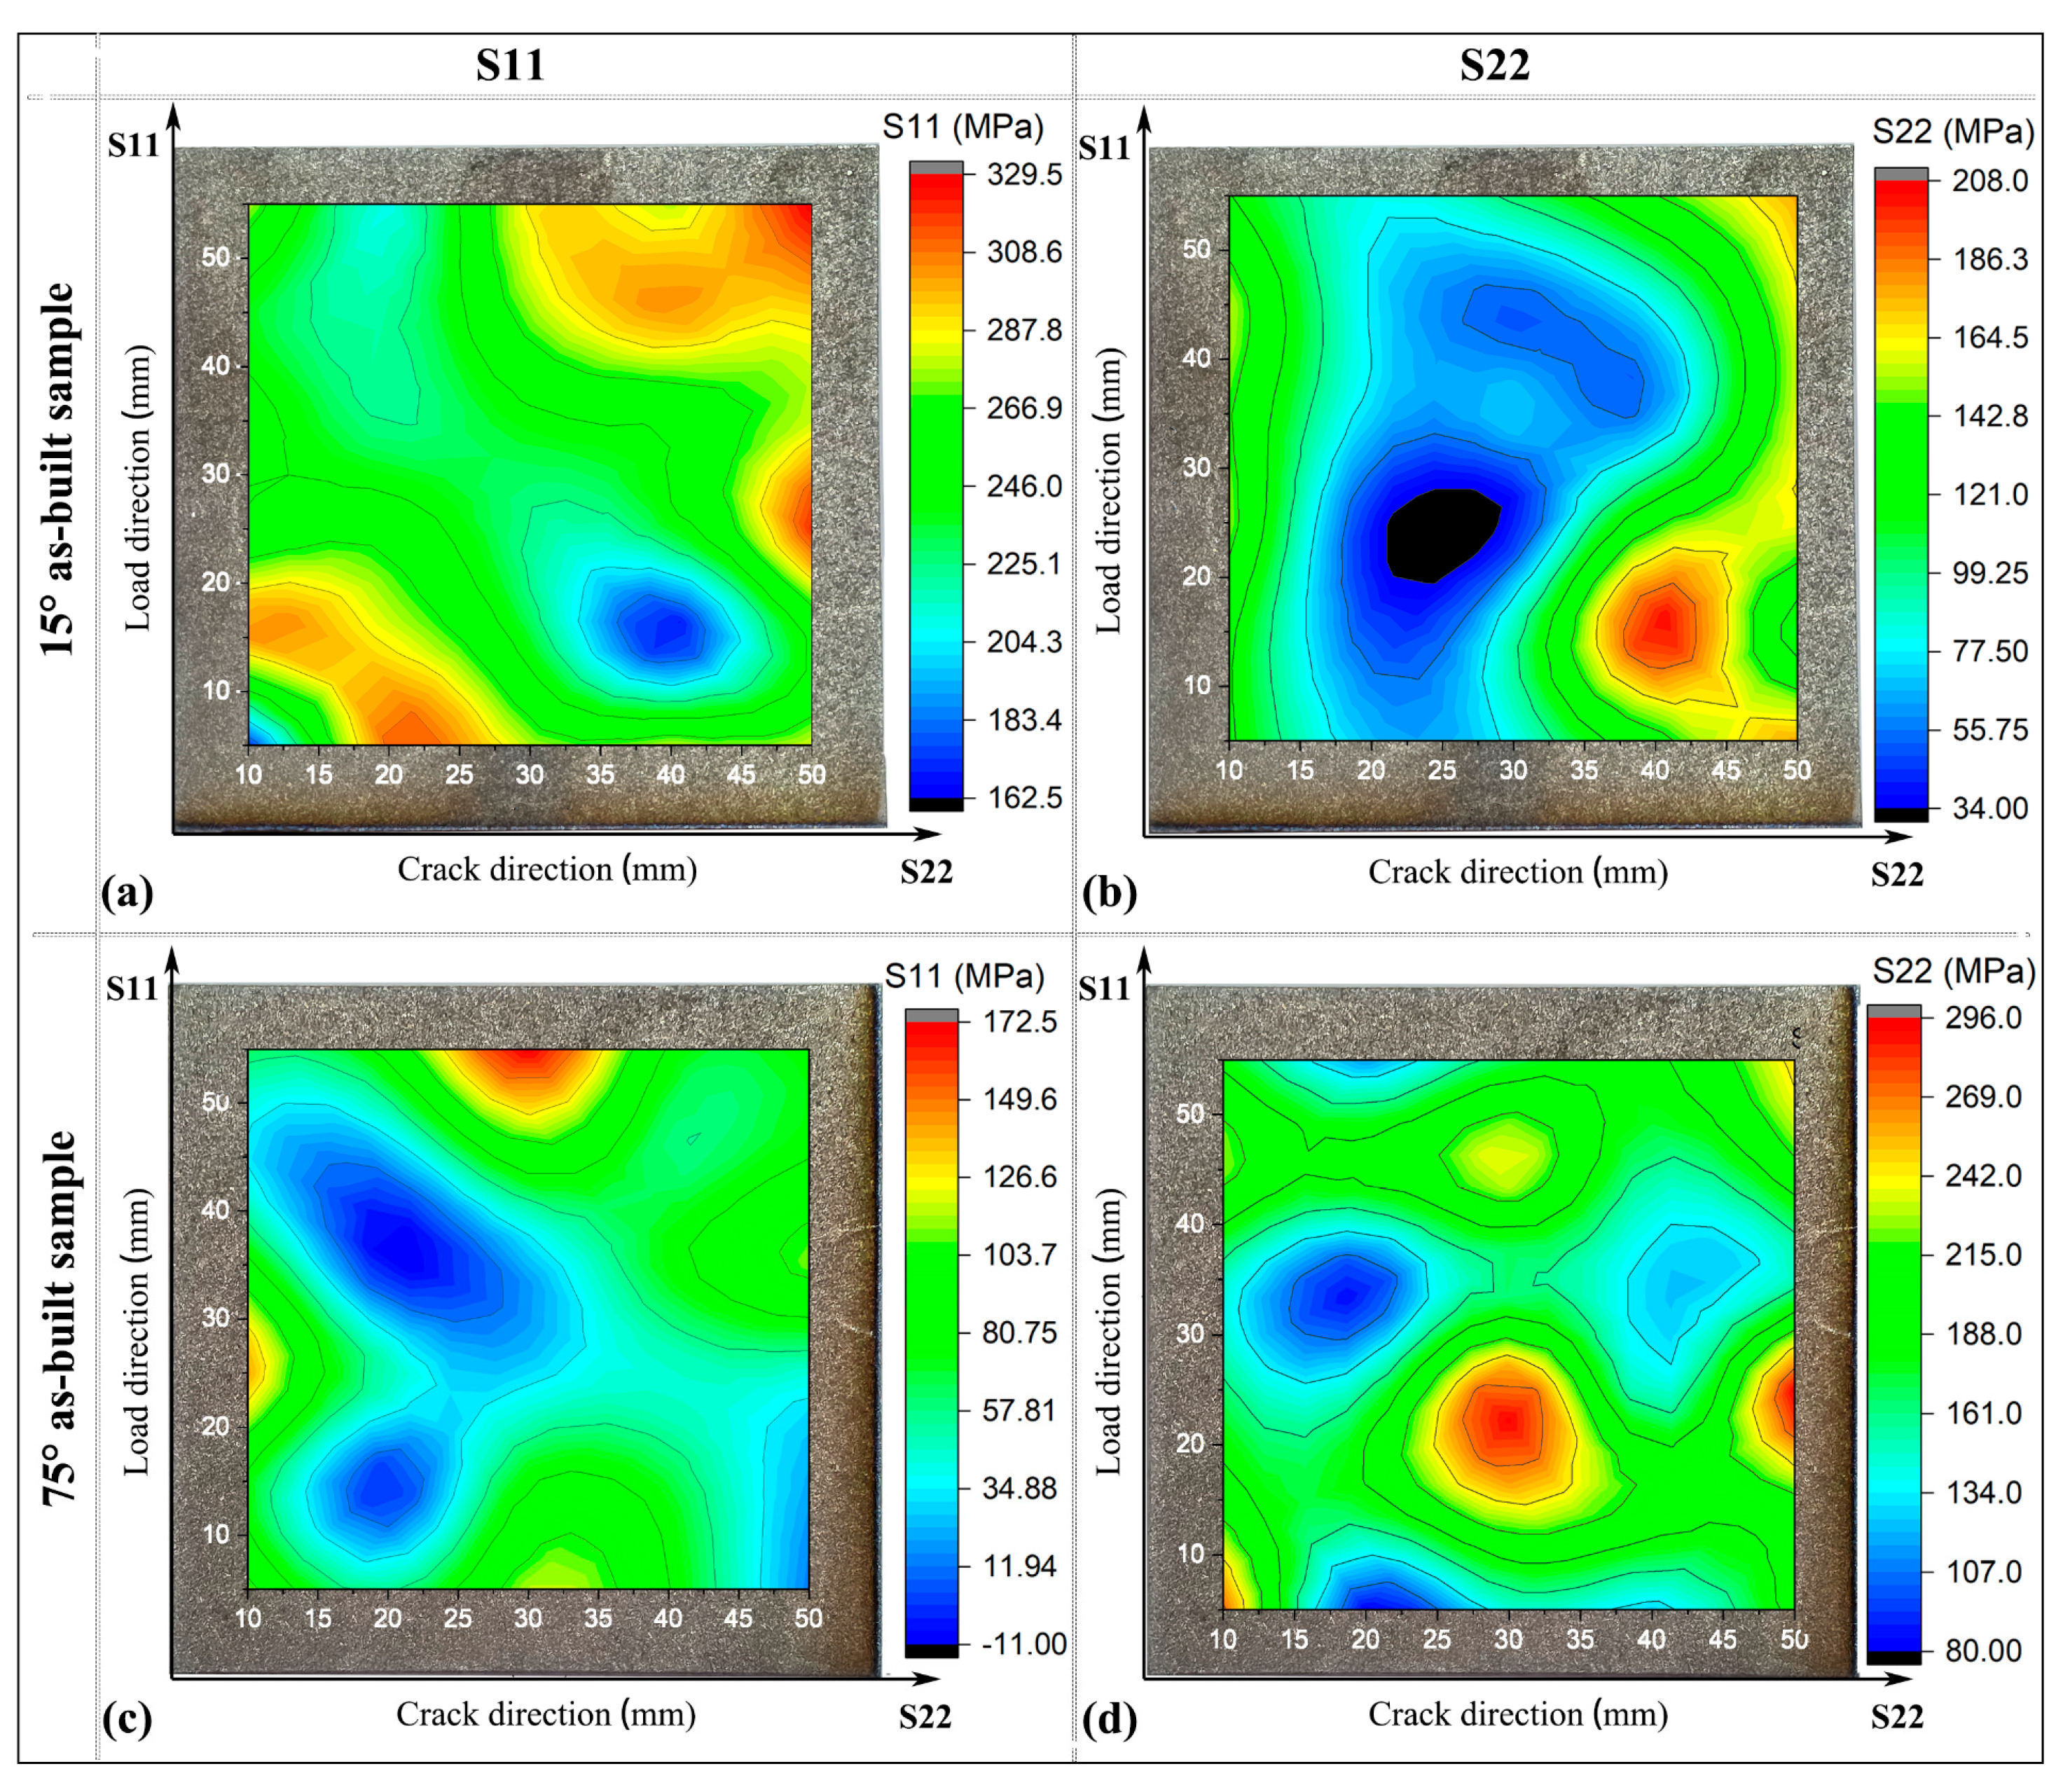
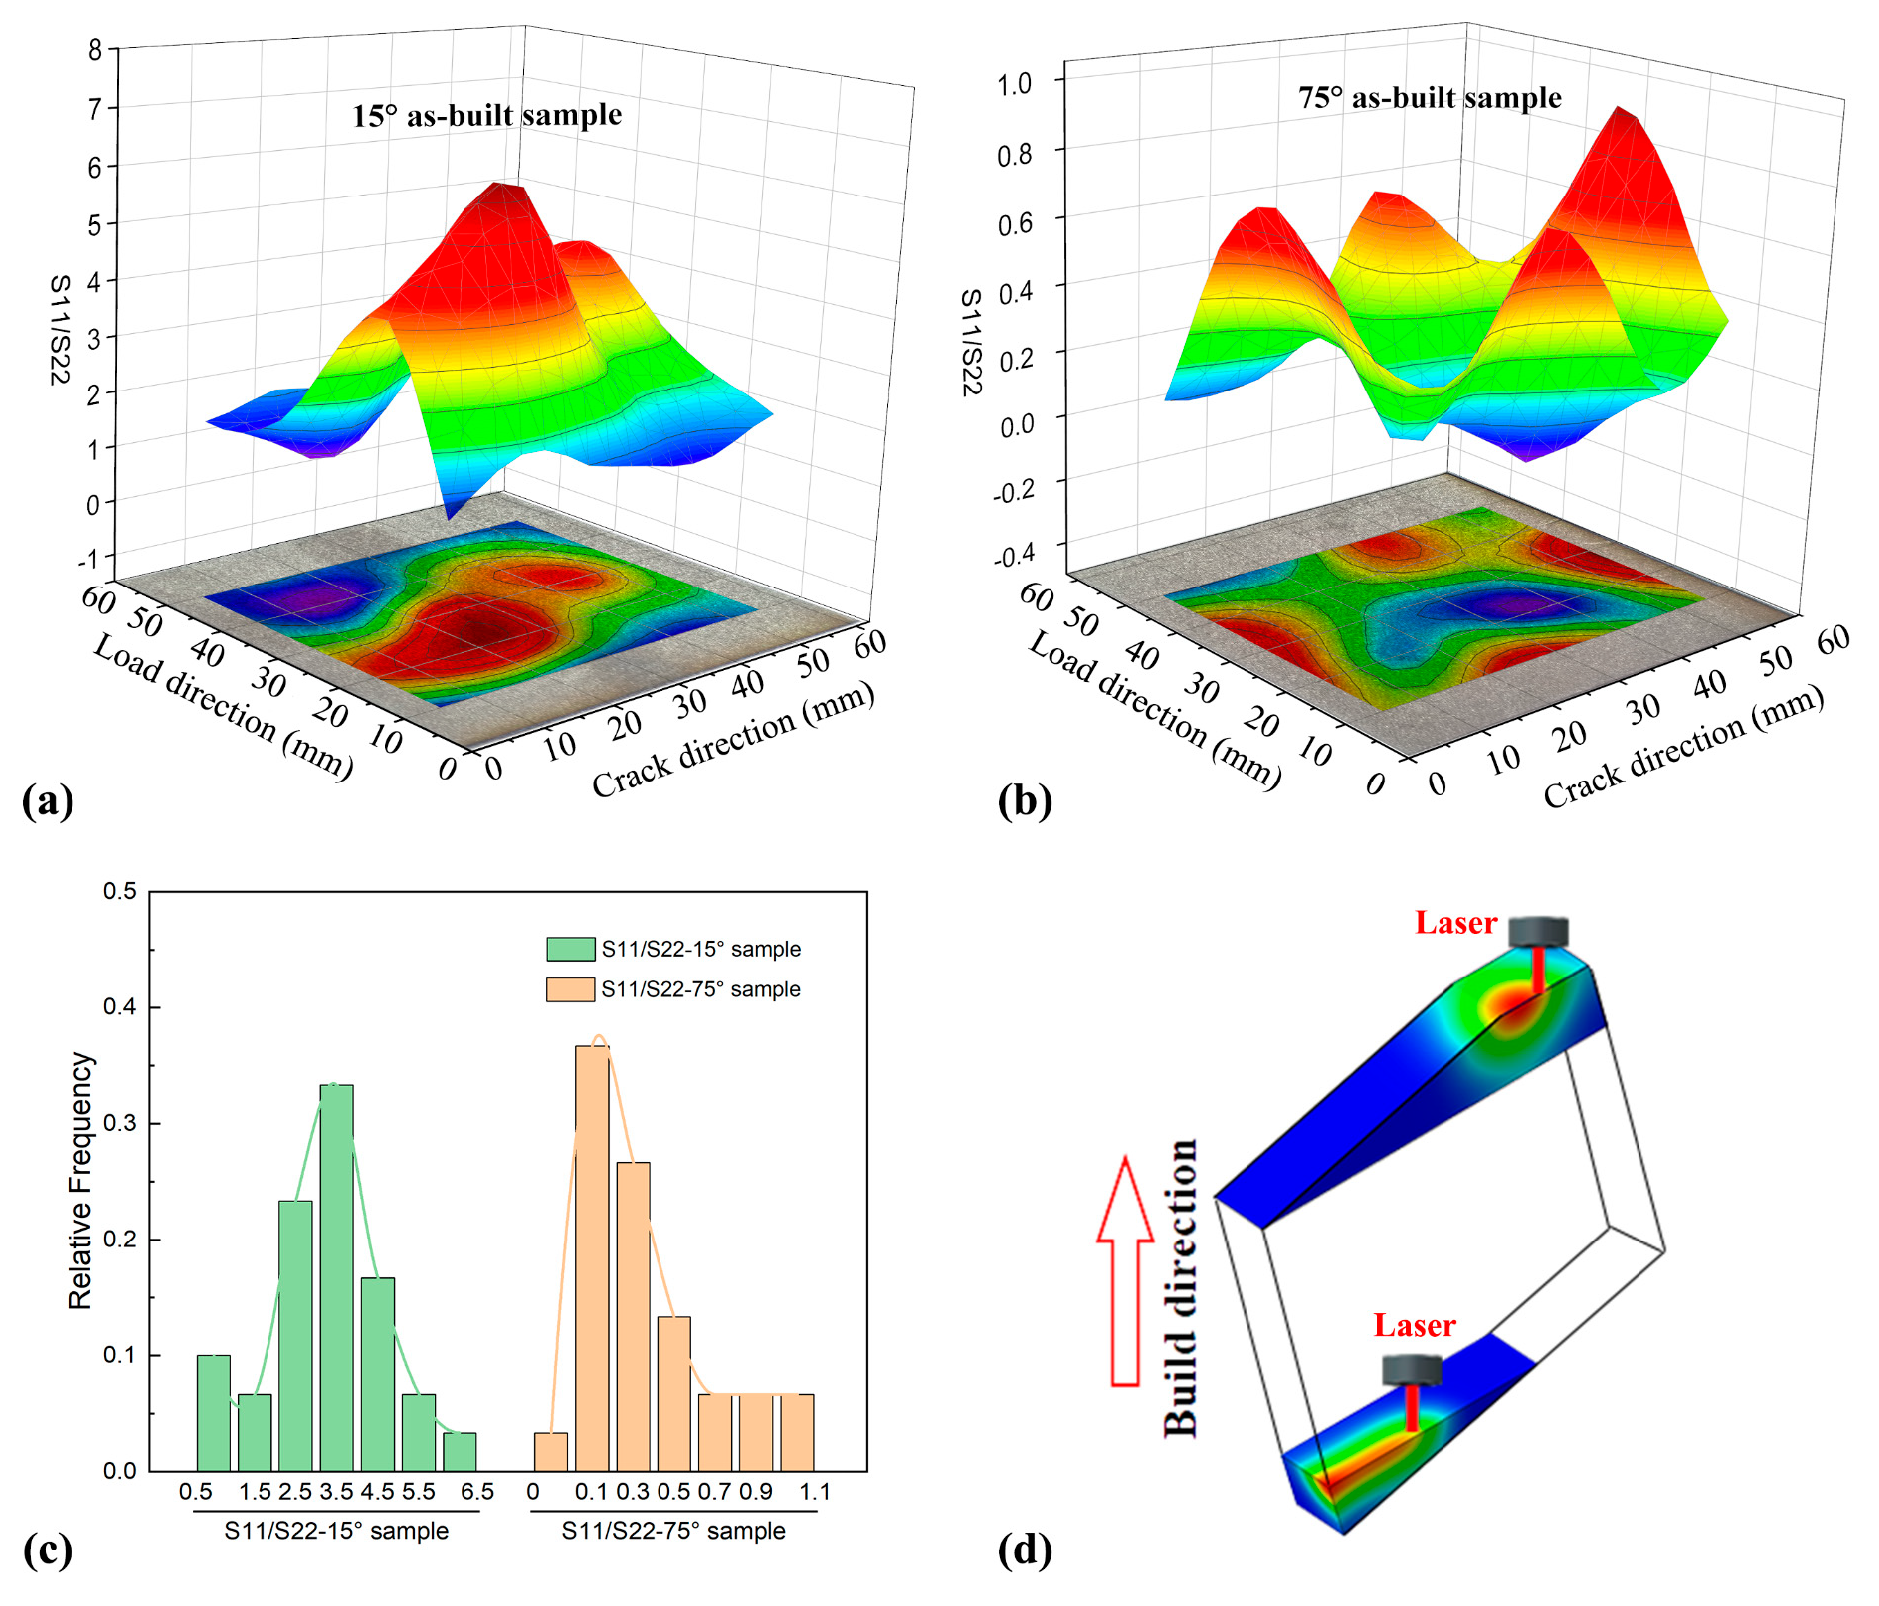
3.1. Surface Residual Stress Distribution

The distribution of surface residual stresses, as measured at 30 points, is shown in Figure 5. Contour plots were generated to illustrate the S11 and S22 values, and a linear interpolation was applied between the adjacent points. The temperature gradient varied with the increasing number of deposition layers and changes in the section contour, leading to a non-uniform residual stress distribution in the AM alloy samples. Tensile surface residual stresses were observed both in the 15° sample and the 75° sample, with the highest values located near the substrate region. The maximum residual stress values in these two samples reached approximately 300 MPa.
In the 15° sample, S11 was significantly higher than S22, with lower S22 values found in the central region, as shown in Figure 5a,b. This phenomenon was primarily attributable to the higher heat transfer near the free surface, which results in greater strain. The thermal expansion was constrained by the underlying material, resulting in larger stress values near the lateral edges.
In the 75° sample, S22 was higher than S11, displaying a similar trend to that observed in the 15° sample, as shown in Figure 5c,d. The anisotropic distribution of residual stresses, characterized by higher magnitudes along the build direction compared to the scanning direction, arises due to a pronounced temperature gradient along the build direction relative to that across the deposition layer. Furthermore, the specific dimensions of the deposition layer, particularly its width and length, exert a significant influence on the anisotropy distribution of residual stress.
The anisotropic residual stresses were effectively characterized using the S11/S22 stress ratio, with the distributions for the 15° and 75° samples shown in Figure 6. During printing, regions processed at the start and end of the build exhibited a shorter laser scanning path, which reduced stress discrepancies between the build and scanning directions. Consequently, these regions exhibited an S11/S22 ratio close to one, as shown in Figure 6a,b. In contrast, the central regions, characterized by longer laser scanning paths and pronounced temperature gradients, displayed significant variations in the stress ratio, as illustrated in Figure 6c. For the 15° sample, the stress ratio predominantly ranged from 0.2 to 0.6, while in the 75° sample, it ranged from 1.5 to 3.5. These anisotropic stress differences arise from the varying cross-sectional dimensions of the samples, which influence temperature gradients and support forces during printing, as depicted in Figure 6d.

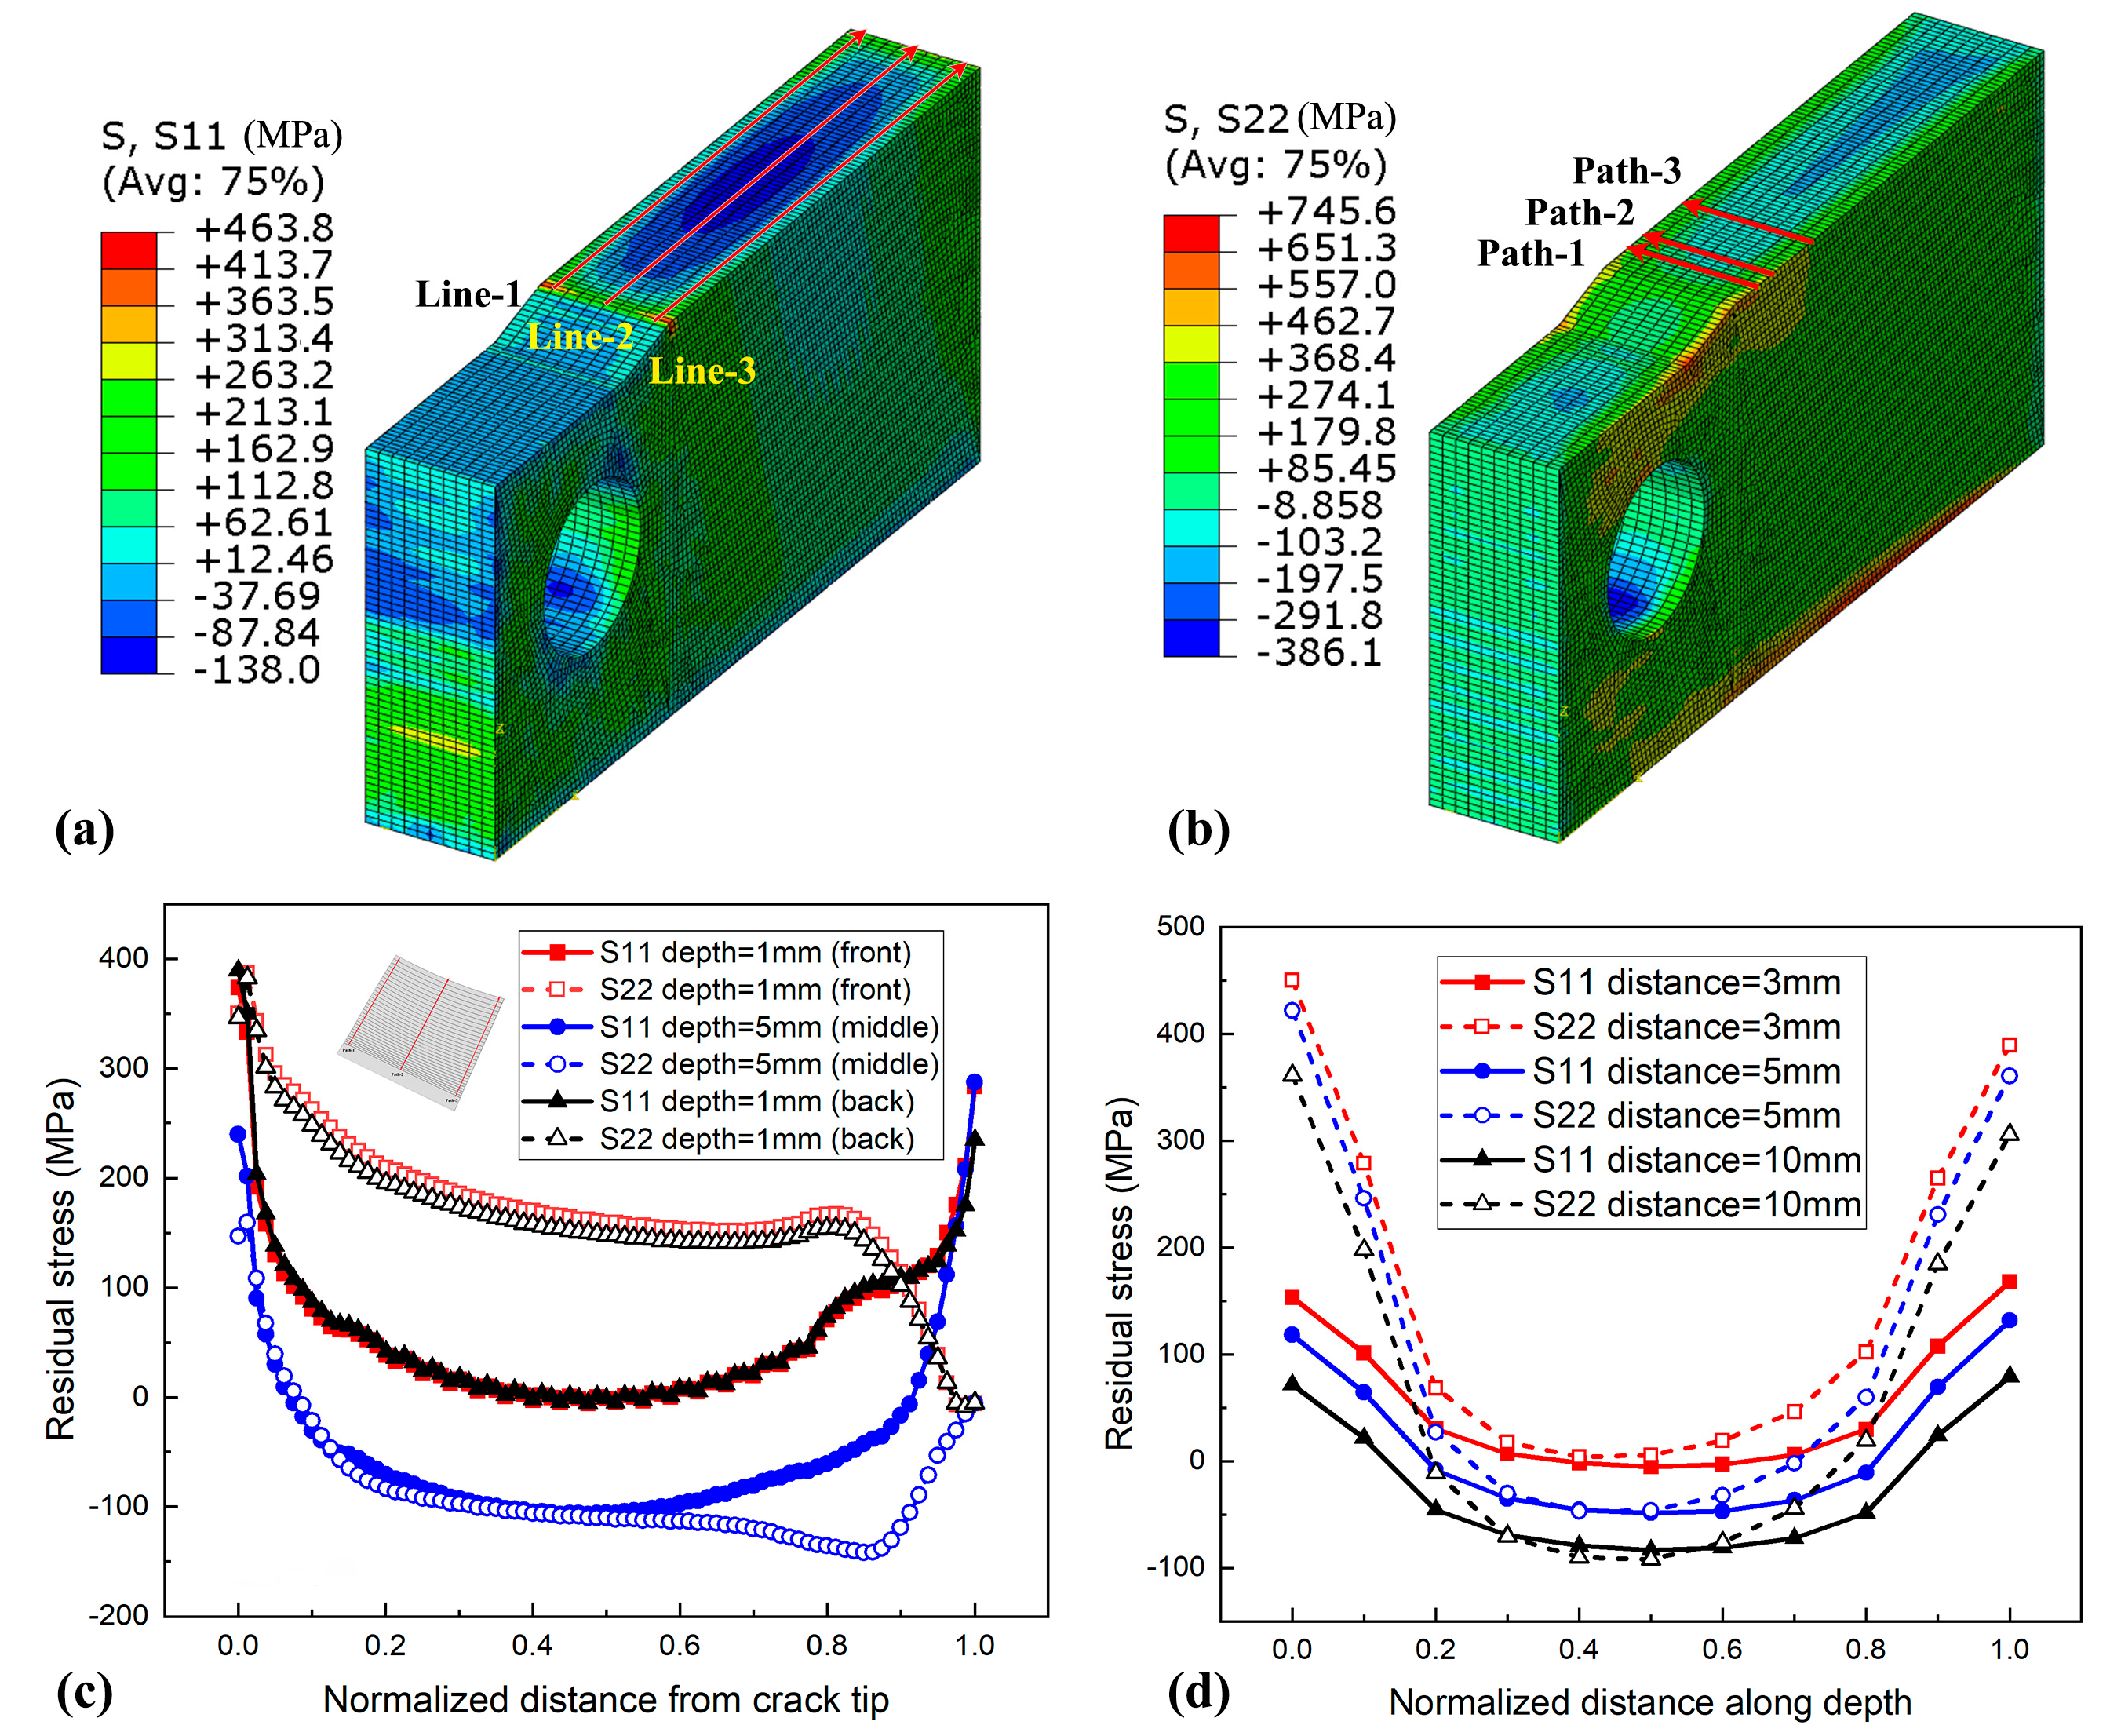
3.2. Three-Dimensional Residual Stress and Validation

When the real processing parameters were incorporated into the 3D residual stress analysis model, the von Mises stress distributions of the 15° sample and the 75° sample were evaluated at three stages: after sample fabrication, after removal from the substrate plate, and after machining into a CT specimen, as shown in Figure 7. It can be observed that residual stress in the vicinity of the substrate region was higher compared to other regions. Furthermore, residual stresses along the sides of the deposition layers exceeded those in the central region. When the block sample was removed from the substrate plate, a significant redistribution of residual stresses occurred near the substrate region. This redistribution manifests as compressive stresses at the lower free surface transitioning into tensile stresses, thereby achieving a new stress equilibrium within the whole sample, as shown in Figure 7b,e. In addition, a similar stress redistribution was also observed following the introduction of a CT notch, as shown in Figure 7c,f.
Two distinct paths on the central region of the specimen surface were selected to validate the accuracy of the numerical model. The first path was oriented along the crack propagation direction, while the second path was aligned with the loading direction. Comparative analysis was conducted between residual stress differences obtained from numerical simulations and those from experimental measurements, as shown in Figure 8. The results indicate that the numerical model can reasonably replicate the experimental findings, particularly in terms of residual stress distribution trends and the anisotropic state.
In the as-built sample, the near-surface region exhibited tensile residual stress, whereas the overall stress within the free structure is self-equilibrium, resulting in compressive residual stress within the inner region, as shown in Figure 9. The residual stress distribution tendency along the crack propagation direction was analyzed, and two paths located 1 mm from the free surface (Line-1 and Line-3) and one path at the center of the depth were chosen and compared, as shown in Figure 9a,c. The RS distribution along two near-surface paths showed a similar anisotropic tendency, exhibiting relatively minor differences in tensile value. In contrast, the RS anisotropy in the center path disappeared. Both the S11 and the S22 initially decreased and subsequently increased along the path, transitioning from tensile to compressive stress with values around −100 MPa. The stress near the free surface region and the notch region were tensile RS.
Residual stress distribution along the depth direction was analyzed in three different paths, located 3 mm, 5 mm, and 10 mm from the notch (Path-1, Path-2, and Path-3), as illustrated in Figure 9b. Their distributions are shown in Figure 9d. Similar distributions were observed in three paths, with a high tensile stress gradient around the near-surface region and steady compressive stress in the center region. Similarly, the anisotropy of RS occurred around the near-surface region and disappeared in the center region. It was revealed that tensile stress is predominantly present within approximately 2 mm depth from the free surface in this study, while the remaining central region is characterized by compressive stress.

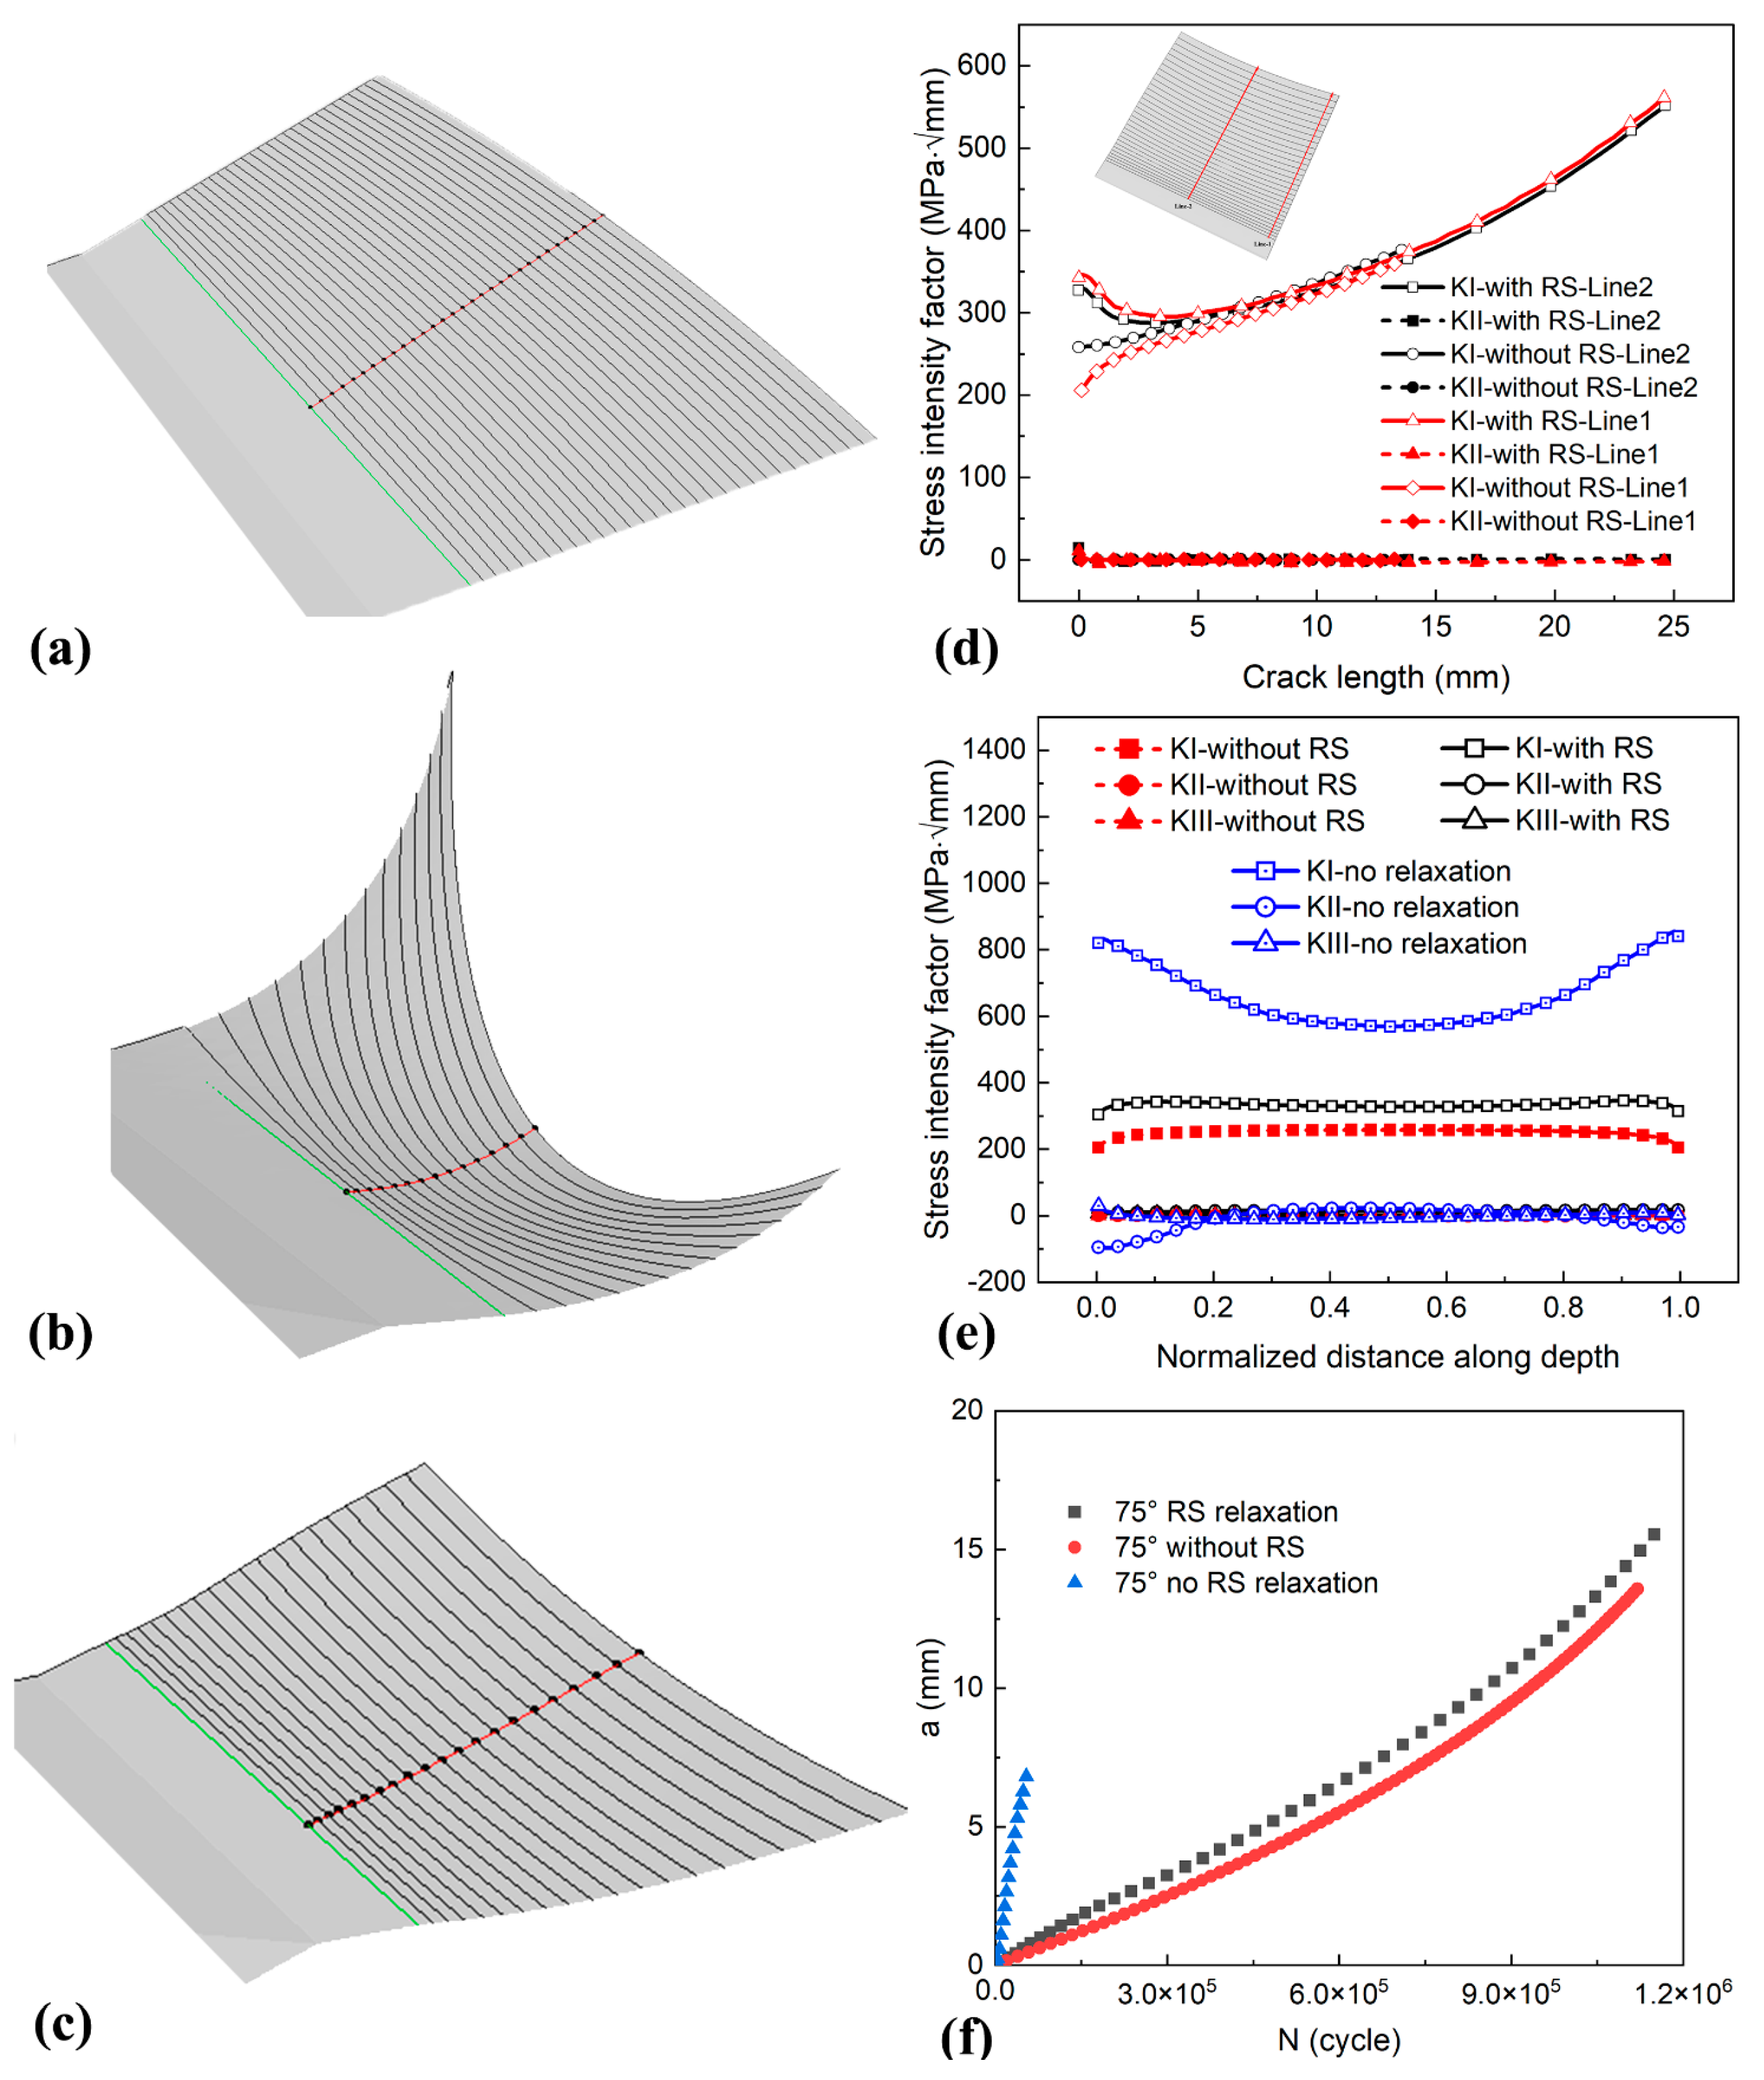
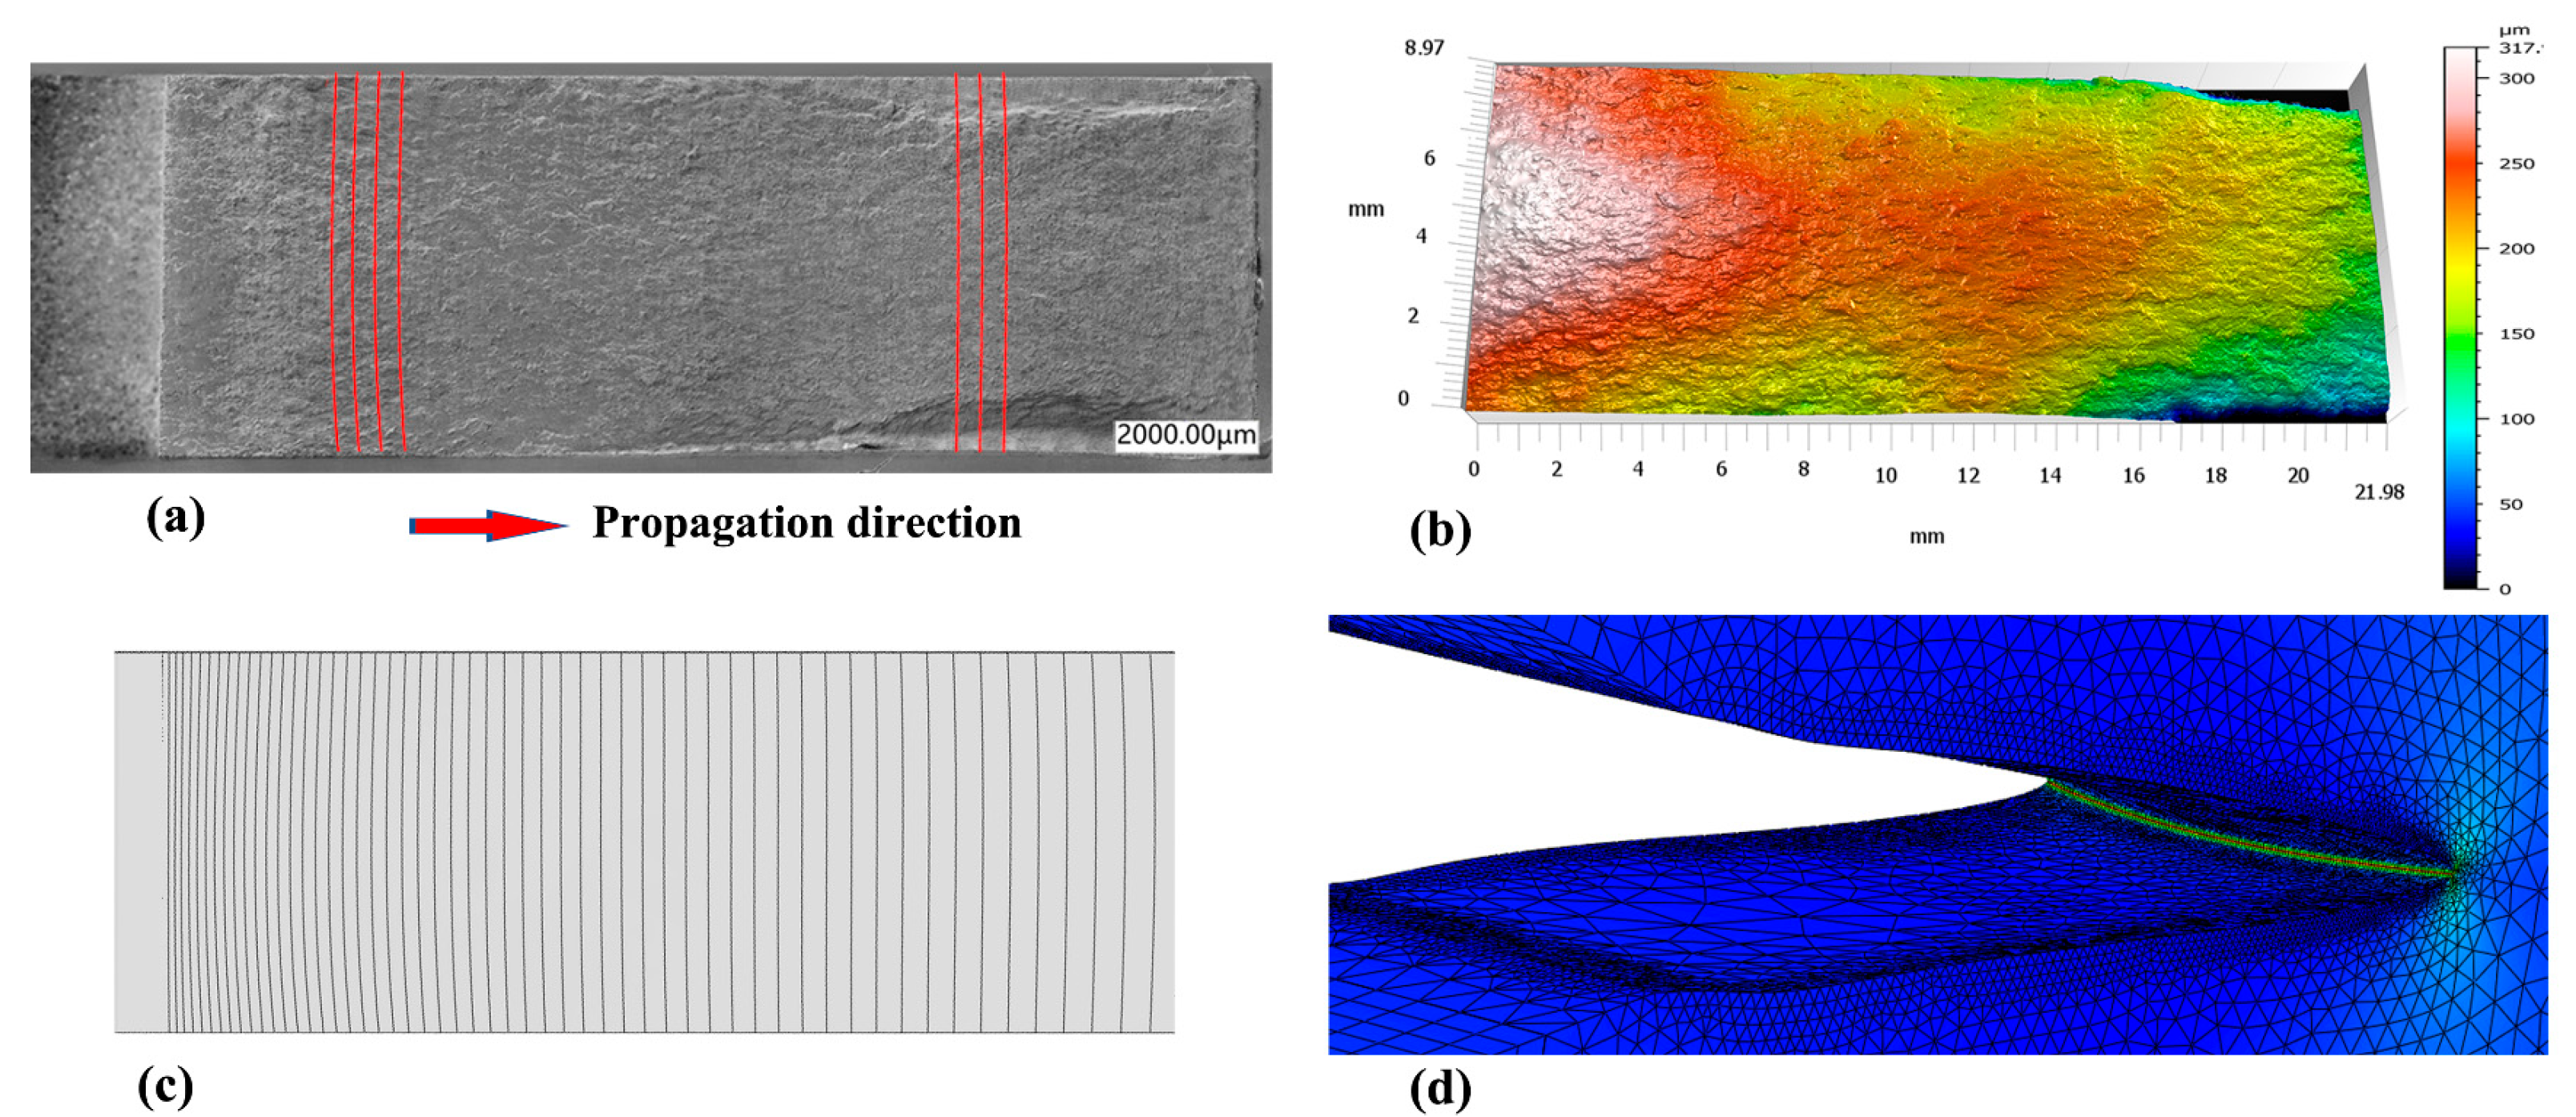
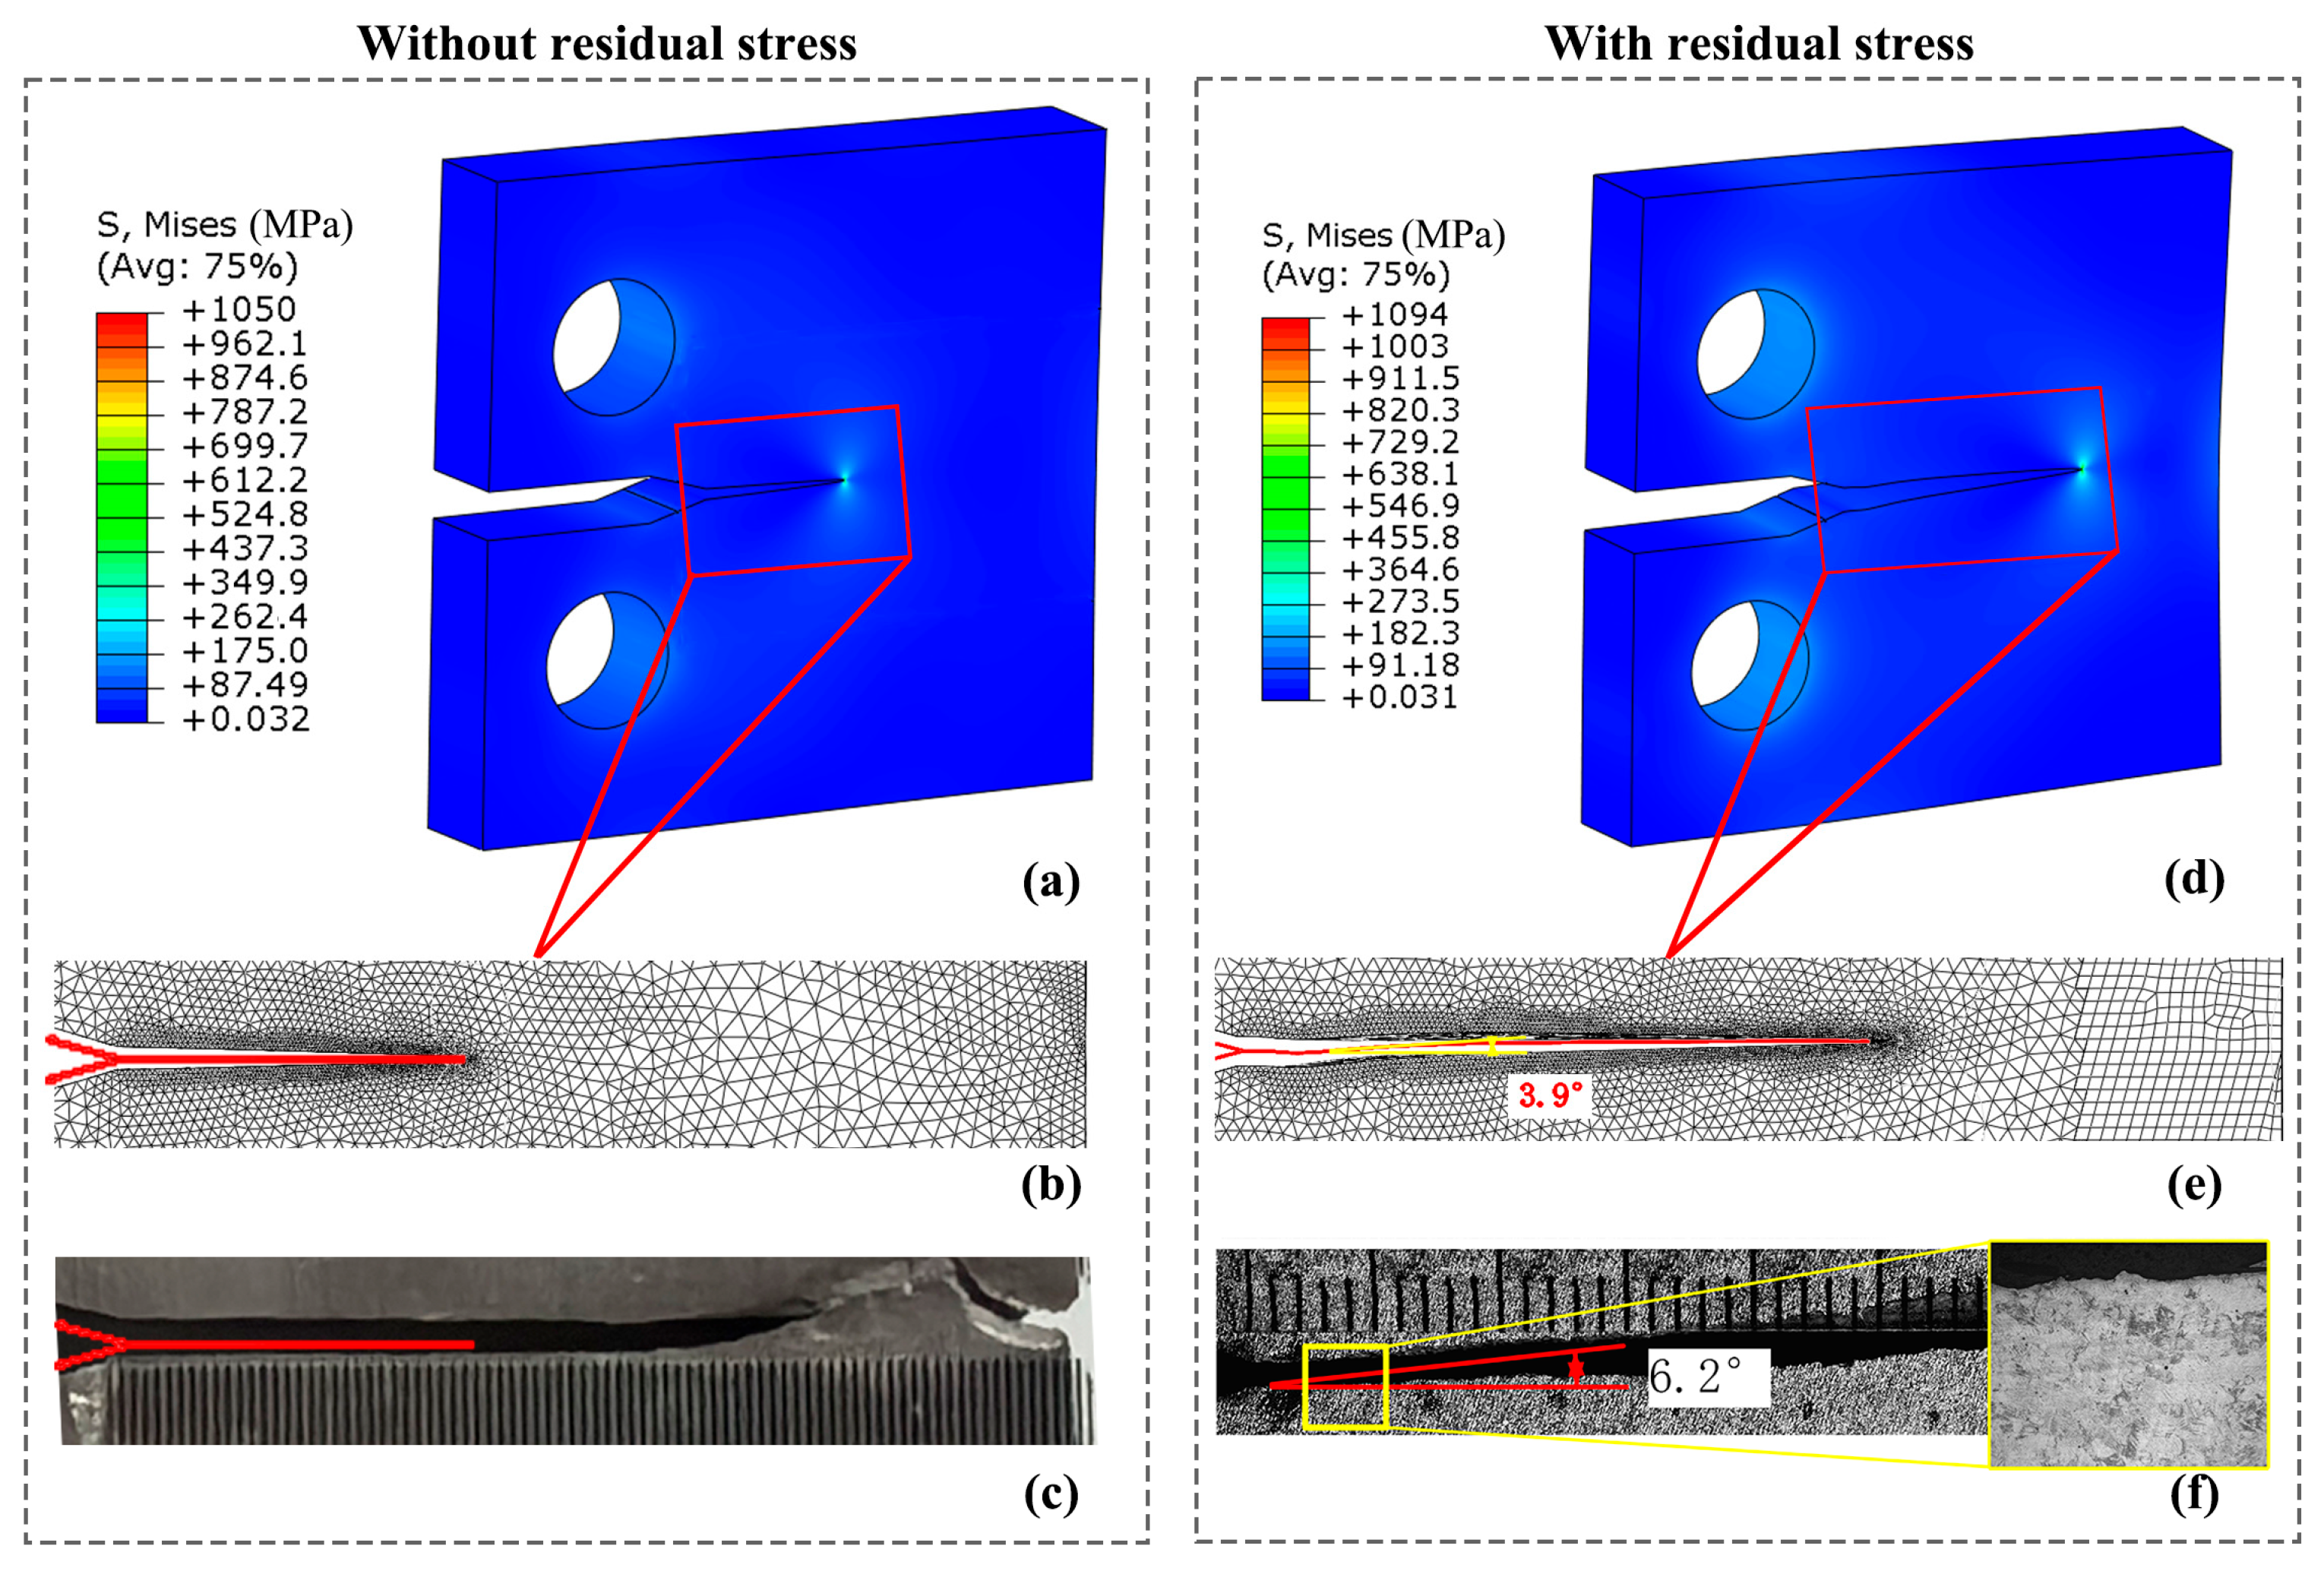
3.3. Fatigue Crack Propagation Behaviour

The anisotropic residual stress state, especially in the AM metal structure with a large thickness, has a significant influence on the fatigue fracture behavior. The altered stress state can induce a transition in the fracture mode, resulting in mode II or mode III cracks. The coexistence of tensile and compressive residual stresses along the depth will cause a more complex fracture mode. Consequently, it is necessary to compare the fatigue crack propagation behavior both in the presence and absence of residual stresses, and the results are shown in Figure 10.
When residual stresses were not considered, the CT sample exhibited a pure mode I fracture under fatigue load and a flat fracture surface, with a higher FCGR in the central region compared to the near-surface region, can be observed, as shown in Figure 10a. The crack front showed an elliptical shape.
When residual stresses were incorporated into the fatigue crack analysis model as the initial stress field, a different fracture surface and crack front were observed. Without considering stress relaxation caused by fatigue crack propagation, the RS was directly superimposed to calculate the SIF. Under this condition, higher tensile residual stresses near the free surface caused pronounced crack deflection, while the deflection in the central area remained minimal, as shown in Figure 10b. However, this approach became unreliable after a few fatigue cycles and exhibited significant deviations from the experimental results.
To solve the premature failure caused by higher stress, the effects of stress relaxation were considered in the model. After each increment of crack growth, the nodes at the crack location were disconnected and a new stress redistribution and self-balancing state was obtained. The recalculated stress field was then reintroduced into the crack growth model as the new initial stress state. In this case, the fatigue fracture surface exhibited a smaller deflection angle. Additionally, the FCGR at the crack front near the free surface region was higher than that in the center region, as shown in Figure 10c.
The SIF distributions along the crack length and along the depth at the initial crack front for these three models are shown in Figure 10d and Figure 10e, respectively. The SIF in the notch region was significantly higher than the specimen without residual stress. As the fatigue cycles increased and cracks propagated, the RS gradually released, and its influence on fatigue cracking gradually decreased and disappeared. Although residual stresses slightly reduced the fatigue crack growth life, this effect was most prominent in the early stage, as shown by the a–N curves in Figure 10f.
The fatigue fracture surfaces of the 75° sample, as captured in both experimental data and numerical simulation, are compared in Figure 11. In the early stage of crack propagation, the surface tensile residual stress accelerated the FCGR, while the compressive residual stress in the center enhanced the fatigue resistance, leading to an inverted elliptical crack front shape. As the crack propagated, the RS gradually released, and its impact on fatigue crack growth vanished. Consequently, the crack front in the 75° sample gradually changed into an elliptical shape, as shown in Figure 11a,c. The fracture surface morphology, captured using a microscope, is shown in Figure 11b. The observed fracture surface exhibited a profile that was higher in the middle and lower on both sides, and this feature was also reproduced in the numerical model, as depicted in Figure 11d.
Figure 12 compared the fatigue crack paths in 75° CT samples with and without residual stress. In the absence of residual stress, the CT specimen exhibited a pure mode I crack, characterized by a straight crack path with no deflection, as shown in Figure 12a–c. When RS was introduced, the crack exhibited significant deflection at a larger angle during the initial stage of fatigue crack growth. As the crack length increased, a gradual reduction in the deflection angle was observed, shown in Figure 12d–f. The predicted fatigue crack deflection angle is 3.9°, which is lower than the experimental value of 6.2°. As observed in the metallographic image in Figure 12f, the microstructure also influences fatigue crack deflection. The deflection angle was increased because the crack was prone to propagating along the columnar grains. Similar findings were reported in reference [56,57].

4. Conclusions and Outlook

In this study, the 15° sample and the 75° sample in the as-built condition were additively manufactured by laser powder bed fusion. The surface residual stress was measured and analyzed using X-ray diffraction. The 3D residual stress distribution of the LPBF Ti6Al4V alloy was modeled through thermo-mechanical simulations and validated with experimental data. Additionally, the effect of residual stress on fatigue crack propagation behavior was investigated. The main conclusions are as follows:
(1)
The anisotropy of the residual stress state can be found both in the 15° and the 75°as-built samples. In the 15° sample, the ratio between S11 and S22 predominantly ranged from 0.2 to 0.6, whereas in the 75° sample, this range increased significantly to 1.5 to 3.5.
(2)
The thermo-mechanical simulation was successfully used to simulate the 3D residual stress trends in its distribution and anisotropy. Tensile stress is predominantly present within approximately 2 mm depth from the free surface in this study, while compressive stresses dominated the central region.
(3)
Residual stress induced mixed fracture modes in the LPBF Ti6Al4V alloy under fatigue loading, resulting in crack deflection and the inverted elliptical crack front. With the increase in the fatigue cycles and crack length, residual stress was gradually released, and its influence on the fatigue crack decreased and disappeared.
The method established in this study only considers the effect of residual stresses on fatigue and does not account for the influence of microstructure and defects. Future research should develop models that incorporate the coupled effects of these factors.

Author Contributions

Conceptualization, W.S. and Y.M.; validation, P.L. and W.Z.; formal analysis, W.S. and P.L.; investigation, Y.M. and P.L.; data curation, W.S.; writing—original draft preparation, W.S.; writing—review and editing, Y.M.; visualization, W.S.; supervision, Y.M. and W.Z.; project administration, W.Z.; funding acquisition, W.S., Y.M., and W.Z. All authors have read and agreed to the published version of the manuscript.

Funding

This study was financially supported by the National Natural Science Foundation of China under Grant No. 12302103, No. 12032018, and No. U2341238.

Data Availability Statement

The raw data supporting the conclusions of this article will be made available by the authors on request.

Conflicts of Interest

The authors declare no conflicts of interest. The funders had no role in the design of the study; in the collection, analyses, or interpretation of data; in the writing of the manuscript; or in the decision to publish the results.

References

  1. Li, C.; Liu, Z.Y.; Fang, X.Y.; Guo, Y.B. Residual Stress in Metal Additive Manufacturing. Procedia CIRP 2018, 71, 348–353. [Google Scholar] [CrossRef]
  2. Yakout, M.; Elbestawi, M.A.; Veldhuis, S.C. A study of the relationship between thermal expansion and residual stresses in selective laser melting of Ti-6Al-4V. J. Manuf. Process. 2020, 52, 181–192. [Google Scholar] [CrossRef]
  3. Mercelis, P.; Kruth, J.P. Residual stresses in selective laser sintering and selective laser melting. Rapid Prototyp. J. 2006, 12, 254–265. [Google Scholar] [CrossRef]
  4. Zhang, H.; Gu, D.; Dai, D.; Ma, C.; Li, Y.; Peng, R.; Li, S.; Liu, G.; Yang, B. Influence of scanning strategy and parameter on microstructural feature, residual stress and performance of Sc and Zr modified Al–Mg alloy produced by selective laser melting. Mater. Sci. Eng. A 2020, 788, 139593. [Google Scholar] [CrossRef]
  5. Zhang, W.; Tong, M.; Harrison, N.M. Scanning strategies effect on temperature, residual stress and deformation by multi-laser beam powder bed fusion manufacturing. Addit. Manuf. 2020, 36, 101507. [Google Scholar] [CrossRef]
  6. Zou, S.; Xiao, H.; Ye, F.; Li, Z.; Tang, W.; Zhu, F.; Chen, C.; Zhu, C. Numerical analysis of the effect of the scan strategy on the residual stress in the multi-laser selective laser melting. Results Phys. 2020, 16, 103005. [Google Scholar] [CrossRef]
  7. Zhao, J.; Quan, G.; Zhang, Y.; Ma, Y.; Jiang, L.; Dai, W.; Jiang, Q. Influence of deposition path strategy on residual stress and deformation in weaving wire-arc additive manufacturing of disc parts. J. Mater. Res. Technol. 2024, 30, 2242–2256. [Google Scholar] [CrossRef]
  8. Bian, P.; Shi, J.; Liu, Y.; Xie, Y. Influence of laser power and scanning strategy on residual stress distribution in additively manufactured 316L steel. Opt. Laser Technol. 2020, 132, 106477. [Google Scholar] [CrossRef]
  9. Salem, M.; Le Roux, S.; Hor, A.; Dour, G. A new insight on the analysis of residual stresses related distortions in selective laser melting of Ti-6Al-4V using the improved bridge curvature method. Addit. Manuf. 2020, 36, 101586. [Google Scholar] [CrossRef]
  10. Bartlett, J.L.; Li, X. An overview of residual stresses in metal powder bed fusion. Addit. Manuf. 2019, 27, 131–149. [Google Scholar] [CrossRef]
  11. Ali, H.; Ma, L.; Ghadbeigi, H.; Mumtaz, K. In-situ residual stress reduction, martensitic decomposition and mechanical properties enhancement through high temperature powder bed pre-heating of Selective Laser Melted Ti6Al4V. Mater. Sci. Eng. A 2017, 695, 211–220. [Google Scholar] [CrossRef]
  12. Pidge, P.A.; Kumar, H. Additive manufacturing: A review on 3 D printing of metals and study of residual stress, buckling load capacity of strut members. Mater. Today Proc. 2020, 21, 1689–1694. [Google Scholar] [CrossRef]
  13. Xie, D.; Lv, F.; Yang, Y.; Shen, L.; Tian, Z.; Shuai, C.; Chen, B.; Zhao, J. A Review on Distortion and Residual Stress in Additive Manufacturing. Chin. J. Mech. Eng. Addit. Manuf. Front. 2022, 1, 100039. [Google Scholar] [CrossRef]
  14. Zhang, Z.; Ibhadode, O.; Shahabad, S.I.; Zhai, X.; Yu, D.; Gao, T.; Zhu, J.; Zhang, W. High-resolution inherent strain method using actual layer thickness in laser powder bed fusion additive manufacturing with experimental validations. J. Mater. Res. Technol. 2024, 30, 6576–6595. [Google Scholar] [CrossRef]
  15. Xiao, Z.; Chen, C.; Hu, Z.; Zhu, H.; Zeng, X. Effect of rescanning cycles on the characteristics of selective laser melting of Ti6Al4V. Opt. Laser Technol. 2020, 122, 105890. [Google Scholar] [CrossRef]
  16. Vastola, G.; Zhang, G.; Pei, Q.X.; Zhang, Y.W. Controlling of residual stress in additive manufacturing of Ti6Al4V by finite element modeling. Addit. Manuf. 2016, 12, 231–239. [Google Scholar] [CrossRef]
  17. Li, Z.; Dai, H.; Du, C.; Xiao, P.; Yao, Y. Energy-based efficient residual stress prediction of titanium alloys with lack-of-fusion porosity in powder bed fusion. Thin-Walled Struct. 2024, 196, 111513. [Google Scholar] [CrossRef]
  18. Ribeiro, V.; Correia, J.; Mourão, A.; Lesiuk, G.; Gonçalves, A.; De Jesus, A.; Berto, F. Fatigue crack growth modelling by means of the strain energy density-based Huffman model considering the residual stress effect. Eng. Fail. Anal. 2022, 140, 106543. [Google Scholar] [CrossRef]
  19. Tekumalla, S.; Seita, M.; Zaefferer, S. Delineating dislocation structures and residual stresses in additively manufactured alloys. Acta Mater. 2024, 262, 119413. [Google Scholar] [CrossRef]
  20. Szost, B.A.; Terzi, S.; Martina, F.; Boisselier, D.; Prytuliak, A.; Pirling, T.; Hofmann, M.; Jarvis, D.J. A comparative study of additive manufacturing techniques: Residual stress and microstructural analysis of CLAD and WAAM printed Ti–6Al–4V components. Mater. Des. 2016, 89, 559–567. [Google Scholar] [CrossRef]
  21. Zhao, L.; Macías, J.G.S.; Dolimont, A.; Simar, A.; Rivière-Lorphèvre, E. Comparison of residual stresses obtained by the crack compliance method for parts produced by different metal additive manufacturing techniques and after friction stir processing. Addit. Manuf. 2020, 36, 101499. [Google Scholar] [CrossRef]
  22. Strantza, M.; Vrancken, B.; Prime, M.B.; Truman, C.E.; Rombouts, M.; Brown, D.W.; Guillaume, P.; Van Hemelrijck, D. Directional and oscillating residual stress on the mesoscale in additively manufactured Ti-6Al-4V. Acta Mater. 2019, 168, 299–308. [Google Scholar] [CrossRef]
  23. Smudde, C.M.; Marchi, C.W.S.; Hill, M.R.; Gibeling, J.C. Evaluation of residual stress reproducibility and orientation dependent fatigue crack growth in powder bed fusion stainless steel. Mater. Sci. Eng. A 2023, 879, 145266. [Google Scholar] [CrossRef]
  24. Becker, T.H.; Dhansay, N.M.; Haar, G.M.T.; Vanmeensel, K. Near-threshold fatigue crack growth rates of laser powder bed fusion produced Ti-6Al-4V. Acta Mater. 2020, 197, 269–282. [Google Scholar] [CrossRef]
  25. ASyed, K.; Ahmad, B.; Guo, H.; Machry, T.; Eatock, D.; Meyer, J.; Fitzpatrick, M.E.; Zhang, X. An experimental study of residual stress and direction-dependence of fatigue crack growth behaviour in as-built and stress-relieved selective-laser-melted Ti6Al4V. Mater. Sci. Eng. A 2019, 755, 246–257. [Google Scholar]
  26. Ye, H.; Le, F.; Wei, C.; Ye, K.; Liu, S.; Wang, G. Fatigue crack growth behavior of Ti-6Al-4V alloy fabricated via laser metal deposition: Effects of building orientation and heat treatment. J. Alloys Compd. 2021, 868, 159023. [Google Scholar] [CrossRef]
  27. Gordon, J.V.; Haden, C.V.; Nied, H.F.; Vinci, R.P.; Harlow, D.G. Fatigue crack growth anisotropy, texture and residual stress in austenitic steel made by wire and arc additive manufacturing. Mater. Sci. Eng. A 2018, 724, 431–438. [Google Scholar] [CrossRef]
  28. Shoemaker, T.K.; Harris, Z.D.; Smudde, C.M.; Hill, M.R.; Burns, J.T. 3D fatigue crack path deflection and residual stresses in 17-4PH stainless steel rod. Int. J. Fatigue 2023, 175, 107735. [Google Scholar] [CrossRef]
  29. Smudde, C.M.; Marchi, C.W.S.; Hill, M.R.; Gibeling, J.C. Effects of residual stress on orientation dependent fatigue crack growth rates in additively manufactured stainless steel. Int. J. Fatigue 2023, 169, 107489. [Google Scholar] [CrossRef]
  30. Zhang, X.; Ma, Y.; Yang, M.; Huang, W.; Peng, Y.; Wang, Z. Effects of biaxial residual stress components on mixed-mode fatigue crack propagation behavior in friction stir welded 7075-T6 aluminium alloy panel. Theor. Appl. Fract. Mech. 2022, 121, 103437. [Google Scholar] [CrossRef]
  31. Luan, S.; Zhang, C.; Zhang, X. Effect of residual stress redistribution on fatigue crack growth pertinent to crack closure and applied load. Mater. Des. 2023, 233, 112282. [Google Scholar] [CrossRef]
  32. Zhang, J.; Wang, X.; Paddea, S.; Zhang, X. Fatigue crack propagation behaviour in wire+arc additive manufactured Ti-6Al-4V: Effects of microstructure and residual stress. Mater. Des. 2016, 90, 551–561. [Google Scholar] [CrossRef]
  33. Zhang, X.; Ma, Y.; Li, W.; Huang, W.; Zhang, W.; Wang, Z. A review of residual stress effects on fatigue properties of friction stir welds. Crit. Rev. Solid State Mater. Sci. 2023, 48, 775–813. [Google Scholar] [CrossRef]
  34. Bachus, N.A.; Strantza, M.; Clausen, B.; Elia, C.R.D.; Hill, M.R.; Ko, J.Y.P.; Pagan, D.C.; Brown, D.W. Novel bulk triaxial residual stress mapping in an additive manufactured bridge sample by coupling energy dispersive X-ray diffraction and contour method measurements. Addit. Manuf. 2024, 83, 104070. [Google Scholar] [CrossRef]
  35. Marola, S.; Bosia, S.; Veltro, A.; Fiore, G.; Manfredi, D.; Lombardi, M.; Amato, G.; Baricco, M.; Battezzati, L. Residual stresses in additively manufactured AlSi10Mg: Raman spectroscopy and X-ray diffraction analysis. Mater. Des. 2021, 202, 109550. [Google Scholar] [CrossRef]
  36. Uzun, F.; Basoalto, H.; Liogas, K.; Slim, M.F.; Lee, T.L.; Besnard, C.; Wang, Z.I.; Chen, J.; Dolbnya, I.P.; Korsunsky, A.M. Tomographic eigenstrain reconstruction for full-field residual stress analysis in large scale additive manufacturing parts. Addit. Manuf. 2024, 81, 104027. [Google Scholar] [CrossRef]
  37. Uzun, F.; Basoalto, H.; Liogas, K.; Chen, J.; Dolbnya, I.P.; Wang, Z.I.; Korsunsky, A.M. Voxel-based full-field eigenstrain reconstruction of residual stresses in additive manufacturing parts using height digital image correlation. Addit. Manuf. 2023, 77, 103822. [Google Scholar] [CrossRef]
  38. Rashid, A.; Gopaluni, A. A review of residual stress and deformation modeling for metal additive manufacturing processes. Chin. J. Mech. Eng. Addit. Manuf. Front. 2023, 2, 100102. [Google Scholar] [CrossRef]
  39. Li, Z.; Dai, H.; Yao, Y.; Liu, J. A semi-analytical model for rapid prediction of residual stress and deformation in laser powder bed fusion. Appl. Math. Model. 2024, 125, 672–686. [Google Scholar] [CrossRef]
  40. Prabhune, B.C.; Suresh, K. A fast matrix-free elasto-plastic solver for predicting residual stresses in additive manufacturing. Comput.-Aided Des. 2020, 123, 102829. [Google Scholar] [CrossRef]
  41. Singh, U.P.; Shukla, A.; Swaminathan, S.; Phanikumar, G. Effect of build orientations on residual stress, microstructure, and mechanical properties of additively manufactured alloy-718 components. J. Manuf. Process. 2024, 113, 1–15. [Google Scholar] [CrossRef]
  42. Hodge, N.E.; Ferencz, R.M.; Vignes, R.M. Experimental comparison of residual stresses for a thermomechanical model for the simulation of selective laser melting. Addit. Manuf. 2016, 12, 159–168. [Google Scholar] [CrossRef]
  43. Lee, Y.; Feldhausen, T.; Fancher, C.M.; Nandwana, P.; Babu, S.S.; Simunovic, S.; Love, L.J. Prediction of residual strain/stress validated with neutron diffraction method for wire-feed hybrid additive/subtractive manufacturing. Addit. Manuf. 2024, 79, 103920. [Google Scholar] [CrossRef]
  44. Song, X.; Feih, S.; Zhai, W.; Sun, C.; Li, F.; Maiti, R.; Wei, J.; Yang, Y.; Oancea, V.; Brandt, L.R.; et al. Advances in additive manufacturing process simulation: Residual stresses and distortion predictions in complex metallic components. Mater. Des. 2020, 193, 108779. [Google Scholar] [CrossRef]
  45. Cao, J.; Gharghouri, M.A.; Nash, P. Finite-element analysis and experimental validation of thermal residual stress and distortion in electron beam additive manufactured Ti-6Al-4V build plates. J. Mater. Process. Technol. 2016, 237, 409–419. [Google Scholar] [CrossRef]
  46. Karpenko, O.; Oterkus, S.; Oterkus, E. Investigating the influence of residual stresses on fatigue crack growth for additively manufactured titanium alloy Ti6Al4V by using peridynamics. Int. J. Fatigue 2022, 155, 106624. [Google Scholar] [CrossRef]
  47. Ali, B.; Heider, Y.; Markert, B. Predicting residual stresses in SLM additive manufacturing using a phase-field thermomechanical modeling framework. Comput. Mater. Sci. 2024, 231, 112576. [Google Scholar] [CrossRef]
  48. Hajializadeh, F.; Ince, A. Residual stress computation in direct metal deposition using integrated artificial neural networks and finite element analysis. Mater. Today Commun. 2024, 38, 108471. [Google Scholar] [CrossRef]
  49. Zhang, X.; Wang, J.; Ma, Y.; Liu, D.; Gao, R.; Xu, R.; Zhao, Z.; Chen, S.; Wang, Z. Residual stress effects on short crack propagation behavior in friction stir welded 7075-T6 aluminum alloy panel under biaxial loading: An experimental and numerical study. Eng. Fract. Mech. 2024, 299, 109956. [Google Scholar] [CrossRef]
  50. ASTM E647-23B; Standard Test Method for Measurement of Fatigue Crack Growth Rates. ASTM International: West Conshohocken, PA, USA, 2011.
  51. Li, F.Z.; Shin, C.F.; Needleman, A. A comparison of methods for calculating energy-release rates. Eng. Fract. Mech. 1985, 21, 405–421. [Google Scholar] [CrossRef]
  52. Rice, J.R. A Path Independent Integral and the Approximate Analysis of Strain Concentration by Notches and Cracks. J. Appl. Mech. 1968, 35, 379–386. [Google Scholar] [CrossRef]
  53. Sun, W.; Ma, Y.E.; Zhang, W.; Qian, X.; Huang, W.; Wang, Z. Effects of the build direction on mechanical performance of laser powder bed fusion additively manufactured ti6al4v under different loadings. Adv. Eng. Mater. 2021, 23, 2100611. [Google Scholar] [CrossRef]
  54. Sun, W.; Ma, Y.; Huang, W.; Zhang, W.; Qian, X. Effects of build direction on tensile and fatigue performance of selective laser melting Ti6Al4V titanium alloy. Int. J. Fatigue 2020, 130, 105260. [Google Scholar] [CrossRef]
  55. Lin, S.E. Numerical Methods and High Performance Computing for Modeling Metallic Additive Manufacturing Processes at Multiple Scales. Ph.D. Thesis, Northwestern University, Evanston, IL, USA, 2019. [Google Scholar]
  56. Małecka, J.; Rozumek, D. Metallographic and Mechanical Research of the O–Ti2AlNb Alloy. Materials 2020, 13, 3006. [Google Scholar] [CrossRef]
  57. Rozumek, D.; Faszynka, S. Surface cracks growth in aluminum alloy AW-2017A-T4 under combined loadings. Eng. Fract. Mech. 2020, 226, 106896. [Google Scholar] [CrossRef]
Figure 1. Sample design and measurement points: (a) geometry and build direction of samples, and (b) experimental measurement points of residual stresses.
Aerospace 12 00103 g001
Figure 2. Scanning strategies.
Aerospace 12 00103 g002
Figure 3. Finite element model.
Aerospace 12 00103 g003
Figure 4. Flowchart of residual stress and fatigue crack propagation analysis.
Aerospace 12 00103 g004
Figure 5. Measured surface residual stress distribution: (a) S11 in the 15° sample, (b) S22 in the 15° sample, (c) S11 in the 75° sample, (d) S22 in the 75° sample.
Aerospace 12 00103 g005
Figure 6. Stress ratio of S11/S22 at measurement points: (a) the 15° sample, (b) the 75° sample, (c) the distribution, and (d) the temperature gradient in different regions.
Aerospace 12 00103 g006
Figure 7. Three-dimensional residual stress distribution: (a,d) printing finished, (b,e) removal from the substrate plate, and (c,f) machining into CT sample.
Aerospace 12 00103 g007
Figure 8. Comparison of experimental and numerical residual stress profiles: (a) path along the crack propagation direction in 15° sample, (b) path along the loading direction in 15° sample, (c) path along the crack propagation direction in 15° sample, (d) path along the loading direction in 15° sample.
Aerospace 12 00103 g008
Figure 9. Residual stress distribution of the 75° sample, (a) S11 in fracture surface, (b) S22 in fracture surface, (c) along crack direction, (d) along the depth.
Aerospace 12 00103 g009
Figure 10. Fatigue crack growth behaviors: (a) fracture surface of the model without RS, (b) fracture surface of the model without RS relaxation, (c) fracture surface of the model with RS relaxation, (d) SIFs along the crack direction, (e) SIFs of the initial crack, and (f) a–N curves.
Aerospace 12 00103 g010
Figure 11. Fatigue fracture surface of 75°as-built sample: (a) experimental result and crack front, (b) fracture morphology, and (c,d) simulation results.
Aerospace 12 00103 g011
Figure 12. Simulated and experimental crack path of the 75° sample: (ac) without residual stress, and (df) with residual stress and stress relaxation.
Aerospace 12 00103 g012
Table 1. Chemical compositions of Ti6Al4V powders (wt %).
(%)
TiAlVFeCHON
balance5.5–6.753.5–4.5≤0.30≤0.08≤0.015≤0.20≤0.05
Table 2. LPBF processing parameters.
Laser Power/WLaser Beam Diameter/mmScanning Speed/(mm/s)Layer Thickness/mm
3500.0810000.06
Table 3. Mechanical properties of LPBF Ti6Al4V at room condition (Adapted with permission from Refs. [53,54]. 2020, 2021, Elsevier, Wiley).
Yielding Stress/MPaUltimate Tensile Stress/MPaElongation/
8559350.15
Table 4. Temperature-dependent material properties of LPBF Ti6Al4V (Adapted with permission from Refs. [45,55]. 2016, 2021, Elsevier, ProQuest).
Temperature/
°C
Conductivity/
(mW·mm−1·°C−1)
Elastic/
MPa
Specific Heat/
(×108 mJ·Tonne−1·°C−1)
Expansion/
(×10−6 1/°C)
207102,0005.469
1277.8101,0005.679.16
2278.995,0005.919.31
32710.591,0006.119.46
42711.785,0006.369.61
5271380,0006.569.76
62714.575,0006.799.9
72716.270,0006.9910.1
82718.465,0007.1910.2
92720.160,0007.3310.4
102719.735,0006.4710.5
112721.720,0006.6410.6
16777210,0007.911
Disclaimer/Publisher’s Note: The statements, opinions and data contained in all publications are solely those of the individual author(s) and contributor(s) and not of MDPI and/or the editor(s). MDPI and/or the editor(s) disclaim responsibility for any injury to people or property resulting from any ideas, methods, instructions or products referred to in the content.

