1. Introduction
Impacts from small, non-trackable orbital debris (OD) in Low Earth orbit are generally unavoidable and pose a severe threat to spacecraft due to the high collision speeds, averaging 9 km/s [
1]. Therefore, protection in the form of spacecraft shielding is implemented to serve as sacrificial elements to prevent perforation in critical areas. Shielding designs take advantage of thin bumper plates to cause fragmentation in impacting orbital debris to form a debris cloud composed of smaller and individually less dangerous fragments.
Studies of ground-based experiments such as the Satellite Orbital Debris Characterization Impact Test (SOCIT) [
2] and DebriSat [
3] have revealed that actual orbital debris primarily consists of non-spherical shapes such as thin plates, rods, nuggets, and various other irregular forms. However, the majority of shielding designs and literature data simulate orbital debris as spherical projectiles, primarily due to practical considerations such as uniformity or physical equipment limitations.
In an effort to evaluate the effects of projectile shape, Morrison experimentally discovered that the debris cloud from cylindrical projectiles striking the bumper at normal incidence was more densely concentrated along the flight axis, creating a spike-like shape. The cloud’s tip moved an average of 14% faster than that of a sphere [
4]. A further experimental study conducted by Piekutowski using cylindrical projectiles with varying length-to-diameter ratios indicated an increased risk of perforation compared to spherical projectiles [
5,
6,
7].
In subsequent years, the primary approach to research has shifted from experimental to computational methods. Increased computational power has allowed researchers to address the limitations of physical experiments. Williamsen et al. [
2,
8] conducted a preliminary numerical study of hypervelocity impacts (HVI) involving spherical, cubical, and flake-like projectiles, and derived ballistic limit equations and curves for a selected reference dual-wall shield. Hiermaier and Schäfer [
9] numerically demonstrated that even small variations in the aspect ratio of ellipsoidal projectiles can significantly influence the characteristics of the debris cloud generated upon perforation of a Whipple shield. Carrasquilla and Miller [
10] conducted a numerical analysis of the selected dual-wall shield subjected to impacts by prolate and oblate ellipsoidal projectiles, highlighting the influence of projectile shape on the resulting ballistic-limit curves.
In more recent years, NASA have developed a novel technique to reliably accelerate nonspherical projectiles and has conducted experimental and numerical studies [
11,
12,
13] on the hypervelocity impact of cylindrical steel, copper and carbon fiber–reinforced polymer projectiles on shielding systems analogous to those used on the International Space Station.
These findings demonstrate that the non-spherical nature of projectiles introduces several additional parameters, significantly increasing the complexity of analyzing shield performance and introducing uncertainty into the effectiveness of design solutions. Given the vast number of possible combinations of projectile velocities, shapes, orientations, and shield configurations, deriving ballistic-limit equations and curves for every non-spherical scenario is exceedingly challenging and would require many years of research to develop a comprehensive database comparable to that available for spherical projectiles.
To address this challenge, the current research aims to correlate existing spherical projectile data with predictions for non-spherical cases. This approach offers a practical engineering solution that enables continued use of spherical data without compromising the effectiveness of orbital debris protection.
3. Numerical Model
This study conducted a numerical analysis of normal impacts by projectiles of various shapes at a velocity of 7 km/s on a semi-infinite rear plate behind a Whipple shield. Each projectile’s mass was selected to match that of the 6 mm spherical aluminum projectile, which served as the baseline. The projectile parameters were set to meet the OD protection requirements for a seven-year mission of a robotic spacecraft in a near-polar orbit at approximately 600 km altitude.
The results of the full-scale satellite collision experiments [
2,
3] showed that thin plates (“flakes”) were the most significant in terms of the number and size of fragments. Rods and nugget-shaped fragments were less numerous but still of considerable quantity. In this study, cylindrical projectiles with varying length-to-diameter (
L/
D) ratios were used to represent common fragment shapes, ranging from flat “flake-like” to elongated rod-like geometries. The dimensions of projectiles are provided in
Table 1. The study was limited to normal impacts, which tend to pose a higher risk than oblique impacts [
8,
13], thereby providing a conservative assessment.
The numerical simulation was performed using two planes of symmetry. Analysis was performed for the standoff distances (S) of 15 mm, 100 mm and 150 mm. The bumper thickness was set to 1.5 mm based on design equations in the literature [
1]. This thickness corresponds to the complete fragmentation of 6 mm aluminum spheres at 7 km/s.
Smoothed-particle hydrodynamics (SPH) was used to model the projectile, the bumper, and the central portion of the rear plate, which undergo significant deformation and fragmentation during the hypervelocity impact event. The explicit finite element method (FEM) was applied to model the remainder of the rear plate, where minimal deformation and fragmentation were anticipated.
All HVI simulations were carried out using the commercial software Ansys Autodyn v24.2. The dimensions of the numerical model for the selected standoff distances were established through a trial-and-error process to be sufficiently large, ensuring that geometry did not affect the numerical test outcomes. The numerical HVI test setup is illustrated in
Figure 1.
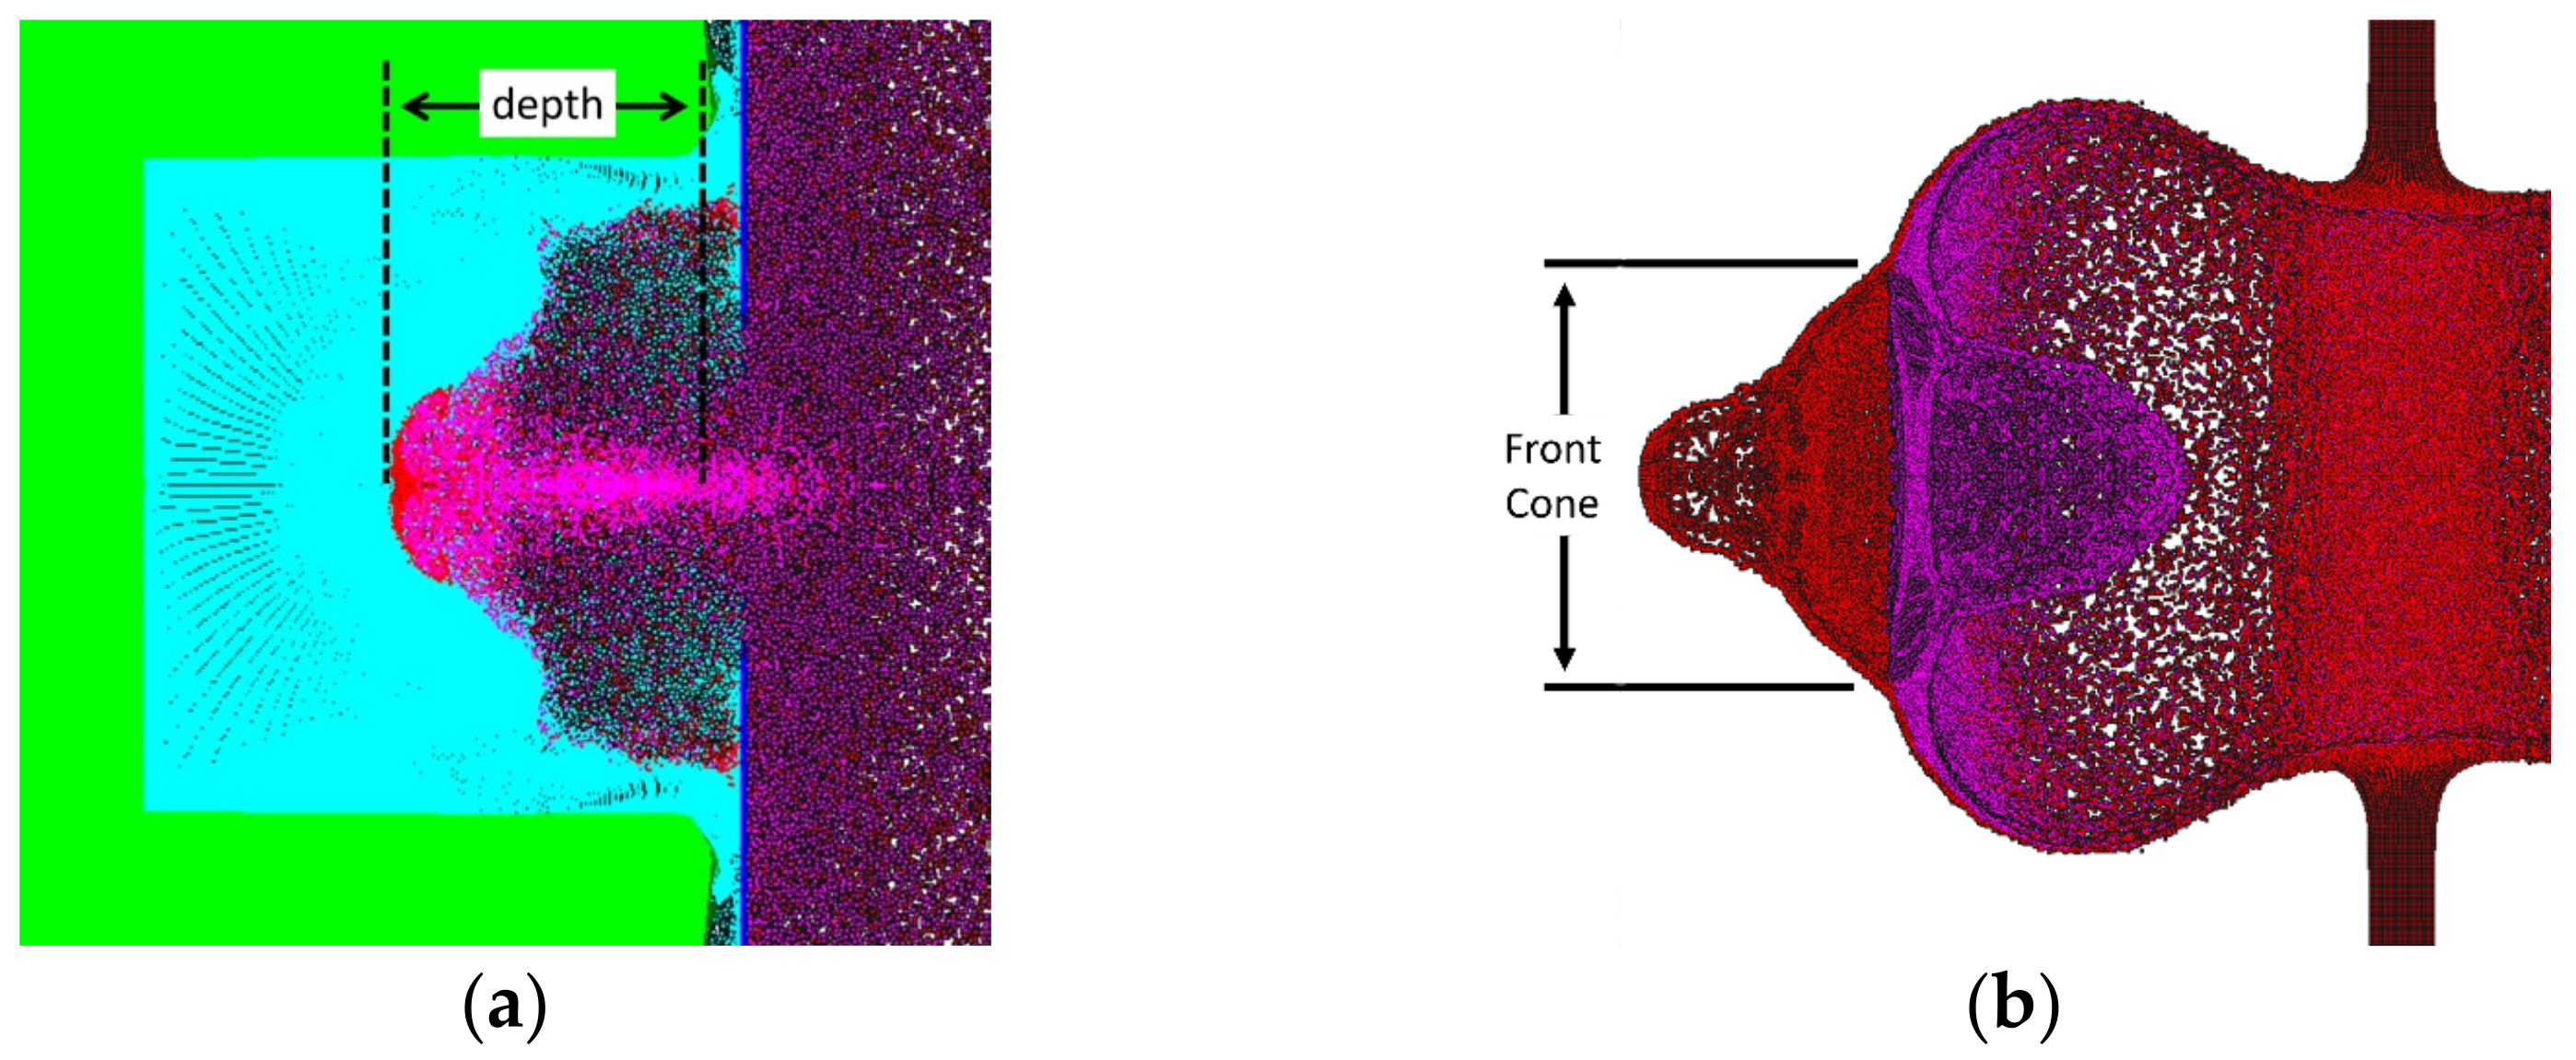
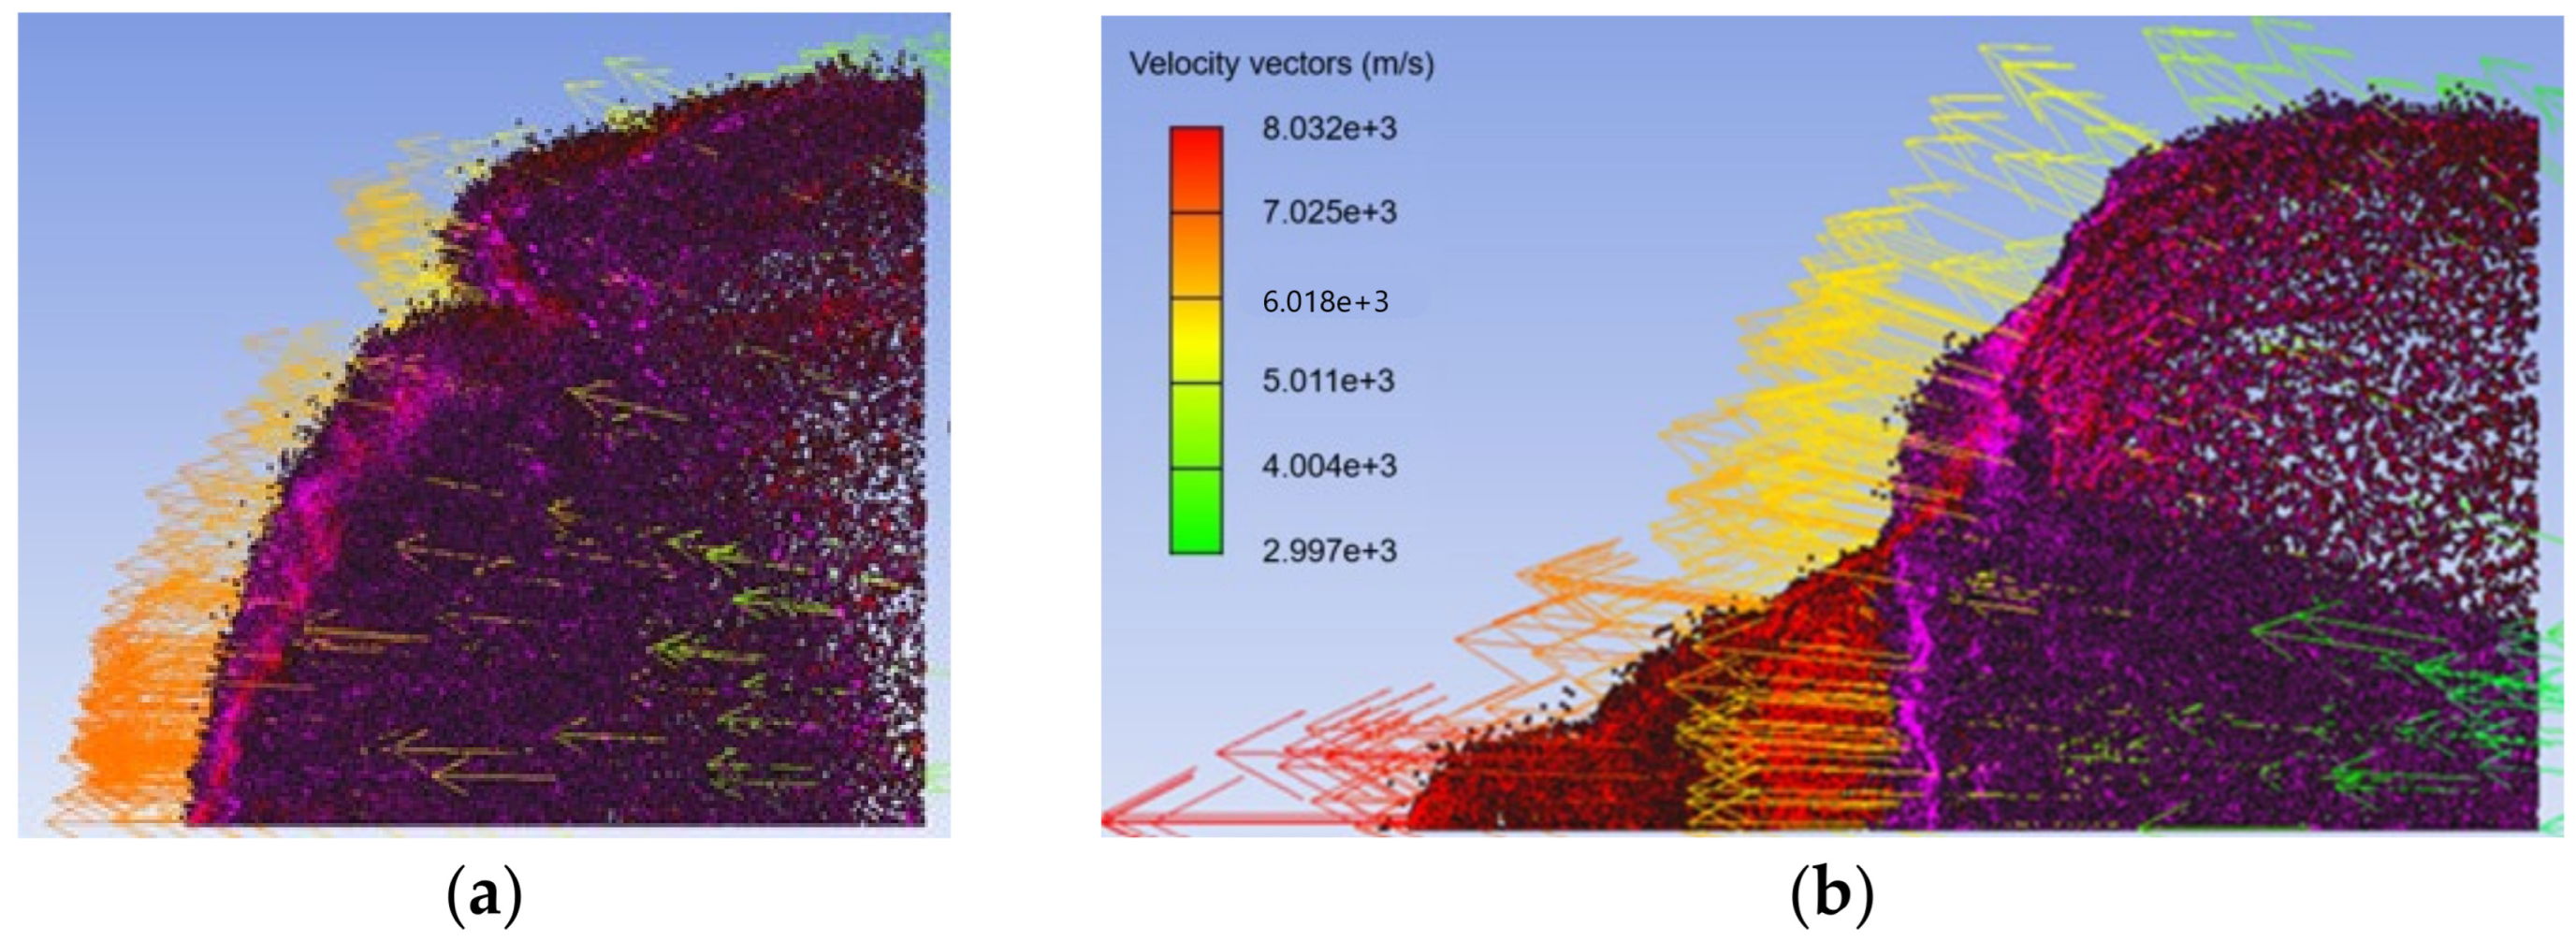
The size of the SPH portion of the rear wall was chosen to encompass the central, deepest crater produced by the debris cloud (
Figure 2a). To reduce computational costs, a rigid body with a central opening was placed between the bumper and rear wall to block peripheral fragments not involved in forming the deepest crater. The opening was sized to accommodate the front cone of the debris cloud (
Figure 2b). This modification significantly reduced computational requirements.
The current study continues the earlier work published in [
14,
15] by using the same Al6061-T6 material and material model [
16] for the projectile, bumper, and rear plate, and by applying the same erosion strain of 1.0 for the FEM portion of the rear wall. The comprehensive material model includes three components: the Mie-Gruneisen Equation of state to relate the local density, specific energy, and hydrostatic pressure; the Johnson-Cook strength model to link the deviatoric stress with the strain and temperature effect; and the Johnson-Cook failure model, which defines the onset of material failure. The details of the material model are listed in
Table 2.
4. Convergence and Validation
The numerically converged output was found by incrementally increasing the number of SPH nodes or finite elements in the various parts of the numerical model. The error in energy was maintained at less than 5% of the total energy. Convergence was considered achieved once further increases in the total number of SPH nodes resulted in a variation in the crater depth of less than 5%.
The convergence process of the simulation output is illustrated in
Figure 3 for a 6 mm spherical projectile impacting at 7 km/s on a configuration with a bumper standoff distance of 15 mm. Convergence was achieved after the total number of SPH particles in the projectile, bumper, and the central region of the rear plate exceeded two million, corresponding to an SPH particle size of 0.065 mm. The finite element size in the remaining portion of the rear plate was set to 0.195 mm, a value determined through a trial-and-error process to ensure consistency of the results.
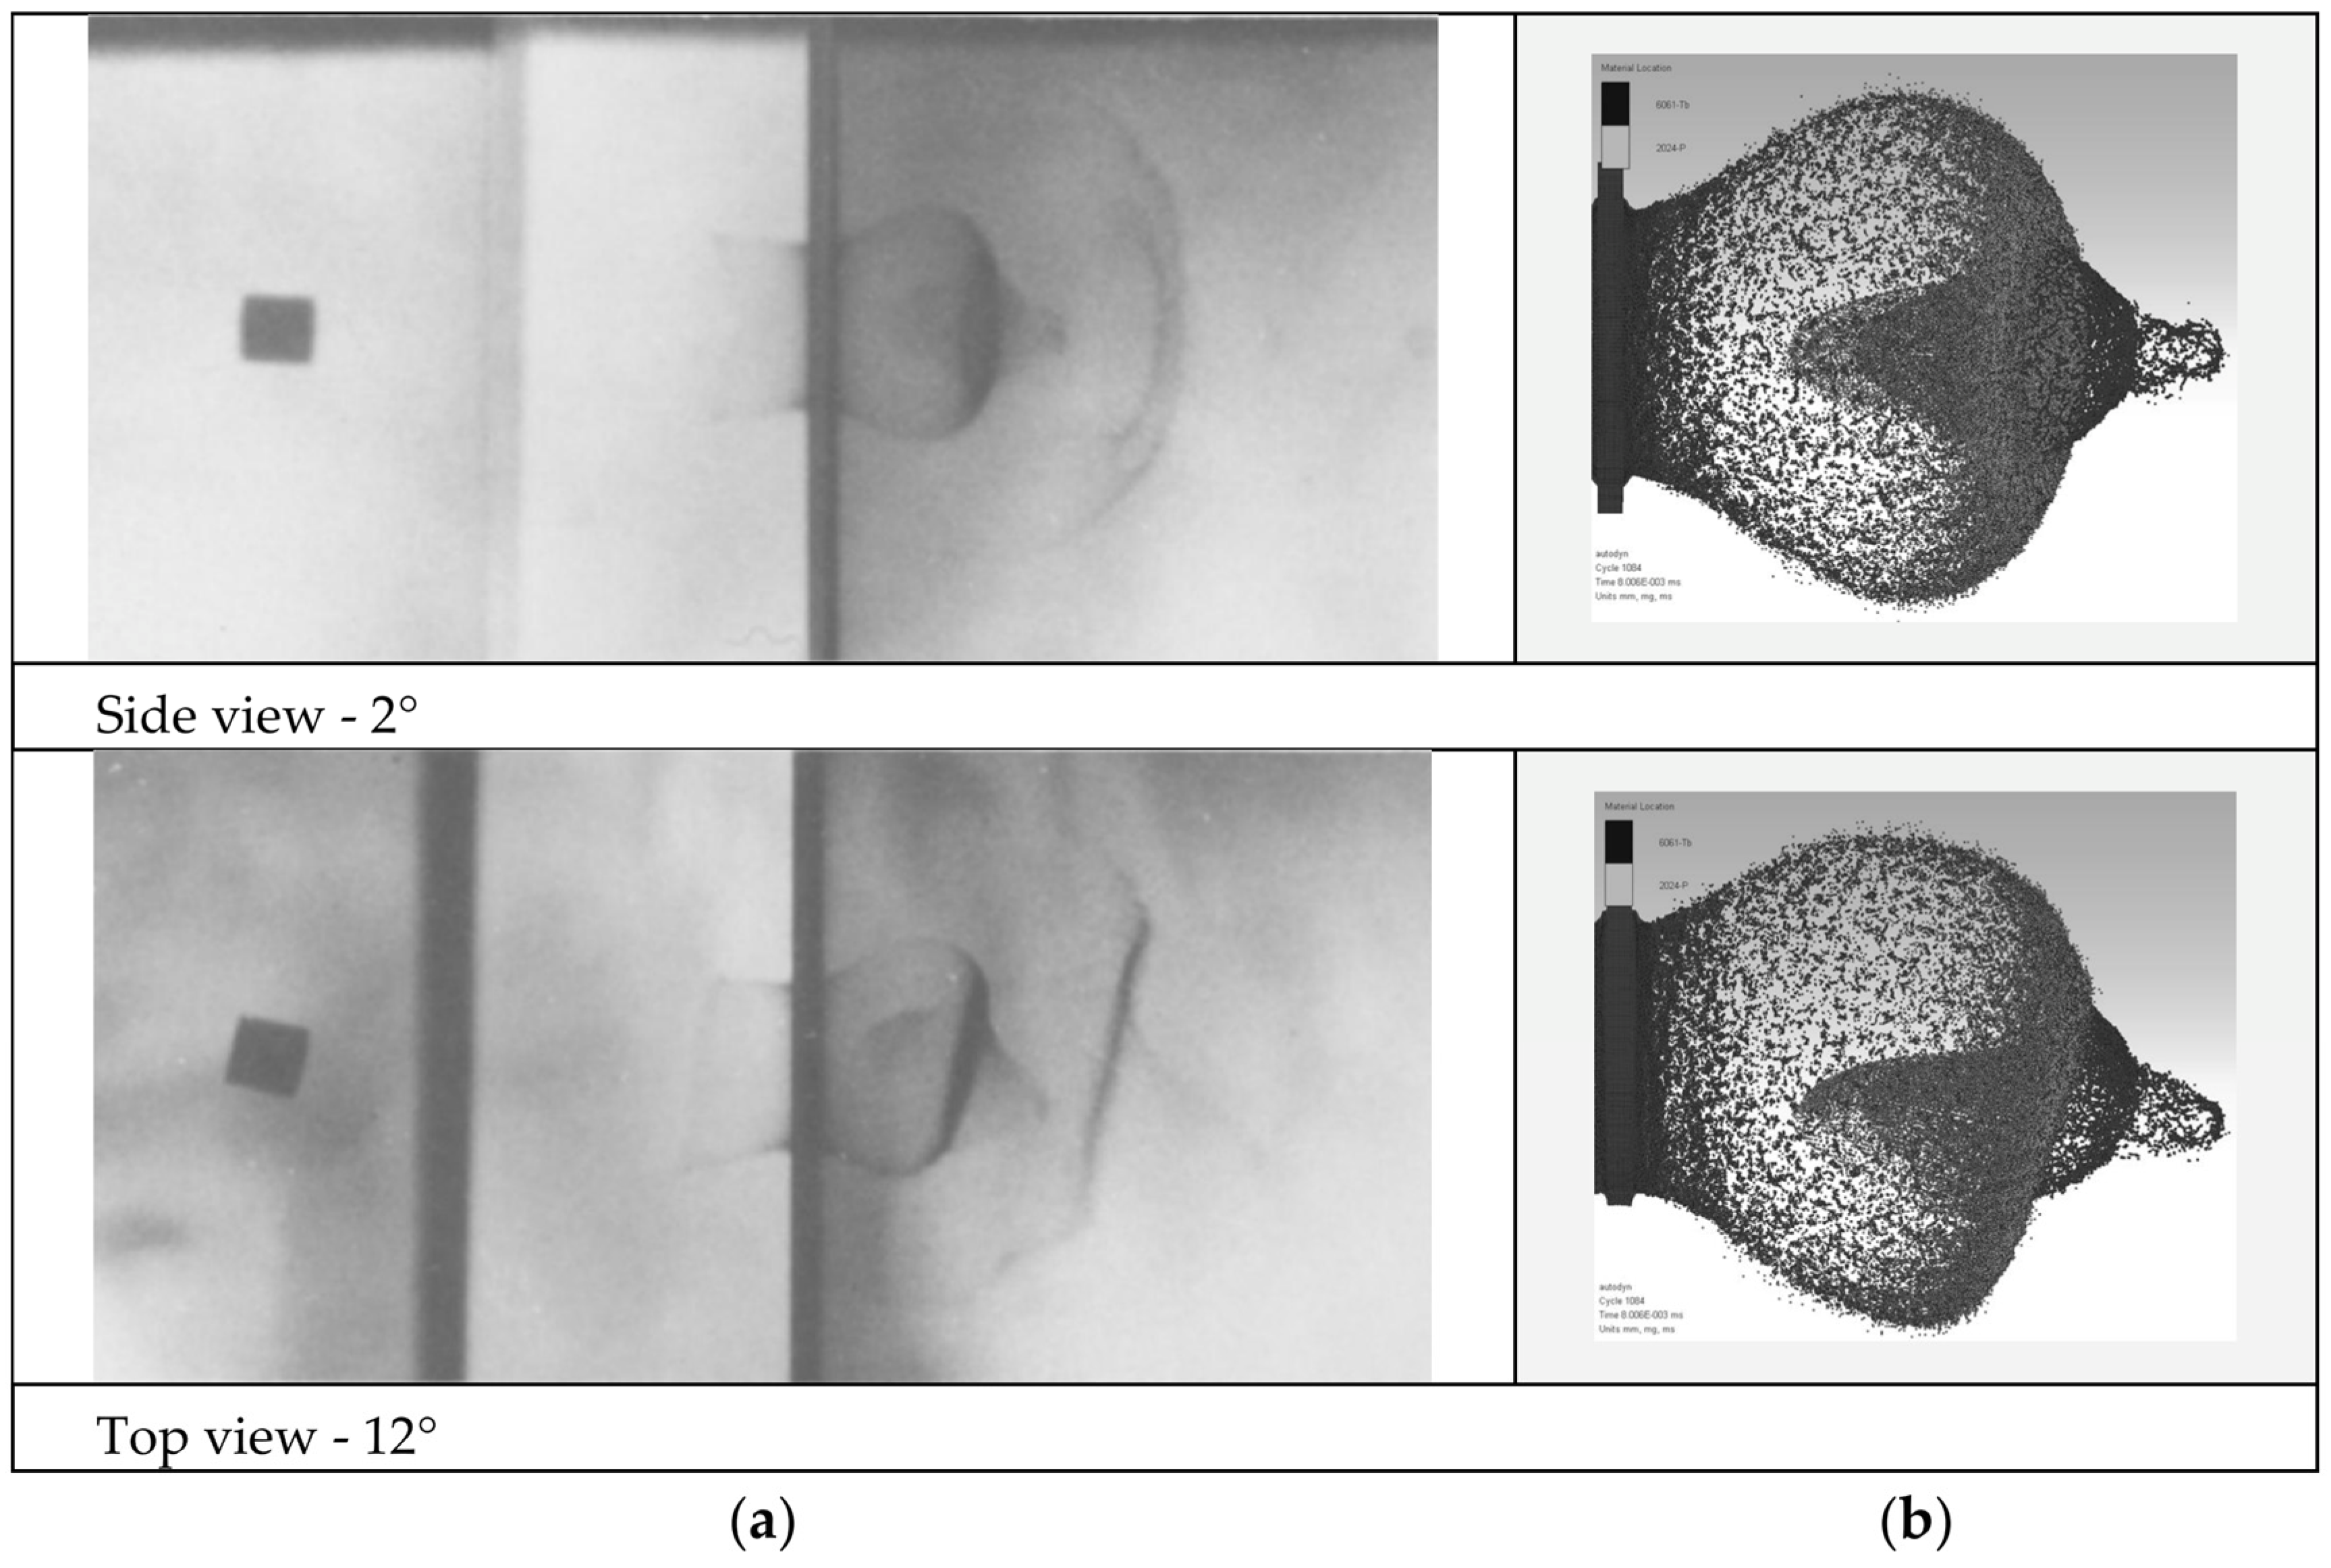
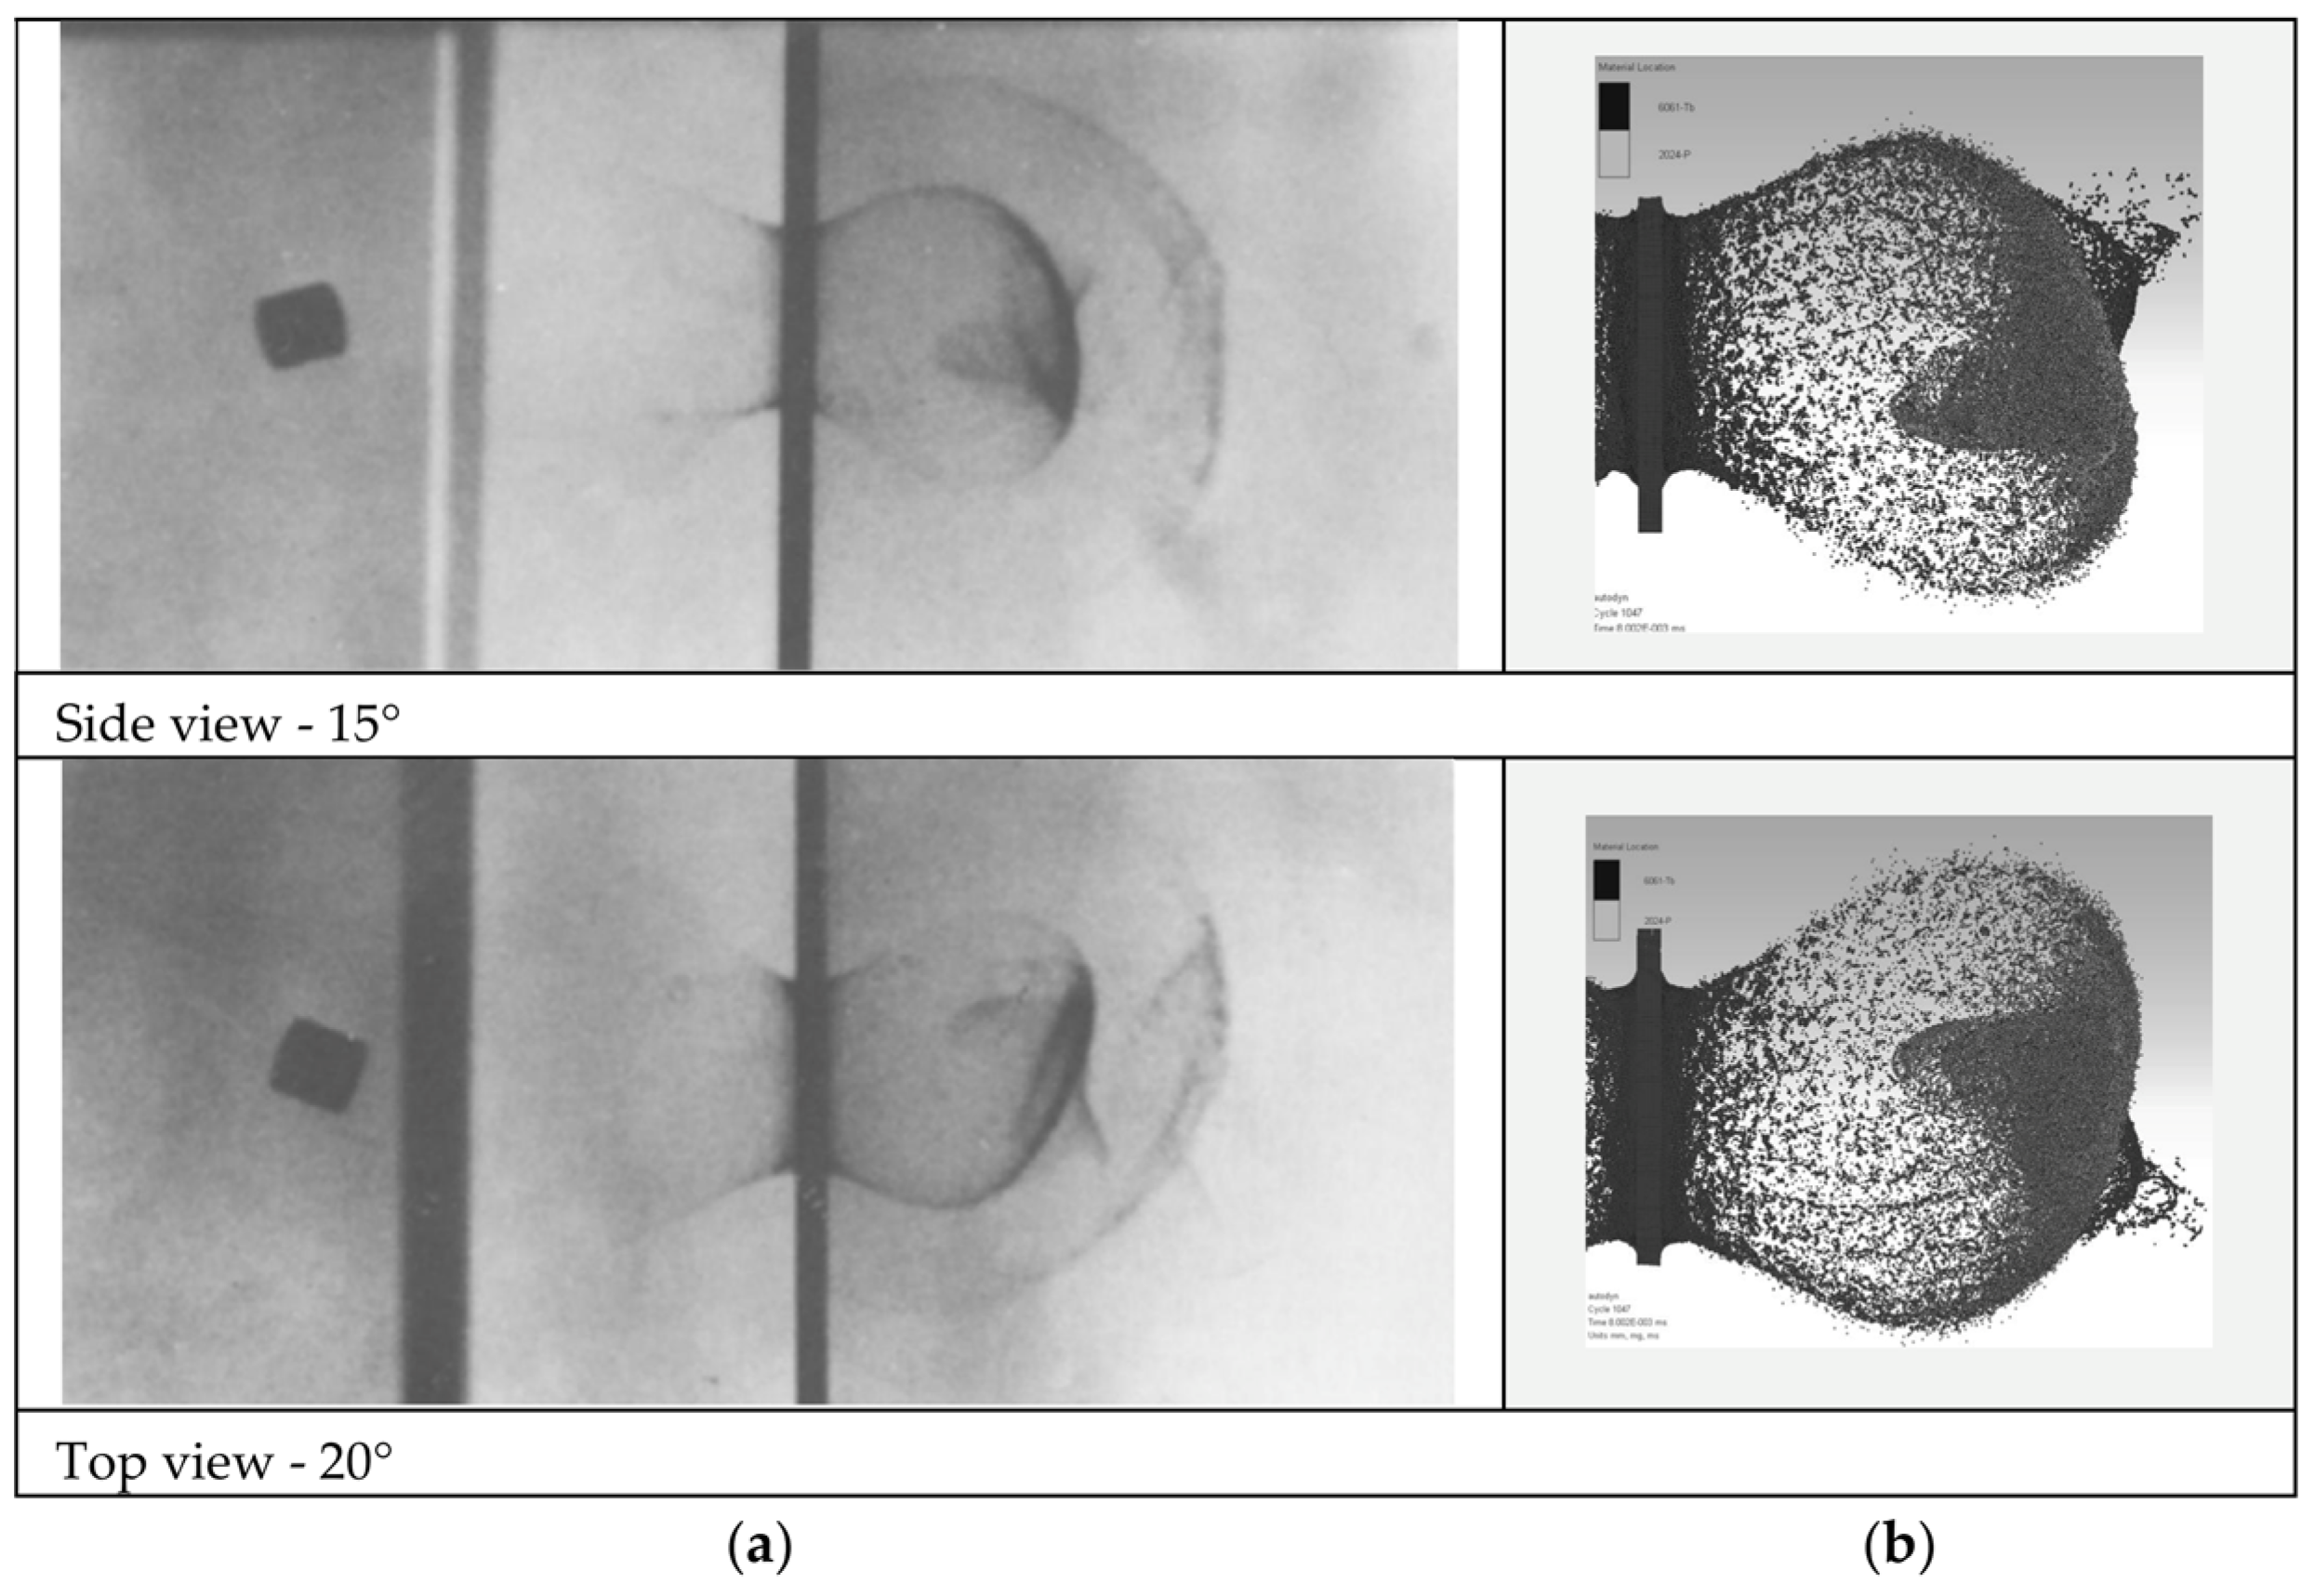
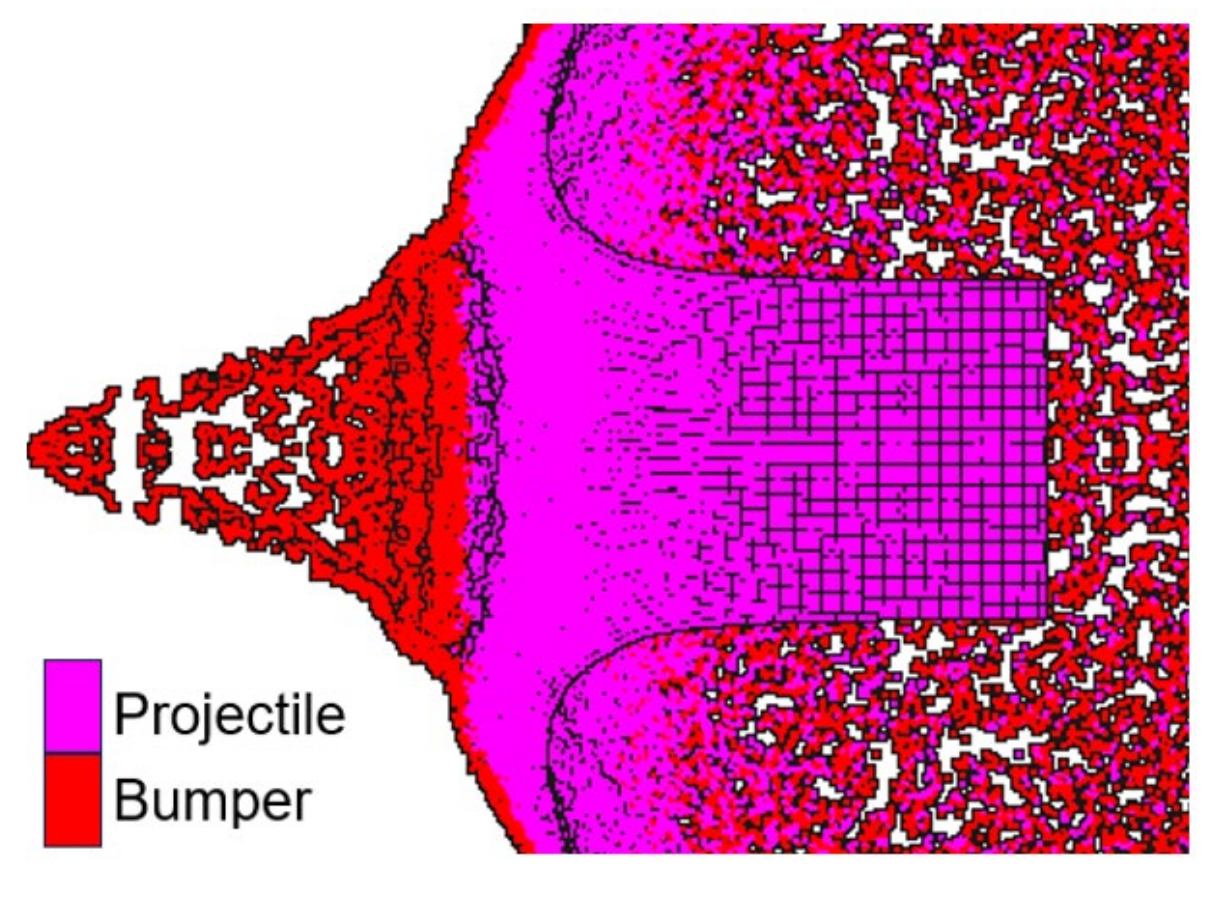
To validate the developed numerical model, it was employed to replicate Piekutowski’s hypervelocity impact test [
5], which involved aluminum cylindrical projectiles impacting a thin aluminum bumper at velocities of approximately 7 km/s. The bumper, made of Al6061-T6, had a thickness of 2.03 mm. The cylindrical projectile, fabricated from aluminum 2024-T4, had a diameter and length of 7.72 mm. The bumper was modelled using the material model and corresponding parameters provided in
Table 2, while the projectile was simulated using a slightly different Al2024-T4 material model specified in [
17]. Due to the non-zero incidence angles observed in the physical HVI tests, the numerical simulation was conducted without employing axes of symmetry to accurately replicate the experimental conditions. The numerical results were subsequently compared with experimental data to evaluate the accuracy of the numerical model. The results of the comparison are illustrated in
Figure 4,
Figure 5,
Figure 6 and
Table 3 (Permission for reuse of experimental figures obtained from CCC’s RightsLink
® on 8 March 2023).
The results of the numerical HVI tests indicate that the simulated debris cloud shape and proportions are in good qualitative agreement with the experimental data. The numerical simulation successfully captured the key features of the cylindrical debris cloud—main body, inner cone, and front cone—as well as the debris cloud distortion caused by projectile inclination. The discrepancy in the velocity of the debris cloud’s leading edge, when comparing the numerical and experimental results, increases with projectile inclination, reaching 10.7% at an inclination of 25 degrees. For inclinations of 12 degrees and below, this discrepancy remains under 5%. Consequently, it can be concluded that the developed model is sufficiently validated to simulate the debris cloud formed by normal and near-normal impacts of cylindrical projectiles. Although experimental data for crater depth is not available, preventing a definitive verdict on full model validation, the accurate representation of the debris cloud remains a critical factor in calculating the crater depth in the rear plate. Given this, and considering that the model was validated in earlier research [
15,
16], it is reasonable to assume that the model is robust enough to proceed with the analysis.
5. Numerical Analysis
Fragmentation of the projectile under hypervelocity impact results from a shock wave propagating through the material and reflecting at free surfaces as rarefaction waves, whose interaction with the incident shock produces the extreme conditions that initiate material failure [
18].
Figure 7 illustrates the influence of projectile geometry on the evolution of the pressure field in cylindrical projectiles of identical mass but with different
L/
D ratios. Variations in geometry produce distinct pressure distributions, which in turn significantly affect the characteristics of the resulting debris cloud, as shown in
Figure 8.
Figure 8 depicts debris clouds generated 5 µs after normal impact at 7 km/s by a 6 mm spherical aluminum projectile (
Figure 8a) and by equal-mass cylindrical projectiles with different length-to-diameter ratios:
L/
D = 1 (“nugget”,
Figure 8b),
L/
D = 1/3 (“flake”,
Figure 8c), and
L/
D = 2 (“rod”,
Figure 8d). Blue and green indicate material originating from the projectile and bumper, respectively. The cloud dimensions are given in millimeters.
Numerical analysis revealed that beyond a certain
L/
D ratio, rod-like cylindrical projectiles retain a portion of their original, unfragmented body after perforating the bumper, posing a significant risk to the rear wall. For the selected bumper and projectile parameters, this threshold corresponds to an
L/
D ratio of 2. As the cylinder becomes more slender (with an increasing
L/
D ratio), the size of the unfragmented portion increases accordingly. An example of the unfragmented portion is illustrated in
Figure 9 for
L/
D = 3. The current study was limited to projectile
L/
D ratios that result in complete projectile fragmentation.
To evaluate the threat posed by projectiles of various shapes to the structure behind the bumper, a series of numerical HVI tests were conducted using cylindrical and spherical projectiles. All cylindrical projectiles had masses equal to that of a 6 mm-diameter sphere and impacted the bumper at a normal angle of incidence at 7 km/s. The simulation was run until the depth of the large central crater stopped increasing in size. As illustrated in
Figure 2a, the depth of the crater was measured from the deepest point, farthest away from the surface of the rear wall.
The simulation results indicate that the velocity of the leading fragments in debris clouds from all cylindrical projectiles was about 18.4% higher than that of the spherical projectile. Despite the distinct fragment patterns observed in debris clouds from cylindrical projectiles with different
L/
D ratios (
Figure 8b–d), the velocity of their leading fragments was nearly identical, with variations not exceeding 1.8%.
The analysis showed that increasing the standoff distance has a more pronounced protective effect against spherical projectiles.
Figure 10 illustrates the debris clouds produced by spherical and cylindrical projectiles after bumper perforation. Due to the radial expansion of the debris cloud produced by the spherical projectile (
Figure 10a), increasing the standoff distance allows the fragments to disperse over a larger area on the rear wall surface, thereby reducing localized damage. However, for cylindrical projectiles, the fragments with the highest momentum form a cluster near the leading edge of the debris cloud, close to its central axis (
Figure 10b). Since the fragments within this cluster travel in nearly the same direction as the original projectile, they exhibit limited lateral expansion, thus requiring a greater standoff distance to enhance the bumper’s effectiveness.
Figure 11 illustrates the variation in deepest crater depth with the
L/
D ratio for four different stand-off distances: 15 mm, 50 mm, 100 mm, and 150 mm. All curves follow a similar trend, reaching a minimum at a specific
L/
D ratio and then increasing as the ratio moves away from that point. The minimum is observed near
L/
D = 4/3 for 100 and 150 mm, at
L/
D = 1 for 50 mm, and at
L/
D = 2/3 for 15 mm.
The curve for the 15 mm standoff distance lies above the other three. It illustrates the effect of the cumulative impact of a cluster of large central fragments shown in
Figure 10b. The curves for 100 mm and 150 mm are nearly identical, suggesting that at these distances the debris cloud fragments have sufficiently dispersed, impacting the rear wall individually, resulting in nearly the same deepest craters. This allows the assumption that a further increase in stand-off will have a limited effect on the bumper’s protective performance.
The obtained results indicate that projectile shape has a significant impact on the outcome of hypervelocity impacts. This finding highlights a key limitation in current industry practices and standards, which rely on spherical projectiles to evaluate the effectiveness of orbital debris shielding. However, since actual orbital debris fragments exhibit non-spherical geometries, this creates a disconnect between experimental conditions and real-world space environment threats. To ensure these standardized methods accurately reflect real-world threats, it is essential to establish a relationship between actual non-spherical debris fragments and their threat-equivalent spherical counterparts. This approach enables the continued use of spherical projectiles within existing frameworks while ensuring they accurately represent the damage potential of irregularly shaped orbital debris.
To establish a relationship between cylinders of varying
L/
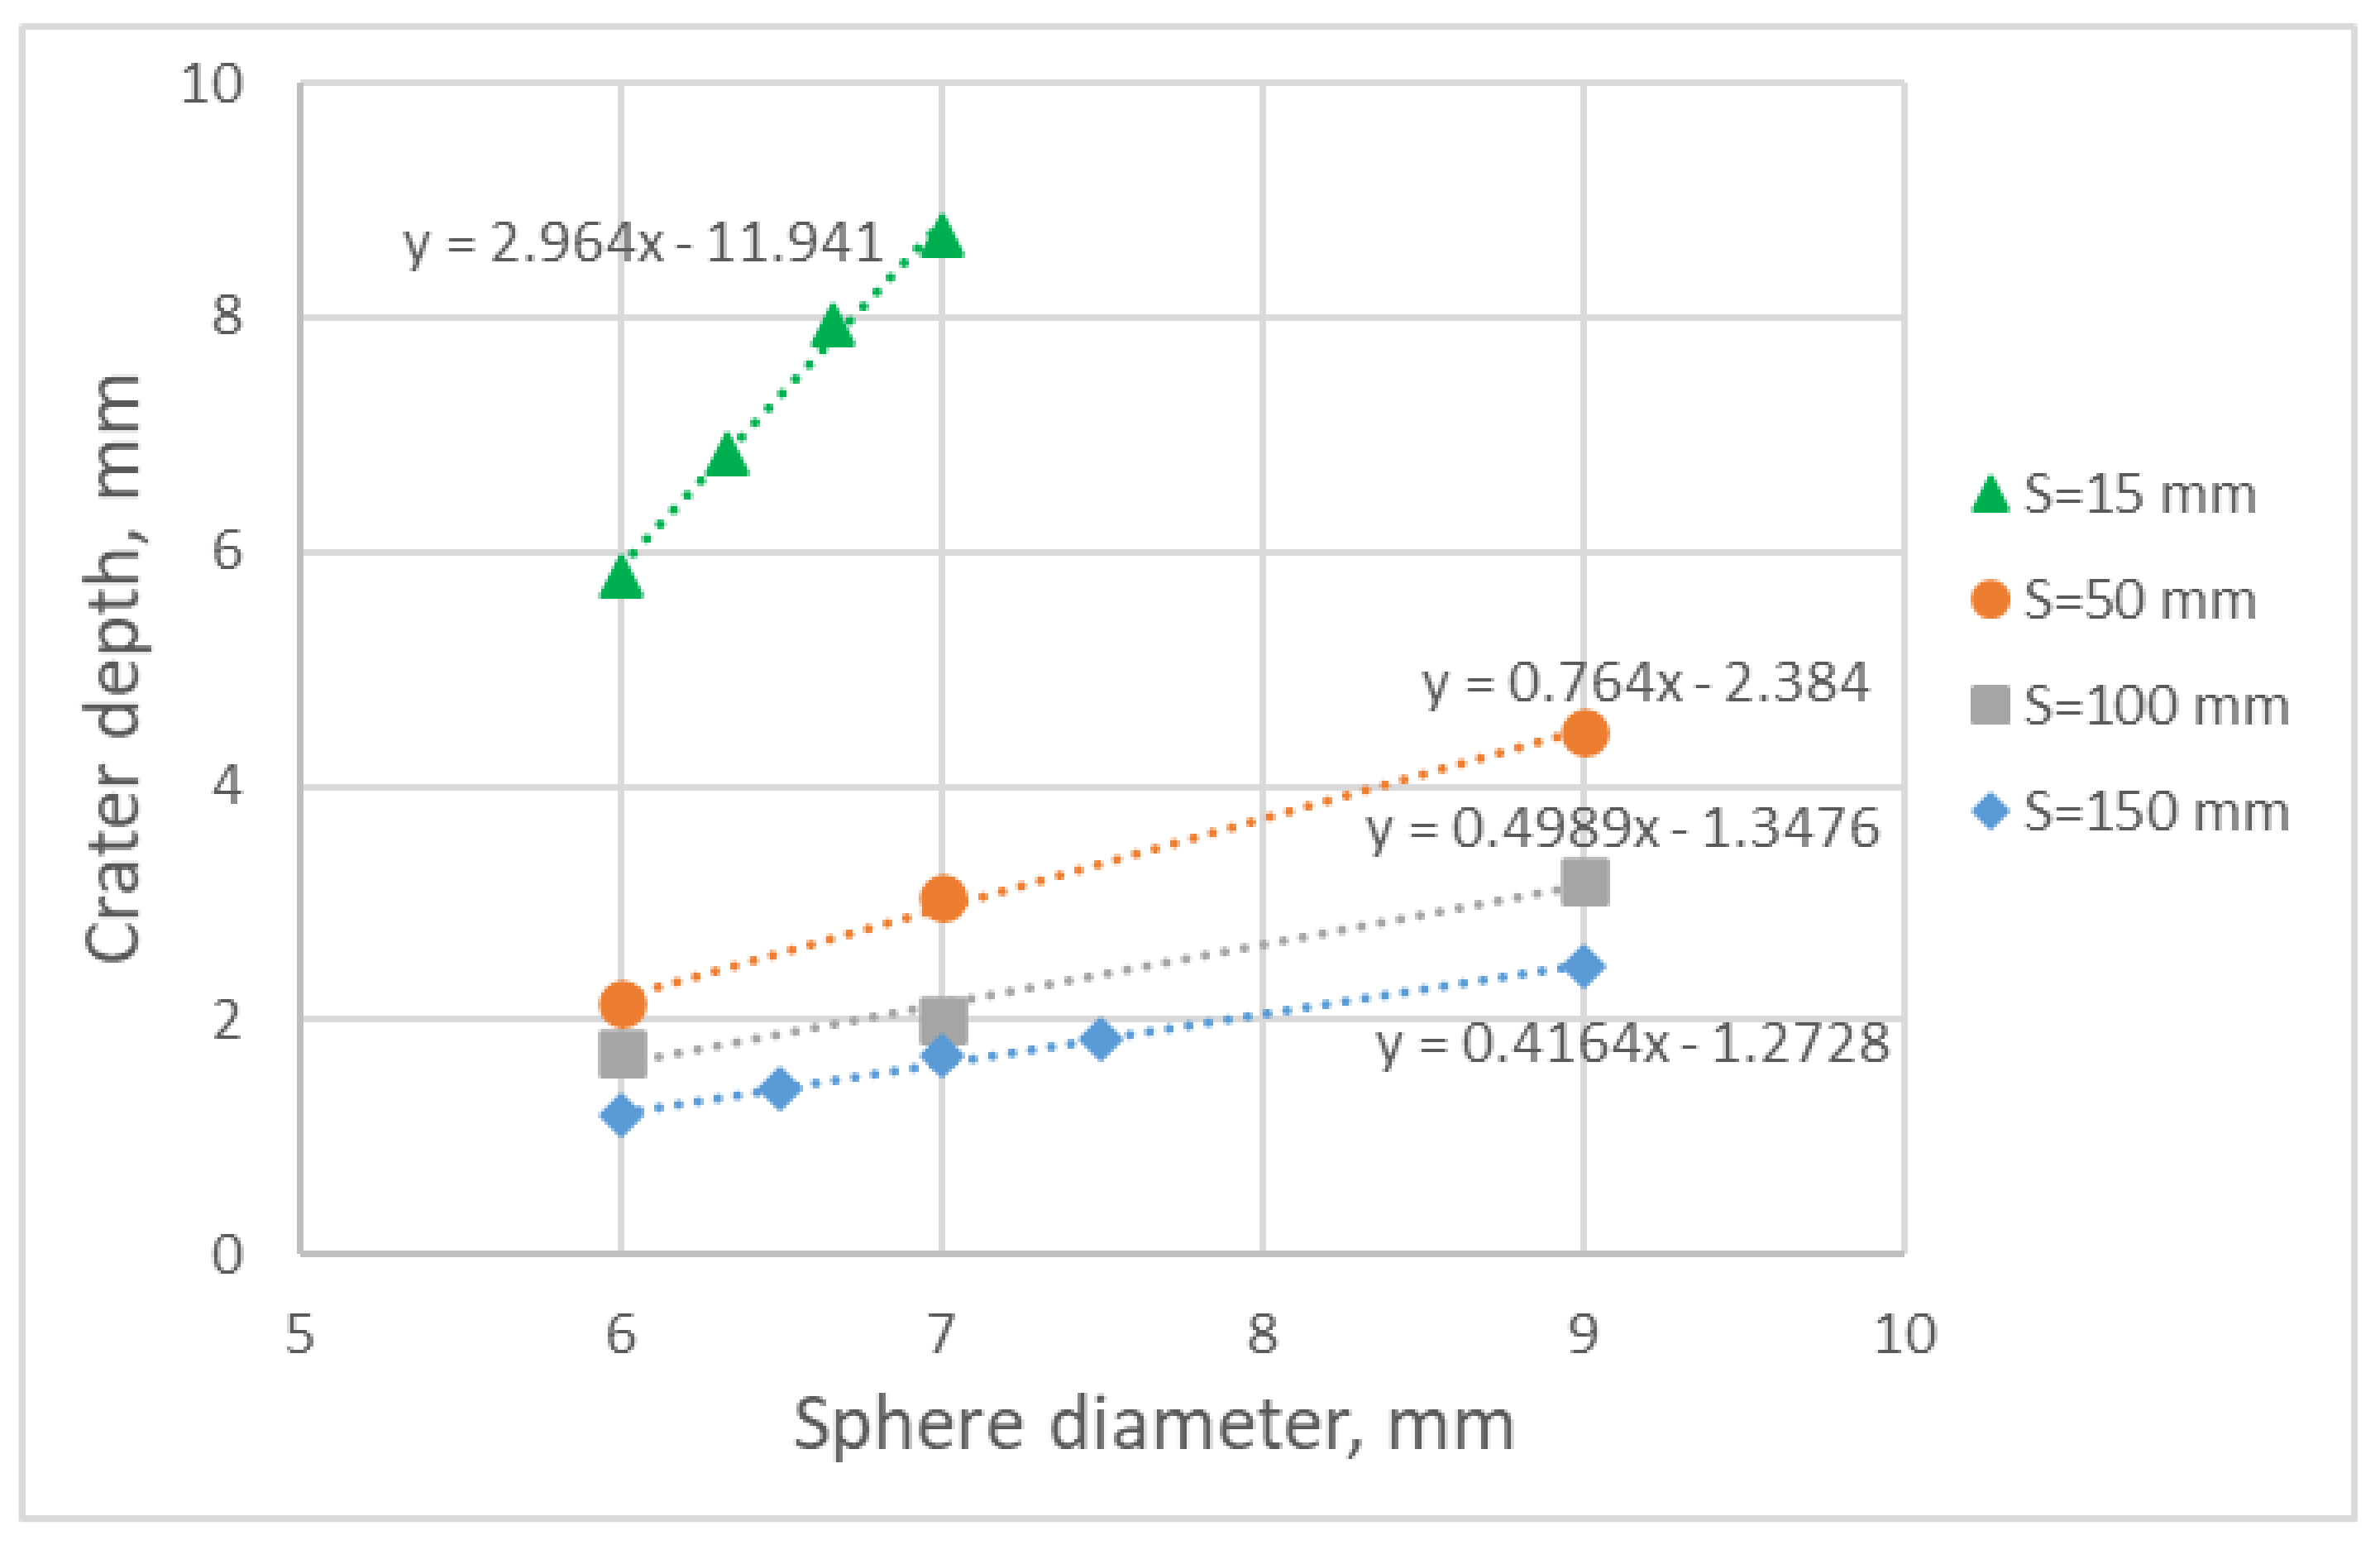
D ratios and their threat-equivalent spherical projectiles, numerical hypervelocity impact tests were first performed using spherical projectiles of progressively larger diameters. For each test, the deepest crater depth was determined and then approximated using linear regression with respect to the sphere diameter. This procedure was repeated for each standoff distance, and the results are presented in
Figure 12.
Subsequently, the previously obtained crater depth data for cylindrical projectiles (
Figure 11) were compared to those for the spherical projectiles (
Figure 12). The working hypothesis is that crater depth can serve as a measure of a projectile’s ability to damage the structure behind the bumper. Accordingly, projectiles that produce identical crater depths are considered threat-equivalent. Based on this criterion, a spherical projectile diameter was identified for each cylindrical projectile that resulted in the same crater depth. The corresponding results for three standoff distances (short, medium, and large) are presented in
Figure 13, which shows the equivalent spherical diameter associated with each cylindrical projectile as a function of its
L/
D ratio.
6. Discussion
Since all the cylinders are of the same mass as a 6 mm sphere, the conclusion from the threat-equivalent results is that there is a significantly increased threat from the difference in shape alone. The established projectile threat relationship can be applied to assess the ability of the MMOD bumpers to withstand non-spherical projectiles by representing them with an equivalent sphere.
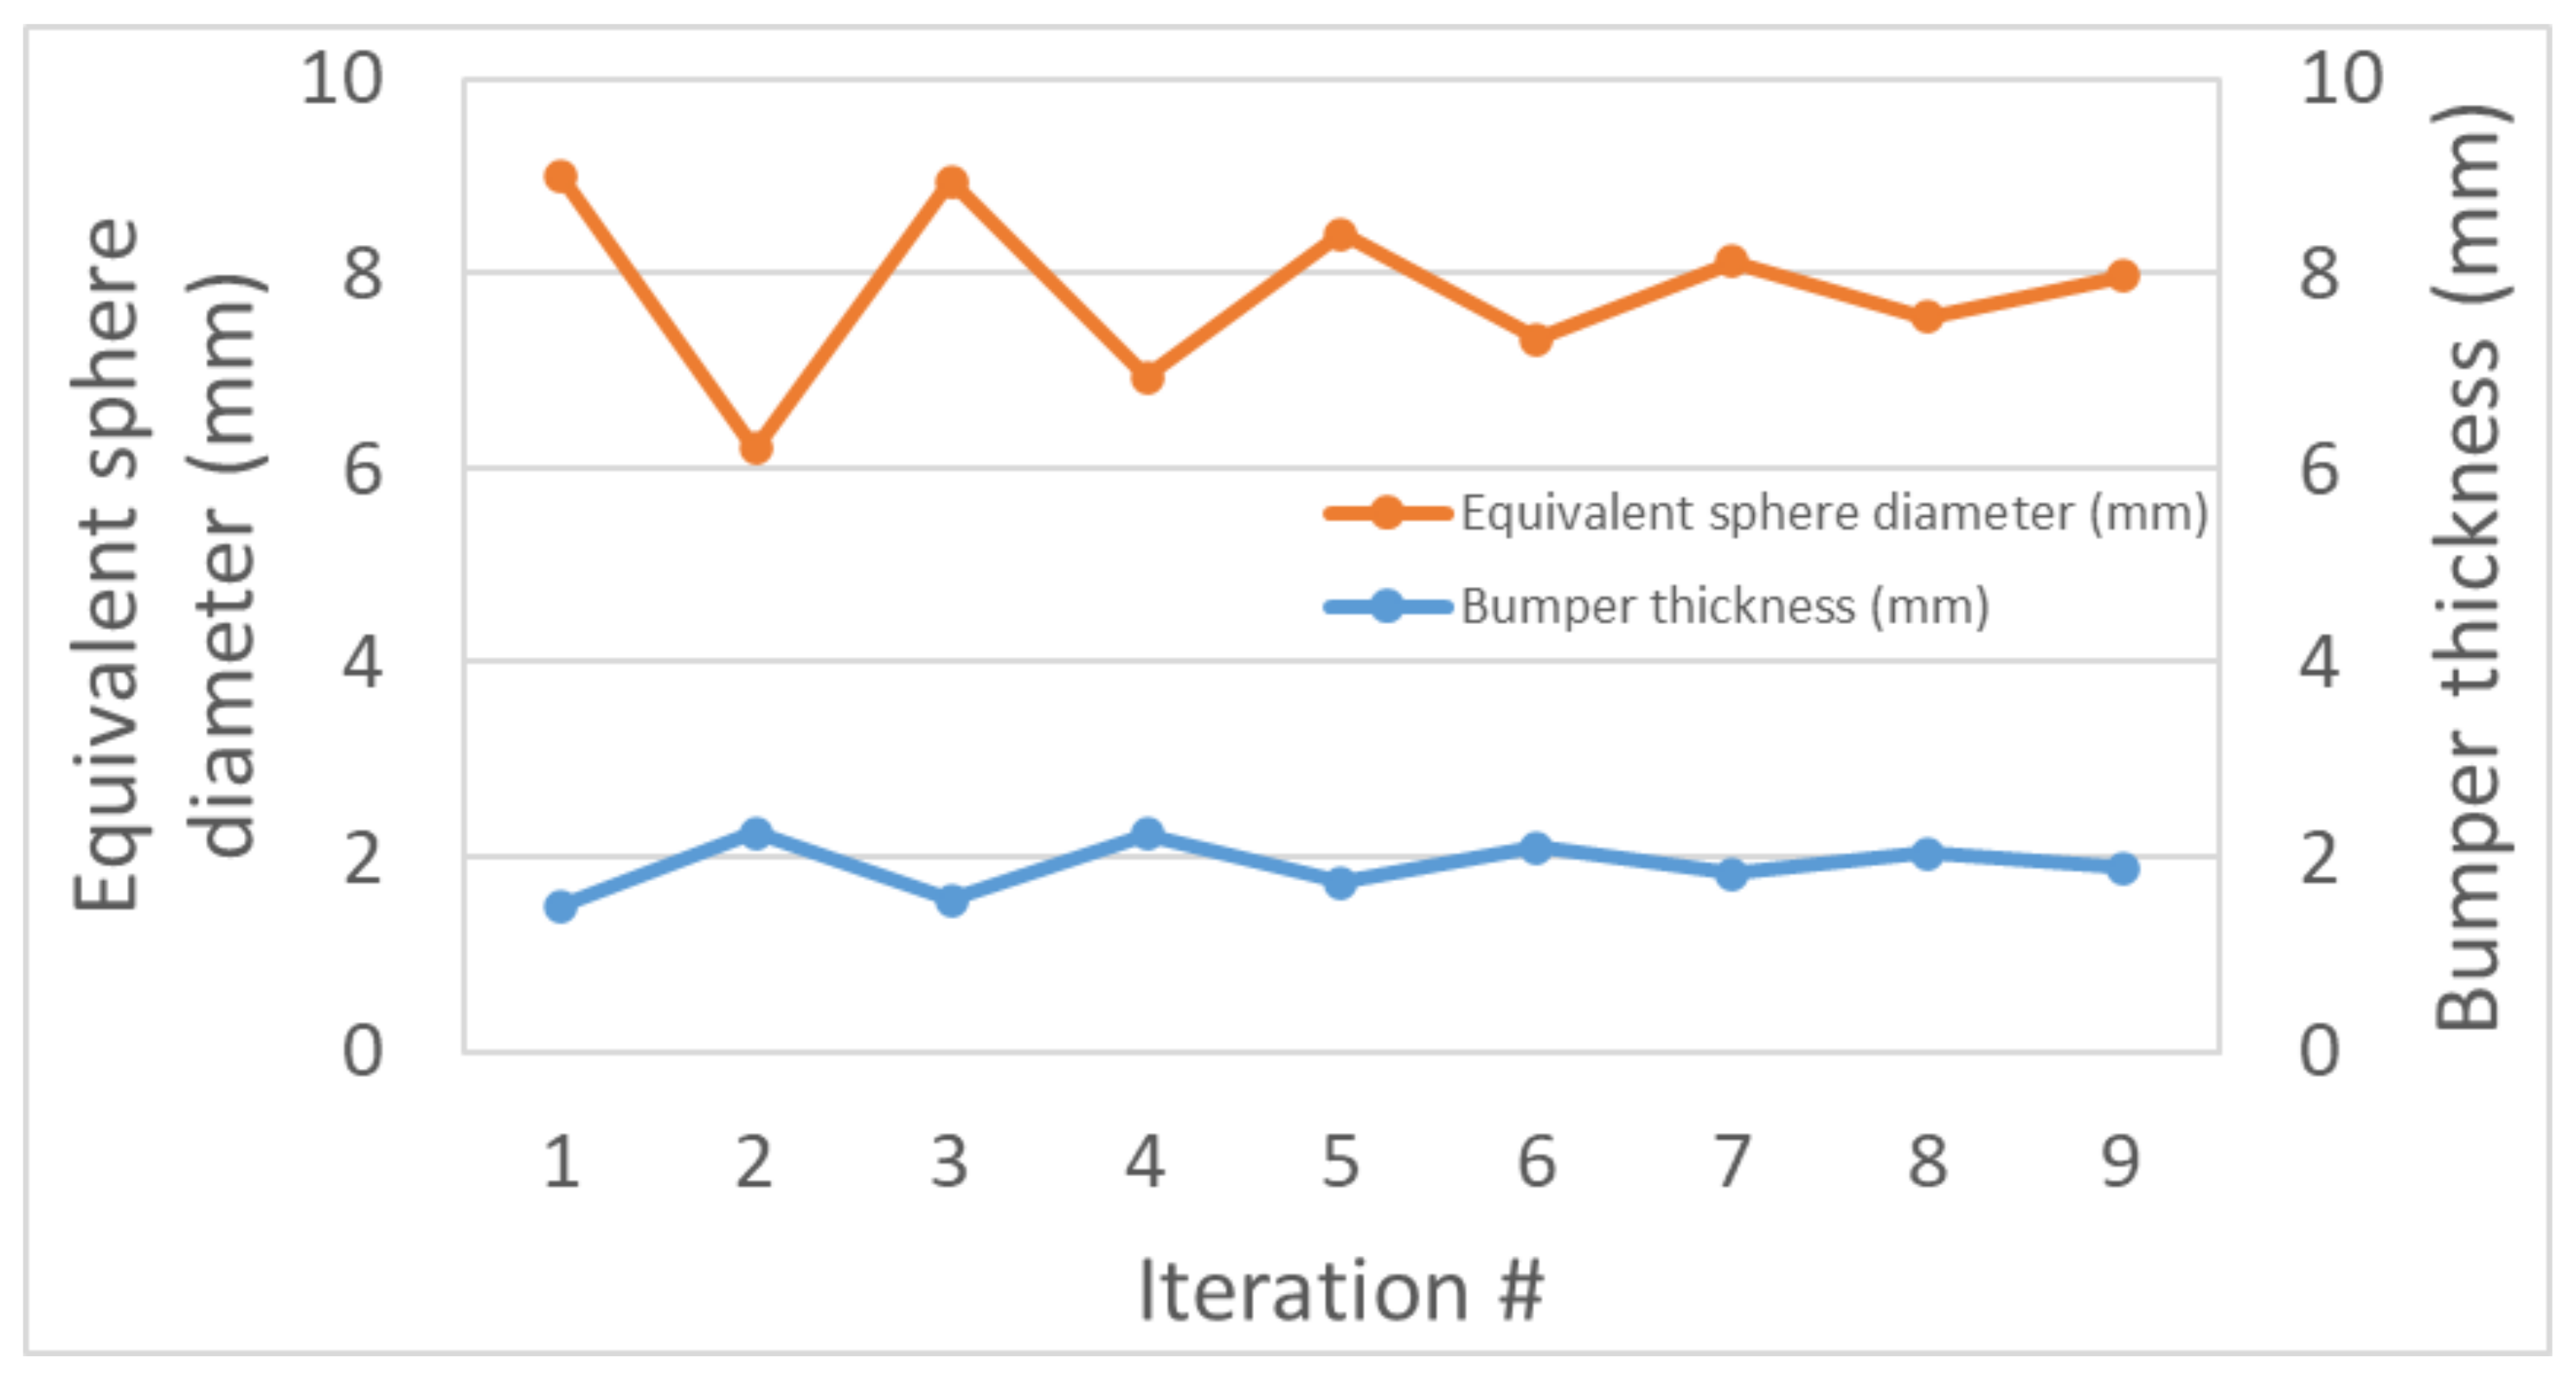
Incorporating the threat-equivalent results into the sizing of shielding is an iterative process. After each modification of the shielding configuration, the diameter of the threat-equivalent spherical projectile is recalculated. That revised diameter dictates the next shielding adjustment, which in turn alters the threat-equivalent dimension yet again. This cyclic process of calculating the equivalent sphere and readjusting the shielding parameters is repeated until convergence is achieved—namely, when the computed threat-equivalent sphere aligns with a shielding configuration proven capable of withstanding its impact.
For a case involving a 1.5 mm bumper at a standoff distance of 150 mm, a cylindrical projectile with
L/
D = 2/3 and the mass of a 6 mm sphere was found to be threat-equivalent to a 9 mm sphere (
Figure 13). This result is valid specifically for the initial bumper thickness of 1.5 mm—one-quarter of the 6 mm reference diameter. To accommodate the increased size of the threat-equivalent sphere, the bumper thickness must be adjusted accordingly. Variations in bumper thickness influence the characteristics of the resulting debris cloud and, consequently, alter the diameter of the corresponding threat-equivalent sphere. Imposing the requirement that the bumper thickness remain one-quarter of the threat-equivalent diameter, successive iterations converged to a bumper thickness of 1.93 mm and a threat-equivalent sphere diameter of 7.8 mm, yielding a thickness-to-diameter ratio of 0.246. The iterative procedure is illustrated in
Figure 14.
Thus, standard shielding design methodologies for spherical projectiles can be extended to non-spherical debris by identifying and applying their threat-equivalent spherical counterparts. Once the shielding design is finalized and the corresponding threat-equivalent sphere is identified, further numerical and physical testing can proceed using the threat-equivalent spherical projectile. This approach helps reduce uncertainty and improve spacecraft protection against irregularly shaped orbital debris.

