Abstract
Current passive anti-rollover systems exhibit inadequate adaptability to complex operational environments. Additionally, due to unidentified critical factors driving rollover incidents during landing, the design of active anti-tipping systems for airdrop remains constrained. Given the foregoing circumstances, this paper divides the landing impact process of the vehicle into the airbag cushioning stage and the rigid collision stage. In the airbag cushioning stage, a vertical impact test bench and a fluid–structure interaction (FSI) model is built up to obtain the terminal impact velocity when the airbag’s touching down speed is set as around 8 m/s. An oblique impact test bench and a dynamic model are proposed to investigate the influence of terminal sideslip angles and impact velocities on the vehicle’s roll/pitch stability during the rigid collision phase. Experimental and numerical analyses reveal that the peak overload during the airbag cushioning stage reaches approximately 11 g while the terminal impact velocity in this stage is around 2 m/s. In the rigid collision stage, higher initial descent velocities amplify the peak roll angles and significantly compromise the roll stability. Notably, adjusting the terminal sideslip angle from 90° to 0°/180° triples the critical horizontal velocity threshold from 5.3 m/s to 14.7 m/s which markedly enhances the vehicle’s stability. To address this, an active sideslip angle control system activated at a 250 m altitude is developed to align the vehicle’s horizontal velocity vector with its longitudinal axis to nearly 0°/180° and thus improves the roll/pitch stability. This study establishes a technical foundation for the design of a highly reliable anti-rollover device for the airdrop vehicle.
1. Introduction
The ongoing evolution of modern vehicle systems toward enhanced protection abilities, multi-functional capabilities, and high intelligence has led to a continuous increase in the overall weight of these systems. While developing heavy vehicles weighing over 2 tons, there is also an urgent need to research the accompanying airdrop stabilization and safety technology [1]. In the past, a lot of previous studies have studied the stability of the projectile–parachute system before landing based on dynamic simulations and experiments [2,3,4,5,6,7,8,9]. Doherr et al. [10] developed a 9-degree-of-freedom (DOF) computer program for the simulation of the trajectory and the dynamic behavior of the parachute system. Dobrokhodov et al. [11] built up a 6-degree-of-freedom dynamic model of a guided circular parachute. Guglieri [12] established the dynamics model of a parachute–payload system during the terminal deceleration phase. The results presented for a realistic case study confirm the validation of their simulation outputs. Neuhaus et al. [13] developed a Generic Multibody Parachute Simulation Model to completely analyze the performance of the vehicle. Avanzini et al. [14] conducted the multibody analysis of the system formed by an entry vehicle and a parachute. They also investigated the most important factors that characterize the final phase of an entry trajectory. Gao et al. [15] developed a new fluid–structure coupling model to predict both the opening phase of parachute and the trajectory of payload during airdrop mission in low altitude. The opening performances of the parachute at different airdropping velocities are analyzed and compared with the experimental results. The results show that, in a finite mass inflation scenario, their coupling model is efficient enough to predict the dynamics behaviors of parachute–payload system. Gao et al. [16] investigated the inflation behavior of a disk-gap-band parachute using the arbitrary Lagrangian–Euler (ALE) penalty coupling method. The results of the airdrop test demonstrate the validation of their model.
However, landing anti-rollover technology serving as a critical stability metric and directly characterizes the dynamic equilibrium of airdrop systems during touchdown has not triggered too much attention. Up to now, the current airdrop systems exhibit significant sensitivity to environmental variables. Furthermore, existing passive anti-rollover devices demonstrate insufficient attitude adaptability to match complex operational environments. According to statistics, the current probability of an airdrop rollover is about 6%.
In recent years, the most widely used method to improve the landing stability of the airdrop vehicle is the application of the airbag [17,18]. Some previous studies tried to analyze the airbag’s buffer characteristics through finite element simulation and experiment [19,20]. For example, Li et al. [21] investigated the cushioning characteristics of self-inflating airbags through indoor drop tests. Results showed that the maximum internal pressure in the airbag increases proportionally with both landing velocity and payload mass while peak acceleration is directly proportional to landing velocity but inversely proportional to payload mass. Focusing on an omni-directional airbag with multi-chamber, Wen et al. [22] built up a validated finite element model to simulate its soft-landing process. Key design parameters were analyzed for their effects on cushioning performance. Results indicated that reducing initial pressure and increasing airbag/vent diameters significantly lowered peak acceleration while diaphragm hole diameter had minimal impact. Wang et al. [23] conducted the multi-objective optimization of an airbag landing attenuation system for heavy airdrop based on the multi-dimensional response surfaces method. The results show that the optimization method presented in their paper is a practical tool for the optimization of an airbag landing attenuation system for heavy airdrops. Lian et al. [24] conducted a study on the cushioning performance during airdrop scenarios, utilizing LS-SDYNA to analyze the impacts on both rigid and soil ground surfaces. The findings revealed that when the airdrop system impacts the ground strictly in a perpendicular manner, the disparity in the maximum overload experienced by the cargo between the rigid ground and soil ground cases is minimal. Yang et al. [25] addressed the challenges of high cost, long duration, and high risk in airborne vehicle airdrop testing by developing a dynamic finite element model to simulate the landing buffer process of a vehicle-airbag system. They found that under normal conditions, the vehicle’s top deck experienced the highest average peak acceleration (11.31 g) with structural stress meeting design requirements. Liu et al. [26] proposed an approximation non-linear interval number programming (A-NINP) method to obtain the optimal buffering characteristics of a landing airbag in manned airdrop. The results indicate that their method can lead to better buffering characteristics of landing airbags and ensure the safety of astronauts. He et al. [27] proposed a hierarchical updating method for finite element model of airbag buffer system under landing impact. They validated their method through experiment. Fu et al. [28] developed a finite element (FE) model of an airborne armored vehicle-airbag system to simulate the landing impact process. Their findings indicated that when the vertical landing speed is less than 8 m/s, the vehicle body does not experience plastic strain and its strength satisfies the airdrop requirements. Zhang [29] built up a thermodynamic analytical model as well as a finite element model (using the CV method) to study the landing buffer characteristics of an unmanned airdrop rescue vehicle. The results demonstrated that the airbag buffer effectively reduced system overload from 35 g to 22 g, achieving a significant 37.1% reduction in peak acceleration and a 45.2% decrease in cargo platform stress. He et al. [30] evaluated the cumulative damage to an airdrop vehicle hull during landing by integrating virtual prototype technology, finite element analysis, and the Lemaitre damage model. Results revealed a linear relationship between the damage variable and the number of landings. Fu et al. [31] built up a finite element method to analyze the landing buffering adaptability of a manned armored vehicle. They validated their method through a typical airdrop experiment. According to their simulation, the airbag buffer system can help manned armored vehicle realize an effective buffer when the vertical landing speed is less than 9 m/s at an altitude up to 3000 m.
Apart from evaluating the buffer characteristics based on the overload, there are also several studies that shed light on the dynamic stability of the vehicle with airbag buffering system [32,33]. Zhang et al. [34] developed a 10-degree-of-freedom dynamics model using Kane’s method to analyze the vibration response of an airdrop vehicle during landing. Key findings indicate that the suspension and wheel compressions are primary vibration sources with suspension impacts at maximum displacement causing significant acceleration spikes. Niu et al. [35] investigated the cushioning characteristics of a double-chamber airbag system for heavy equipment recovery by developing an analytical model integrating dynamic equations, thermodynamic principles, and exhaust flow equations. Results indicate that increasing initial pressure reduces peak impact overload but raises landing velocity. Also, a higher secondary-to-primary chamber volume ratio lowers peak overload at the cost of increased landing speed.
Despite the above studies, most of the previous work only involves in the ground test or simulation, the uncertainty and complexity of the wind field in the actual airdrop process have not been taken into account. In particular, the key factors causing the landing rollover phenomenon are unclear. There is a lack of quantitative landing stability evaluation methods, which cannot effectively guide the design of anti-rollover devices for airdrop systems.
In view of the above situation, this article starts with dividing the landing impact process of the vehicle into two stages in Section 2: the airbag cushioning stage and the rigid collision stage. In the airbag cushioning stage, a vertical impact test bench and a fluid–structure interaction (FSI) model is built up to obtain the terminal impact velocity in typical airdrop mission. In addition, an oblique impact test bench and a dynamic model is proposed in the following rigid collision stage. After the impact mechanism analysis, a terminal sideslip angle active control system is built up to help increase the vehicle’s landing attitude stability. In Section 3, this work successfully achieves the terminal impact velocity through both the experiment and the fluid–structure iteration (FSI) model. Then, through the dynamic simulation model and the corresponding experiment, the effect of the terminal sideslip angle and the terminal impact velocity on the vehicle’s roll/pitch angle is uncovered. Afterwards, at the landing time, the angles between the vehicle’s horizonal velocity vector and its longitudinal axis are regulated to around 0°/180° under the assistance of the terminal sideslip angle active control system. Finally, several conclusions are drawn in Section 4.
In general, this work studies the influencing factors of landing rollover in heavy vehicle airdrop systems (e.g., jeep or truck) and researches the active attitude adjustment anti-rollover control technology, laying a technical foundation for the engineering design and application of adaptive, highly reliable active attitude adjustment anti-rollover devices for heavy airdrop system during their airdrop process.
2. Materials and Methods
2.1. Experimental and Numerical Method in Airbag Cushioning Stage
To study the rollover phenomenon caused by the impact of the vehicle on the ground at the end of the airdrop, this paper tries to conduct experiments and simulation analyses in two steps: the airbag cushioning stage and the rigid collision stage.
In the first stage, the vehicle assembled with the airbag touches the ground and the gas inside the airbag is rapidly compressed. When the air pressure inside the airbag exceeds the predetermined pressure of the exhaust hole, the airbag begins to deflate until the internal gas is almost completely expelled. Upon the main airbag becoming nearly empty, the airbag loses its buffering effect and the descent speed of the vehicle that has not been buffered is defined as the terminal impact velocity ().
For obtaining the magnitude of the terminal impact velocity, a vertical impact test bench is plotted in Figure 1. When fully deployed, the under-vehicle airbag reaches a height of 1.2 m. The weight of the vehicle is 7600 kg and the ground coordinate is defined in Figure 1. In addition, the angle between the vehicle’s heading (longitudinal axis) and its horizontal velocity vector is defined as the sideslip angle (). When the vertical landing impact test bench works, the vehicle is lifted by a cable to a height of 3.2 m and then conducted free fall afterwards to ensure a ground touching speed of about 8 m/s (typical touchdown speed in the airdrop mission).
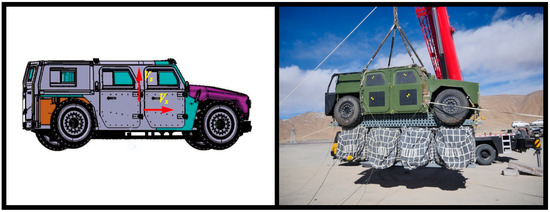
Figure 1.
Geometry of the vehicle in the vertical impact test.
Afterwards, an accelerometer (MPU9250) is used to record the vehicle’s overload (the acceleration of the vehicle divided by the acceleration of gravity) curve as shown in Figure 2 wherein the accelerometer’s measurement range is ±16 g (g means the acceleration of gravity). The microcontroller unit (MCU) is powered by a 7.4 V battery and stores the acceleration data measured by the accelerometer. The velocity and displacement curves are then calculated by the acceleration curve (proportional to the overload curve) through integration. Through analyzing the velocity and displacement curves, the terminal impact velocity can be obtained.
where the and mean the exhaust flow coefficient and gas leakage coefficient, and stand for the exhaust port area and leakage area, and mean the pressure inside and outside of the airbag, means the universal gas constant, is the temperature, is the specific heat ratio. Equations (1) and (2) come from the theoretical manual of LS-Dyna R13 Software.
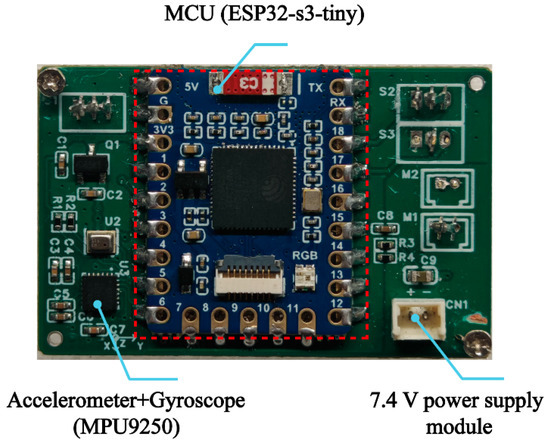
Figure 2.
The acceleration measurement chip.
Apart from the above experiment measurement devices, this study also proposes a fluid–structure interaction (FSI) model to simulate the vehicle’s impact process. The buffer airbag of the airdrop system is fixed to the vehicle through the front and rear beams and modeled based on the control volume (CV) method. Since the complex contact model between the buffer system and the vehicle has little impact on the finite element analysis, the front and rear beams of the buffer system are simplified as part of the vehicle model. Also, the impact of the vehicle’s gun barrel on the calculation of airbag buffering process is minimal. Therefore, the gun barrel is deleted for simplicity. At the beginning of the simulation, the height of the base plate from the ground is set to 0.751 m and the vehicle falls freely at an initial speed of 7.02 m/s so that the speed at which the base plate contacts the ground is around 8 m/s. The meshes of the vehicle as well as the airbags are plotted with the Hypermesh 13.0 software as shown in Figure 3. The total cell numbers for the vehicle, airbag, and ground are 500,000.
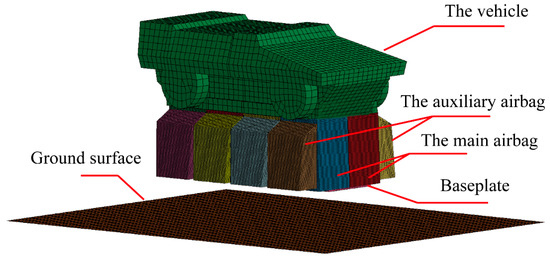
Figure 3.
Mesh definition of the vehicle as well as the airbags.
In addition, in this simulation model, the airbag exhaust port is usually bonded with nylon buckles and the deflation pressure is very low. Thus, the default deflation pressure of the exhaust port is assumed to be the ambient pressure . When the pressure inside the airbag () is higher than , the mass flow through the vents and leakage can be expressed using Equations (1)–(3). Wherein, means vent orifice coefficient, is the vent orifice area, means the orifice coefficient for leakage, is the area for leakage, is the ideal gas constant, stands for the specific heat of gas (equals to 1.4 for air), denotes the internal temperature of the airbag gas. The main bag’s exhaust hole area is set as 0.018 m2 while the auxiliary bag’s exhaust hole area is set as 0.028 m2. Both the main bag’s vent hole area and the auxiliary bag’s vent hole area are given as 0.030 m2.
2.2. Experimental and Numerical Method in Rigid Collision Stage
Right after the airbag cushioning stage, the second stage starts when the bottom surface of the vehicle touches the ground. In that case, the vehicle collides with the ground directly and may cause the rollover or forward-backward flipping along the pitch axis as shown in Figure 4. The analysis in this step can also be divided into experiment study and numerical study.

Figure 4.
The oblique impact test. (a) The oblique impact test bench; (b) The angle between the horizontal velocity and the longitudinal direction of the vehicle.
In the actual airdrop process, due to the influence of wind, the vehicle has a certain horizontal velocity at the start of the rigid collision stage. The initial vertical descent velocity is equal to the terminal impact velocity at the end of the airbag cushioning stage. In this work, the vertical and horizontal movements of the airdrop system are treated as two independent parameters, while the initial pitch angle is assumed to be zero during the rigid collision stage. The differences in the vertical deformation of each airbag are neglected.
Thus, on one hand, the structure of the oblique impact test bench is plotted in Figure 4. Unlike the experiment instruments in Figure 1, the oblique impact test bench gives the vehicle a horizontal velocity (). The angle between the longitudinal direction and the horizontal velocity vector when the bottom surface of the vehicle touches the ground is defined as the terminal sideslip angle ().
On the other hand, using the terminal impact velocity at the end of the airbag cushioning stage as the initial descent velocity for the collision process, the collision process between the vehicle and the ground under different terminal sideslip angle () was calculated based on an ADAMS model. The critical horizontal velocities leading to the rollover (or backward/forward flipping) phenomenon under different terminal sideslip angles are then obtained to be an evaluation index for the anti-rollover performance of the vehicle. In the ADAMS model, the parameters setting for the calculation of normal force and friction force are listed in Table 1 where the moments of inertia are defined in body axis.

Table 1.
Normal force and friction force parameters’ setting in impact dynamic simulation.
2.3. Setup of the Terminal Sideslip Angle Active Control System
Since the terminal sideslip angles affect the landing attitude stability, it is fundamental to design certain control systems to achieve certain terminal sideslip angles and help increase the landing attitude stability. As shown in Figure 5, the micro controller unit (MCU) used in the control system is the STM32F407 chip manufactured by O1 studio. The wind sensor powered by an independent 12 V battery (manufactured by GT electronics technology) is connected to the MCU through transistor-transistor logic (TTL) serial communication, while the UB 482 module used to obtain the high precision orientation of the vehicle is connected to the MCU through UART port. The GPS receiver embedded in UB 482 module can receive satellite signals and calculate the current position and velocity of the vehicle in real time to provide initial position information and gyro drift correction; magnetometers embedded in UB 482 module can be used for initial heading alignment and gyro heading drift correction.
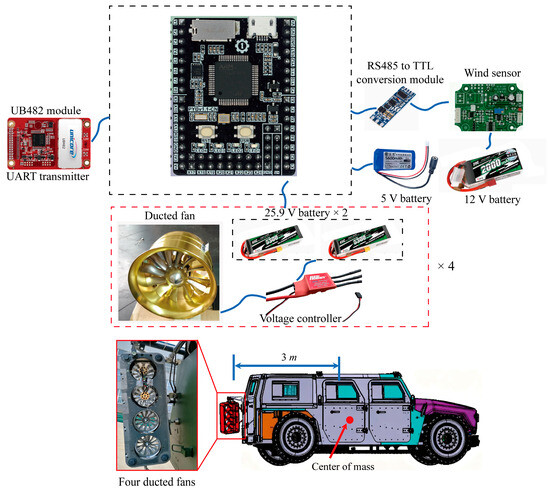
Figure 5.
Hardware system of the Active control system.
To guarantee enough steering torque, two 150 mm ducted fans are connected in parallel to form a thrust generation group. Also, since the forward and reverse rotation speeds of ducted fans are different under the same voltage, two thrust generation groups aligned in opposite direction are needed in total. For each ducted fan, two 25.9 V batteries and one voltage controller are needed. The 25.9 V battery’s capacity is 6000 mAh and its maximum current is 189 A. With a single operation time of 2–3 min, it can be repeatedly charged and used, meeting the requirements of small size and light weight.
3. Results and Discussion
3.1. Analysis of Vertical Falling Test and Buffering Simulation
By using the simulation model built up by LS-DYNA R13 software, as depicted in Figure 3, the vehicle’s airbag cushioning process is simulated and plotted in Figure 6. As shown in Figure 6, the bottom of the airbag touches the ground when t = 0.1 s and significant airbag leakage is observed at 0.3 s. Upon the time exceeding 0.4 s, the main airbags are almost empty despite there still being some compressed gas within the auxiliary airbag.
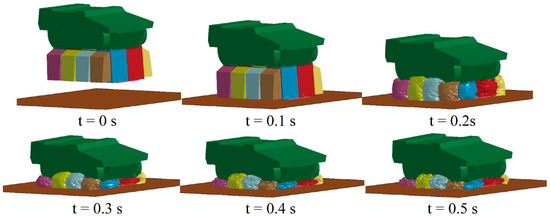
Figure 6.
The LS-DYNA simulation animation for the vertical impact process of the vehicle.
In addition, the simulated overload curves, velocity curves and displacement curves are given in Figure 7. Within the first 0.1 s, the bottom of the airbag does not encounter the ground, and the overload is −1 g (caused by gravity). After 0.1 s, the force of the airbag on the vehicle gradually increases with the gas compression and provides an upward acceleration to the vehicle. Then, the downward velocity of the vehicle rapidly decreases accordingly. At t = 0.32 s, the vehicle collides with the ground and its overload reaches the peak (11.2 g) during the entire buffering process. It is noted that the displacement is defined to be zero when the bottom of the airbag touches the ground.
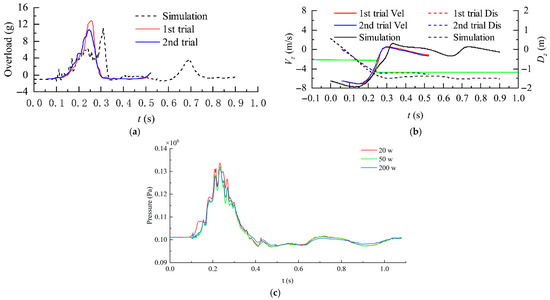
Figure 7.
The history curves of the overload, velocity, and pressure inside the main airbag. (a) Comparison of the overload between the simulation and experiment; (b) Comparison of the vertical velocity between the simulation and experiment; (c) The pressure inside the single airbag under different mesh density.
Based on the test instruments introduced in Figure 1, two vertical falling tests are also included, as shown in Figure 7. The peak overloads in the first trial and the second trial are 12.9 g and 10.8 g, respectively. The differences between the simulated peak overload and experimental overloads are −13.2% and 3.7%. Obviously, from the peak overloads, the experiment results prove the reliability of the FSI buffering simulation model built up in this study. It is apparent that the experimental curves and simulation curves show similar trend despite the experimental peak overloads occurring earlier. According to the experiment results in Figure 7, the vehicle collides with the ground when t = 0.25 s. At that time, the displacement of vehicles was −1.2 m (equal to the height of the under-vehicle airbag) and the downward velocity is about 2 m/s. Thus, the terminal impact velocity is obtained as 2 m/s. By comparing the pressure inside the single airbag, the grid impendence study is conducted as shown in Figure 7c. According to Figure 7c, the curves of the pressure inside the single airbag obtained by 50 w cells and 200 w cells show good consistency, which means 50 w cells are enough for the fluid–structure-interaction simulation.
3.2. Analysis of Oblique Falling Test and Collision Simulation
Although the terminal impact velocity is 2 m/s according to the experiment in Section 3.1, in the rigid collision stage, the randomness may cause a small range of variation in the initial descent velocity around 2 m/s. Thus, it is important to analyze the effect of the initial descent velocity () on the roll stability of the vehicle. In this analysis, the initial descent velocity () ranges from 0.5 m/s to 3 m/s while the initial horizontal velocity () ranges from 0.5 m/s to 4.5 m/s as shown in Figure 8. For all the cases in Figure 8, the terminal sideslip angle () are set as 90°. According to Figure 8, it is observed that the increase in the initial descent velocity can increase the peak roll angles increase and reduce the roll stability of the vehicle. Also, the peak roll angles increase dramatically with the increase in the initial horizontal velocity. When the initial horizontal velocity is as small as 0.5 m/s, the roll angle peaks stay at nearly zero. This means the initial horizontal velocity is the most important factor affecting the roll stability of the vehicle.
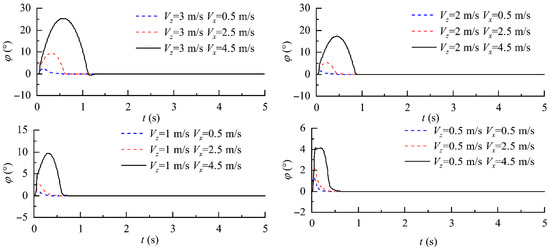
Figure 8.
The history curves of the roll angles under different initial descent velocity.
Thus, in the next step, the effect of the initial horizontal velocity () on the roll stability of the vehicle tries to be uncovered through simulation results. The terminal sideslip angle () is set as 90° for all cases in Figure 9. It is found that the peak roll angle grows to about 30° when the initial horizontal velocity is 5 m/s. If further increasing the initial horizontal velocity to 7 m/s, the vehicle starts to rollover. The roll angle continues growing to about 200° before it decreases. Upon the initial horizontal velocity () even increases to 11 m/s, the vehicle can complete a 360° rollover.

Figure 9.
The history curves of the roll angles under different initial horizontal velocity.
Afterwards, to obtain a general trend, peak values in the roll angle curves under different cases are listed in Table 2. It is obvious that the larger initial horizontal velocity would cause larger peak roll angle. It is noted that if the terminal sideslip angle is 0° or 180°, the vehicle can bear quite large initial horizontal speed and maintain its roll stability. Apart from the cases under 0° or 180° terminal sideslip angle, when the initial horizontal velocity exceeds 11 m/s, the vehicle will roll over with no doubt. In addition, the cases under 90° terminal sideslip angles are more prone to roll over. Upon the peak roll angle reaching about 30°, the corresponding initial horizontal velocity in that case has almost approached the critical stability threshold. If the initial horizontal speed continues to increase, it will inevitably lead to the vehicle rollover.

Table 2.
Peak values in the roll angle curves under different cases.
Although the vehicle shares very good roll stability when the terminal sideslip angle is 0° or 180°, it does not mean the vehicle can sustain its pitch stability with huge initial horizontal speed. As listed in Table 3, contrary to the trend of roll stability, the vehicle’s pitch stability is stronger when the terminal sideslip angle is 90°. Upon 0°/180° terminal sideslip angle is achieved; the peak pitch angles can reach about 30° under 13 m/s initial horizontal speed. Apart from the cases with 0°/180° terminal sideslip angle, the other cases in Table 3 share a relatively small peak pitch angle and the vehicle is more prone to losing its roll stability compared to the pitch stability.

Table 3.
Peak values in the pitch angle curves under different cases.
To verify the reliability of the dynamic simulation analysis mentioned above, several experiments are conducted to test the critical initial horizontal velocity under 90° terminal sideslip angles based on the system provided in Section 2.2. In the experiment, if the vehicle rolls over 4 out of 7 repetitions at a certain initial horizontal velocity, it is considered that the vehicle will roll over at that speed. It is noted that the critical horizontal velocities at all sideslip angles are tested once a day and the whole test lasts for 5 days. Then, for each case, the average critical horizontal velocity is calculated according to the 5 days experiment results and dotted in Figure 10. In addition, the error bars are also given in Figure 10. From Figure 10, it is found that the experimental data exhibits excellent agreement with simulation results. Also, the critical horizontal velocity is almost tripled from about 5.3 m/s to 14.7 m/s if adjusting the terminal sideslip angle from 90° to 0°/180°.
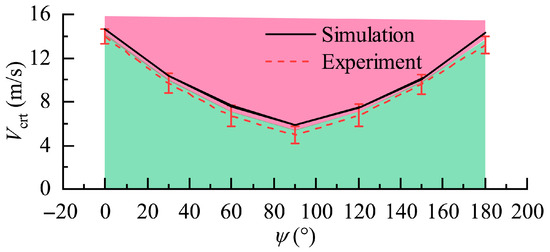
Figure 10.
Comparison between the numerical and experimental critical initial horizontal velocity.
3.3. Active Attitude Adjustment Strategies
By analyzing the suspension method of the airdrop system, the thrust required to adjust the steering of the airdrop system is calculated as follows:
where stands for the moment of inertia, means the angular velocity perpendicular to the ground in radians/second, and are the length and width of the vehicle, as shown in Figure 4. Based on Equations (4) and (5), in order to achieve an angular velocity () of 1.25 revolutions per minute within 6 s for the airdrop system, the required moment (M) can be calculated as . Since the distance between the duct fan center and the vehicle’s center of gravity is , as shown in Figure 5, the required thrust of the ducted fan is around 175 N. A TP5670 480 KV motor is used to drive the 150 mm ducted fan with 10 kg maximum thrust. Thus, two ducted fans are used to generate the needed 175 N thrust. The relationship between the current and thrust of the customized 150 mm ducted fan (improved based on the JP EDF120mm ducted fan) was tested using the digital dynamometer (NK-200), as shown in Figure 11 and Table 4. When lifting the vehicle off the ground and activating the maximum thrust, it is found that the vehicle turns 90 ° after 12 s.
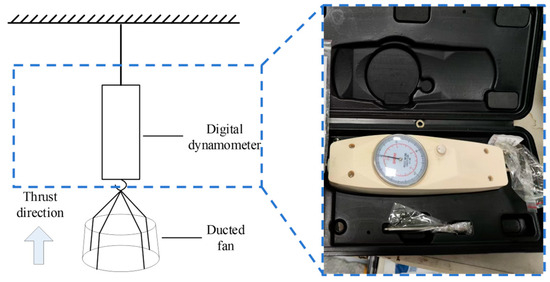
Figure 11.
The thrust test for the 150 mm ducted fan.

Table 4.
Thrust generation of the ducted fan.
According to the above analysis, the vehicle’s stability can be significantly increased if adjusting the terminal sideslip angle to 0°/180°. Thus, in this work, based on the deviation angle (, in degree) between the real-time measured vehicle’s horizonal velocity vector and the its longitudinal axis as well as the angular velocity (, in degree/second) of the vehicle in axis, a PD controller is designed to realize the magnitude and direction control of ducted fans’ thrust so as to achieve 0°/180° terminal sideslip angle. The ducted fan’s rotation speed is adjusted using Equation (6).
wherein, the and parameters are set as 5 and 8, respectively, stands for the ducted fan’s rotation speed in revolutions per minute (RPM). Then, the complete airdrop tests are conducted with the initial airdrop heights are set as 600 m, 800 m, 1000 m, 1200 m, and 1600 m. The terminal sideslip angle active control system starts to work when the vehicle descents to 250 m height. According to Figure 12, during the whole airdrop process, the angular velocity stays at a relatively low level and its magnitude can be kept within about ±15° under the help of the terminal sideslip angle active control system.

Figure 12.
The height as well as the angular velocity during the airdrop test.
When it comes to the variation trend of the vehicle’s longitudinal axis at the landing time as shown in Figure 13, it can be observed that the angles between the vehicle’s horizonal velocity vector and its longitudinal axis get quite close to 0°/180° whatever the initial airdrop height is. Also, the initial height would lengthen the total airdrop time and the terminal sideslip angle active control system works for about 30 s in each airdrop case as shaded in light blue. In fact, shifting the center of mass of the vehicle assembly may improve the effectiveness of the yaw steering contraption. We will study that in our next work.
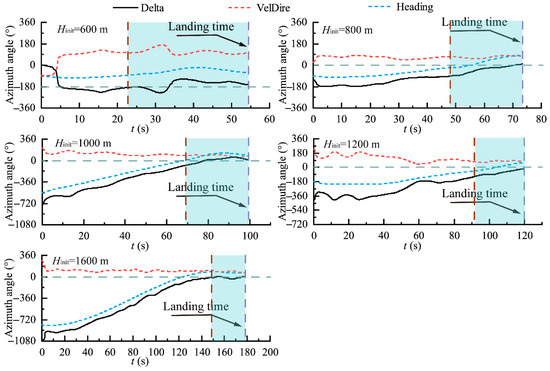
Figure 13.
The variation in the angles between the vehicle’s horizonal velocity vector and its longitudinal axis.
4. Conclusions
In this paper, the experiments and simulation analyses are mainly focused on the vehicle’s roll and pitch stability during the airbag cushioning stage and the rigid collision stage in the airdrop process. In the airbag cushioning stage, a vertical impact test bench and a fluid–structure interaction (FSI) model are built up to study the vehicle’s impact process. The buffer airbag of the airdrop system is modeled based on the control volume (CV) method. In both the numerical model and experiment, the speed at which the bottom of the airbag contacts the ground is around 8 m/s. In the following rigid collision stage, an oblique impact test bench and a dynamic model are proposed. Wherein, the terminal impact velocity obtained in the airbag cushioning stage is given as the initial descent velocity in the rigid collision stage. It is noted that the vertical () and horizontal () movements of the vehicle in body axis are treated as two independent parameters in this study. The initial pitch angle is assumed to be zero during the rigid collision stage and the differences in the vertical deformation of each airbag are neglected. After analyzing the impact process, a terminal sideslip angle active control system is built up to help increase the landing attitude stability. The O1 studio STM32F405 chip is used in the control system as the micro controller unit (MCU). Simultaneously, a wind sensor and a UB 482 module are used to obtain the horizontal velocity vector as well as the longitudinal axis of the vehicle. Four ducted fans and the corresponding PD control algorithm are also applied to adjust the azimuth angle of the vehicle. From the numerical and experimental studies in this paper, the following key conclusions can be drawn:
- In the airbag cushioning stage, the peak overload in simulation and two experiment trials are 11.2 g, 12.9 g, and 10.8 g, respectively. The terminal impact velocity is obtained as around 2 m/s.
- In the rigid collision stage, the increase in the initial descent velocity can increase the peak roll angles increase and reduce the roll stability of the vehicle. The peak roll angles increase dramatically with the increase in the initial horizontal velocity. Although the vehicle shares very good roll stability when the terminal sideslip angle is 0° or 180°, it does not mean the vehicle can sustain its pitch stability with huge initial horizontal speed. The critical horizontal velocity almost tripled from about 5.3 m/s to 14.7 m/s if turning the terminal sideslip angle from 90° into 0°/180°.
- With the help of the sideslip angle active control system activated when the vehicle reaches 250 m height, the angular velocity can be kept within a relatively small value. Also, at the landing time, the angles between the vehicle’s horizonal velocity vector and its longitudinal axis get quite close to 0°/180° whatever the initial airdrop height is. It means that the vehicle can maximize its critical horizonal velocity.
To summarize, this work analyses the roll/pitch stability of the vehicle during the airbag cushioning stage and the rigid collision stage and draws several theoretical conclusions. Then, a sideslip angle active control system is built up to improve landing stability according to the theoretical conclusions. This study establishes a technical foundation for the design of a highly reliable anti-rollover device capable of active attitude adjustment for the airdrop vehicle. In fact, the current airdrop test data is still insufficient, and the thrust of the ducted fan may have caused a lag in vehicle attitude adjustment. Thus, it is fundamental to further improve the thrust generated by the active attitude control system in the next work.
Author Contributions
Z.L.: Methodology. S.C.: Writing—original draft. X.L.: Validation. Z.Y.: Writing—review and editing. Y.C.: Investigation. M.T.: Funding acquisition. All authors have read and agreed to the published version of the manuscript.
Funding
This research was funded by: the Aeronautical Science Foundation of China (Grant No. ASFC-20230023052001 and ASFC-20220023052001); China Postdoctoral Science Foundation (Grant No. 2024M754237); Science and Technology Plan Project of Wenzhou Municipality (Grant No. ZG2024001); Basic Public Welfare Research Program of Wenzhou (Grant No. G2023046). Wherein, the APC was funded by: China Postdoctoral Science Foundation (Grant No. 2024M754237).
Data Availability Statement
The data presented in this study are available on request from the corresponding author.
Conflicts of Interest
The authors declare that they have no known competing financial interests or personal relationships that could have appeared to influence the work reported in this paper.
References
- Accorsi, M.; Charles, R.; Benney, R. Computer Simulation and Evaluation of Static Line Deployment Procedures. In Proceedings of the 18th AIAA Aerodynamic Decelerator Systems Technology Conference and Seminar, Munich, Germany, 23–26 May 2005; Volume 1631, pp. 23–26. [Google Scholar]
- Avanzini, G.; Guglieri, G.; Torasso, A. Multibody analysis of terminal phase for a reentry vehicle: A comparative study. J. Aircr. 2012, 49, 1940–1952. [Google Scholar] [CrossRef]
- Cheng, W.; Yang, C.; Ke, P. Landing Reliability Assessment of Airdrop System Based on Vine-Bayesian Network. Int. J. Aerosp. Eng. 2023, 2023, 1–20. [Google Scholar] [CrossRef]
- Dai, J.; Zhou, Y.; Zhang, J.; Zhang, M.; Wang, X.; Sun, X. Effects of Different Postures on Crew Damage under the Impact of Manned Airdrop Landing. Explos. Shock. Waves 2021, 41, 015901-1. [Google Scholar] [CrossRef]
- Dobrokhodov, V.N.; Yakimenko, O.A.; Junge, C.J. Six-degree-of-freedom model of a controlled circular parachute. J. Aircr. 2003, 40, 482–493. [Google Scholar] [CrossRef]
- Doherr, K.F.; Schilling, H. Nine-degree-of-freedom simulation of rotating parachute systems. J. Aircr. 1992, 29, 774–781. [Google Scholar] [CrossRef]
- Eaton, J.A. Added mass and the dynamic stability of parachutes. J. Aircr. 1982, 19, 414–416. [Google Scholar] [CrossRef]
- Fu, X. Analysis on Characteristics of Structural Impact Response of Airborne Armored Vehicle in Landing Process. In Proceedings of the 5th Annual International Conference on Material Engineering and Application, Wuhan, China, 14–16 December 2018; Institute of Physics Publishing: Bristol, UK, 2019. [Google Scholar]
- Fu, X.; Wang, J.; Chen, Y.; Chen, X. A Study on Soft-landing Buffering Process of Manned Armored Vehicle Airdrop. J. Vib. Shock. 2021, 40, 57–64. [Google Scholar]
- Gao, X.; Zhang, Q.; Tang, Q. Parachute dynamics and perturbation analysis of precision airdrop system. Chin. J. Aeronaut. 2016, 29, 596–607. [Google Scholar] [CrossRef]
- Gao, X.; Zhang, Q.; Tang, Q. Fluid–structure interaction and flight dynamics analysis of parachute–payload system during uncontrolled airdrop process. Proc. Inst. Mech. Eng. G. J. Aerosp. Eng. 2018, 232, 2499–2512. [Google Scholar] [CrossRef]
- Guglieri, G. Parachute-payload system flight dynamics and trajectory simulation. Int. J. Aerosp. Eng. 2012, 2012, 182907. [Google Scholar] [CrossRef]
- He, H.; Chen, Z.; He, C.; Ni, L.; Chen, G. A Hierarchical Updating Method for Finite Element Model of Airbag Buffer System under Landing Impact. Chin. J. Aeronaut. 2015, 28, 1629–1639. [Google Scholar] [CrossRef]
- He, J.; Ma, J.; Wu, D.; Deng, S. Cumulative Damage Assessment to Airdrop Vehicle Hull for the Landing Process. WSEAS Trans. Appl. Theor. Mech. 2016, 11, 76–84. [Google Scholar]
- Heinrich, H.G. A linearised theory of parachute opening dynamics. Aeronaut. J. 1972, 76, 723–731. [Google Scholar] [CrossRef]
- Lee, C.K. Modeling of parachute opening: An experimental investigation. J. Aircr. 1989, 26, 444–451. [Google Scholar] [CrossRef]
- Li, J.; Wang, H.; Rui, Q.; Hong, H.; Chi, B. Tests for Cushioning Characteristics of a Self-inflating Airbag. J. Vib. Shock. 2014, 33, 119–123. [Google Scholar]
- Lian, W.; Hou, B.; Sun, J.; Wang, C.; Zhang, T. Numerical Analyses of Heavy Equipment Airdrop with Cushion Airbag Landing Process Impacting the Rigid and Soil Ground. Adv. Aeronaut. Sci. Eng. 2022, 13, 68–75. [Google Scholar]
- Liu, X.; Zhang, Z.; Zhao, Z. The uncertain optimisation of buffering characteristics of landing airbag in manned airdrop. Int. J. Crashworthiness 2013, 18, 225–236. [Google Scholar] [CrossRef]
- McVey, D.F.; Wolf, D.F. Analysis of deployment and inflation of large ribbon parachutes. J. Aircr. 1974, 11, 96–103. [Google Scholar] [CrossRef]
- Niu, S.; Wang, H.; Chi, B.; Lv, Z. Cushioning Characteristics of Double Chamber Airbag for Heavy Equipment Recovery System. J. Vib. Shock. 2012, 31, 74–78. [Google Scholar]
- Purvis, J.W. Prediction of parachute line sail during lines-first deployment. J. Aircr. 1983, 20, 940–945. [Google Scholar] [CrossRef]
- Richard Neuhaus, J.; Kenney, P.S. A Generic Multibody Parachute Simulation Model AIAA Modeling and Simulation Technologies Conference and Exhibit. In Proceedings of the AIAA Modeling and Simulation Technologies Conference and Exhibit, Keystone, CO, USA, 21–24 August 2006. [Google Scholar]
- Sun, N.; Li, L. Research Status of Landing Airbag for Airdrop. Packag. Eng. 2017, 38, 97–101. [Google Scholar]
- Tang, X.; Qian, L.; Tang, J.; Xu, F.; Wan, L. Stability Analysis of a Soft-landing System for Heavy Cargo Airdrop. J. Vib. Shock. 2015, 34, 122–126. [Google Scholar]
- Wang, H.; Hong, H.; Li, J.Y.; Rui, Q. Study on Multi-objective Optimization of Airbag Landing Attenuation System for Heavy Airdrop. Def. Technol. 2013, 9, 237–241. [Google Scholar] [CrossRef]
- Welch, J.V. CEV Airbag Landing System Modelling. In Proceedings of the 19th AIAA Aerodynamic Decelerator Systems Technology Conference and Seminar, Williamsburg, VA, USA, 21–24 May 2007. [Google Scholar]
- Wen, G.; Lei, Z.; Yin, J.; Yin, H. Cushion Characteristics of an Omni-Directional and Multi-chamber Airbag. J. Vib. Shock. 2013, 32, 13–17. [Google Scholar]
- White, F.M.; Wolfj, D.F. A theory of three-dimensional parachute dynamic stability. J. Aircr. 1968, 5, 86–92. [Google Scholar] [CrossRef]
- Wolf, D. A simplified dynamic model of parachute inflation. J. Aircr. 1974, 11, 28–33. [Google Scholar] [CrossRef]
- Yang, Z.; Liu, C.; LI, J.; Guo, S.; Li, J. Dynamic Modelling and Simulation of Airborne Vehicles Landing Buffer Process. Acta Armamentarii 2022, 43, 26. [Google Scholar]
- Zhang, C.; Zhao, Y.; Shen, Y.; Li, D. The Modelling and Analysis of Vibration Response with Airdrop Vehicle in Landing Process. J. Braz. Soc. Mech. Sci. Eng. 2024, 46, 345. [Google Scholar] [CrossRef]
- Zhang, X. Analysis of Landing Buffer Characteristics of Unmanned Airdrop Rescue Vehicle. Acad. J. Sci. Technol. 2024, 12, 2771–3032. [Google Scholar] [CrossRef]
- Zhou, M.; Di, C.; Yang, Y. Simulation of Cushion Characteristic of Airbags Based on Corpuscular Particle Method. Adv. Eng. Res. 2017, 118, 5STARCOOKS. [Google Scholar]
- Zhou, X.; Zhou, S.; Li, D.; Cui, D.; Dong, C. Research on design and cushioning performance of combined lunar landing airbag. Acta Astronaut. 2022, 191, 55–78. [Google Scholar] [CrossRef]
Disclaimer/Publisher’s Note: The statements, opinions and data contained in all publications are solely those of the individual author(s) and contributor(s) and not of MDPI and/or the editor(s). MDPI and/or the editor(s) disclaim responsibility for any injury to people or property resulting from any ideas, methods, instructions or products referred to in the content. |
© 2025 by the authors. Licensee MDPI, Basel, Switzerland. This article is an open access article distributed under the terms and conditions of the Creative Commons Attribution (CC BY) license (https://creativecommons.org/licenses/by/4.0/).