Article

Aerodynamic Analysis and Simulation for a Z-Shaped Folding Wing UAV

College of Aerospace Engineering, Shenyang Aerospace University, Shenyang 100124, China
*
Author to whom correspondence should be addressed.
Aerospace 2024, 11(9), 769; https://doi.org/10.3390/aerospace11090769
Submission received: 5 August 2024 / Revised: 6 September 2024 / Accepted: 8 September 2024 / Published: 19 September 2024
(This article belongs to the Section Aeronautics)

Abstract

:
The potential of folding wing unmanned aerial vehicles (UAVs) in enhancing the adaptability of complex missions is substantial. Analyzing the aerodynamic characteristics of these UAVs is vital for optimizing the design of their folding wing configuration and airfoil shape. In this study, a model of a Z-shaped folding wing UAV was established with the objective of enhancing UAV maneuverability. An integrated vortex lattice method (VLM) was employed to analyze the aerodynamic characteristics of the Z-shaped folding wing and numerical simulations were utilized to validate the obtained results, which prove the effectiveness of the integrated VLM in studying aerodynamic characteristics at a high angle of attack of the Z-shaped folding wing UAV. This is a new way to reduce computation time while maintaining accuracy to calculate such complex folding structures in high fidelity. Furthermore, the Z-shaped folding wing configuration demonstrates enhanced maneuverability at high angles of attack, and a Simulink flight simulation model based on the aerodynamic coefficients of the Z-shaped folding wing verifies this property. This analysis can properly predict the post-stall characteristics for the Z-shaped folding wing UAV to ensure the safety of the vehicle during flight.

1. Introduction

With the advancement of the aviation industry, aircraft are now required to possess exceptional performance capabilities in complex missions and flight environments. Morphing aircraft have emerged as a means to enhance aircraft performance, encompassing three main morphing methods: planar shape morphing involving changes in variables such as swept back angle, span, chord length or planar shape parameters; nonplanar shape morphing including variations in torsion or dihedral angles; and wing profile morphing entailing adjustments in curvature or thickness [1,2,3]. Among various variable span design concepts, folding wings have garnered significant attention from researchers. For instance, the implementation of retractable wing design on Tomahawk cruise missiles has resulted in a 12% reduction in fuel consumption and substantial improvements in missile performance.
Folding structure was introduced into the design of the wing more than ten years ago, the Lockheed-Martin team developed a double-hinged folding-wing concept of a flying-wing vehicle, which could be seen as the prototype of the Z-shaped folding wing [4], and the validity of the morphing design was quantified by the wind tunnel test [5]. In recent years, folding wing aircraft are receiving a lot of attention. NASA is exploring the feasibility of a system that will allow part of an aircraft’s wing to fold in flight, and uses shape memory alloy as an actuator to improve the lateral stability for a designed morphing wing as well as reducing drag [6]. Guo et al. [7] predicted the nonlinear vibration responses of a Z-shaped folding wing during the morphing process, and the theoretical analysis results of the nonlinear vibrational characteristics of the morphing wing during the morphing process are verified by experiments conducted with a corresponding Z-shaped morphing wing model [8]. Xie et al. [9] developed an aeroelastic approach for the dynamic response of a Z-shaped folding wing, and proposed the coupling relationship between the structural and aerodynamics model innovatively. Xu et al. [10] constructed an aeroelastic flight simulation platform to describe the flight-folding process of a folding wing aircraft, and investigated the influences of the folding rate and the aircraft’s center of gravity (c.g.) position on the results. Huang et al. [11,12] proposed a parameterized modeling methodology for nonlinear aeroelastic analysis of a folding wing with bilinear hinge stiffness.
The establishment of the aerodynamic model is another critical step in the aerodynamic analysis for folding wings. Since the classical lifting-line theory (LLT) [13,14,15] is not suitable for the folding wing, some other methods are improved to give more correct calculations, such as the inviscid vortex lattice method (VLM) [16,17,18]. The AERODAS proposed by Spera [19] can be used to predict the aerodynamic characteristics of the aircraft in the pre- and post-stall regions at large angles of attack to improve the fidelity of the aerodynamic model.
Generally, the utilization of mechanical transmission structures into the morphing wing will lead to low system reliability, a high degree of mechanical complexity and control design difficulty, and the complex structures make the analysis of its aerodynamic performance difficult. Therefore, it is necessary to apply different methods for morphing UAVs. For example, Ke et al. [20] present a systematic design approach for an unconventional UAV, which includes the overall configuration, aerodynamics, and internal subsystems, and proved the design concept by a vertical take-off and landing experiment. Hassanalian et al. [21] proposed a comprehensive sizing method to design flapping wing micro air vehicles and recognized the appropriate modes of flying for a flapping wing bird with the defined mission analysis. Kan et al. [22] used both the computational fluid dynamics method and a dynamic mesh to simulate the continuous morphing of the flexible leading edge and examined the unsteady aerodynamic characteristics of morphing wings with upward and downward deflections of the leading edge at different frequencies. Although folding wing aircraft has the potential to enhance multirole performance, these morphing concepts still need many further studies to improve their performance and verify their feasibility.
In recent years, various types of variable-wing UAV designs have emerged in an endless stream. For example, Hattalli et al. [23] used shape memory alloys to perform camber change for the horizontal tail of an unmanned aerial vehicle and yielded a deflection of 0.6 mm at trailing edge. Oyama et al. [24] covered a conceptual design of a box wing configuration, which could reduce induced drag and reduced fuel consumption.
Hui et al. [25] designed a bio-inspired morphing discrete wing with bionic feathers to improve the aerodynamic performance of an unmanned aerial vehicle. The results revealed that the bio-inspired morphing UAV can maintain an optimal lift-to-drag ratio at three different Reynolds numbers utilizing symmetrical wing morphing. Palaia et al. [26] present a conceptual design methodology for urban air vehicles based on a box-wing architecture coupled with tilt-wing mechanisms and carried out sensitivity analyses on the varying main design parameters. Bi et al. [27] investigated the aerodynamic interactions during shipboard launch and recovery of unconventional UAVs by experiments and measured the time-varying wing and proprotor aerodynamic loads with independent six-component load cells. Ajanic et al. [28] adopted an avian-inspired strategy of wing folding and pitching combined with a folding and deflecting tail to improve the turning performance of winged drones and performed an experiment through wind tunnel and flight tests to learn about the capabilities of the increased roll rate and decreased turn radius. Veeranjaneyulu et al. [29] described the aerodynamic characteristics of a two-stage morphing wing at the span angles of 0° and 120° at different angles of attack, which showed the better aerodynamic efficiency of a morphing wing at almost all angles of attack.
From the above literature, it was found that the research on the aerodynamic design of folding wings is still at the initial stage and needs to be further studied. In this study, a comprehensive 3D model of a Z-shaped folding wing UAV is formulated to analyze its aerodynamic characteristics using theoretical methodologies. Particularly, the impact of the wings’ folding angle on its aerodynamic properties is scrutinized. To validate the theoretical framework, numerical simulations employing the k-omega SST turbulence model are conducted and compared with the results derived from the theoretical analysis, confirming the fidelity of the proposed theory. Furthermore, this study establishes a Simulink flight simulation model for the Z-shaped folding wing UAV to analyze the impact of wing folding during flight.
This paper is organized as follows. Section 2 presents the modeling and design specifics of the Z-shaped folding wing UAV. In Section 3, the aerodynamic characteristics of the UAV at a high angle of attack are analyzed, and Section 4 introduces the flight simulation model, which is essential for examining the variations in parameters throughout the UAV’s flight.

2. Modeling of UAV with Z-Shaped Folding

The modeling process for the Z-shaped folding wing UAV differs from that of conventional aircraft in terms of wing design, due to the presence of both unfolded and folded states. When determining the wingspan size, it is crucial to consider whether the UAV can maintain normal flight in the folded state, and select an appropriate folding method and two-dimensional wing shape to achieve optimal flight performance. The Z-shaped folding UAV model is established through a combination of constraint analysis and preliminary software modeling analysis. Various software tools are available for modeling the Z-shaped folding wing UAV, including CATIA, SolidWorks, UG, OpenVSP [30], XFLR5 [31], Advanced Aircraft Analysis (AAA), and Shark FX-AP. In this study, both OpenVSP and XFLR5 are utilized for establishing the model parameters of the designed UAV, which have high computational efficiency and convenient modeling, while MATLAB is employed for constraint analysis.

2.1. Constraint Analysis

Because the Z-type folding wing aircraft needs different optimal flight parameters under different flight conditions, and these parameters are coupled and constrained with each other, the constraint analysis is applied to obtain the optimal design through the variable constraint equation. Firstly, constraint analysis proposed by Snorri Gudmundsson [32] is used to determine the initial size of the Z-shaped folding wing UAV, which can determine the wing span length and its power pack configuration requirement in different flight conditions. Generally, the level constant velocity turn, rate of climb, the thrust-to-weight ratio at takeoff (T-O distance), and cruise airspeed are the most important conditions in the design process, these flight conditions could be expressed as constraint equations between the thrust-to-weight ratio T/W and wing loading W/S to determine the aspect ratio change rates of the Z-shaped folding wing at these flight conditions. These flight conditions could be written as follows:
  • Level constant velocity turn
T W = q 1 C D min ( W / S ) + k ( n q 1 ) 2 ( W S )
  • Rate of climb (RC)
T W = V V V c l i + q 2 ( W / S ) C D min + k q 2 ( W S )
  • T-O distance
T W = V L O F 2 2 g S G + q 3 C D T O W / S + μ ( 1 q 3 C L T O W / S )
  • Cruise airspeed
T W = q 4 C D min ( 1 W / S ) + k ( 1 q 4 ) ( W S )
According to the constraint Equations (1)–(4), in order to compare the contents of this paper using the RC model test vehicle in future experiments, the Constraint equation basic parameters are given here with Z-folded wings, a shown in Table 1, calculated by the constraint equations and flight conditions as shown in Table 2. Moreover, C D T O and C L T O are given by Snorri Gudmundsson’s [32] experience, as detailed in the Appendix A.
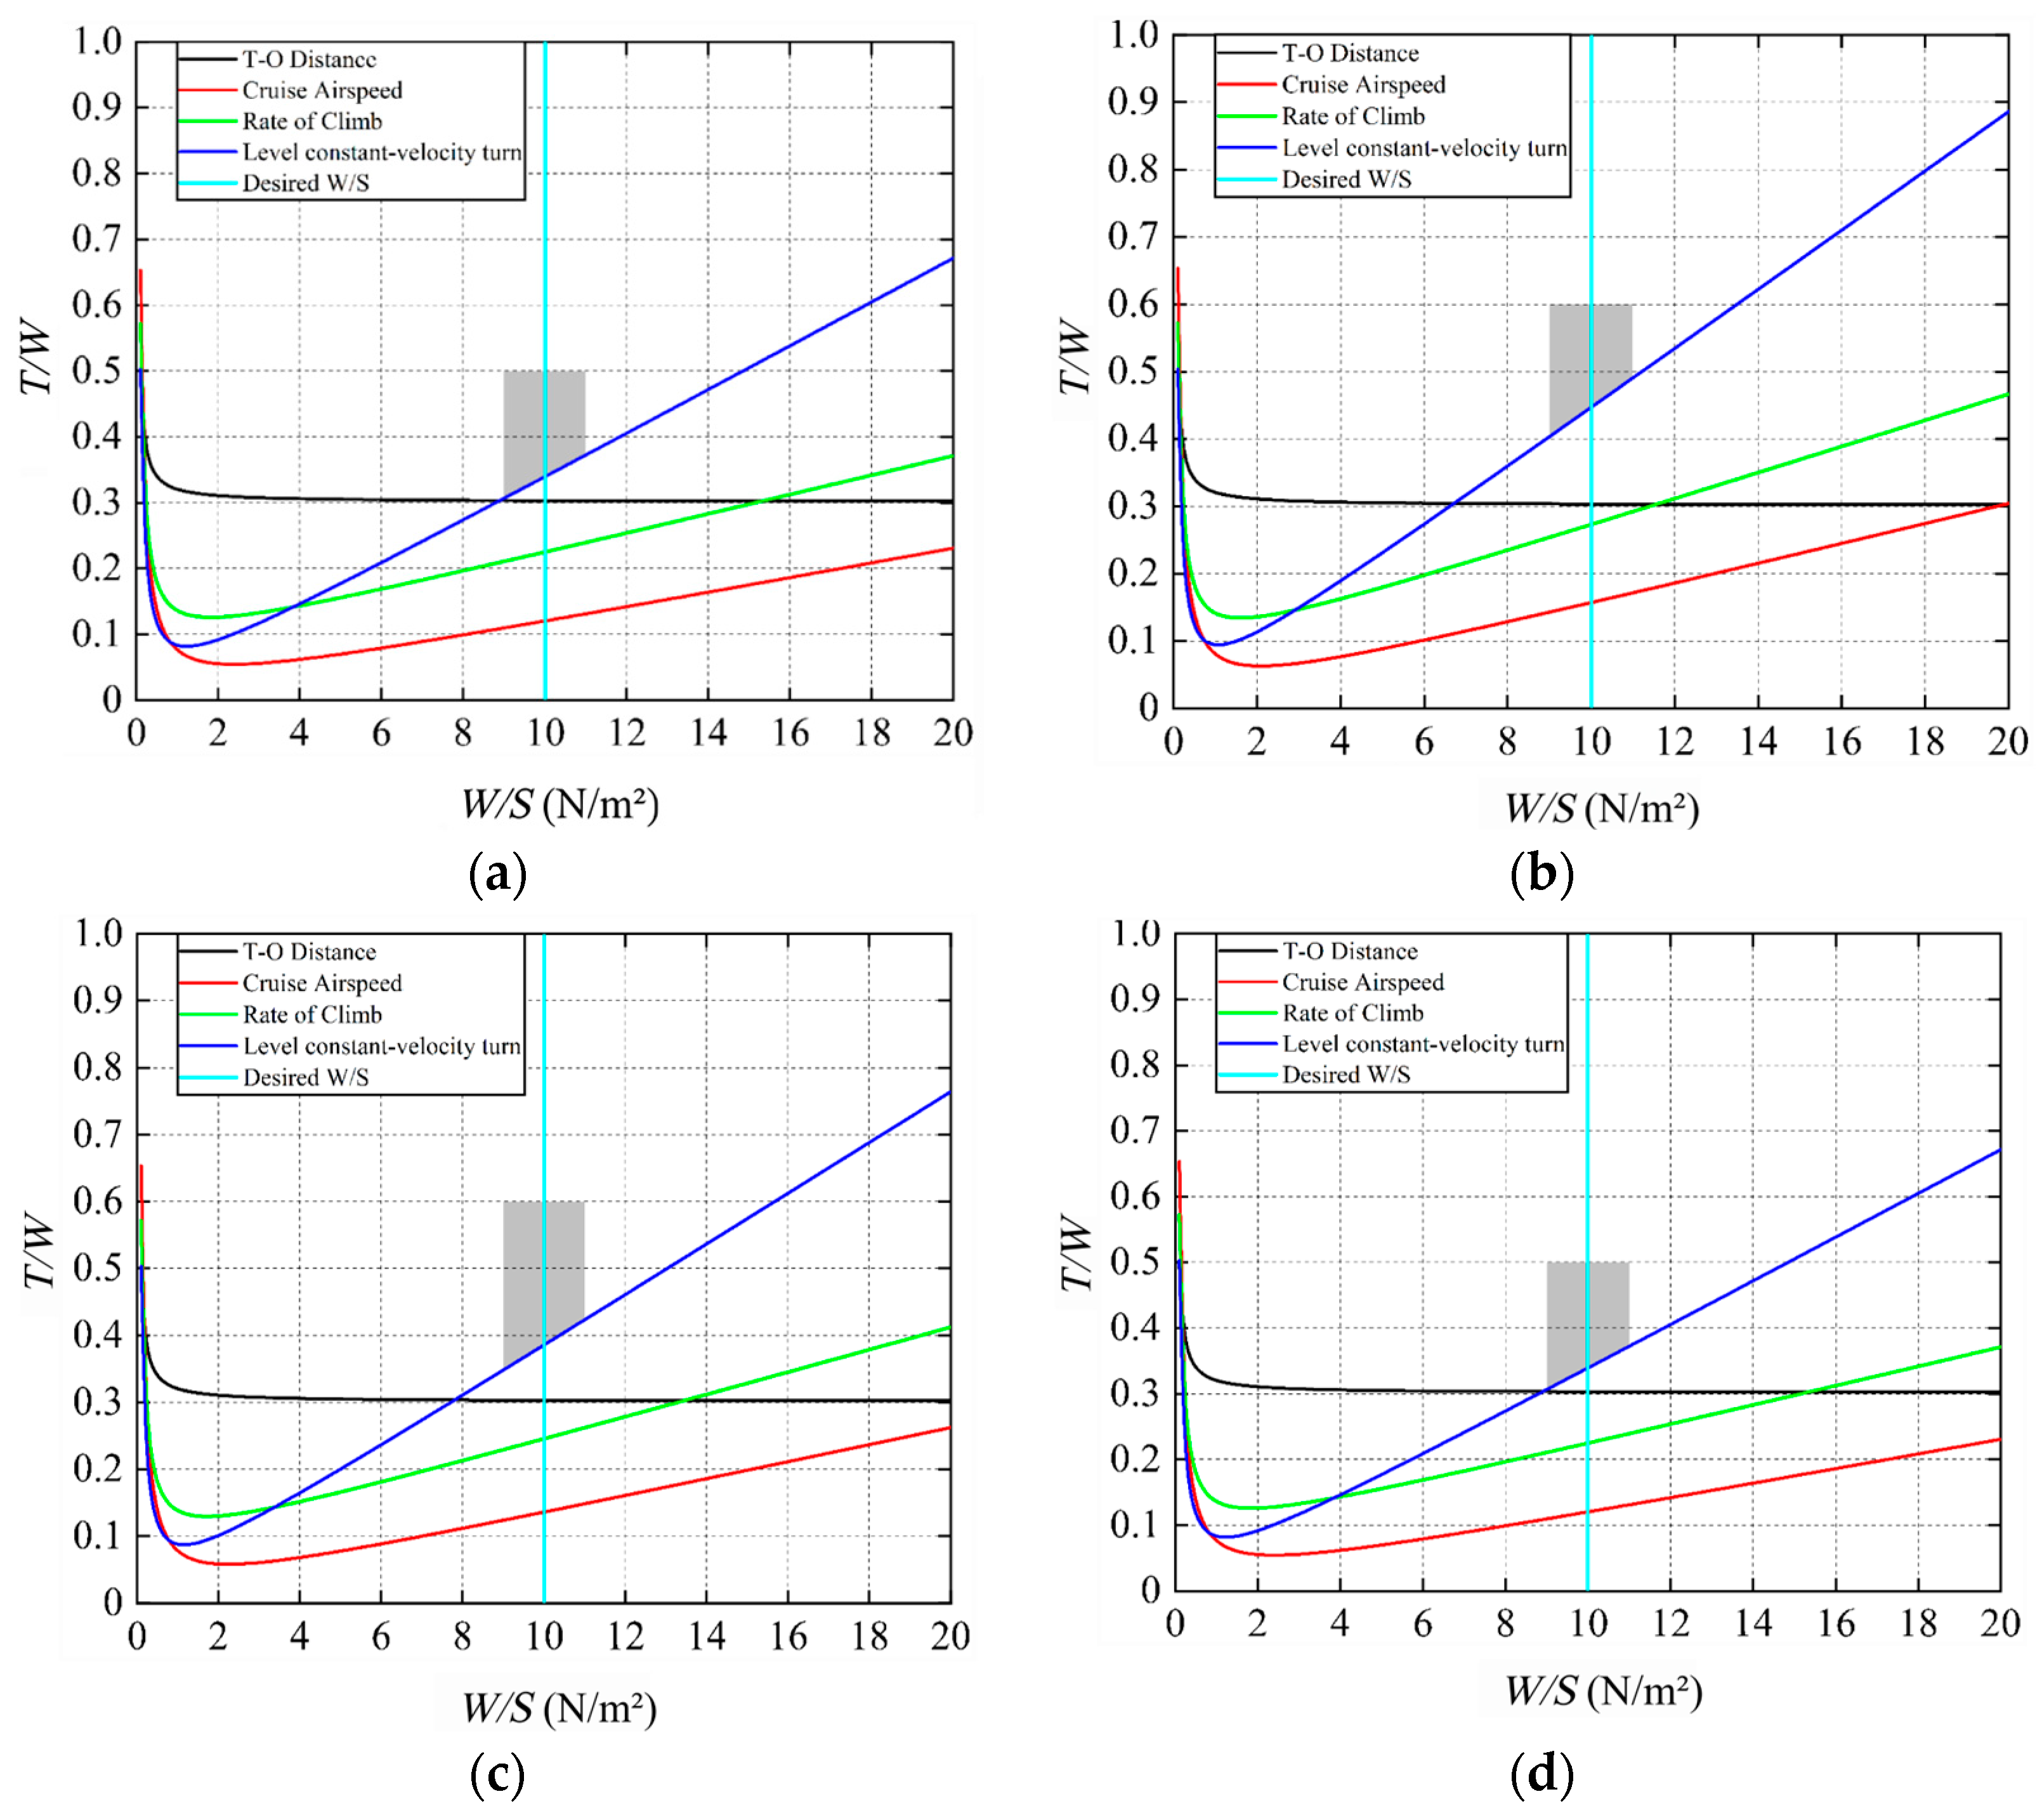
Then, the aspect ratio (AR) is chosen in the region of 6~9 for General Aircraft [33], based on Cessna 182, and the main wing type is selected as NACA2412, with a relative thickness of 0.12. For the RC model, suppose the wing loading W/S is 0.005   g / mm 2 , then the above parameters and constraint equations are imported into MATLAB, and the constraint diagrams for Z-shaped folding wings are generated as Figure 1. It is easy to find that the required thrust-to-weight ratio T/W becomes smaller when the main wing aspect ratio A R increases from 6 to 9. Moreover, the constraint of level constant velocity turn has the most stringent thrust-to-weight ratio requirement, while the constraints of cruise, takeoff, and climb rate are easier to meet with these constraints in conservative calculation. Therefore, a suitable thrust-to-weight ratio is chosen in the shaded area near the lower right corner of the constraint diagram for the Z-shaped folding wing, which also can be adjusted by the vertical wing loading straight line. Combined with the results of constraint diagram in Figure 1, considering the motor engine thrust and airframe weight of the RC model test vehicle, the final main wing A R of the Z-shaped folding wing in the folded and unfolded state are chosen as 7 and 8, respectively. Moreover, the wing loading is 0.005   g / mm 2 and the required thrust-to-weight ratio is greater than 0.6, and the determined AR and T/W are listed in Table 3.

2.2. Folding Configuration Selection

In this study, a Z-shaped folding wing is considered, the configuration of which varies in the Z-axis direction. Wingspan of the wing can be morphing through the rotation of the inner section wing around the hinge structure, while the main wing surface remains horizontal during the folding process. The aerodynamic center is located after the gravity center, which is determined not only from the wing position distribution but also from the folding process. When folding up, the neutral point moves relatively farther away from the aerodynamic center and the slope of the pitching moment and the longitudinal stability increase. On the contrary, the neutral point varies a little for the folded downward deflection and both the pitching moment slope and the longitudinal stability decline, which is helpful to improve the maneuverability of the UAV. Therefore, the folded downward deflection is suitable for subsequent analysis and the detailed dimensions of the wing are satisfied with the above constraint analysis.

2.3. Airfoil Selection

Since the UAV typically operates at low Reynolds numbers, the strong adverse pressure gradient significantly impacts the aerodynamic performance of the folding wing. The presence of a separation bubble results in a thicker boundary layer and increased airfoil drag, leading to instability issues and control difficulties for the Z-shaped folding wing UAV. To address this, we utilized XFLR5 and Profili software tools to obtain an appropriate airfoil shape for the Z-shaped folding wing and analyze its folding process (based on available airfoil data from the UIUC airfoil data site [33]).
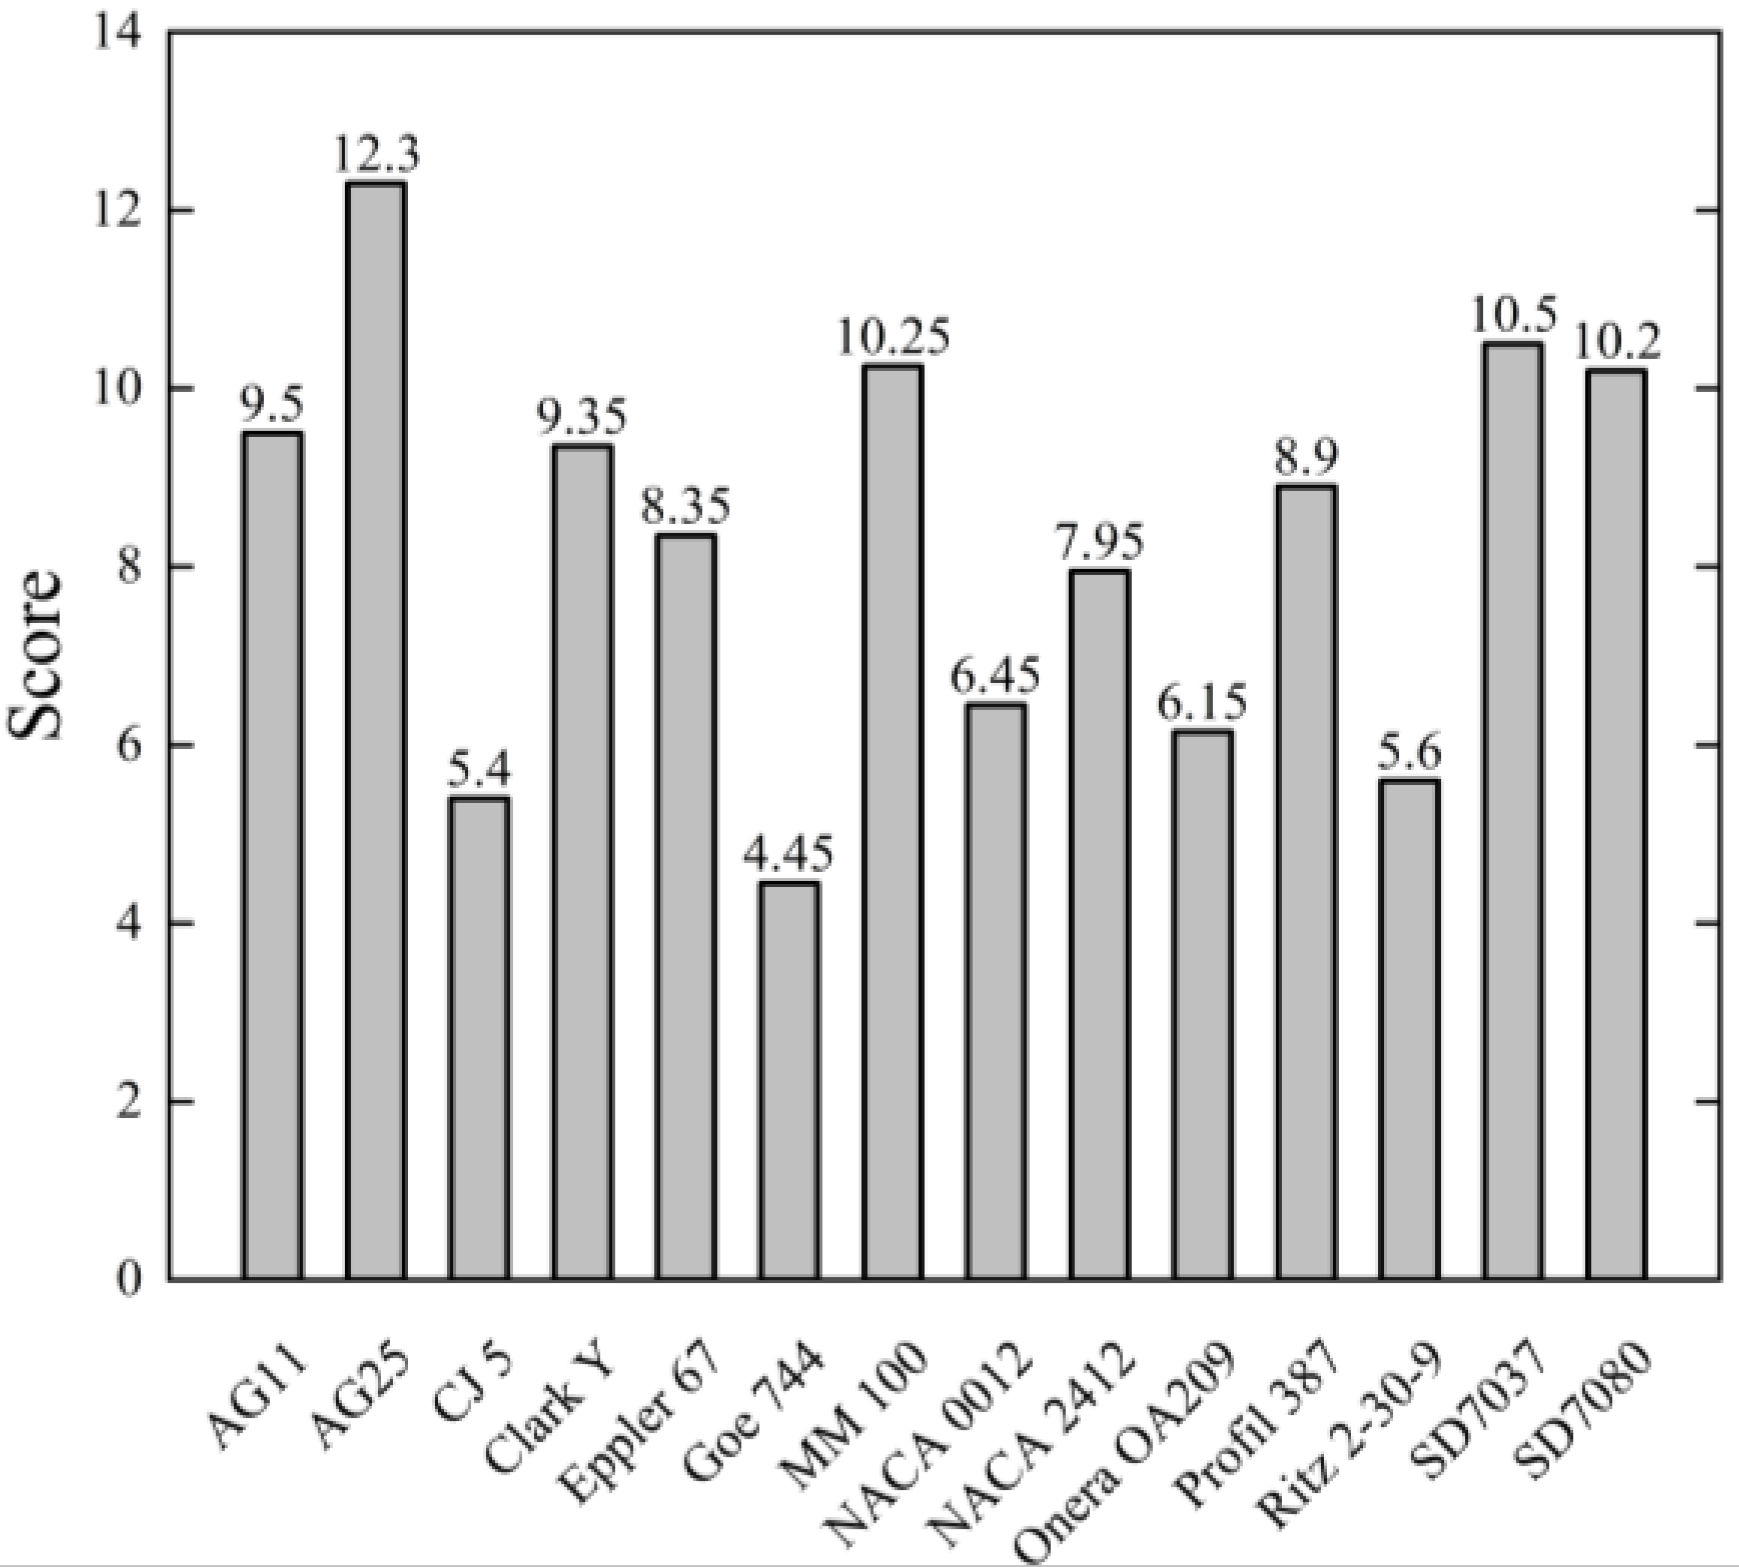
Firstly, a control group consisting of classical airfoils is selected. Subsequently, the VLM analysis is employed to establish the relationship between designed parameters (such as lift, drag, and pitching moment coefficient) and the angle of attack. The evaluation criteria [34] presented in Table 3 are utilized to assess the impact of multiple parameters on UAV flight performance and determine the priority order of the aforementioned airfoils. These criteria encompass all aspects related to airfoil selection and assign weighted scores to reflect their relative importance and evaluation. Considering low Reynolds numbers in application scenarios, a set of potential suitable airfoils is chosen. Table 4 displays these airfoils along with their geometric parameters and associated criteria. The 3D unfolded wing model incorporates these airfoils for analysis using XFLR5 by the VLM. Subsequently, each airfoil’s aerodynamic performance is graded in reverse order and multiplied by 0.1 based on the fundamental parameters outlined in Table 5. Furthermore, composite scores are obtained through assigned evaluation weights as depicted in Figure 2. The analysis data for each wing type are ultimately derived by multiplying individual coefficient weights; according to our assessment criteria, AG25 exhibits superior performance for Z-shaped folding wings.

2.4. Aircraft Modeling

The main focus of this section is to discuss the impact of the main wings on the aerodynamic characteristics of the Z-shaped folding wing UAV. The AG25 airfoil, which has achieved the highest score, is selected as the airfoil section for the upper monoplane main wing. Additionally, NACA0010 is chosen as the airfoil section for both drogue and elevator. The baseline reference for this design is based on Cessna 182T aircraft from OpenVSP database. Flap distribution and vertical tail arrangement are determined by existing aircraft and design manual guidelines. Furthermore, Figure 3 illustrates a 3D model representation of the designed folding wing UAV at various angles.
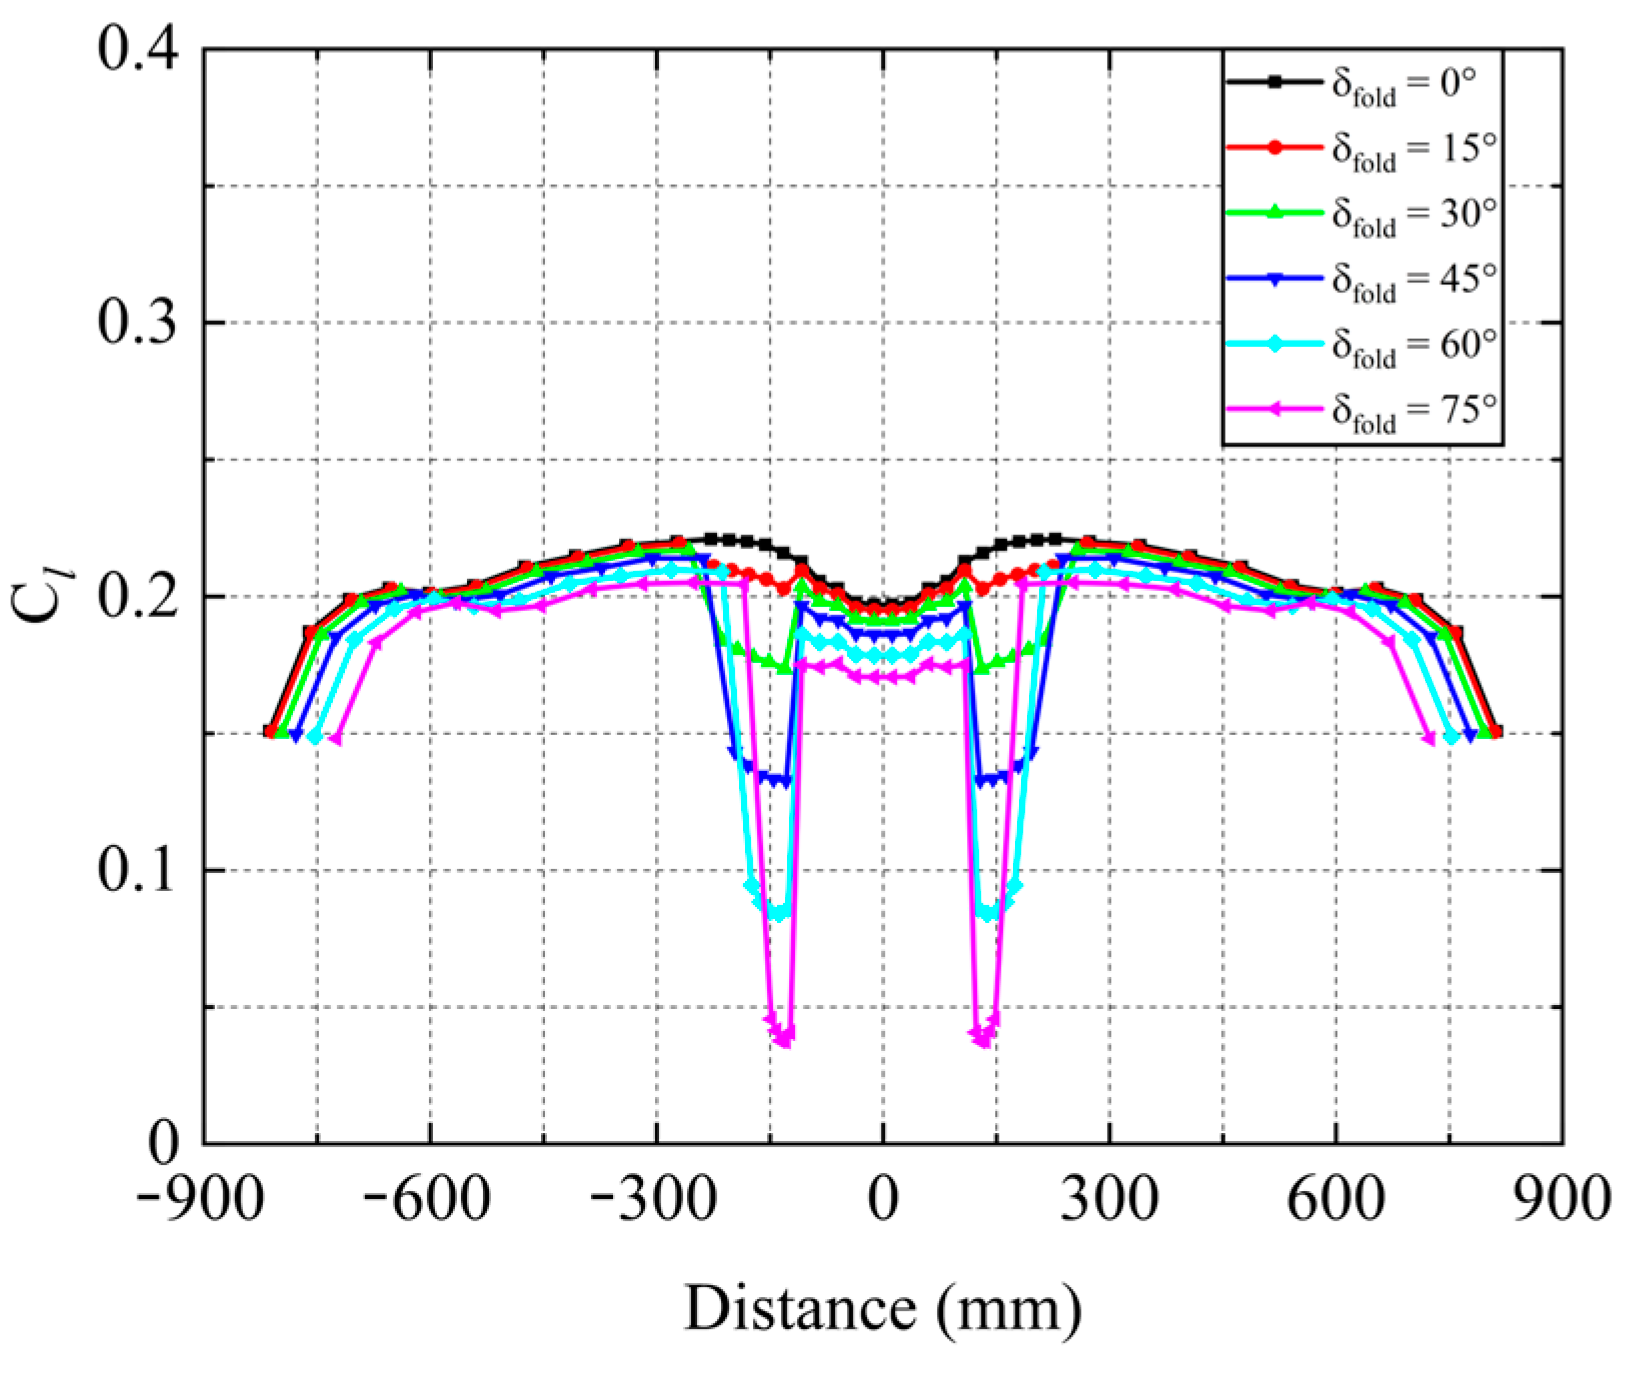
After conducting modeling using OpenVSP and analyzing with VLM at a 0° angle of attack, the distribution of lift coefficients across the span of the main wing can be obtained as shown in Figure 4. It is evident from this figure that as the folding angle increases from 0 to 75°, the lift coefficient of the inner section wing decreases more compared to other sections. This decrease can be attributed to a significant reduction in lift area caused by folding of the inner section wing. However, it should be noted that although the inner section wing accounts for a relatively small portion of the total wing area, its impact on overall lift is not as pronounced as depicted here. Additionally, it is observed that since the outer section primarily contributes to generating lift, there is a slight decrease in its distribution span with an increase in folding angle. Furthermore, during the folding process, there is a decline in span-to-chord ratio to approximately 89%. In conclusion, this Z-shaped folding wing configuration sacrifices only a small fraction of lift on the inner section while still relying on outer sections to provide overall lift.

3. The Aerodynamic Characteristics of Post-Stall Area

The analysis of post-stall characteristics and accurate prediction are essential to ensure the safety of Z-shaped folding wing UAV during flight, as its maneuvers occasionally involve covering the stall angle of attack, such as pulling up to altitude or diving at high speed. However, existing software and codes like XFLR5, DATCOM, AVL lack a nonlinear lift/drag model in the stall region, making it challenging to obtain precise aerodynamic profiles. To address this limitation, Spera [19] proposed a semi-empirical aerodynamic model that incorporates airfoil thickness into the calculation of lift and drag characteristics in the post-stall region. AERODAS effectively fits lift and drag coefficients from test data in the pre-stall region combined with airfoil parameters. Additionally, Montgomerie [35] introduced a stall region model for pitching moment characteristics by utilizing both pre-stall and post-stall pitching moment data.
By integrating these theories, an advanced nonlinear vortex lattice method (VLM) is employed to calculate the aerodynamic characteristics of Z-shaped folding wing UAV in both pre-stall/post-stall regions [36]. This integrated VLM utilizes general VLM-derived aerodynamic coefficients from the pre-stall region while quickly obtaining post-stall coefficients through fitting data using AERODAS and Montgomerie methods, where the detail steps are as follows: based on the input parameters and adjustments for finite aspect ratio, Jacobs and Anderson evaluated the selected aspect ratio function for the change in an infinite aspect ratio to a finite aspect ratio, then the important parameters, including coefficient of the pre-stall area, maximum lift and drag, the change in lift with the angle of attack after stall and the change in drag with angle of attack after stall to obtain the optimal airfoil AG25 for the lift resistance characteristics in the stall area. Unlike conventional approaches relying on experimental data alone for pre-stall coefficients determination, our approach employs VLM-based calculations instead. Through this integrated VLM analysis, it is observed that increasing folding angle enhances maneuverability without significantly affecting lift-drag performance.

3.1. Analysis of Lift and Drag Characteristics in the Post-Stall Region

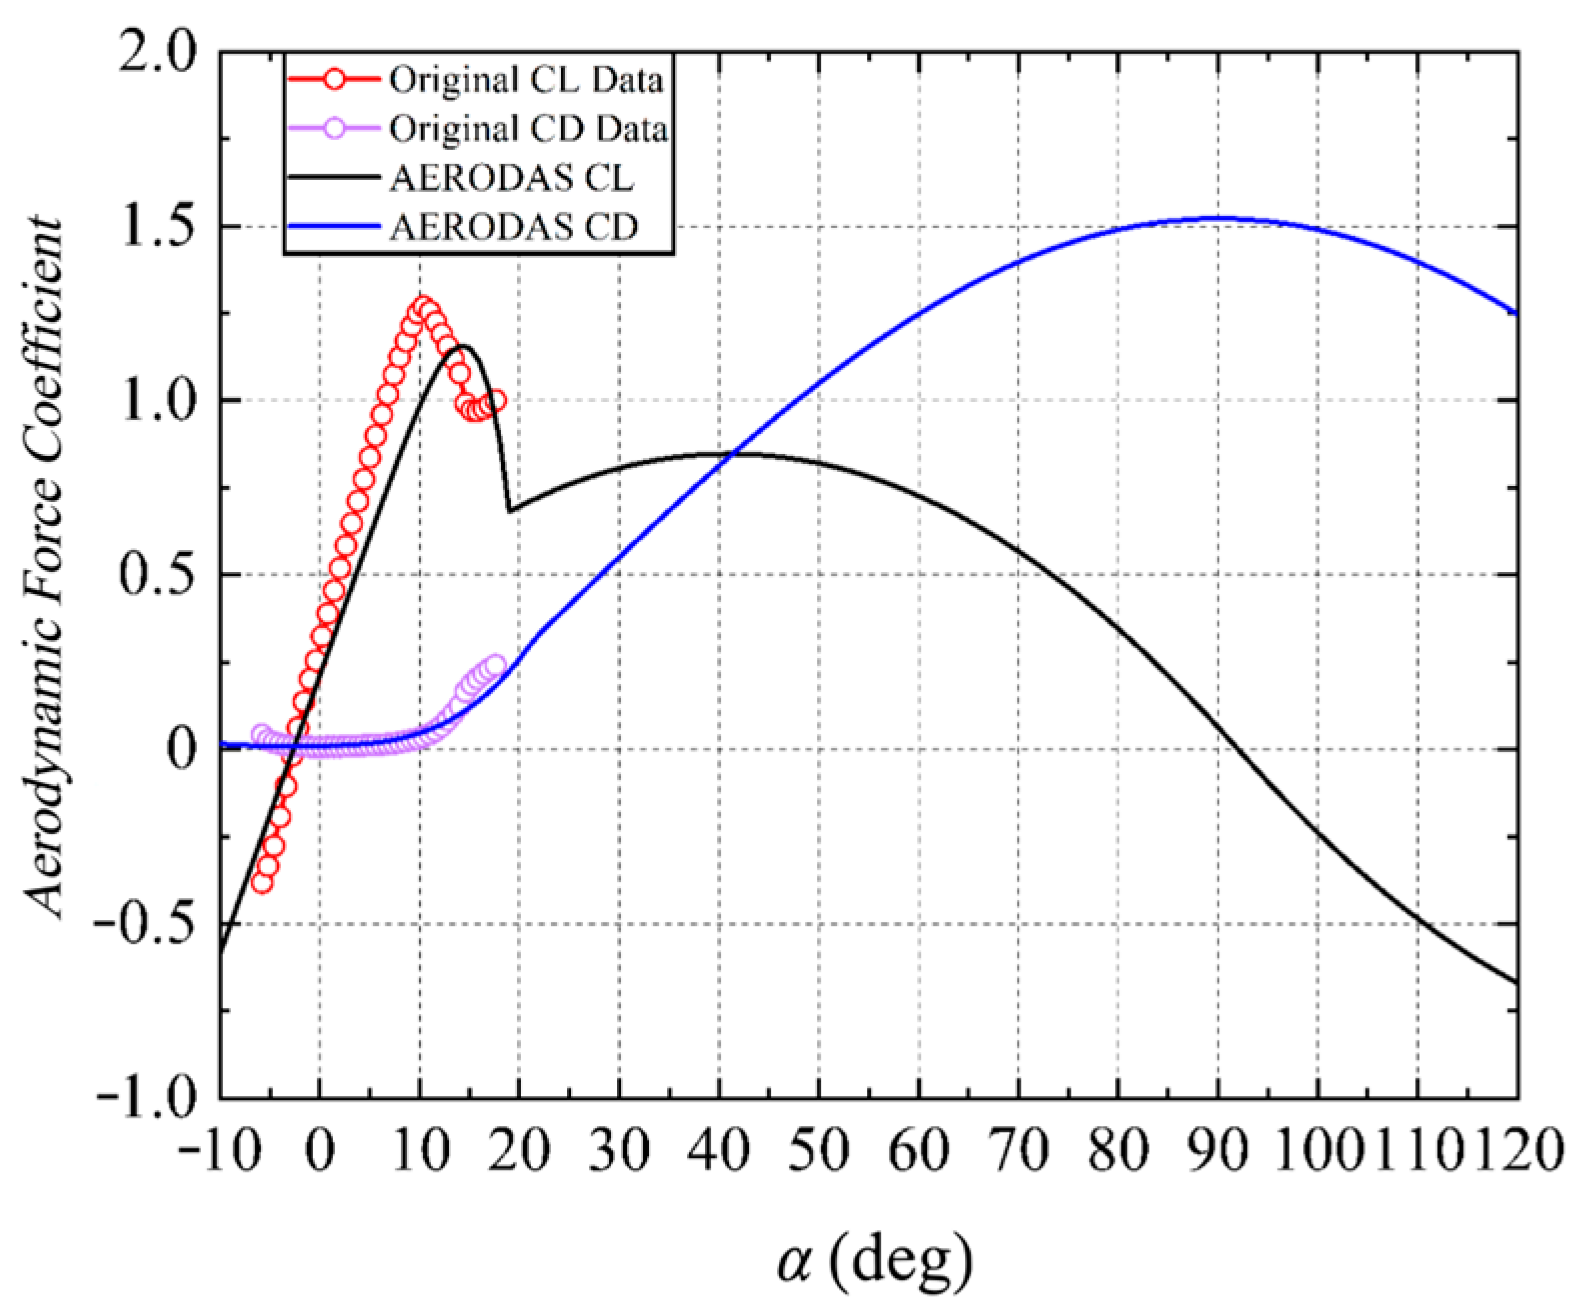
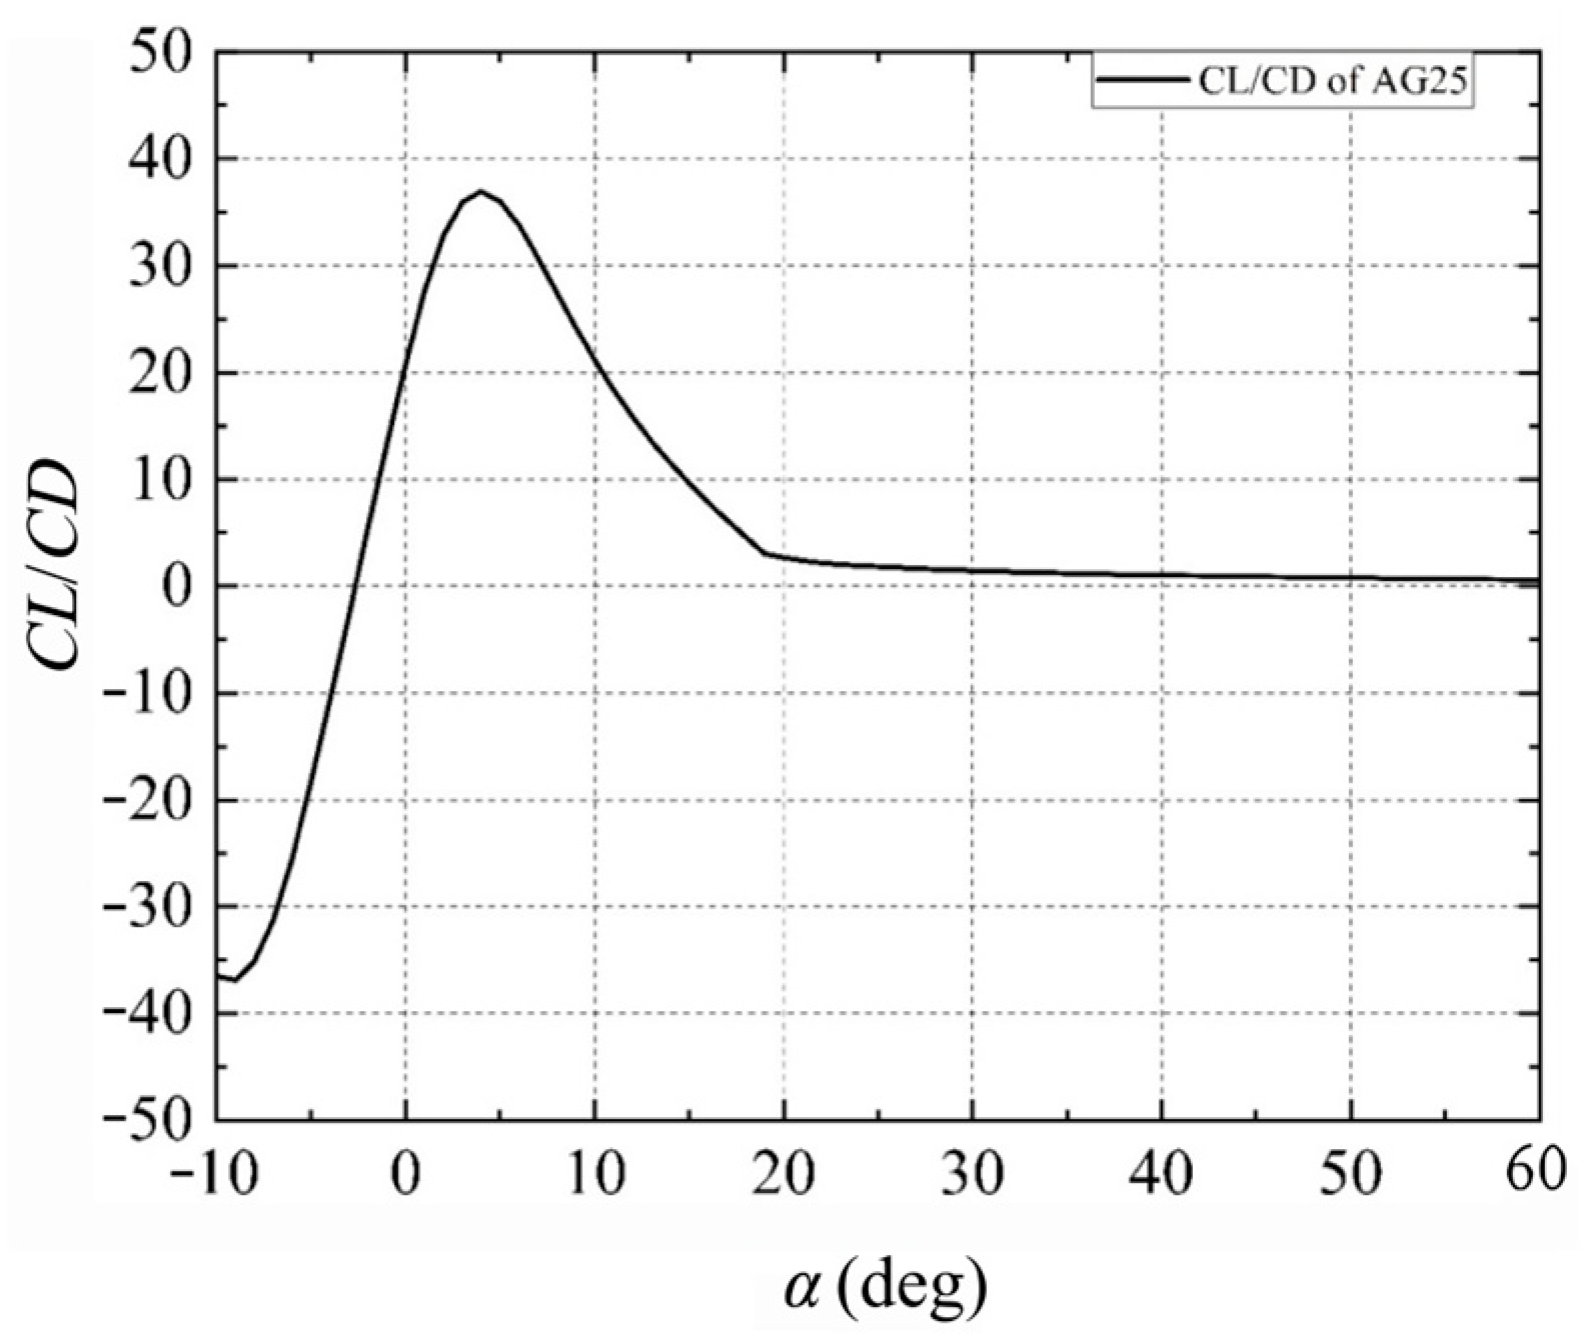
Based on the optimal AG25 airfoil type, the lift-drag characteristics of the UAV in the stall region are analyzed using the AERODAS method. The results indicate that with a given aspect ratio, the relative thickness of the AG25 airfoil is 7.58%. The original data of AG25 airfoil with angle of attack variation are obtained through Xfoil code and then fitted by AERODAS as shown in Figure 5. It can be observed that compared to the AG25 source data generated by Xfoil code, the stall angle of attack of the unfolding state slightly shifts backward. Subsequently, within an angle of attack range of 20°~40°, it was found that the drag coefficient of the UAV increases more rapidly than its lift coefficient, leading to a post-stall state. Figure 6 illustrates variations in lift-to-drag ratio after reaching stall angle of attack, revealing that even after stalling occurs, there are still certain angles of attack where this ratio remains above 1. Therefore, despite having a large thrust-to-weight ratio, Z-shaped folding wing UAVs can still maintain post-stall maneuverability.
The wing span and area of Z-type folding wing aircraft undergo changes during the folding process, which must be taken into account when calculating its aerodynamic characteristics using the vortex lattice method (VLM) provided by XFLR5. Additionally, when analyzing stall characteristics with the AERODAS method, a conversion from infinite to finite aspect ratio is necessary, resulting in changes to the aspect ratio as well. Therefore, several representative folding angles are selected for obtaining aerodynamic data through XFLR5’s VLM. Subsequently, the AERODAS method is employed to fit the data and establish relationships between lift and drag coefficients with respect to folding angles (as shown in Figure 7). It is observed that the influence of folding angles on aerodynamic performance is primarily active within low angle-of-attack regions, while aspects such as aspect ratio and relative thickness affect lift-drag characteristics in high angle-of-attack regions. Overall, based on data fitted by AERODAS, both lift and drag coefficients exhibit a decreasing trend as folding angle increases.

3.2. Pitching Moment Characteristic Analysis in the Post-Stall Region

The pitching moment coefficient source data in XFLR5 are obtained from the model with mass distribution settings, where the neutral point varies during the wing folding process. Similar to the AERODAS method, the post-stall region’s pitching moment coefficients are fitted based on pre-stall region data acquired through ordinary VLM. By employing Montgomerie’s method [37], three segments of the pre-stall region’s pitching moment characteristic curve can be interpolated to match the curve in the high angle-of-attack region. From Figure 8 depicting the pitching moment characteristics of the Z-shaped folding wing UAV, it can be observed that as the folding angle δ fold increases from 0° to 90°, there is a decrease in the nose-down pitching moment, thereby enhancing control efficiency and maneuverability.

4. Validation Analysis

4.1. Fluent Turbulence Model Establishment

The validation of the integrated VLM results is assessed by employing the computational fluid dynamics (CFD) tool to predict the stall characteristics of a 3D model for the designed Z-shaped folding wing. In order to ensure high confidence in the aerodynamics configuration of the Z-shaped folding wing, only the wing performance is evaluated here, disregarding the fuselage. Three popular Reynolds Averaged Navier Stokes (RANS) solvers are utilized for simulation purposes. The first one is the Spalart–Allmaras model, also known as a single-equation turbulence model, which offers advantages in terms of computational efficiency [38]. Additionally, two-equation turbulence models—K-omega and k-epsilon—are employed as semi-analytic models. Lastly, the Shear Stress Transport (SST) model, which combines elements from both aforementioned models, is used due to its ability to improve accuracy in predicting aerodynamic characteristics within pre-stall/post-stall regions [39,40], as well as its relatively good results in predicting stall characteristics [41]. Therefore, the SST model serves as the chosen turbulence model to analyze the Z-shaped folding wing’s stall prediction. Furthermore, it should be noted that wall function plays an important role and typically depends on y + settings during the meshing process [42].
To ensure y + 1 , the parameters are chosen as a temperature of 15 °C, a freestream density of 1.225 kg / m 3 , an incoming flow velocity of 20 m/s and a mean aerodynamic chord (MAC) of 0.2 m for more reliable prediction. Then, Re and wall spacing Δ s are calculated by the following formula [43]:
Re = ρ V L M A C μ = 1.225 × 20 × 0.2 1.7894 × 10 5 = 273834
C f = 0.026 Re 1 / 7
τ w a l l = C f ρ U 2 2
U f r i c = τ w a l l ρ
Δ s = y + μ U f r i c ρ = 0.00001567   m
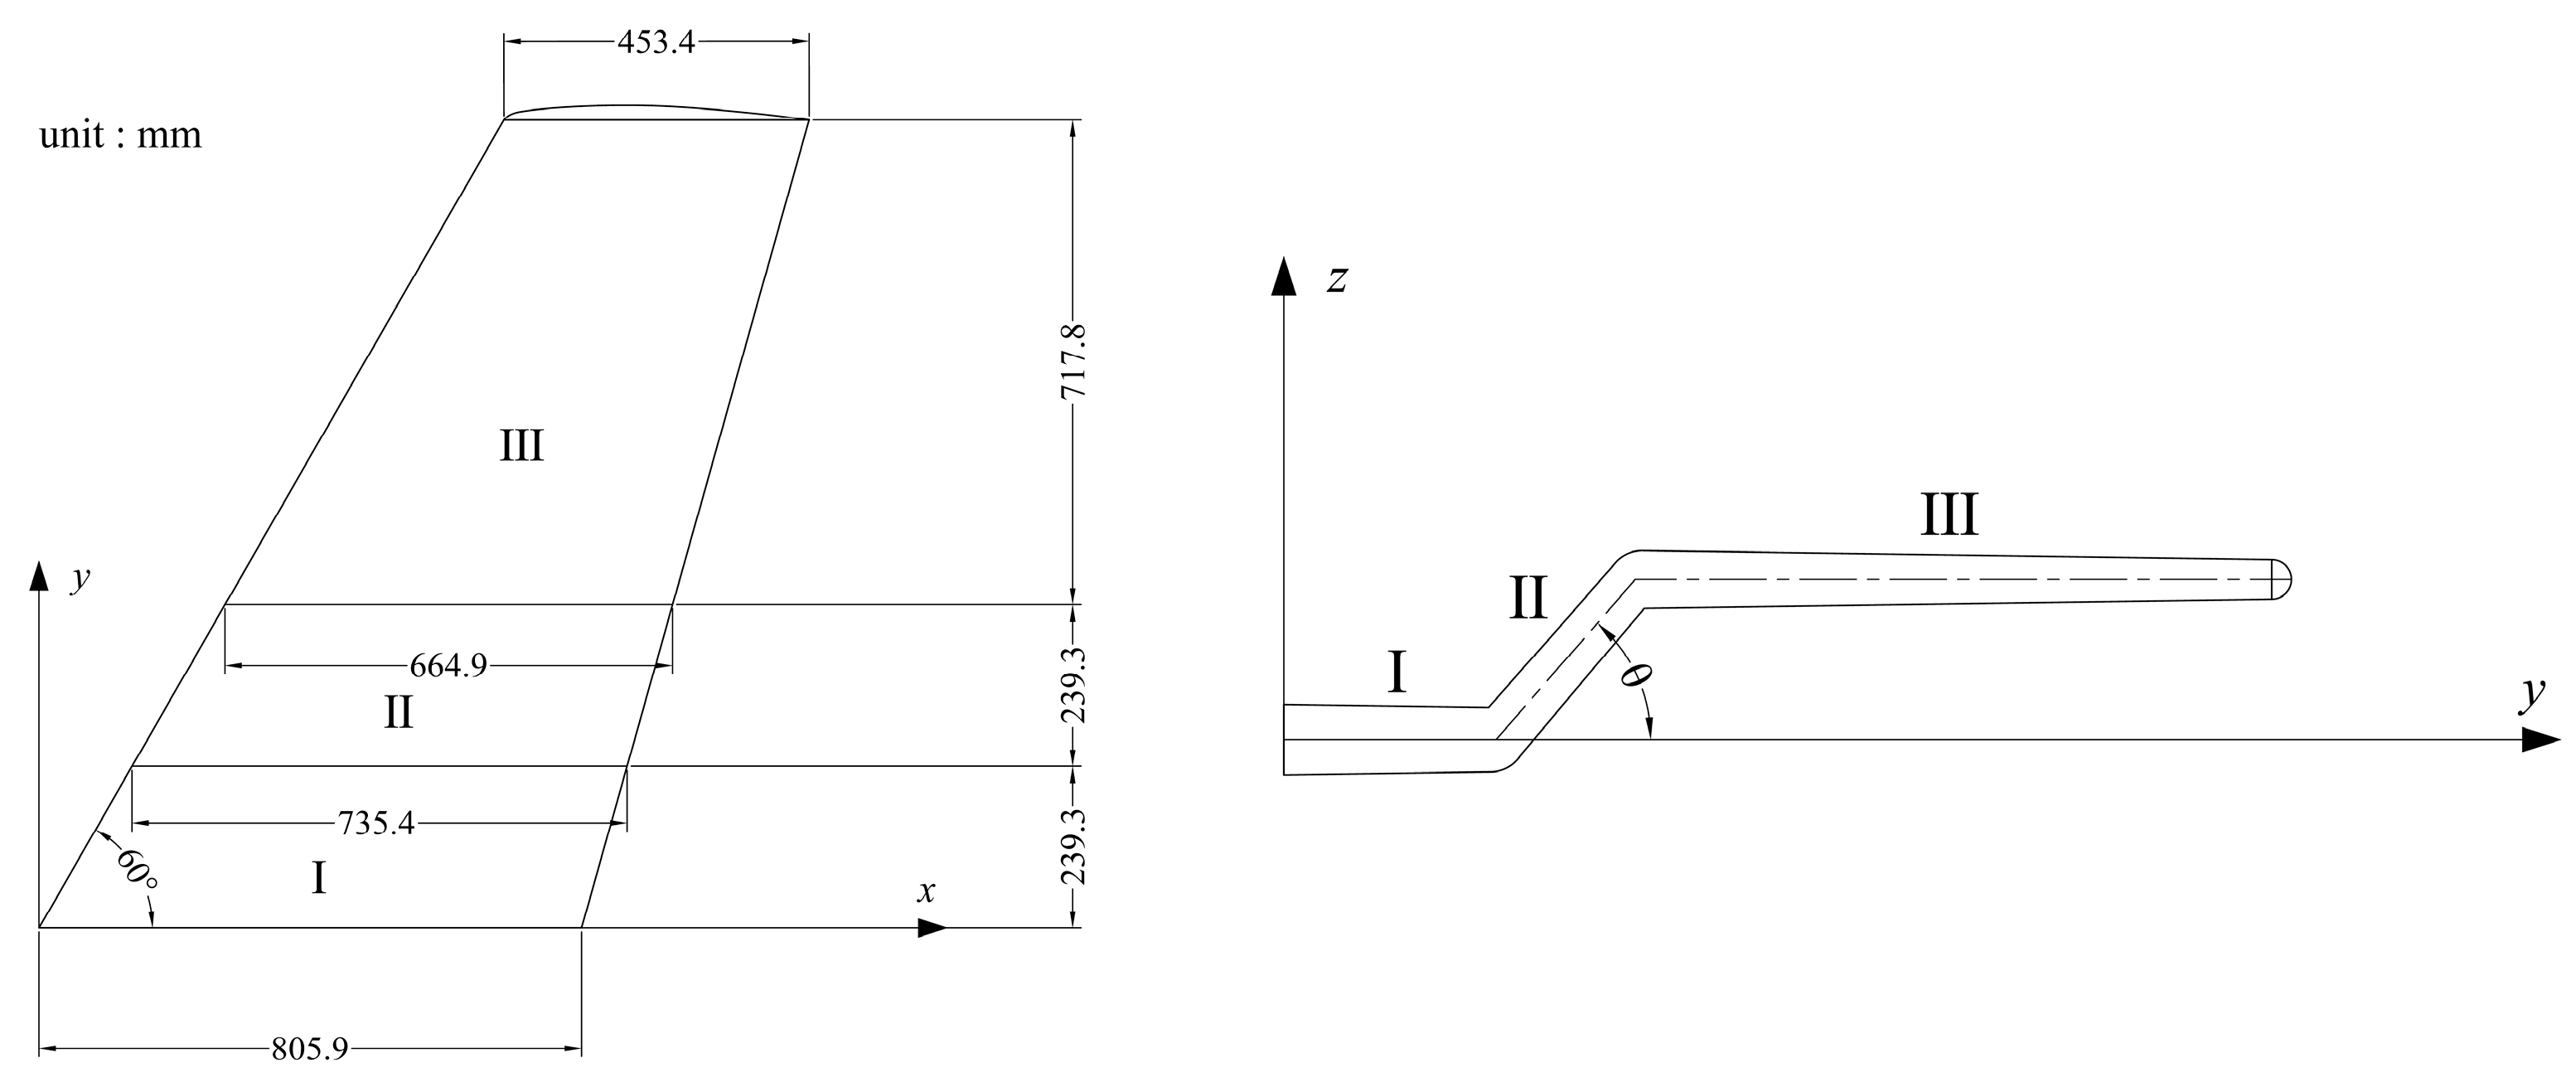
The folding process of the wing can be effectively described by combining the spread length formula of the inner wing ( l 1 ) , the middle wing ( l 1 ) and the outer wing ( l 1 ) as shown in Figure 9, and the appropriate aerodynamic shape can be obtained, so as to obtain the transient solution of the flow field.
In the process of morphing, the research adopts the method of fluent dynamic mesh and user-defined function (UDF). The UDF is used to define the node motion during the folding of the wing and the dynamic grid UDF is activated by the macro command “DEFINE_GRID_MOTION”. Moreover, the coordinates update the grid reference coordinates with the initial position in “DEFINE_GRID_MOTION”, where the formulae are written in the following form:
For Part I:
x n + 1 = x n y n + 1 = y n + ( y n z n ) ( l 1 z n ) tan θ n 2 ( tan θ n 2 tan θ n + 1 2 ) z n + 1 = z n
For Part II:
x n + 1 = x n y n + 1 = y n + ( y n l 1 ) + z n tan θ n 2 cos θ n + sin θ n tan θ n 2 ( cos θ n + 1 cos θ n ) z n y n l 1 + z n tan θ n 2 sin θ n cos θ n + sin θ n tan θ n 2 ( tan θ n + 1 2 tan θ n 2 ) z n + 1 = z n + y n l 1 + z n tan θ n 2 cos θ n + sin θ n tan θ n 2 ( sin θ n + 1 sin θ n )
For Part III:
x n + 1 = x n y n + 1 = y n + l 2 ( cos θ n + 1 cos θ n ) + ( l 1 + l 2 + l 3 ) l 3 y n + l 2 l 2 cos θ n + ( l 1 + l 2 + l 3 ) l 3 ( z n l 2 sin θ n ) tan θ n 2 l 3 + ( z n l 2 sin θ n ) tan θ n 2 ( z n l 2 sin θ n ) ( tan θ n 2 tan θ n + 1 2 ) z n + 1 = z n + l 2 ( sin θ n + 1 sin θ n )
where ( x n + 1 , y n + 1 , z n + 1 , θ n + 1 ) is the coordinate and angle of the current time step node and ( x n , y n , z n , θ n ) is the corresponding values of the previous time step. Moreover, the coordinates of the node are updated at each time step based on the UDF’s previous location. It is important to note that the UDF must define the folding position over time to ensure the correctness of model updates, which can be achieved by defining time change variables ( l 1 , l 2 , l 3 ) .
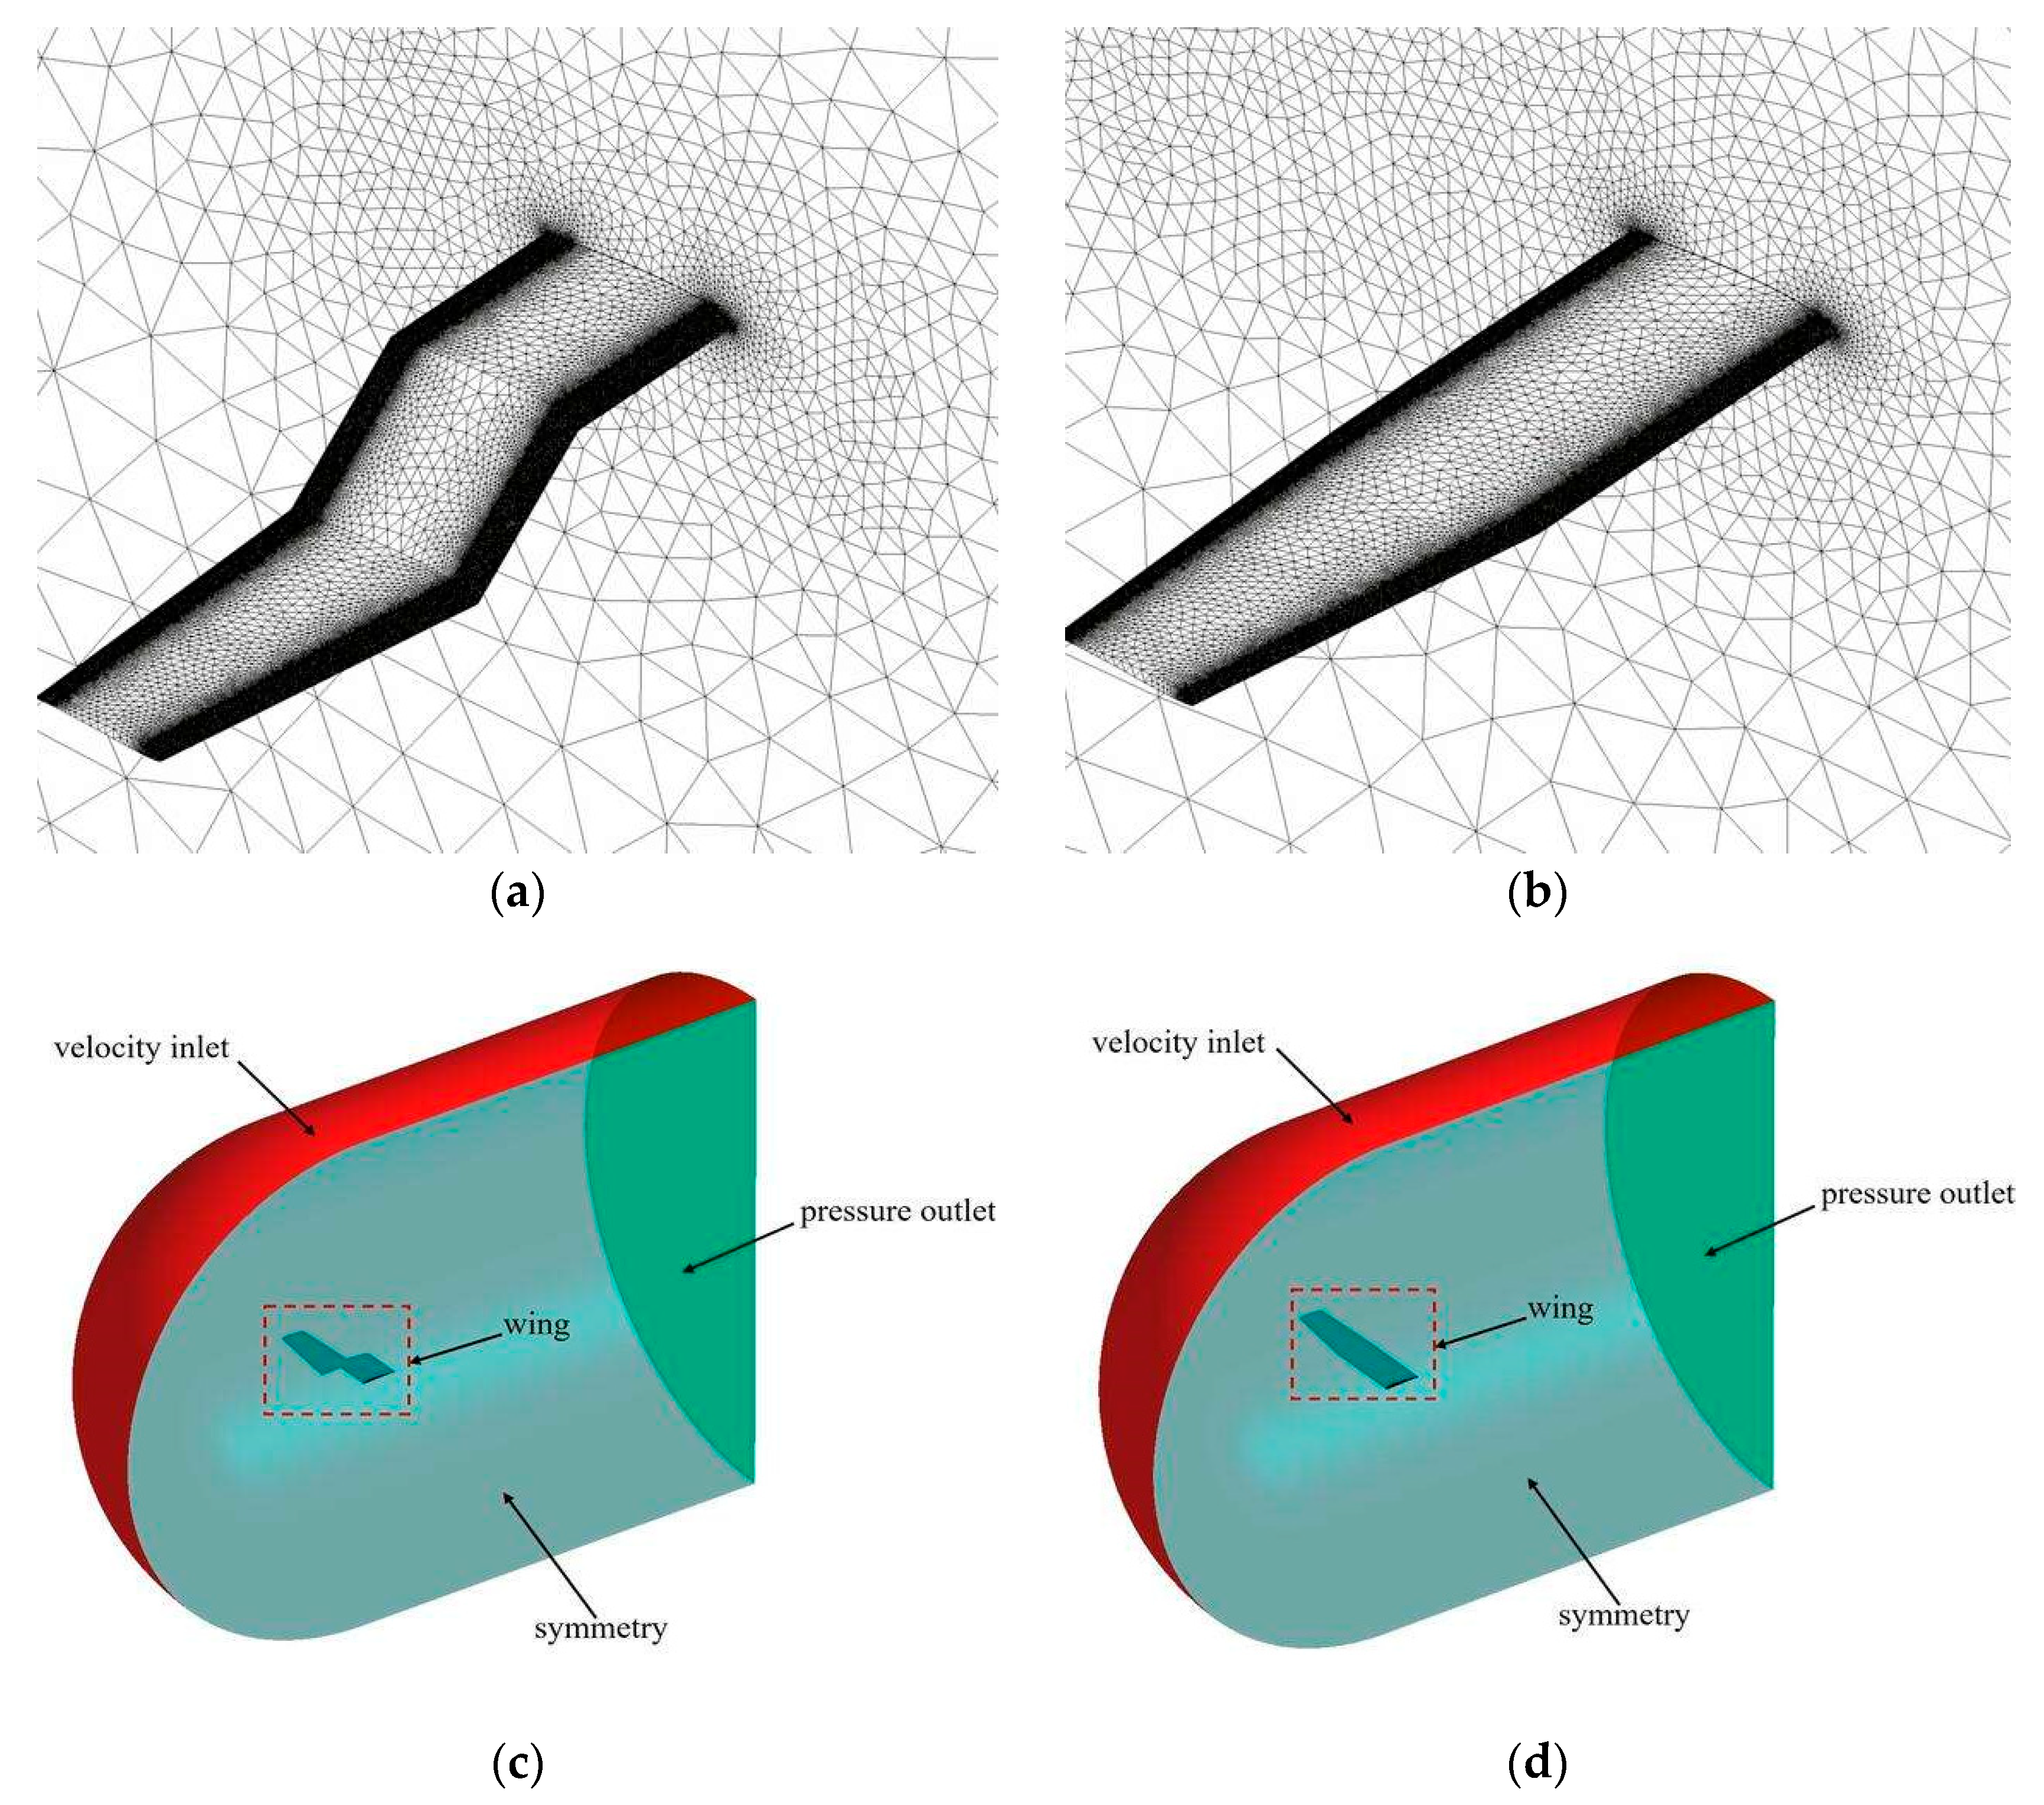
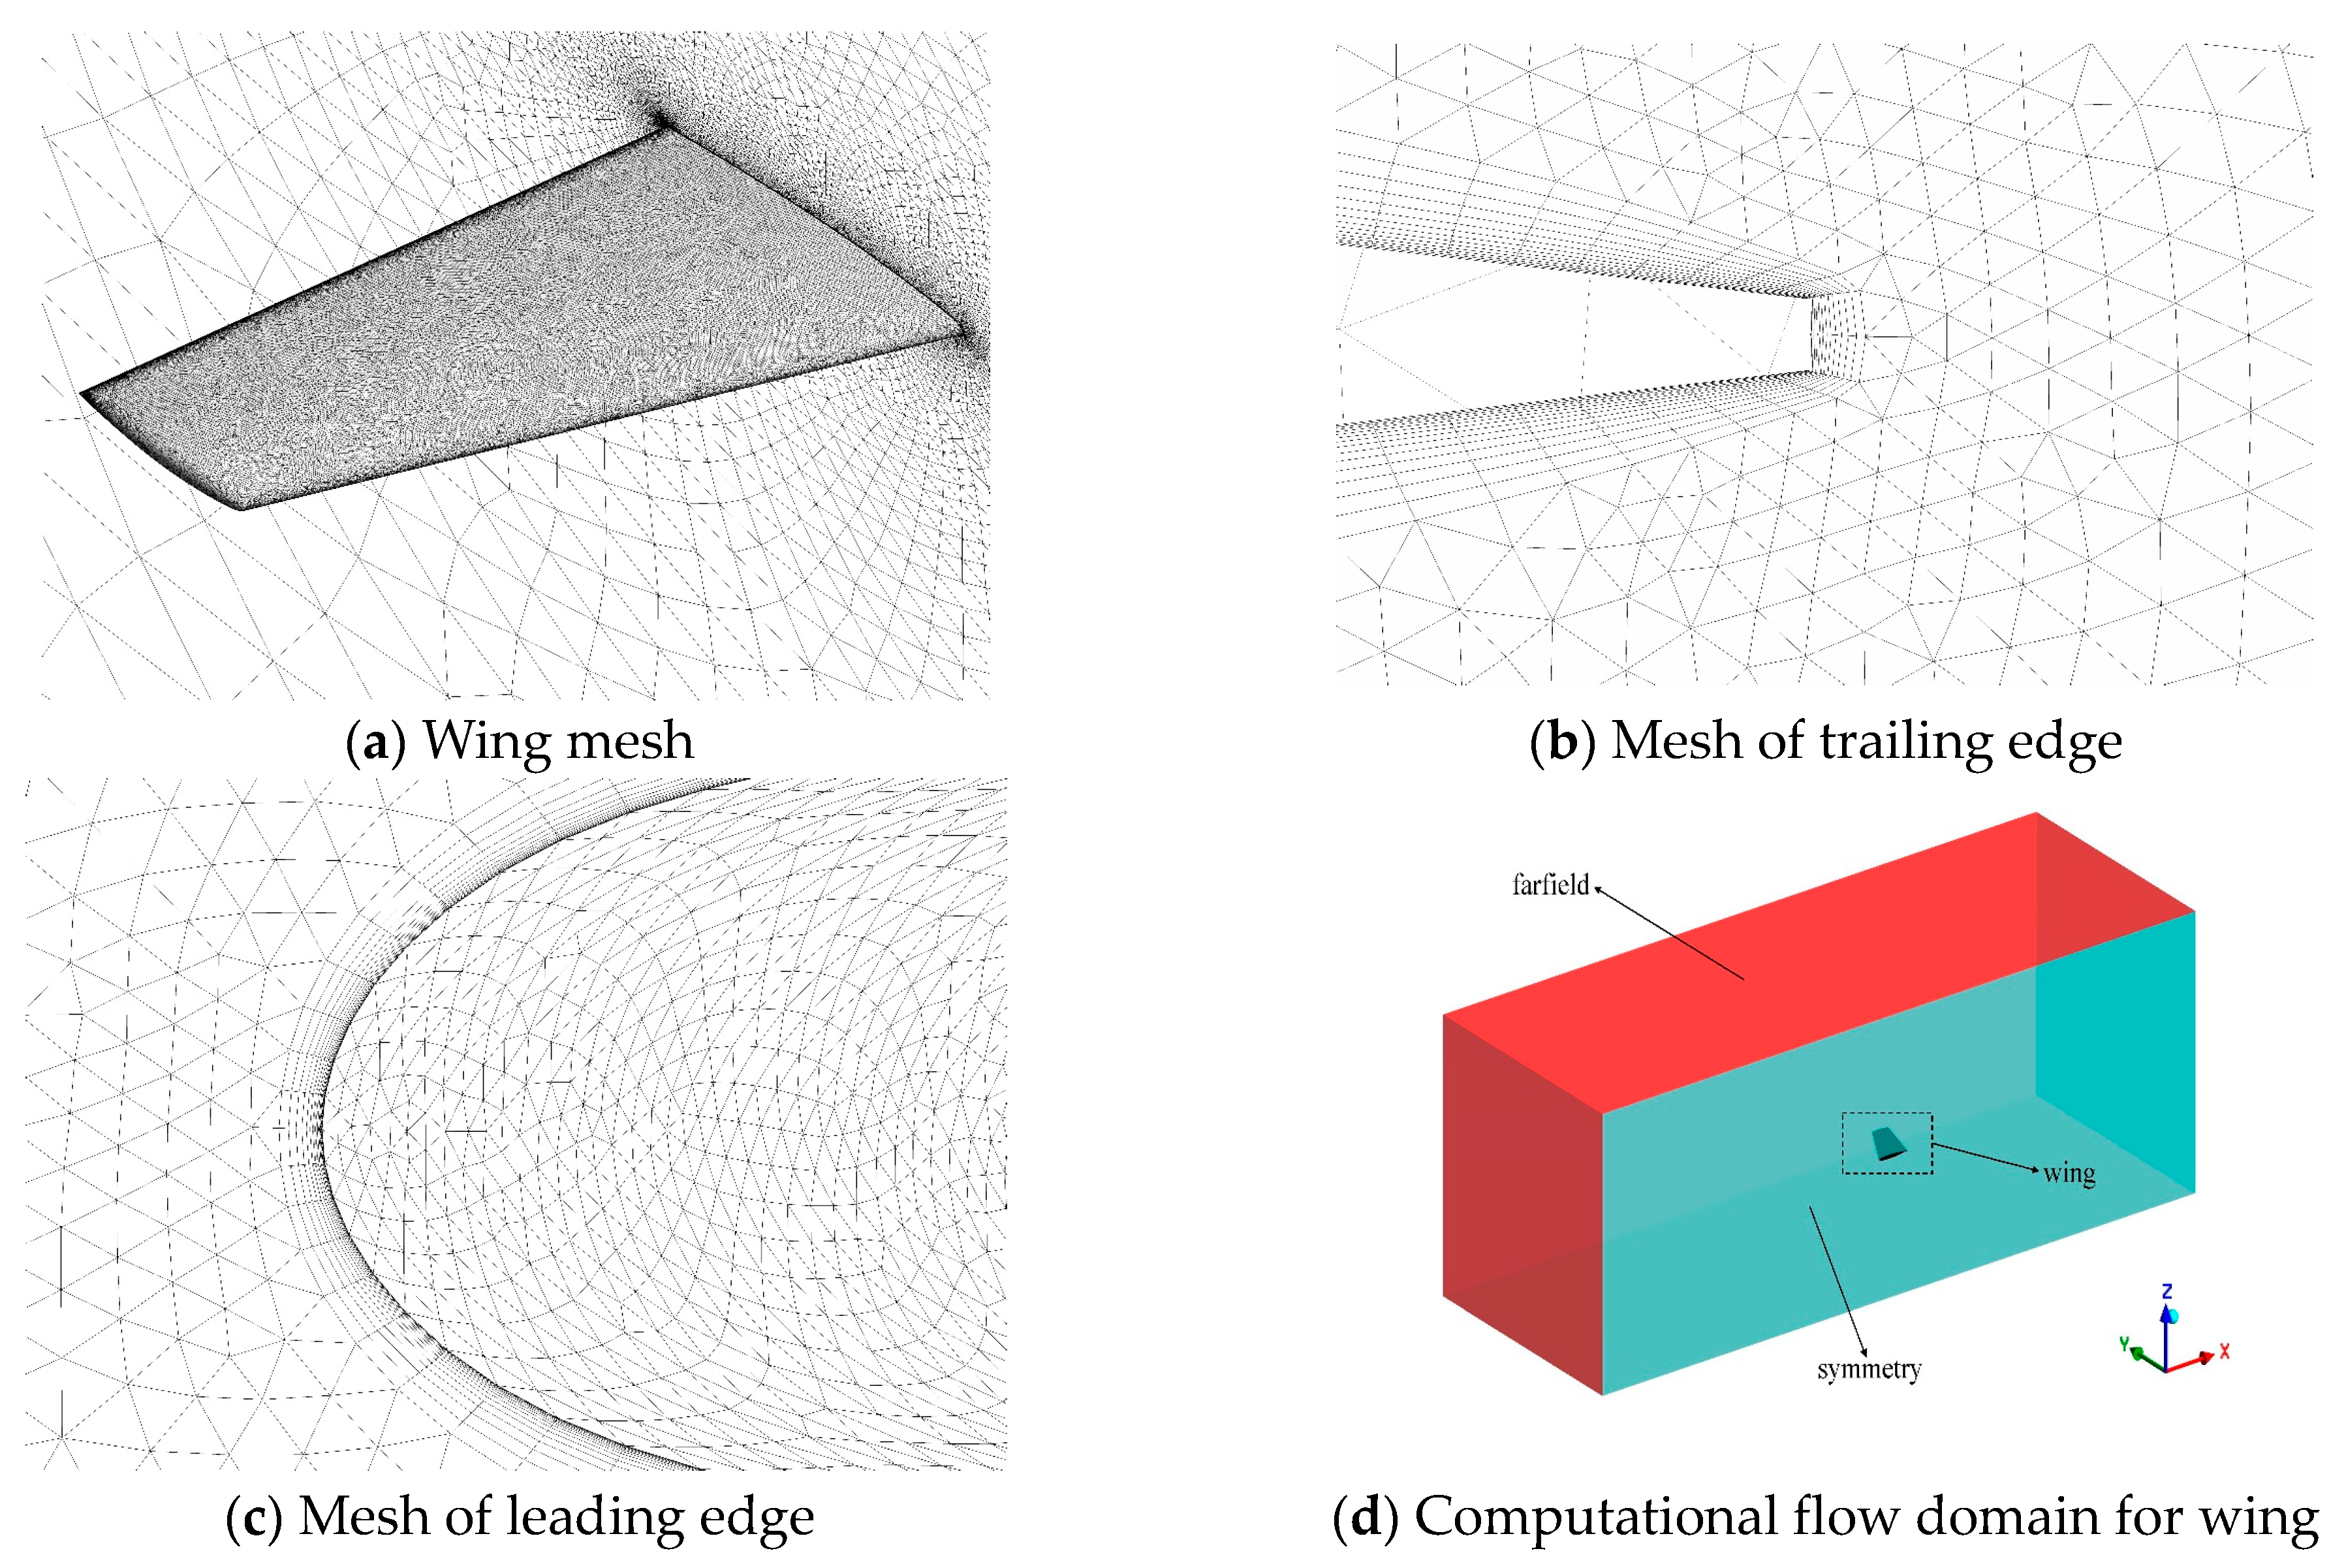
In this study, both the pressure-based Reynolds mean Navier–Stokes equation and the Spalart–Allmaras (S-A) turbulence model are used to simulate the aerodynamic characteristics of the folded wing. Firstly, in order to deal with the large-scale wall motion of the folded wing, diffusion-based smoothing techniques are used in the dynamic mesh setup. Then, during the folding process, the quality of the internal mesh is improved by the local remeshing method. In addition, Equation (10) is used to update the node position on the folded wing boundary, and the grid in the flow field is reconstructed accordingly. Since the multimesh partitioning method in Ansys Fluent is only applicable to the triangle-tetrahedron region and the mixed region, the volume mesh of the wing model is created using the tetrahedron mesh with 15 boundary layers and an offset type of last ratio.

4.2. K-Omega SST Turbulence Model Simulation

By the results of the wall spacing, the thickness of the first boundary layer is taken as 0.015 mm. The 3D model of the wing and its external flow field are locally encrypted, with an overall mesh size of 4,903,983 cells of the unfolded model, and 5,979,878 cells of the folded model. The used meshes are shown in Figure 10. The aerodynamic coefficients of the main wing are extracted by Ansys Fluent at an angle of attack from 0° to 20°.
The comparison among the three analyses in Figure 11 confirms the reliability of the predicted aerodynamic characteristics by the integrated VLM. It can be observed that as the angle of attack increases from 0° to 20°, the stall angle of attack of the Z-shaped folding wing obtained from Fluent simulation is slightly lower in both unfolded and folded states at 45°, and the lift and drag coefficients near the stall angle of attack are smaller compared to those predicted by the integrated VLM. Subsequently, there is a subsequent increase in the lift coefficient after a steep drop at higher angles of attack, which closely aligns with predictions made by the integrated VLM. The drag coefficient curve obtained from Fluent simulations for angles of attack ranging from 0° to 15° essentially coincides with results obtained using integrated VLM; however, in the post-stall region, there is a slight deviation where the drag coefficient is slightly smaller compared to predictions made by integrated VLM. This indicates that prediction results match simulation ones better at low angles of attack and provide an accurate trend in the post-stall region. However, it should be noted that results predicted using the K-omega SST model tend to underestimate values in high angle-of-attack region due to the laminar-turbulent transition effect [44,45].
In terms of pitching moments analysis, comparison between simulation results and previous study reveals similar trends with lower head moment being smaller; moreover, prediction results match simulation ones better at high angles of attack, reaching almost identical values at an angle of attack of 20° while deviating at low angles of attacks.

5. Flight Simulation

Based on the analysis results obtained from XFLR5 for the Z-shaped folding wing UAV, its longitudinal and lateral aerodynamic data are exported. Utilizing this aerodynamic data, a simulation model is established in Simulink by incorporating the control program as inputs. The resulting simulation model is then visualized using FlightGear software to obtain model outputs for visualization purposes. Additionally, relevant flight parameters of interest are extracted from Simulink for comparison through visualization and scientific research, enabling arithmetic calculations and modeling comparisons.

5.1. Simulink Model Building

The folded-wing UAV flight simulation model consists of a flight dynamics module and a flight environment module. The inputs to the model include elevator, yaw rudder, folding angle, thrust, and flight environment parameters. The outputs are the UAV’s flight state quantities such as linear velocity vector, linear displacement vector, plane displacement and altitude vector under the wind axis system, as well as airframe attitude angle vector. The flight environment module takes in the flight state quantity as input and provides output for gravity acceleration, atmospheric temperature, atmospheric speed of sound, atmospheric pressure and density (with only atmospheric density being considered here).
The flight environment module is constructed using the COESA Atmosphere model provided in the Aerospace Blockset module in Simulink, as shown in Figure 12.
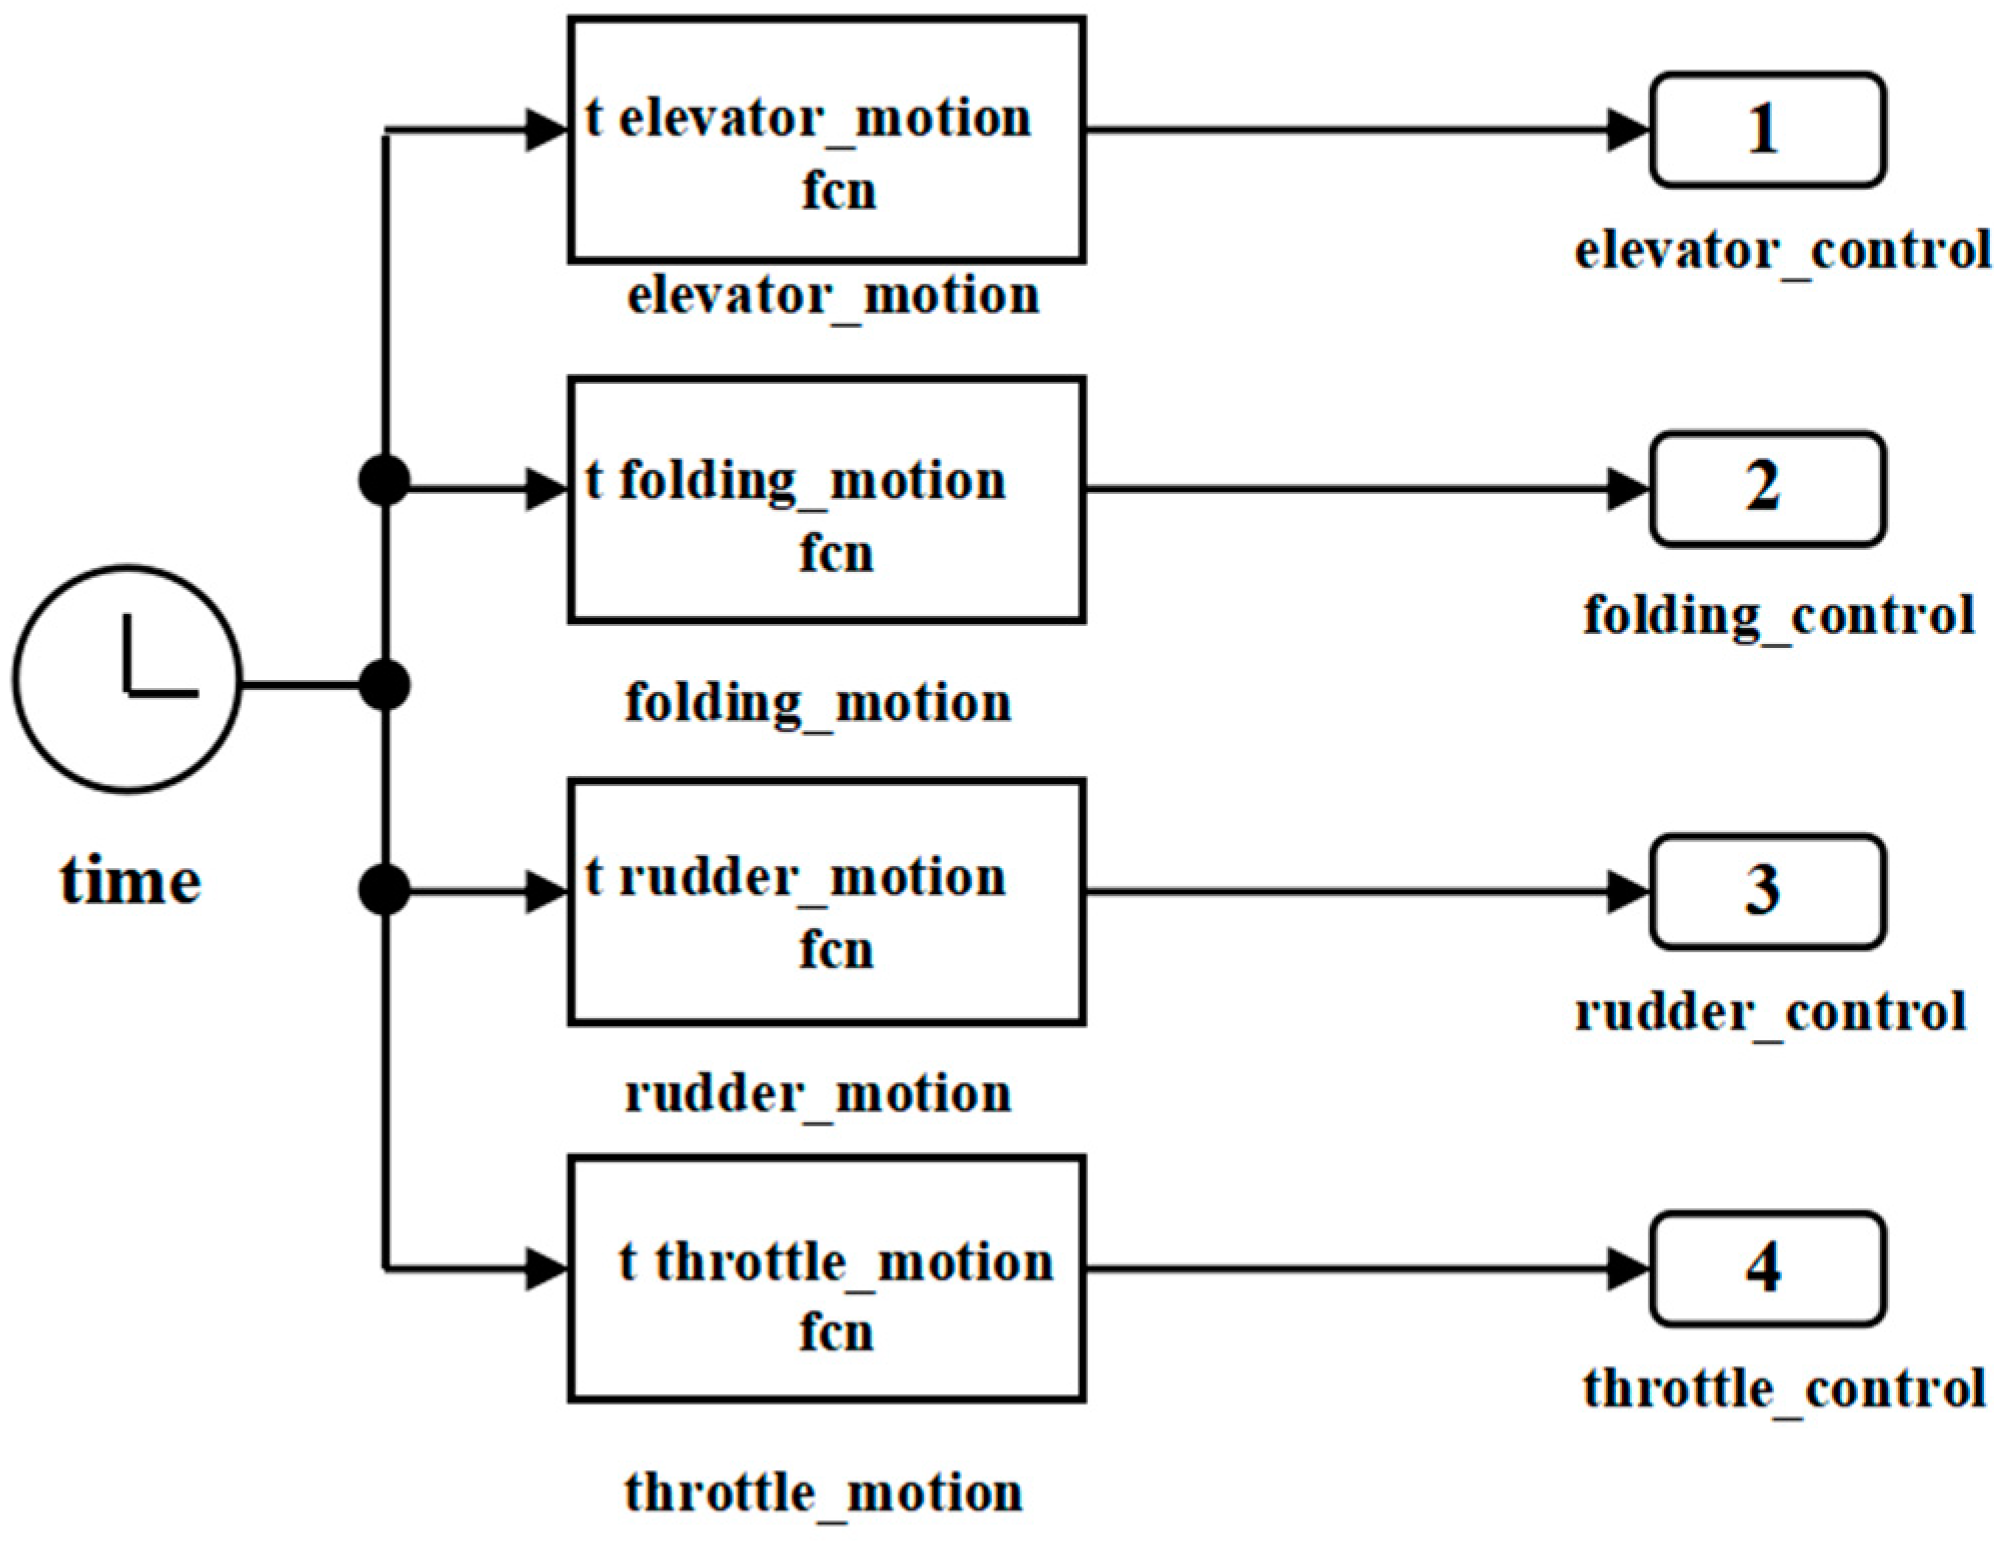
In the flight dynamics module, the subsystem contains two parts: the force and moment summation module and the 6-degree-of-freedom wind module, whose inputs are controlled by the program, which is implemented by the MATLAB function module, as shown in Figure 13. And the initial values of the flight environment parameters can be customized.
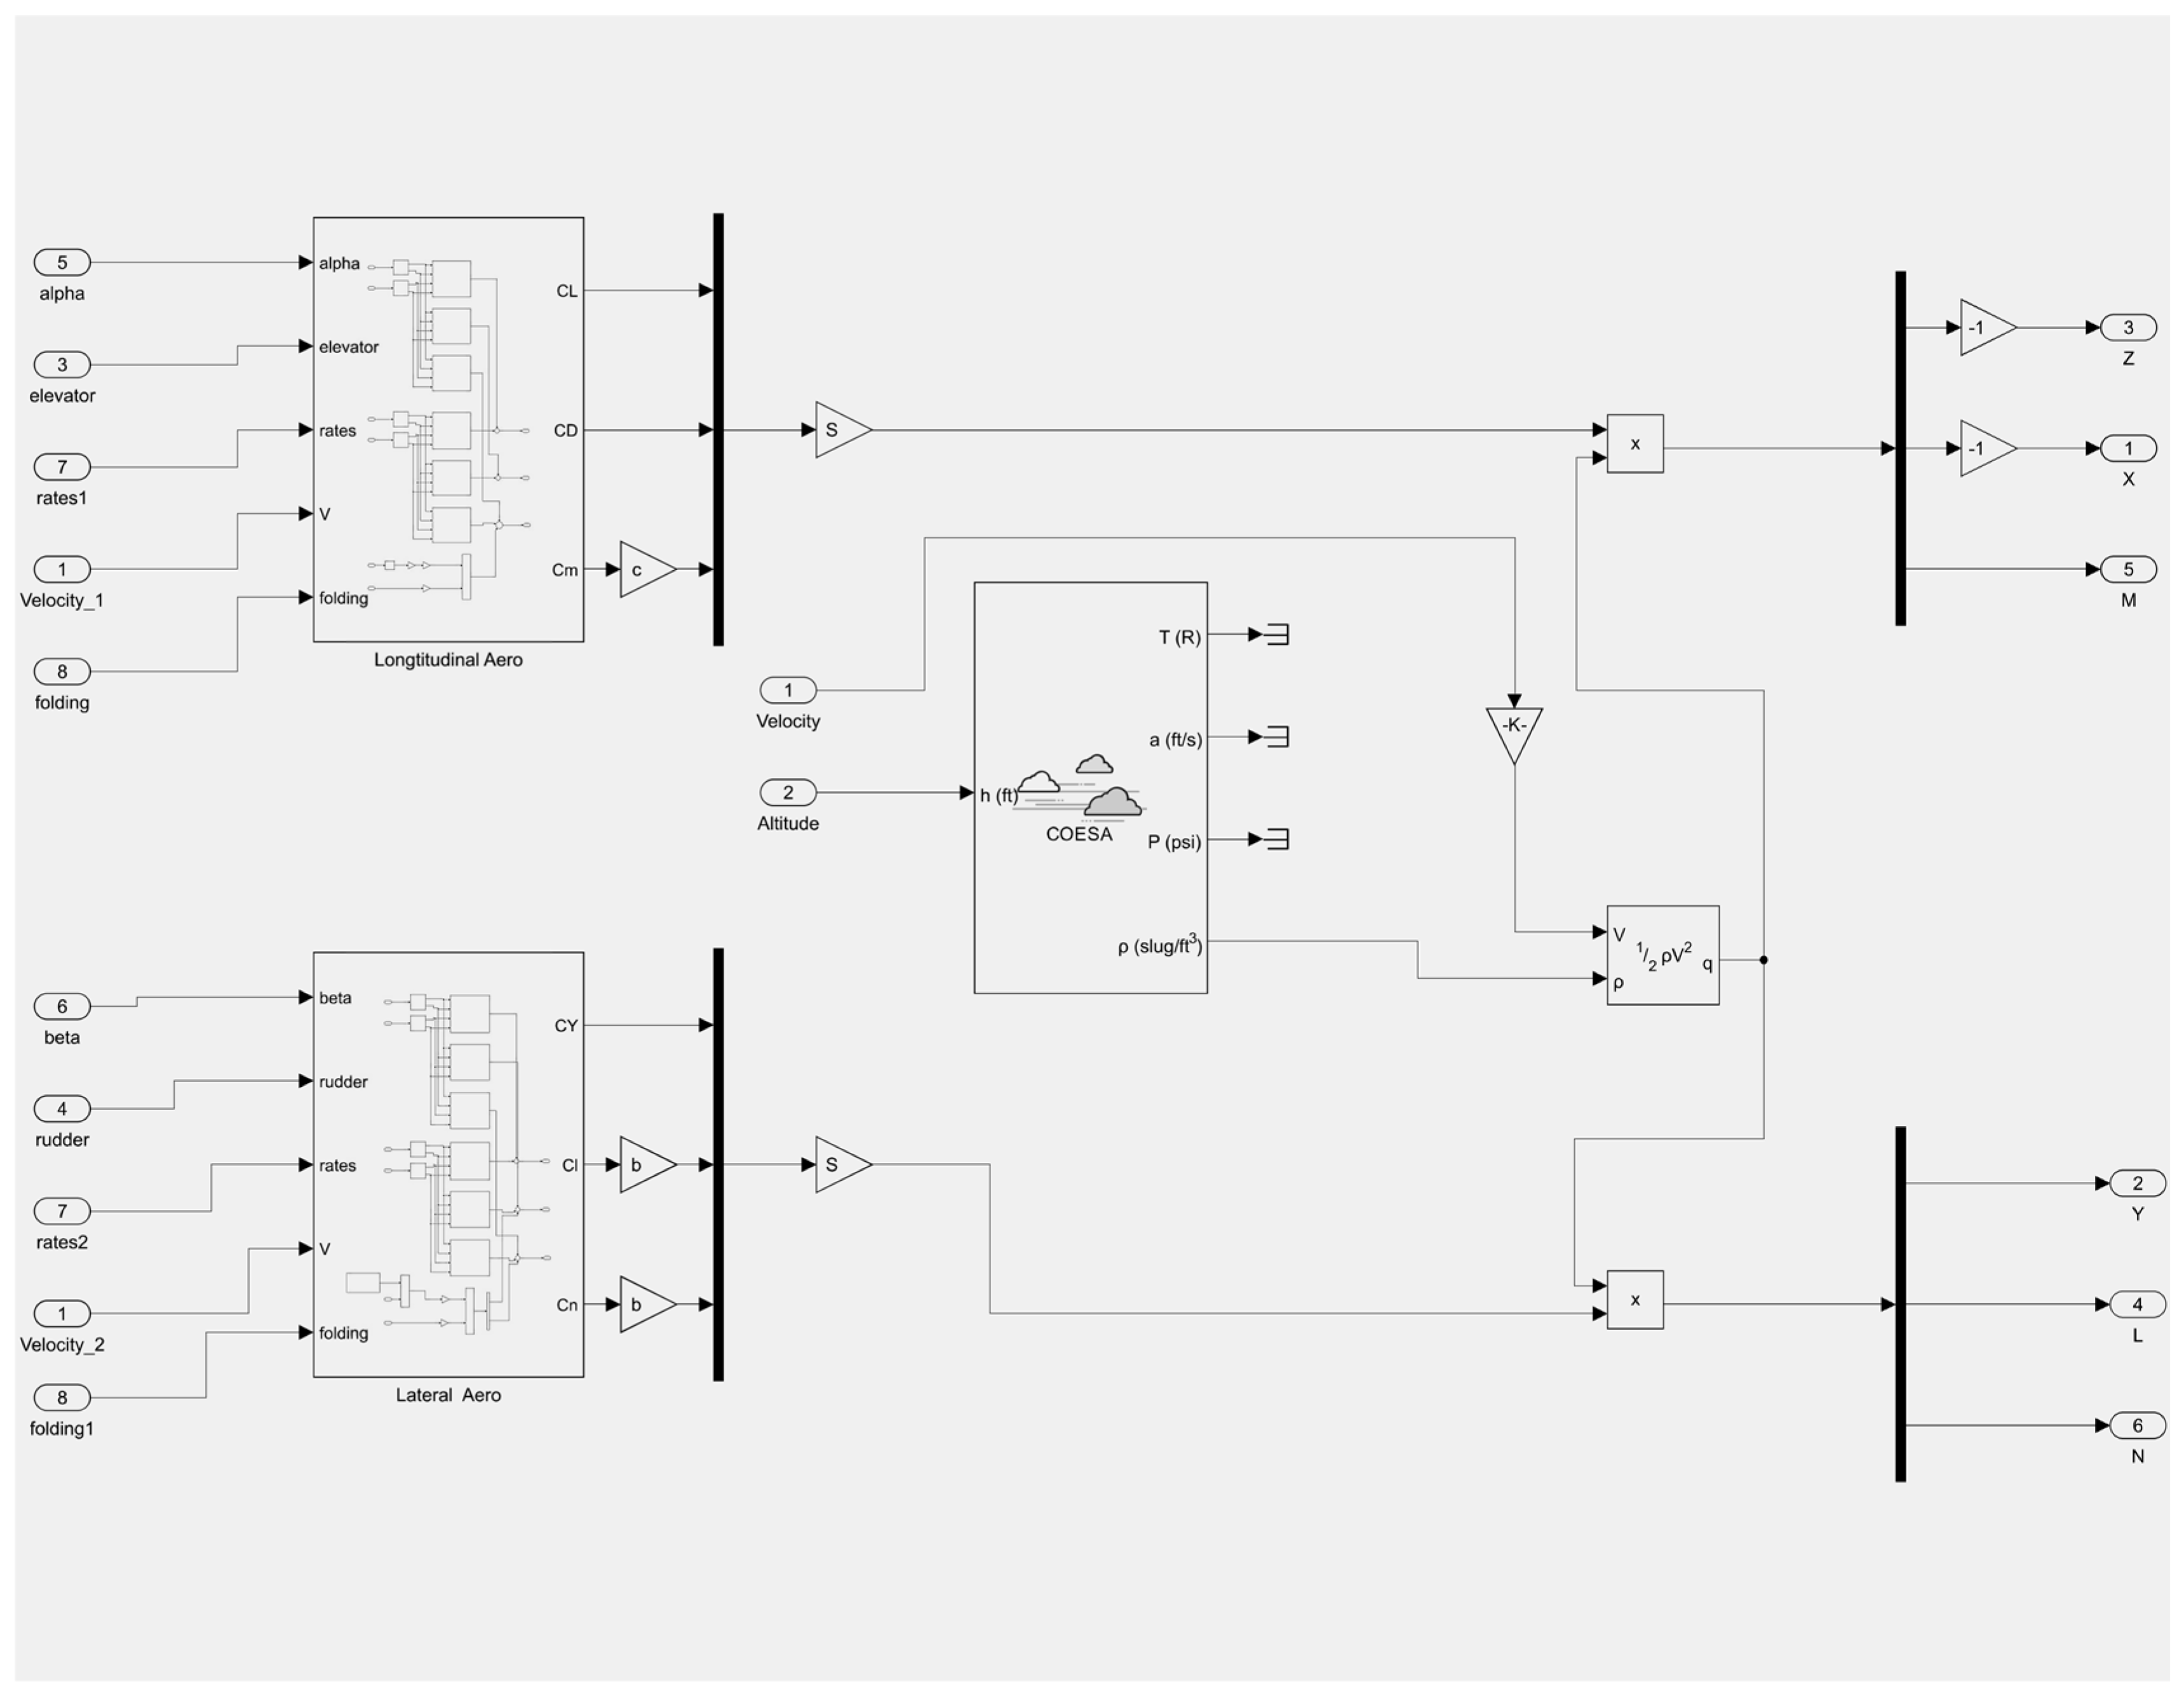
The force and moment summation module depicted in Figure 14 incorporates models for the elevator, rudder, and wing folding. Its primary function is to process aerodynamic data computed by XFLR5, with inputs including elevator maneuvering amount, rudder maneuvering amount, wing folding angle, flight environment parameters, and flight state parameters. The ultimate output comprises the combined force and moment exerted on the folded-wing UAV.
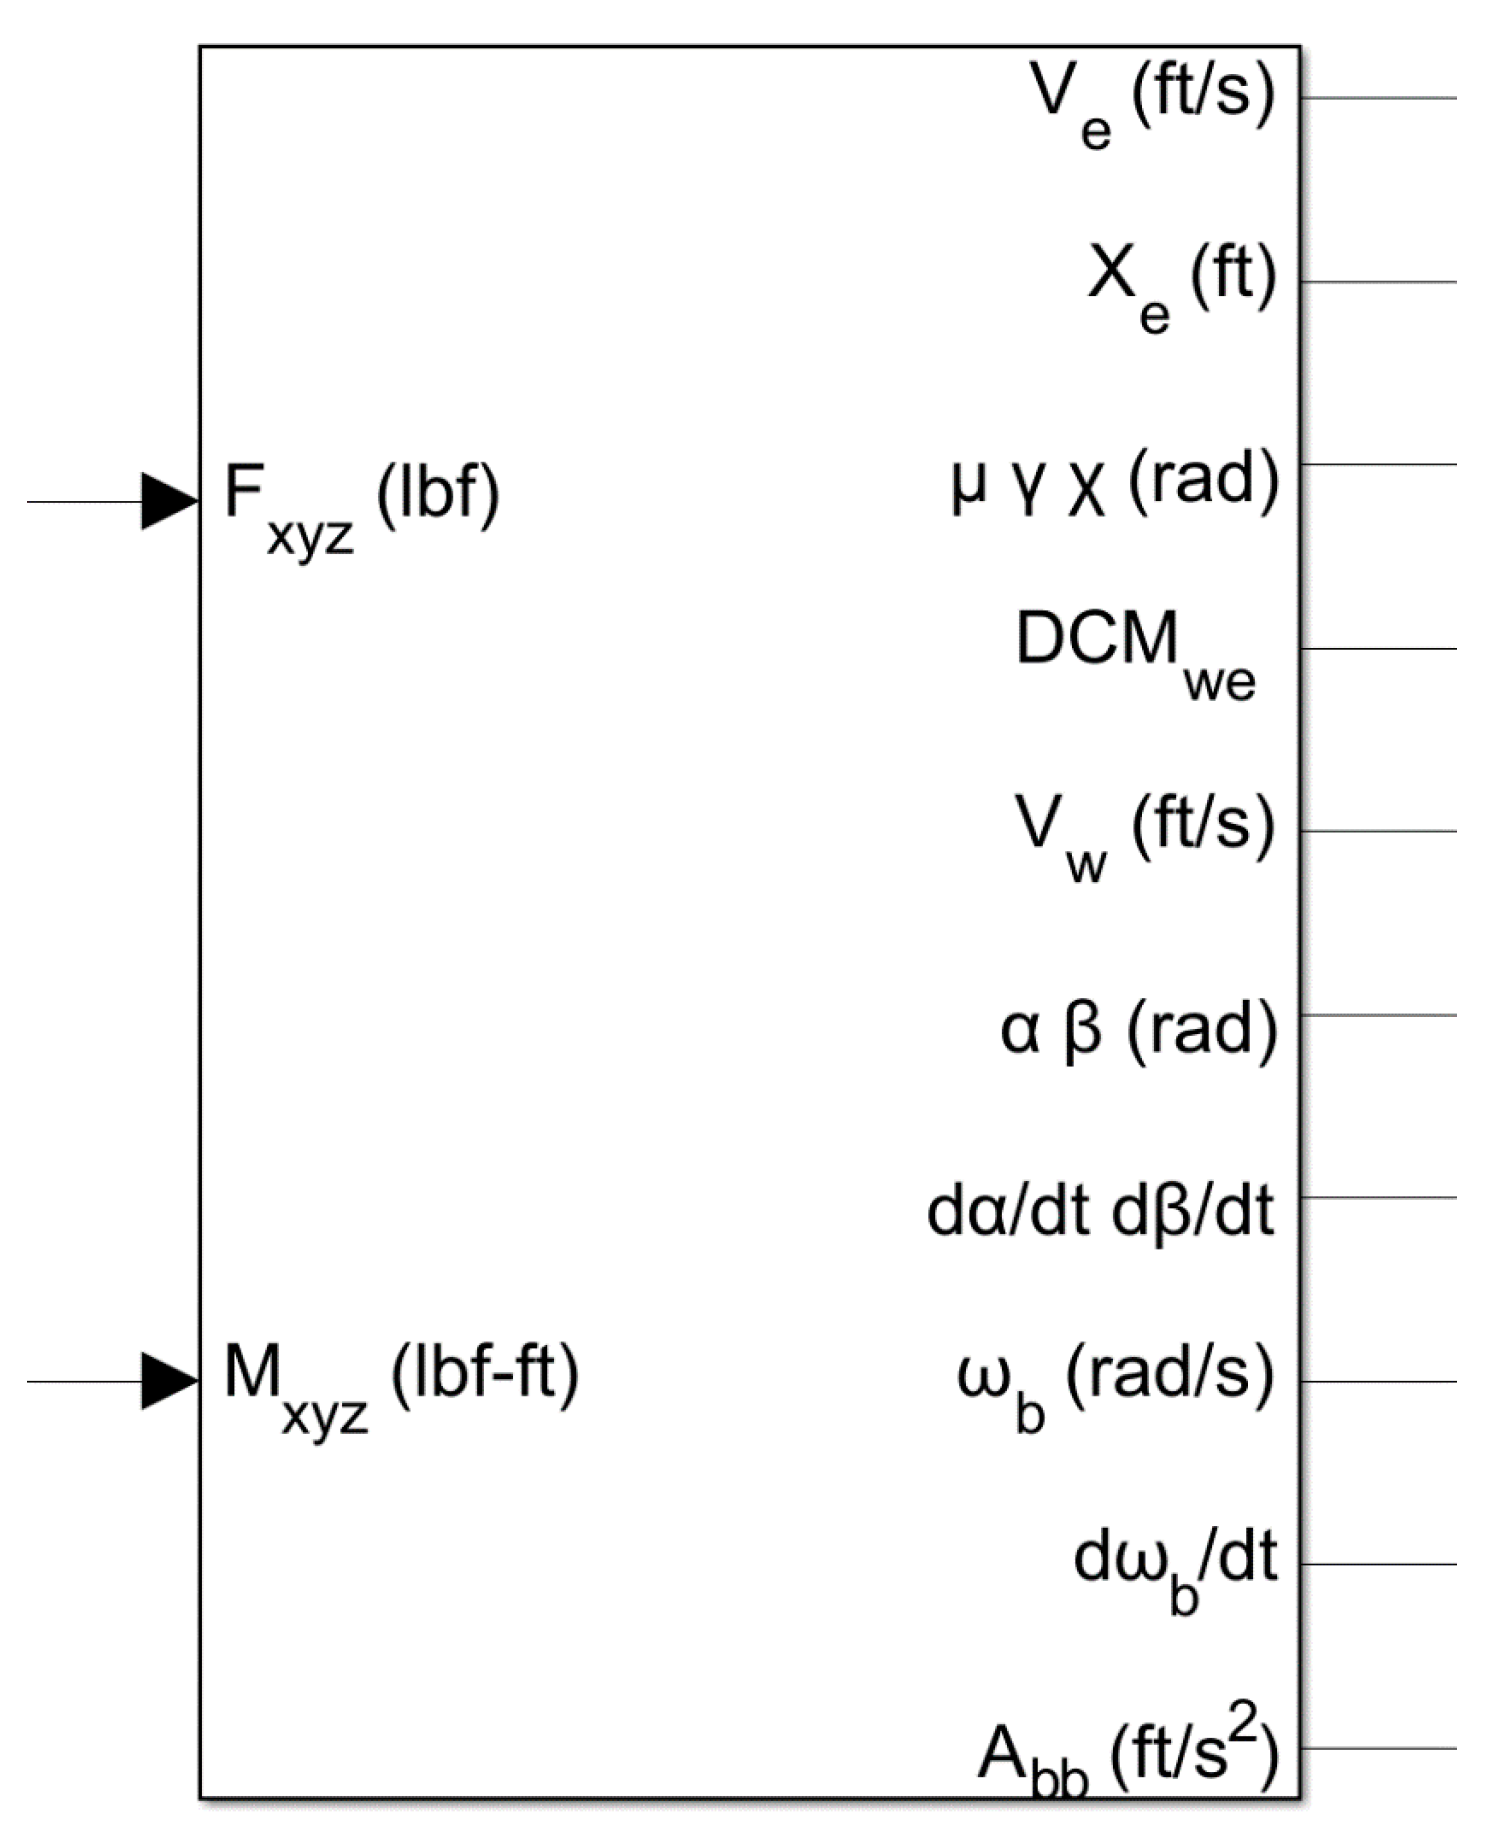
After the force and moment are calculated by the 6-degree-of-freedom wind module in Figure 15, they are then passed to the force and moment summation module. The resulting flight state parameters are outputted to the navigation module, where they undergo coordinate conversion before being visualized using the flightgear visualization module in order to achieve flight visualization functionality as shown in Figure 16.

5.2. Simulation Results

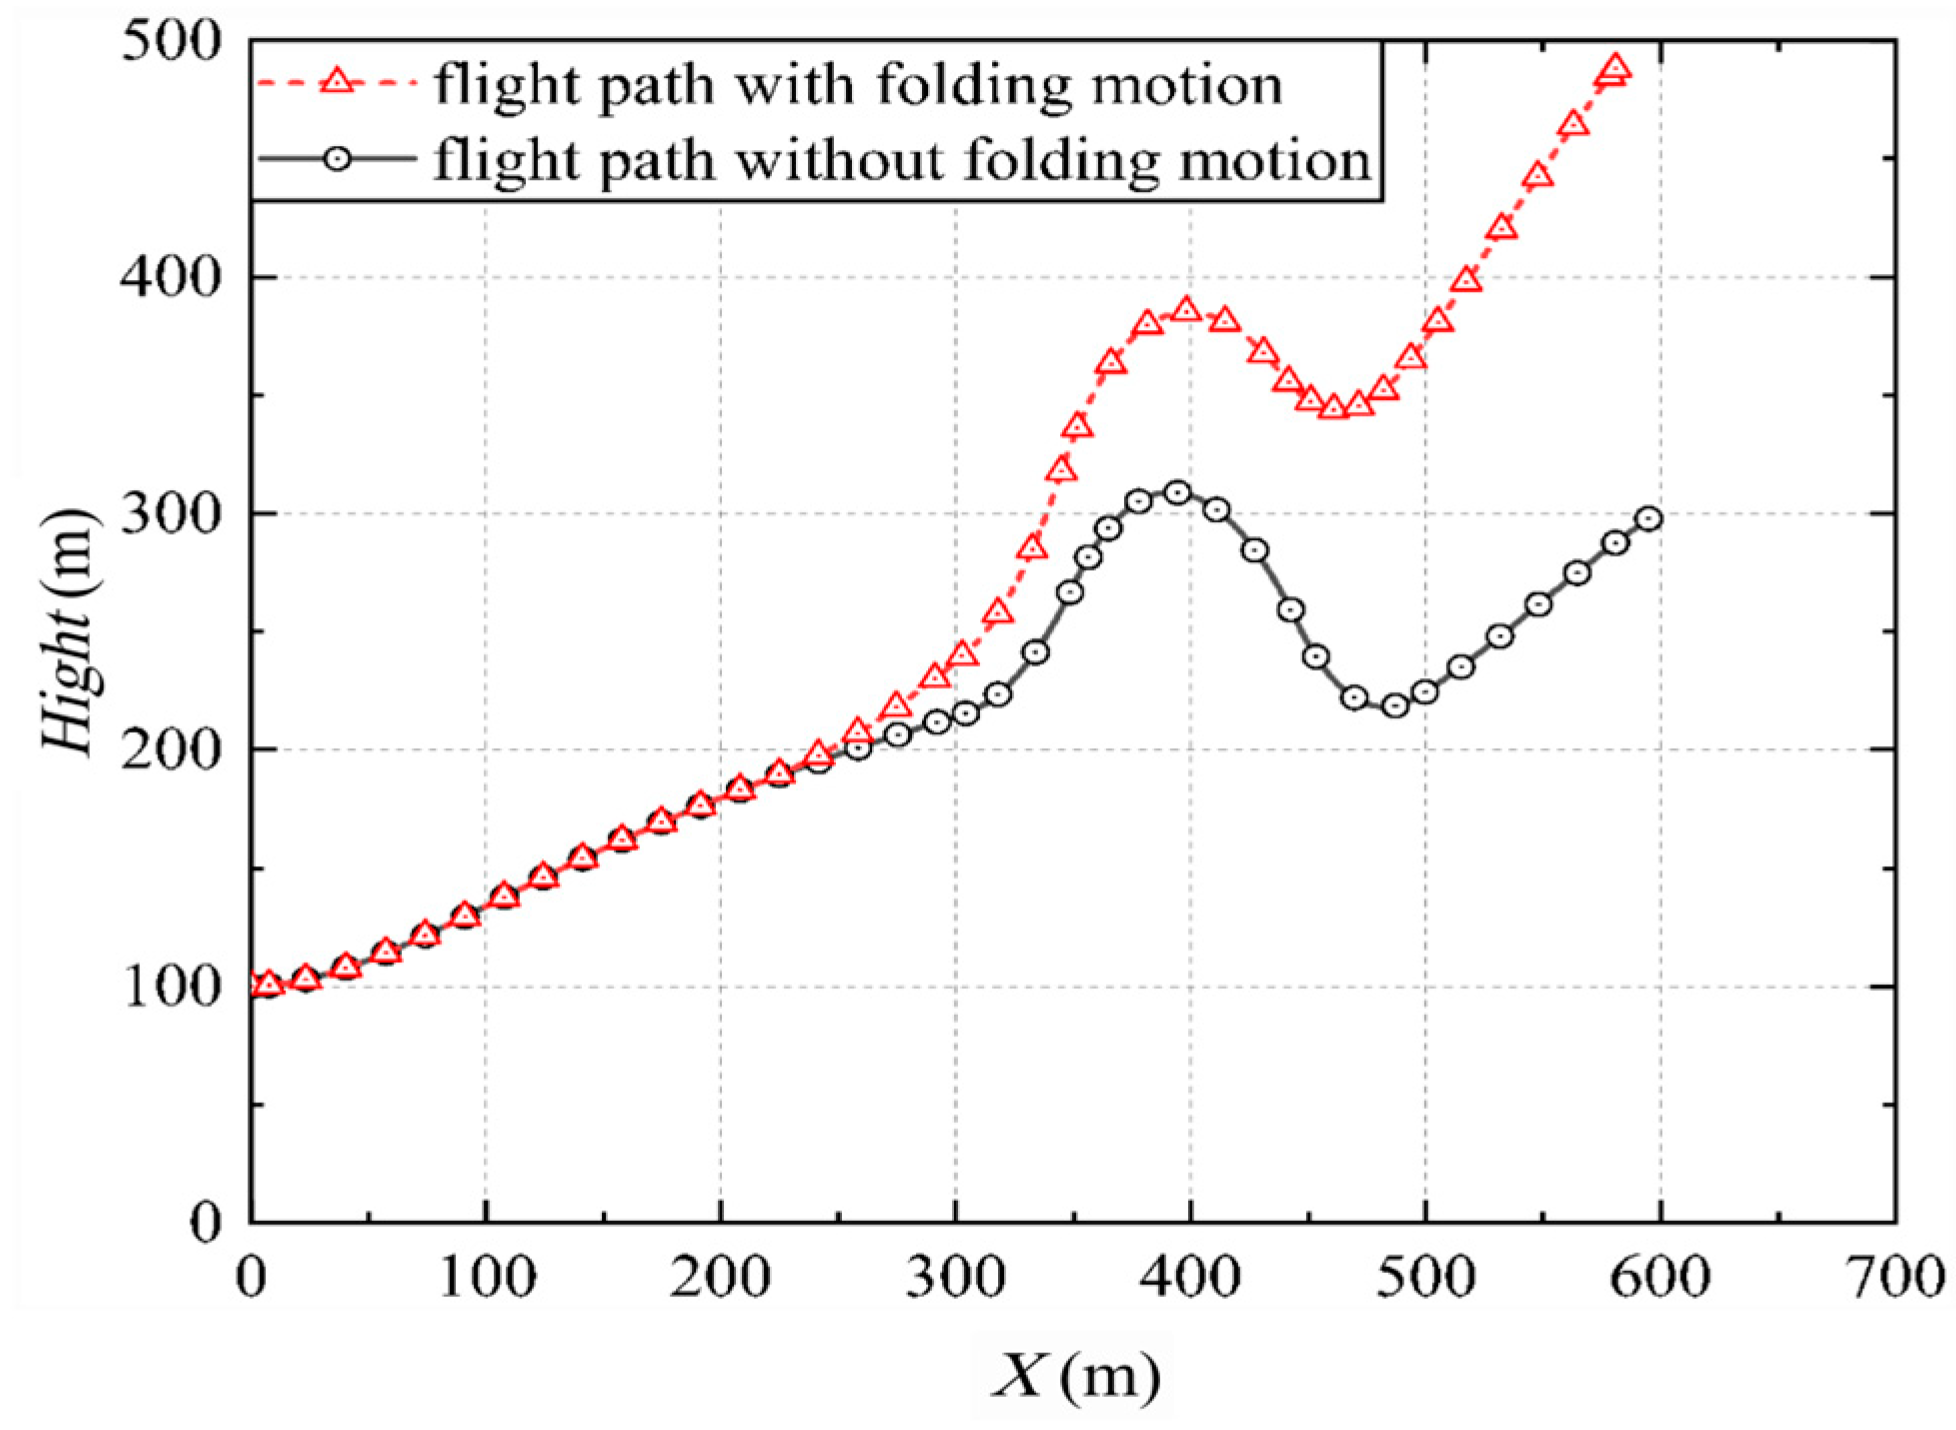
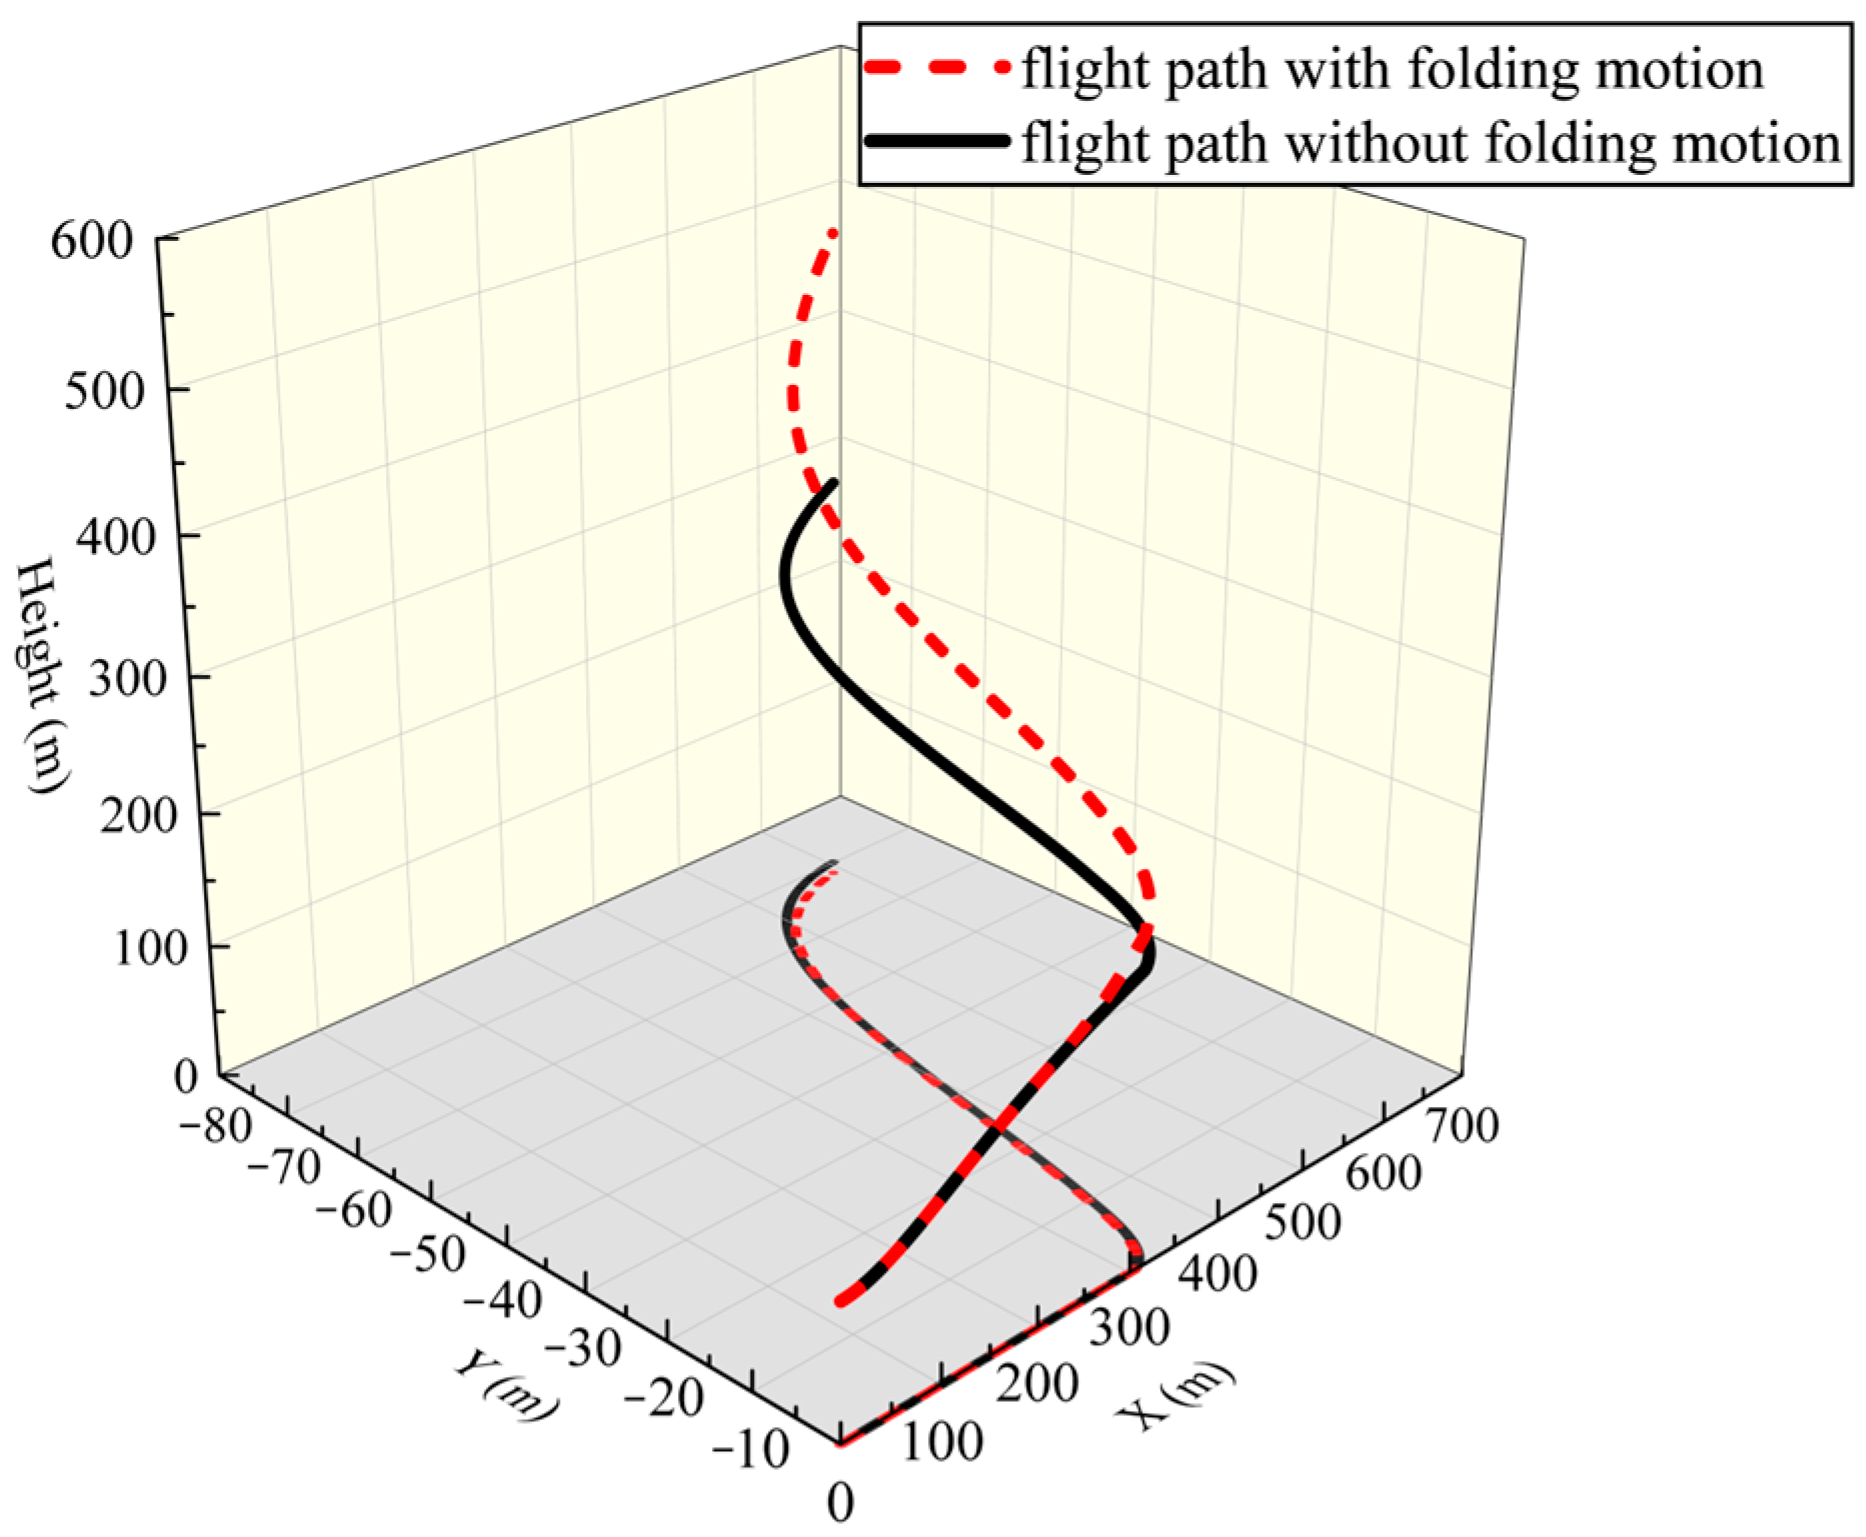
Following an extensive aerodynamic analysis conducted by XFLR5 across a range of folding angles (0°~90°), and elevator and rudder control angles (−15°~15°), the data generated were incorporated into the flight simulation model. Various flight missions involving wing folding and unfolding actions were executed under programmed control parameters. Initially, a flight mission without any elevator or rudder deflection was performed at a speed of 10.3632 m/s for 60 s, during which the wing was folded at 90 degrees between the 30th and 50th seconds, and then unfolded after the 50th second. The folding and unfolding maneuvers each lasted 3 s, and the flight path is visually represented in Figure 17. Comparing the pitch angle–time diagrams depicted in Figure 18, it is evident that, in the folded state, the vehicle’s pitch angle increases, leading to a higher climb rate. Conversely, after unfolding, the pitch angle decreases. The folded wing did not cause a reduction in altitude due to decreased lift; instead, it led to an increase in the climb rate due to a decrease in the nose-down pitching moment.
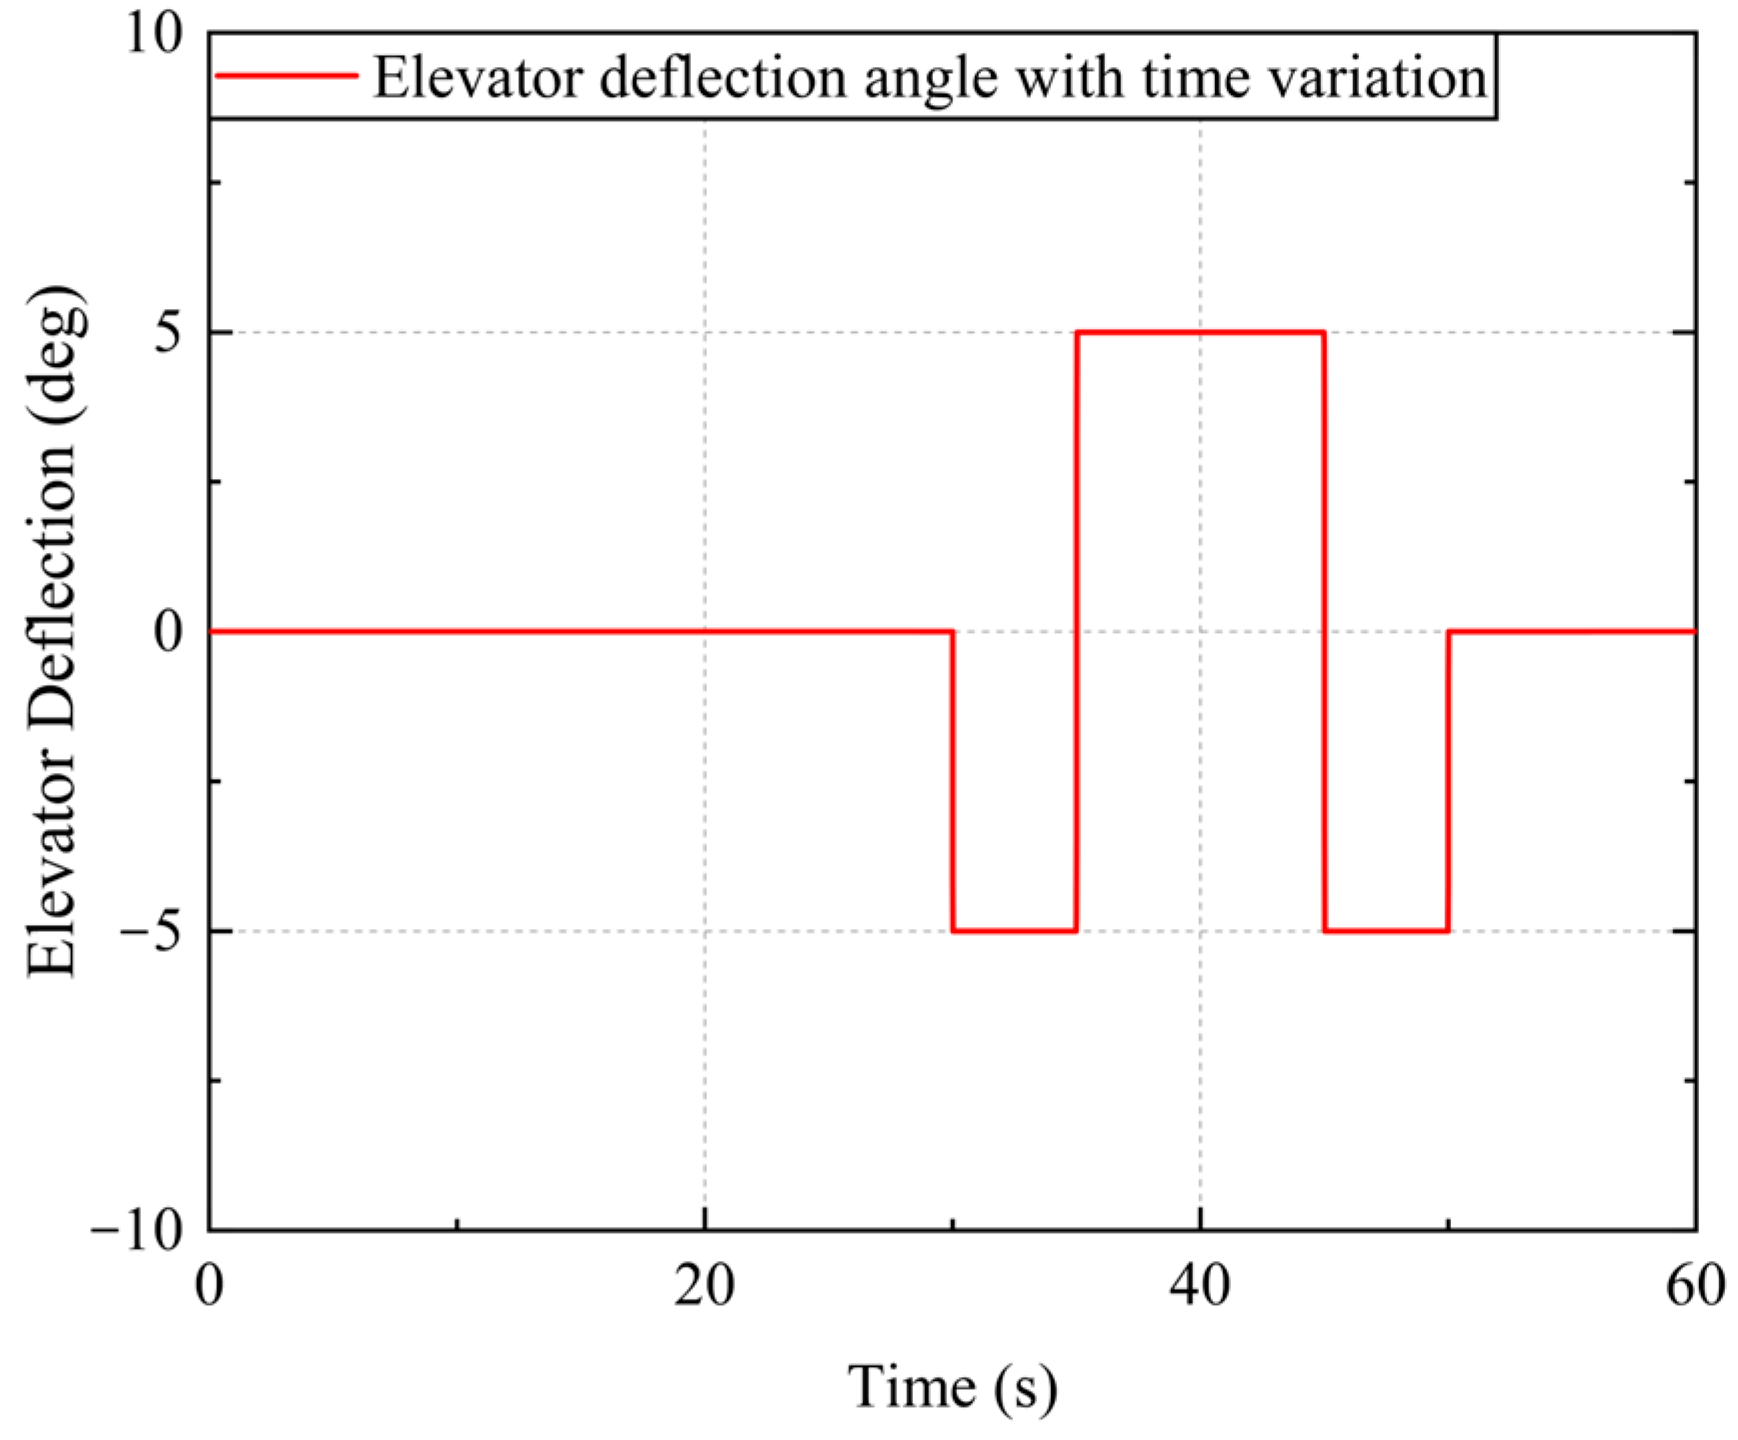
Subsequently, a flight mission was conducted with elevator deflection at a constant speed of 10.3632 m/s for 60 s. This time, the wing executed the folding maneuver prior to the elevator deflection and maintained its folded state throughout the entire mission. Figure 19 and Figure 20 depict the flight path and elevator deflection, respectively. Comparative analysis of pitch angle–time plots in both folded and unfolded states, as shown in Figure 21, revealed a greater pitch angle in the folded state when subjected to identical elevator deflection conditions. Consequently, the folded wing UAV exhibited an increased climb rate within the same time duration compared to its unfolded counterpart. Furthermore, upon altering rudder deflection for the first time under identical flight control parameters, it was observed that there was a significantly higher pitch angle rate in the folded state as illustrated in Figure 22; however, subsequent opposite rudder deflections showed only marginal disparity in pitch angle rates between both folded and unfolded states. This implies that during climbing maneuvers, the folded UAV demonstrated enhanced maneuvering efficiency while maintaining comparable maneuvering efficiency during diving maneuvers.
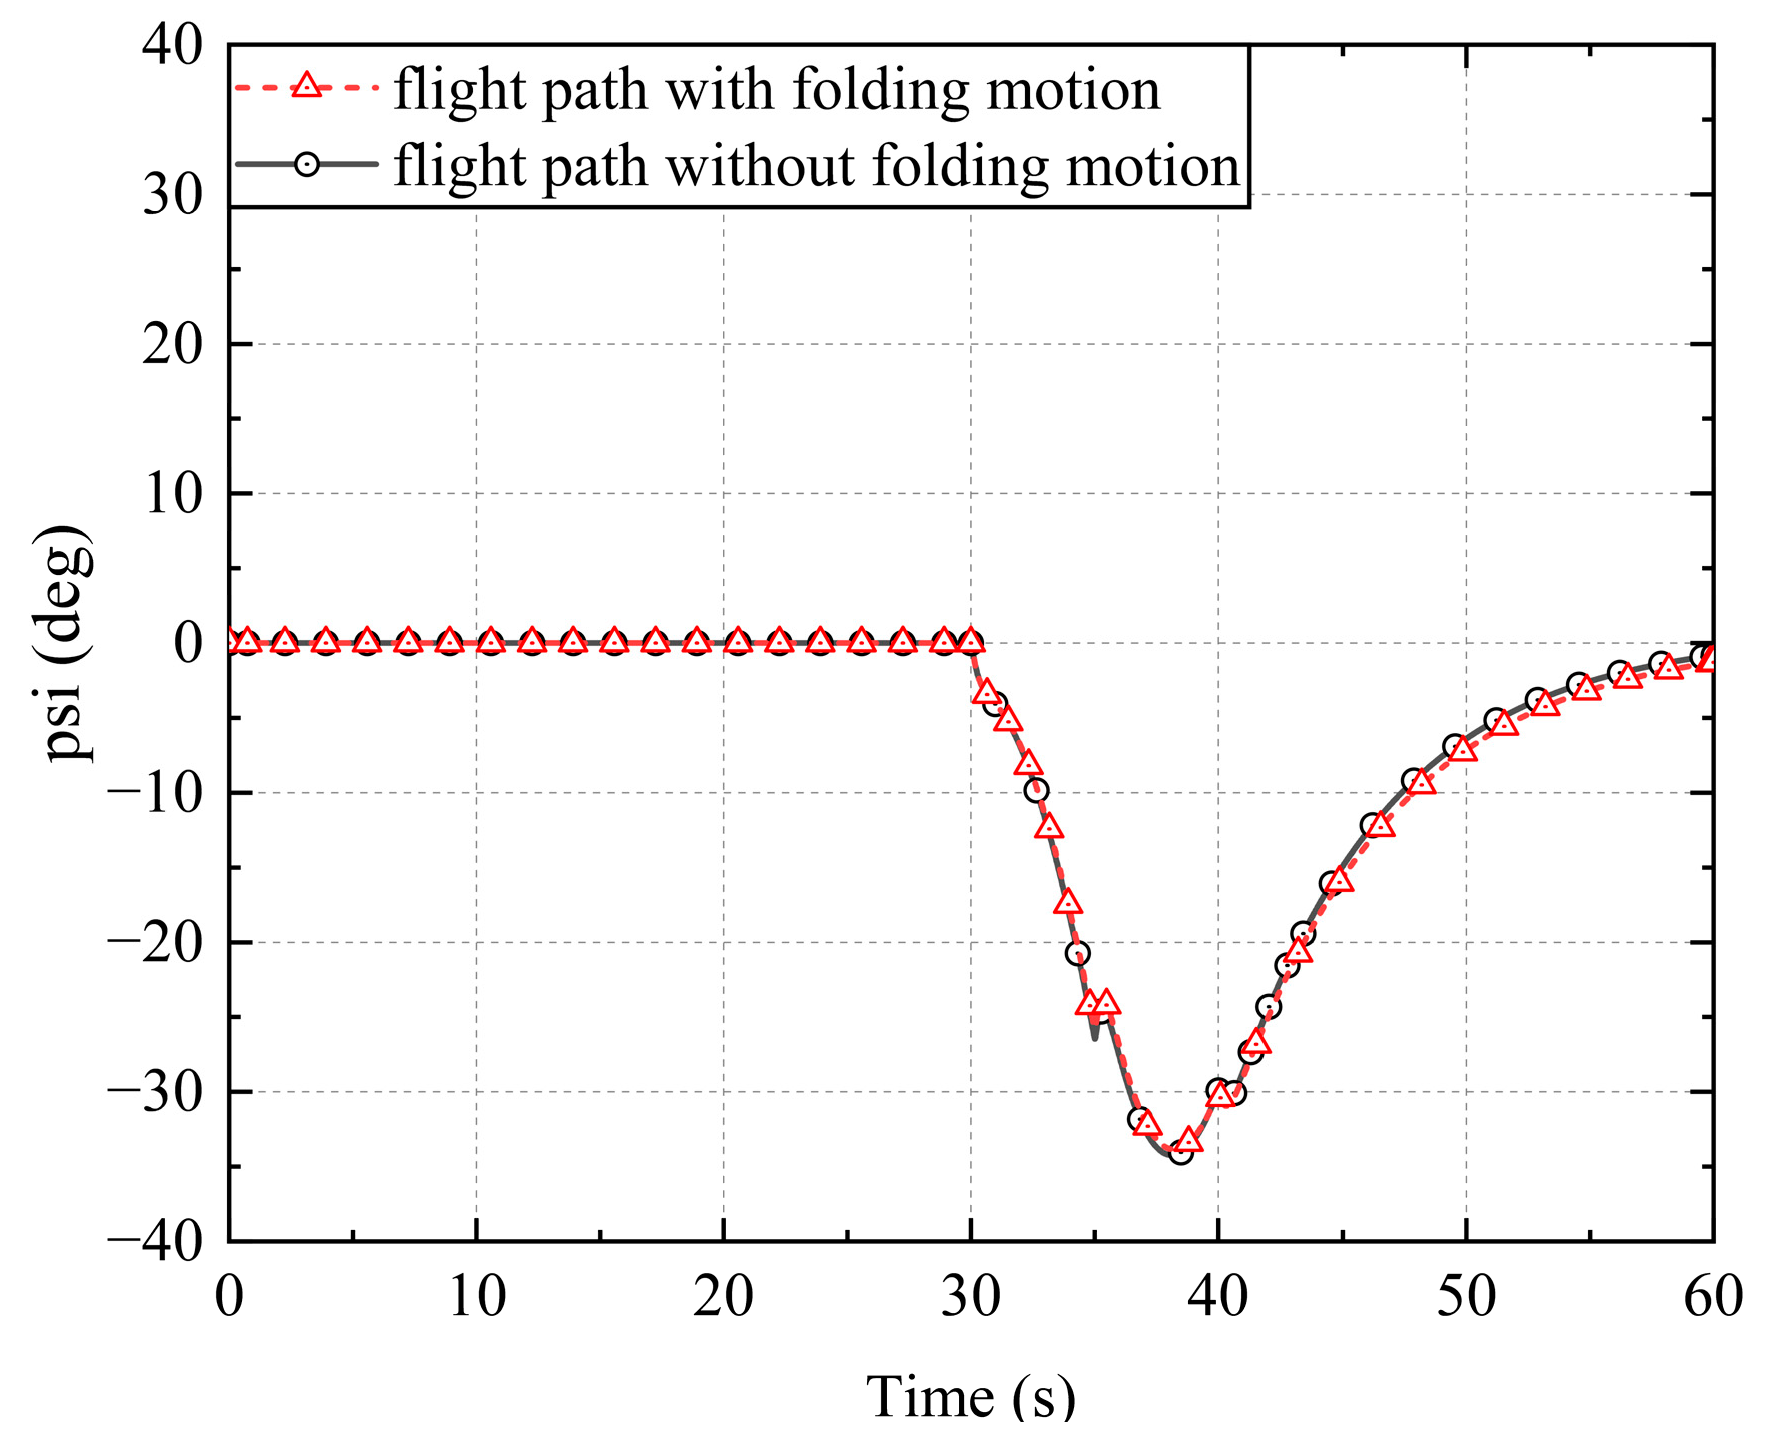
Similarly, a flight mission was conducted involving rudder deflection at a velocity of 10.3632 m/s for a duration of 60 s. Flight path diagrams and rudder deflection can be observed in Figure 23 and Figure 24, respectively. Comparative analysis of the yaw angle–time and roll angle–time plots in both folded and unfolded states depicted in Figure 25 and Figure 26 revealed minimal impact on lateral flight conditions resulting from wing folding. The folding effect primarily manifested itself in altitude changes on the flight path diagram, with only slight variations in orientation.
In summary, the vertical maneuvering efficiency of the Z-shaped folding wing UAV improved after wing folding actions, primarily observed in the climb rate, while lateral maneuvering efficiency remained largely unaffected. Despite a reduction in lift resulting from the folding maneuver, there was only a subtle impact on wing leveling. However, due to a decreased nose-down pitching moment, there was a slight increase in pitch angle, leading to an ascent in flight altitude, which can be mitigated by making minor adjustments to elevator deflection.

6. Conclusions

This study presents a rapid approach adopted for the analysis of the Z-shaped folding wing UAV. Through determining the appropriate UAV main wing and the overall UAV dimensions, the optimization parameters of each folding wing configuration are analyzed. Moreover, aerodynamic characteristics in the pre- and post-stall regions are analyzed through the lift and drag characteristics of the wing model when unfolded and at a 45° folding angle.
The simulation revealed that the Z-shaped folding wing UAV enhances climbing efficiency without compromising its ability to execute dive actions effectively. The impact of the folding maneuver on the vehicle primarily manifests in the alteration of the longitudinal pitch angle and the folding maneuver facilitates faster climbing owing to the decrease in the low head moment. In addition, the results also indicate that AERODAS is a suitable theoretical tool to analyze the aerodynamic analysis of the morphing aircraft with unusual aerodynamic shapes, such as Z-shaped folding wing UAVs, and the integrated VLM can capture the stall characteristics of the morphing wing with large-scale geometric configuration changes accurately and rapidly.
Since the original prototype design and flight test of folding wing aircrafts are necessary verification means, we will conduct more comparative analyses between the theory and experiments in the next plan due to limited space.
Author Contributions

Methodology and software, J.-G.W.; formal analysis and investigation, X.-Y.G.; writing—original draft preparation, X.-Y.G.; writing—review and editing, J.-G.W. All authors have read and agreed to the published version of the manuscript.

Funding

This research is funded by the National Natural Science Foundation of China, grant numbers 12172014, U2241264 and 11972050 and the National Key Laboratory of Helicopter Aeromechanics Fund (61422202206).

Data Availability Statement

The data that support the findings of this study are available on request from the corresponding author.

Acknowledgments

The authors thank all the reviewers for constructive suggestions.

Conflicts of Interest

The authors declare that they have no known conflicts of interest or personal relationships that could have appeared to influence the work reported in this paper.

Nomenclature

SymbolSignificance
T Aircraft propulsion
W Aircraft weight
S Aircraft wing area
q 1 ~ q 4 Dynamic pressure
C D min Minimum drag coefficient
k -Induced drag coefficient
V V Vertical climb speed
V c l i Climbing speed
V L O F Lift off speed
S G Run distance
C D T O Drag coefficient at takeoff
μ 3 The friction coefficient of the runway
C L T O Lift coefficient at takeoff
Re Reynolds number
V Incoming flow velocity
L M A C Mean aerodynamic chord
μ 5 Dynamic viscosity
C f Skin-friction coefficient
τ w a l l Wall shear stress
U Free-stream velocity
U f r i c Friction velocity
y + The distance from the wall to the Measuring point

Appendix A

According to the 2308 test in the AGARD report [45], with the initial flow conditions shown in Table A1, the Reynolds number is 11.72 million, and the average aerodynamic chord length is 0.64607 m. Figure A1 shows the used grid.
Figure A1. ONERA M6 wing model meshed.
Aerospace 11 00769 g0a1
Figure A2. The seven sections of the ONERA M6 wing.
Aerospace 11 00769 g0a2
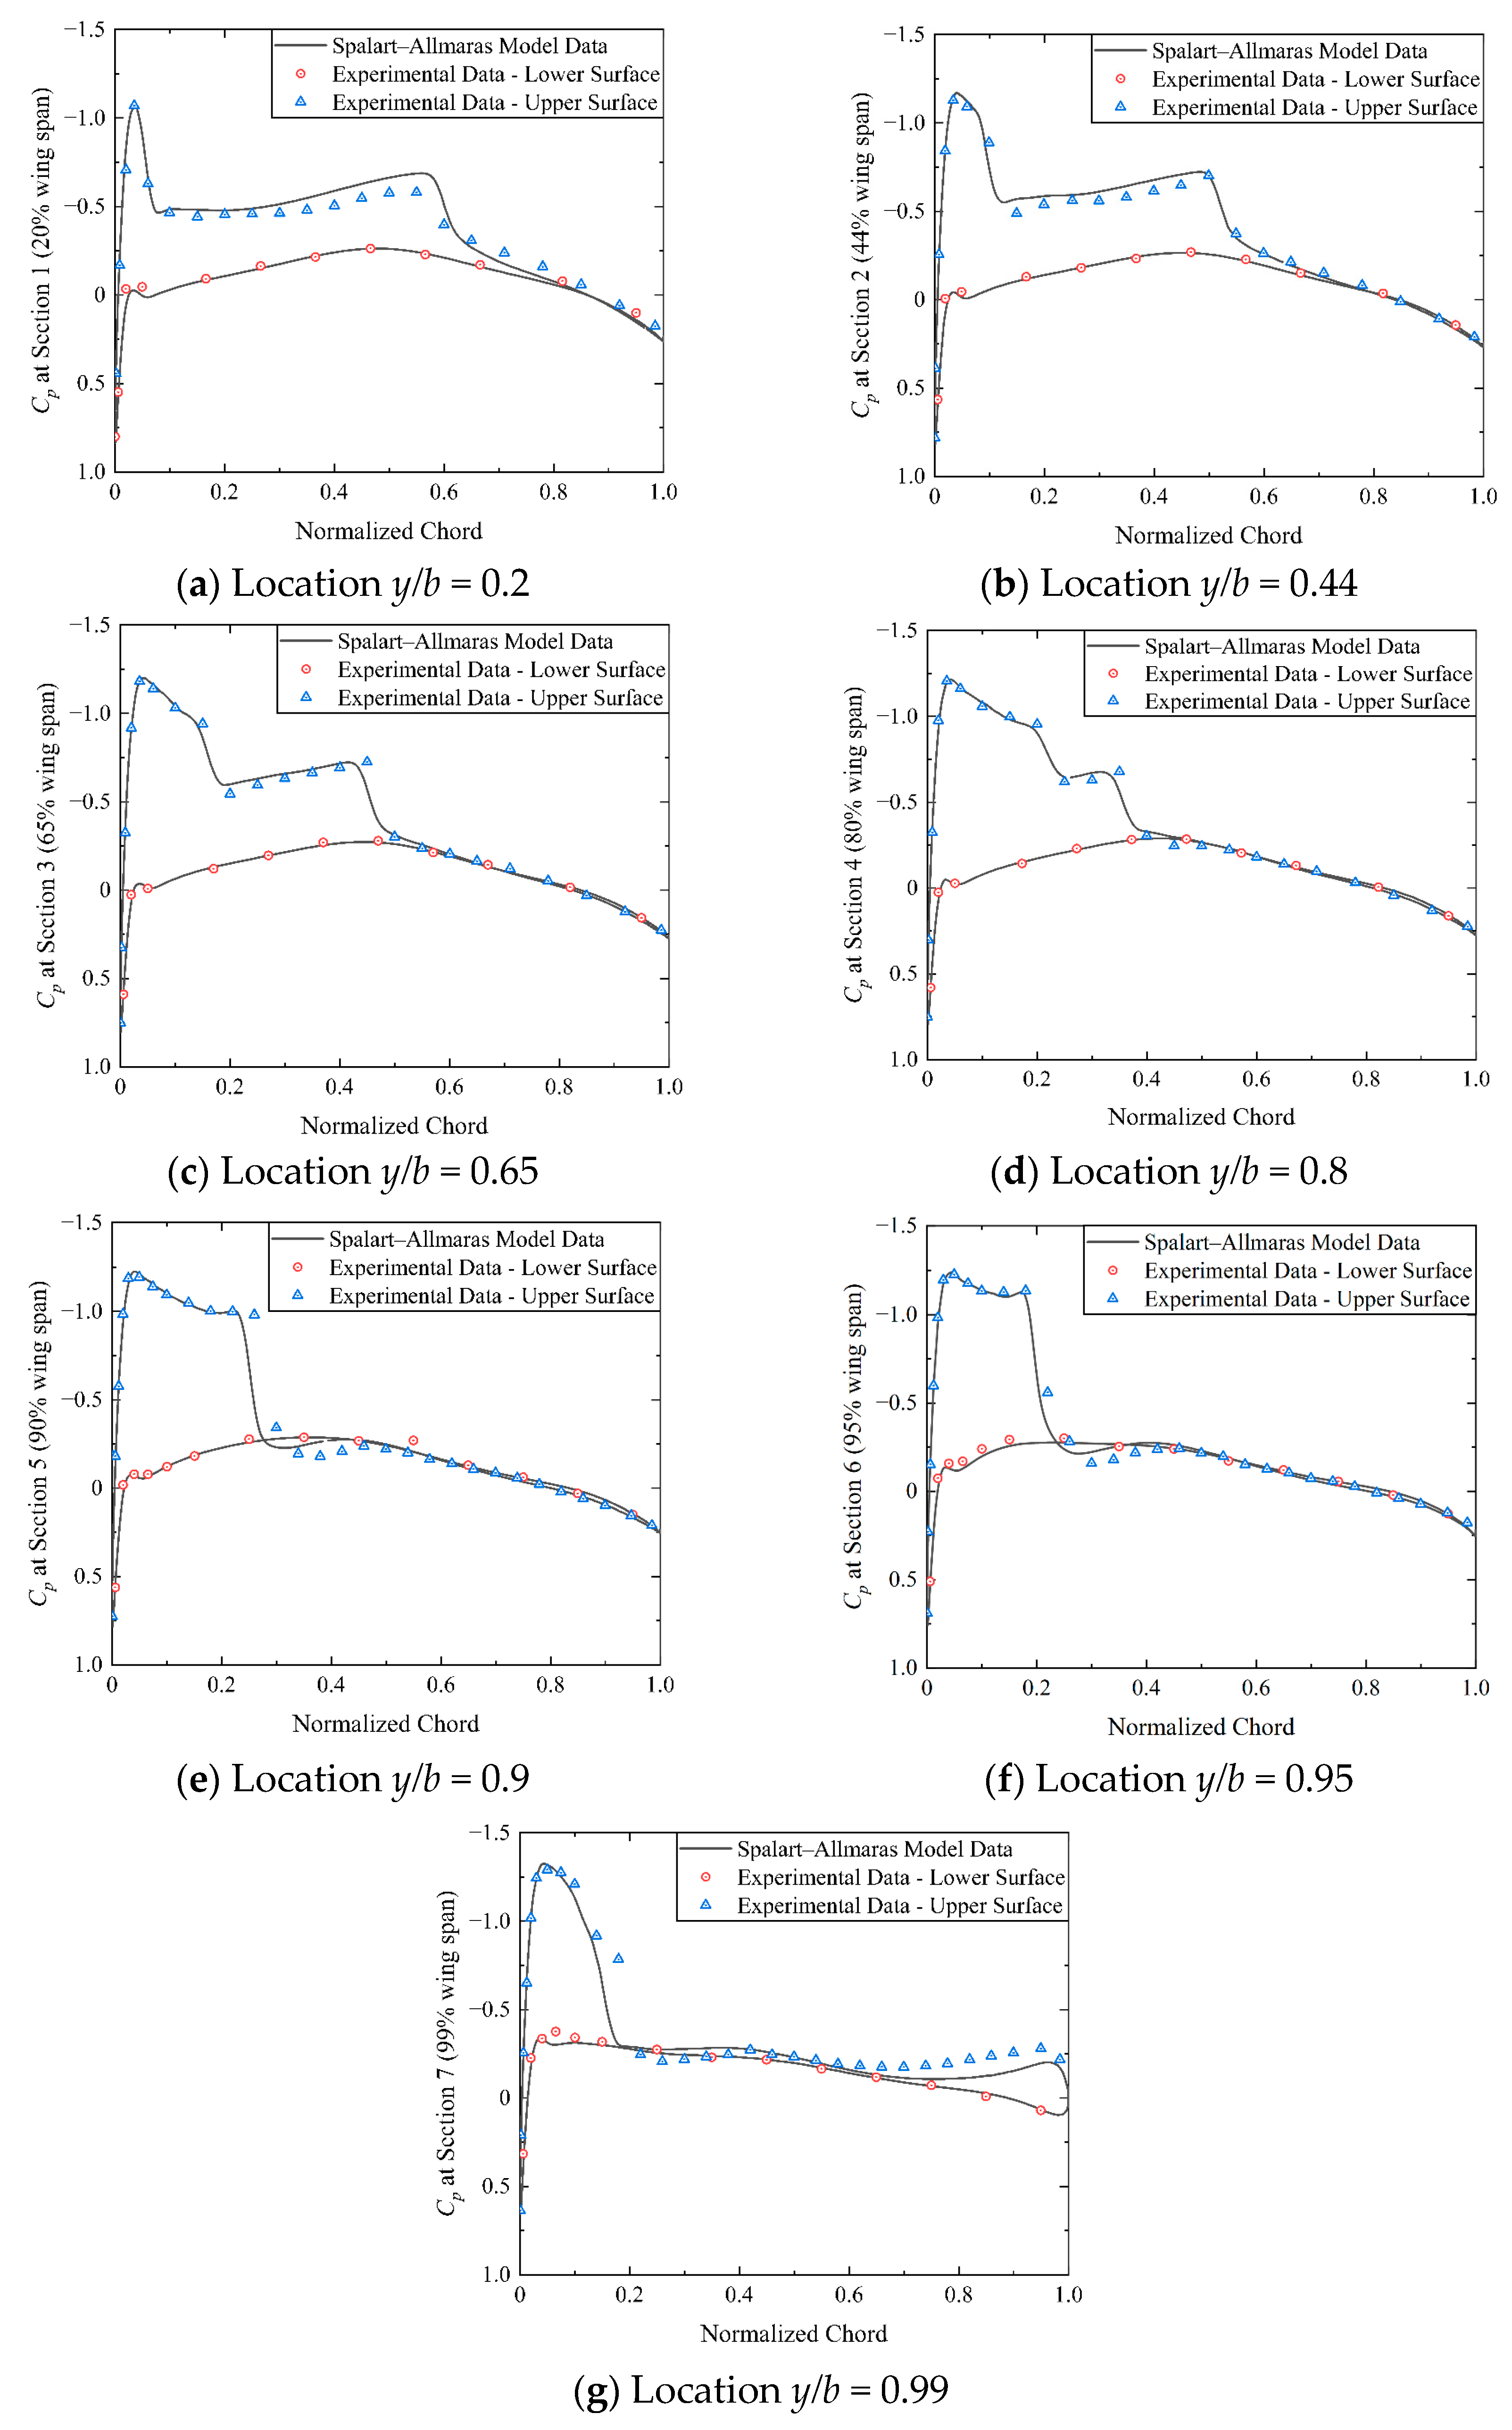
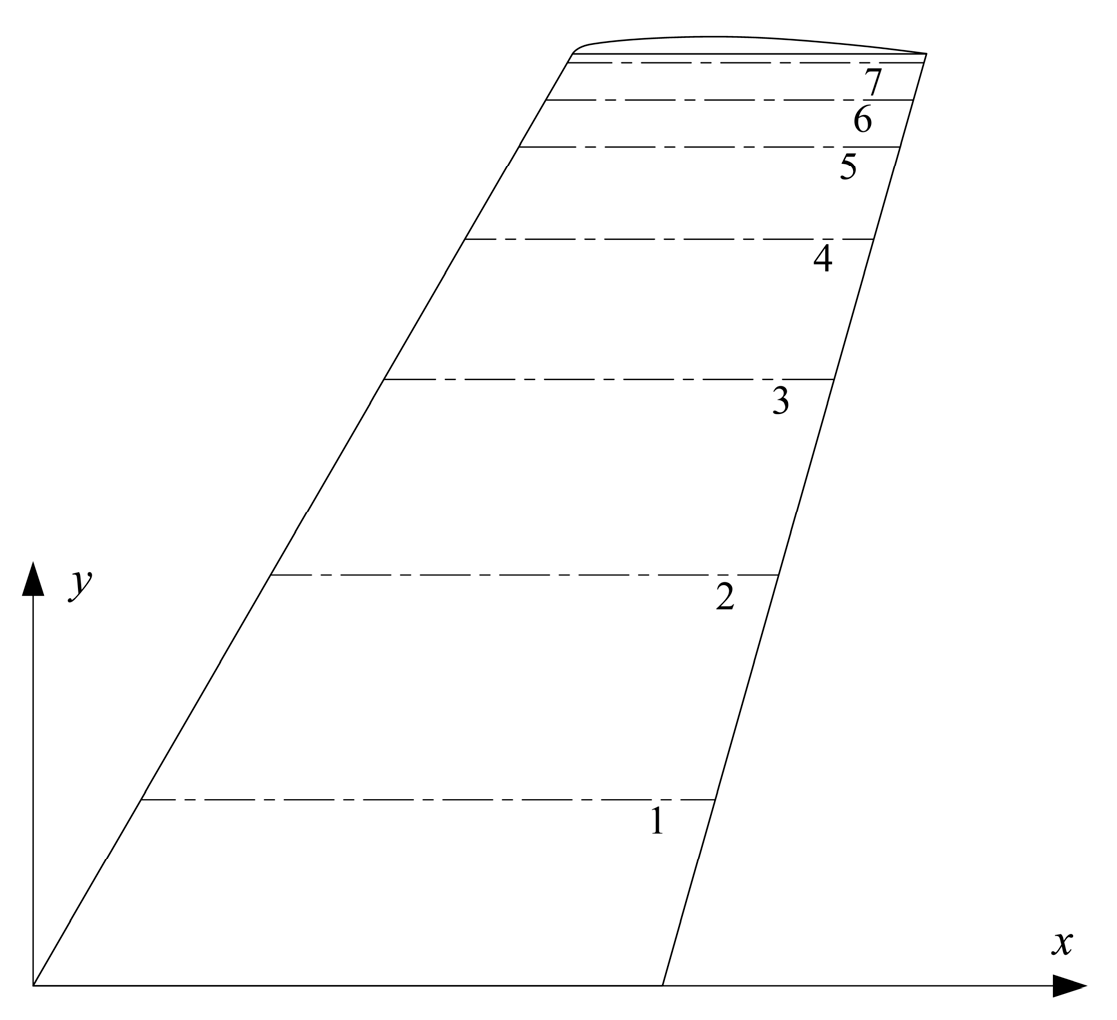
In AGARD’s experiment, the pressure coefficients were measured at seven different positions on the ONERA M6 wing model [46], which was divided into multiple parts along the span, as shown in Figure A2. Previous studies used the same wing model to compare and analyze the accuracy of CFD method and experimental data [47,48]. In this study, the model was verified by comparing the pressure coefficient obtained by CFD simulation with the experimental data of seven parts of the upper and lower surfaces of the wings. The comparison results are shown in Figure A3, indicating that the upper and lower surface curves of most sections are consistent with the corresponding experimental data. The smallest difference is observed at two specific locations: the upper airfoil shock aggregation region at y/b = 0.95 and the upper airfoil trailing edge at y/b = 0.99.
Table A1. The locations for plotting the pressure coefficients.
Partsy/by (mm)
10.2239.26
20.44526.372
30.65777.595
40.8957.04
50.91076.67
60.951136.485
70.991184.337
Figure A3. Comparison of the S-A model results and experimental data.
Aerospace 11 00769 g0a3
According to the above analysis results, it can be determined that the SA turbulence model and grid adopted here are effective under the above free flow conditions, and the error is small between the simulation results and the experimental values.

References

  1. Chu, L.; Li, Q.; Gu, F.; Du, X.; He, Y.; Deng, Y. Design, modeling, and control of morphing aircraft: A review. Chin. J. Aeronaut. 2022, 35, 220–246. [Google Scholar] [CrossRef]
  2. Majid, T.; Jo, B.W. Status and Challenges on Design and Implementation of Camber Morphing Mechanisms. Int. J. Aerosp. Eng. 2021, 2021, 6399937. [Google Scholar] [CrossRef]
  3. Ajaj, R.M.; Parancheerivilakkathil, M.S.; Amoozgar, M.; Friswell, M.I.; Cantwell, W.J. Recent developments in the aeroelasticity of morphing aircraft. Prog. Aerosp. Sci. 2021, 120, 100682. [Google Scholar] [CrossRef]
  4. Weisshaar, T.A. Morphing aircraft technology-new shapes for aircraft design. In Multifunctional Structures/Integration of Sensors and Antennas; NATO: Brussels, Belgium, 2006; p. 20. [Google Scholar]
  5. Ivanco, T.; Scott, R.; Love, M.; Zink, S.; Weisshaar, T. Validation of the Lockheed Martin Morphing Concept with Wind Tunnel Testing. In Proceedings of the 48th AIAA/ASME/ASCE/AHS/ASC Structures, Structural Dynamics, and Materials Conference, Honolulu, HI, USA, 23–26 April 2007; American Institute of Aeronautics and Astronautics: Reston, VA, USA, 2007; pp. 2007–2235. [Google Scholar]
  6. Ortiz, P.; Alley, N. Spanwise Adaptive Wing-PTERA Flight Test; NASA AFRC-E-DAA-TN57887; NASA: Washington, DC, USA, 2018. [Google Scholar]
  7. Guo, X.; Zhang, Y.; Zhang, W.; Sun, L.; Chen, S. Nonlinear Dynamics of Z-Shaped Folding Wings with 1:1 Inner Resonance. Int. J. Bifurc. Chaos 2017, 27, 1750124. [Google Scholar] [CrossRef]
  8. Guo, X.; Wang, S.; Qu, Y.; Cao, D. Nonlinear dynamics of Z-shaped morphing wings in subsonic flow. Aerosp. Sci. Technol. 2021, 119, 107145. [Google Scholar] [CrossRef]
  9. Xie, C.; Chen, Z.; An, C. Study on the Aeroelastic Response of a Z-shaped Folding Wing During the Morphing Process. In Proceedings of the AIAA SCITECH 2022 Forum, San Diego, CA, USA, 3–7 January 2022; p. 0849. [Google Scholar]
  10. Xu, H.; Han, J.; Yun, H.; Chen, X. Calculation of the Hinge Moments of a Folding Wing Aircraft during the Flight-Folding Process. Int. J. Aerosp. Eng. 2019, 2019, 9362629. [Google Scholar] [CrossRef]
  11. Huang, R.; Yang, Z.; Yao, X.; Zhao, Y.; Hu, H. Parameterized Modeling Methodology for Efficient Aeroservoelastic Analysis of a Morphing Wing. AIAA J. 2019, 57, 5543–5552. [Google Scholar] [CrossRef]
  12. Huang, R.; Zhou, X. Parameterized Fictitious Mode of Morphing Wing with Bilinear Hinge Stiffness. AIAA J. 2021, 59, 2641–2656. [Google Scholar] [CrossRef]
  13. Gamble, L.L.; Pankonien, A.M.; Inman, D.J. Stall Recovery of a Morphing Wing via Extended Nonlinear Lifting-Line Theory. AIAA J. 2017, 55, 2956–2963. [Google Scholar] [CrossRef]
  14. Plante, F.; Laurendeau, É.; Dandois, J. Stall Cell Prediction Using a Lifting-Surface Model. AIAA J. 2022, 60, 213–223. [Google Scholar] [CrossRef]
  15. Carvalho, A.R.D.; Brito, P.d.C. Nonlinear Lifting Line Implementation and Validation for Aerodynamic and Stability Analysis. In Proceedings of the The XXXVIII Iberian Latin-American Congress on Computational Methods in Engineering, Florianpolis, Brazil, 5–8 November 2017. [Google Scholar]
  16. Goitia, H.; Llamas, R. Nonlinear vortex lattice method for stall prediction. In Proceedings of the 9th EASN International Conference on “Innovation in Aviation & Space”, Athens, Greece, 3–6 September 2019; MATEC Web of Conferences. EDP Sciences: Les Ulis, France, 2019; Volume 304, p. 02006. [Google Scholar]
  17. Piedra, S.; Martinez, E.; Escalante-Velazquez, C.A.; Jimenez, S.M.A. Computational aerodynamics analysis of a light sport aircraft: Compliance study for stall speed and longitudinal stability certification requirements. Aerosp. Sci. Technol. 2018, 82–83, 234–242. [Google Scholar] [CrossRef]
  18. Septiyana, A.; Hidayat, K.; Rizaldi, A.; Ramadiansyah, M.L.; Ramadhan, R.A.; Suseno PA, P.; Jayanti, E.B.; Atmasari, N.; Rasyadi, A. Analysis of aerodynamic characteristics using the vortex lattice method on twin tail boom unmanned aircraft. AIP Conf. Proc. 2020, 2226, 020003. [Google Scholar] [CrossRef]
  19. Spera, D.A. Models of Lift and Drag Coefficients of Stalled and Unstalled Airfoils in Wind Turbines and Wind Tunnels; NASA NASA/CR-2008-215434; NASA: Washington, DC, USA, 2008. [Google Scholar]
  20. Ke, Y.; Yu, H.; Chi, C.; Yue, M.; Chen, B.M. A systematic design approach for an unconventional UAV J-Lion with extensible morphing wings. In Proceedings of the 2016 12th IEEE International Conference on Control and Automation (ICCA), Kathmandu, Nepal, 1–3 June 2016; pp. 44–49. [Google Scholar] [CrossRef]
  21. Hassanalian, M.; Abdelkefi, A.; Wei, M.; Ziaei-Rad, S. A novel methodology for wing sizing of bio-inspired flapping wing micro air vehicles: Theory and prototype. Acta Mech. 2017, 55, 1097–1113. [Google Scholar] [CrossRef]
  22. Zi, K.A.N.; Daochun, L.I.; Tong, S.H.E.N.; Xiang, J.; Zhang, L. Aerodynamic characteristics of morphing wing with flexible leading-edge. Chin. J. Aeronaut. 2020, 33, 2610–2619. [Google Scholar]
  23. Hattalli, V.L.; Srivatsa, S.R. Wing Morphing to Improve Control Performance of an Aircraft—An Overview and a Case Study. Mater. Today Proc. 2018, 5, 21442–21451. [Google Scholar] [CrossRef]
  24. Oyama, Y.; Rostami, M.; Chung, J. Conceptual design and analysis of a box fan-in-split-wing tiltrotor eVTOL aircraft. Aircr. Eng. Aerosp. Technol. 2024. ahead-of-print. [Google Scholar] [CrossRef]
  25. Hui, Z.; Zhang, Y.; Chen, G. Aerodynamic performance investigation on a morphing unmanned aerial vehicle with bio-inspired discrete wing structures. Aerosp. Sci. Technol. 2019, 95, 105419. [Google Scholar] [CrossRef]
  26. Palaia, G.; Salem, K.A.; Cipolla, V.; Binante, V.; Zanetti, D. A conceptual design methodology for e-VTOL aircraft for urban air mobility. Appl. Sci. 2021, 11, 10815. [Google Scholar] [CrossRef]
  27. Bi, N.P.; Schwartz, A.; Soltis, J.; Kimmel, K.; Sydney, A. Experimental investigation of aerodynamic interactions during shipboard launch & recovery of unconventional UAVs. In Proceedings of the AIAA Scitech 2021 Forum, Virtual, 4 January 2021; p. 1536. [Google Scholar] [CrossRef]
  28. Ajanic, E.; Feroskhan, M.; Wüest, V.; Floreano, D. Sharp turning maneuvers with avian-inspired wing and tail morphing. Commun. Eng. 2022, 1, 34. [Google Scholar] [CrossRef]
  29. Veeranjaneyulu, K.; Joshi, S.; Devalla, V.; Kiran, K.S.; Khushal, K. Aerodynamic characteristics of two stage morphing wing of UAV. AIP Conf. Proc. 2023, 2492, 020062. [Google Scholar]
  30. McDonald, R.A. Advanced modeling in OpenVSP. In Proceedings of the 16th AIAA Aviation Technology, Integration, and Operations Conference, Washington, DC, USA, 13–17 June 2016; p. 3282. [Google Scholar]
  31. Communier, D.; Salinas, M.F.; Carranza Moyao, O.; Botez, R.M. Aero structural modeling of a wing using CATIA V5 and XFLR5 software and experimental validation using the Price-Païdoussis wing tunnel. In Proceedings of the AIAA Atmospheric Flight Mechanics Conference, Dallas, TX, USA, 22–26 June 2015; p. 2558. [Google Scholar]
  32. Gudmundsson, S. General Aviation Aircraft Design: Applied Methods and Procedures; Butterworth-Heinemann: Oxford, UK, 2013. [Google Scholar]
  33. Selig, M.S. UIUC Airfoil Data Site; Department of Aeronautical and Astronautical Engineering University of Illinois at Urbana-Champaign: Urbana, IL, USA, 1996. [Google Scholar]
  34. Hieu, N.K.; Loc, H.T. Airfoil selection for fixed wing of small unmanned aerial vehicles. In AETA 2015: Recent Advances in Electrical Engineering and Related Sciences; Springer: Berlin/Heidelberg, Germany, 2016; pp. 881–890. [Google Scholar]
  35. Montgomerie, B. Methods for Root Effects, Tip Effects and Extending the Angle of Attack Range to {+−} 180 Deg., with Application to Aerodynamics for Blades on Wind Turbines and Propellers; FOI-R—1305-SE; Swedish Defence Research Agency: Stockholm, Sweden, 2004. [Google Scholar]
  36. Ananda, G.K.; Selig, M.S. Stall/Post-Stall Modeling of the Longitudinal Characteristics of a General Aviation Aircraft. In Proceedings of the AIAA Atmospheric Flight Mechanics Conference, Washington, DC, USA, 13–17 June 2016; American Institute of Aeronautics and Astronautics: Reston, VA, USA, 2016. [Google Scholar]
  37. McCormick, B.W. Aerodynamics, Aeronautics, and Flight Mechanics, 2nd ed.; John Wiley & Sons: Hoboken, NJ, USA, 1995. [Google Scholar]
  38. Hasan, M.S.; Svorcan, J.; Simonovic, A.; Daou, D.; Peric, B. CFD Analysis of a High Altitude Long Endurance Uav Wing. In Proceedings of the 7th International Congress of Serbian Society of Mechanics, Sremski Karlovci, Serbia, 24–26 June 2019; pp. 1–9. [Google Scholar]
  39. Shelton, A.; Abras, J.; Jurenko, R.; Smith, M. Improving the CFD predictions of airfoils in stall. In Proceedings of the 43rd AIAA Aerospace Sciences Meeting and Exhibit, Reno, NV, USA, 10–13 January 2005; p. 1227. [Google Scholar]
  40. Catalano, P.; Amato, M. An evaluation of RANS turbulence modelling for aerodynamic applications. Aerosp. Sci. Technol. 2003, 7, 493–509. [Google Scholar] [CrossRef]
  41. Matyushenko, A.; Garbaruk, A. Adjustment of the k- ω SST turbulence model for prediction of airfoil characteristics near stall. J. Phys. Conf. Ser. 2016, 769, 012082. [Google Scholar] [CrossRef]
  42. Sagmo, K.; Bartl, J.; Sætran, L. Numerical simulations of the NREL S826 airfoil. J. Phys. Conf. Ser. 2016, 753, 082036. [Google Scholar] [CrossRef]
  43. White, F.M. Fluid Mechanics; McGraw-Hill: New York, NY, USA, 2003. [Google Scholar]
  44. Joseph, L.A.; Borgoltz, A.; Devenport, W. Infrared thermography for detection of laminar–turbulent transition in low-speed wind tunnel testing. Exp. Fluids 2016, 57, 77. [Google Scholar] [CrossRef]
  45. Im, H. Large Eddy Simulation of Coflow Jet Airfoil at High Angle of Attack. J. Fluids Eng. 2013, 136, 021101. [Google Scholar] [CrossRef]
  46. Schmitt, V.; Charpin, F. Pressure Distributions on the ONERA M6 Wing at Transonic Mach Numbers; Advisory Group for Aerospace Research and Development: Neuilly sur Seine, France, 1979. [Google Scholar]
  47. Balan, A.; Park, M.A.; Anderson, W.K.; Kamenetskiy, D.S.; Krakos, J.A.; Michal, T.R.; Alauzet, F.; Loseille, A.; Frazza, L.; Marcum, D.L.; et al. Verification of anisotropic mesh adaptation for turbulent simulations over ONERA M6 wing. AIAA J. 2020, 58, 1550–1565. [Google Scholar] [CrossRef]
  48. Munshi, A.; Sulaeman, E.; Omar, N.; Ali, M.Y. CFD analysis on the effect of winglet cant angle on aerodynamics of ONERA M6 wing. J. Adv. Res. Fluid Mech. Therm. Sci. 2018, 45, 44–54. [Google Scholar]
Figure 1. Constraint equation in different AR: (a) AR = 6, (b) AR = 7, (c) AR = 8, and (d) AR = 9.
Aerospace 11 00769 g001
Figure 2. Composite score of 14 airfoils.
Aerospace 11 00769 g002
Figure 3. Z-shaped folding wing UAV aerodynamic model.
Aerospace 11 00769 g003
Figure 4. Lift distribution on the main wing of Z-shaped folding wing UAV at 15 deg folding angle increments.
Aerospace 11 00769 g004
Figure 5. Lift-drag characteristics of a fully deployed wing with AG 25 airfoil.
Aerospace 11 00769 g005
Figure 6. Lift−to−drag ratio of a fully deployed wing predicted by AERODAS.
Aerospace 11 00769 g006
Figure 7. Lift-drag characteristics of the main wing at 15 deg folding angle increments: (a) the lift coefficient and (b) the drag coefficient.
Aerospace 11 00769 g007
Figure 8. Pitching moment characteristics of the main wing at 15 deg folding angle increments.
Aerospace 11 00769 g008
Figure 9. Model of ONERA M6 wing.
Aerospace 11 00769 g009
Figure 10. Wing model meshed: (a) folded wing mesh, (b) unfolded wing mesh, (c) computational flow domain for folded wing, and (d) computational flow domain for unfolded wing.
Aerospace 11 00769 g010
Figure 11. Comparison of Fluent results with integrated VLM prediction results: (a) the lift coefficient at a 0 deg folding angle, (b) the drag coefficient at a 0 deg folding angle, (c) the lift coefficient at a 45 deg folding angle, (d) the drag coefficient at a 45 deg folding angle, (e) the pitching moment coefficient at a 0 deg folding angle, and (f) the pitching moment coefficient at a 45 deg folding angle.
Aerospace 11 00769 g011
Figure 12. Atmosphere module.
Aerospace 11 00769 g012
Figure 13. Flight control module.
Aerospace 11 00769 g013
Figure 14. Force and moment summation module.
Aerospace 11 00769 g014
Figure 15. The 6-degree-of-freedom module.
Aerospace 11 00769 g015
Figure 16. Visualization module.
Aerospace 11 00769 g016
Figure 17. Flight path with no elevator or rudder deflection.
Aerospace 11 00769 g017
Figure 18. Pitch angle–time plot with no elevator or rudder deflection.
Aerospace 11 00769 g018
Figure 19. Flight path with elevator deflection.
Aerospace 11 00769 g019
Figure 20. Elevator deflection.
Aerospace 11 00769 g020
Figure 21. Pitch angle–time plot with elevator deflection.
Aerospace 11 00769 g021
Figure 22. Pitch angle rate-time with elevator deflection.
Aerospace 11 00769 g022
Figure 23. Flight path with rudder deflection.
Aerospace 11 00769 g023
Figure 24. Rudder deflection.
Aerospace 11 00769 g024
Figure 25. Yaw angle–time plot with rudder deflection.
Aerospace 11 00769 g025
Figure 26. Roll angle–time plot with rudder deflection.
Aerospace 11 00769 g026
Table 1. Constraint equation basic parameters.
V c r u = 16   m / s n = 1.5 Λ = 0
V V = 1   m / s S G = 20   m Re = 200,000
V c l i = 14   m / s μ = 0.02 g = 9.8   m / s 2
V t u r n = 14   m / s C L T O = 0.7 ρ = 1.29   kg / m 3
V L O F = 10.5   m / s C D T O = 0.04
Table 2. Freestream conditions.
MachReynoldsAttack Angle (deg)Slip Angle (deg)Temp (R)Pressure (Psia)
0.839511.72 × 1063.06046045.82899
Table 3. Results of the constraint diagrams.
Desired W/SARRequired T/WRange of Change and Rate of Change
0.005 g/mm26Above 0.53Determined AR range of change
0.005 g/mm27Above 0.457.2~8.4
0.005 g/mm28Above 0.39Determined AR rate of change
0.005 g/mm29Above 0.3414.3%
0.005 g/mm27.2Above 0.471Determined T/W range of change
0.005 g/mm28.4Above 0.3980.471~0.398
Table 4. Evaluation weights for airfoil parameters.
ParameterEvaluationWeighted Scored for Fixed Wing of UAVs
C l 0 Close to C l c r u is the best0.15
C l max Highest is the best0.15
α s t a l l Highest is the best0.15
C D min Lowest is the best0.15
C l / C D max Highest is the best0.15
C l 3 / 2 / C D max Highest is the best0.2
C m , c / 4 Low magnitude is the best0.05
Table 5. Basic parameters of 14 airfoils.
No.AirfoilThickness (%)Camber (%)No.AirfoilThickness (%)Camber (%)
1AG115.812.298NACA0012120
2AG257.582.49NACA2412121.92
3CJ59.32.310Onera OA2099.011.56
4ClarkY11.713.4311Profil 3879.033.79
5Eppler 6711.623.6512Ritz 2-30-992
6Goe 74414.487.0213SD70379.23.01
7MM 1008.762.1214SD70809.152.48
Disclaimer/Publisher’s Note: The statements, opinions and data contained in all publications are solely those of the individual author(s) and contributor(s) and not of MDPI and/or the editor(s). MDPI and/or the editor(s) disclaim responsibility for any injury to people or property resulting from any ideas, methods, instructions or products referred to in the content.