Article

Multiscale Modeling of Plasma-Assisted Non-Premixed Microcombustion

by
Giacomo Cinieri
1,
Ghazanfar Mehdi
1,2,* and
Maria Grazia De Giorgi
1,*
1
Department of Engineering for Innovation, University of Salento, Via per Monteroni, 73100 Lecce, Italy
2
Department of Mechanical Engineering, School of Engineering, Aalto University, 00076 Aalto, Finland
*
Authors to whom correspondence should be addressed.
Aerospace 2024, 11(9), 697; https://doi.org/10.3390/aerospace11090697
Submission received: 31 May 2024 / Revised: 7 August 2024 / Accepted: 23 August 2024 / Published: 26 August 2024

Abstract

:
This work explores microcombustion technologies enhanced by plasma-assisted combustion, focusing on a novel simulation model for a Y-shaped device with a non-premixed hydrogen-air mixture. The simulation integrates the ZDPlasKin toolbox to determine plasma-produced species concentrations to Particle-In-Cell with Monte Carlo Collision analysis for momentum and power density effects. The study details an FE-DBD plasma actuator operating under a sinusoidal voltage from 150 to 325 V peak-to-peak and a 162.5 V DC bias. At potentials below 250 V, no hydrogen dissociation occurs. The equivalence ratio fitting curve for radical species is incorporated into the plasma domain, ensuring local composition accuracy. Among the main radical species produced, H reaches a maximum mass fraction of 8% and OH reaches 1%. For an equivalence ratio of 0.5, the maximum temperature reached 2238 K due to kinetic and joule heating contributions. With plasma actuation with radicals in play, the temperature increased to 2832 K, and with complete plasma actuation, it further rose to 2918.45 K. Without plasma actuation, the temperature remained at 300 K, reflecting ambient conditions and no combustion phenomena. At lower equivalence ratios, temperatures in the plasma area consistently remained around 2900 K. With reduced thermal power, the flame region decreased, and at Φ = 0.1, the hot region was confined primarily to the plasma area, indicating a potential blow-off limit. The model aligns with experimental data and introduces relevant functionalities for modeling plasma interactions within microcombustors, providing a foundation for future validation and numerical models in plasma-assisted microcombustion applications.

1. Introduction

Over the past three decades, there has been a considerable surge in research on combustion-based micro–meso devices. This heightened interest is largely attributed to the characteristics of hydrogen, which include high energy density and minimal weight [1,2,3]. Power generation at the microscale is generally characterized by dimensions smaller than 1 mm, while mesoscale devices are in the order of millimeters [4]. The microcombustion technology revolution has led to systems that are lighter and smaller and have higher energy density. The number of publications on micro–meso-scale combustion has been increasing in the last 10 years, highlighting that this field is a highly active research topic.
The reduced scale of these devices facilitates process intensification, exemplified by rapid heat and mass transfer, enhanced efficiency, and accelerated transients, allowing for quick startup times [5]. These advantages highlight the unique operational dynamics and efficiencies achievable in microscale combustion technologies. However, the high area-to-volume ratio and brief mixture residence time present significant challenges in maintaining a stable flame within micro burner systems. These factors complicate the efficient and consistent operation of these systems, making stability difficult to achieve [6,7]. In microburners, the dynamics are predominantly influenced by gas–surface interactions [8]. Flame propagation in microcombustors and narrow channels encounters significant challenges. Flames often fail to propagate when the gap size falls below the “quenching distance”, a critical threshold where flame propagation becomes unfeasible [9]. When the residence time is reduced, the fuel mixture is expelled from the burner before it is fully burned or even before it begins to burn. This leads to low combustion efficiency, energy waste, and other issues, as well as the increased production and emission of pollutants into the atmosphere. Because the reaction time of the mixture is shortened, maintaining a stable flame becomes challenging in a microcombustor. The quenching distance varies with the type of fuel, pressure, and temperature. Understanding the dynamics of flame behavior in confined spaces and the impact of variables like quenching distance, wall temperature, and materials is crucial for flame propagation and stabilization.
Incorporating a porous material into premixed microcombustion has been extensively studied in the last few years. The introduction of a porous medium increases the contact area, which can significantly enhance the heat transfer from the hot exhaust gases to the microcombustor wall. The random connectivity and obstructive properties of porous media significantly disturb the airflow, thereby improving heat transfer between the combustion zone and the unburned gas through the solid matrix enhancing combustion. This process preheats the reactants, potentially accelerating the flame.
In a hydrogen–air mixture scenario, Peng et al. [10] conducted experimental tests and numerical simulations to investigate premixed H2 combustion with and without a porous medium. The results indicate that flame stabilization is significantly enhanced in the combustor with a porous medium. The wall temperature in the presence of the porous medium is 188 K higher than that of the free flame in a tube. As the combustor diameter increases, the limitations in terms of inlet velocity and flame blowout are mitigated and the radiation surface area is increased, leading to higher energy output. Bani et al. [11] investigated porous media combustion thermo-photovoltaic systems focusing on experimental and numerical assessments of a TPV generator. The results indicated that increasing the inlet velocity led to a reduction in combustion efficiency due to decreased residence time. Additionally, the average wall temperature decreased as the thermal conductivity of the solid matrix increased.
To enhance flame stability and combustion efficiency, the use of a bluff body has proven to be effective. The mixture is separated from the boundary layer as it passes through the bluff body [12]. This separation generates a low-speed, high-temperature, and high-concentration recirculation area, which effectively maintains the flame, facilitating the ignition of the fuel. Qian et al. [13] investigated the combustion characteristics of a premixed hydrogen/air mixture in a microcombustor using a cavity, a bluff body, a rib with a bluff body, and rib configurations. Thicker walls in the bluff body configuration provided a more uniform temperature distribution, with higher wall temperatures at the inlet (370 K) and lower at the outlet (1099 K) compared to thinner walls. Increasing the thermal conductivity coefficient from 1 W/mK to 10 W/mK improved the preheating effect on the fresh mixture by 100 K and 214 K for the bluff body and cavity walls, respectively, but also increased heat loss to the surroundings. Therefore, materials with lower thermal conductivity are more favorable for flame stability. Increasing the equivalence ratio from 0.5 to 0.7 significantly raised the mean outer wall temperature.
Finally, plasma-assisted combustion (PAC) is currently being offered as a new low-cost and efficient solution to further enhance combustion performance and flame stability [14,15,16]. This technology has demonstrated excellent results in aero-engine combustion in low-pressure and low-temperature atmospheric environments [7,17,18,19,20].
Among various forms of plasma actuation, Dielectric Barrier Discharge (DBD) is of particular interest in the meso–micro context, generating a uniform and large-area discharge at atmospheric pressure and room temperature [18,21,22,23,24,25].
Plasma is the fourth state of matter in which a gas becomes ionized with equal amounts of positive and negative charges, making it quasi-neutral [26]. The efficiency of plasma-based active flow control is the function of transport, thermal, and chemical effects [27]:
  • Thermal Effects: Plasma transfers energy to the gas, raising its temperature and thereby enhancing the rate of temperature-sensitive chemical reactions.
  • Kinetic Effects: Plasma introduces alternative reaction pathways that are not present in pure combustion systems, altering the chemical kinetics.
  • Transport Effects: Electric fields generated by the plasma influence charged particles through electric-field-driven drift, enhanced diffusion, and other bulk fluid processes, such as pressure waves, shock waves, and turbulence initiation.
The concept of using thermal equilibrium plasma conditions for combustion control has been around for a century, originating with internal combustion engines and spark ignition systems [28]. These principles have significantly contributed to achieving high efficiency in various applications. Recently, however, scientific researchers have increasingly focused on non-equilibrium plasma for ignition and combustion control in other applications [29,30,31]. This approach presents new possibilities for ignition and flame stabilization.
Plasma is widely used in scramjets to enhance ignition and combustion stability, proving highly effective in extending the flame blowout limit and optimizing combustor performance [32,33].
Tian et al. [34] utilized a multi-channel gliding arc (MCGA) plasma to improve ignition and combustion stability near the flame blowout limit in a C2H4-fueled, cavity-based scramjet model for scramjet combustors. The investigation employed wall static pressure measurements, CH* chemiluminescence imaging, optical emission spectroscopy, and discharge waveform analysis to explore PAC effects.
In recent years, different fuels have been investigated under plasma actuation. Patel et al. [35] investigated how coupled energy per pulse affects the ability of DBD plasma to ignite fuel-lean methane–airflow. It was observed that increasing the dielectric thickness resulted in a decrease in coupled energy per pulse, despite similar applied voltage conditions, necessitating more pulses to ignite the lean mixture.
Reduced ignition times have been observed in shock tube ignition delay studies under the influence of low energy discharges to increase flame speeds under the influence of sub-critical microwave fields, and increase extinction limits for counterflow [36].
While significant progress has been made in exploring plasma-coupled combustion, the impact on submillimeter-scale flames has remained poorly explored until now.
The use of plasma in mesoscale and microscale applications is highly intriguing. In these scales, the flows are typically laminar, and the required pressures are low. This significantly facilitates the feasibility of employing 0D or 1D approximations in these studies for preliminary analysis [37].
Most PAC studies can be categorized into two main types. The first category involves 0D models, which are crucial for analyzing mechanisms. These models are highly useful for studying kinetic processes but do not account for fluid dynamics, and the main studies are reported below. Hazenberg et al. [38] examined the reactions of plasma species and whether their thermodynamic properties are obtained by modifying the formation enthalpy. Errors in adiabatic flame temperature can reach up to 100 K, and NO concentration errors can be as large as 50%. They propose a new path to compute thermodynamic data for vibrational species.
Computational mechanisms for PAC analysis are very complex and computationally expensive. Rekkas-Ventiris et al. [39] introduced a novel reduction methodology of kinetic mechanism for PAC applications. By employing predictive machine learning regression models, a new framework was successfully applied to a detailed isooctane/air plasma kinetic mechanism through zero-dimensional ignition simulations, significantly reducing computational costs while maintaining high accuracy. Shasvasari et al. [40] studied the synergistic effects of nanosecond plasma discharge and hydrogen on ammonia combustion incorporating excitations, ionizations, quenching, recombination, charge exchanges, and neutral state elementary reactions in a mechanism for NH3/H2/O2/N2 mixtures. The results showed that relatively low-energy pulses or low hydrogen fuel fractions are sufficient to significantly reduce the ignition delay time of ammonia/air mixtures. Lower NOX emissions are found compared to hydrogen assistance for a specific enhancement in flame speed.
These studies account for the effects of plasma kinetics and their impact on chemistry. However, they overlook the contributions of plasma transport and power density from the actuators, the context in which they are situated, and the fluid dynamics interplay between kinetic effects and other factors. On the other hand, current PAC CFD 3D models focus on the fluid dynamic effects of plasma, neglecting the kinetic effects. Mackay et al. [41,42,43] simulated the plasma-coupling effect in mesoscale devices using different FE-DBD configurations, improving fuel consumption and efficiency with PAC compared to a burner without plasma actuation. The model, however, neglects the plasma contribution of radical generation and how the discharge dramatically modifies the fluid composition.
In this work, a new attempt to improve the PAC comprehensive model is proposed for a non-premixed H2–air mixture. In the first step, plasma discharge is modeled for kinetics effects forecasting using a zero-dimensional approach based on the solution of the Boltzmann equation. The solution is mapped on the equivalence ratio of the mixture and potential amplitude. In the second step, the PIC/MCC model predicts plasma body force and power density. Finally, plasma effects are exported in the plasma regions to steady-state CFD simulations using Ansys Fluent 2023 R2. The primary objective of this study is to examine the different impacts of the PAC effects on a microsystem, determining whether it should be implemented.

2. Numerical Methods

2.1. Case Study, the Plasma Actuator

Figure 1 shows the configuration of an FE-DBD plasma actuator with one electrode embedded beneath a dielectric layer and the other exposed to the gas. The thickness of the dielectric and electrodes are 4 µm and 1 µm, respectively (as listed in Table 1). The electrode is 100 µm long and has a width equal to the width of the conductive layer. The dielectric is made of silicon nitride and has a thickness of 4 µm. A sinusoidal voltage is applied with a peak-to-peak voltage of 325 V and a DC bias of 162.5 V, generating a longitudinal force in the direction from the buried to the exposed electrode.

2.2. Geometric Features of the Microcombustor

The investigated test case is a Y-shaped combustion chamber of 200 mm in length with a 90-degree angle and two inlet channels for hydrogen and dry air, as previously studied by Xiang et al. [44,45] and numerically analyzed by us [46,47]. The combustion chamber walls are made of 1 mm thick quartz, and the pressure and temperature are set to 1 atm and 300 K, respectively. A couple of FE-DBD actuators (x = 0, y = +/− 1 mm) are set in a pump configuration (i.e., the plasma body force is directed toward the outlet).
The sum of flow rates is constant (vair + vH2 = 6 m/s) at 300 K and 1 atm. The wall is modeled as a no-slip. The conductive heat transfer coefficient is 20 W/m2K, and the specific quartz glass heat capacity and thermal conductivity are 750 J/kg-K and 1.05 W/m-K, respectively. The plasma region is defined as a rectangular cross-section measuring 200 × 50 × 758 µm.

3. Modeling

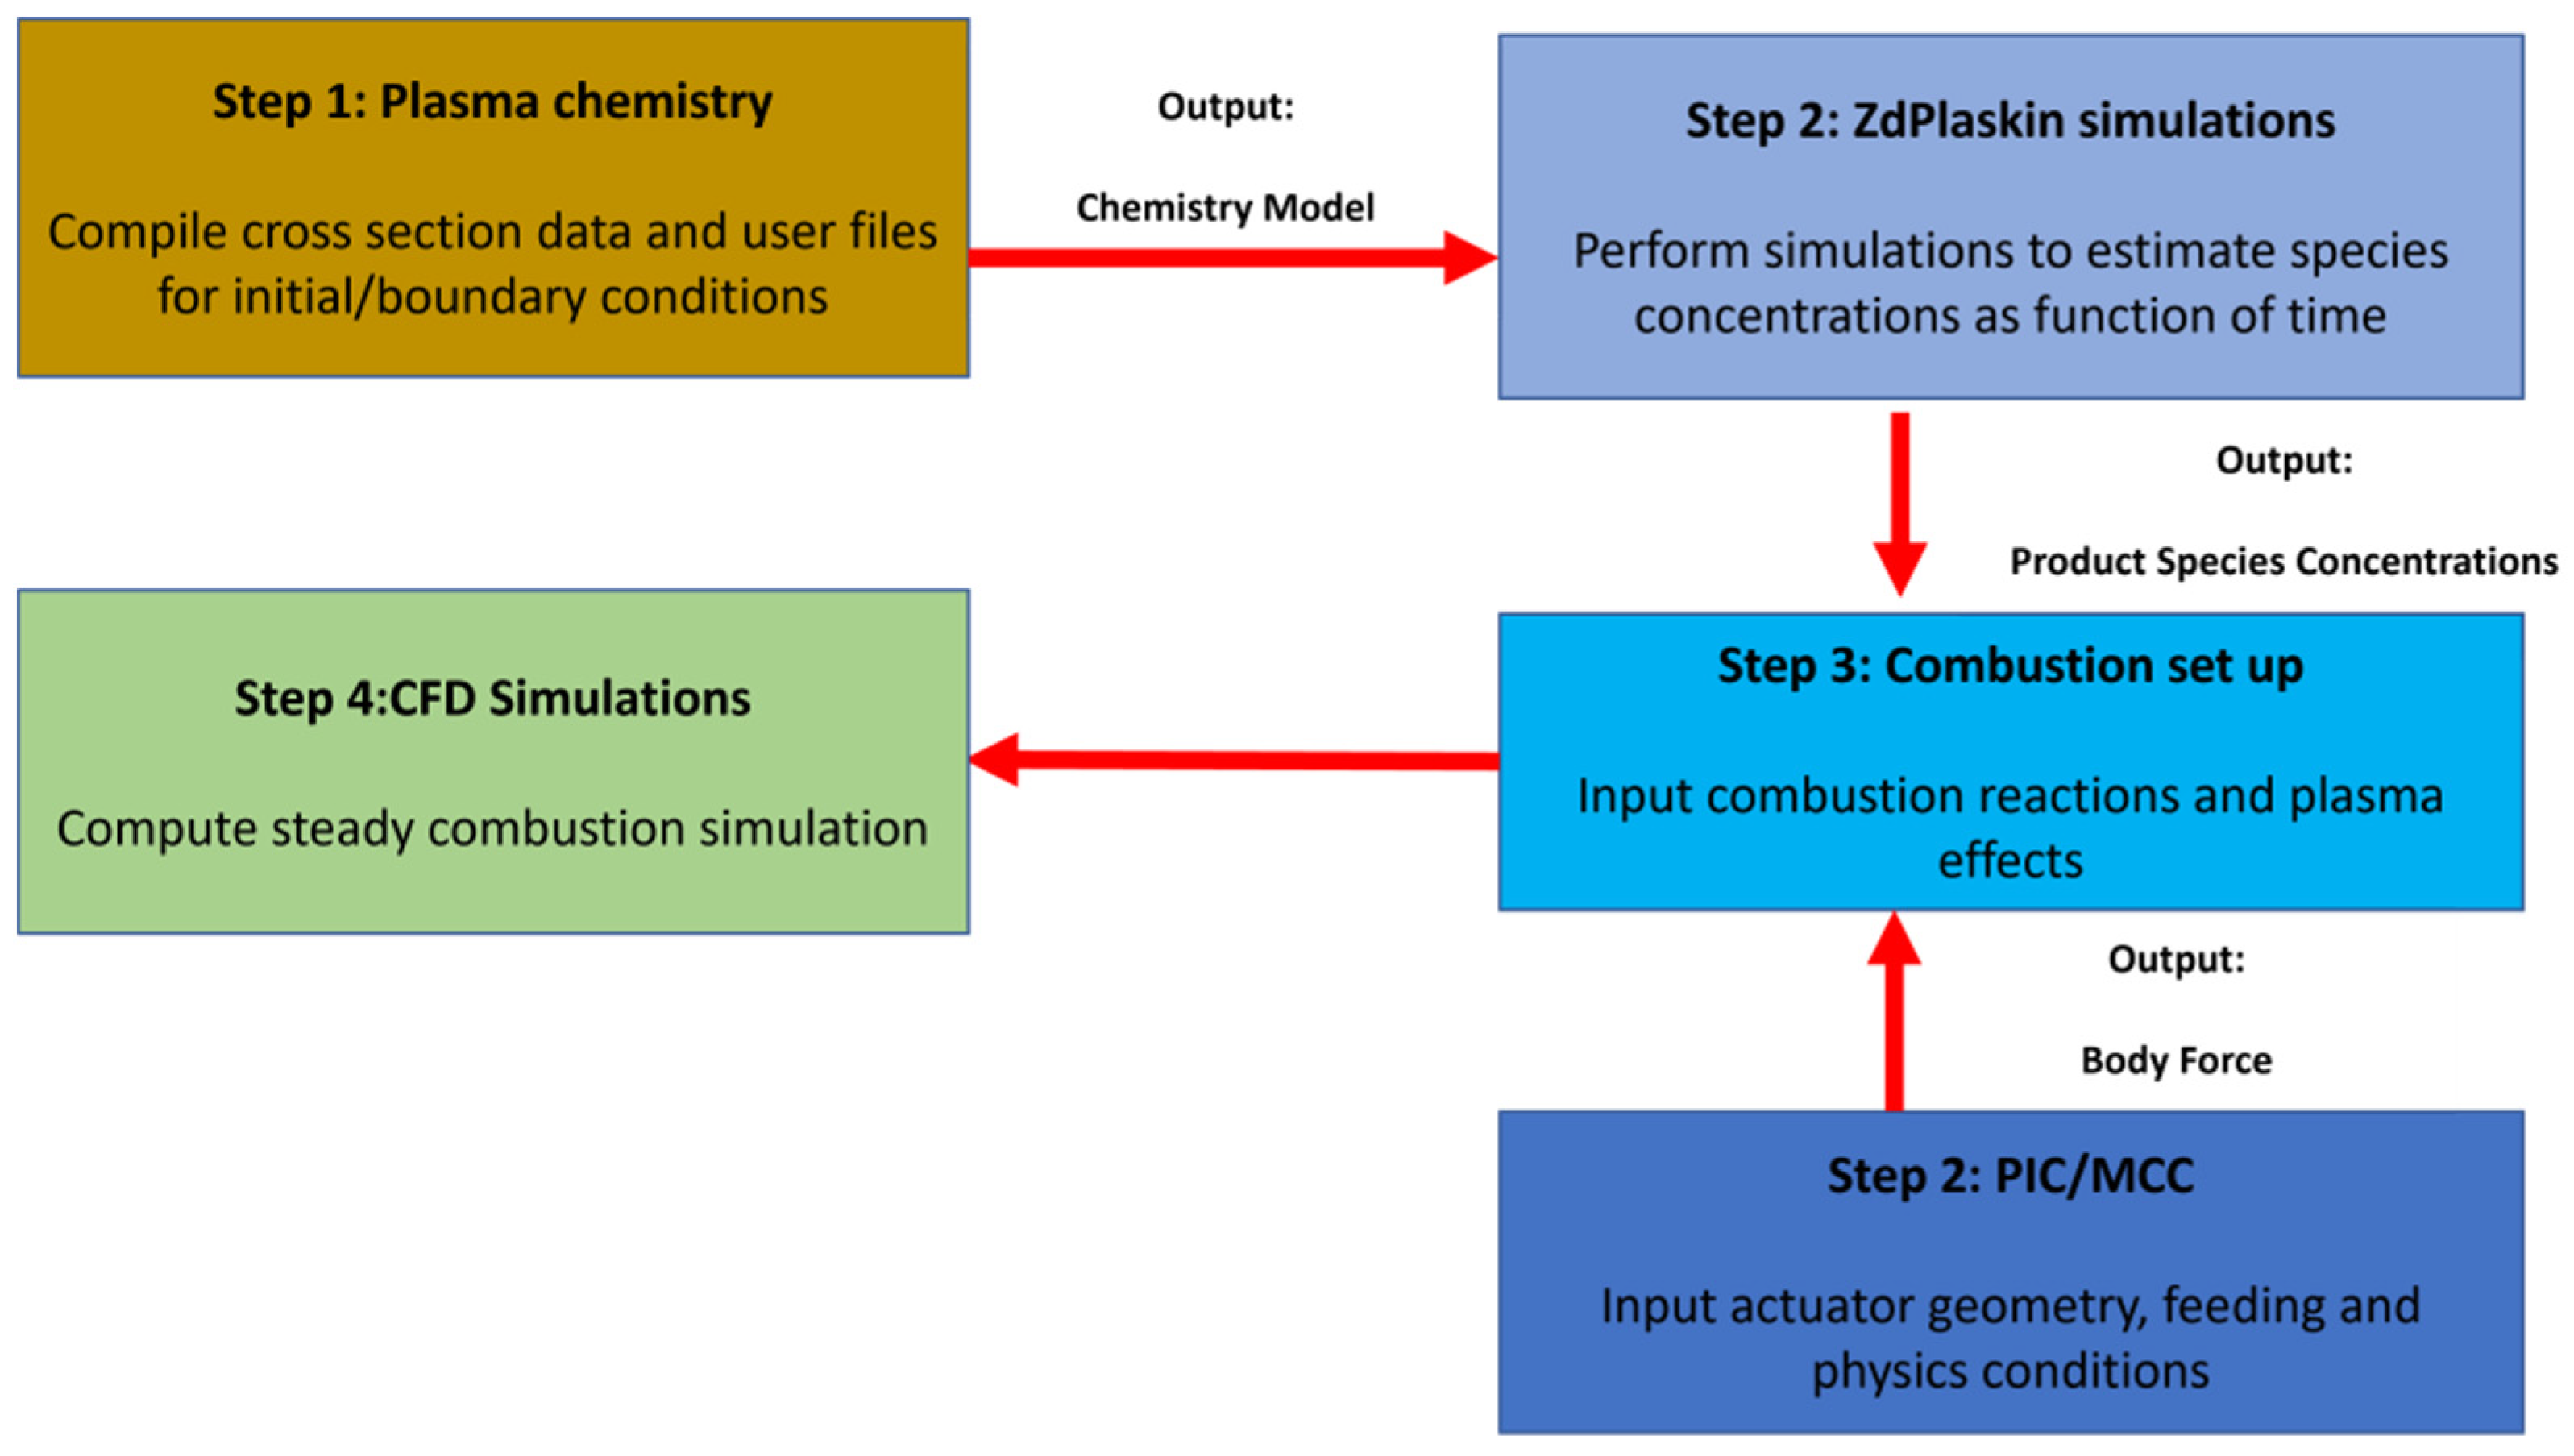
A new approach is proposed. Initially, plasma discharge is modeled to forecast kinetic effects using a zero-dimensional method based on the Boltzmann equation. This solution is then mapped to the Φ and V. Subsequently, the PIC/MCC model predicts the plasma body force and power density. Finally, these plasma effects are incorporated into steady-state CFD simulations.

3.1. PIC

The Particle-In-Cell model with Monte Carlo Collisions (PIC/MCC) computes interactions between electrons, charged particles, and neutral species with external and/or self-induced electromagnetic fields. It employs the Boltzmann equation and Monte Carlo method to calculate charged particle motion and collisions using an externally applied electric field. The time step ensures that particles do not leave the domain, cross more than one cell after each step, and do not exceed the plasma time scale. When the Knudsen number (Kn) is ≥0.1 (as it is in our test case), the non-continuum effect can be described by PIC/MCC. At each time step, the model calculates the collision probability, generates a new particle by replacing the background species and modifying the velocity, and finally updates the positions and velocities of these particles by integrating the equations of motion. However, due to computational limitations, a macroparticle is defined as a constant value representing a portion of the phase space distribution since particles with the same momentum are expected to remain close together in phase space [48,49].
In contrast, the size of the macroparticle in the position space is finite. Equation (1) describes the motion of charged particles, with k representing the charged particle, E representing the electric field, v and x representing particle motion, m representing the particle mass, n representing the density, and f representing the velocity distribution function.
C k = ( f k n k ) t + ( f k n k ) r v k       + ( f k n k ) v k   E   q k m k
Particle and field values are advanced sequentially in time, and the particle equations of motion are solved at every time step using field values interpolated from the discrete grid to particle locations. The XOOPICcode [50] is used with the Poisson equation 2D solved for each time step neglecting the magnetic field. The ion-density-to-neutral-species-density ratio is less than 10−3 (as it is nonthermal plasma), and the ion–ion and electron–ion collisions can be neglected. At the beginning of the simulation, no particles are initialized in the domain. The Fowler–Nordheim equation of emission is applied to the exposed electrode and emits electrons from the edge to the fluid [50] given by Equation (2):
j F N = β 2 A F N E N 2 φ w   t 2 ( y ) e x p [ ν y B F N φ w 3 / 2 φ w   t 2 ( y ) ]
where jFN is the field emission current density, while AFN and BFN are Fowler–Nordheim constants, β is the field enhancement factor, EN is the reduced electric field, and φw is the work function for the electrode material. To compute the force on each particle, field values are interpolated from grid positions to the given particle positions. Electrohydrodynamic forces are computed for each coordinated using the formula described in Equation (3):
f b   = e   E   ( n   i o n s n   e l e c t r o n s )
Q = j   E
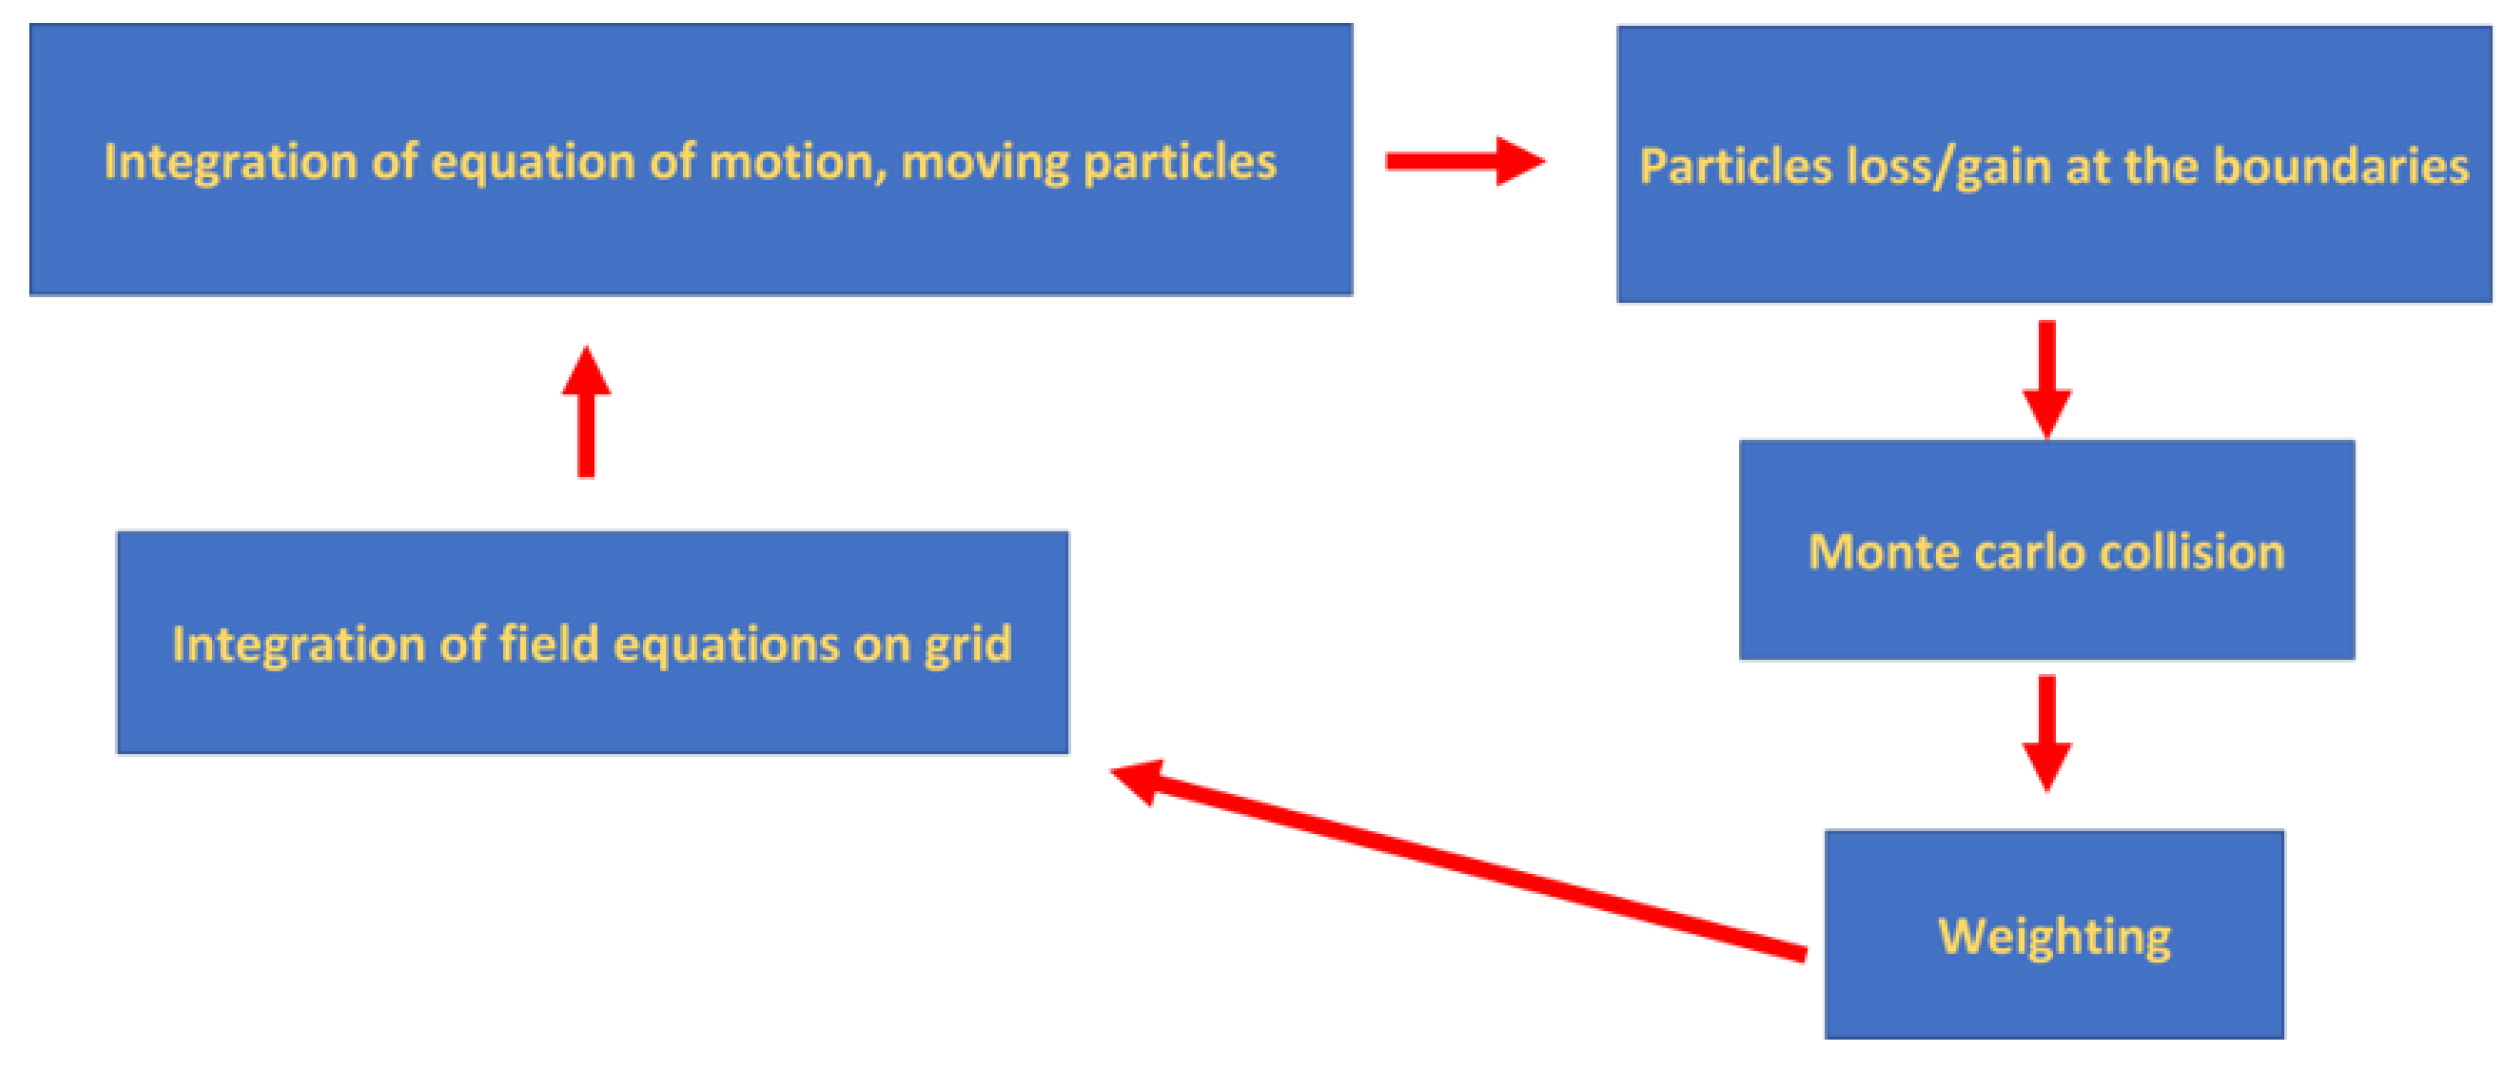
Figure 2 reports a schematic representation of the main stages of the methodology. The time step of 2 × 10⁻¹³ is set. Each macroparticle simulates 1 × 10⁶ particles to achieve consistent results and saves computational time. Table 2 summarizes the Fowler coefficients used, including the Fowler–Nordheim electron current density (jFN), the Fowler–Nordheim constants (AFN and BFN), and the surface roughness factor (β).

3.2. Chemistry Plasma Effect Modeling

During the ignition, the homogeneity of the plasma is supported by Intensified Charge-Coupled Device (ICCD) imaging that determines electron–ion recombination reactions, excitation and de-excitation, and the attachment and detachment of electrons and neutral species [46]. So, a 0-D approximation is consistent with the experimental results for our test case. The reactions that need to be solved to define the plasma effect on chemistry include excitation and de-excitation, electron–ion recombination, and the attachment and detachment of electrons and neutral species. Constant rate values are added for bimolecular and trimolecular hydrogen–oxygen processes and ion reactions. The Phelps and Pancheshnyi electron cross-section databases are used, which are available on the LXCat website [51]. The initial conditions of a pressure of 101,325 Pa and a temperature of 300 K are considered. Kinetics modeling is solved by Equations (5)–(9).
D [ N i ] d t j = 1 j m a x Q i j ( t ) = 0
A + b B = c C + d D
k j [ A ] a [ B ] b = R j
Q A = a R ,   Q B = b R ,   Q C = c R , Q D = d R
N g a s γ 1 d T g a s d t = j = 1 j m a x δ ε   R j   P e l a s t   [ N e ] + Q s r c
where Ni is considered the density of the species, Qij is the species production rate, and Rj is the reaction rate for reaction j. To determine the reduced field in the plasma zone, Orlov et al.’s model, which represents the DBD system as an RC electrical circuit, is used (Figure 3) [52]. A simplified air hydrogen scheme is applied incorporating mixed reactions of N2-H2 and H2-O2. The N2-H2-O2 mixture model consists of neutral, metastable, and charged species. In Table 3, the kinds of main species are illustrated.
By using this electrical circuit model, the reduced electric field is calculated based on the high voltage amplitude and frequency, the geometry of the plasma actuator, and its materials.
The model calculates the reduced electric field by considering various factors such as the applied potential, the design of the device, and the electrical/dielectric materials used. To represent the fluid, a combination of a capacitor and a resistor is used, along with a capacitor for the dielectric layer.
C a = ε 0   ε a   h   z L p
C d = ε 0   ε d   h d   z L d
R =   ρ a   L p h   z
ϕ a ( t ) = ϕ a m p l i t u d e   s i n   ( 2   π   ω   t ) + ϕ b i a s  
To describe the fluid in the model, a parallel combination of a capacitor and a resistor is used, along with a capacitor for the dielectric layer. The resistance R and capacitances of the fluid side Ca and dielectric side Cd are assigned specific values. To apply Kirchhoff’s law, the discharge potential Δϕ for the average slot is introduced at each time step.

3.3. Modelling Combustion

The CFD code Fluent 23.0 is used to solve the governing equations of conservation of mass, momentum, energy, and chemical species in the fluid, a second-order upwind scheme, and a pressure-based algorithm [53]. Gradients are calculated using the least-squares cell-based scheme. The simulation is considered converged when the residuals for all parameters, except for continuity, are lower than 10−3. To check for convergence and residuals, the simulation monitors the temperature and main combustion mass fraction products in the flame area (OH, H2O). A three-dimensional steady model is employed, and the influence of gravity is neglected. The basic governing equations of heat and mass transfer are given for an ideal gas. A segregated solution solver with a sub-relaxation method is used.
ρ t + ( ρ u i ) x i = 0
( ρ u j ) t + ( ρ u i u j τ i j ) x i = p x j + F p l a s m a
( ρ h ) t + ( ρ u i h ) x i = ( λ T f ) t j = 1 n ( h j J j ) x i + j = 1 n h j R j + P p l a s m a
( ρ Y i ) t + ρ u i Y i x i = J i x i R i
where ρ is the gas density, p is the pressure, u is the velocity, τ i j is the stress tensor, h is the total enthalpy, Ji is the diffusion flux of species i, Yi is the mass fraction of species, T is the temperature, and Rj is the net rate of production of species j by chemical reaction, i, λ thermal conductivity. F p l a s m a and   P p l a s m a are plasma source effects added to the actuator plasma region. The effect of convection and radiation on heat losses is computed considering Equation (18).
Q l o s s = h 0 A   T w T 0 + ε σ A   ( T w 4 T 0 4 )
Finally, the new PAC method is summarized in Figure 4. The characteristic time of the plasma is in the order of 10−7 s, while the ignition process takes around 10−3 s. As a result, the outputs obtained in step 2 can be used as steady-state input for step 3.

4. Validation

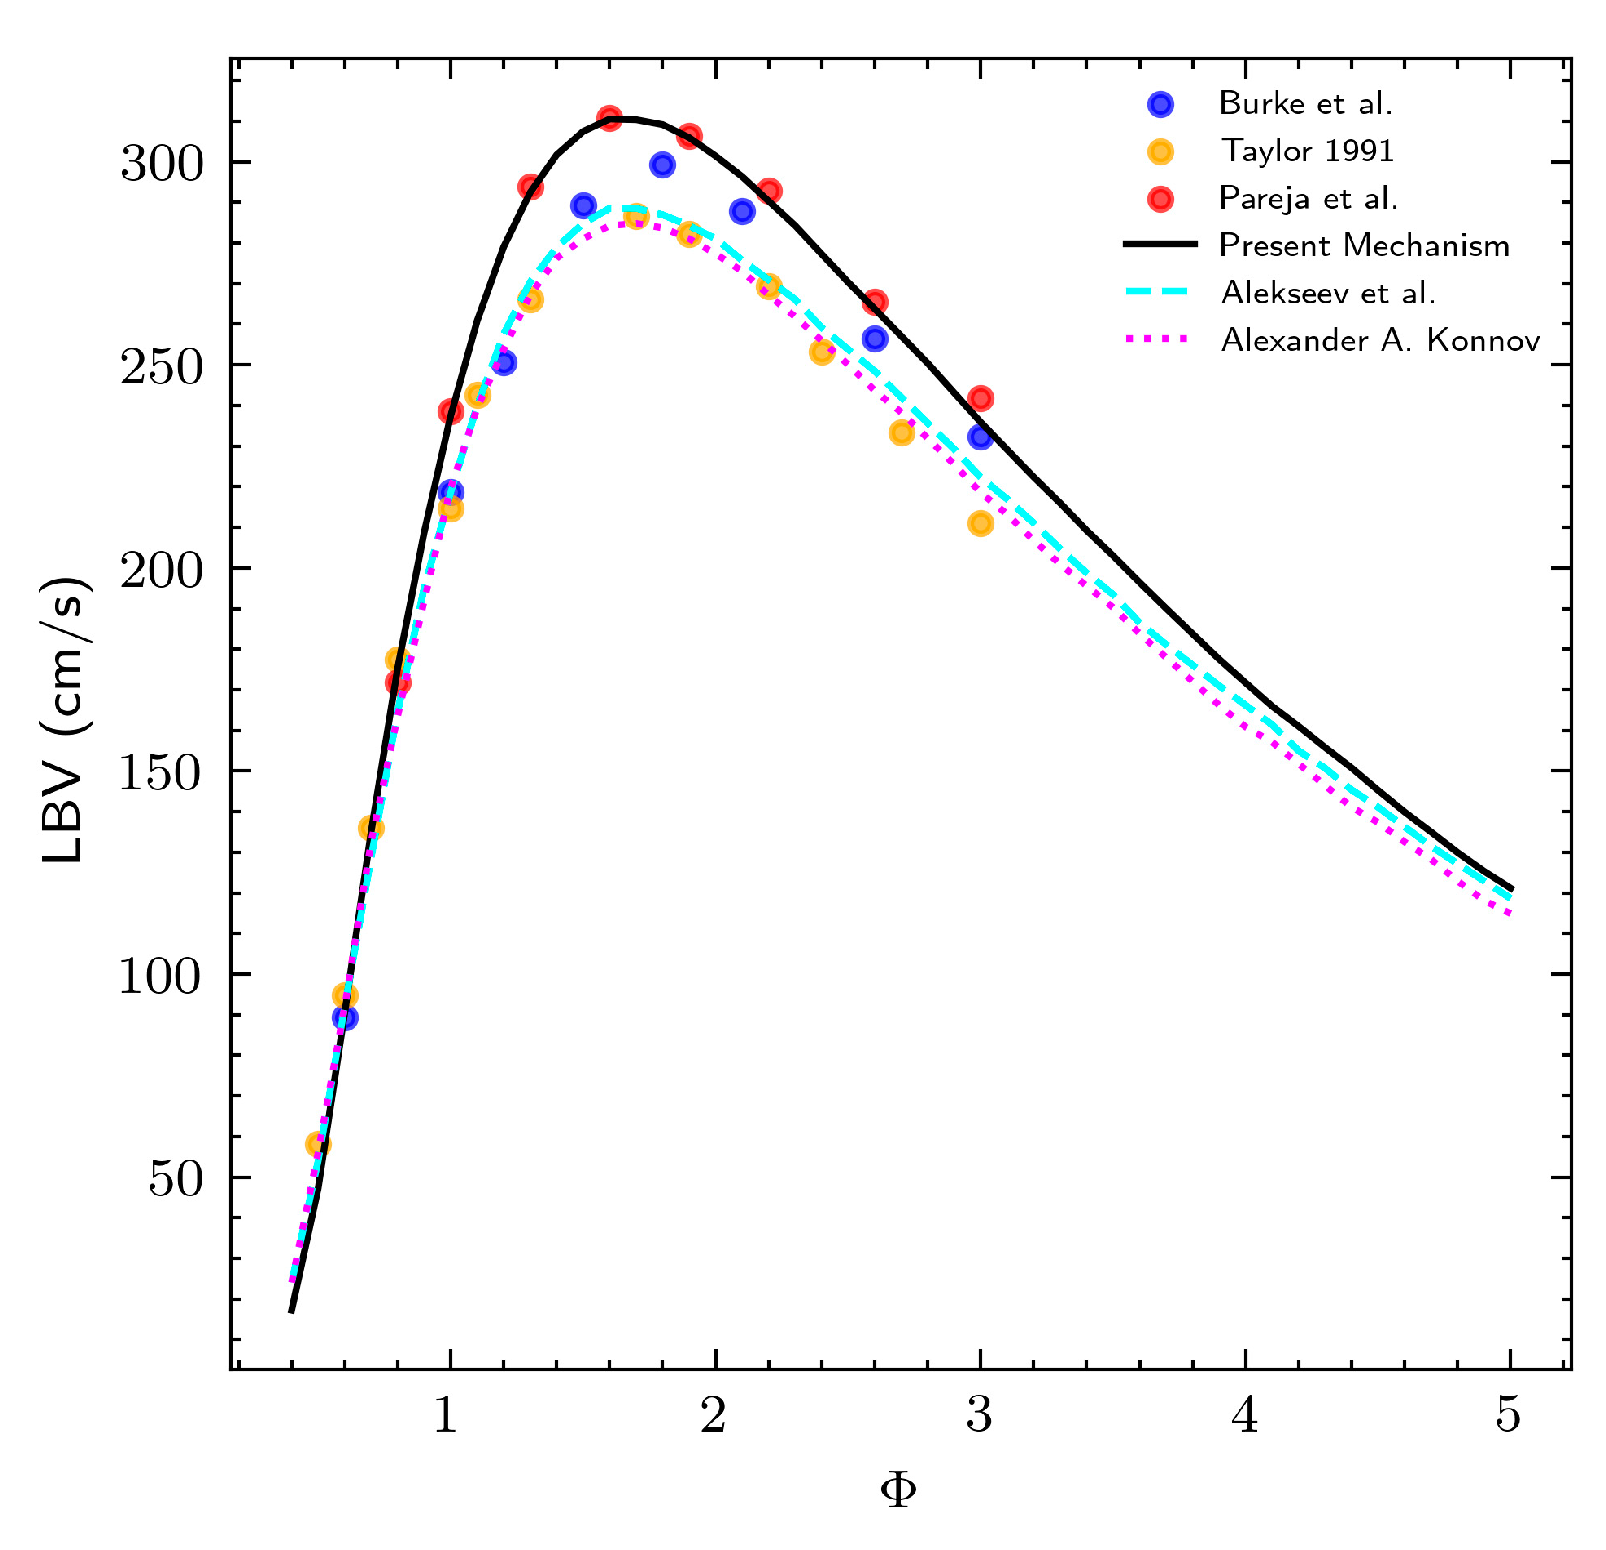
Kinetic combustion mechanism details were discussed in [46,47]. Validation was confirmed by correlating the data of Burer et al. [54] and Pareja et al. [55] with simulation results from Alekseev et al. [56] and Konnov et al. [57]. This comparison was conducted at a temperature of 298 K and a pressure of 1 atm over a range of equivalence ratios, as illustrated in Figure 5. The predicted values using the chosen mechanism showed strong agreement with the experimental data.
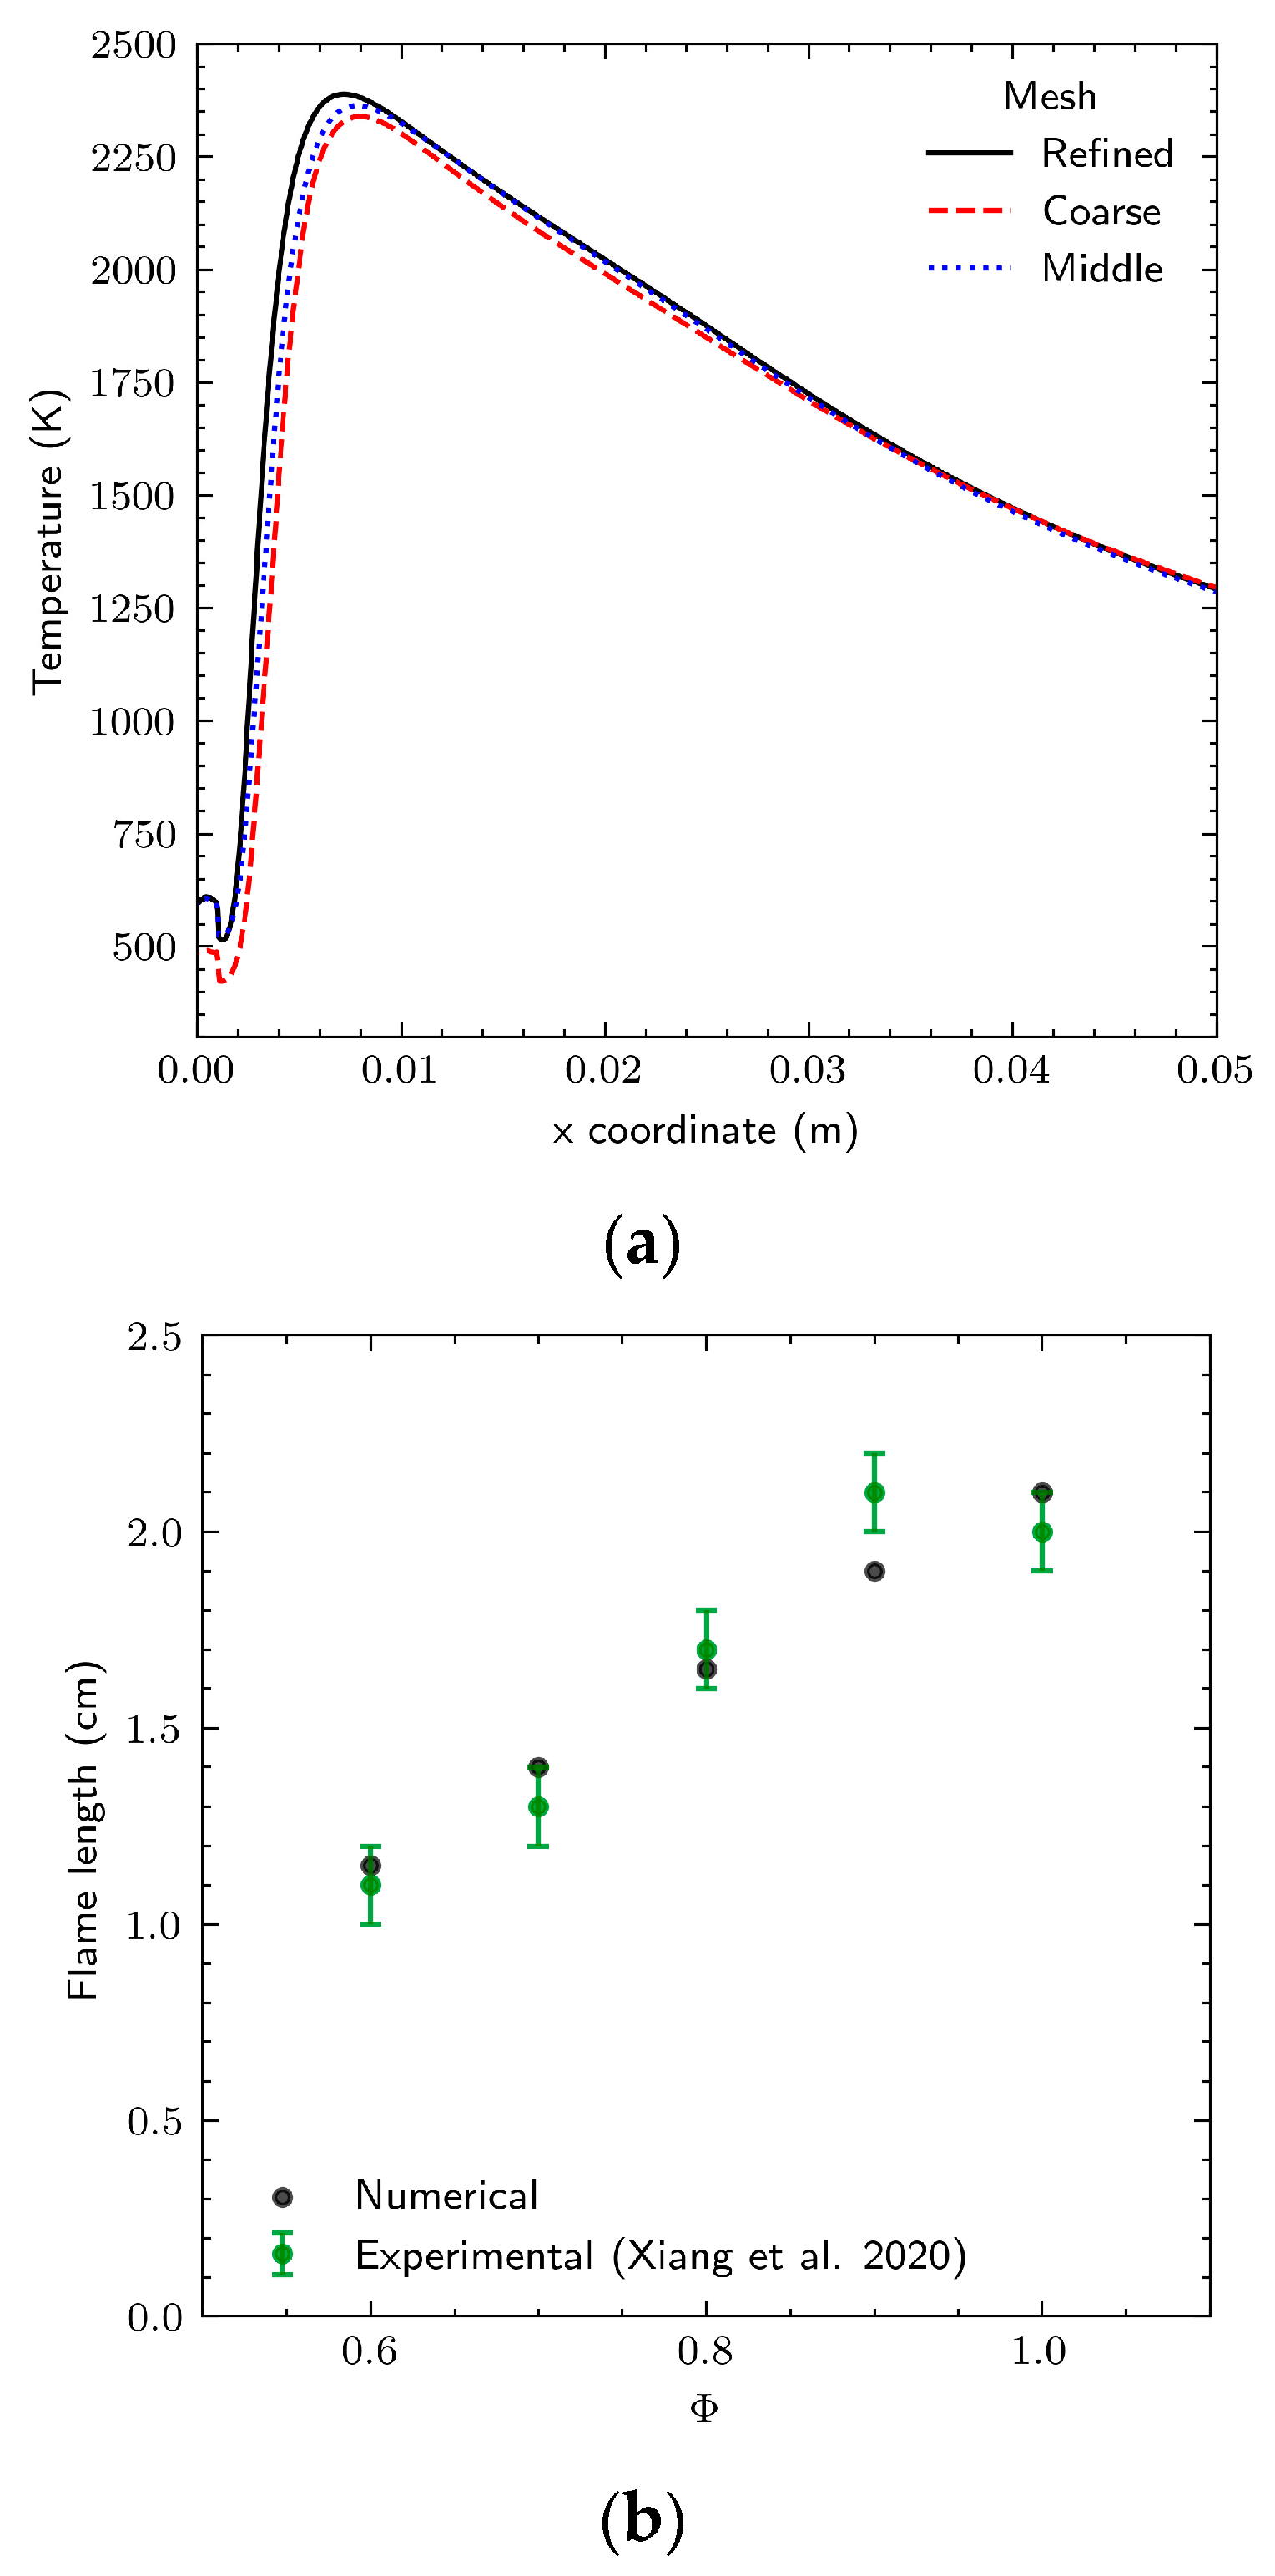
To ensure grid independence, the simulation results were evaluated at a velocity of 6 m/s in Figure 6a, under the H2 case condition, using three different grid resolutions. The mesh resolutions compared were 140 k cells, 175 k cells, and 237 k cells. In Figure 6b, CFD device simulation results were compared with experimental data [44] for an unburned mixture velocity of 6 m/s and Φ ranging from 0.5 to 1. For Φ values below 0.6, the simulations did not show a stable flame, which aligns with the experimental observations. By applying a threshold of 1 W/m3 to the heat of reactions, a function is found between the experimental flame picture and numerical results.
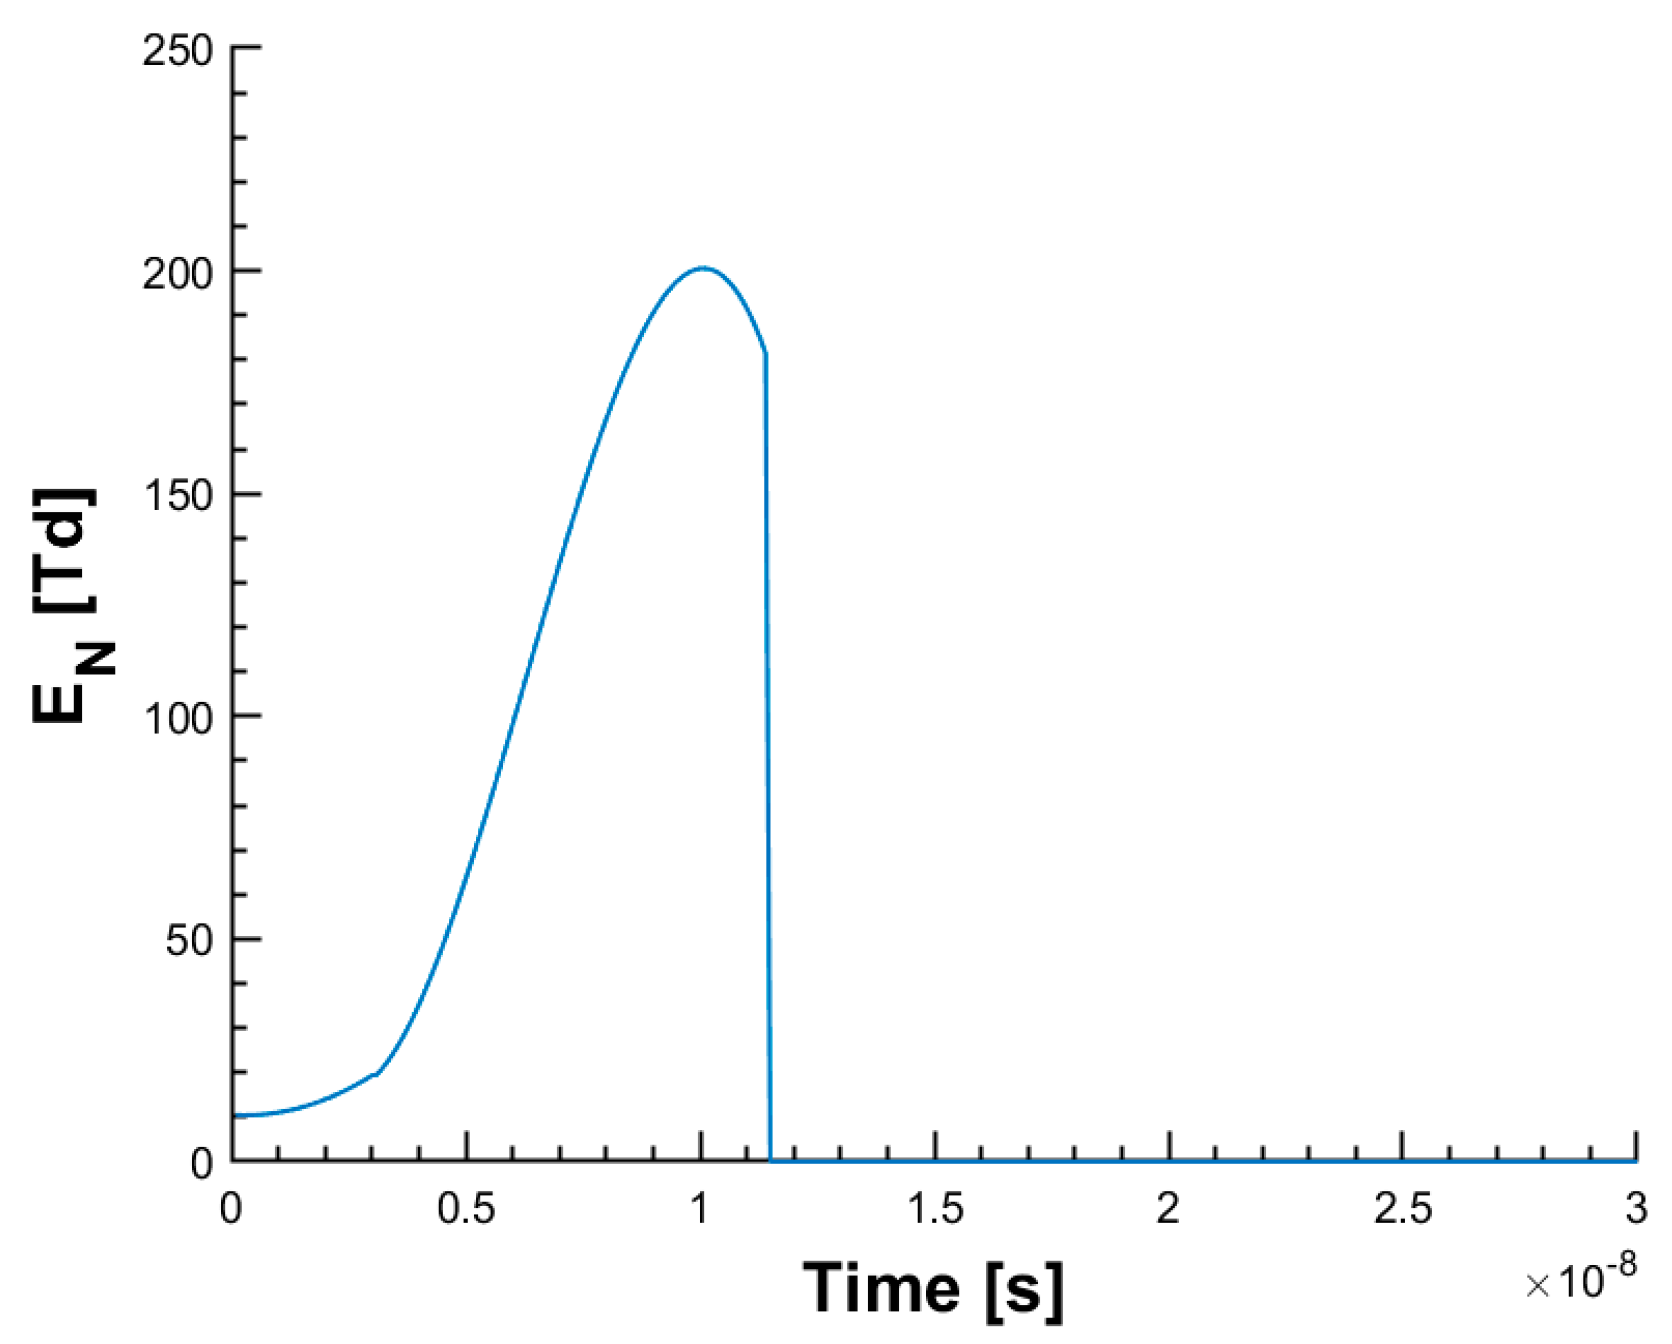
No experimental data for FE-DBD actuators’ decoupled effects are present in the literature. So, the novel plasma model has been validated by migrating the step and effect with available experimental data. A kinetic model was tested using nano-pulsed (NP) plasma discharge on hydrogen diluted with helium. The experimental setup and results are detailed in [58], with the initial temperature set to 298 K and a constant pressure of 8000 Pa. The numerical model was based on two steps: firstly, the discharge effect was analyzed by ZDPlasKin 2.0; secondly, the oxidation reactions were computed in the CHEMKIN environment [53]. To initiate plasma discharge, a 200 Td 3 × 10⁻⁸ s pulse was applied (Figure 7) with a duty cycle of 3.3 × 10⁻⁵ s. The simulations were conducted until a steady state was achieved after 10 pulses. The final mixture is presented in Table 4.
In CHEMKIN [53], the test case was reduced to two ducts. Duct 1 features a constant flow of the non-ionized mixture to model inlet clean flow, while duct 2 uses the ionized mixture. In Table 4 and Figure 8, comparisons between the numerical and experimental results are shown, and our data are in good agreement with the experimental results.
In the second case, PIC results were compared with previous literature analysis [41]. The flow residence time in the plasma region was computed using Equation (19).
t r = L p   v f     ~   10 6   s .
The fluid is considered to be composed of N2. The simulation reached a stationary state after a few cycles and computations were performed over 28 cycles (tp = 10−7 s), below the residence time. The electron density during simulation is lower than the ion density due to electron losses resulting from attachment to the dielectric, escaping to the far field. In contrast, ions take longer to diffuse to surfaces, creating a net positive region. Average charged species density PIC computations are compared to Shivmkar et al. [42] in Table 5.
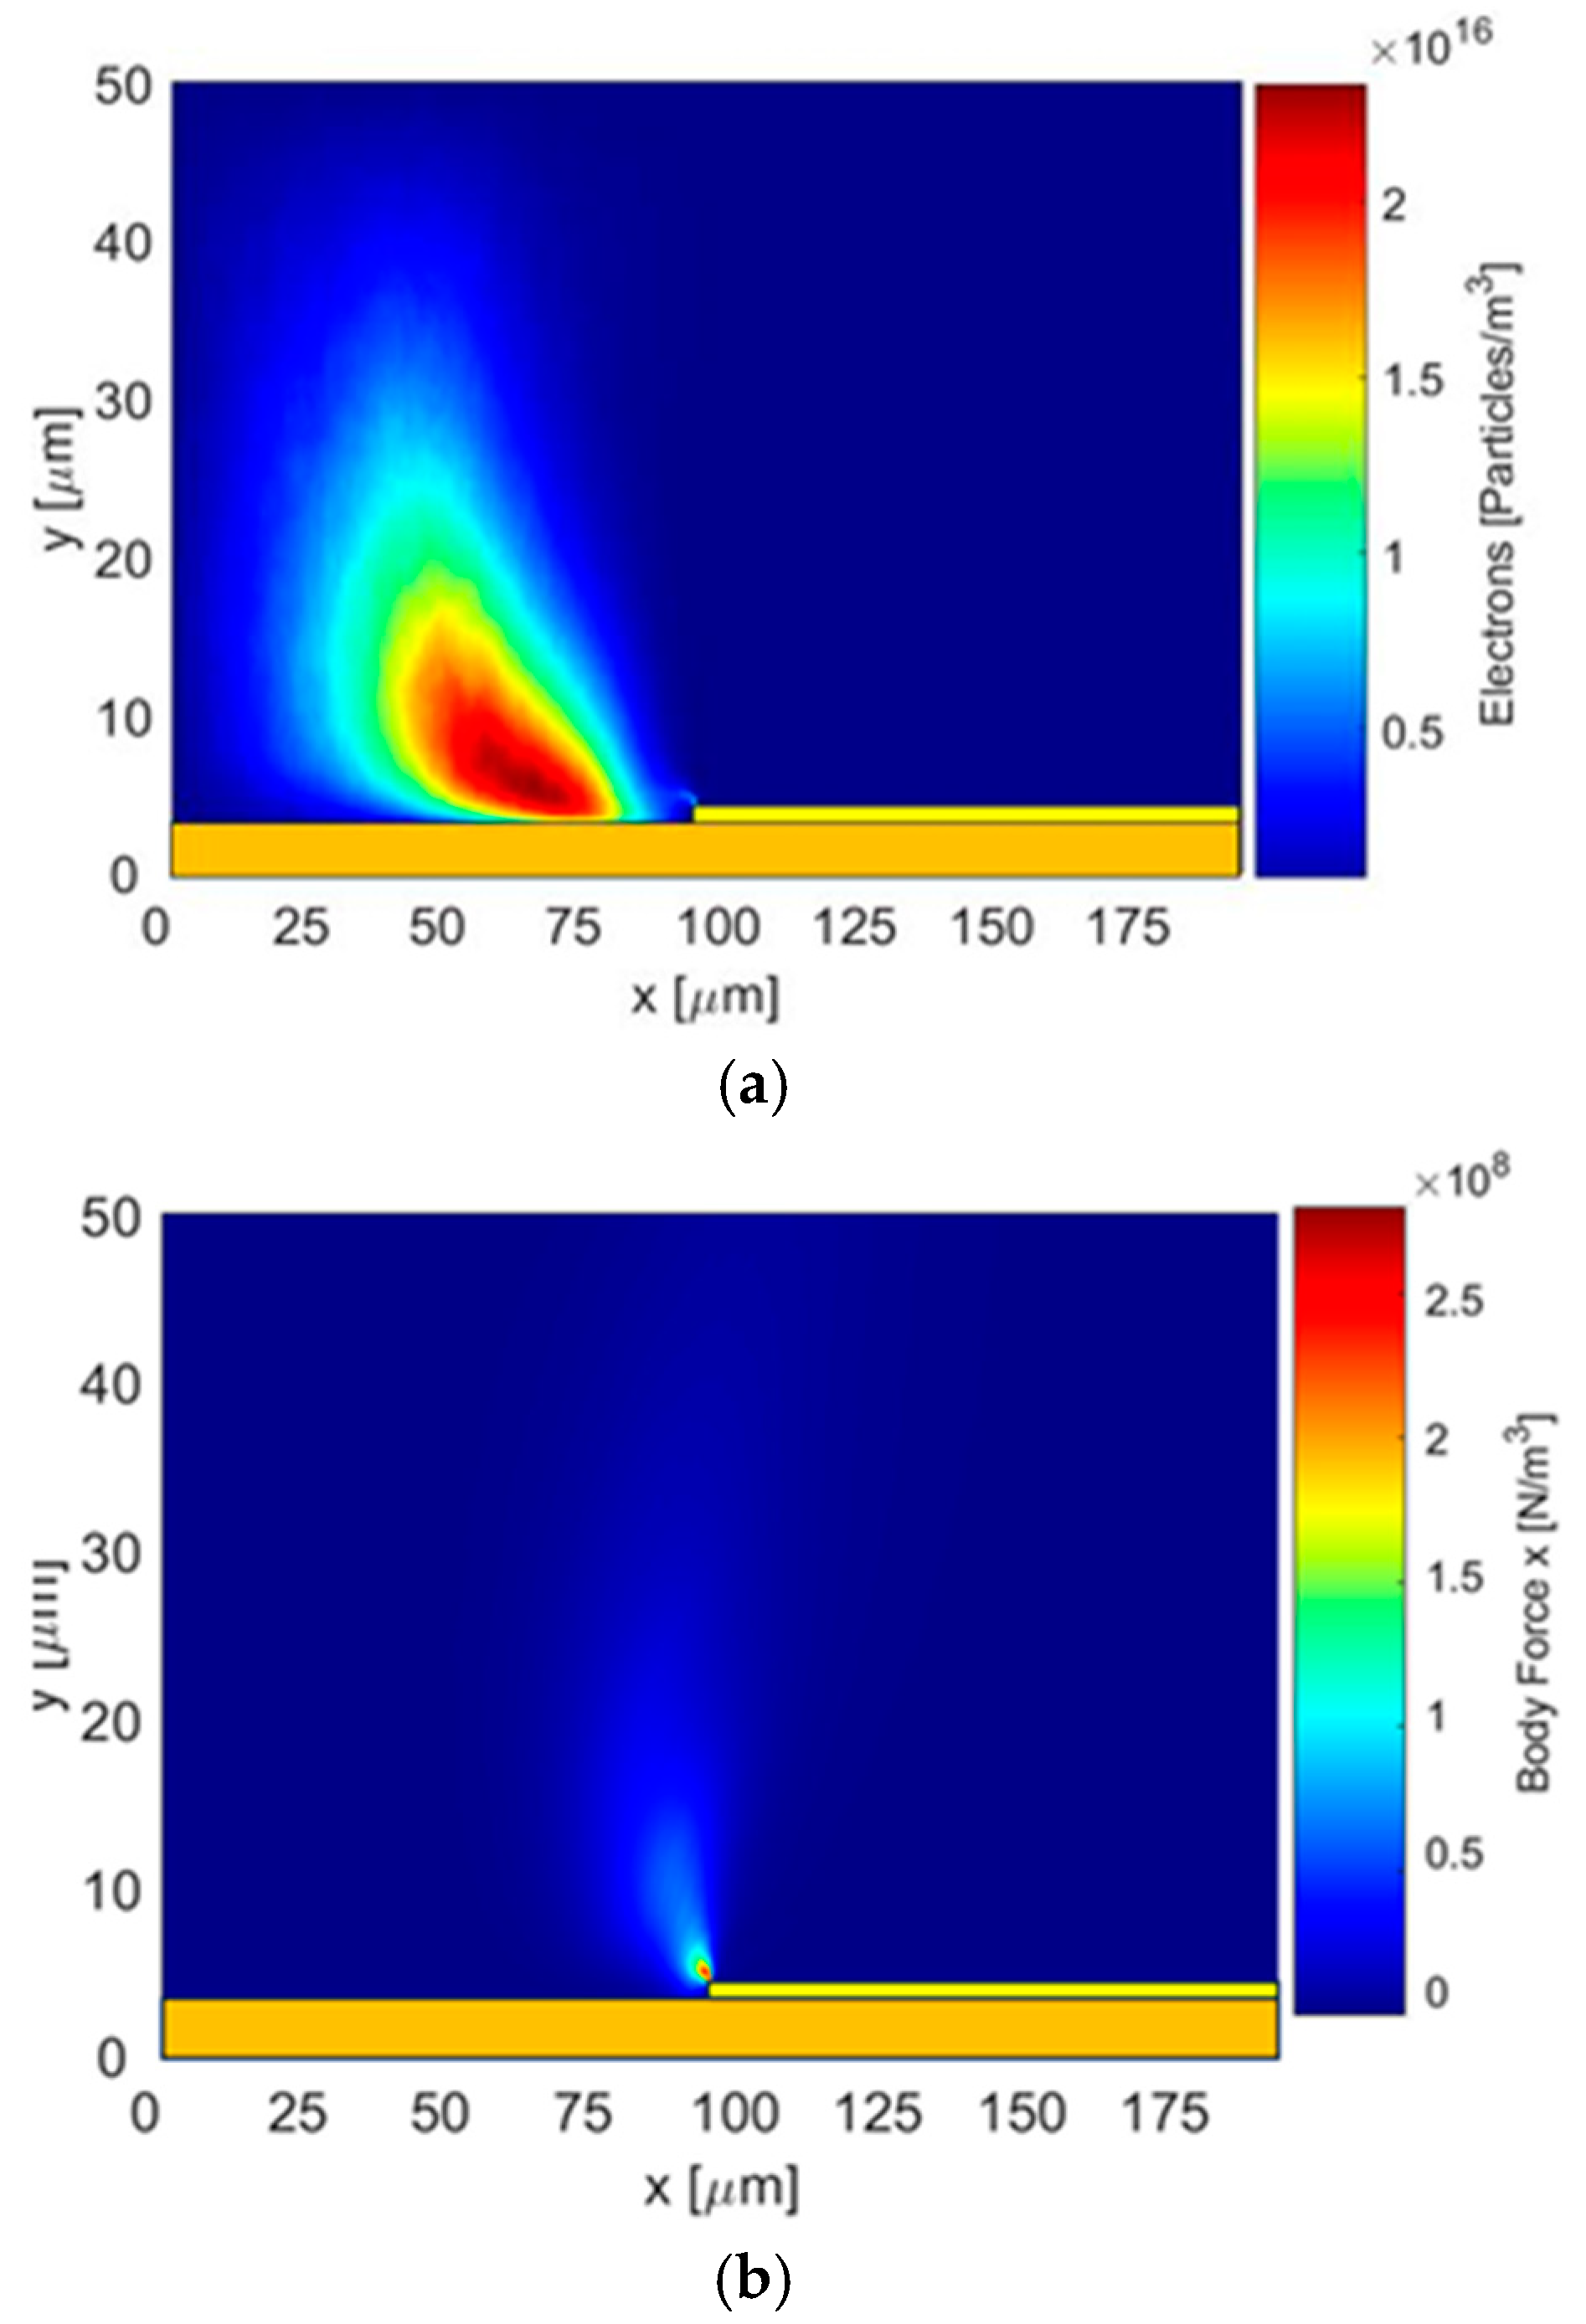
The electron particle density is the highest above the covered electrode region (Figure 9a). In Figure 9b, the spatial-time force distribution over cycles 20–28 is depicted, being mainly present near the exposed edge. Finally, the computed values of mean body force and power density are equal to 1.6 × 10⁶ N/m3 and power density equal to 1.8 × 10⁹ N/m3.

5. Results

5.1. Plasma Discharge Kinetic Results

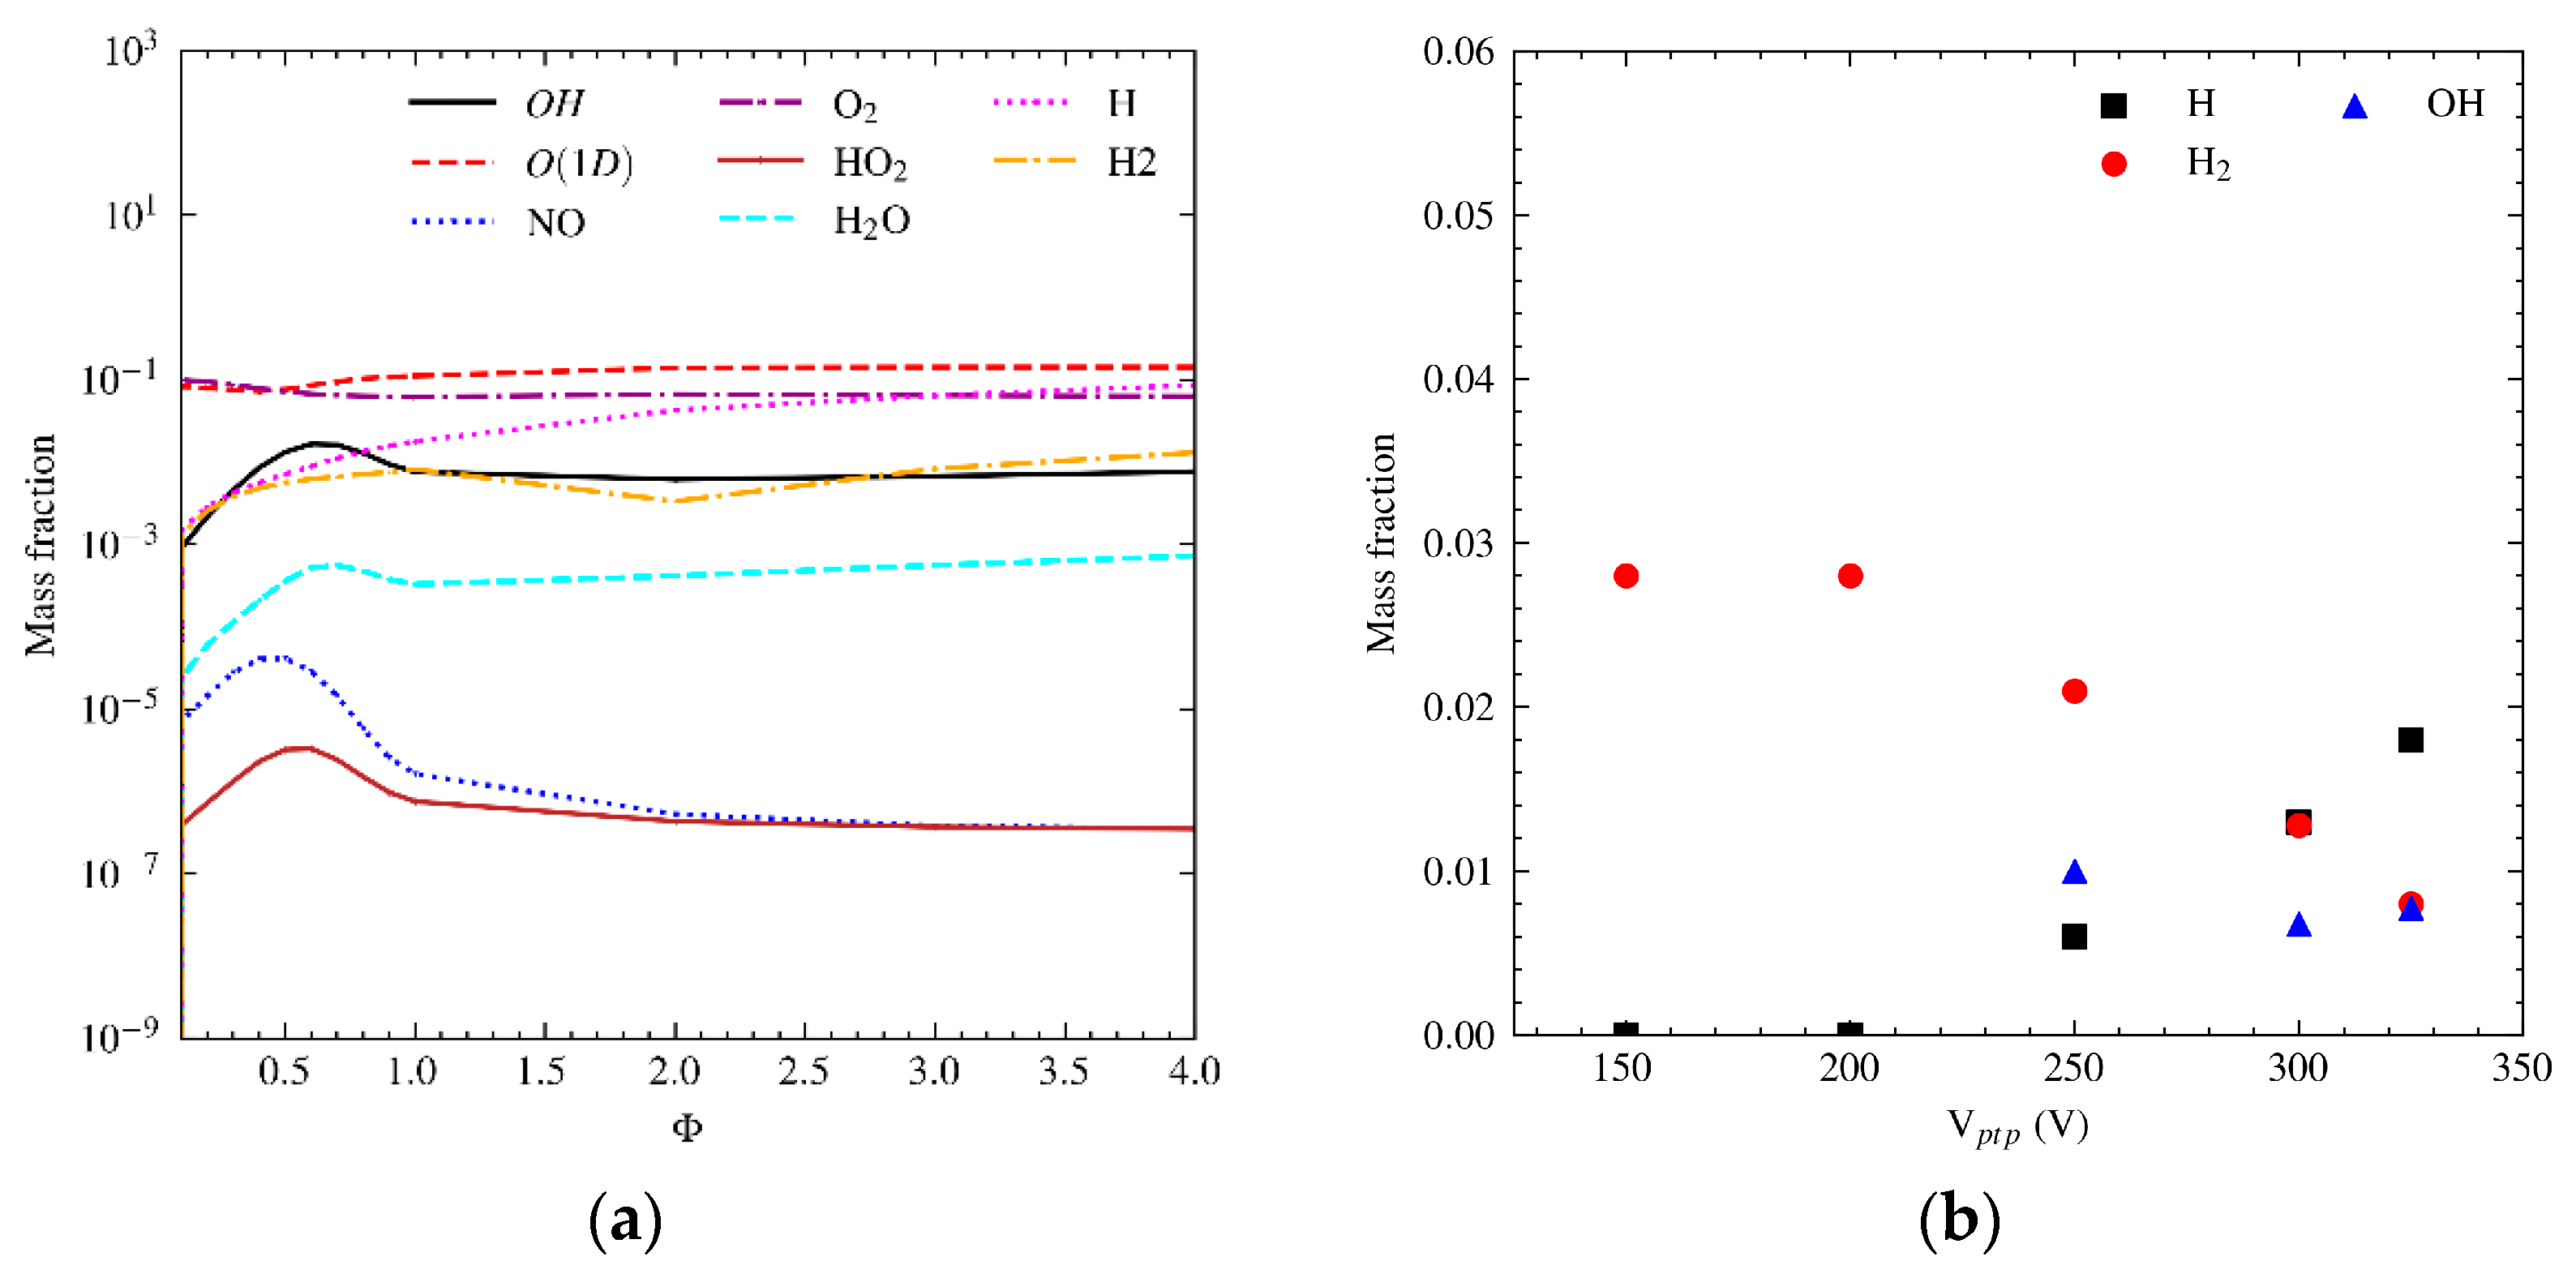
Reduced electric field EN displays a sinusoidal pattern peaking at around 400 Td. Specifically, the integral of the species concentrations over the first five cycles was calculated, and the most significant species were identified, and their mass fractions were computed. The fuel oxidation process is initiated by H atoms generated from H2 dissociation, which form HO2. Most of HO2 then converts to OH, which reacts with H2 to form H2O, the product. As evident in Figure 10a, for mixtures with equivalence ratios greater than 2, the mass fraction of H and H2 becomes increasingly dominant, playing a crucial role in plasma kinetics and then flame ignition. For leaner mixtures, the preferable condition is an equivalence ratio of 1, where there is the best trade-off between the concentration of OH and H, which are radical species crucial to the combustion reaction chains (Figure 10a). In Figure 10b, an analysis is presented, varying the potential while keeping the Φ fixed at 1. The highest potential amplitude (325 V) allows for the dissociation of more hydrogen molecules and results in a higher concentration of OH, justifying this choice of actuation condition for plasma-assisted microcombustion with this condition. For potential amplitude peak-to-peak (Vptp) values below 250 V (Figure 10b), no dissociation of hydrogen molecules is observed. These findings are consistent with the 2D PIC model where no electrons were produced in these conditions, confirming the reliability of both models.
Therefore, within the CFD conditions for plasma actuation, a potential of 325 V is considered. For the chemical kinetics, a fitting curve of phi is defined for all the indicated species. This function is incorporated into the plasma domain in the CFD analysis, ensuring that the analysis accounts for the local composition within the domain. This is crucial due to the asymmetric concentration in the mixture channel caused by the non-premixed nature of the experiment.

5.2. Plasma Assisted Combustion Results

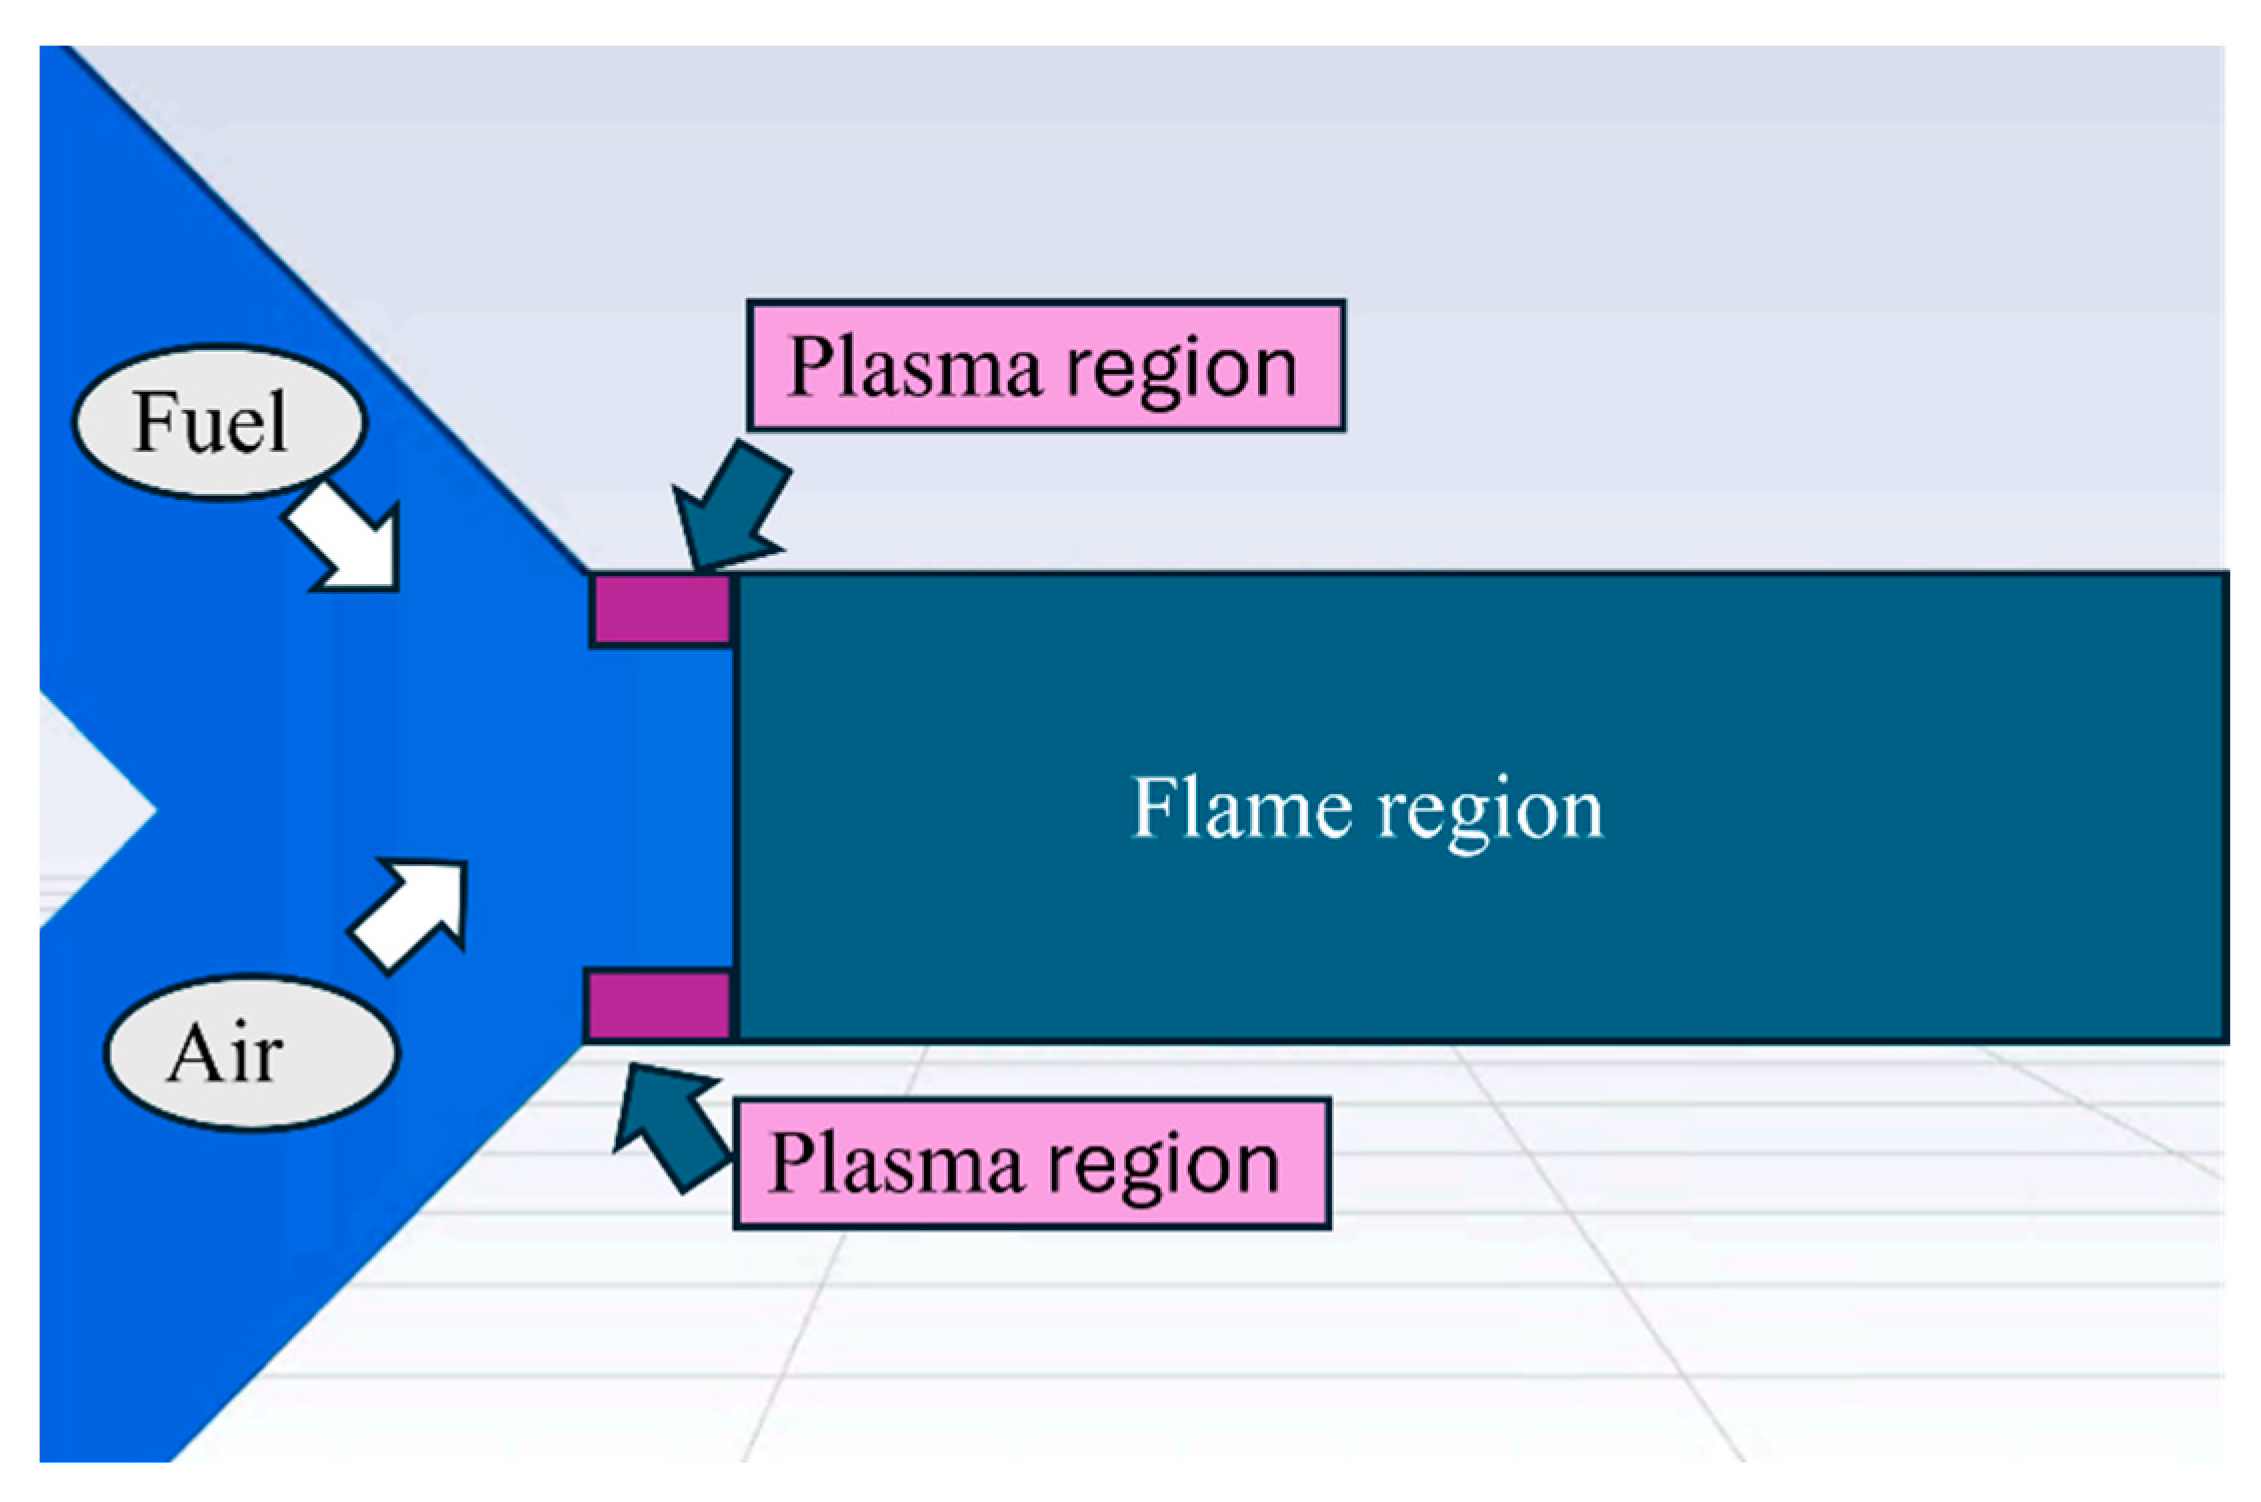
Two actuators were used: one on the flame side and the other on the air side for x = 0 and y = +/−1 mm (Figure 11).
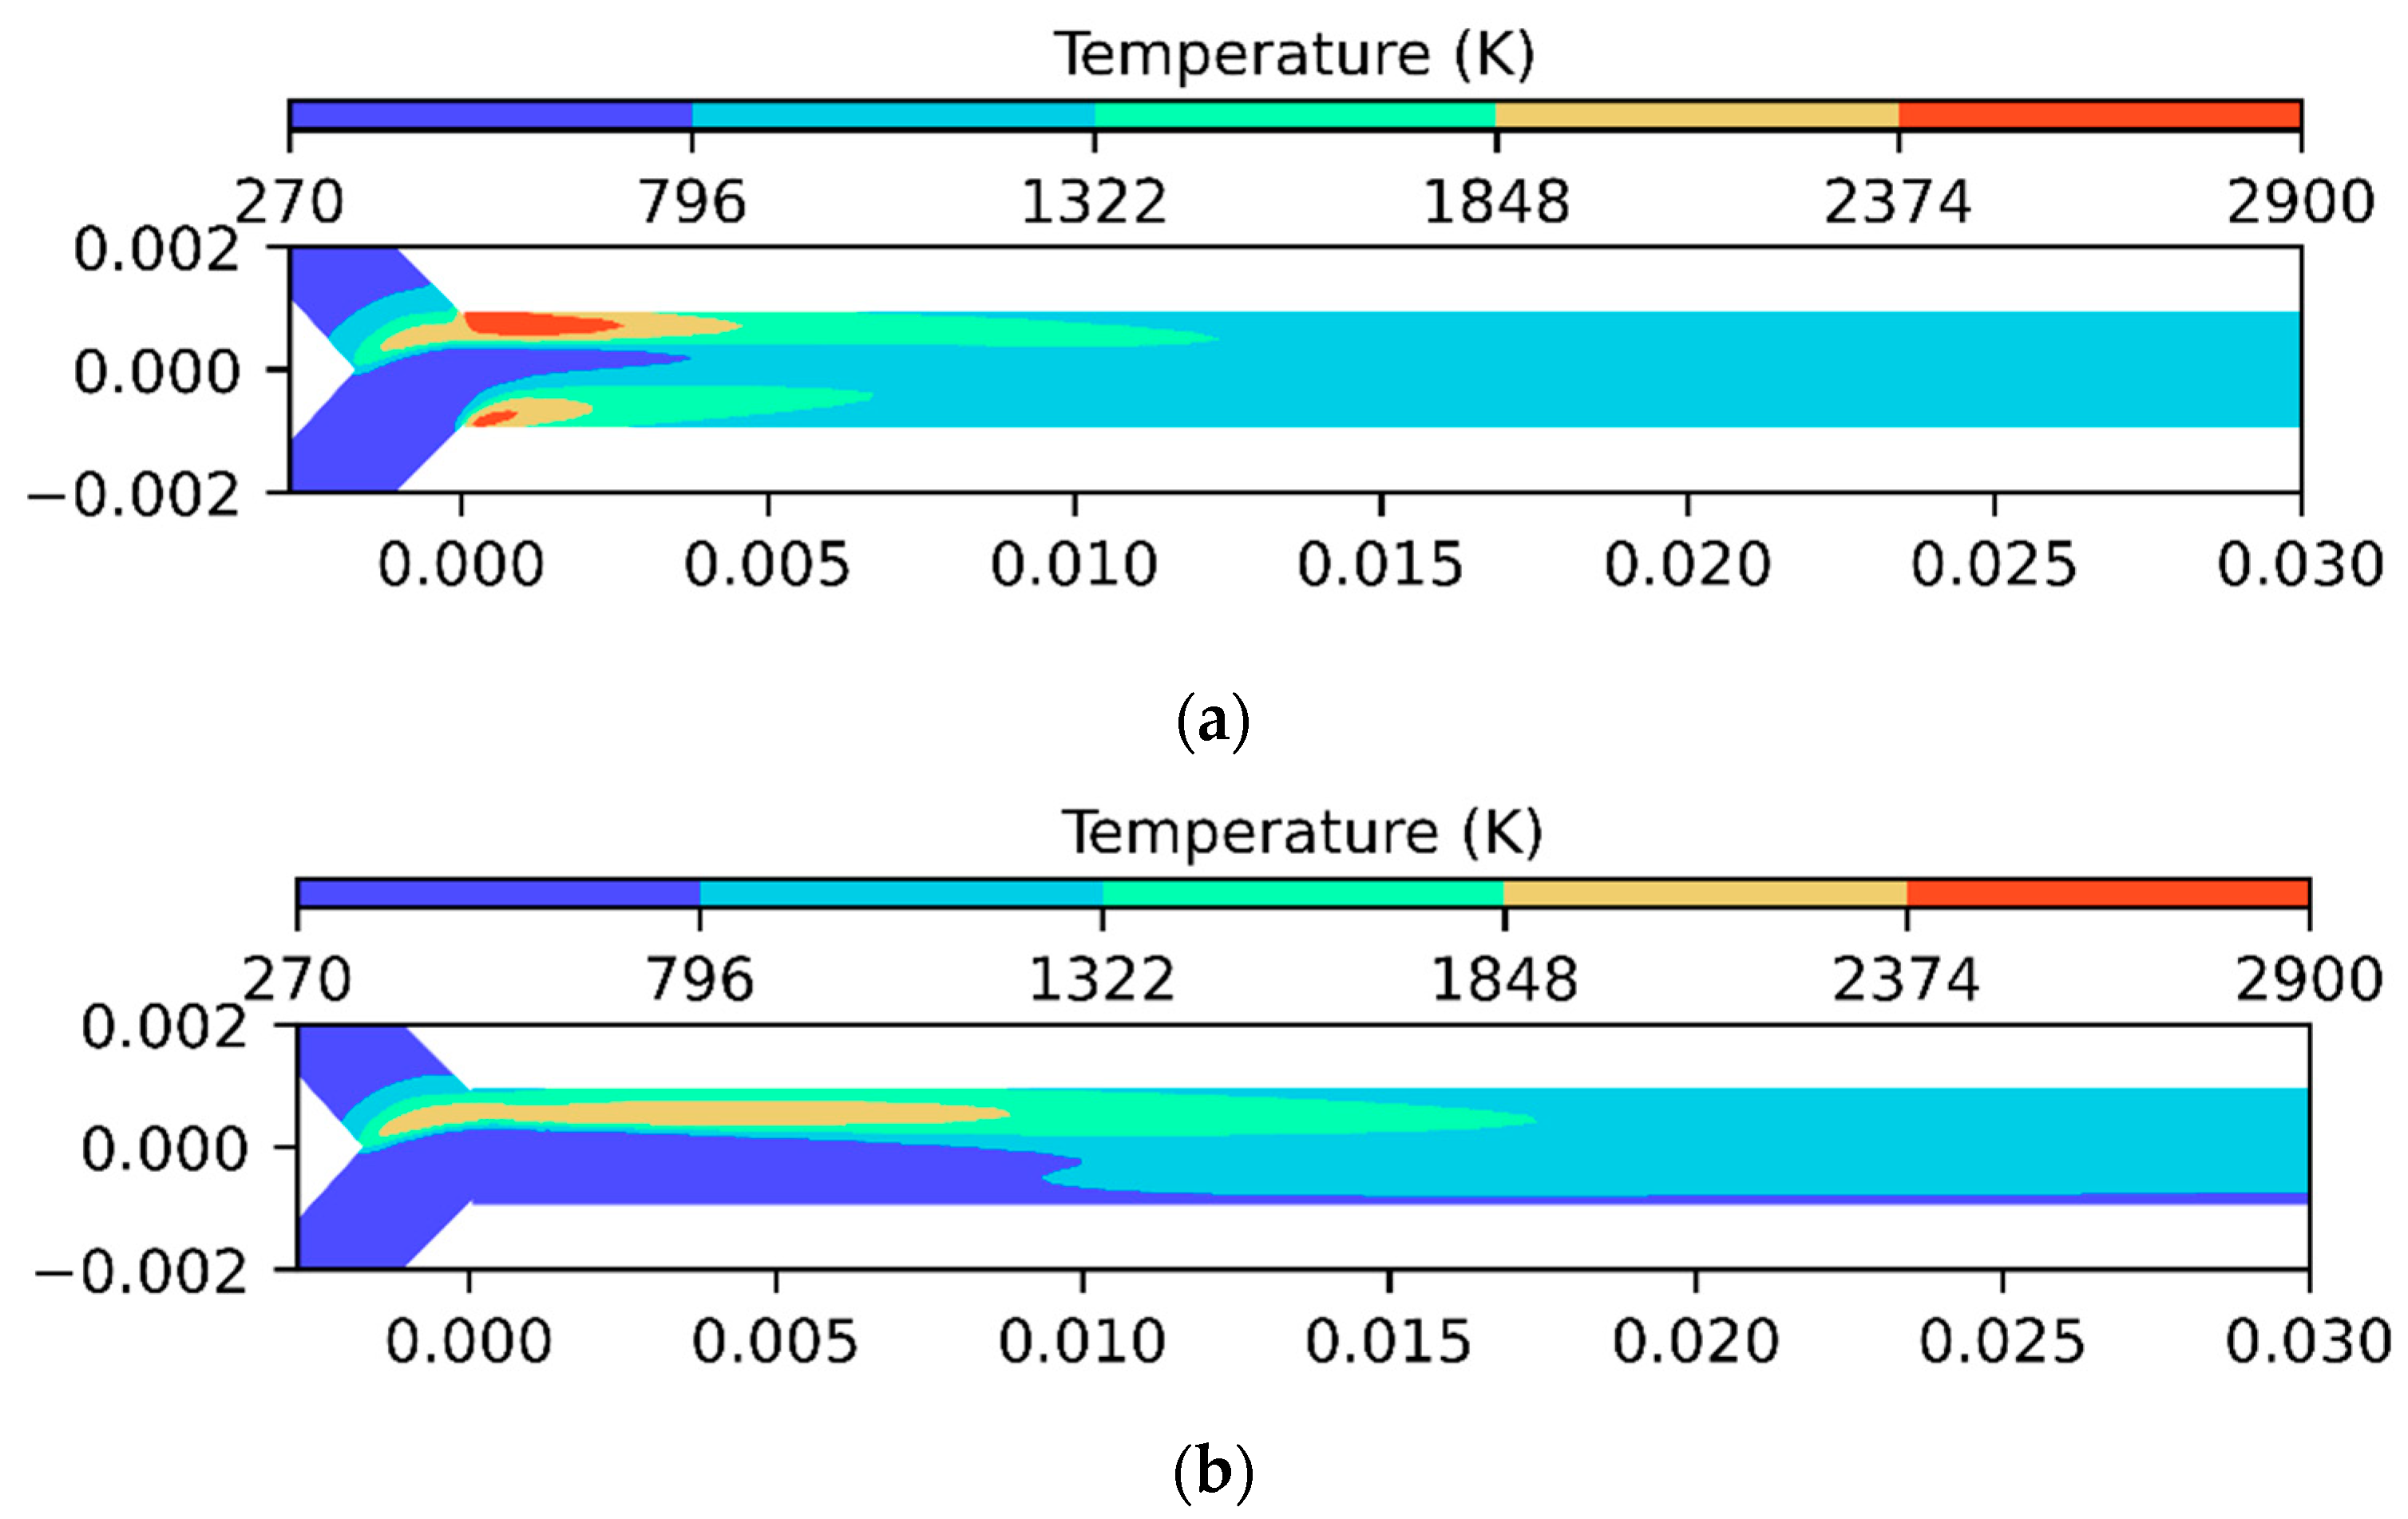
In the paper, the plasma effects were first decoupled to ascertain which has a greater impact in this scenario. In the comparative analysis between the plasma effect of the temperature distribution profiles shown in Figure 12, significant variances are observed closer to the plasma source region, suggesting radical activity also from the oxygen duct. On the other hand, the momentum and power density effect show a temperature of 2238 K, with a single flame distribution. As demonstrated in our previous work and experimentally, under this condition without plasma, there is no stable flame. The shape and temperature difference between the two conditions is significant. With the kinetic contribution, the flame has two high-temperature regions, close to the electrode areas. Furthermore, the area with a temperature above 1322 K ended next to x = 13 mm. When the contributions of force and energy are active, it is evident that the flame is defined in a single area and has a lower maximum temperature, but the hottest region extends further along the conduit, up to 18 mm.
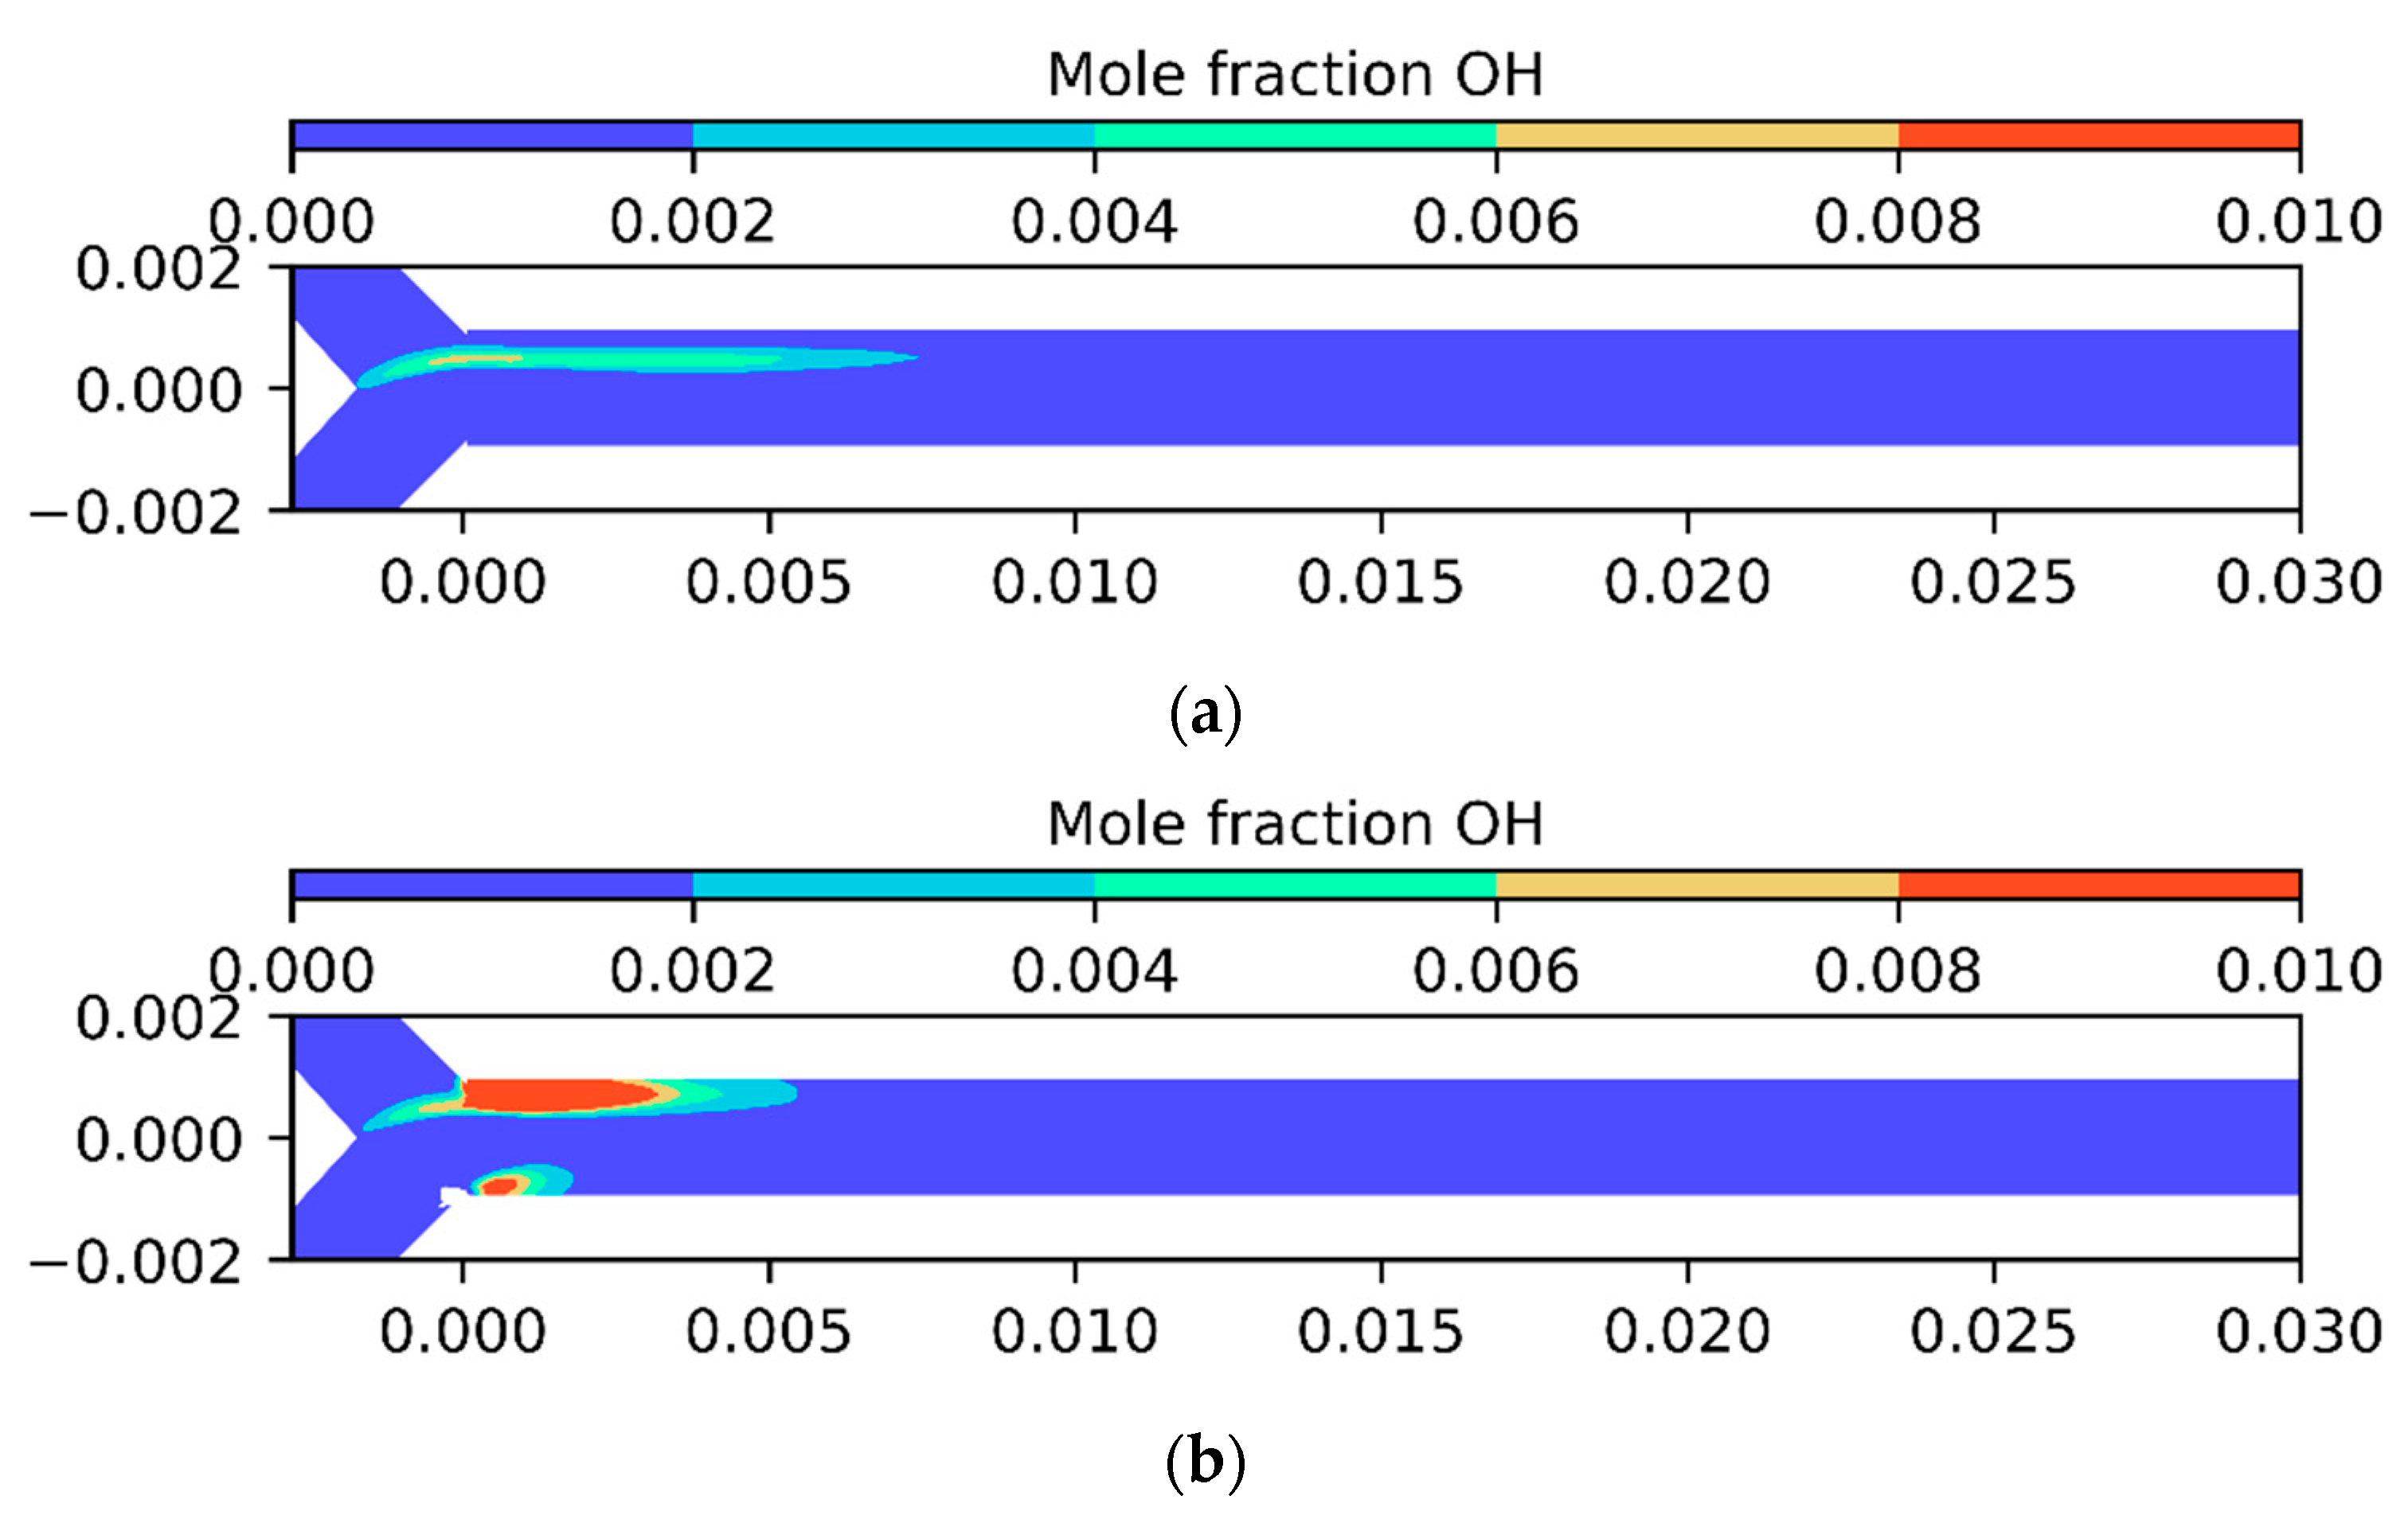
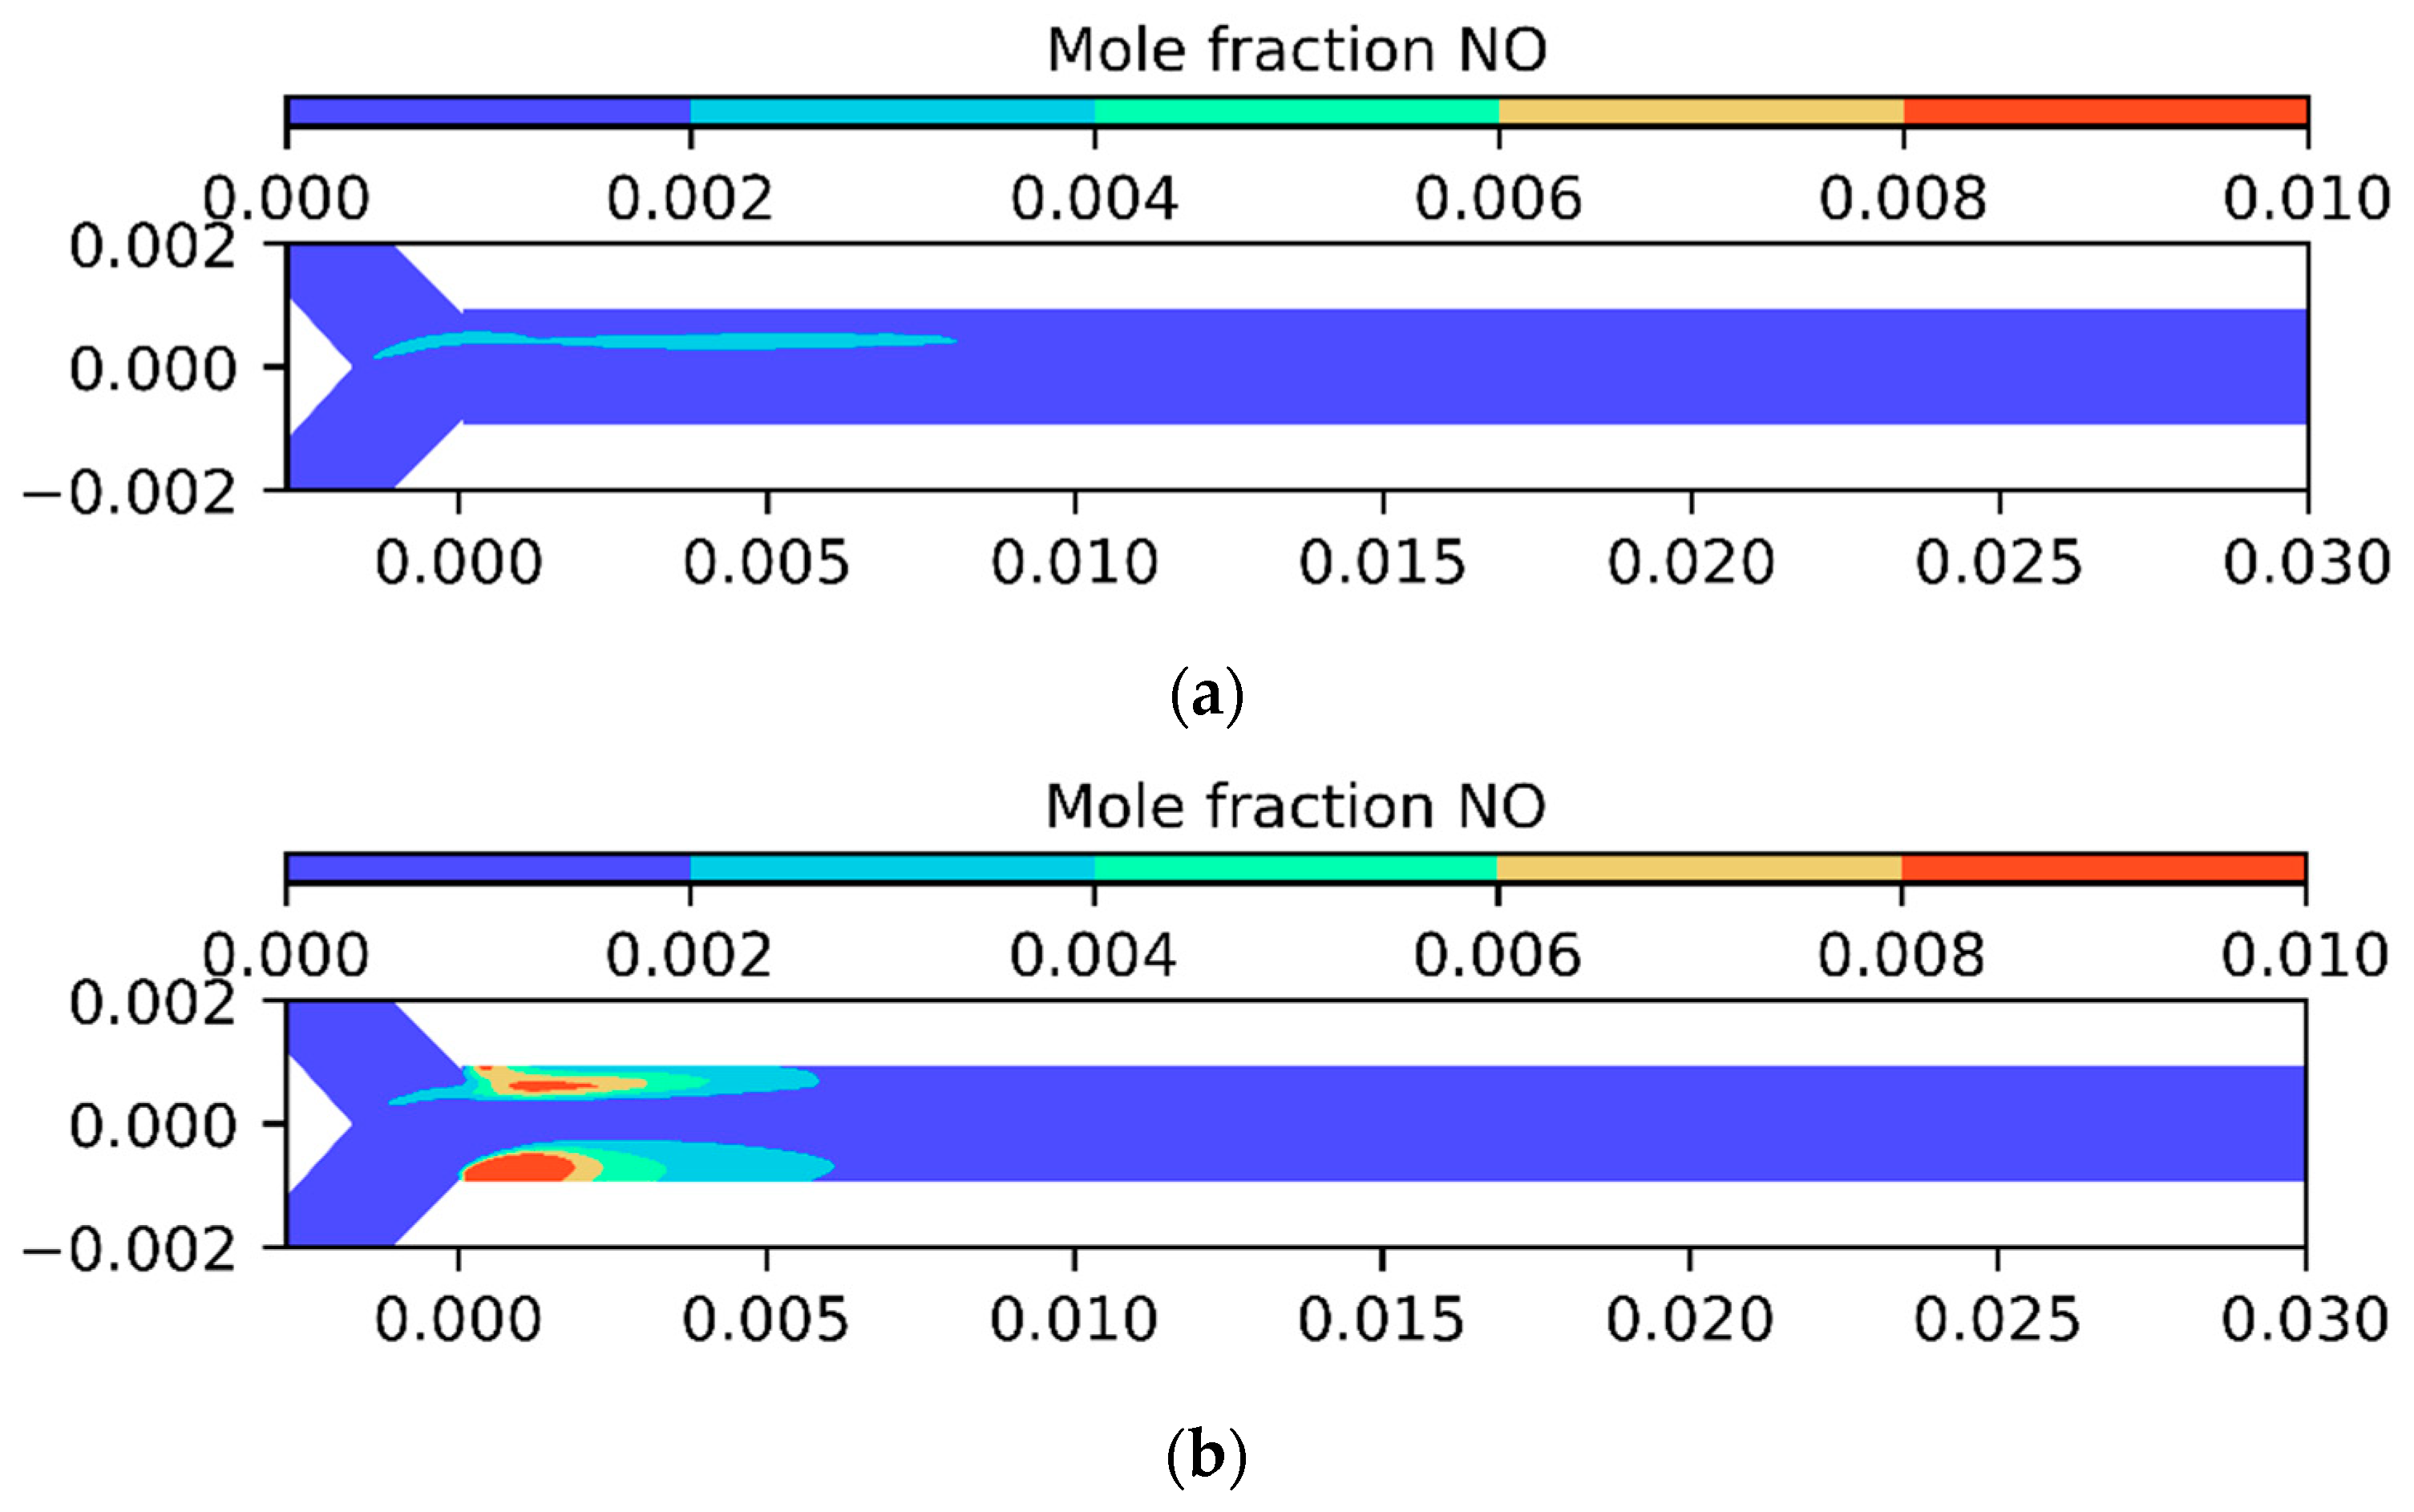
As expected, the distribution of the OH radical closely mirrors the temperature distribution within the domain, as illustrated in Figure 13. This correlation indicates that regions with higher temperatures exhibit a higher concentration of OH radicals. When kinetic effects are employed, both OH and NO are distributed around the plasma region (Figure 14), underscoring the significant impact of kinetic dynamics from the plasma region to the flame area. In the kinetics case, the max OH mole fraction is 4.95 × 10⁻² while the max NO mole fraction is 3.11 × 10⁻². In the momentum/energy case, max OH is 7.25 × 10⁻³ while max NO is 3.66 × 10⁻³.
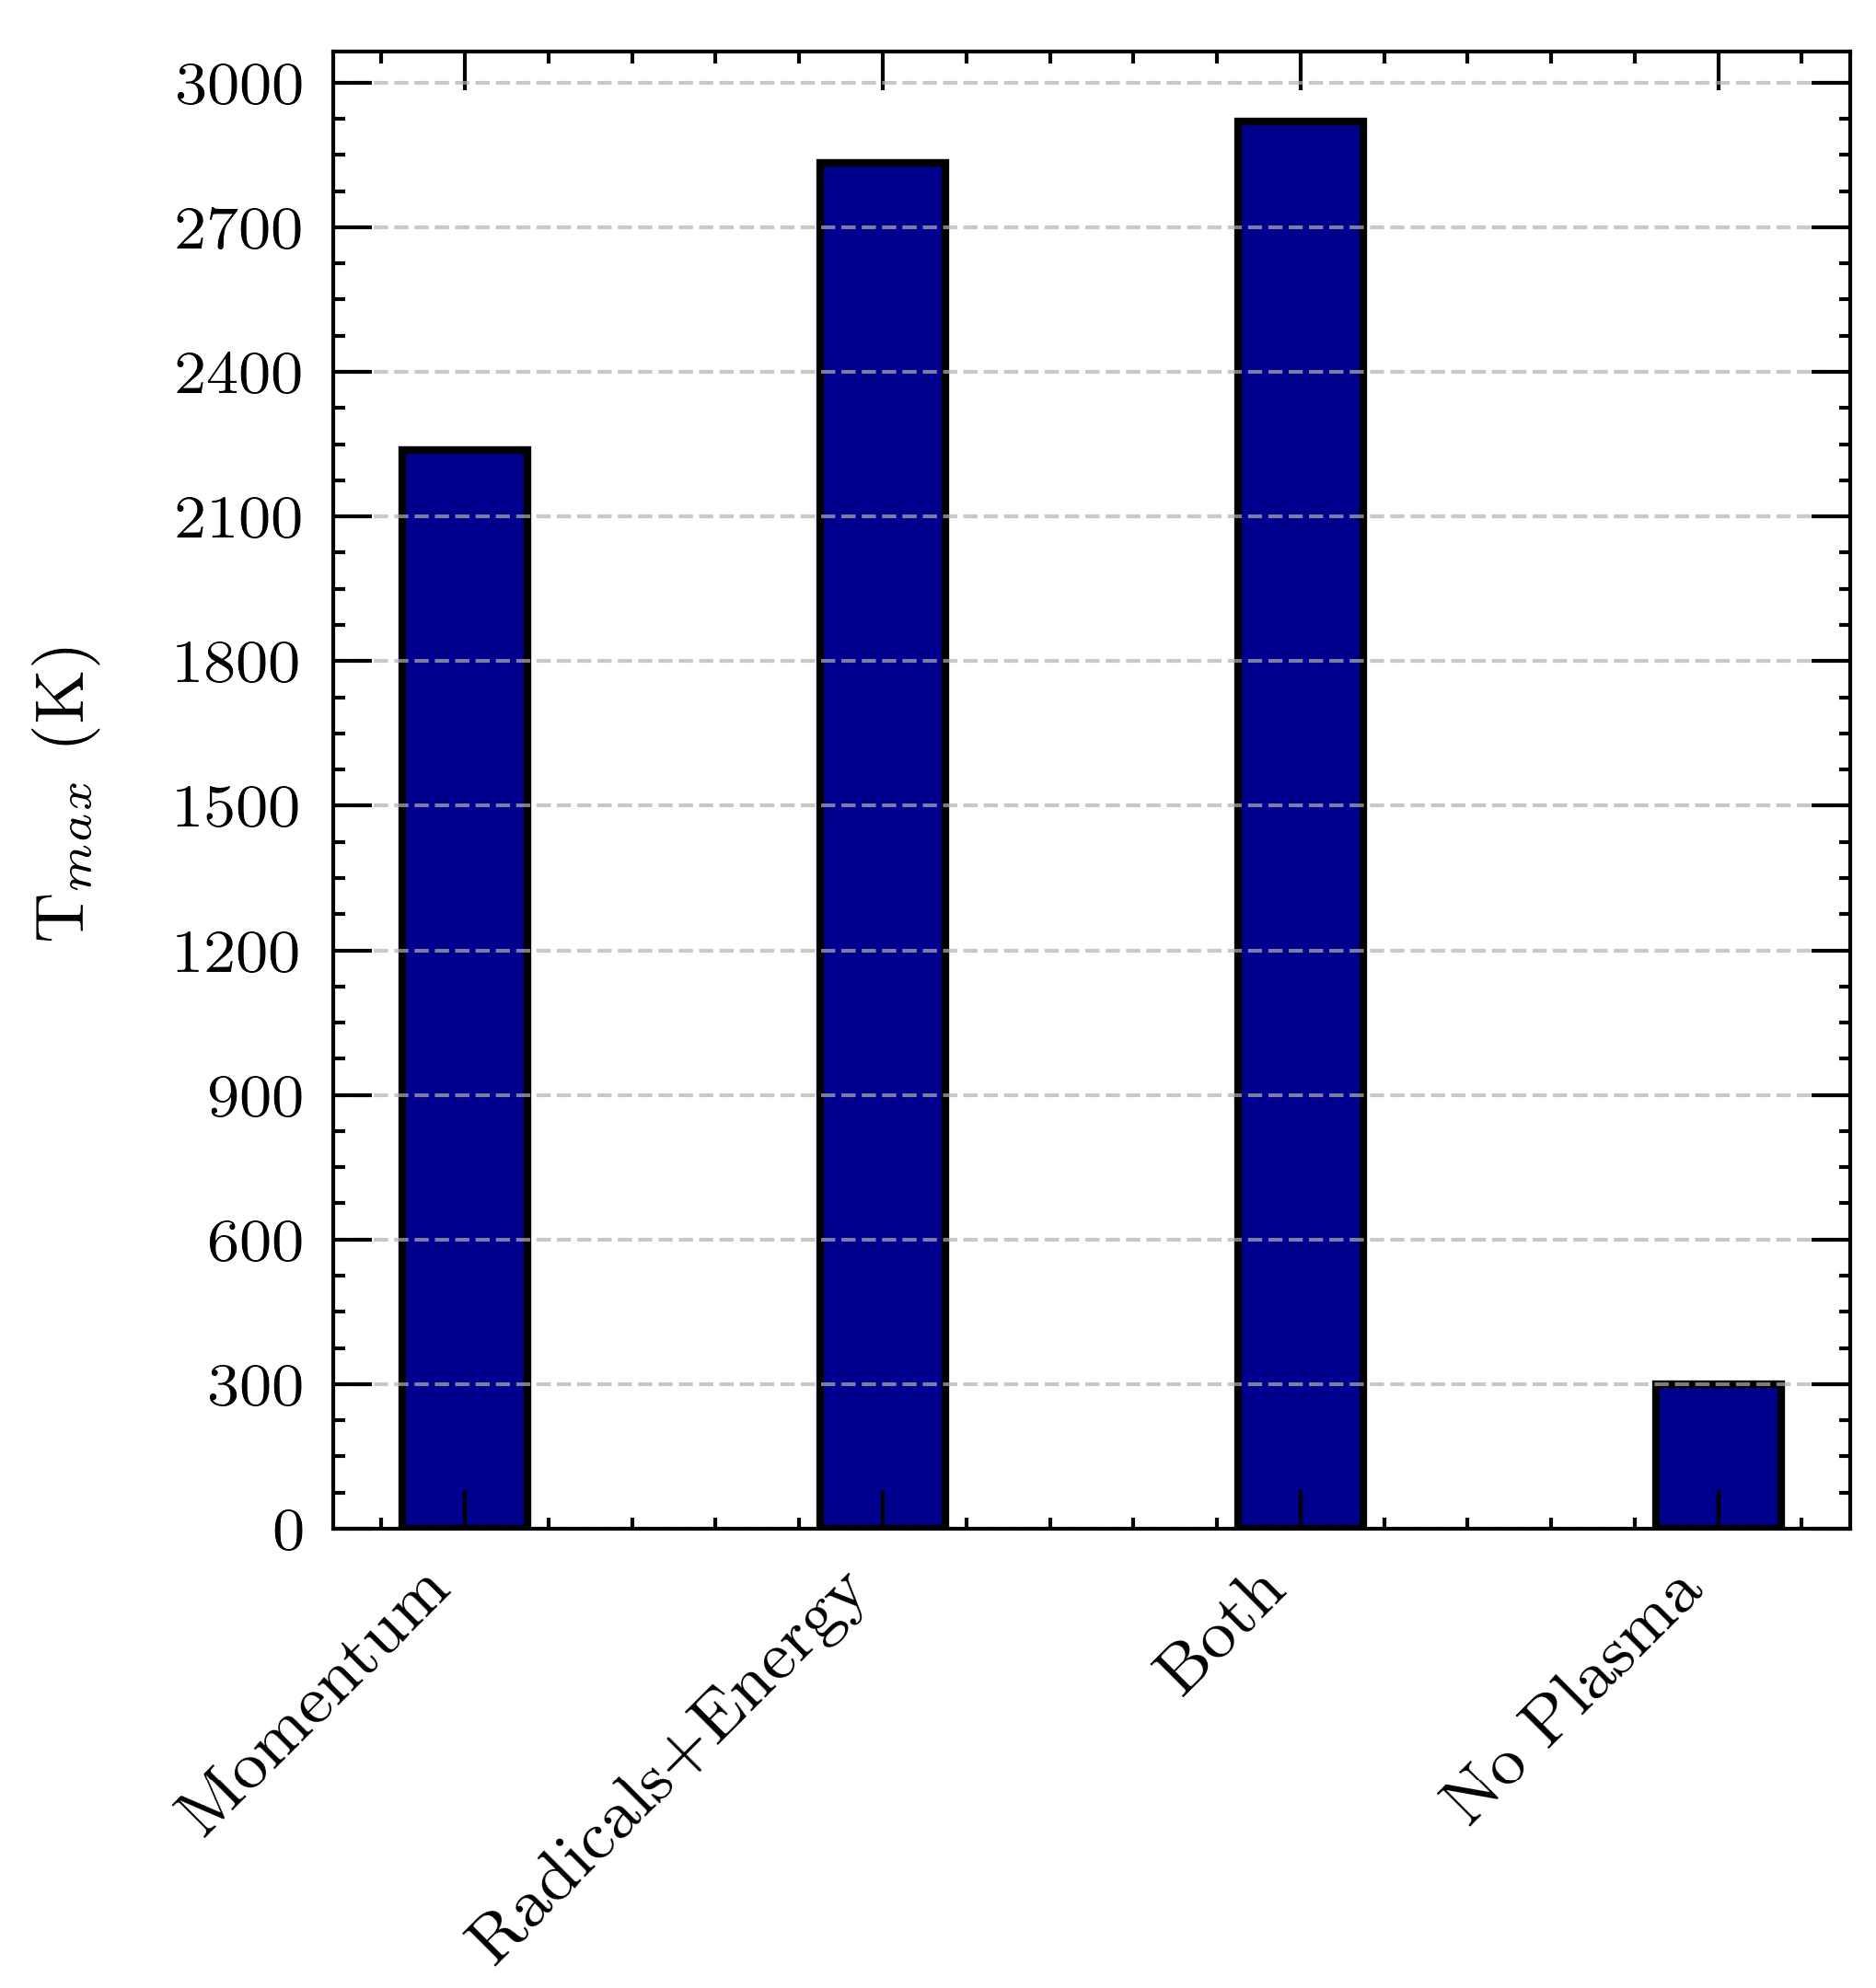
Therefore, we can conclude that both effects are important in sustaining a stable flame. In Figure 15, the maximum temperature reached in these cases is described by adding the test case simulation with complete PAC modeling. For kinetic and joule heating contribution, the max temperature was equal to 2238 K. With plasma actuation and the radical effects in play, the temperature reaches 2832. When complete plasma actuation is modeled, the temperature increases further to 2918.45 K. In contrast, without plasma actuation, the temperature is 300 K. This baseline temperature reflects the ambient conditions and the absence of any combustion-enhancing effects provided by plasma actuation. Plasma electrons and reactive species accelerate the rate of chemical reactions, far surpassing what can be achieved through momentum and energy contributions alone. Specifically, plasma-generated radicals play a crucial role in reducing the activation energy for combustion reactions, facilitating faster reaction kinetics. This leads to more efficient fuel breakdown and enhanced oxidation processes. The non-thermal nature of DBD plasma ensures that most electrical energy is used to generate and sustain high-energy electrons and reactive species rather than merely heating the gas. The predominance of kinetic effects over momentum and energy effects can be attributed to several factors related to the scale and nature of the microactuator system. Within the plasma volume, the momentum and thermal effects are of the order of 106 N and 109 W per m3, respectively. Given that microactuators have dimensions of approximately 200 μm by 50 μm, these effects are significantly reduced within the confined space of the plasma. In summary, the dominance of kinetic effects in our study is a direct consequence of the small scale of the microactuator and the critical role of kinetic processes in the ignition phase of plasma-assisted hydrogen air combustion.
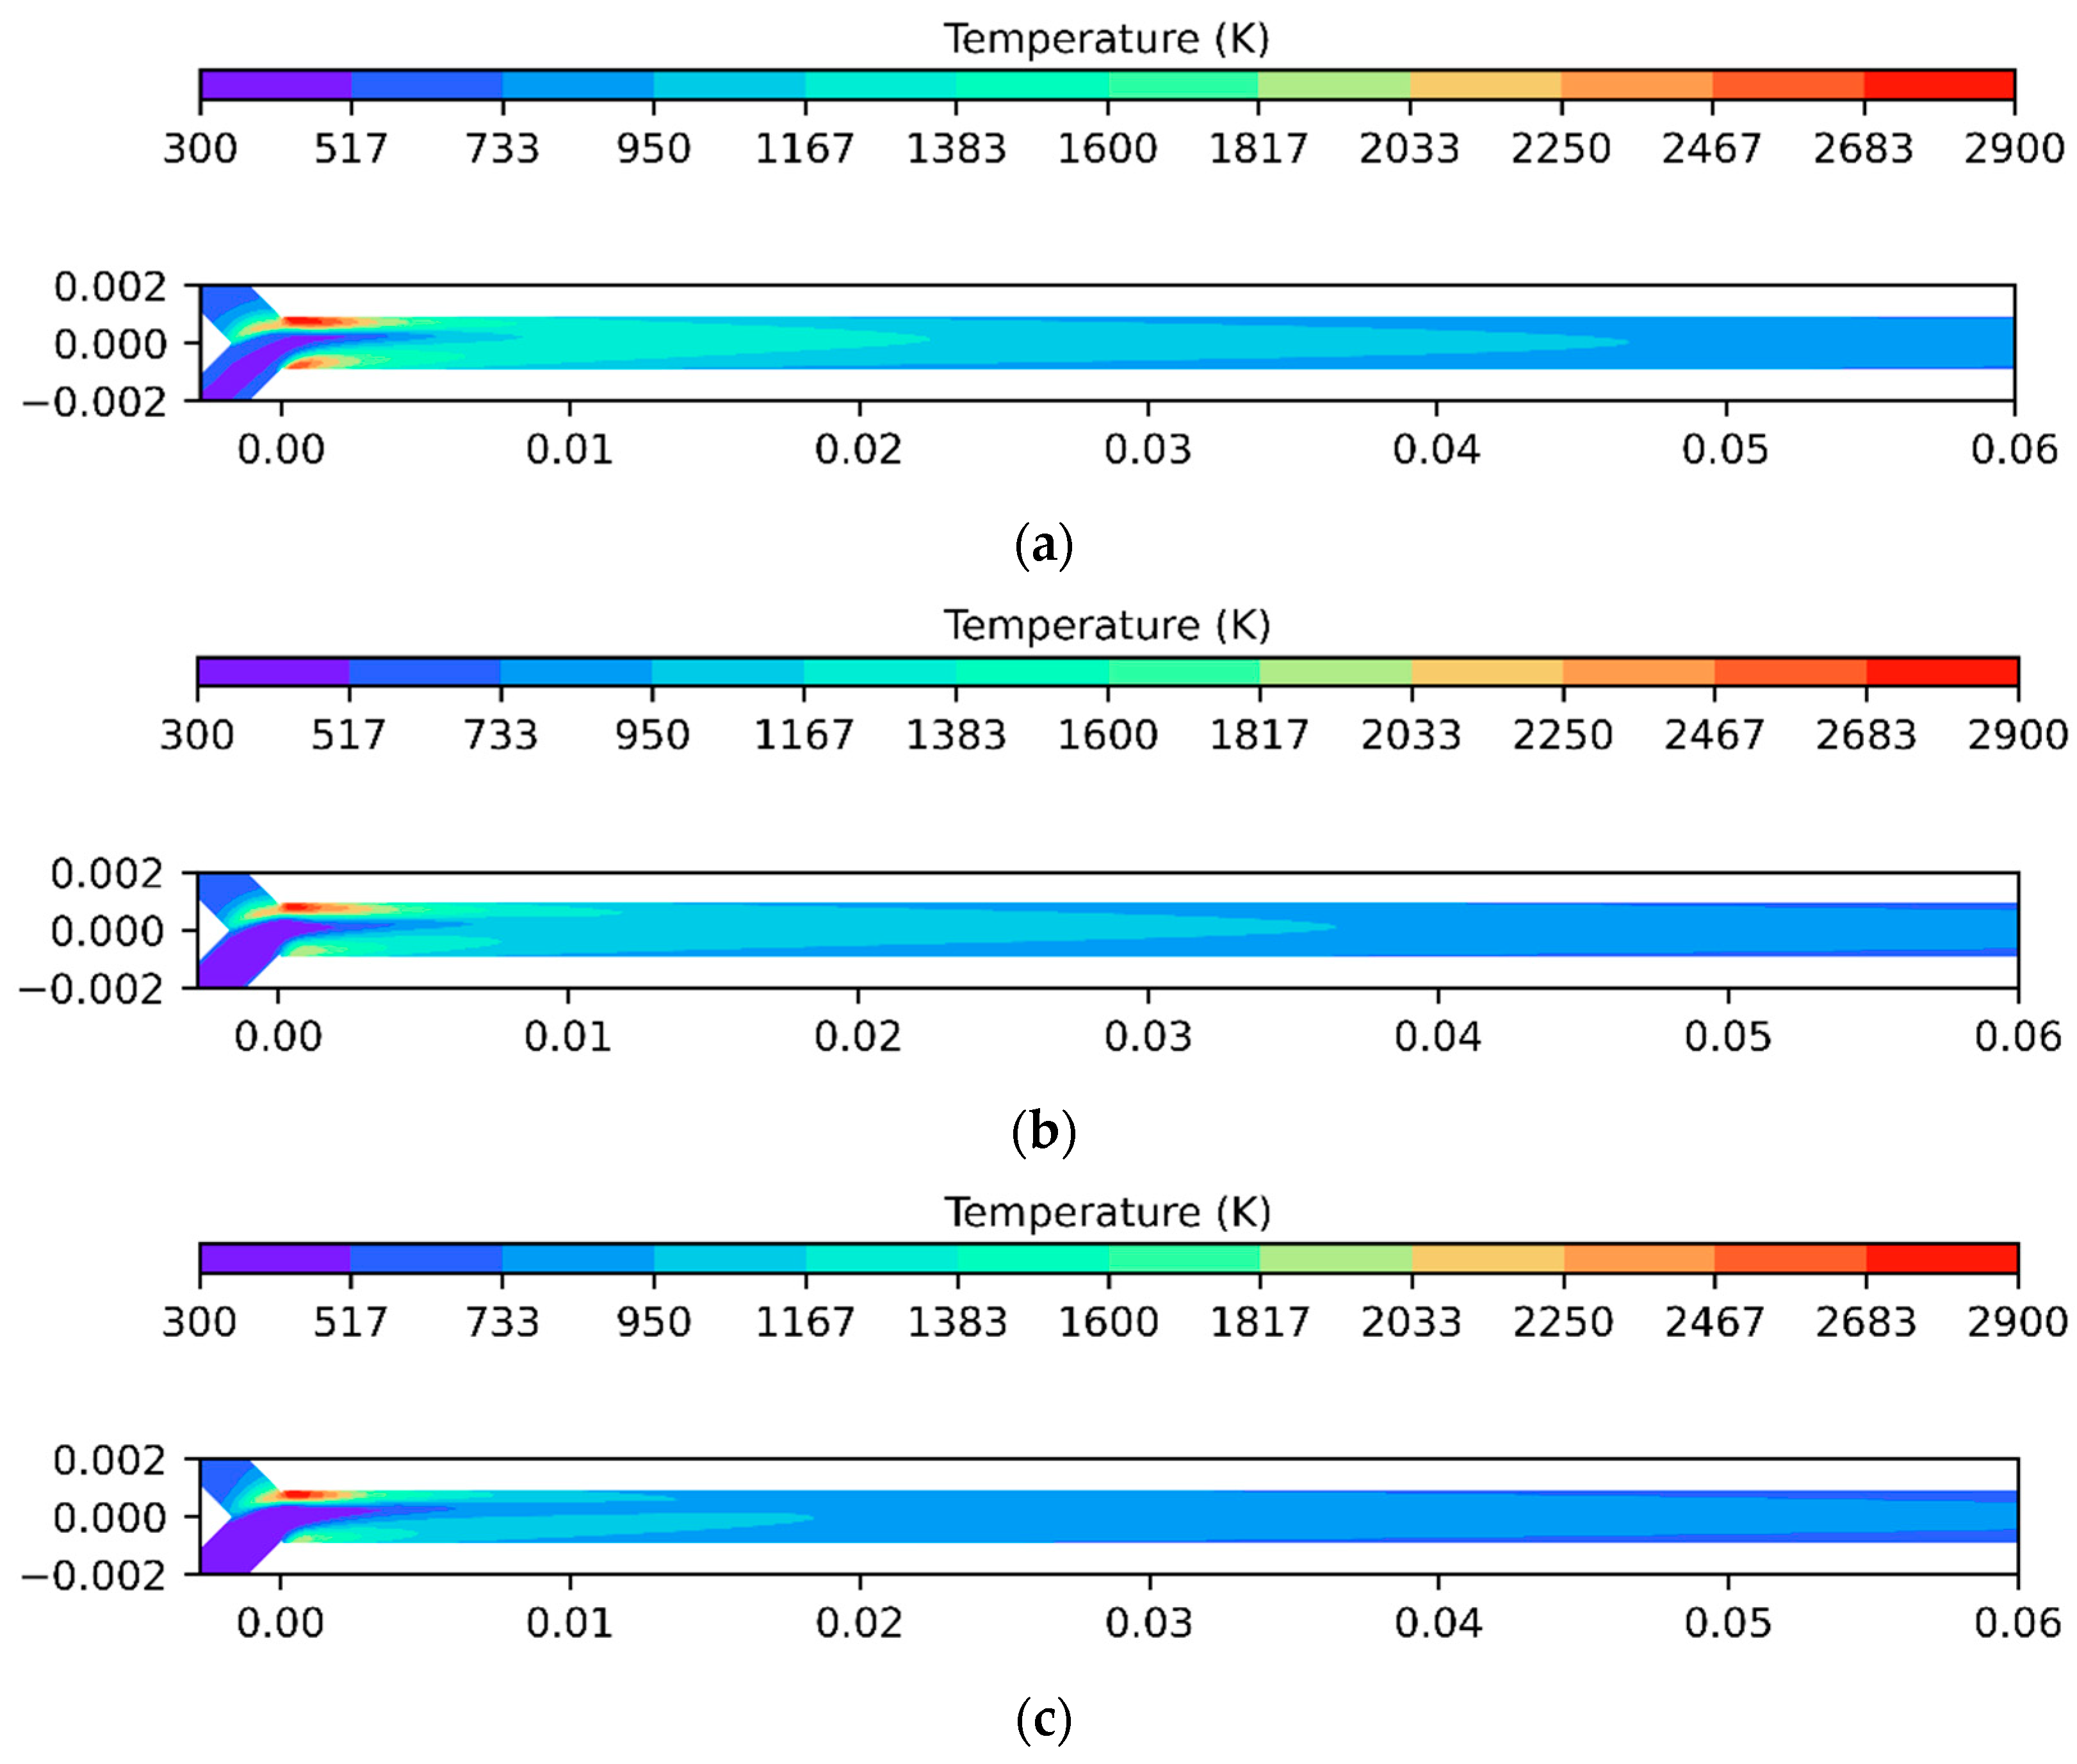
Considering the full model, additional cases at v 6 m/s and lower Φ were examined to determine the impact of the discharge and lower concentrations of H2. As can be observed, the area around the fuel electrode consistently remains at a very high temperature of around 2900 K with negligible differences. What decreases with the reduction in supplied thermal power is the length of the flame region and the extent of the hot fluid. In Figure 16, the flame regions at Φ of 0.1, 0.3, and 0.5 are considered. Although all three cases show a hot area in the plasma regions, in the case of Φ = 0.1, outside the plasma region, the fluid is cold, indicating that the blow-off limit may have been reached. Furthermore, the fluid exceeds 1167 K at different heights. In the case of Φ = 0.5, the temperature remains above 1167 K up to 4.7 cm, while in the second case, it reaches up to 3.6 cm. In the last case, the limit is above 2 cm.

6. Conclusions

This paper explores the development of an advanced multiscale modeling framework for simulating DBD plasma actuators within a Y-shape microcombustor to enhance combustion processes. The framework integrates a plasma kinetic/transport model with CFD simulation. The proposed plasma kinetic model estimates the transport, heating effect, and species mole fractions produced, which are subsequently applied as a source in the steady-state CFD model in function of the local equivalence ratio. The key conclusions are as follows:
  • The influence of plasma is impactful, maintaining a stationary flame in the duct.
  • The PAC model enhanced the reliability in non-premixed conditions considering the local plasma region.
  • The results highlighted the fundamental role of kinetic effects, which cannot be neglected. This underscores the novelty of our approach compared to the PAC steady-state methods in the literature, which only consider momentum and energy effects in CFD models. The effect of plasma is also significant at very low equivalence ratios, such as 0.1.
  • Additional experimental investigations are required to ensure comprehensive validation of the proposed model. Moreover, further studies on PIC are necessary for the function of the local concentration, providing a more comprehensive evaluation of the model’s effectiveness.

Author Contributions

Conceptualization, G.C. and M.G.D.G.; methodology, G.C. and M.G.D.G.; software, G.C., M.G.D.G. and G.M.; validation, G.C., M.G.D.G. and G.M.; formal analysis, G.C. and M.G.D.G.; investigation, G.C., M.G.D.G. and G.M.; data curation. G.C. and M.G.D.G.; writing—original draft preparation, writing—review and editing, G.C., M.G.D.G. and G.M.; supervision, M.G.D.G.; project administration, M.G.D.G.; funding acquisition, M.G.D.G. All authors have read and agreed to the published version of the manuscript.

Funding

The work was supported and funded by Project MOST Research Project: Sustainable Mobility Center (Centro Nazionale per la Mobilità Sostenibile—CNMS) CUP progetto: F83C22000720001; Codice del progetto:CN00000023. It was also supported by project RIPARTI (RIcerca Per riPARTIre con le Imprese). POC PUGLIA FESR-fse 2014/2020.

Data Availability Statement

The data presented in this study are available on request from the corresponding authors.

Conflicts of Interest

The authors declare no conflicts of interest.

References

  1. Abdelbasir, S.M.; El-Sheltawy, C.T.; Abdo, D.M. Green Processes for Electronic Waste Recycling: A Review. J. Sustain. Metall. 2018, 4, 295–311. [Google Scholar] [CrossRef]
  2. Kaisare, N.S.; Vlachos, D.G. A review on microcombustion: Fundamentals, devices and applications. Prog. Energy Combust. Sci. 2012, 38, 321–359. [Google Scholar] [CrossRef]
  3. E, J.; Ding, J.; Chen, J.; Liao, G.; Zhang, F.; Luo, B. Process in micro-combustion and energy conversion of micro power system: A review. Energy Convers. Manag. 2021, 246, 114664. [Google Scholar] [CrossRef]
  4. Fu, L.; Feng, Z.; Li, G. Experimental investigation on overall performance of a millimeter-scale radial turbine for micro gas turbine. Energy 2017, 134, 1–9. [Google Scholar] [CrossRef]
  5. Giorgi, M.G.D.; Cinieri, G.; Marseglia, G.; Shah, Z.A.; Mehdi, G. Combustion Efficiency of Carbon-neutral Fuel using Micro-Combustor Designed for Aerospace Applications. J. Phys. Conf. Ser. 2024, 2716, 012091. [Google Scholar] [CrossRef]
  6. Fernandez-Pello, A.C. Micropower generation using combustion: Issues and approaches. Proc. Combust. Inst. 2002, 29, 883–899. [Google Scholar] [CrossRef]
  7. Walther, D.C.; Ahn, J. Advances and challenges in the development of power-generation systems at small scales. Prog. Energy Combust. Sci. 2011, 37, 583–610. [Google Scholar] [CrossRef]
  8. Bieri, J.A.; Matalon, M. Edge flames stabilized in a non-premixed microcombustor. Combust. Theory Model. 2011, 15, 911–932. [Google Scholar] [CrossRef]
  9. Nauman, M.; Pan, J.; Wang, Y.; Li, F.; Oluwaleke Ojo, A.; Raza, A. A review of recent advancements in micro combustion techniques to enhance flame stability and fuel residence time. Int. J. Hydrogen Energy 2024, 49, 1165–1193. [Google Scholar] [CrossRef]
  10. Peng, Q.; Yang, W.; E, J.; Xu, H.; Li, Z.; Yu, W.; Tu, Y.; Wu, Y. Experimental investigation on premixed hydrogen/air combustion in varied size combustors inserted with porous medium for thermophotovoltaic system applications. Energy Convers. Manag. 2019, 200, 112086. [Google Scholar] [CrossRef]
  11. Bani, S.; Pan, J.; Tang, A.; Lu, Q.; Zhang, Y. Micro combustion in a porous media for thermophotovoltaic power generation. Appl. Therm. Eng. 2018, 129, 596–605. [Google Scholar] [CrossRef]
  12. Rahbari, A.; Homayoonfar, S.; Valizadeh, E.; Aligoodarz, M.R.; Toghraie, D. Effects of micro-combustor geometry and size on the heat transfer and combustion characteristics of premixed hydrogen/air flames. Energy 2021, 215, 119061. [Google Scholar] [CrossRef]
  13. Qian, P.; Liu, M.; Li, X.; Xie, F.; Huang, Z.; Luo, C.; Zhu, X. Effects of bluff-body on the thermal performance of micro thermophotovoltaic system based on porous media combustion. Appl. Therm. Eng. 2020, 174, 115281. [Google Scholar] [CrossRef]
  14. Mehdi, G.; Bonuso, S.; De Giorgi, M.G. Plasma Assisted Re-Ignition of Aeroengines under High Altitude Conditions. Aerospace 2022, 9, 66. [Google Scholar] [CrossRef]
  15. Mehdi, G.; Fontanarosa, D.; Bonuso, S.; Giorgi, M.G.D. Ignition thresholds and flame propagation of methane-air mixture: Detailed kinetic study coupled with electrical measurements of the nanosecond repetitively pulsed plasma discharges. J. Phys. D Appl. Phys. 2022, 55, 315202. [Google Scholar] [CrossRef]
  16. Lacoste, D.A. Flames with plasmas. Proc. Combust. Inst. 2023, 39, 5405–5428. [Google Scholar] [CrossRef]
  17. Deng, J.; Wang, P.; Sun, Y.; Zhou, J.; Luo, Y.; He, D. Design and experimental investigation of a dual swirl combined DBD plasma combustor head actuator. Sens. Actuators A Phys. 2022, 344, 113707. [Google Scholar] [CrossRef]
  18. De Giorgi, M.G.; Ficarella, A.; Marra, F.; Pescini, E. Micro DBD plasma actuators for flow separation control on a low pressure turbine at high altitude flight operating conditions of aircraft engines. Appl. Therm. Eng. 2017, 114, 511–522. [Google Scholar] [CrossRef]
  19. Li, G.; Jiang, X.; Zhu, J.; Yang, J.; Liu, C.; Mu, Y.; Xu, G. Combustion control using a lobed swirl injector and a plasma swirler. Appl. Therm. Eng. 2019, 152, 92–102. [Google Scholar] [CrossRef]
  20. Feng, R.; Huang, Y.; Zhu, J.; Wang, Z.; Sun, M.; Wang, H.; Cai, Z. Ignition and combustion enhancement in a cavity-based supersonic combustor by a multi-channel gliding arc plasma. Exp. Therm. Fluid Sci. 2021, 120, 110248. [Google Scholar] [CrossRef]
  21. Zhao, Q.; Mao, B.; Bai, X.; Zhao, J.; Chen, C.; Zhang, X.; Wei, S.; Gao, Q. Experimental investigation of the discharge and thermal characteristics of an alternating current dielectric-barrier discharge plasma reactor. Appl. Therm. Eng. 2022, 217, 119276. [Google Scholar] [CrossRef]
  22. De Giorgi, M.G.; Traficante, S.; Ficarella, A. Performance Improvement of Turbomachinery Using Plasma Actuators. In Proceedings of the Volume 7: Turbomachinery, Parts A, B, and C; ASMEDC: Vancouver, BC, Canada, 2011; pp. 369–380. [Google Scholar]
  23. De Giorgi, M.G.; Pescini, E.; Marra, F.; Ficarella, A. Plasma actuator scaling down to improve its energy conversion efficiency for active flow control in modern turbojet engines compressors. Appl. Therm. Eng. 2016, 106, 334–350. [Google Scholar] [CrossRef]
  24. De Giorgi, M.G.; Motta, V.; Suma, A. Influence of actuation parameters of multi-DBD plasma actuators on the static and dynamic behaviour of an airfoil in unsteady flow. Aerosp. Sci. Technol. 2020, 96, 105587. [Google Scholar] [CrossRef]
  25. Pescini, E.; Marra, F.; De Giorgi, M.G.; Francioso, L.; Ficarella, A. Investigation of the boundary layer characteristics for assessing the DBD plasma actuator control of the separated flow at low Reynolds numbers. Exp. Therm. Fluid Sci. 2017, 81, 482–498. [Google Scholar] [CrossRef]
  26. Dou, S.; Tao, L.; Wang, R.; El Hankari, S.; Chen, R.; Wang, S. Plasma-Assisted Synthesis and Surface Modification of Electrode Materials for Renewable Energy. Adv. Mater. 2018, 30, 1705850. [Google Scholar] [CrossRef]
  27. Rodrigues, F.; Pascoa, J.; Trancossi, M. Heat generation mechanisms of DBD plasma actuators. Exp. Therm. Fluid Sci. 2018, 90, 55–65. [Google Scholar] [CrossRef]
  28. Ju, Y.; Sun, W. Plasma assisted combustion: Dynamics and chemistry. Prog. Energy Combust. Sci. 2015, 48, 21–83. [Google Scholar] [CrossRef]
  29. Plasma-Assisted Ignition and Combustion—ScienceDirect. Available online: https://www.sciencedirect.com/science/article/pii/S0360128512000354 (accessed on 29 July 2024).
  30. Plasma Supported Combustion—ScienceDirect. Available online: https://www.sciencedirect.com/science/article/pii/S0082078404003285 (accessed on 29 July 2024).
  31. A Review of Recent Studies and Emerging Trends in Plasma-Assisted Combustion of Ammonia as an Effective Hydrogen Carrier—ScienceDirect. Available online: https://www.sciencedirect.com/science/article/pii/S0360319923025909 (accessed on 29 July 2024).
  32. Feng, R.; Zhu, J.; Wang, Z.; Zhang, F.; Ban, Y.; Zhao, G.; Tian, Y.; Wang, C.; Wang, H.; Cai, Z.; et al. Suppression of combustion mode transitions in a hydrogen-fueled scramjet combustor by a multi-channel gliding arc plasma. Combust. Flame 2022, 237, 111843. [Google Scholar] [CrossRef]
  33. Li, Q.; Zhu, J.; Tian, Y.; Sun, M.; Wan, M.; Yan, B.; Luo, T.; Sun, Y.; Wang, C.; Tang, T.; et al. Investigation of ignition and flame propagation in an axisymmetric supersonic combustor with laser-induced plasma. Phys. Fluids 2023, 35, 125133. [Google Scholar] [CrossRef]
  34. Tian, Y.; Zhu, J.; Sun, M.; Wang, H.; Huang, Y.; Feng, R.; Yan, B.; Sun, Y.; Cai, Z. Enhancement of blowout limit in a Mach 2.92 cavity-based scramjet combustor by a gliding arc discharge. Proc. Combust. Inst. 2023, 39, 5697–5705. [Google Scholar] [CrossRef]
  35. Patel, R.; Peelen, R.; van Oijen, J.; Dam, N.; Nijdam, S. How pulse energy affects ignition efficiency of DBD plasma-assisted combustion. J. Phys. D Appl. Phys. 2023, 57, 025501. [Google Scholar] [CrossRef]
  36. Ignition of Ethylene–Air and Methane–Air Flows by Low-Temperature Repetitively Pulsed Nanosecond Discharge Plasma | IEEE Journals & Magazine | IEEE Xplore. Available online: https://ieeexplore.ieee.org/document/4392533 (accessed on 29 July 2024).
  37. Pavan, C.A. Nanosecond Pulsed Plasmas in Dynamic Combustion Environments. Ph.D. Thesis, Massachusetts Institute of Technology, Cambridge, MA, USA, 2023. [Google Scholar]
  38. Hazenberg, T.; Janssen, J.F.J.; van Dijk, J.; van Oijen, J.A. Consistent thermodynamics for plasma-assisted combustion. Proc. Combust. Inst. 2023, 39, 5541–5549. [Google Scholar] [CrossRef]
  39. Rekkas-Ventiris, G.; Duarte Gomez, A.; Deak, N.; Kincaid, N.; Pepiot, P.; Bisetti, F.; Bellemans, A. A novel machine learning based lumping approach for the reduction of large kinetic mechanisms for plasma-assisted combustion applications. Combust. Flame 2024, 260, 113252. [Google Scholar] [CrossRef]
  40. Shahsavari, M.; Konnov, A.A.; Bai, X.-S.; Valera-Medina, A.; Li, T.; Jangi, M. Synergistic effects of nanosecond plasma discharge and hydrogen on ammonia combustion. Fuel 2023, 348, 128475. [Google Scholar] [CrossRef]
  41. Mackay, K.K.; Johnson, H.T.; Freund, J.B. Field-emission plasma enhancement of H2–O2 micro-combustion. Plasma Sources Sci. Technol. 2020, 29, 045014. [Google Scholar] [CrossRef]
  42. Shivkumar, G.; Tholeti, S.S.; Alexeenko, A.A. Microchannel Flow Enhancement by Microplasma Actuation. In Proceedings of the ASME 2015 13th International Conference on Nanochannels, Microchannels, and Minichannels Collocated with the ASME 2015 International Technical Conference and Exhibition on Packaging and Integration of Electronic and Photonic Microsystems, American Society of Mechanical Engineers Digital Collection, San Francisco, CA, USA, 6–9 July 2015. [Google Scholar]
  43. Alexeenko, A.A.; Strongrich, A.D.; Cofer, A.G.; Pikus, A.; Sebastiao, I.B.; Tholeti, S.S.; Shivkumar, G. Microdevices enabled by rarefied flow phenomena. AIP Conf. Proc. 2016, 1786, 080001. [Google Scholar] [CrossRef]
  44. Xiang, Y.; Wang, S.; Yuan, Z.; Fan, A. Effects of channel length on propagation behaviors of non-premixed H2-air flames in Y-shaped micro combustors. Int. J. Hydrogen Energy 2020, 45, 20449–20457. [Google Scholar] [CrossRef]
  45. Xiang, Y.; Yuan, Z.; Wang, S.; Fan, A. Effects of flow rate and fuel/air ratio on propagation behaviors of diffusion H2/air flames in a micro-combustor. Energy 2019, 179, 315–322. [Google Scholar] [CrossRef]
  46. Cinieri, G.; Fontanarosa, D.; De Giorgi, M.G. Combustion Characteristics of Hydrogen/Air Mixtures in a Plasma-Assisted Micro Combustor. Energies 2023, 16, 2272. [Google Scholar] [CrossRef]
  47. Cinieri, G.; Shah, Z.A.; Marseglia, G.; De Giorgi, M.G. Toward Zero Carbon Emissions: Investigating the Combustion Performance of Shaped Microcombustors Using H2/Air and NH3/Air Mixtures. Aerospace 2023, 11, 12. [Google Scholar] [CrossRef]
  48. Dawson, J.M. Particle simulation of plasmas. Rev. Mod. Phys. 1983, 55, 403–447. [Google Scholar] [CrossRef]
  49. Hockney, R.W.; Eastwood, J.W. Computer Simulation Using Particles; CRC Press: Boca Raton, FL, USA, 2021; ISBN 978-0-367-80693-4. [Google Scholar]
  50. The Plasma Theory and Simulation Group. Available online: https://ptsg.egr.msu.edu/ (accessed on 17 July 2023).
  51. Pancheshnyi, S.; Eismann, B.; Hagelaar, G.; Pitchford, L.C. ZDPlasKin: A new tool for plasmachemical simulations. In Proceedings of the APS Meetings: 61st Annual Gaseous Electronics Conference, Dallas, TX, USA, 13–17 October 2008. [Google Scholar]
  52. Orlov, D.; Apker, T.; He, C.; Othman, H.; Corke, T. Modeling and Experiment of Leading Edge Separation Control Using SDBD Plasma Actuators. In Proceedings of the 45th AIAA Aerospace Sciences Meeting and Exhibit, Reno, NV, USA, 8–11 January 2007. [Google Scholar] [CrossRef]
  53. Ansys|Engineering Simulation Software. Available online: https://www.ansys.com/ (accessed on 20 July 2023).
  54. Burke, M.P.; Chen, Z.; Ju, Y.; Dryer, F.L. Effect of cylindrical confinement on the determination of laminar flame speeds using outwardly propagating flames. Combust. Flame 2009, 156, 771–779. [Google Scholar] [CrossRef]
  55. Pareja, J.; Burbano, H.J.; Ogami, Y. Measurements of the laminar burning velocity of hydrogen–air premixed flames. Int. J. Hydrogen Energy 2010, 35, 1812–1818. [Google Scholar] [CrossRef]
  56. Alekseev, V.A.; Christensen, M.; Konnov, A.A. The effect of temperature on the adiabatic burning velocities of diluted hydrogen flames: A kinetic study using an updated mechanism. Combust. Flame 2015, 162, 1884–1898. [Google Scholar] [CrossRef]
  57. Konnov, A.A. On the role of excited species in hydrogen combustion. Combust. Flame 2015, 162, 3755–3772. [Google Scholar] [CrossRef]
  58. Mao, X.; Chen, Q.; Rousso, A.C.; Chen, T.Y.; Ju, Y. Effects of controlled non-equilibrium excitation on H2/O2/He ignition using a hybrid repetitive nanosecond and DC discharge. Combust. Flame 2019, 206, 522–535. [Google Scholar] [CrossRef]
Figure 1. General scheme of the FE-DBD offset planar actuator.
Aerospace 11 00697 g001
Figure 2. Schematic representation of the computation sequence for the PIC-MCC method.
Aerospace 11 00697 g002
Figure 3. Equivalent lumped electrical circuit schematic of the plasma actuator.
Aerospace 11 00697 g003
Figure 4. Main stages of the proposed method.
Aerospace 11 00697 g004
Figure 5. LBV for the hydrogen–air mixture for T = 300 K and p = 1 atm vs. experimental data and prior kinetic models [54,55,56,57].
Aerospace 11 00697 g005
Figure 6. (a) Temperature midline flame area for three different grid sizes; (b) flame length comparison between numerical studies and experimental data [44] at different Φ.
Aerospace 11 00697 g006
Figure 7. Applied EN for each pulse.
Aerospace 11 00697 g007
Figure 8. Water vapor concentration comparison between numerical and experimental results [58].
Aerospace 11 00697 g008
Figure 9. (a) Mean electron particle density in the plasma region; (b) mean body force in the plasma region between cycles 20 and 28.
Aerospace 11 00697 g009
Figure 10. p = 1 atm Temperature = 300 K conditions, (a) log scale mass fractions for different Φ at Vptp = 325 V p = 1 atm Temperature = 300 K, (b) mass fraction for different Vptp Φ = 1.
Aerospace 11 00697 g010
Figure 11. Sketch of the mixing and flame area.
Aerospace 11 00697 g011
Figure 12. Temperature contour v = 6 m/s Φ = 0.5 (a) kinetic effect, (b) momentum and energy effect.
Aerospace 11 00697 g012
Figure 13. OH concentration contour v = 6 m/s Φ = 0.5 of (a) plasma kinetic effect and (b) momentum and energy plasma effect.
Aerospace 11 00697 g013
Figure 14. NO concentration contour v = 6 m/s Φ = 0.5 of (a) kinetic effect and (b) momentum and energy effect.
Aerospace 11 00697 g014
Figure 15. Maximum temperature in the symmetry plane for different plasma effects under the conditions of v = 6 m/s and ϕ = 0.5.
Aerospace 11 00697 g015
Figure 16. Plasma-assisted combustion temperature symmetry plane for v = 6 m/s at different equivalence ratios of (a) Φ = 0.5, (b) Φ = 0.3, and (c) Φ = 0.1.
Aerospace 11 00697 g016
Table 1. Geometric features of the microcombustor.
Geometric FeaturesTest Case Geometric Parameters [m]
Streamwise Electrodes gap4 × 10−6
Electrodes Thickness1 × 10−6
Dielectric thickness1.2 × 10−5
Electrodes length1 × 10−4
Electrodes width1.57 × 10−3
Frequency1 GHz
Amplitude162.5 V
Table 2. Fowler–Nordheim coefficients.
Fowler-Nordheim Equation Constants
AFN1.54 × 10−6
βFN50.0
CvFN0
BvFN6.8308 × 109
CyFN3.79 × 10−5
φVFN4.0
Table 3. Main elements, charged particles, and excited species.
Species TypeMolecules
ElementsN, H, O
Charged particlesN+ N2+ N3+ N4+ O+ O2+ O4+ O O2 O3 O4 NO+ N2O+ NO N2O NO2 NO3 O2+ E H+ H2+
Excited speciesO2(V1), O2(V2), O2(V3), O2(V4), O2(A1), O2(B1), O2(4.5EV), N2(V1), N2(V2), N2(V3), N2(V4), OH*
Table 4. Mean flow composition for cycles.
Chemical SpeciesMolar Fraction
H2.67 × 10−1
H22.29 × 10−8
O1.31 × 10−1
O21.01 × 10−4
OH7.19 × 10−6
H2O1.24 × 10−10
HO23.61 × 10−5
H2O24.13 × 10−19
HE6.01 × 10−1
O21.31 × 10−3
Table 5. Mean electron and ion density obtained for 325 V and 1 GHz.
Hazenberg et al. [38]Our Analysis Values [particles/m3]
Max ions density3.6 × 10206.0 × 1019
Average ions density1.40 × 10181.41 × 1018
Max electrons density2.0 × 10196.0 × 1019
Disclaimer/Publisher’s Note: The statements, opinions and data contained in all publications are solely those of the individual author(s) and contributor(s) and not of MDPI and/or the editor(s). MDPI and/or the editor(s) disclaim responsibility for any injury to people or property resulting from any ideas, methods, instructions or products referred to in the content.