1. Introduction
Magnesium is the lightest common structural metal currently available in the world, with a density of 1.74 g/cm3 in its solid state. The mechanical and physical properties of magnesium alloys make them suitable for engineers in the design of lightweight components and structures.
Magnesium could be an ideal choice in lightweight designs where aluminium alloys have traditionally been used; for example, in the design of aircraft seat components.
However, the perceived easy ignition and flammability of magnesium alloys create a detrimental safety feature and, therefore, the Society of Automotive Engineers (SAE), which develops standards for both the automotive and aviation industries, has banned the use of magnesium alloys in aircraft seat construction.
On 14 August 2015, an SAE AS8049 Revision C was published, in which a key statement that had previously read “Magnesium alloys shall not be used” was changed to this new wording: “Magnesium alloys may be used in aircraft seat construction provided they are tested to and meet the flammability performance requirements in the FAA Fire Safety Branch document: Aircraft Materials Fire Test Handbook—DOT/FAA/AR-00/12, Chapter 25, Oil Burner Flammability Test for Magnesium Alloy Seat Structure.”, ref. [
1].
As there are many areas in an aircraft seat where moderate tensile strength in conjunction with moderate ductility constitute best practice, magnesium should have a chance of being introduced into the aircraft seat business. The aircraft seat industry is ready to receive clearance for take-off and landing with magnesium alloys.
Static, dynamic, and flammability criteria restrict the design of aeroplane seats, although weight reduction also has an impact. As a result, this study hopes to employ more lightweight materials while maintaining certification standards [
2].
Elektron® 43 (WE43C in the ASTM standards definition) is a wrought magnesium alloy that is lightweight when compared to metal alloys for engineering uses (such as aluminium alloys) while having good mechanical properties; these features have piqued the interest of aeroplane seat makers.
Elektron® 43 is one of only two magnesium alloys that have previously met the flammability standards specified in DOT/FAA/AR-11/3.
During the airworthiness authority-regulated certification procedure, a seat’s design must fulfil both static and dynamic safety standards. The structural characteristics of the seat are crucial, especially during these tests.
Elektron
® 43’s high specific strength, ductility, fatigue strength, and low density make it an excellent candidate for the construction of lightweight and airworthy seats, where aluminium alloys such as AA2024-T351 have historically been employed,
Table 1.
Furthermore, the effect of different strain rate loads on the Elektron
® 43 response is that, as the strain rate increases, the material is subjected to hardening and to an increase in ductility, as is the case for tensile and compressive loads [
5]. These characteristics of the material lead an improvement of the structure response exhibited by Elektron
® 43 during dynamic applications, like dynamic testing for the certification of an aircraft seat (16 g) [
6].
This testing consists of a sled test to determine how the seat will perform in conditions like those experienced in a survivable crash or ‘heavy landing’; here, the seat components are subjected to very high peak loads—both in tension and compression.
In this study, a so-called ‘building block’ or ‘testing pyramid’ approach was utilised, with tests at each of the following levels: (i) coupon, (ii) component, and (iii) sub-structure or full structure, ref. [
7].
The ‘building block’ approach provides a comprehensive and systematic methodology to demonstrate airworthiness and structural integrity, and as such represents the backbone of the certification processes for composite aerostructures. Most certification tests are conducted at the coupon level, whereas far fewer certification tests are conducted at the subsequent higher pyramid levels. Once a model of Elektron
® 43 for static and dynamic structural finite element analysis is obtained and validated, this material model will be applied to perform the structural analyses on aircraft seat components model (spreader), references [
8,
9].
2. Modelling and Validation of Elektron® 43 Material Model for Finite Element Analysis
The behaviour of the Elektron
® 43 material model was validated to the experimental test data, under standard and complex loading/stress conditions and at different loading rate values. The experimental data used to validate the material model are the results of the testing of Elektron
® 43 material characterisation, ref. [
5]: tensile tests up to high strain rate values, compression test up to high strain rate values, notched tension tests with two different notch geometries and up to high strain rate values, and the Brinell test.
Tensile tests were performed in order to validate the material model’s behaviour under uniaxial tensile loading and stress conditions;
Compression tests were performed in order to validate the material model’s behaviour under uniaxial compressive loading and stress conditions;
Notched tension tests were performed in order to validate the material model’s behaviour under tensile loading and triaxially stress states;
The Brinell test was performed to validate the material model’s behaviour under a complex state of stress.
The experimental tests presented in the above citated report were simulated with the software LS-DYNA to validate this material model [
10].
2.1. Magnesium Alloy Characterization
With this characterisation, the behaviour of the magnesium alloy “Elektron 43” was investigated at different strain rates and under different loading types and stress states:
Standard tension and compression tests at different strain rates for uniaxial loading;
Notched tension tests at different strain rates to investigate the influence of triaxially stress states under tensile loading;
The Brinell test to capture the material’s response under a complex state of loading and stress.
Table 2 and
Figure 1 show the geometries and testing summary, the thickness of the tensile test is 2 mm, and the gauge length section of the notched sample is extended for 35 mm.
2.2. Elastic–Plastic Material Modelling
The material’s parameter density, Young’s modulus, Poisson ratio, and the true stress–true plastic strain curves given by standard tensile/compression tests performed in this characterisation were implemented in the material card MAT_024 of the Ls-Dyna code, to model the elastic–plastic and strain rate sensitive behaviour of Elektron® 43 under compression and tensile loading.
The maximum plastic deformation at which the element fails was implemented in the material card to simulate the failure phenomena. The parameters and the true strain vs. true plastic strain curve inserted into the material card are shown in
Table 3 and
Figure 2.
2.3. Material Model Validation
2.3.1. Tensile Test Simulation Using LS-DYNA
The tensile tests were simulated to validate the material model under tension loading, where the specimen geometry was modelled with quad linear shell elements. For each test (for each load speed) a mesh sensitivity was evaluated as reported in
Figure 3.
All the degrees of freedom of the nodes at the end of the specimen were removed to simulate the constrain condition, and the nodes on the other side of the specimen were endowed with a speed law assigned to replicate the load condition,
Table 4.
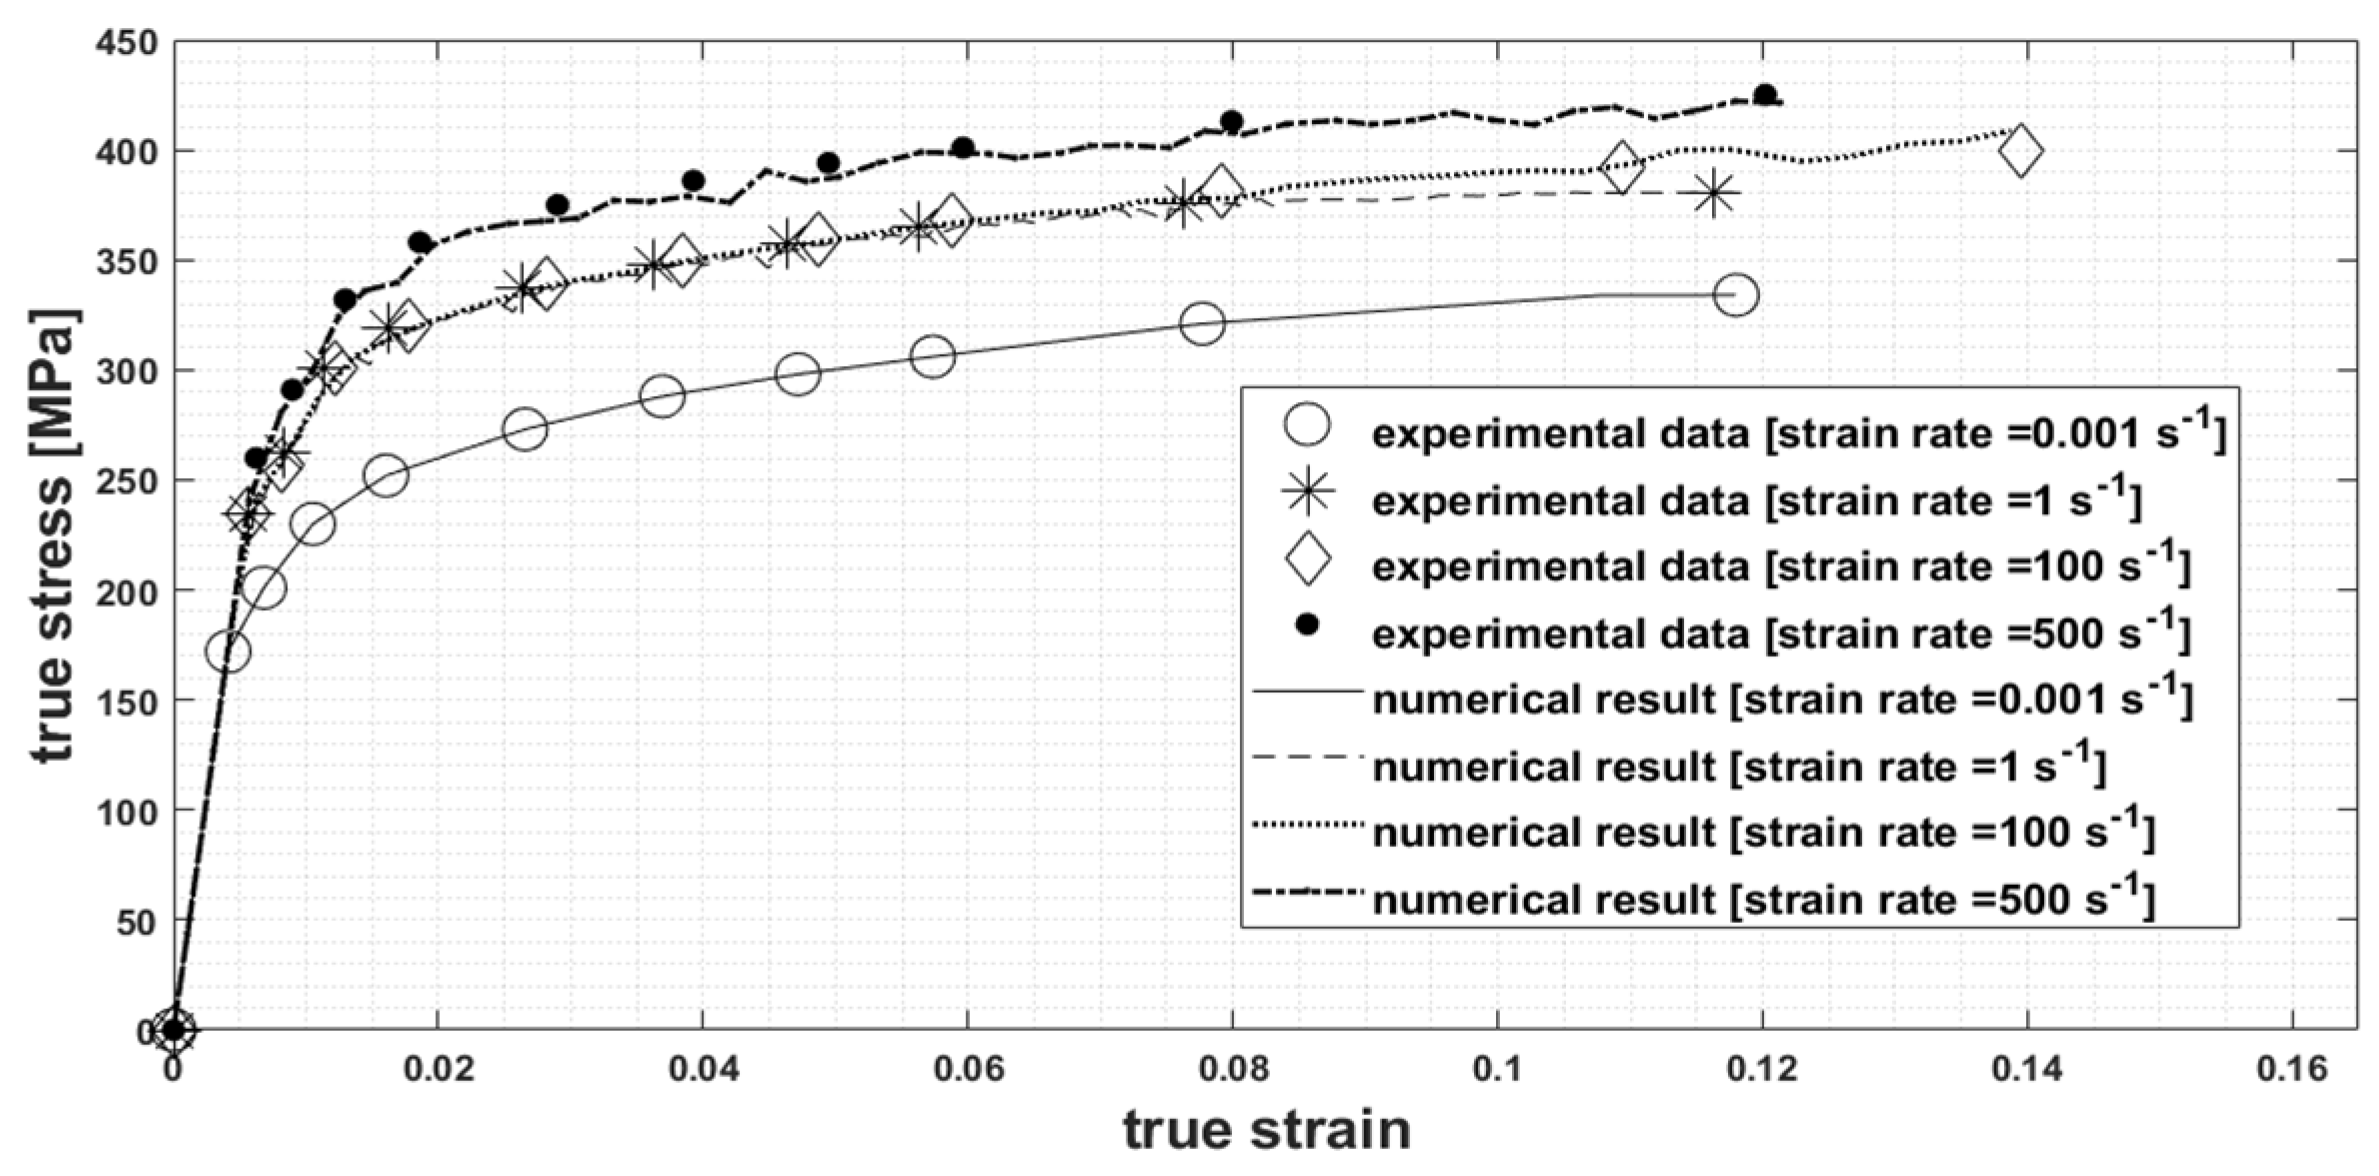
Figure 4 shows a comparison of the true stress vs. true strain curves of numerical simulation with experimental data for each strain rate.
2.3.2. Compression Test Simulation Using LS-DYNA
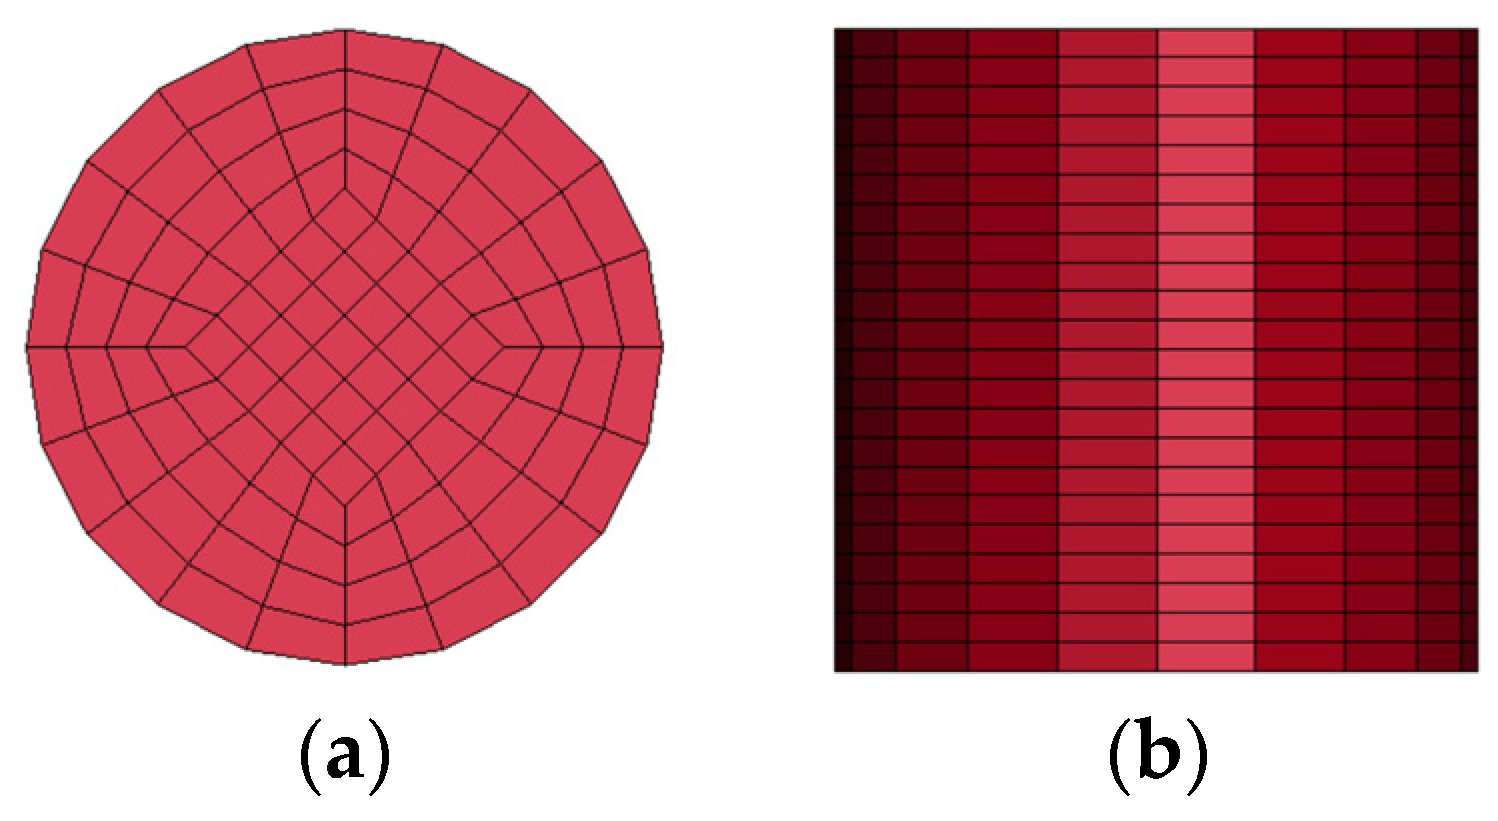
The compression test was simulated to validate the material model under compressive loading. The specimen geometry was modelled with hex8 elements,
Figure 5, and again a mesh sensitivity was conducted to complete the analysis.
All the degree of freedom of the nodes at the end of the specimen were removed to simulate the constrain condition and the nodes on the other side of the specimen were endowed with a speed law assigned to replicate the load condition.
Finally, in
Figure 6, a comparison of true stress vs. true strain curves of numerical simulation with experimental data for each strain rate is reported,
Table 5.
2.3.3. Notched Tensile Test Simulation Using LS-DYNA
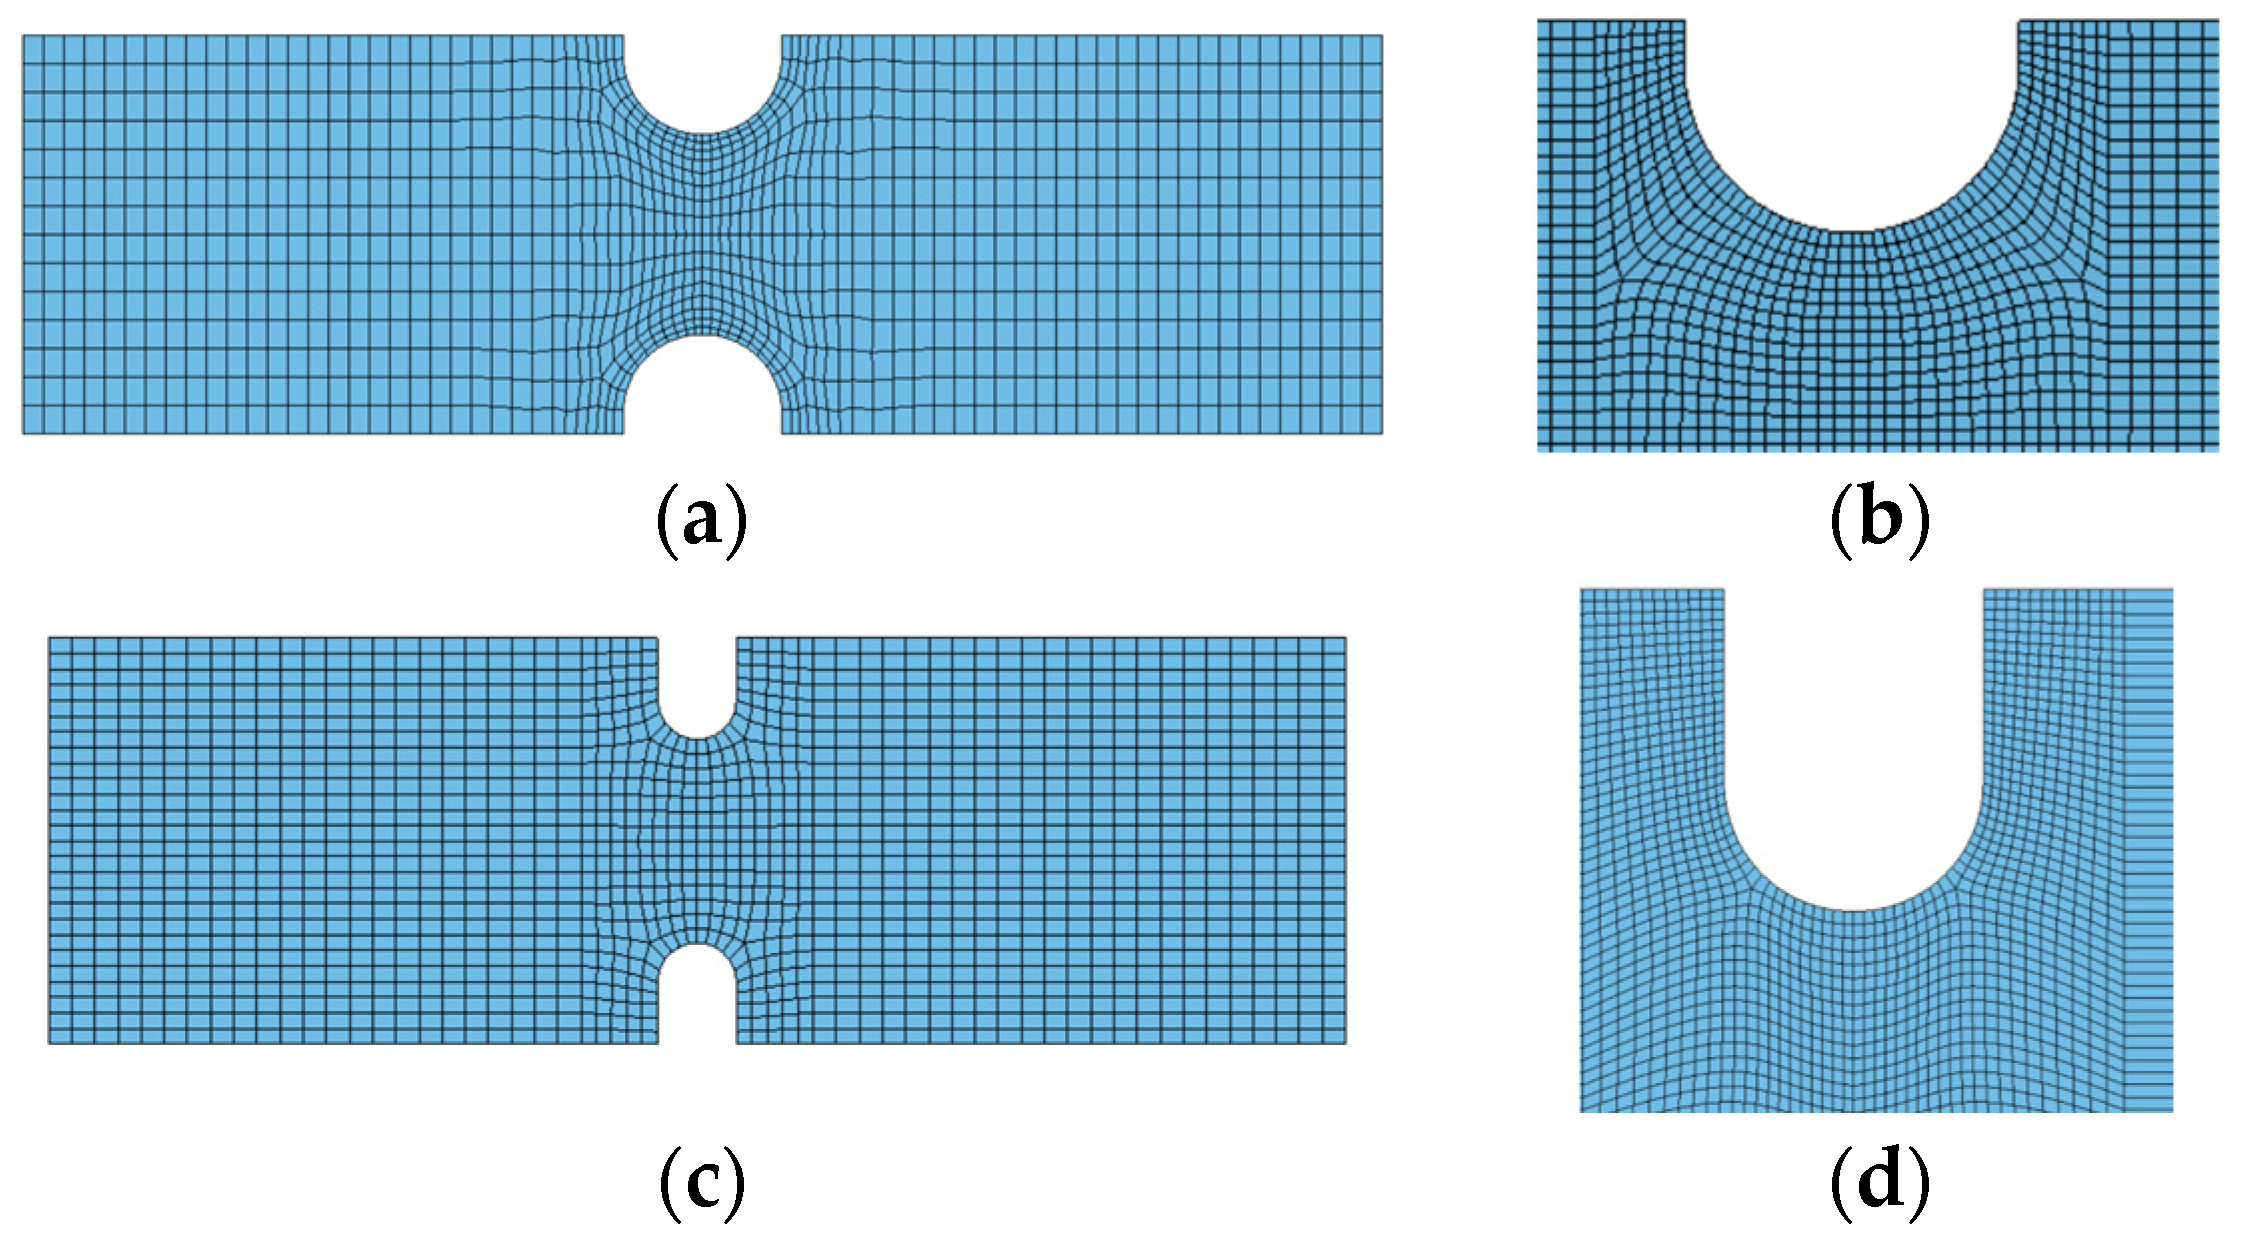
The notched tensile tests were simulated to validate the material model under tension loading and triaxially stress states. The geometry was modelled with Hex8 solid elements,
Figure 7, and all the degrees of freedom of the nodes at the end of the specimen were removed to simulate the constrain condition and the nodes on the other side of the specimen were endowed with a speed law to replicate the load condition.
Table 6,
Table 7 and
Table 8 show the failure diameter of numerical simulation and experimental tests for each strain rate. The typical failure modes of notched tensile test specimens are in proximity to the diameter variation, so it is possible to measure the factors involved in this context by measuring the area involved in the failure; the failure in the diameter will then be measured.
2.3.4. Brinell Test Simulation Using LS-DYNA
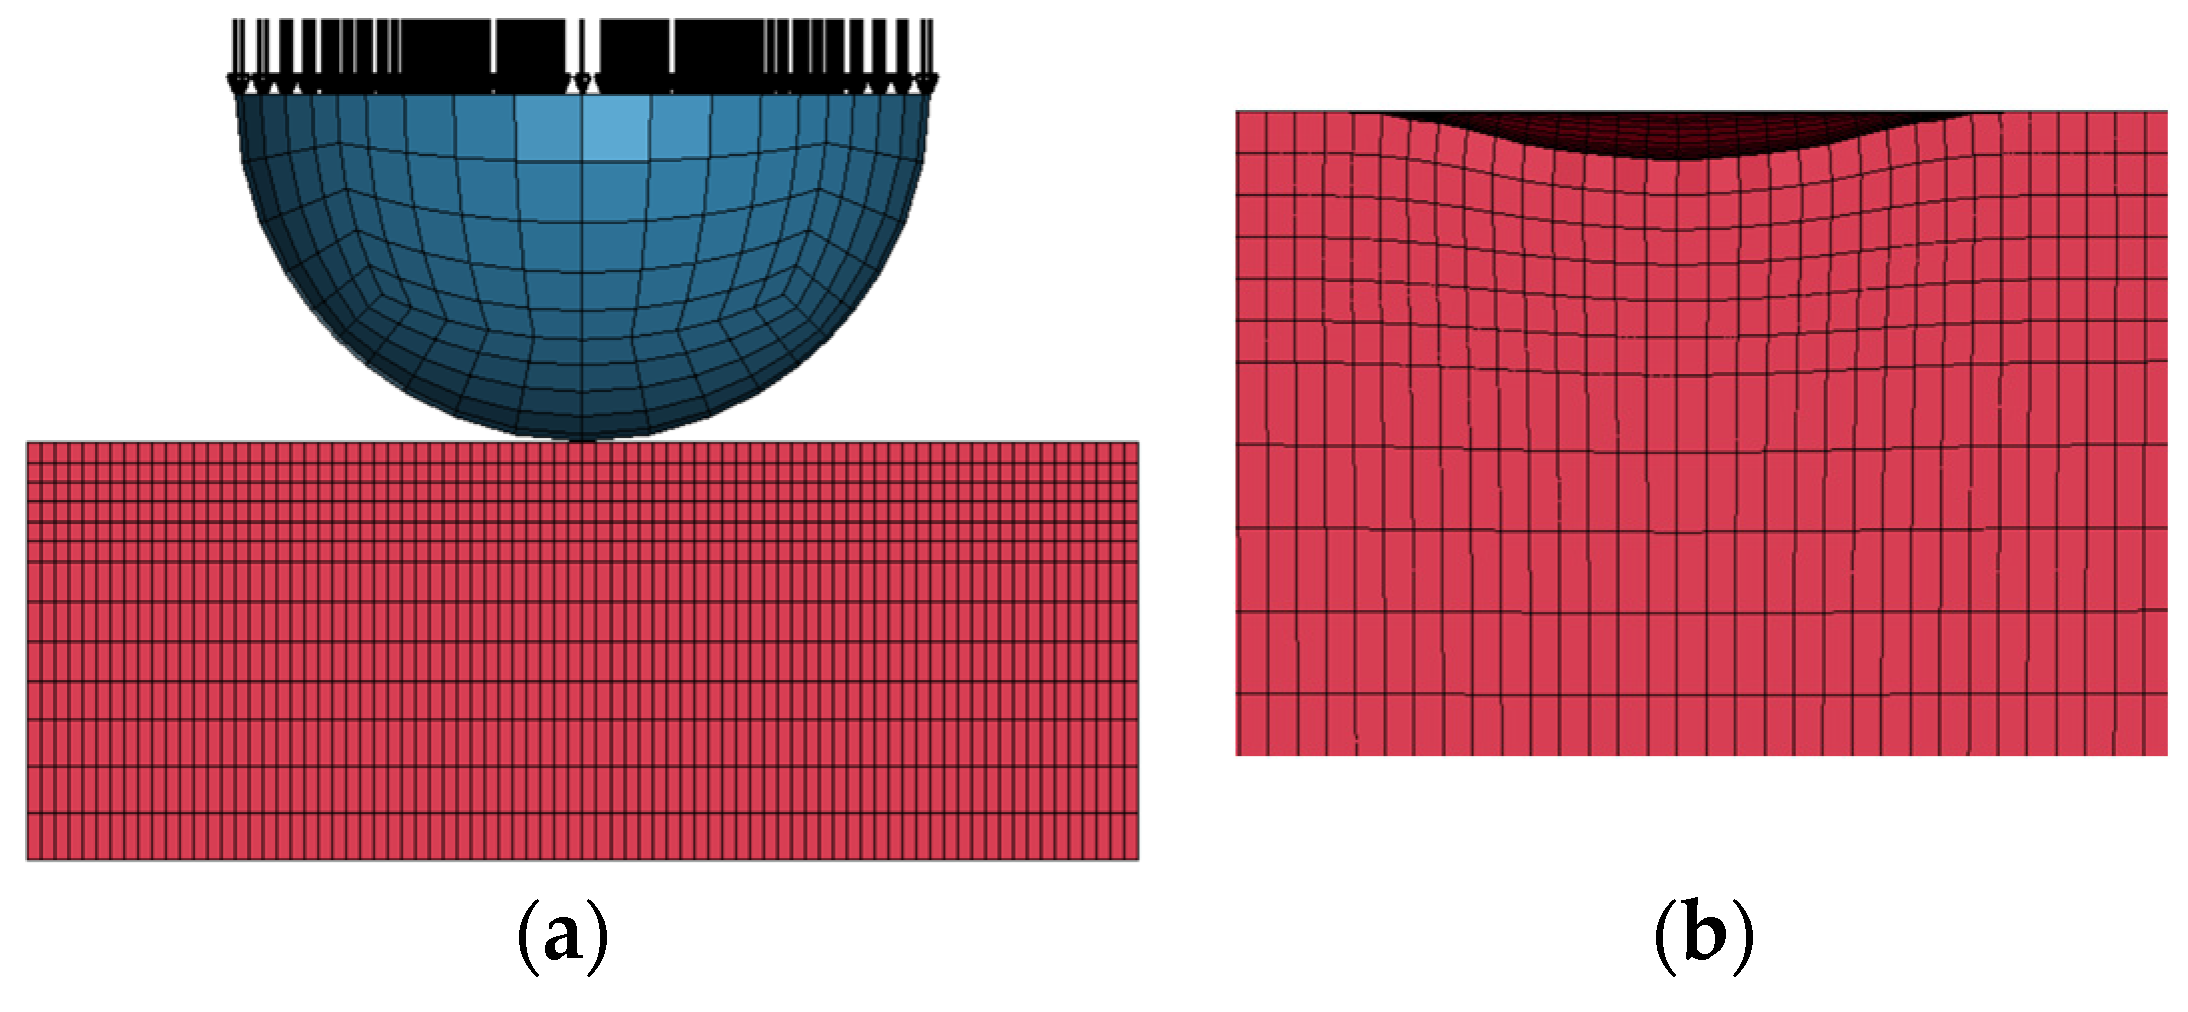
The geometry of the block and the sphere were modelled with Hex8 elements; the above-presented material model was used for the block and a rigid material was used for the sphere model.
All the degrees of freedom of the nodes at the end of the block were removed, all the node sphere’s dofs were fixed, except the displacements along the thickness of the block and the nodes on the upper side of the sphere were loaded to replicate the constrain condition and the load condition,
Table 9 and
Table 10.
The surface area of the residual indent on the specimen (the projection of the indent) after withdrawing the test force were measured and comparted with the experimental data (
Figure 8).
3. Numerical Analysis of a Seat Component Model: Spreader
The spreader is a primary seat structural component for the load path,
Figure 9 [
11]. To certify a seat for static and dynamic tests, it must not break during these tests. This component is also subject to different loads during its life, due to abuse by passengers; so, to ensure a good design, in addition to the requirements to pass the certification test, the seat manufacturers consider other mechanical requirements.
Three load cases to define the requirements for the spreader design must be considered: abuse loads, life cycle, and fatigue.
The mechanical requirement of the static abuse loads is that the equipment shall withstand the abuse loads requirement shown in
Table 11.
The component design must be such as to avoid permanent deformation and no failure of any part shall be permitted under these load conditions. The object of the analysis is to simulate the behaviour of the magnesium alloy spreader element under abuse load conditions with an FE structural analysis.
Numerical Analysis of Abuse Load Condition
The geometry of the structural component was modelled using 3D elements as reported in
Table 12, and the CNRB (constrained nodal rigid body) elements were considered to simulate the constraints.
Figure 10 shows the spreader element and three attachment points are identified in
Figure 10a to link the spreader to the seat structure; these three attachments are simulated by the CNRB elements and the centre of the grids considered is completely fixed.
To apply the two load conditions downward and sideways, were used, respectively:
The equivalent force system shown in
Figure 11a;
A constrained interpolation element to link the pin, where the armrest is linked with the spreader, with a node created in the load application point; finally, the sideways load was applied in this node as shown in
Figure 11b.
The stress and deformation values are obtained for the static analysis, and they are presented in
Figure 12 for both load conditions, downward and sideward.
When the stress and deformation values were evaluated, it was seen that the maximum von Mises stress was calculated to be about 250–270 MPa, and this stress is at the junction of the spreader and armrest component when the downward load is considered, whereas the maximum stress is visible in correspondence to the maximum curvature when one considers the sideward load condition.
According to the results of the static analysis, these values are predictable and at the expected levels.
4. Num-Exp Correlation for Elektron® 43 Spreader
After simulating the stress (strain) state of the spreader model under the downward and sideways load conditions with a static finite element structural analysis, a testing phase was conducted on the physical prototype of the Elektron
® 43 spreader [
12,
13] in order to measure and then compare the strain values of the strain gauge analysis against the numerical ones. This phase, as already anticipated, makes it possible to validate the results obtained from the numerical model.
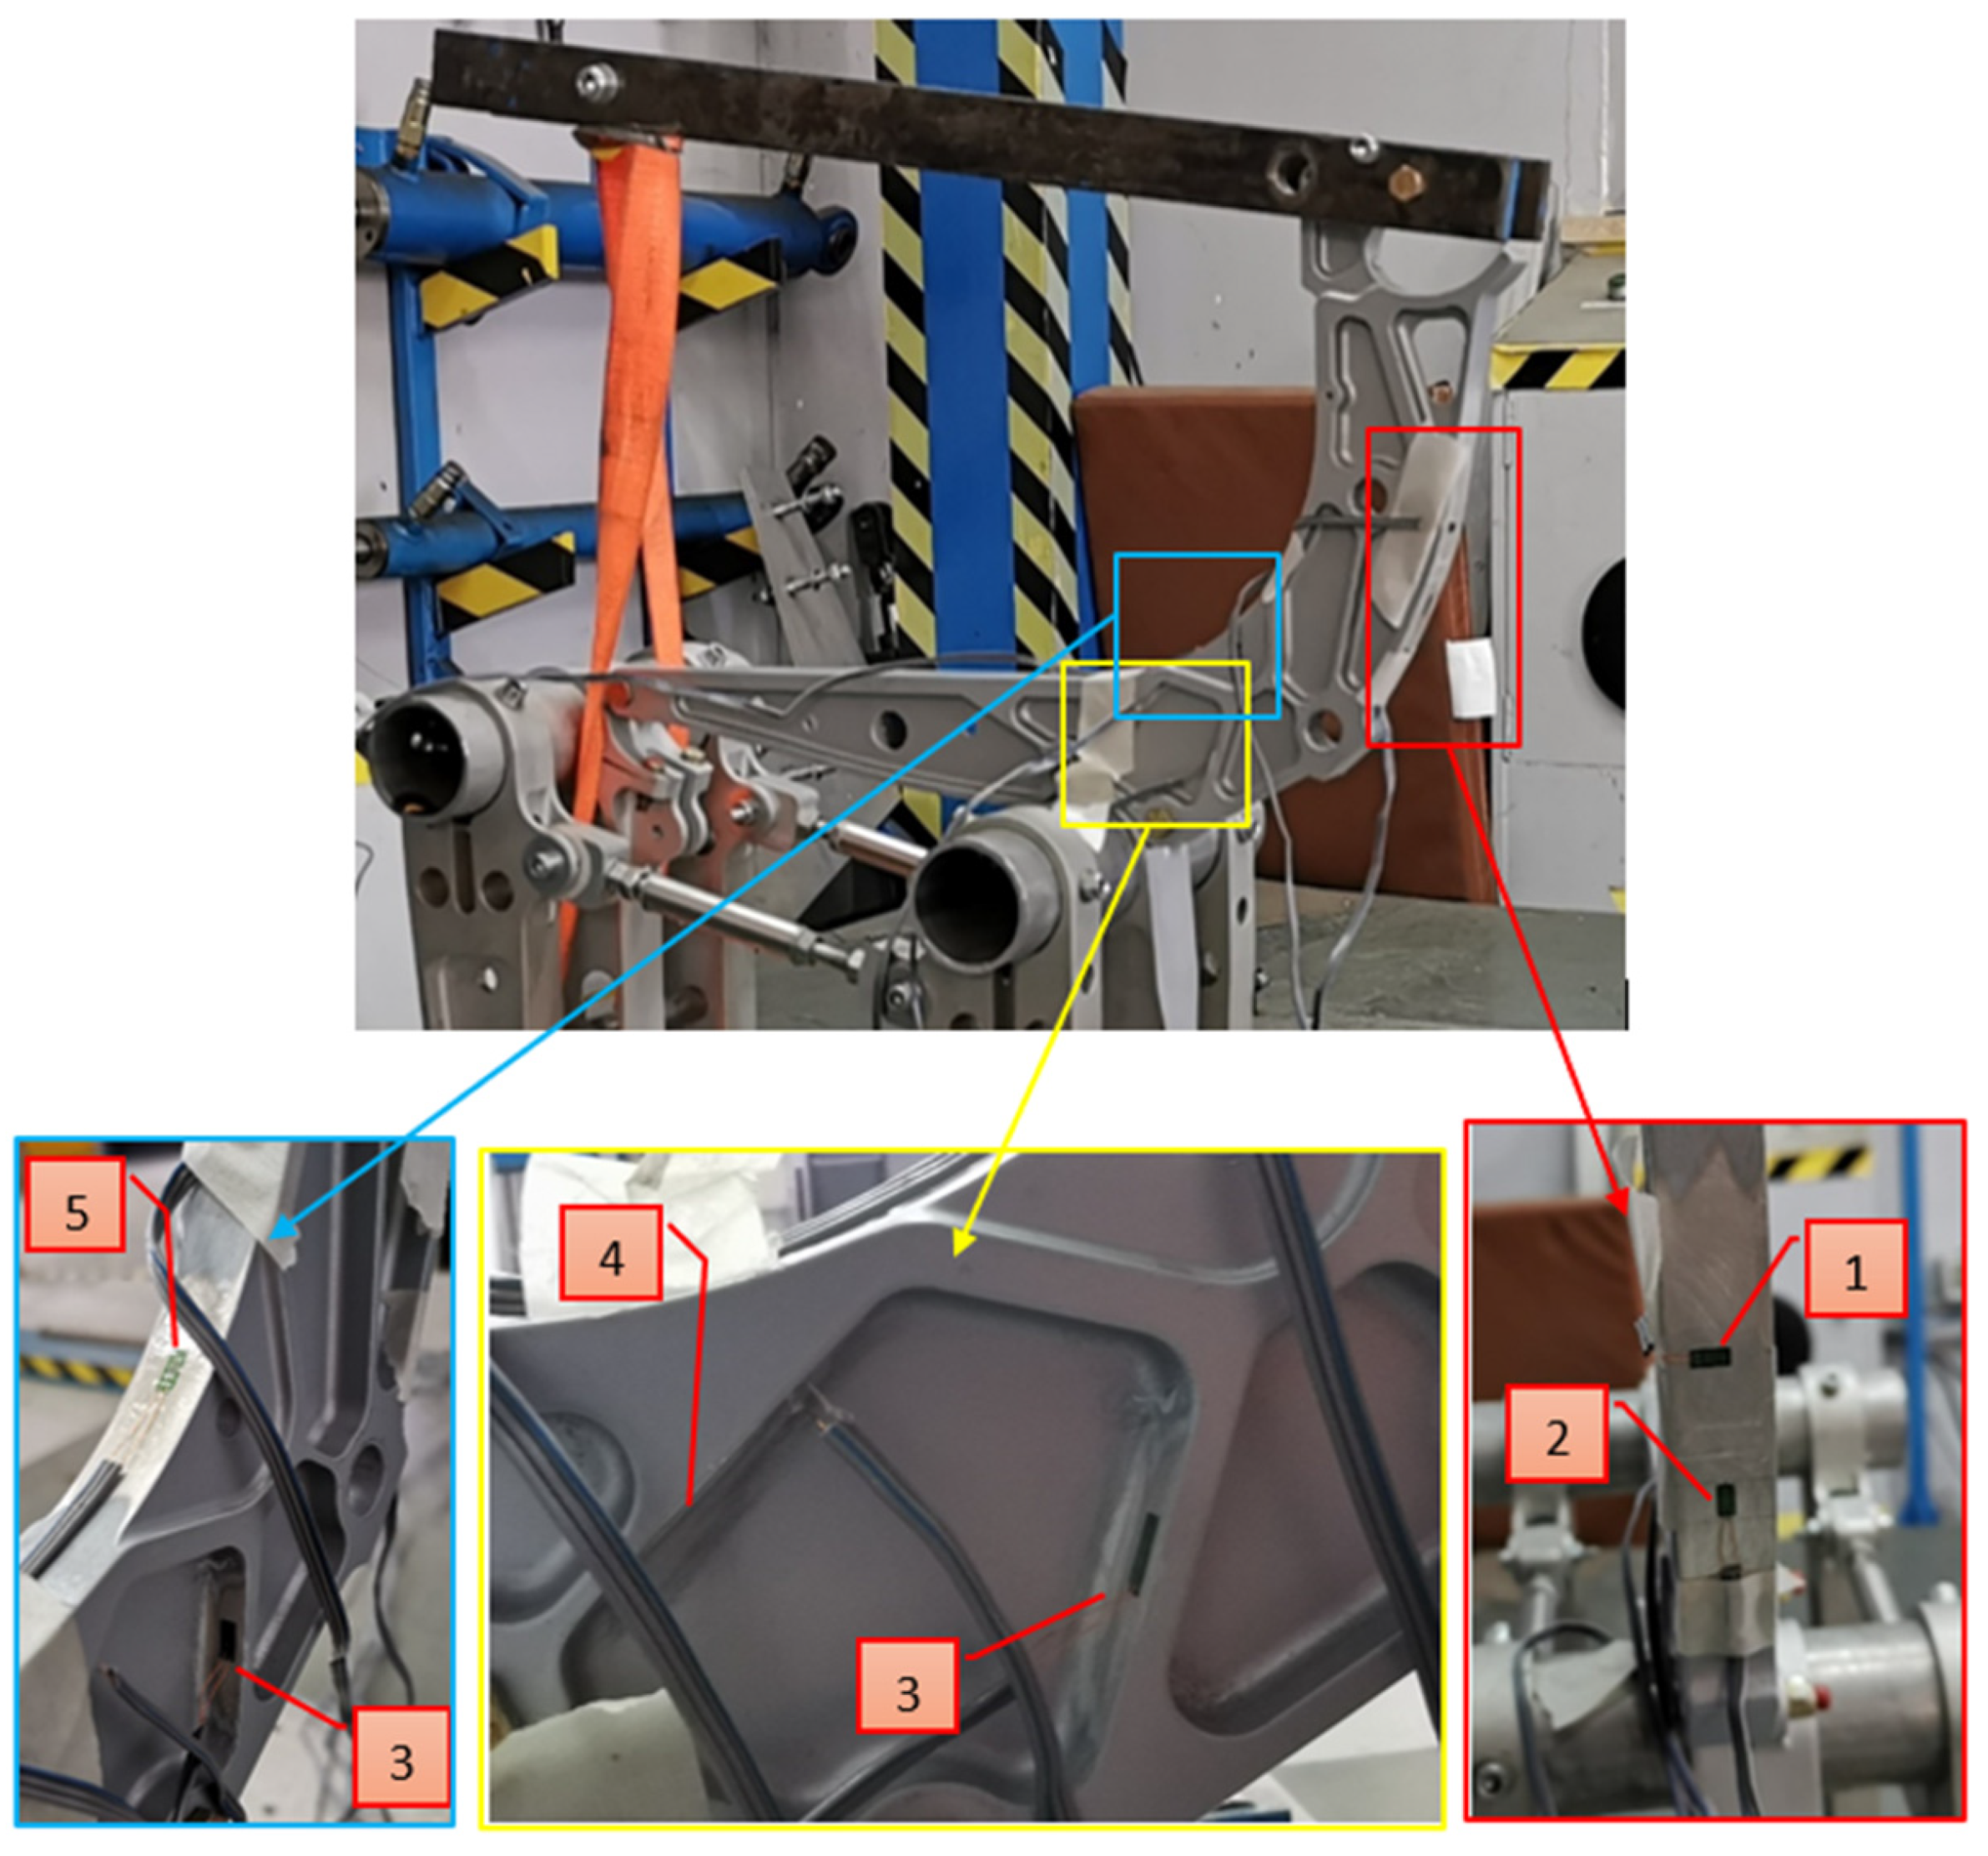
The spreader was instrumented with five unidirectional strain gauges applied, respectively, in five areas,
Figure 13. The areas in which the strain gauges were applied was chosen following the methods:
Areas in which the stress (strain) determined by the finite element stress analysis was higher were chosen to reduce the numerical error and increase the quality of the output.
Areas in which the thickness of the component is lower were chosen to increase the sensitivity of the instrumentation used to read the results and so improve the quality of the results.
In particular, strain gauges No. 2 and No. 5 were applied in the areas were the stress of its elements, due to downward load simulation, are of a higher entity. The other strain gauges, No. 1, No. 3, and No. 4, were applied in the areas were the stress of their elements, due to sideways load simulation, are of a higher entity.
On the spreader, a rigid beam (steel beam) was hinged through which the downward and sideways loading condition were applied. To this beam, in a position 35 cm away from the hinge, a cord was linked. To apply the downward load case, the cord was placed in vertical tension, and then, for the sideways load, the cord was placed in lateral tension. Furthermore, the free side of the cord was linked to a load cell to output the load values applied versus time history; the load cell acquisition system was also linked to the same acquisition system of the strains measurement to synchronise the strain and load history. The force values tested during this phase were lower than the values cited before; this was because of the measurement capability of the strain gauges.
The experimental data of the strain gauge analysis were compared with the numerical results of the finite element analysis carried out at the same load values tested during the experimental phase and shown in
Table 14,
Table 15,
Table 16 and
Table 17.
5. Concluding Remarks
This study examines the static stress analysis of a structural component of a spreader, with a focus on model preparation investigations that were started in light of experimental testing conducted to characterize the magnesium alloy.
Next, a mesh analysis was carried out to investigate the spreader component using the FEA approach. One of the most crucial phases of model preparation is this one. Because the prepared model’s ability to converge to a result—and, more significantly, to an accurate result—depends greatly on the mesh quality and mesh size used. The spreader’s boundary conditions and loads were specified once the proper mesh parameters for the analyses were established. The materials that were going to be utilised in the developed seat were then processed into the software and allocated to the various elements of the seat. Next, the model defines the methods needed to solve the problem. Ultimately, the model was executed, and the outcomes were acquired.
The finite element analysis findings, the right element size, type, and solution techniques were chosen to be very compatible with the test data. But testing and verification are necessary for the FE analysis to be considered validated. Current FE, analytical results, and experimental test results show a good correlation, suggesting that the technique presented here may be effectively used for an aircraft spreader design. Additionally, weight savings were achieved with the magnesium alloy without sacrificing the structural strength associated with conventional aluminium applications. However, it must be noted that, in addition to static load conditions, the designed aircraft seats are also subjected to fatigue and dynamic “crash” load conditions of 14 and 16 grammes. In order to pass these tests, the structure must be able to absorb the load without failing or experiencing excessive plastic deformation.


