Article

Fuel Efficiency Evaluation of A380 Aircraft through Comparative Analysis of Actual Flight Data of the A380–800 and A350–900

1
Asiana Airlines, Seoul City 07505, Republic of Korea
2
Department of Aviation Services, Cheongju University, Cheongju 28503, Republic of Korea
3
Department of Aeronautical Science & Flight Operation, Cheongju University, Cheongju 28503, Republic of Korea
*
Authors to whom correspondence should be addressed.
Aerospace 2024, 11(8), 665; https://doi.org/10.3390/aerospace11080665
Submission received: 12 June 2024 / Revised: 10 July 2024 / Accepted: 6 August 2024 / Published: 13 August 2024
(This article belongs to the Collection Air Transportation—Operations and Management)

Abstract

:
The Airbus A380 was initially expected to replace existing aircraft due to its remarkable fuel efficiency on long-haul routes when operating with a full passenger load. However, recent changes in the commercial aviation environment have resulted in a decrease in demand for four-engine aircraft. Rising fuel prices have pushed airlines to focus on more efficient operations, while manufacturers prioritize producing advanced twin-engine aircraft. The debate over the long-term economic viability of A380 operations remains ongoing. This study compares and evaluates the fuel efficiency of the Airbus A380 and the Airbus A350 using actual flight data. The analysis employs a fuel efficiency prediction model to compare scenarios based on identical payload and load factor. Results indicate that the A350 is approximately twice as fuel efficient as the A380 under the same payload and about 1.34 times more efficient under the same load factor. The A380’s economic viability is analyzed by considering the balance between revenue per available ton-kilometer (RASK) and cost per available ton-kilometer (CASK). If the A380’s RASK is significantly higher than 1.34 times the A350’s or exceeds its own CASK, it can sustain operations. Achieving a balance between RASK and CASK is essential for the economic sustainability of A380 operations.

1. Introduction

The Airbus A380, developed through collaboration between several European aviation manufacturers including France and Germany, marked a significant milestone in aviation history. The largest commercial aircraft in the world, the A380 had its successful maiden test flight on 27 April 2005, in Toulouse, France, and Singapore Airlines began commercial operations on 25 October 2007. This aircraft revolutionized passenger and cargo transportation with its unprecedented capacity and comfort.
The success of the A380, as with any aircraft, depends on factors such as sales volume, costs, passenger preferences, and the product lifecycle. Airlines operating the A380 manage costs by utilizing the aircraft on routes with high load factors to generate consistent profits. However, the aviation industry has shifted towards point-to-point operations, and rising fuel costs and global events like COVID-19 and the Russia–Ukraine war have changed the industry’s landscape [1].
The trend towards fuel-efficient twin-engine aircraft, such as the Airbus A350 and Boeing 787, has challenged the A380’s viability. Quad-engine aircraft like the A380 face lower fuel efficiency and higher emissions, making them less attractive to airlines seeking to reduce costs and environmental impact. As a result, Airbus decided to discontinue A380 production in 2019, and many airlines have suspended its operations.
This study evaluates the fuel efficiency of the A380 compared to twin-engine aircraft using real-world flight data. By developing a model to estimate fuel consumption based on operational data, the study aims to assess the actual fuel consumption rates of these aircraft. The goal is to identify the optimal load factor for the A380 to remain competitive against twin-engine aircraft like the Airbus A350.
Verifying fuel consumption and carbon reduction in practical scenarios is crucial for making informed investment decisions. This research provides valuable insights into the economic viability and strategic management of the A380 within the evolving aviation landscape, offering benchmarks and guidelines for airlines to conduct ongoing economic assessments of A380 operations [2].

2. Background Knowledge and Literature Review

The Airbus A380 was initially celebrated as a significant milestone in aviation history, demonstrating Airbus’s advanced technology and innovative capabilities. It introduced numerous groundbreaking features such as the world’s largest takeoff weight, long-range flight capabilities, and a fully double-decked design. These achievements showcased Airbus’s ability to push the boundaries of aircraft design and manufacture, setting a new standard in the aviation industry [3].
In terms of technological advancements, the A380 integrated cutting-edge materials and innovative designs to optimize safety and performance. Its engine and aerodynamic designs were engineered for efficiency during both landing and takeoff, resulting in reduced fuel consumption. Moreover, the aircraft’s state-of-the-art technology allowed it to deliver reliable performance on long-haul flights, while advanced materials minimized weight, contributing to its overall efficiency [4].
The A380 quickly gained popularity among passengers for its modern technology and unparalleled comfort, yet it faced challenges in the market. Despite there being over 800 commercial airlines globally, only 15 currently operate the A380, with the majority of these being operated by Emirates Airlines. The A380’s limited adoption can be attributed to a combination of high operational costs and difficulties in attracting sufficient buyer interest [1].
One notable challenge the A380 faced was its lack of adoption by US airlines. The US aviation market favors smaller, more efficient aircraft over the large passenger capacity of the A380, which can pose operational and logistical challenges. Additionally, US airports often face infrastructure limitations that make supporting large aircraft like the A380 more difficult. As a result, smaller, more versatile aircraft tend to be more appealing to US airlines [5].
Comparative studies between the A380 and other aircraft models, such as the Boeing 747, 787, and 737, have produced mixed results in terms of fuel efficiency and operational costs. Although the A380 provides substantial passenger capacity and comfort, its maintenance and operational costs tend to be higher. In contrast, medium-sized aircraft like the Boeing 737 and Airbus A350 offer better fuel efficiency and economic benefits, particularly for long-haul flights [6,7,8,9,10].
These studies suggest that the advantages of quad-engine aircraft may diminish as twin-engine aircraft continue to incorporate the latest technologies. Improvements in fuel efficiency and engine reliability in twin-engine aircraft enable them to transport large numbers of passengers even on long-haul flights. This shift is expected to reduce demand for costly quad-engine operations [11]. For instance, a study on transpacific carriers indicated that airlines operating quad-engine aircraft, such as the Boeing 747 and A380, face higher fuel consumption [12].
Research indicates that the future of the A380 may be limited due to the superior performance and fuel efficiency of twin-engine aircraft. Changes in extended twin-engine operations performance standards (ETOPS) regulations, which primarily apply to twin-engine aircraft, have increased their reliability and fuel efficiency. This trend has further reduced the demand for large passenger aircraft like the A380 [13].
Although the A380 was initially anticipated to replace existing Airbus aircraft, it faced challenges due to its enormous size and associated high operating costs. Despite its capacity to accommodate large numbers of passengers, the A380’s potential inefficiency when operating with empty seats can impact airline profits. Consequently, airlines have started replacing the A380 with smaller, more economical aircraft [14,15,16].
The A380 played a significant role in shaping the aviation industry, yet its demand has declined due to changes in the market for large passenger aircraft. As more fuel-efficient aircraft gained popularity, especially during the COVID-19 pandemic, operating large passenger aircraft like the A380 became increasingly challenging. Many airlines have opted for smaller, more economical aircraft to achieve cost savings and efficiency [6].
Ultimately, the Airbus A380 faced high fuel and fleet operating costs, leading airlines to reconsider its adoption. This prompted Airbus to discontinue A380 production in 2019 due to weak market demand and operational cost issues [17]. Although the A380 remains in use on some routes, its operations have significantly declined, with fewer airlines deploying the aircraft than initially anticipated [18]. The fate of the A380 depends on airlines’ strategies and market conditions. Although Emirates Airlines continues to utilize the A380 as a central part of its fleet, other airlines are gradually phasing out the aircraft in favor of more fuel-efficient models [19]. The relationship between aircraft size and fuel efficiency is complex. Although larger aircraft may lead to operational cost savings, fuel efficiency may decrease as size increases. Nonetheless, large aircraft can offer economic benefits through economies of scale and operational strategies [20,21].

3. Methodological Approach

3.1. Fuel Efficiency Index

The fuel efficiency index quantifies the “fuel consumption when transporting 1 ton of payload over 1 km”. A lower value of the fuel efficiency index implies less fuel consumption per unit of payload, interpreted as superior fuel efficiency [22]. Payload refers to the loaded weight data from weight and balance, encompassing passengers, carry-on baggage, checked baggage, and cargo. Distance is based on nautical air miles data reflecting flight plans adjusted for upper-level winds during cruise altitude. Fuel consumption is constrained to exclude fuel consumed during ground operations and is calculated from takeoff to landing.
Table 1 is a sample of actual flight data of A380, and Table 2 is a sample of actual flight data of A350. In the actual flight data, “Payload (Ton)” will be used as the independent variable, and “Index (LB/Ton·Km)” is the fuel efficiency index, which is calculated by dividing the “Actual Trip Fuel (LB)” by the produce of “Distance (KM)” and “Payload (Ton)”.
Table 3 outlines the key specifications of the A380–800 and A350–900 that were used in the comparative analysis of this study. The A380’s structural capacities, such as maximum takeoff weight, maximum landing weight, and maximum zero fuel weight, are more than double those of the A350. The A380 can hold up to 850 passengers in a single-class layout, though the 14 A380 operators worldwide have opted for seating configurations that range from 379 to 520 seats across three or four classes. This seating capacity is roughly 1.2 to 1.7 times greater than that of the A350 when using a 3-class configuration.

3.2. Operational Performance

Operational performance data from “A” airline for the two-year period from 2022 to 2023 was utilized for statistical analysis. A total of 2745 A380–800 flights and 16,828 A350–900 flights were included, with flight durations falling within the 4–15 h range. Payloads ranged from 10 to 60 tons for A380 and from 5 to 55 tons for A350. Outlying data points were considered outliers and excluded from analysis.

3.3. Fuel Efficiency Prediction Model (Using Statistical Analysis)

Fuel efficiency prediction models for A380–800 and A350–900 were established with payload as the independent variable and fuel efficiency index as the dependent variable.

3.3.1. A380–800 Fuel Efficiency Prediction Model

Utilizing curve estimation in SPSS Statistics 25.0 simple regression analysis, the model with the highest explanatory power, the ‘power’ model, was selected as the A380’s fuel efficiency prediction model. Table 4 summarizes the results of the regression models for A380. Table 5, Table 6 and Table 7 confirm the statistical significance of the power model.
Table 5 presents the model summary for the A380, with an R-squared value of 0.969, indicating 96.9% explanatory power. Table 6 displays the analysis of variance, showing a significant F value (0.000), confirming the model’s suitability. Table 7 provides coefficients, with both coefficients showing a significant level (0.000), indicating their suitability. Based on the coefficients, the A380’s fuel efficiency prediction model is expressed as follows:
Y = 20.489 X 0.892
  • Y represents the fuel efficiency index (Unit: lb/ton·km)
  • X represents the payload (unit: ton)

3.3.2. A350–900 Fuel Efficiency Prediction Model

Using curve estimation in SPSS simple regression analysis, the ‘power’ model with high explanatory power was determined as the A350’s fuel efficiency prediction model. Table 8 summarizes the results of the regression models for the A350. Table 9, Table 10 and Table 11 confirm the statistical significance of the power model.
Table 9 presents the model summary for the A350, with an R-squared value of 0.993, indicating 99.3% explanatory power. Table 10 displays the analysis of variance, showing a significant F value (0.000), confirming the model’s suitability. Table 11 provides coefficients, with both coefficients showing a significant level (0.000), indicating their suitability. Based on the coefficients, the A350’s fuel efficiency prediction model is expressed as follows:
Y = 10.371 X 0.900
  • Y represents the fuel efficiency index (unit: lb/ton·km)
  • X represents the payload (unit: ton)

3.4. A380–800 vs. A350–900 Fuel Efficiency Comparison

To provide an intuitive understanding of the fuel efficiency prediction models for the A380 and A350, Excel’s trendline option was utilized to plot them in Figure 1. Although the A380 tends to have a higher payload compared to the A350, it demonstrates a higher fuel efficiency index. In this study, the fuel efficiency index represents ‘fuel consumption per unit of transportation’ and thus the higher fuel efficiency index of the A380 implies lower fuel efficiency.

3.5. Comparison of Fuel Efficiency with Equal Payload

Using the established fuel efficiency prediction models or equations ((Equations (1) and (2)), the fuel efficiency indices based on equal payload are presented in the table. Table 12 illustrates the fuel efficiency indices of the A380 compared to the A350 with the same payload. The fuel efficiency index of the A380 is approximately 2.02 to 2.04 times higher than that of the A350. Figure 2 displays the fuel efficiency indices at the payload level of 30 tons. At this payload, the Fuel Efficiency Index is 0.486, as identified by the intersection with the blue trend line, which represents the A350 actual flight data. In contrast, the Fuel Efficiency Index for the A380 is 0.986, as observed from the intersection with the red trend line, which represents the A380 actual flight data.

3.6. Comparison of Fuel Efficiency with Same Load Factor

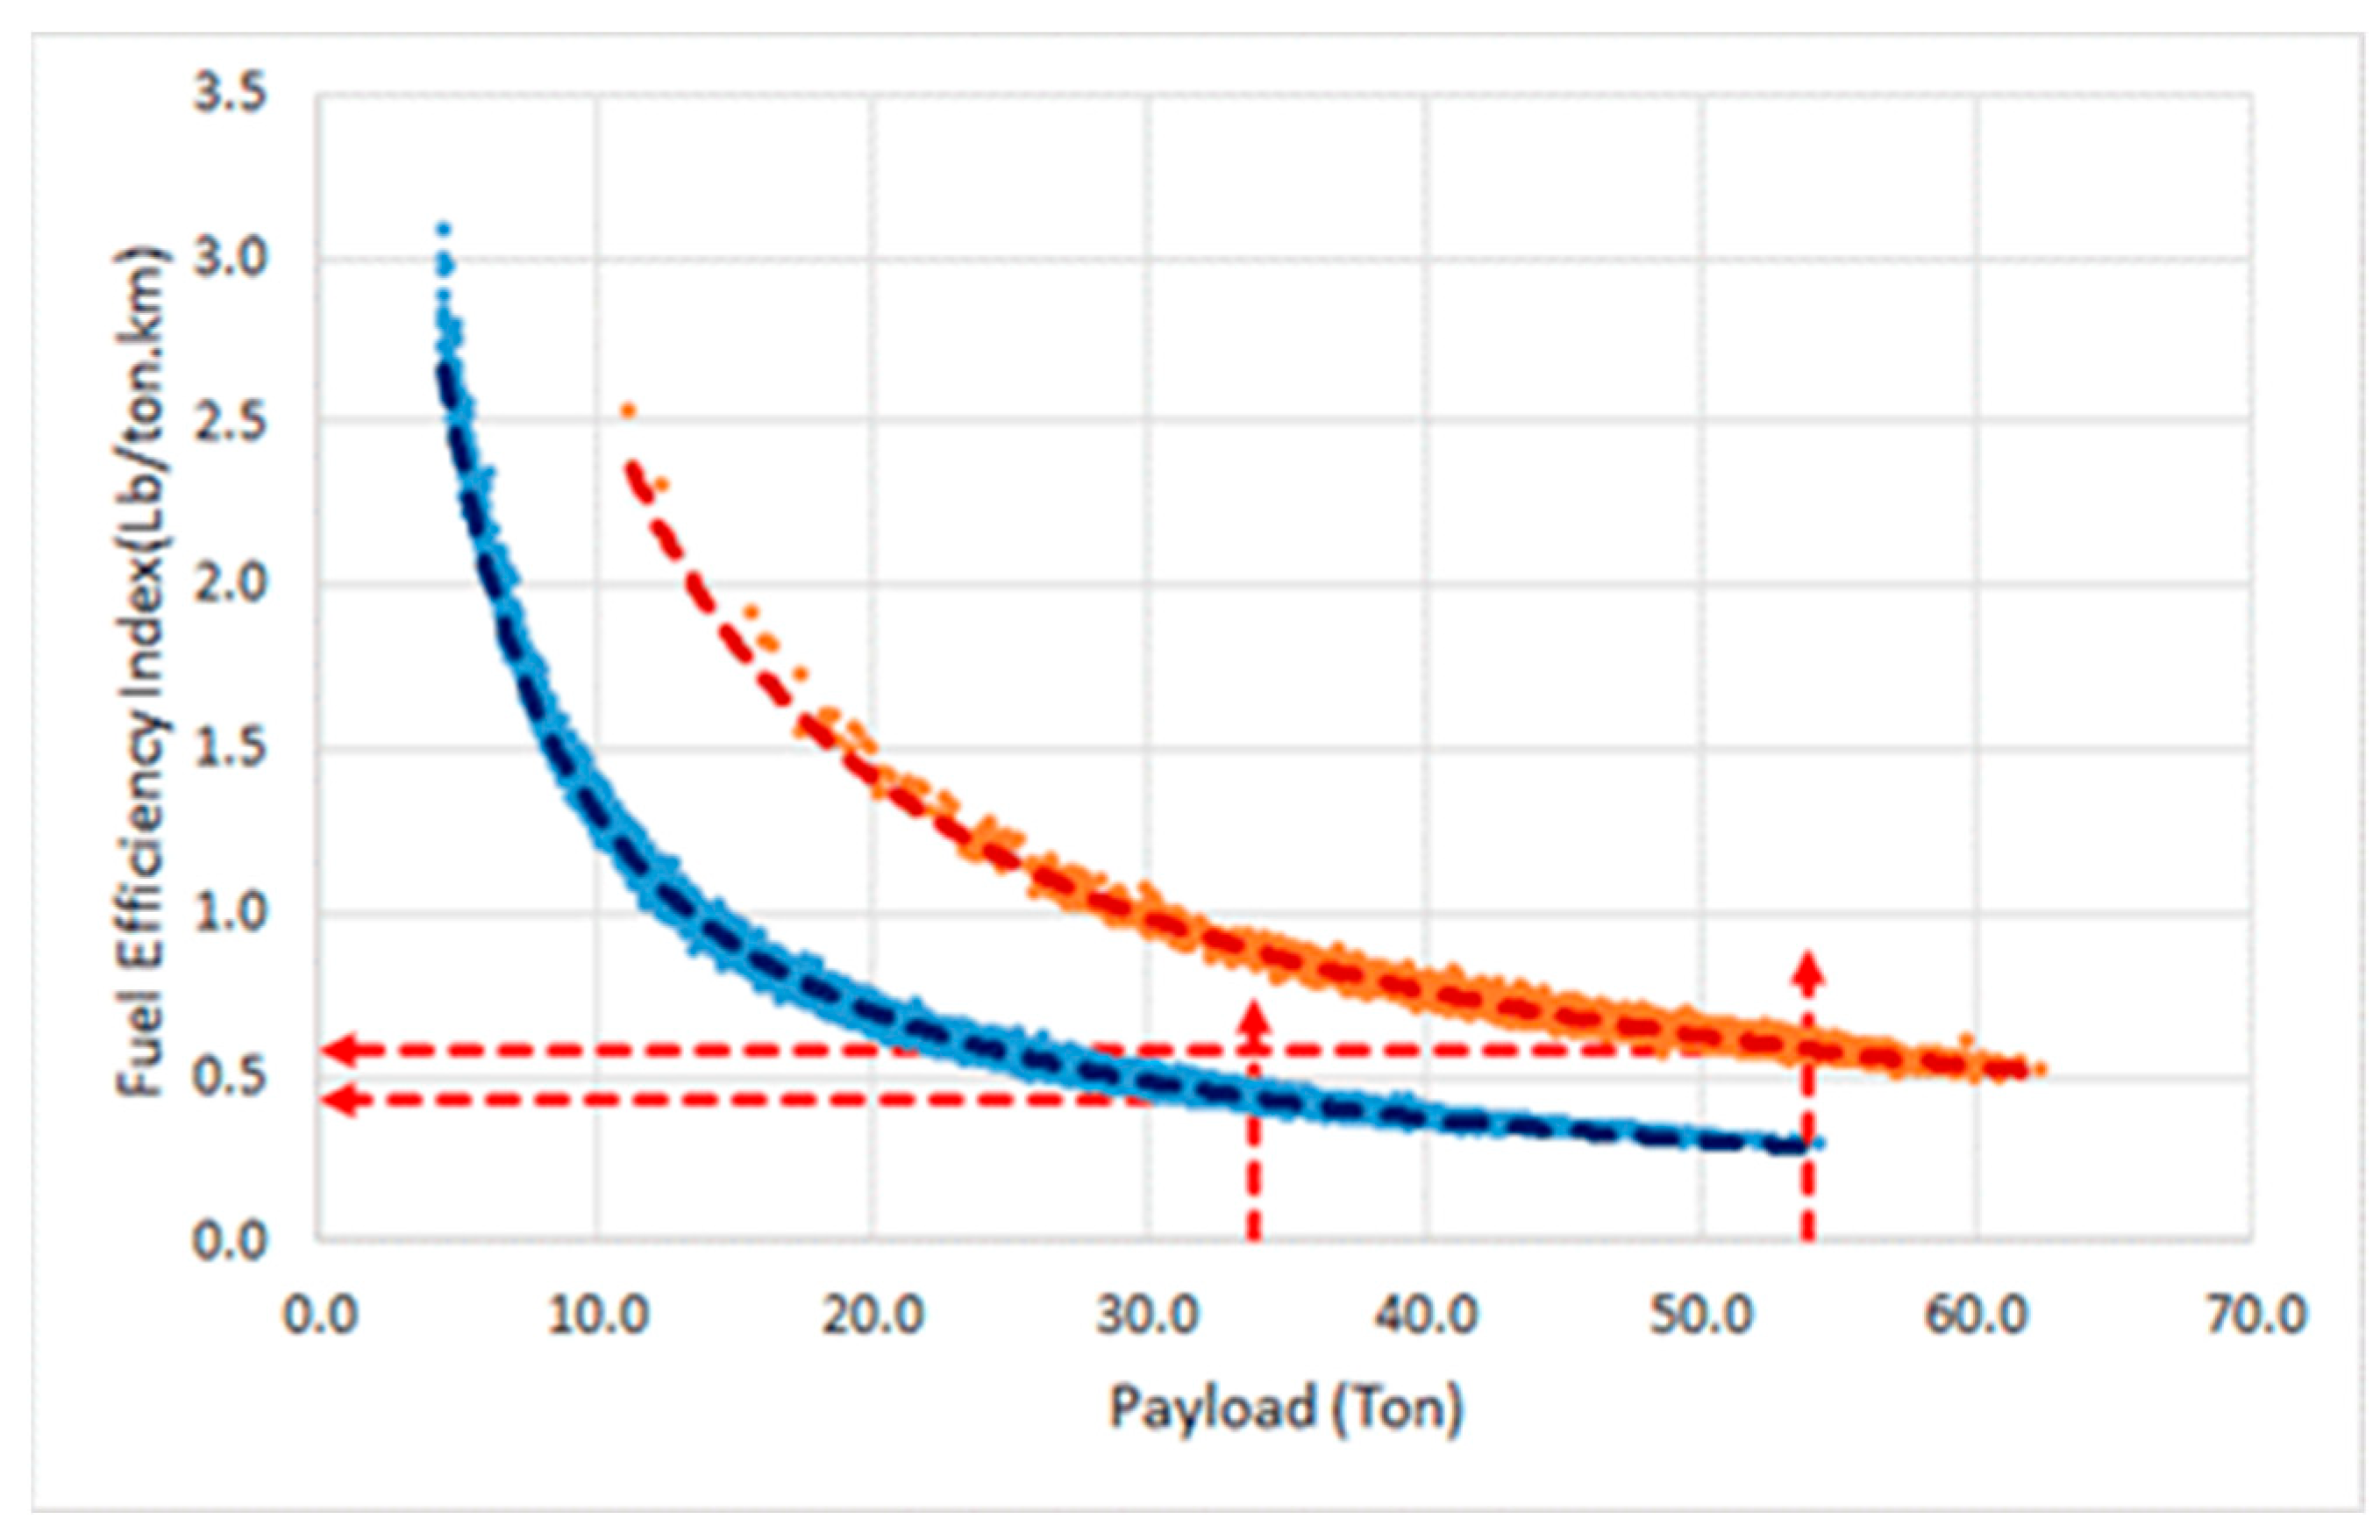
Using the established fuel efficiency prediction models or equations ((Equations (1) and (2)), the fuel efficiency indices based on the same load factor are presented in the Table. Table 13 illustrates the fuel efficiency indices of the A380 compared to the A350 with the same load factor. The fuel efficiency index of the A380 is approximately 1.34 times higher than that of the A350. Figure 3 displays the fuel efficiency indices at a load factor of 100%. The 100% load factor for the A350 is approximately 34 tons, and the Fuel Efficiency Index at this point can be identified as 0.436 by observing the intersection with the blue trend line, which represents the A350 actual flight data. In contrast, the 100% load factor for the A380 is approximately 54 tons, and the Fuel Efficiency Index at this point is 0.585, as seen from the intersection with the red trend line, which represents the A380 actual flight data.

4. Discussion

One of the significant limitations of the A380 is the limited number of operational airports capable of accommodating such a large aircraft. For the continued operation and potential remanufacturing of the A380, it is crucial to increase the number of airports that can support its operations. Gelhausen, Berster, and Wilken have highlighted the challenges and potential solutions related to airport capacity constraints. Their work underscores the necessity of addressing these limitations to ensure the economic efficiency of the A380 and similar large aircraft [23]. The potential implications of constrained airport capacity on the economic viability of the A380 must be studied further to develop strategies for optimizing airport infrastructure and aircraft design.

5. Conclusions

This study developed fuel efficiency prediction models for the A380 and A350, comparing and evaluating their fuel efficiency performance. A regression analysis model was constructed using the latest performance data, with payload as the independent variable and fuel efficiency index as the dependent variable. The fuel efficiency index measures fuel consumption per kilometer per ton of payload, with lower values indicating better fuel efficiency.
The study used curve estimation from SPSS simple regression analysis to establish the fuel efficiency prediction models. Among the various models evaluated, the ‘power’ model was selected for its highest explanatory power. The statistical significance of the established models and their coefficients was confirmed.

5.1. Fuel Efficiency Comparison

The study calculated fuel efficiency indices based on two criteria: ‘same payload’ and ‘same load factor’, enabling a comparative analysis of fuel efficiency. For the same payload, the fuel efficiency index of the A380 was approximately 2.02–2.04 times higher than that of the A350. This finding indicates that the A380 incurs roughly twice the fuel costs per unit transport compared to the A350, primarily due to the A380’s heavier structural weight.
At full passenger load (100% load factor), the A380 accommodates 495 passengers, whereas the A350 accommodates 311 passengers. Under these conditions, the fuel efficiency index of the A380 was around 1.34 times higher than the A350. Although the efficiency gap between the A380 and twin-engine aircraft narrows based on the same payload criterion, the superior fuel efficiency of the A350 and other latest twin-engine aircraft remains evident. For the A380 to operate competitively, it must achieve near-full passenger load conditions, challenging its viability against twin-engine aircraft.

5.2. Economic Analysis of A380 Operations

An economic analysis of A380 operations extended the technological concept of fuel efficiency to the airline management concepts of benefits and costs. A precise economic analysis would require quantifying specific benefits and costs, considering airline operational policies and purchasing contracts, and addressing external variables such as oil prices and exchange rates through time-series forecasting. This study focused on verifying the economic viability of A380 operations based on fuel efficiency comparisons and assumed that non-fuel unit costs were consistent across aircraft types.

5.2.1. When A380’s RASK Is Greater than 1.34 Times the A350’s RASK

If the revenue per available ton-kilometer (RASK) of the A380 surpasses 1.34 times that of the A350, the A380 is deemed to have a competitive advantage over the A350. This scenario assumes that each aircraft’s RASK is greater than its cost per available ton-kilometer (CASK).

5.2.2. When A380’s RASK Exceeds Its CASK

If the A380’s RASK is higher than its CASK, the A380 can sustain operations. Airlines must maintain the ratio ‘RASK > CASK’ for the continued operation of the A380. This involves increasing RASK through ticket sales, cargo transportation revenue, and onboard duty-free sales, while reducing CASK through economies of scale. Concentrating the A380 on long-haul or non-competitive routes, maximizing passenger load, and maintaining high ticket prices are essential for increasing RASK.

5.2.3. When A380’s RASK Is Less than Its CASK

If the A380’s RASK falls below its CASK, generating revenue becomes challenging. Comparing RASK/CASK ratios on individual routes may be misleading; therefore, comprehensive management of RASK/CASK trends across various routes is necessary. Distortions in assessing RASK/CASK at specific points in time require long-term demand analysis and management decisions based on trends. In the post-COVID-19 environment, with eased travel restrictions and increased air travel demand and prices, A380 operations may temporarily achieve ‘RASK > CASK’. However, this situation calls for sustained demand analysis and management strategies to increase RASK and decrease CASK.

Author Contributions

Conceptualization, S.J., S.Y. and J.L.Y.; Methodology, S.J.; Validation, S.J.; Formal analysis, S.J.; Resources, S.Y. and J.L.Y.; Data curation, S.J.; Writing – original draft, S.J.; Writing – review & editing, S.Y. and J.L.Y.; Supervision, J.L.Y. All authors have read and agreed to the published version of the manuscript.

Funding

This research received no external funding.

Data Availability Statement

The original contributions presented in the study are included in the article, further inquiries can be directed to the corresponding authors.

Conflicts of Interest

Author Sungwoo Jang was employed by the company Asiana Airlines. The remaining authors declare that the research was conducted in the absence of any commercial or financial relationships that could be construed as a potential conflict of interest.

References

  1. Nelson, C. Investigating the Airbus A380: Was It a Success, Failure, or a Combination? Available online: https://scholarsbank.uoregon.edu/xmlui/bitstream/handle/1794/25788/Final_Thesis-Nelson_C.pdf?sequence=1&isAllowed=y (accessed on 17 April 2024).
  2. Jefry, Y.; Rhea, P.L. Cluster-Based Aircraft Fuel Estimation Model for Effective and Efficient Fuel Budgeting on New Routes. Aerospace 2022, 9, 624. [Google Scholar] [CrossRef]
  3. Airbus A380 Superjumbo Airliner. Available online: https://www.aerospace-technology.com/projects/a380/ (accessed on 17 April 2024).
  4. A380—Unique Passenger Experience. Available online: https://www.airbus.com/en/products-services/commercial-aircraft/passenger-aircraft/a380 (accessed on 17 April 2024).
  5. Why Don’t US Airlines Fly the Airbus A380? Available online: https://simpleflying.com/why-us-airlines-dont-fly-the-airbus-a380/ (accessed on 17 April 2024).
  6. The Airbus A380 vs. Boeing 747—Which Plane Is Best? Available online: https://simpleflying.com/a380-vs-747/ (accessed on 17 April 2024).
  7. The Airbus A380 vs. Boeing 787—Which Plane Is Best? Available online: https://simpleflying.com/airbus-a380-vs-boeing-787/ (accessed on 17 April 2024).
  8. A Fleet of Boeing 737s vs. One Airbus A380—Which Is Best? Available online: https://simpleflying.com/a-fleet-of-boeing-737s-vs-one-airbus-a380-which-is-best/ (accessed on 17 April 2024).
  9. The Airbus A380 vs. A350—What Plane Is Best? Available online: https://simpleflying.com/airbus-a380-vs-a350/ (accessed on 17 April 2024).
  10. The Boeing 777X vs. The Airbus A380—What Plane Wins? Available online: https://simpleflying.com/boeing-777x-vs-airbus-a380 (accessed on 17 April 2024).
  11. Twinjets vs. Quadjets: How Do the Two Aircraft Types Compare. Available online: https://simpleflying.com/twinjets-vs-quadjets-how-do-the-two-aircraft-types-compare/ (accessed on 17 April 2024).
  12. Graver, B.; Rutherford, D. Transpacific Airline Fuel Efficiency Ranking. 2016. Available online: https://theicct.org/publication/transpacific-airline-fuel-efficiency-ranking-2016/ (accessed on 17 April 2024).
  13. Did ETOPS Kill the Airbus A380? Available online: https://simpleflying.com/did-etops-kill-the-airbus-a380/ (accessed on 17 April 2024).
  14. King, J.M.C. The Airbus 380 and Boeing 787: A Role in the Recovery of the Airline Transport Market. J. Air Transp. Manag. 2007, 13, 16–22. [Google Scholar] [CrossRef]
  15. Airbus’s Flagship Plane May Be Too Big to Be Profitable. Available online: https://www.businessinsider.com/airbuss-flagship-plane-may-be-too-big-to-be-profitable-2014-12 (accessed on 17 April 2024).
  16. Is Airbus’s A380 a ‘Superjumbo’ with a Future or an Aerospace White Elephant? Available online: https://www.telegraph.co.uk/finance/newsbysector/industry/engineering/11353508/Is-Airbuss-A380-a-superjumbo-with-a-future-or-an-aerospace-white-elephant.html (accessed on 17 April 2024).
  17. Giants of the Skies: How the Airbus A380 & Boeing 747 Compare to One Another. Available online: https://simpleflying.com/airbus-a380-boeing-747-comparison-analysis/ (accessed on 17 April 2024).
  18. The Rise and Fall of the Airbus A380. Available online: https://simpleflying.com/a380-rise-and-fall/ (accessed on 17 April 2024).
  19. Airline by Airline: The Fate of the World’s Airbus A380s. Available online: https://simpleflying.com/airbus-a380-fate-by-airline/ (accessed on 17 April 2024).
  20. Rutherford, D. Size Matters for Aircraft Fuel Efficiency. Just Not in the Way That You Think. Available online: https://theicct.org/size-matters-for-aircraft-fuel-efficiency-just-not-in-the-way-that-you-think/ (accessed on 17 April 2024).
  21. How Are Emirates’ A380s So Profitable? Available online: https://simpleflying.com/how-are-emirates-a380s-so-profitable/ (accessed on 17 April 2024).
  22. Jang, S.W.; Cho, Y.H.; Yoo, J.L.; Yoo, K.E. Fuel Efficiency Prediction Model to Enhance the Fuel Efficiency and Reduce the Carbon Emissions. Trans. Jpn. Soc. Aeronaut. Space Sci. 2022, 65, 237–243. [Google Scholar] [CrossRef]
  23. Marc, C.G.; Berster, P.; Wilken, D. Airport Capacity Constraints and Strategies for Mitigation, 1st ed.; Academic Press: Cambridge, MA, USA, 2019. [Google Scholar] [CrossRef]
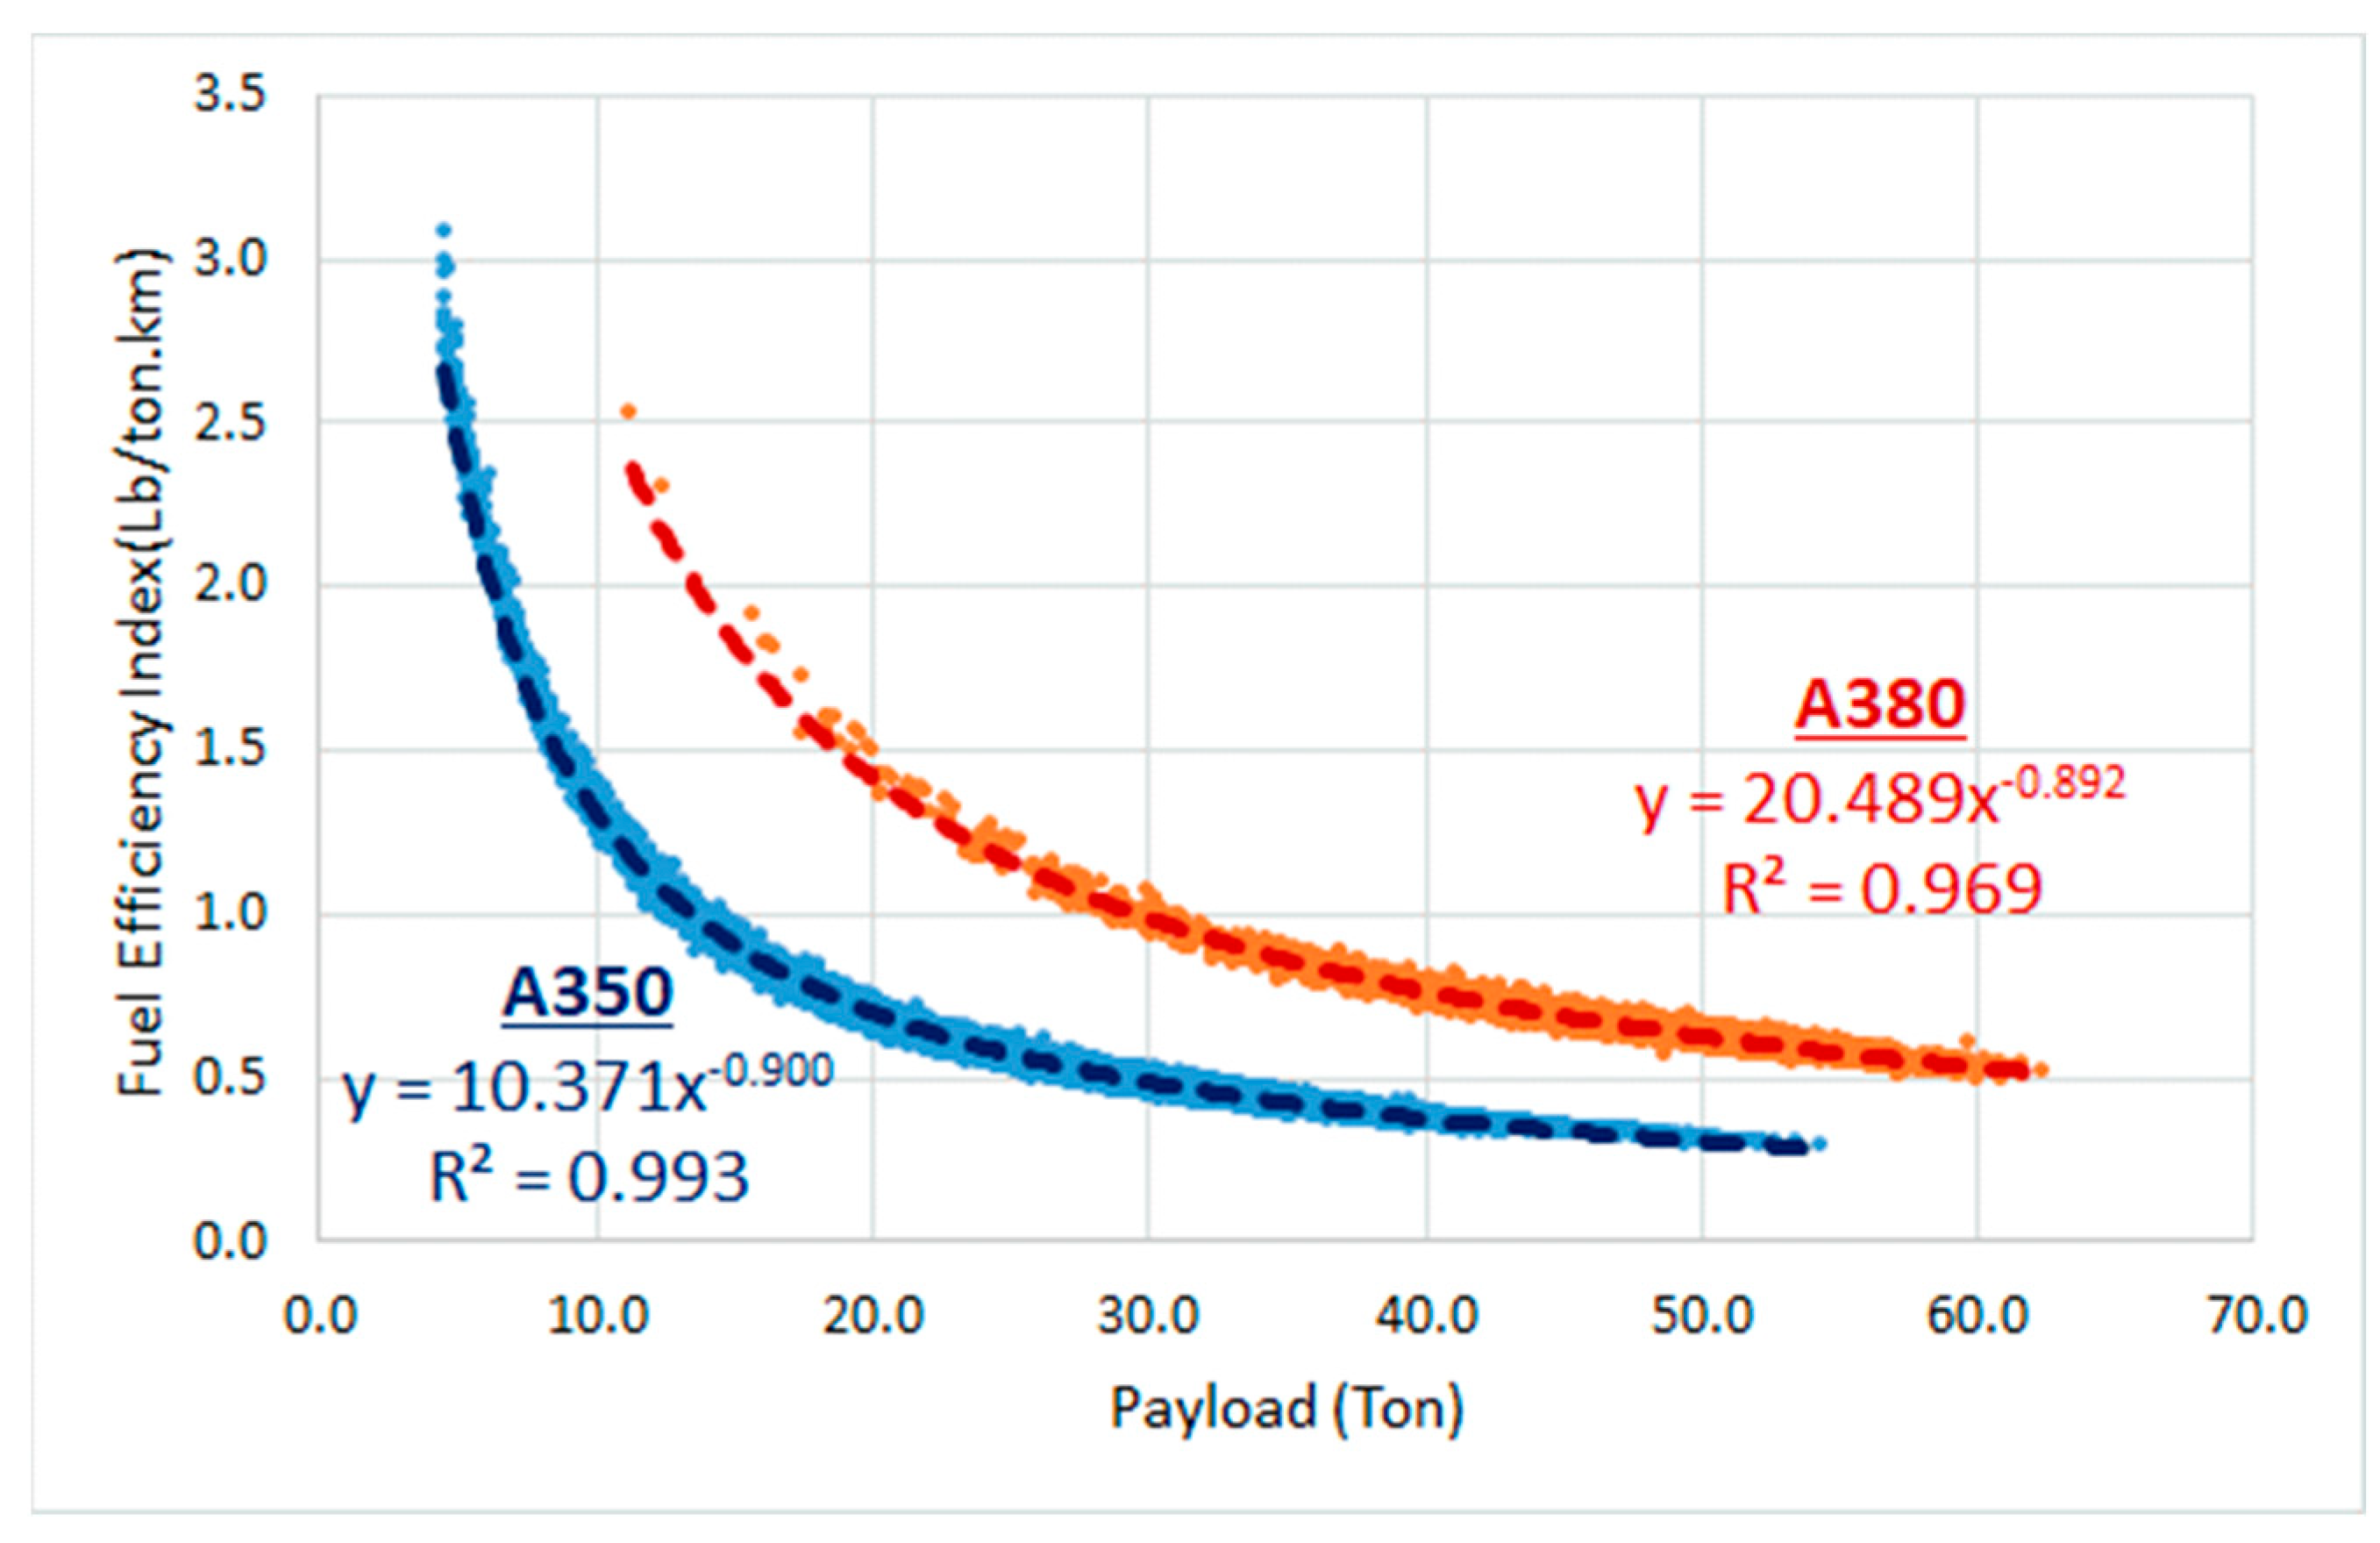
Figure 1. Fuel efficiency prediction model comparison (A380 vs. A350).
Aerospace 11 00665 g001
Figure 2. Fuel efficiency index comparison—payload of 30 tons (A380 vs. A350).
Aerospace 11 00665 g002
Figure 3. Fuel efficiency index comparison—100% load factor (A380 vs. A350).
Aerospace 11 00665 g003
Table 1. Sample of actual flight data of A380–800.
CountDateDepartureArrivalActual
Trip Time
(Min)
Actual
Trip Fuel
(LB)
Distance
(KM)
Payload
(Ton)
Index *
(LB/Ton·Km)
118 January 2023LAXICN879433,10012,79055.00.62
29 October 2023LAXICN832409,20012,18153.80.62
319 December 2023LAXICN830396,00011,89947.80.70
430 November 2022LAXICN827401,30011,93152.60.64
59 December 2022LAXICN823401,40012,11949.90.66
274313 February 2020BKKICN257107,000364130.10.98
274425 January 2020BKKICN257118,700362842.10.78
274526 January 2020BKKICN256110,900361943.40.71
* Index represents the fuel efficiency index; Trip Fuel/(Distance·Payload).
Table 2. Sample of actual flight data of A350–900.
CountDateDepartureArrivalActual
Trip Time
(Min)
Actual
Trip Fuel
(LB)
Distance
(KM)
Payload
(Ton)
Index *
(LB/Ton·Km)
123 October 2022ATLICN951184,30013,81010.71.25
221 March 2022ATLICN951193,00013,79014.80.95
313 November 2022ATLICN947191,50013,77012.01.16
414 January 2022ATLICN942183,90013,5609.81.39
57 November 2022ATLICN941193,20013,78121.50.65
16,82623 March 2023HANICN20543,100297636.60.40
16,82719 January 2023HANICN20542,100287437.10.39
16,82821 December 2023HANICN20543,400299837.70.38
* Index represents the fuel efficiency index; Trip Fuel/(Distance·Payload).
Table 3. General specifications of A380 and A350.
SpecificationA380–800
(a)
A350–900
(b)
Ratio
(a/b)
Engine Type
(Thrust)
RR Trent970
(70,000X4)
(4-Engine Airplane)
RR Trent XWB-84
(84,000X2)
(2-Engine Airplane)
Maximum Takeoff Weight (Ton)5692752.1
Maximum Landing Weight (Ton)3912071.9
Maximum Zero Fuel Weight (Ton)3661961.9
Operational Empty Weight (Ton)2991402.1
Maximum Payload (Ton)66.855.21.2
Seat Configuraiton (3-Class based)4953111.6
Table 4. Regression model summary (A380).
MethodR-SquaredPrediction Model
Linear0.838Y = −0.018X + 1.535
Logarithmic0.929Y = −0.753ln(X) + 3.568
Power0.969Y = 20.489X − 0.892
Exponential0.933Y = 1.906e − 0.022X
Table 5. Model summary (A380).
ModelRR-SquaredAdjusted R-SquaredStd. Error of the Estimate
A3800.9840.9690.9690.033
Table 6. Analysis of variance (A380).
ModelSum of SquaresDfMean SquareFSig.
Regression92.073192.07385,563.7660.000
Residual2.95227430.001
Total95.0252744
Table 7. Coefficients (A380).
ModelUnstandardized CoefficientsStandardized CoefficientstSig.
BStd. ErrorBeta
ln (Payload)−0.8920.003−0.984−292.5130.000
(Constant)20.4890.238 85.9520.000
Table 8. Regression model summary (A350).
MethodR-SquaredPrediction Model
Linear0.700Y = −0.028X + 1.405
Logarithmic0.893Y = −0.716ln(X) + 2.937
Power0.993Y = 10.371X − 0.900
Exponential0.912Y = 1.637e − 0.039X
Table 9. Model Summary (A350).
ModelRR-SquaredAdjusted R-SquaredStd. Error of the Estimate
A3500.9960.9930.9930.034
Table 10. Analysis of Variance (A350).
ModelSum of SquaresDfMean SquareFSig.
Regression2651.84612651.852,362,011.220.000
Residual18.89116,8260.001
Total2670.73616,827
Table 11. Coefficients (A350).
ModelUnstandardized CoefficientsStandardized CoefficientstSig.
BStd. ErrorBeta
ln (Payload)−0.9000.001−0.996−1536.8840.000
(Constant)10.3710.020 520.6530.000
Table 12. Fuel efficiency index comparison (A380 vs. A350).
Payload
(Ton)
A380
(a)
A350
(b)
Ratio *
(a/b)
Fuel Efficiency Index
201.4160.7002.02
300.9860.4862.03
400.7630.3752.03
500.6250.3072.04
* Ratio represents A380 fuel efficiency index/A350 fuel efficiency index.
Table 13. Fuel efficiency index comparison with same load factor (A380 vs. A350).
Load Factor
(%)
A380
(a)
A350
(b)
Ratio *
(a/b)
Fuel Efficiency Index
1000.5850.4361.34
750.7560.5641.34
* Ratio represents A380 fuel efficiency index/A350 fuel efficiency index.
Disclaimer/Publisher’s Note: The statements, opinions and data contained in all publications are solely those of the individual author(s) and contributor(s) and not of MDPI and/or the editor(s). MDPI and/or the editor(s) disclaim responsibility for any injury to people or property resulting from any ideas, methods, instructions or products referred to in the content.