Abstract
Airport networks are interconnected through flight routes, with delays at upstream airports leading to delays at downstream airports, thus causing delay propagation. Exploring the mechanisms of delay propagation in airport networks provides scientific insights for managing and controlling delays in aviation systems. Existing methods, such as Granger causality tests and transfer entropy, must be revised to address the nonlinear causal relationships of delays in airport networks. So, this paper proposes a causality mining method for delay propagation in airport networks based on partial correlation-based multivariate conditional independence (PCMCI). This method comprehensively considers all airports and causality mining in two stages. The first stage uses conditional independence tests to obtain the parent node set of the target airport, which includes both true and false causal relationships. The second stage employs instantaneous conditional independence tests to eliminate false causal relationships and obtain test statistics representing the strength of causality. Based on historical delay data from US airports over a year, the experimental results show that multiple factors cause delay propagation in airport networks rather than a single causal relationship. The scope of delay propagation is limited, mainly affecting a few airports closely connected to it. Delays at airports with small flight volumes are more likely to propagate. Few airport pairs in the network mutually propagate delays and, often, delays at airports affected by a particular airport’s delay also exhibit causal relationships with each other. This method provides a new perspective for deepening the understanding of delay propagation mechanisms in airport networks.
1. Introduction
The rapid development of the civil aviation industry has posed more scheduling and operational challenges for airlines and airports, resulting in increasingly severe flight delays. The problem of flight delays has become a global challenge. Flight delays have a multifaceted impact on the entire civil aviation industry, including economic, passenger, and safety aspects. Economically, flight delays hurt airlines and related businesses, as airlines need to pay additional costs for delayed and canceled flights. From the passenger’s perspective, flight delays affect the travel and plans of passengers. Passengers may need to change their itineraries, cancel reservations, or delay their travel plans, which can cause them to lose time and money, and experience mental stress. From a safety perspective, if airlines neglect maintenance and inspections due to delays and try to catch up with schedules, this may lead to mechanical failures and safety issues. To effectively address the problem of flight delays, researchers have conducted extensive studies on flight delays [1,2,3], including estimating delay probability distributions [4,5,6], predicting delays [7,8,9,10], and optimizing flight schedules [11,12,13,14]. However, flight delays are a complex problem, and flight delays may vary in different regions and periods. Therefore, studying flight delays has always been of great significance and a challenge.
Flight delays can have multiple causes, including weather, airport operations, airline operations, mechanical failures, and staff shortages. Flight delays are prone to causing delay propagation because flights are usually scheduled according to a timetable, and air routes connect airports. The operation of flights is interrelated, and the delay of one flight may affect the regular operation of other flights. Subsequent flights may be delayed or canceled, and this chain reaction may trigger delays across the entire airport network. Therefore, studying the mechanisms and patterns of flight delay propagation can help to better understand the nature and impacts of flight delays, significantly reducing and improving flight operation efficiency.
Researchers have extensively researched delay propagation, including modeling delay propagation, reducing delay propagation, and investigating causal relationships in delay propagation through complex network analysis [15,16,17]. Most researchers have constructed agent-based data-driven models to simulate the process of delay propagation. The TREE project (data-driven modeling of reactive delay diffusion trees within the European Civil Aviation Conference (ECAC) region) aims to characterize and predict the propagation of reactive delays in the European network. Ciruelos et al. [18] developed an agent-based data-driven model that simulates the propagation of reactive delays in the ECAC region by simulating the connectivity between aircraft, passenger connections, crew rotations, and airport congestion. Fleurquin et al. [19] developed an agent-based data-driven model based on aircraft to simulate the propagation of delays in the US air transportation system network. The model simulates three sub-processes: aircraft flights, connectivity between passengers and crew, and airport congestion. The latter two processes are independent and can be adjusted as needed to understand their role in delay propagation. The simulations have shown that the connectivity between passengers and crew is the most effective single mechanism leading to network congestion.
Based on these findings, Fleurquin et al. [20] extended the application of the model to understand the system’s response to large-scale disturbances, such as the impact of severe weather on delay propagation. They provided tools for assessing strategies to handle these disruptions. Later, Campanelli et al. [15] compared the delay propagation caused by scheduling failures or disruptions in the US and European air traffic networks. They developed two agent-based models, one based on first-come-first-serve principles for the US and one based on ATFM (Air Traffic Flow Management) slot prioritization for Europe. The comparison revealed that flight management based on first-come-first-serve principles leads to more significant delays. Baspinar et al. [21] constructed two different data-driven epidemic models to approximate the delay propagation process and understand the propagation behavior of delays at various levels in the network. One model is based on flights, focusing on each flight, while the other model is based on airports, allowing for collective behavior definition and considering interactions between flights.
Liu et al. [22] argued that arrival flight delays can propagate to departure flights, causing delay propagation at hub airports. Quantitatively simulating the amount of departure delay propagation is equivalent to the difference between the delays of the preceding arrival flights and the absorption of turnaround time delays. The absorption of turnaround time delays is the difference between the planned and accurate turnaround times. Therefore, delay propagation is reduced when the actual turnaround time is less than or equal to the planned turnaround time. In contrast, delay propagation is exacerbated when the exact turnaround time exceeds the planned turnaround time. However, the actual turnaround time is more significant in practice than the planned one. Pyrgiotis et al. [23] constructed an approximate network delay model having two parts. The first part is a stochastic dynamic queuing model that calculates delays at each airport, and the second part is a delay propagation algorithm that considers the connectivity between flights and propagates delays to downstream airports. The delay propagation algorithm focuses on four aspects: determining whether delays propagate downstream, calculating delay propagation between consecutive flights operated by the same aircraft, updating the flight schedules for all airports in the local delay update model obtained from the stochastic dynamic queuing model, including arrival and departure times, and updating the demand rate per hour for each airport. Wu et al. [24] added a link transmission model between the queuing model and the delay propagation algorithm to calculate delays in various sectors and convert all airborne delays into ground delays. They developed a model suitable for airport–airspace network delay analysis.
Researchers have studied the delay propagation causality in airport network systems in recent years to deepen their understanding of the mechanisms involved [25]. They represent airports as nodes and flights as edges, constructing complex networks to represent the aviation network. When delay propagation is detected, arcs connect the nodes [26]. Wu et al. [27] overcame the limitations of the Delay Propagation Tree (DPT) model by introducing Bayesian networks into the DPT framework, creating the DPT-BN model. In this model, each node represents a flight, and each arc represents the connection between two nodes in the flight network. Therefore, the collective set of nodes represents a flight network where each flight connects to other flights through arcs representing the connections of aircraft, crew, and passengers. Li Juan [28] employed the Convergent Cross Mapping (CCM) method to uncover causal relationships in airport delay propagation. Using historical operational data from airports, Li constructed a delay time series and established a spatial state model to analyze the causal relationships among variables in a nonlinear system. Dai et al. [29] modeled the delay propagation process as a complex undirected dynamic network. Each node has an equal weight, and the weight of each connection is assigned based on the strength of the connection, which can be described as the sum of shared resources. If two flights share three resources, such as the departure time, runway, and taxiway, the connection strength should be stronger than that for flights sharing two or more resources. These models capture the propagation process and the factors influencing the clustering of delays.
However, delay propagation networks are directed graphs, and undirected graphs cannot represent the causal relationships of delay propagation. Zanin et al. [30] reconstructed a complex network representing delay propagation by constructing a delay time series and using the Granger causality test to study whether there is delay propagation between each pair of airports. Then, standard network metrics, including connection density, transitivity, assortativity, efficiency, diameter, and information content, were used to investigate specific delay characteristics and the presence of significant airports causing severe delay propagation. However, the traditional Granger causality test method cannot address nonlinear causal relationships. Jia et al. [31] proposed an improved nonlinear Granger causality approach to construct a delay propagation network among airports to tackle this issue. Du et al. [32] analyzed the complexity of delay propagation networks using degree, reciprocity parameter, clustering coefficient, maximum connected clusters, and community type. Zhang et al. [33] examined the interdependence of delay time series between each pair of airports using the transfer entropy measure. They quantified the impact of delay propagation between airports using propagation indicators. Sun et al. [34] addressed the critical issues of spatiotemporal dependence and propagation relationships. They utilized the Second-Order Modified Transfer Entropy (SMTE) principle to construct a causal relationship knowledge rule-expanded graph convolutional network to guide the construction of the airport delay propagation network.
The approaches above, whether using Granger causality or transfer entropy, are primarily limited to bivariate analysis, which can lead to spurious correlations and cannot explain indirect connections or common driving factors. Additionally, transfer entropy cannot handle non-stationary time series, resulting in fragile causal network estimations and causal effects. Introducing multiple variables can address this issue. However, introducing too many variables increases dimensionality and decreases dependent variables’ effect size (such as partial correlation coefficients). These factors lead to reduced detection power and a reduced ability to correctly detect causal relationships. They can also lead to false positive causal relationships by mistakenly treating correlations as causal relationships. Current machine learning algorithms do not provide any safeguards to prevent mistaking correlations for causal relationships, and the consequences of mistaking correlations for causal relationships can be severe.
This paper studies the complex nonlinear delay propagation relationship of airport network systems based on the framework of graphical causal models. From the perspective of causal relationships in airport delay time series, the problem of delay propagation is considered. At the same time, multiple airports are considered, and delay time series with solid autocorrelation characteristics are processed. Large delay time series datasets of airports with linear, nonlinear, and time-delay dependencies are expanded to explore causal relationships based on lag time. Using the PCMCI algorithm, which considers both “error-detected causal relationships” and “undetected causal relationships”, the model has more robust detection capabilities. Then, based on causal relationships, a directed network for delay propagation is constructed to analyze the characteristics of delay propagation and quantitatively describe the degree and scope of delay impact between airports. Using complex network theory, the delay propagation in airport networks from the perspectives of in-degree and out-degree is further described.
The organization of this paper is as follows: Section 2 introduces the PCMCI algorithm for mining causal relationships in delay propagation and the construction of the delay propagation-directed network. Section 3 focuses on the US airport network system as the research subject and analyzes the mechanisms of delay propagation within the airport network through experiments. Section 4 provides a summary of the paper and offers prospects for research.
2. Problem Formulation
A causal relationship is an objective correlation between “cause” events and “effect” events, and “cause” events are the reasons that lead to “effect” events. The causal relationship mining of airport network delay propagation is undertaken to reveal the interaction of airport flight delays, thereby identifying some key airports that cause delays and propagating them to the next airport. So, if a delay occurs at one airport, leading to a delay at another, there is a causal relationship between the two airports.
Identifying the causal relationship of delays in airport networks is challenging in scientific research. In actual operation, many reasons cause airport flight delays and collecting delayed data makes it difficult to obtain complete and adequate data. However, considering the emergence of these factors, they are ultimately feedback on the delay value of the airport. Therefore, by mining causal relationships through the time series of airport flight delays, we can capture the characteristics of airport flight delay propagation. Assuming there are airports in the airport network, represents a set of airports, where represents the delay time series of airports i, to discover causal relationships between time series in the airport set . A directed causal graph is constructed to effectively represent the causal relationship between airports, as shown in Figure 1, with vertices representing the time series of airport delays and directed edges indicating the existence of causal relationships. Therefore, if there is a real causal relationship between airports, there is an edge pointing towards j. The set represents the weight of the edges, where represents the weight of the edges , i.e., the degree of delay impact of airport i on airport j.
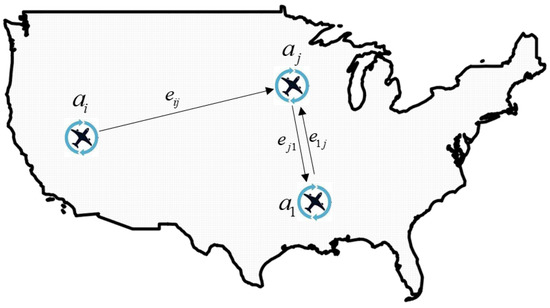
Figure 1.
Schematic diagram of causal relationship network for airport delay propagation.
3. Methodology
Figure 2 shows the diagram of causal relationship mining for airport delay propagation. Firstly, the delay time series is constructed based on the airport’s historical operational data. Then, the PCMCI algorithm is established, which includes two stages. In the first stage, a connectivity graph connects all pairs of time series nodes with directed edges. Then, the PC1 algorithm minimizes excess variables in the condition set as much as possible to obtain an initial set of parent nodes. This set not only contains actual parent nodes but also false parent nodes. The PC1 algorithm is based on the PC-stable algorithm for Markov blanket discovery. The parent node represents the “cause” airport that caused the delay at the target airport. In the second stage, the father variable set obtained in the first stage is tested using MCI (momentary conditional independence) to remove false causal relationships among highly interdependent time series variables and get an accurate time series causal diagram.
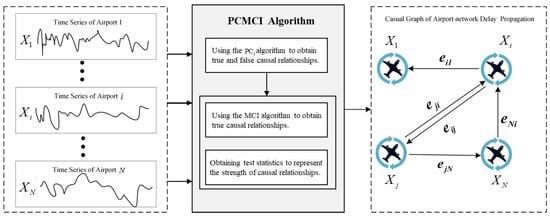
Figure 2.
Conceptual diagram of mining causal relationships in airport delay propagation.
Additionally, we use obtained test statistics to represent the strength of observed causal relationships. The larger the specific value of the test statistic, the stronger the causal relationship between variables. Finally, a directed graph of the causal relationship of airport network delay propagation is constructed based on the causal relationship.
3.1. Delay Time Series
This article utilizes delay time series to represent the punctuality performance of airports, focusing on daily time series as it provides the finest temporal resolution within flight datasets. Researchers typically divide time intervals into 15 min and 60 min increments [23,30]. For airport i, this paper uses a time step of 15 min to divide a day into 96 time intervals to construct its delay time series , , represents the average delay for the first time interval and is defined as:
In this case, represents the total delay of departing flights at airport i during the time interval , represents the number of flights canceled during the time interval , and represents the total number of scheduled departing flights during the time interval . Traditional methods do not take into account flight cancellations. However, in extreme situations, not considering flight cancellations may lead to deviations in airport operations. Cancellations should be regarded as delay indicators for evaluating the performance of the aviation transport system [35]. According to regulations from the Federal Aviation Administration (FAA), the Civil Aviation Administration of China (CAAC), and the European Aviation Safety Agency (EASA), the variable m can represent the equivalent delay time for cancellations (m = 180 min).
3.2. PCMCI Algorithm
Constrained-based methods are a class of approaches that identify causal relationships by testing the conditional independence between variables. Constrained-based time series methods are typically an extended version of non-time series causal graph discovery algorithms. The time precedence constraint reduces the search space of causal structures [36]. The PC (Peter–Clark) algorithm belongs to the widely used class of constrained-based methods in non-time series algorithms, and it has a time series version called PCMCI [37]. The core module of constrained-based methods is the test of conditional independence, which is essential for effectively handling various scenarios and types of data. Its advantage lies in its general applicability, but its drawback is the strong assumption of faithfulness and the potential requirement of a large sample size for reliable conditional independence testing. In this experiment, a large amount of historical operational data from multiple airports was available, which allowed this study to overcome some of the limitations associated with conditional independence testing. By utilizing these data, the study can more accurately assess the conditional independence between airports and conduct a causal relationship analysis.
PCMCI is a causal graph analysis method specifically designed for time series variables. It effectively handles high-dimensional datasets with linear and nonlinear relationships and time-delay correlations [37]. Compared to traditional regression-based causal discovery methods, PCMCI can adjust for irrelevant variables, resulting in increased statistical measures of correlation between two variables with a genuine causal relationship, which improves the algorithm’s ability to identify causal relationships.
Considering a system with time series of length , where , the set of parent variables for any variable at time is defined as:
where represents the maximum delay time. Figure 3 illustrates the parent variables for four time series, with a maximum delay time of . Each variable has a set of 16 parent variables (shown in gray boxes).
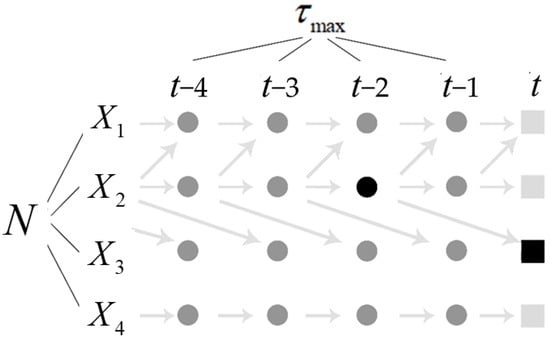
Figure 3.
Illustration of parent variables.
The PCMCI algorithm obtains causal relationships of airport network delay propagation through two stages:
Stage 1: For any variable , the conditional algorithm selects the set of parent variables , filtered to obtain the more robust correlated parent variables . The algorithm is a Markov blanket discovery algorithm based on the PC-stable algorithm. It iteratively removes irrelevant conditions for each variable among the N variables through independent conditional independence tests. The algorithm follows the following approach: For any variable , the parent variable set is initially initialized as . In the first iteration (), an unconditional independence test is used to remove variables from that do not satisfy the following null hypothesis: if the null hypothesis is not rejected at the significance level , where represents (conditional) independence, in each subsequent iteration , the parent variables from the previous iteration are sorted based on the test statistics, and a conditional independence test is performed, where is the top parent variables with the most significant test statistics . After each iteration, the independent parent variables are removed from , and if there are no more conditions to test, the algorithm converges. For detailed steps of the algorithm, please refer to reference [37].
In the first stage, the Algorithm 1 iteratively removes variables from a set of M variables unrelated to the target variable based on independent tests of independence. This process obtains the initial parent nodes for each variable at each time slot, including both genuine and spurious parent nodes.
| Algorithm 1. First stage |
| Input: A set of time series , the target airport delay time series Output: The parent set of the target airport delay time series Parameters: Delay lag duration , significance level α, conditional independence test function F, length of the conditioning set = 1. Function F(X, Y, Z) % Conditional independence test function Null hypothesis Return p-value and test statistic Step 1: Initialize the parent set , and set the number of parent nodes of the target variable to L = 0, ε = 0. When L = 0, it is an unconditional independence test. Step 2: For each parent node in the parent set, obtain the p-value and test statistic based on the conditional independence test function. If . If the p-value is more significant than the significance level , and sort the parent nodes based on the test statistic , where . . |
The delay lag duration indicates that the delay of airport j in the t time slot is primarily influenced by the delay of airport i in the time slot, and there is limited significance in considering time slots further back.
Stage 2: The second stage involves testing the parent variable set obtained in the first stage using momentary conditional independence (MCI) to remove spurious causal relationships among time series variables that exhibit high mutual dependence, resulting in the identification of the actual causal graph for the time series. To perform conditional independence tests on the causal pair , the conditioning set for the MCI algorithm is defined as , which is obtained by removing and the parent variable set from the parent variable set of . Thus, the conditional independence test in the second stage is as follows:
The MCI algorithm effectively suppresses spurious causal relationships caused by autocorrelation in limited samples by adding the parent variable set of to the conditioning set. It has been proven to have more considerable statistical power than the complete conditional independence algorithm and has a significantly smaller conditional dimension. The specific Algorithm 2 is as follows:
| Algorithm 2. Second stage |
| obtained in the first stage. Output: p-value and test statistic . Parameters: delay lag , h (the number of parent nodes for the dependent variable). For all causal relationships , perform momentary conditional independence tests. If the p-value is more significant than the significance level from the parent node set of Return the p-value and test statistic . |
The proposed airport network delay propagation causal relationship mining method based on PCMCI has the following characteristics:
- It can effectively distinguish between correlation and causation. When mining the causal relationships in delay propagation, it is essential to note that correlation does not imply causation. Correlation refers to the relationship between two variables, where when one variable changes, the other variable also changes accordingly. The correlation between two variables does not necessarily mean that one variable is the reason for the other. For example, measuring the annual income and happiness of 30 people, it was found that people with higher annual incomes are happier. However, since factors that may affect happiness beyond yearly income (such as age and personality) have yet to be excluded or controlled for, it is not possible to believe that there is a causal relationship between annual income and happiness. If controlling for other factors such as age and personality that affect happiness, only yearly income is the dependent variable, and it is found that people with higher annual income are happier, then it can be explained that people feel so glad because they have higher incomes. Causal relationships involve causal chains and time order, where one event or variable occurs before another, and there is sufficient evidence to suggest that the former is the cause of the latter. By combining partial correlation coefficients and conditional independence tests, the PCMCI algorithm can distinguish between correlation and causation. If two variables exhibit strong correlations but are determined to be conditionally independent in the conditional independence test, it can be inferred that their relationship is correlational rather than causal. Conversely, suppose two variables show significant conditional dependence. In that case, they are determined to be not conditionally independent in the conditional independence test; it can be inferred that there is a causal relationship between them.
- It effectively distinguishes between direct and indirect causal relationships. From the perspective of air traffic managers, using direct causal relationships to guide traffic control is more intuitive and easier to implement than indirect causal relationships. Therefore, this paper primarily focuses on the direct causal relationships in airport delay propagation without considering the indirect effects of delay propagation on subsequent airports. Figure 4 shows the direct and indirect causal relationships of airport delay propagation. Direct causal relationships refer to the situation where the delay at Airport A is a direct cause, and the delay at Airport B is a direct result, without interference or influence from other airports. Indirect causal relationships refer to the situation where the delay at Airport A causes the delay at Airport C, ultimately leading to the delay at Airport B. The PCMCI algorithm can consider the relationships between multiple variables simultaneously, that is, considering the delay time series of all airports simultaneously. It better distinguishes between direct and indirect causal relationships, overcoming the limitation of the Granger causality test that only considers two variables and characterizes the deeper nonlinear relationships among airports.
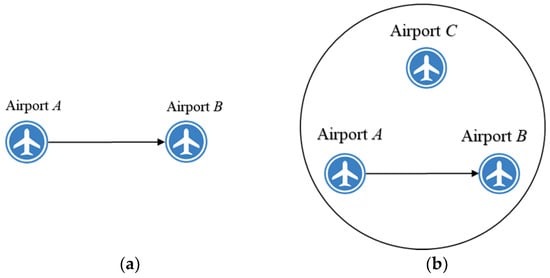 Figure 4. Direct and indirect causal relationships of airport delay propagation: (a) causal relationship; (b) indirect causal relationship.
- 3.
- It can quantify the impact of the “cause” airport on the “effect” airport. The PCMCI algorithm calculates test statistics through the momentary conditional independence tests in the second stage, representing the strength of the causal relationships. We can quantitatively describe the extent and scope of delay propagation between airports by analyzing the edge weights in the directed causal network. This helps to understand the intensity of delay propagation between different airports and to identify critical airports and propagation paths.
4. Case Study
This section analyzes the causal relationship network of delay propagation in US airports using the proposed model in this paper. Firstly, the data are described, including preprocessing. Experiments were conducted, and the parameters involved in the model are discussed here. Finally, the performance of the causal relationship network was analyzed, and the topological properties were examined using complex network metrics.
4.1. Data and Preprocessing
This study employed a case analysis utilizing flight historical operational data from 339 airports in the United States, as illustrated in Figure 5, spanning from 25 March 2018, to 30 March 2019. The data were obtained from the Bureau of Transportation Statistics “https://www.transtats.bts.gov/DL_SelectFields.asp?Table_ID=236” (accessed on 2 March 2023). Each data entry includes attributes such as the operating day, departure airport, arrival airport, scheduled departure time, actual departure time, scheduled arrival time, actual arrival time, and whether the flight was canceled. Based on the planned and exact departure times, flights that departed earlier than expected have a delay time of 0. In contrast, flights with delays exceeding 180 min have a delay time of 180 min. Flights that were canceled at each airport were removed from the dataset, as canceled flights only result in wasted resources for the associated airports and do not contribute to delay propagation in the airport network. When the time interval was 60 min, each day was divided into 24 periods. The average departure delay for each airport during each period was calculated over 371 days. We used this information to construct a delay time series of length 371 × 24 for each airport, representing the delay characteristics of the airport. These delay time series for each airport were used as input data to train the predictive model.
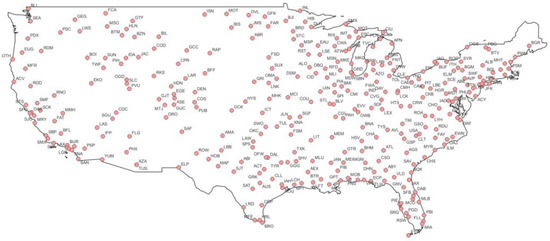
Figure 5.
Geographical distribution of the 339 airports in the United States.
4.2. Model Parameters
The parameters involved in the causal relationship mining method in this paper mainly include the delay lag duration in the first stage, the significance level , and the maximum length of the dependent variable’s parent nodes h in the second stage.
The delay lag duration indicates that the delay at airport j in the t time slot is influenced by the delay at airport i in the time slot. Beyond a specific time slot, the delay has little impact. Typically, a delay at one airport causes delays at another airport after a lag of 2–3 h. A more significant value of leads to more identified causal relationships. This paper selects as 6 h to capture all the actual causal relationships.
should not be considered solely as the significance level in the first stage, as iterative hypothesis testing does not allow for precise assessment of uncertainty at this stage. In this context, plays a role as a regularization parameter, as it enables the adaptive convergence of the tests. This ensures that the first stage obtains authentic causal relationships while keeping the number of causal relationships low, reducing the estimation dimension in the second stage and improving efficiency.
Figure 6 depicts a line graph showing the variation in the number of causal relationships obtained in the first stage as changes. These causal relationships include both true causal relationships and spurious ones. The graph shows that when is set to 1, all initial parent nodes are retained, and none of the dependent variables are removed. Therefore, in the case of 339 airports, there are a total of 339 × 339 causal relationship pairs. Before reducing to 0.7, the number of causal relationship pairs decreases rapidly. After reaching 0.7, further reduction in leads to a slower decline in the number of causal relationship pairs. We can observe that setting too small may result in removing authentic causal relationships. Conversely, setting too large may result in a significant presence of spurious causal relationships, leading to increased runtime in the second testing stage and decreased efficiency.
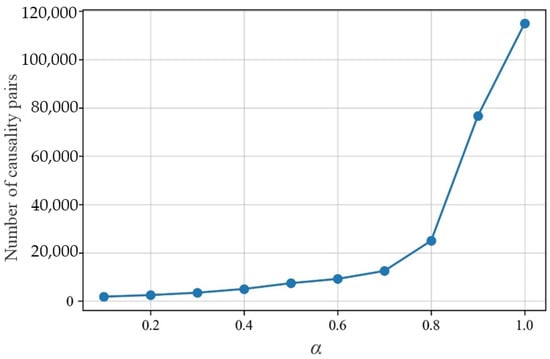
Figure 6.
The relationship between the significance level and the number of causality pairs.
To eliminate spurious causal relationships and improve the computational efficiency in the second stage, limiting the number of parent nodes h for the dependent variables is crucial. Figure 7a presents a bar graph showing the variation in the number of true causal relationship pairs with changes in and h values. When h = 1, the number of true causal relationship pairs is equal to the potential causal relationship pairs shown in Figure 6. For any given h value, the number of true causal relationship pairs decreases as the value increases. Authentic causal relationships are validated based on instantaneous conditional independence tests using the causal relationship pairs obtained from the first stage. Similarly, for any given value, the number of valid causal relationship pairs decreases as the h value increases.
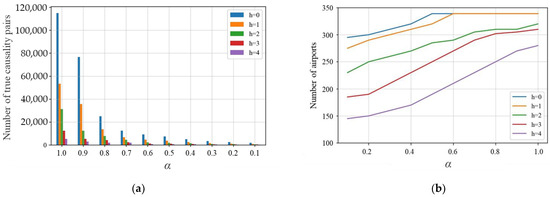
Figure 7.
The relationship between the value and h value and the number of authentic causal relationships and the number of airports: (a) the relationship between the value , h value, and the number of authentic causal relationships; (b) the relationship between the value , h value, and the number of airports.
Figure 7b displays a line graph illustrating the variation in the number of airports with changes in the and h values. For any given h value, the number of airports increases as the value increases. When is between 0.6 and 1, or when h is 0 or 1, the number of airports includes all the airports. When h is 2, the number of airports decreases slowly, but when h is 3 and 4, the number of airports decreases significantly. Additionally, when h is 0 or 1, the number of airports declines after the value goes below 0.5. When h is 2, the number of airports decreases after the value goes below 0.7. As the h value increases, the number of airports decreases earlier with changes in the value, indicating that the valid causal relationship pairs are more sensitive to the value. Combining Figure 7a,b, setting the value to 0.3 and h value to 3 would obtain a sufficient number of valid causal relationship pairs and reduce spurious causal relationships caused by solid autocorrelation. At this point, the number of authentic causal relationships and the number of involved airports are conducive to making decisions for the airports.
4.3. Performance Analysis
Suppose a delay at one airport leads to a delay at another airport. In that case, the two airports are connected to establish a network graph of delay causality, allowing for the analysis of airport delay propagation performance.
Figure 8a is a directed network graph of causal relationships among domestic airports in the United States, obtained based on the model parameters from the previous section. It consists of 307 nodes and 1462 edges. Nodes represent domestic airports in the United States, with larger nodes indicating airports with more severe delays. Directed edges represent causal relationships between two airports, with the airport experiencing delays pointing towards the airport it affects. The color of the edges represents the strength of the causal relationship, with darker shades indicating more robust relationships. The strength of the causal relationship is measured by the second-stage instantaneous conditional independence test statistic , representing the credibility of the causal relationship between the two airports. A higher strength indicates a greater credibility of a causal relationship between the airports. There are 1204 directed edges with a strength between 1.50 and 1.99, 239 directed edges with a strength between 1.99 and 2.58, and 19 directed edges with a strength between 2.58 and 3.16. The number of directed edges with a strength greater than 1.99 is significantly smaller than those with less than 1.99. This is because delays at one airport are rarely solely caused by delays at another airport but are somewhat influenced by various factors such as weather conditions and airlines. Among the 19 edges with the highest strength, RAP and CHS led to delays at several other airports. The delays at RAP result in delays at five different airports, while the delays at CHS result in delays at four other airports. On average, RAP has 14 departing flights per day, and CHS has 67 departing flights per day, which is much smaller than the average maximum daily departing flight volume of 1096. This indicates that smaller airports with lower flight volumes are more likely to affect delays at other airports.
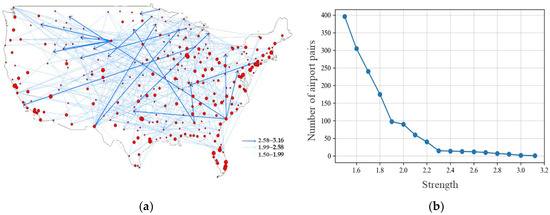
Figure 8.
Causal relationship network diagram of airport delays in the United States: (a) causal relationship network diagram; (b) strength distribution.
Figure 8b is a bar graph that further breaks down the number of edges corresponding to different strengths of causal relationships. It counts the number of causal relationship pairs within each interval of strengths ranging from 1.5 to 3.2, with a step size of 0.1. The interval with the highest number of edges is between 1.5 and 1.6, with 396 edges. As the strength increases, the number of causal relationship pairs decreases. The number of edges with a strength between 1.9 and 2 is almost equal to those between 2 and 2.1. There is only one edge with a strength between 3.1 and 3.2.
4.4. Topological Properties
In addition to performance analysis, this section conducts a topological analysis of the directed graph of causal relationships. This includes analyzing the degree distribution, the relationship between in-degree and out-degree for each airport, the relationship between degree and flight volume, the relationship between degree and average delay, and other complex network metrics.
The degree of a node is an important measure used to characterize the structure of a complex network, representing the number of edges connected to that node. In the causal relationship network studied in this paper, a directed graph shows that the degree includes in-degree and out-degree. This study discusses the distribution of in-degrees and out-degrees in the network, analyzing how many other airports’ delays affect the delay at a particular airport (in-degree), as well as how many other airports’ delays are influenced by the delay at that airport (out-degree).
Figure 9a presents a box plot illustrating the distribution of in-degree, out-degree, and degree for airports in the network. The degree of an airport is equal to the sum of its in-degree and out-degree. The average in-degree is equal to the average out-degree, which is 5.66, indicating that, on average, an airport is influenced by delays from approximately six other airports and also influences delays at approximately six other airports. For in-degree, the minimum value is 0, indicating that delays at other airports do not cause delays at these airports but are rather due to internal factors such as weather conditions. Most airports have in-degree values ranging from 2 to 7, suggesting that although delays at other airports influence them, they are not affected by many other airports (the number of influencing airports is not excessively high). The maximum in-degree value for an airport is 28, which corresponds to Grand Forks International Airport (GFK). This airport has an average daily departure volume of 6 flights, indicating that smaller airports with lower flight volumes are more likely to be influenced by delays from multiple other airports. For out-degree, the minimum value is also 0, indicating that delays at these airports do not impact delays at other airports. Except for Rapid City Regional Airport (RAP), which has an out-degree value of 105 and impacts a significant number of airports, 75% of airports have out-degree values of 7 or below, suggesting that they only affect delays at the airports they are most closely connected to.
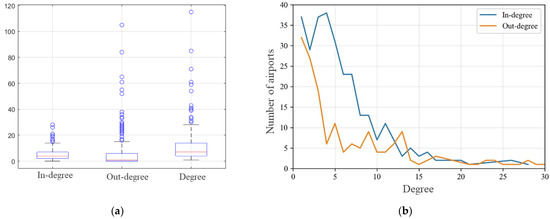
Figure 9.
The distribution of airport degrees: (a) airport degrees; (b) the relationship between degree and airports’ number.
Figure 9a shows that the maximum in-degree value is 28. To compare the similarities and differences in the number of airports when the in-degree and out-degree values are equal, Figure 9b displays a line graph showing the number of airports with degree values ranging from 1 to 30 within the entire causal relationship network. There are 37 airports with an in-degree of 1 and 32 airports with an out-degree of 1. However, the number of airports decreases as the degree value exceeds 20. The number of airports decreases as the in-degree and out-degree increase. When the in-degree and out-degree have the same value less than 12, the number of airports with in-degrees is smaller than those with out-degrees. Mainly, when the in-degree and out-degree values are 4, there is a difference of 32 airports. When the in-degree and out-degree have the same value greater than 17, the number of airports is almost the same. This indicates that delays at many other airports do not significantly influence delays at airports, and they also do not affect a large number of different airports.
Figure 10 is a scatter plot depicting the relationship between in-degree and out-degree for each airport in this experiment. The airport with the highest out-degree, identified as RAP in Experiment 1, does not have the highest in-degree. Conversely, the airport with the highest in-degree has an out-degree of 0. There are airports with out-degrees greater than 40 but in-degrees smaller than 10, and airports with in-degrees larger than 15 but very small out-degrees. Most airports have in-degrees ranging from 0 to 15 and out-degrees ranging from 0 to 20.
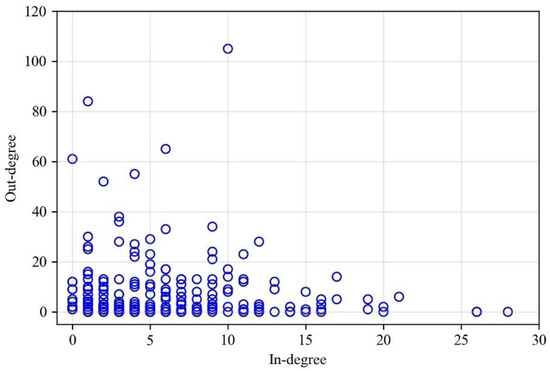
Figure 10.
The relationship between in-degree and out-degree of airports.
Figure 11a displays the relationship between the average daily departure volume and degree, which represents how many airport delays affect the delays generated by airports with different flight volumes and how many airports are affected by the delays at these airports. There are five airports with shallow flight volumes but high out-degrees, and four with very high flight volumes but low in-degrees. Most airports generally have a departure volume ranging from 0 to 100, with in-degrees and out-degrees ranging from 0 to 20. These airports are more susceptible to being influenced by delays from other airports, and they also have the potential to affect delays at different airports. Airports with a departure volume exceeding 100 tend to have low in-degrees, indicating that they are less likely to be influenced by other airports and have a solid capacity to absorb delays. The average out-degree value is approximately 10, indicating that, on average, each airport is likely to affect ten other airports. From this analysis, it can be observed that the airports with the smallest flight volumes have the highest out-degrees and in-degrees.
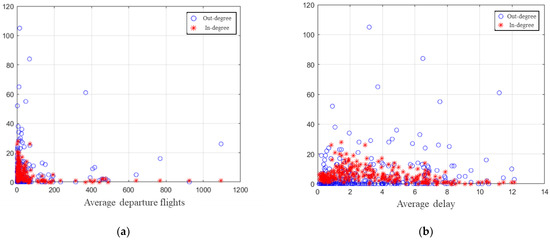
Figure 11.
The relationship between degree and departure flight volume, as well as average delay: (a) the relationship between degree and average departure flights; (b) the relationship between degree and average delay.
Figure 11b shows the relationship between the average departure delay at each airport and its degree value. The relationship between airport delay levels and in-degree values is similar to that between flight volume and in-degree values. Airports with smaller average delay times are more likely to be influenced by delays from other airports. There is no clear relationship between an airport’s delay causing delays at different airports and its average delay time, but most out-degree values are below 10.
In addition to airport degree, this experiment also utilized complex network metrics such as connectivity density, interaction parameter, and clustering coefficient to describe the causal relationship network and analyze the characteristics of airport delay propagation. Table 1 provides the corresponding values for different metrics.

Table 1.
The values of network metrics for measuring the propagation of delays in the causal relationship network.
The connectivity density represents the degree of tightness in network connections and is defined as the ratio between the number of edges in the network and the maximum possible number of edges among all nodes. Its value ranges within . A higher value of connectivity density indicates a tighter network connection, making delay propagation easier within the network. The connectivity density of this causal relationship network is 0.0155, which is influenced by the parameter selection in Section 4.2. This relatively low connectivity density interrupts delay propagation within the airport network through specific measures. The interaction parameter indicates whether delay propagation between airports has bidirectional effects. It represents the influence of delay at airport i on airport j and vice versa. The interaction parameter is calculated using the method provided in reference [32] by generating 1000 randomly generated networks with the same number of nodes and edges using network randomization techniques, and the average interaction parameter is 0.17. In comparison, the interaction parameter in the causal relationship network is a much smaller value of , indicating very few pairs of airports where delays mutually affect each other. When one airport’s delay causes delays at different airports, those other airports are considered neighbors. The ratio of actual causal relationships between existing neighbor airports and the possible causal relationships is known as the clustering coefficient, which reflects the clustering tendency of airports. For directed networks, the clustering coefficient is calculated using the method provided in reference [32]. The overall clustering coefficient of this causal relationship network is 0.1405, which is higher than the clustering coefficient of random networks (0.092). This indicates a clustering tendency among airports in the delay causal relationship network, where airports affected by a delay at one airport often have delay causal relationships with each other.
4.5. Discussion
This article adopts the PCMCI algorithm, which has practical feasibility in exploring the causal relationship of delay propagation in the US airport network. As a complex system, airport networks often exhibit nonlinear delay relationships, which traditional linear causal relationship mining methods often cannot accurately capture. The PCMCI algorithm can improve the accuracy of causal relationships in airport network delay propagation by using nonlinear independence testing methods. In addition, the PCMCI algorithm requires a large amount of data support for accuracy requirements. This article uses 371 days of historical operating data from 339 airports in the United States for testing, and the amount of data is quite abundant, which can significantly improve the accuracy of the causal relationships mined. Usually, large-scale datasets lead to low computational efficiency. However, the PCMCI algorithm overcomes this drawback by optimizing algorithm design and adopting efficient data structures. When processing large-scale airport network data, the PCMCI algorithm can complete causal relationship mining tasks relatively quickly, which is beneficial for the impact of multiple model parameters on causal relationships, as shown in Section 4.2. This allows us to adjust and explore different model parameters more flexibly and conduct an in-depth analysis of causal relationships.
The experiments conducted on accurate historical flight operation data from US airports demonstrate that the PCMCI algorithm can successfully mine causal relationships in the delay propagation of airport networks and quantify causal strengths. Therefore, the PCMCI algorithm is a promising approach that can assist airlines and airport managers identify the main propagation paths and key node of delays. This, in turn, enables the development of more effective delay management strategies and proactive measures to mitigate the impact of delay propagation. While this paper focused on utilizing the PCMCI algorithm to uncover causal relationships in airport network delay propagation, constraint-based methods can also be applied in other domains. For instance, they can be employed in the financial sector to explore causal relationships between different assets in financial markets or the healthcare domain to investigate the causal relationships between disease transmission and epidemics.
5. Conclusions
The rapid increase in flight volume has led to increasingly severe flight delays. Delays at preceding airports can propagate to subsequent airports, making it crucial to explore causal relationships in the network of airport delay propagation. This paper proposes a method based on the PCMCI algorithm to mine causal relationships in the airport network for delay propagation. This method efficiently handles many nonlinear delay data in airports, considering all airports and removing spurious and indirect causal relationships. The process is tested on accurate historical flight operation data from the United States. The results indicate that, on average, a delay at one airport causes delays at six other airports, and the extent of delay impact varies across airports. Delays are more likely to propagate to smaller airports, airports with lower flight volumes, and airports with moderate delay situations, which then propagate delays to other airports.
Additionally, we found that airports more prone to causing delays in other airports are not necessarily heavily influenced by delays from many different airports, and vice versa. The density of connections in the causal relationship network reveals that the ability of airport network delay propagation is not highly robust, and delay propagation can be easily disrupted. Small airports with lower flight volumes can take measures to mitigate delay propagation, based on the findings of this study.
One limitation of this study is that we did not calculate the delay propagation time. In an airport network, the delay at one airport propagates to other airports after a certain period, and there are different time delays in delay propagation. The PCMCI algorithm cannot accurately capture these time delays and variations in propagation paths, which restricts a comprehensive understanding of causal relationships in delay propagation. The PCMCI algorithm uses a fixed time window to analyze time series data, and the time resolution is limited. Smaller time steps can improve the time resolution but also increase computational complexity. Future research will employ new techniques such as dynamic causal models and hybrid models to incorporate the time factor into causal relationship mining to establish more accurate delay propagation models and obtain information about the delay time delays and propagation paths.
Author Contributions
Conceptualization, D.Z. and H.W.; Methodology, D.Z. and H.W.; Investigation, D.Z. and X.T.; Data curation, D.Z. and X.T.; Supervision, H.W.; Validation, D.Z. and X.T.; Writing—original draft preparation, D.Z. and X.T.; Writing—review and editing, D.Z. and H.W. All authors have read and agreed to the published version of the manuscript.
Funding
This work was supported by the National Key R&D Program of China [No. 2022YFB4300905]; the State Key Laboratory of Air Traffic Management System and Technology [No: SKLATM202007].
Data Availability Statement
This study did not report any data.
Acknowledgments
We would like to thank the National Air Traffic Control Flight Flow Management Technology Key Laboratory of Nanjing University of Aeronautics and Astronautics for providing the data used in the model tests described in this paper.
Conflicts of Interest
The authors declare no conflicts of interest.
References
- Wang, N.; Roongnat, C.; Rosenberger, J.M.; Menon, P.K.; Subbarao, K.; Sengupta, P.; Tandale, M.D. Study of time-dependent queuing models of the national airspace system. Comput. Ind. Eng. 2018, 117, 108–120. [Google Scholar] [CrossRef]
- Jiang, Y.; Zografos, K.G. A decision making framework for incorporating fairness in allocating slots at capacity-constrained airports. Transp. Res. Part C Emerg. Technol. 2021, 126, 103039. [Google Scholar] [CrossRef]
- Benlic, U. Heuristic search for allocation of slots at network level. Transp. Res. Part C Emerg. Technol. 2018, 86, 488–509. [Google Scholar] [CrossRef]
- Pérez–Rodríguez, J.V.; Pérez–Sánchez, J.M.; Gómez–Déniz, E. Modelling the asymmetric probabilistic delay of aircraft arrival. J. Air Transp. Manag. 2017, 62, 90–98. [Google Scholar] [CrossRef]
- Lovell, D.J.; Vlachou, K.; Rabbani, T.; Bayen, A. A diffusion approximation to a single airport queue. Transp. Res. Part C Emerg. Technol. 2013, 33, 227–237. [Google Scholar] [CrossRef]
- Cheng, S.; Zhang, Y.; Hao, S.; Liu, R.; Luo, X.; Luo, Q. Study of Flight Departure Delay and Causal Factor Using Spatial Analysis. J. Adv. Transp. 2019, 2019, 1–11. [Google Scholar] [CrossRef]
- Rodríguez-Sanz, Á.; Comendador, F.G.; Valdés, R.A.; Pérez-Castán, J.A. Characterization and prediction of the airport operational saturation. J. Air Transp. Manag. 2018, 69, 147–172. [Google Scholar] [CrossRef]
- Yu, B.; Guo, Z.; Asian, S.; Wang, H.; Chen, G. Flight delay prediction for commercial air transport: A deep learning approach. Transp. Res. Part E Logist. Transp. Rev. 2019, 125, 203–221. [Google Scholar] [CrossRef]
- Arnaldo Scarpel, R.; Pelicioni, L.C. A data analytics approach for anticipating congested days at the São Paulo International Airport. J. Air Transp. Manag. 2018, 72, 1–10. [Google Scholar] [CrossRef]
- Zeng, W.; Li, J.; Quan, Z.; Lu, X.; Tang, J. A Deep Graph-Embedded LSTM Neural Network Approach for Airport Delay Prediction. J. Adv. Transp. 2021, 2021, 1–15. [Google Scholar] [CrossRef]
- Zeng, W.; Ren, Y.; Wei, W.; Yang, Z. A data-driven flight schedule optimization model considering the uncertainty of operational displacement. Comput. Oper. Res. 2021, 133, 105328. [Google Scholar] [CrossRef]
- Katsigiannis, F.A.; Zografos, K.G.; Fairbrother, J. Modelling and solving the airport slot-scheduling problem with multi-objective, multi-level considerations. Transp. Res. Part C Emerg. Technol. 2021, 124, 102914. [Google Scholar] [CrossRef]
- Zografos, K.G.; Salouras, Y.; Madas, M.A. Dealing with the efficient allocation of scarce resources at congested airports. Transp. Res. Part C Emerg. Technol. 2012, 21, 244–256. [Google Scholar] [CrossRef]
- Jiang, H.; Zeng, W.; Wei, W.; Tan, X. A bilevel flight collaborative scheduling model with traffic scenario adaptation: An arrival prior perspective. Comput. Oper. Res. 2024, 161, 106431. [Google Scholar] [CrossRef]
- Campanelli, B.; Fleurquin, P.; Arranz, A.; Etxebarria, I.; Ciruelos, C.; Eguíluz, V.M.; Ramasco, J.J. Comparing the modeling of delay propagation in the US and European air traffic networks. J. Air Transp. Manag. 2016, 56, 12–18. [Google Scholar] [CrossRef]
- Du, W.-B.; Zhou, X.-L.; Lordan, O.; Wang, Z.; Zhao, C.; Zhu, Y.-B. Analysis of the Chinese Airline Network as multi-layer networks. Transp. Res. Part E Logist. Transp. Rev. 2016, 89, 108–116. [Google Scholar] [CrossRef]
- Kafle, N.; Zau, B. Modeling flight delay propagation-A new analytical-econometric approach. Transp. Res. Part B Methodol. 2016, 93, 520–542. [Google Scholar] [CrossRef]
- Ciruelos, C.; Arranz, A.; Etxebarria, I.; Peces, S.; Campanelli, B.; Fleurquin, P.; Eguiluz, V.M.; Ramasco, J.J. Modelling delay propagation trees for scheduled flights. In Proceedings of the 11th USA/EUROPE Air Traffic Management R&D Seminar, Lisbon, Portugal, 23–26 June 2015. [Google Scholar]
- Fleurquin, P.; Ramasco, J.J.; Eguiluz, V.M. Systemic delay propagation in the US airport network. Sci. Rep. 2013, 3, 1159. [Google Scholar] [CrossRef]
- Fleurquin, P.; Ramasco, J.J.; Eguiluz, V.M. Data-driven modeling of systemic delay propagation under severe meteorological conditions. arXiv 2013, arXiv:1308.0438. [Google Scholar]
- Baspinar, B.; Koyuncu, E. A Data-Driven Air Transportation Delay Propagation Model Using Epidemic Process Models. Int. J. Aerosp. Eng. 2016, 2016, 1–11. [Google Scholar] [CrossRef]
- Liu, Y.-J.; Cao, W.-D.; Ma, S. Estimation of Arrival Flight Delay and Delay Propagation in a Busy Hub-Airport. In Proceedings of the 2008 Fourth International Conference on Natural Computation, Jinan, China, 18–20 October 2008; pp. 500–505. [Google Scholar]
- Pyrgiotis, N.; Malone, K.M.; Odoni, A. Modelling delay propagation within an airport network. Transp. Res. Part C Emerg. Technol. 2013, 27, 60–75. [Google Scholar] [CrossRef]
- Wu, Q.; Hu, M.; Ma, X.; Wang, Y.; Cong, W.; Delahaye, D. Modeling flight delay propagation in airport and airspace network. In Proceedings of the 2018 21st International Conference on Intelligent Transportation Systems (ITSC), Maui, HI, USA, 4–7 November 2018. [Google Scholar]
- Kang, J.; Yang, S.; Shan, X.; Bao, J.; Yang, Z. Exploring Delay Propagation Causality in Various Airport Networks with Attention-Weighted Recurrent Graph Convolution Method. Aerospace 2023, 10, 453. [Google Scholar] [CrossRef]
- Fleurquin, P.; Ramasco, J.J.; Eguíluz, V.M. Characterization of delay propagation in the US air-transportation network. Transp. J. 2014, 53, 330–344. [Google Scholar] [CrossRef]
- Wu, C.-L.; Law, K. Modelling the delay propagation effects of multiple resource connections in an airline network using a Bayesian network model. Transp. Res. Part E Logist. Transp. Rev. 2019, 122, 62–77. [Google Scholar] [CrossRef]
- Li, J. Research on Flight Delay Prediction Method Based on Deep Learning; Nanjing University of Aeronautics and Astronautics: Nanjing, China, 2020. [Google Scholar]
- Dai, X.; Hu, M.; Tian, W.; Liu, H. Modeling Congestion Propagation in Multistage Schedule within an Airport Network. J. Adv. Transp. 2018, 2018, 1–11. [Google Scholar] [CrossRef]
- Zanin, M.; Belkoura, S.; Zhu, Y. Network analysis of Chinese air transport delay propagation. Chin. J. Aeronaut. 2017, 30, 491–499. [Google Scholar] [CrossRef]
- Jia, Z.; Cai, X.; Hu, Y.; Ji, J.; Jiao, Z. Delay propagation network in air transport systems based on refined nonlinear Granger causality. Transp. B Transp. Dyn. 2022, 10, 586–598. [Google Scholar] [CrossRef]
- Du, W.-B.; Zhang, M.-Y.; Zhang, Y.; Cao, X.-B.; Zhang, J. Delay causality network in air transport systems. Transp. Res. Part E Logist. Transp. Rev. 2018, 118, 466–476. [Google Scholar] [CrossRef]
- Zhang, M.; Zhou, X.; Zhang, Y.; Sun, L.; Dun, M.; Du, W.; Cao, X. Propagation Index on Airport Delays. Transp. Res. Rec. J. Transp. Res. Board 2019, 2673, 536–543. [Google Scholar] [CrossRef]
- Mengyuan, S.; Yong, T.; Xunuo, W.; Xiao, H.; Qianqian, L.; Zhixiong, L.; Jiangchen, L. Transport causality knowledge-guided GCN for propagated delay prediction in airport delay propagation networks. Expert Syst. Appl. 2023, 240, 122426. [Google Scholar]
- Xiong, J.; Hansen, M. Value of flight cancellation and cancellation decision modeling ground delay program postoperation study. Transp. Res. Rec. 2009, 2106, 83–89. [Google Scholar] [CrossRef]
- Spirtes, P.; Zhang, K. Causal discovery and inference: Concepts and recent methodological advances. Appl. Inf. 2016, 3, 3. [Google Scholar] [CrossRef] [PubMed]
- Runge, J.; Nowack, P. Detecting and quantifying causal associations in large nonlinear time series datasets. Sci. Adv. 2019, 27, eaau4996. [Google Scholar] [CrossRef]
Disclaimer/Publisher’s Note: The statements, opinions and data contained in all publications are solely those of the individual author(s) and contributor(s) and not of MDPI and/or the editor(s). MDPI and/or the editor(s) disclaim responsibility for any injury to people or property resulting from any ideas, methods, instructions or products referred to in the content. |
© 2024 by the authors. Licensee MDPI, Basel, Switzerland. This article is an open access article distributed under the terms and conditions of the Creative Commons Attribution (CC BY) license (https://creativecommons.org/licenses/by/4.0/).