Abstract
Based on the goals of “high reliability, high frequency, rapid launch, and low cost” for space launch sites, an integrated dual-sided deflector system for convective cooling and thermal protection is presented. The interaction process between the gas jet and liquid water jet and its effect on the flow field environment are thoroughly studied using numerical calculation methods. Furthermore, considering the phase-change heat transfer issue in a compressible gas–liquid two-phase flow, and the varying distribution of different bubble shapes and sizes at the gas–liquid interface, a modified Lee model is derived. The research results show that compared to the classical Lee model, the modified Lee model can achieve a higher numerical accuracy in predicting the heat and mass transfer processes in gas–liquid two-phase flows. Through comparative analysis with the traditional dual-sided deflector and the conventional cooling system, the integrated dual-sided deflector system exhibits significant performance advantages in gas flow regulation and flow field environment improvement at the near-ground region of the space launch site. It not only achieves effective flow deflection, but also mitigates the degree of erosion caused by the gas jet on the deflector. This conclusion can provide theoretical references for the thermal protection design of commercial launch vehicle systems at space launch sites.
1. Introduction
Launch vehicles generally adopt the hot-launching method. The intense impact and erosion effects generated by the gas jets of the rocket engine can significantly jeopardize the safety of the launch equipment. If the gas jets fail to be smoothly expelled, it can severely impede the proper functioning of the rocket’s body and launch platform [1,2,3]. Therefore, studies aimed at reducing the adverse effects of impact and erosion caused by the gas jet are of paramount importance in improving the performance of launch vehicle systems, reducing launch costs, and shortening launch cycles.
To reduce the intense thermal and dynamic impact effects of the rocket engine exhaust plume, space launch sites both domestically and internationally typically employ gas jet water injection to cool down the flow field (Figure 1). On the rocket launching platform, a large deflector channel is excavated and a multi-stage water spray system is built. On the one hand, the gas jets are discharged to prevent the gas from flowing back and washing away the ground facilities. On the other hand, the scouring and abrasion effect of the high-temperature gas on the deflector channel is reduced, which is to minimize the damage caused by the gas to the rocket and the launching devices. Kennedy Space Center in Florida utilized a “deflector channel + water spray” approach to mitigate the exhaust plume generated during thermal launching, which effectively reduced the adverse effects on the launch equipment [4,5]. The Ariane 5/6 launch site of the European Space Agency employed a “deflector channel + automatic four-stage water spray” system to guide and cool the gas jet. The second-stage water spray test for the Long March 7 launch platform has been successfully conducted at Wenchang Spacecraft Launch Site in Hainan. The water spray system automatically activated during rocket launching, which provided the thermal and dynamic impact protection for the launch platform. Li et al. conducted numerical simulations and related experiments using the multiphase flow mixing model to investigate water injection into rocket engine plumes [6]. Lu et al. compared the cooling effects of two different water spray systems on the launch pad for the Long March 7 rocket (Beijing Launch Vehicle Technology Research Institute, Beijing, China), indicating that the cooling area of each nozzle decreased as it came closer to the central region [7]. Zhou et al. conducted numerical studies on the gas flow field of the launch vehicle, and analyzed the influence of different water spray angles on the cooling effect. They provided theoretical references for the design of cooling systems in launch sites [8,9,10]. Ji developed a scaled-down model of the launch vehicle, numerically simulated the gas-water spray flow field, and studied the effects of water spray intensity and droplet diameter on the temperature improvement [11]. Xiong adopted the computational fluid dynamics (CFD) method to carry out numerical simulation of water spraying and mixing cooling on the test stand of the ground engine ignition test. The feasibility and optimization of water spray cooling were investigated through theoretical research and numerical simulations [12]. Luo et al. conducted numerical simulations to study the noise reduction system and cooling protection of the test stand, considering the mutual influence under the different aspects [13].
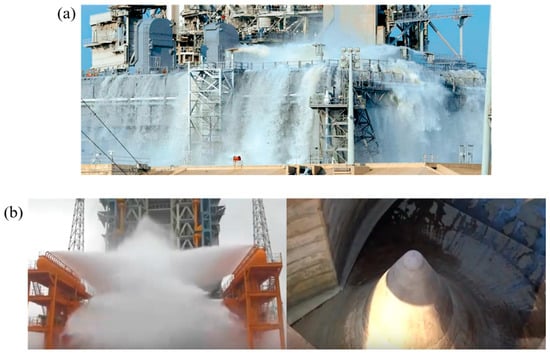
Figure 1.
Schematic diagrams of water spray systems for launch sites: (a) the Kennedy Space Center; (b) the Wenchang Spacecraft Launch Site.
Gas jet water spraying is a common method to improve the flow field environment and provide thermal protection for ground launch devices. However, there are some problems with the existing conventional cooling system at the launch site. The deflector device and water spray equipment are independent and separate systems, with high costs for building, repair, and transformation [14]. This results in a slow recovery and low launch efficiency of the state after the launch, and restricts the overall effectiveness and response speed of the ground launch system. The water spray facilities on the launch platform are large and complex, and the water spray pipelines are numerous and not compactly distributed. The water spray system in the launch area has been used for a long time, and the overall level of generalization, combination, and serialization is low. It is not able to adapt to new models and new tasks quickly, limiting its flexibility and adaptability. At the same time, the energy propagation in the core area of the gas jet is limited, and the heat transfer efficiency inside the flow field is lower than the gas and liquid phases. The improvement effect of the gas jet on the erosion degree of the deflector is not significant, and the service life and performance of the deflector are limited. Therefore, it is necessary to actively develop a new type of gas jet water spray cooling technology, for realizing the goal of commercial spaceflight development.
Based on the above analysis and drawing inspiration from the design concept of using “water-cooled steel plates” at the SpaceX Starship launch test site, a thermal protection and cooling system called the “integrated dual-sided deflector system” is proposed. The study focuses on a specific model of a single-nozzle commercial launch rocket and its dual-sided deflector [15]. A CFD numerical simulation method is employed to investigate the fundamental mechanisms of the integrated dual-sided deflector system in improving the thermal launch flow field environment of the launch vehicle. The analysis primarily examines changes in flow field characteristics and the level of load impact on the deflector caused by the gas jets. A comparative analysis is conducted between the integrated dual-sided deflector system, the traditional dual-sided deflector (without any heat protection and cooling measures), and the conventional heat protection and cooling system (using water spraying from the side and directed downward). The purpose is to validate the feasibility of the integrated dual-sided deflector system in actively protecting the deflector from thermal effects and demonstrate its effectiveness in heat protection.
2. The Basic Physical Model
Gas jet flow and water spray cooling are typical turbulent flow problems in aerospace engineering, which involve various physical and mathematical models, such as the basic control equations, species transport equations, turbulence equations, multiphase flow models, and vaporization models. The mature CFD technique is used for numerical simulations of the gas flow field [16]. The control equations of the flow field are solved using the finite volume method, employing a second-order upwind scheme in spatial discretization and a first-order backward difference scheme in time discretization. The resulting system of algebraic equations is solved with the prediction and multi-step correction methods. Due to space limitations, the focus will be on providing a detailed description of the vaporization model for liquid water.
The interaction between the gas jet and liquid water, leading to vaporization phenomena, is a typical problem of a compressible gas–liquid multiphase flow. It has been demonstrated in refs. [6,16] that the Euler–Euler approach with the mixture two-phase flow model can accurately simulate the mixing process of the gas and liquid phases. Therefore, the mixture model is chosen to investigate compressible two-phase flow phenomena involved in gas jet flow and water spray cooling. The vaporization and condensation phenomena of liquid water are incorporated into the mass equation of water vapor as a mass source term, resulting in the following expression:
where the subscript v is the water vapor, αv is the volume fraction of water vapor within the control volume, ρv is the density of water vapor, vv is the velocity of water vapor in the gas phase, mlv is the vaporization rate, and mvl is the condensation rate.
Based on research by Lee, the mass transport rate (vaporization and condensation) of water can be related to temperature as follows [17]:
where coeff is the phase-change mass transfer coefficient, Tl is the temperature of the liquid water, Tsat is the saturation temperature corresponding to the current pressure, Tv is the temperature of the water vapor, and αl, αv, ρl, and ρv are the volume fractions and densities of the liquid and vapor phases within the computational cell, respectively.
By combining the Hertz–Knudsen formula and the Clausius–Clapeyron equation, the expression of the phase-change mass transfer coefficient in Equation (2) can be obtained as follows [18,19,20,21]:
where db is the bubble diameter of water vapor, and β is the sticking coefficient, which represents the fraction of water vapor absorbed by liquid water.
When using the classical Lee phase-change mass transfer equation, the phase-change mass transfer coefficient is typically assumed to be an empirical constant. However, there is significant variation in the values reported in different sources in the literature [22,23,24]. The range of values is also quite wide, ranging from 0.1 to 107 s−1. Furthermore, these values are based on empirical observations and not thoroughly analyzed for rationality or underlying physical mechanisms. In addressing the issue of relying on empirical values for the phase-change mass transfer coefficient, Qiu et al. extensively considered the factors (fluid density, heat flux density, and specific enthalpy), and developed a steady-state analysis model to examine the influence of different mass transfer coefficient values on the simulation results of phase-change heat transfer [25]. Through analyzing the patterns of these influences, reasonable values for the mass transfer coefficient were derived. Guang et al. derived an explicit expression for calculating the phase-change mass transfer coefficient in the Lee model [26]. This expression clearly revealed the dependence of the mass transfer coefficient on various fluid properties (the density of the gas–liquid phases, thermal conductivity, latent heat, and saturation temperature) and grid sizes. It also indicated that within a specific computational cell of the fluid, the value of the mass transfer coefficient depended on the volume fraction of the liquid phase. Furthermore, the maximum value of this coefficient corresponded to the minimum volume fraction of the liquid phase. Wang et al. took the classical Lee model mass transfer equation as a starting point and derived a new mass transfer coefficient model [27,28]. This model primarily considered the influence of normal and tangential concentration gradients on the mass transfer rate at the gas–liquid interface, which could be used to predict the mass transfer coefficient on the liquid side under turbulent conditions. The mentioned studies have addressed the issue of relying on empirical values for the phase-change mass transfer coefficient and the lack of a theoretical basis in the existing literature. However, few studies have considered the bubble parameter factors in deriving and modifying the calculation formulas for the mass transfer coefficient. This neglects the influence of different bubble shapes and sizes at the gas–liquid interface on the heat and mass transfer processes. The bubble parameter factor is an important piece of information that reveals the mass and heat transfer mechanisms between the gas and liquid phases. The existing mass transfer correction models find it difficult to accurately describe the relationships between bubble parameters and phase-change mass transfer coefficients, and their application scope is still limited.
In the analysis of boiling and evaporation scenarios, bubbles are generated, which carry away some heat during the liquid-phase endothermic evaporation process. These bubbles vary in size and shape, which has an impact on the phase-change mass transfer coefficient [29,30,31]. Additionally, the saturation temperature of the fluid varies under different pressure conditions, affecting the heat exchange process during the evaporation phase change. Therefore, it is necessary to consider the bubble parameter factor and make modifications to Equations (2) and (3) to enhance the accuracy of the phase-change mass transfer coefficient in numerical simulations.
In turbulent flow conditions, the liquid water surface experiences forces from different directions when in contact with high-temperature and high-velocity gas jets. Consequently, the vapor bubbles generated during the liquid evaporation process are not only perfectly spherical, but also non-spherical shapes, such as ellipsoidal shapes. Considering that the ellipsoid has three semi-axes a, b, and c, the volume of the ellipsoid is V = 4/3πabc, and the surface area is S = 4/3π(ab + bc + ac). In this case, the db in Equation (3) can be replaced by the following expression:
The expression for the mass transfer coefficient corresponding to an ellipsoidal bubble is
When both spherical and ellipsoidal vapor bubbles exist, their proportions are related by a certain ratio. Assuming the proportion of spherical bubbles is denoted as e, the expression of the phase-change mass transfer coefficient is as follows:
To further simplify Equation (6), the expression can be described as follows:
where de is the equivalent diameter of the spherical or ellipsoidal bubble, and θ is the shape factor, which is dependent on temperature and pressure [29,30,31].
Furthermore, considering the influence of the gas–liquid interface pressure on the saturation temperature Tsat, the modified and improved Lee theory model can be expressed as follows:
where T and P represent the temperature and pressure of the gas–liquid interface grid cell, and λ is a dimensionless coefficient related to the diameter [32,33,34]. Based on the classical Lee model, a gas–liquid phase-change mass transfer model that considers bubble parameter factors can be derived. By adjusting the equivalent diameter of the bubble de and the shape factor θ, the rationality and accuracy of the phase-change mass transfer coefficient can be achieved.
By compiling Equations (8)–(10) in the C programming language and using Fluent’s user-defined function (UDF), it is possible to implement the modified Lee model within the mixture multiphase flow model. By incorporating the improved Lee model and leveraging relevant experimental data, the range of values or empirical formulas for the phase-change mass transfer coefficient can be determined, considering the bubble parameter factors. This approach allows for an enhancement in the accuracy of numerical simulations for gas–liquid multiphase flows.
3. Numerical Simulation Models
3.1. Physical Model Design
Based on the objectives of “low cost, high reliability, high frequency, and rapid launch”, this study focuses on a small-scale commercial launch vehicle with a single nozzle and its double-sided deflector [15]. The original geometric model of the launch vehicle is too large and structurally complex, resulting in a large physical model and computational domain. It not only increases the number of grids, but also extends the computational time and data storage space. To address these challenges without affecting the initial gas diffusion flow and smooth exhaust, the structural dimensions of the original rocket geometric model and launch site are appropriately simplified, as shown in Figure 2. Additionally, a Cartesian coordinate system is established, with the origin o located at the center of the bottom cross-section of the rocket. The y-axis is oriented vertically upward, the positive direction of the x-axis is as shown in Figure 2, and the z-axis is determined by the right-hand rule. Based on the simplified boundaries of the physical model, the computational domain for the flow field is established. Due to the geometric symmetry of the launch vehicle and deflector, the 1/2 model is used for numerical simulations of the flow field. The dimensions of the computational domain are 65De × 13De × 12De, where De is the nozzle’s exit diameter. During the launch process, the vertical direction (y-direction) is only considered for single-degree-of-freedom motion.
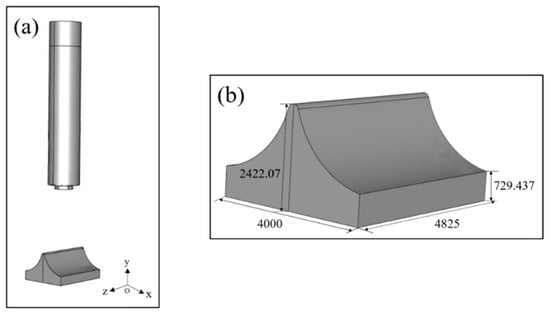
Figure 2.
Geometric model of the launch vehicle and its double-sided deflector: (a) overall model; (b) locality model deflector.
Currently, both domestic and international aerospace launch sites have developed mature conventional cooling systems, in which water spray devices are generally located on the launch platform or in lateral positions around the launch platform. The water spray system is typically designed with a combination of multiple stages, high flow rates, and automatic control. During the launch, water is sprayed from above downwards onto the gas jets for cooling purposes. The flow field model of the conventional cooling system is shown in Figure 3, based on the model depicted in Figure 2. Considering practical engineering experience, a total of 48 water spray pipes are installed at certain heights circumferentially above the deflector. There are 14 pipes distributed along the long side (y-direction) and 10 pipes distributed along the short side (x-direction). The cross-sectional dimensions of the water spray pipes are 100 mm × 100 mm, with a length of 240 mm. The angle between the pipes and the horizontal plane (parallel to the xz plane) is 60°.
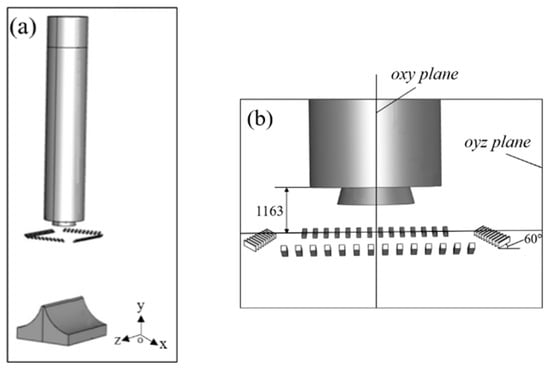
Figure 3.
The model of the conventional cooling system: (a) overall model; (b) the bottom of the rocket.
Based on the previous literature review and numerical simulations of gas flow fields, a new type of heat protection and cooling system called the integrated dual-sided deflector system is proposed to improve the thermal environment of the gas jet flow. The aim is to reduce the impact erosion intensity on the deflector caused by the gas jet and lower the temperature of the flow field. Building upon the traditional dual-sided deflector, a water spray system is integrated, as shown in Figure 4. This involves designing perforations on the deflector surface and adding liquid water orifices, making an integrated design of the deflector and water spray system. To ensure that the conventional cooling system and the integrated dual-sided deflector system have the same water discharge rate under the same operating time and the same liquid water velocity conditions, a total of 135 liquid water orifices are distributed on the deflector surface. Specifically, one row of liquid water orifices is placed at the top of the dual-sided deflector, and four rows are evenly spaced from top to bottom on each side of the deflector, with 15 orifices per row. The cross-sectional dimensions of the liquid water orifices are 60 mm × 60 mm. Depending on different working conditions, different liquid water orifices can be opened or closed. They can be set as wall boundary conditions when not needed, and set as velocity inlet boundary conditions when required. Through the water spray system on the deflector, liquid water can be sprayed on the gas jet flow area in advance before the engine ignition, which is to realize the effect of improving the flow field of the rocket thermal launch.
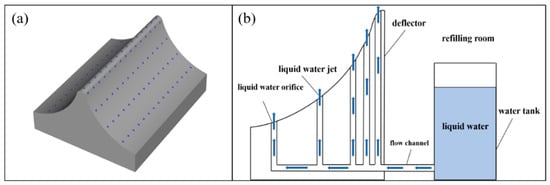
Figure 4.
The integrated dual-sided deflector system for convective cooling and thermal protection: (a) overall model; (b) working principle.
The working principle of the integrated dual-sided deflector system is shown in Figure 4b. Multiple liquid water flow channels are laid inside the dual-sided deflector, with the ends of the channels connected to the orifices on the deflector surface and the water tank. During the launch process, the liquid water injection pressure in the water tank is regulated [34,35]. On the one hand, this ensures that the liquid water flows continuously into the space of the rocket bottom at a certain velocity. It provides sufficient liquid water to absorb and carry away the heat from the gas jets, creating a counter-flowing water jet. On the other hand, it ensures that the liquid water jets have enough kinetic energy to overcome the stagnation pressure (6–8 atm) caused by the impact of the gas jets on the deflector surface. This helps maintain the continuity and stability of the liquid water jet, and ensures an effective convective impact between the counter-flowing liquid water jet and the gas jets. Moreover, the flow velocity and kinetic energy of the liquid water jet from the deflector surface can be controlled by adjusting the injection pressure of the liquid water. This increases the momentum transfer ratio and contact area between the gas–liquid two-phase flow, enhancing the convective impact and mixing cooling effect. It reduces the differences in local temperature and velocity, effectively improving the uniformity and stability of the gas flow field.
3.2. Grid Generation and Boundary Conditions
Considering the geometric complexity of the rocket structure and the curved surface of the dual-sided deflector, a structured/unstructured hybrid grid is adopted to partition the flow field region. The grid size is determined based on specific structural features and overall scale, such as the liquid water orifices, throat of the nozzle, and the computational domain. Figure 5 illustrates the schematic of the flow field grid partition. A dynamic grid-layering method is employed to update the grids in the flow field region. The newly generated grids are located at the intermediate position between the bottom of the rocket body and the dual-sided deflector, as well as at the top surface of the rocket body. The grid size in the former region is smaller, while the grid size in the latter region is larger. To better capture the flow phenomena, including gas jet spreading, gas exhaust through the deflector, and the convective impact between liquid water and gas jets, the grids in the region of the rocket bottom space, the surface of the dual-sided deflector, and the nearby ground are refined, as shown in Figure 5b,c.

Figure 5.
Grid modeling of the launch flow field: (a) overall grid; (b) nozzle; (c) deflector.
The boundary condition settings of the flow field’s computational domain are as follows. The combustion-chamber-end face of the engine nozzle is set as the pressure inlet. The gas enters the flow field through this boundary, with a total gas temperature of 3638.83 K. The pressure distribution in the high-pressure chamber is represented by the pressure ratio P/P0, which is a dimensionless quantity. P0 is the ambient pressure, and the pressure profile is shown in Figure 6. The upper and side boundaries of the computational domain are set as pressure outlets. The ambient pressure is set to 101,325 Pa, and the ambient temperature is set to 300 K. The surfaces of the engine, rocket body, ground, and dual-sided deflector are all set as no-slip adiabatic walls. When using the 1/2 model, there exists a set of symmetric boundary planes, as indicated by the yellow region in Figure 5a. The liquid water orifices are set as velocity inlets. The liquid water is injected into the computational domain through these orifices with a velocity of 40 m/s. The temperature is 300 K, and the pressure is 101,325 Pa.
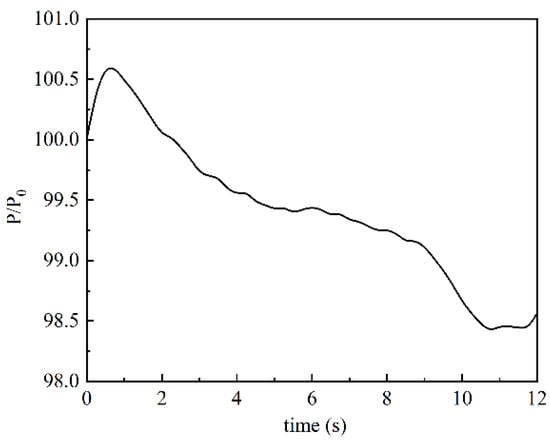
Figure 6.
Pressure–time curve of the high-pressure chamber.
According to different operating conditions, different liquid water orifices are opened, which are set as wall boundary conditions when not needed and as velocity inlet boundary conditions when needed. The water flow rate, considering the distance (L) between the top of the deflector and the rocket nozzle, is related to the pre-spray time. After multiple rounds of numerical calculations in the early stage, it is found that under the condition of a water spraying speed of 40 m/s and a pre-spray time of 100 ms, the liquid water jet sprayed from the orifices at the top of the deflector surface can move vertically to a height of more than 2/3 L. To avoid the impact of the liquid water jet on the nozzle and the bottom of the rocket body, the pre-spray time of the integrated dual-sided deflector cannot exceed the time corresponding to the liquid water jet moving to the 2/3 L height position.
The thermal environment characteristics of the dual-sided deflector are a key focus in the numerical simulation of the flow field. Therefore, multiple monitoring points are established on the deflector surface to measure the temperature and dynamic pressure variations at these points. The erosion effect of the gas jets on the deflector is evaluated. Figure 7 provides a schematic distribution of the monitoring points on the deflector surface. P11 to P41 are located at the top surface of the deflector. Among them, P11 is positioned on the axis of the rocket engine, while P21, P31, and P41 are equally spaced and located on one side of the top surface. P11, P12, P13, and P14 are located at the intersection between the symmetry plane and the deflector surface. P22, P32, P33, and P44 are respectively located at the midsection and downstream region of the deflector surface.
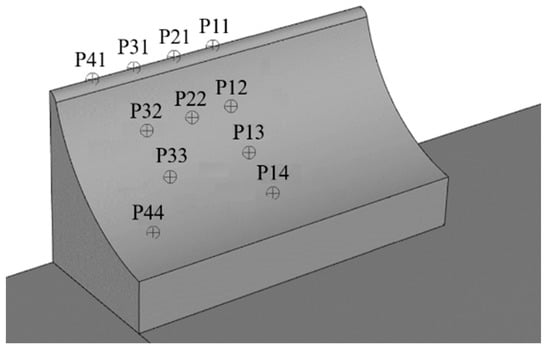
Figure 7.
The monitoring points on the deflector surface.
3.3. Grid Independence Verification
When solving flow fields using the finite volume method, it is necessary to divide the computational domain into discrete grids. The size of the grids directly affects the accuracy of the numerical results during the discretization of the flow field. Selecting an appropriate grid size not only saves a significant amount of computational time, but also reduces computational resource costs. Therefore, conducting grid independence analysis is crucial [16].
In Figure 4a, the dimensions of the liquid water orifices on the deflector surface are 60 mm × 60 mm. These orifices represent the “smallest” structural features in the entire physical model. To accurately simulate the interaction between liquid water and the gas jet, and the degree of water vaporization, a fine grid resolution is required. However, excessively fine grid divisions would result in a significantly larger number of grids within the entire computational domain, surpassing the current computational capacity. Furthermore, the dimensions of the nozzle throat, a critical location in the numerical simulation of gas jet formation and diffusion, have a significant impact on the accuracy of the gas jet numerical calculations. Based on the diameter of the nozzle throat and the grid size of the liquid water orifice, four sets of grids are created, with 4.44 million, 6.42 million, 8.74 million, and 10.92 million grid cells. The grid sizes at each location are shown in Table 1.

Table 1.
Basic parameters of different grid numbers.
Based on the previous multiple rounds of trial calculations and considering the vertical distance L, as well as ensuring the effective functioning of the water spray system, the engine ignition is initiated after 40 ms of the water spray system’s operation. At this time, the reverse liquid water jets injected from the top position of the deflector have moved vertically to a height of 1/3 L. The ignition time of the engine is considered as t = 0 s for convenient comparison and analysis of the physical parameters in the flow field. The temperature data of monitoring points P32 and P33 on the deflector surface are extracted and compared during the time range of 0 to 0.5 s, as shown in Figure 8. From the figure, it can be observed that the temperature curve of the 4.44 million-cell-grid model differs significantly from the other three curves. The temperature values of the monitoring points in the 6.42 million-cell-, 8.74 million-cell-, and 10.92 million-cell-grid models are relatively close, and the temperature curves of the 8.74 million-cell-grid model overlap more closely with the 10.92 million-cell-grid model. This indicates that further increasing the grid count has minimal impact on the numerical calculation results after reaching a grid count of 8.74 million. In addition, the calculation time for the 8.74 million-cell-grid model is 40% of the 10.92 million-cell-grid model. Therefore, to improve computational efficiency and follow the strategy of generating the minimum grid size, the division scheme with 8.74 million grid cells is adopted.
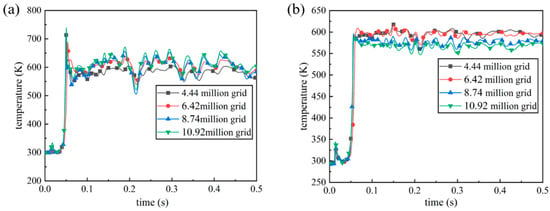
Figure 8.
Temperature change curves of the deflector surface monitoring points: (a) monitoring point P32; (b) monitoring point P33.
3.4. Experimental Validation of the Vaporization Model
To validate the effectiveness and accuracy of the improved Lee model, numerical simulations are performed on the engine gas jet–water spray experiments conducted in an open environment [6,16] (Figure 9). The numerical simulations employ both the classical Lee model and the improved Lee model for vaporization modeling. In the experiment, four water spray orifices were installed near the engine nozzle exit. The water spray orifices were activated before the engine ignition, resulting in the convergence of four liquid water jets. After the engine ignition, the high-temperature gas jet rushed into the low-temperature liquid water, which vaporized and absorbed heat, reducing the temperature of the flow field. Temperature sensors were placed at four locations (designated as A, B, C, and D) on the base plate. The temperature data at these four monitoring points were obtained using thermocouple sensors.
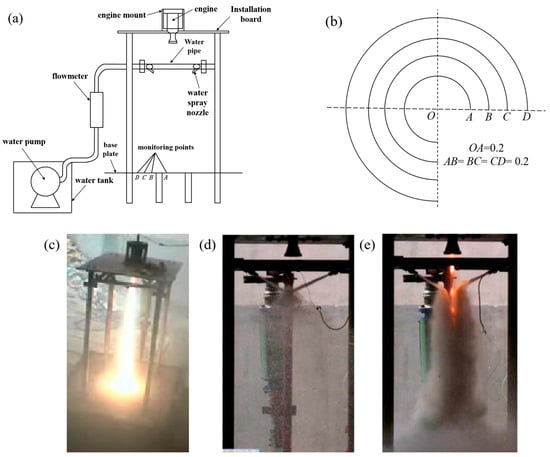
Figure 9.
Schematic diagram of experimental setup for gas jet water spraying in an open environment: (a) experimental device diagram; (b) four monitoring points on the bottom plate; (c) no water spray working condition; (d) no gas jet working condition; (e) water spray + gas jet working condition.
In Figure 9a, the engine is fixed on the experimental bench, and there is a water injection system on the platform to provide a platform for subsequent water injection and cooling test. A support rod is ultimately used to form the platform, which is to facilitate the installation and shooting of high-speed photography and infrared test equipment. Considering the temperature measurement without destroying the gas mainstream structure, an impact platform is designed at a certain height from the ground to realize the installation of temperature sensors. A short outrigger is designed at the bottom of the impact platform to be fixed on the ground to ensure the stability of the system, which can offset the thrust generated by the engine ignition. In the test device, the water injection pipeline is connected to a water pump to ensure the test water. The engine is fixed in the top center position, the water spray nozzle is installed in the center of each side’s square pipeline, and any nozzle can be turned on or off in accordance with the conditions of the test. Temperature sensors are arranged on the impact platform (Figure 9b). These are mainly for the acquisition of the overall structure characteristics of the flow field, and for monitoring point temperature distribution to analyze the overall flow characteristics of the gas flow. Therefore, the test instruments used for the experimental research include a high-speed camera and infrared camera, which are placed in a safe area away from the test bench.
When there is no liquid water in the gas flow field, a comparison between the wave structure of the gas jet captured by high-speed photography and the numerical simulation results is shown in Figure 10. In the figure, y is the axial distance from the nozzle throat to the wave node, and ymax is the maximum axial distance of the fourth wave node from the nozzle throat. From the graph, it can be observed that the positions of the first three clear wave nodes in the numerical calculation match well with those captured in the experiment. This indicates that the numerical calculation method employed for the gas jet is reliable and accurate.
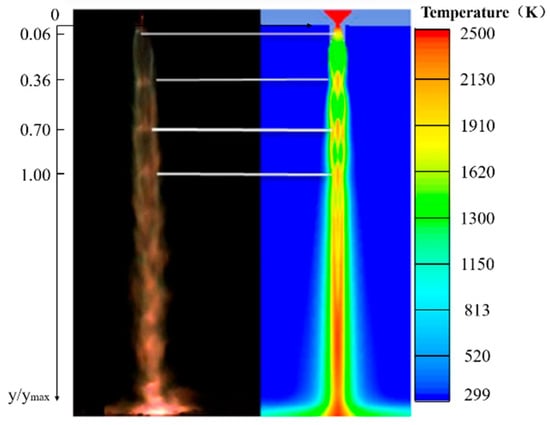
Figure 10.
Comparison of wave structure comparison between the test shooting (left) and the numerical simulation (right).
When the gas jet impacts the liquid water jet, intense vaporization of the liquid water occurs, resulting in a large amount of water vapor. The gas, air, and water vapor components continuously mix in the flow field. During the mixing process of the gas–liquid two-phase flow, there also exist phenomena such as the movement, deformation, and breakup of the two-phase interface, which consume a significant amount of energy in the flow field. To accurately simulate the interaction between the gas jet and liquid phases, the improved Lee model is compiled into a UDF file using the C language and loaded into Fluent. The temperature and pressure data from the four monitoring points of the base plate are extracted accordingly. A thorough analysis is conducted to investigate the coupling relationship between the shape factor θ and the temperature/pressure at the monitoring points. This analysis aims to explore the extent to which the bubble parameter factor affects the cooling effect in the flow field. Assuming an equivalent bubble diameter de (with typical bubble diameters ranging from 10 to 50 μm) and taking β as 0.001, numerical simulations are performed to simulate the vaporization process of liquid water under different shape factor values.
Based on the comparative analysis of the numerical simulation results and experimental data, it is found that when the shape factor θ is within the range of 18 to 60, it can adapt to a wide range of temperature and pressure variations and have a good corrective effect. Therefore, the shape factor θ is set to 32 for the numerical study. The numerical simulation results using the improved Lee model are compared with the simulation results using the classical Lee model and the experimental data, as shown in Figure 11 and Table 2. Compared to the classical Lee model, the temperature results obtained from the numerical simulation using the improved Lee model show a higher level of agreement with the experimental data. The relative errors are all below 0.5%, indicating that the improved Lee model can significantly enhance the accuracy of numerical calculations for the heat and mass transfer processes in the gas–liquid two-phase flow.
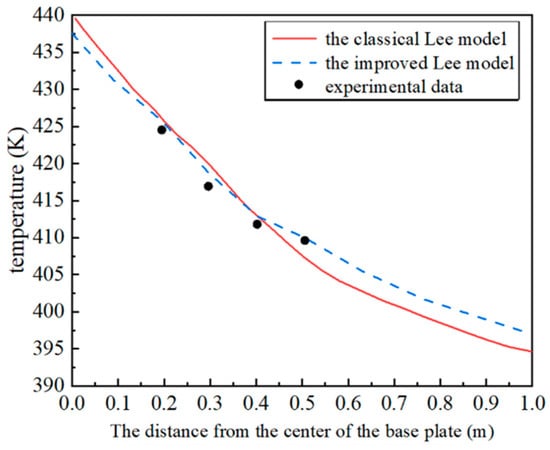
Figure 11.
Comparisons of the experimental measurement values and the numerical simulation values.

Table 2.
Relative errors in temperature values at monitoring points between experimental data and simulation values.
4. Numerical Computation and Result Analysis
4.1. Effectiveness of Gas Flow Control
The characteristics of gas flow directly impact the aerodynamic behavior of the rocket’s surrounding flow field. This section focuses on investigating the influence of the integrated dual-sided deflector system on the gas diffusion flow and exhaust guidance effectiveness. Through comparative analysis with the conventional cooling systems, the feasibility and superiority of the integrated dual-sided deflector system in regulating gas flow processes are validated.
Figure 12 illustrates the gas flow process in the xy-symmetric plane influenced by the integrated dual-sided deflector system. The black contour lines represent the volume fraction of liquid water, indicating the presence of liquid water in the flow field and the mixing process of liquid water and the gas jet. At the initial moment of engine ignition, the high-temperature gas and the liquid water jet move towards each other. When the gas jet interacts with the liquid water jets, the liquid water undergoes the first round of energy consumption and cooling of gas. Simultaneously, the liquid water changes its initial flow direction under the strong impact of the gas jet. As the gas diffusion flows towards the deflector surface region, the liquid water exhibits a “W-shaped” distribution along the deflector surface. Subsequently, the gas and liquid water rapidly diffuse to the ground position, and the first wave node of the gas jet is formed. The top of the deflector is in the high-temperature core region of the gas jet. At this point, the liquid water exhibits an “hourglass” distribution along the deflector surface and spreads over the deflector surface. As the launch vehicle accelerates to a higher position, the second and third wave nodes of the gas jet form successively, and the main flow of the gas jet fully develops. The core region of the gas jet begins to detach from the deflector. Meanwhile, the liquid water has spread over the deflector surface and the nearby ground area, forming a thick “water film” and providing a “second round” of insulating and cooling effects. The impact of the gas jet on the ground launch system and launch environment is significantly reduced. In the near-ground flow field, due to the convective impact between the gas and liquid water jets, the liquid water flows in forms such as “fountain”, “W-shaped”, and “hourglass”. There is a clear boundary between the gas and liquid phases. And throughout the entire process from the initial contact of liquid water with the gas to the end of the numerical calculation, the liquid water remains attached beneath the main flow of the gas jet. This facilitates an increase in the contact area and mixing degree of the gas and liquid phases, which better utilize the thermal insulation and cooling effect of the liquid water.
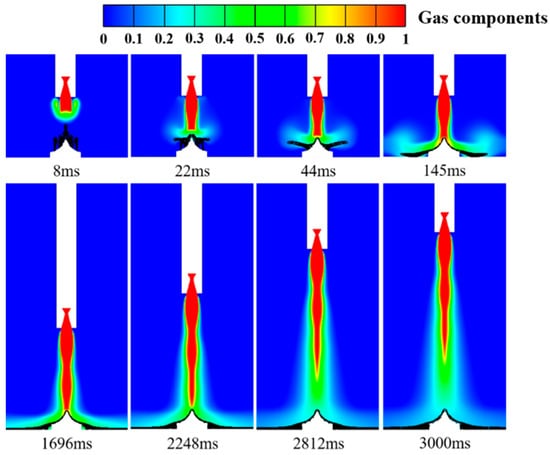
Figure 12.
Gas flow process in the xy symmetry plane under the integrated dual-sided deflector system, and the black contour in the figure is the volume fraction of liquid water, with values ranging from 0 to 0.2.
Figure 13 depicts a comparison of the gas distribution cloud maps between the conventional cooling system and the integrated dual-sided deflector system. From the figure, it can be observed that under both schemes, the rocket’s motion process and trajectory are essentially the same, and the gas jet in the rocket bottom space is effectively guided. In the conventional cooling system, the rate of gas diffusion into the surrounding space is somewhat reduced, leading to a prolonged duration of gas impinging on the deflector. However, the deflector and its surrounding ground position are still enveloped by the high-temperature gas for a long time. Therefore, the improvement in reducing the accumulation of high heat flux density in the near-ground flow field is not significant. On the other hand, the integrated dual-sided deflector system may exhibit relatively weaker performance in delaying the initial impingement of the gas jet on the deflector. But through the gas jet and liquid water jet convective impact process and the “water film” of the deflector surface formation (Figure 12), the integrated dual-sided deflector system can effectively disperse and diffuse the gas jet. This significantly reduces the contact area and contact time between the gas and the deflector, alleviating the accumulation of high-temperature gas in the near-ground flow field. As a result, the deflector is protected from the strong impact of the gas jet, achieving effective control over the gas flow process. In summary, the integrated dual-sided deflector system demonstrates advantages over the conventional cooling system in regulating the gas jets.
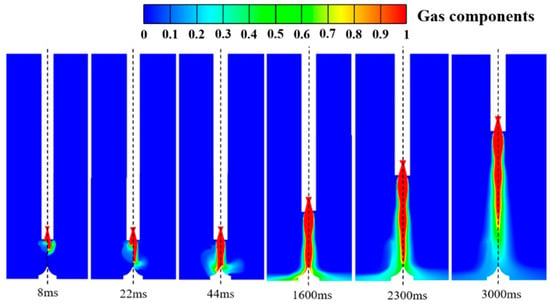
Figure 13.
Comparison of gas flow process in the xy symmetry plane under the integrated dual-sided deflector and the conventional cooling system (the left side is the conventional cooling system, and the right side is the integrated dual-sided deflector).
4.2. Improvement in the Flow Field Environment
When the flow characteristics of the gas and its deflection effects are optimized and controlled, the near-ground flow field environment at the launch site undergoes changes. These mainly include the propagation of pressure disturbances, temperature variations, and the degree of liquid water vaporization. These changes directly impact the design of ground launch facilities and structures. This section focuses on studying the influence of the integrated dual-sided deflector system on the improvement in the gas flow field environment. By comparing and analyzing the temperature/pressure distribution characteristics under different schemes, the superior performance of the integrated dual-sided deflector system in convective cooling, thermal protection, and improvement in the gas flow field environment can be demonstrated.
4.2.1. Propagation of Pressure Disturbances
The pressure disturbances generated by the engine nozzle typically propagate through the fluid medium in the form of initial shockwaves and spread to the surrounding space. The propagation characteristics and process of these disturbances are greatly influenced by the properties of the medium and the surrounding environmental conditions. Figure 14 illustrates the pressure distribution in the flow field affected by the integrated dual-sided deflector system. From the figure, it can be observed that after the ignition of the engine, the initial shockwave interacts with the liquid water jet injected from the orifices located at the top of the deflector at an extremely high speed. The water jet is “captured” by the shockwave and vertically compressed downwards. Phenomena such as structural disruption of the water jet and localized vibration of water molecules consume a significant amount of energy from the shockwave [36]. When the first high-pressure wave node of the gas jet reaches the top region of the deflector, the initial shockwave has propagated to a distant ground location away from the deflector, resulting in a significant weakening of the shockwave intensity. The second high-pressure wave node of the gas jet then appears and forms. At this point, the liquid water covers the top and mid-body regions of the deflector, forming a “W-shaped” distribution along the deflector surface. As the rocket continues to accelerate to a higher position, the gas jet fully develops, and there is no longer the propagation of shockwaves in the flow field. The spatial distribution of pressure at the rocket bottom becomes relatively uniform, and the high-pressure region at the top of the deflector disappears. At this stage, the liquid water has completely covered the surface of the deflector and the surrounding ground area.
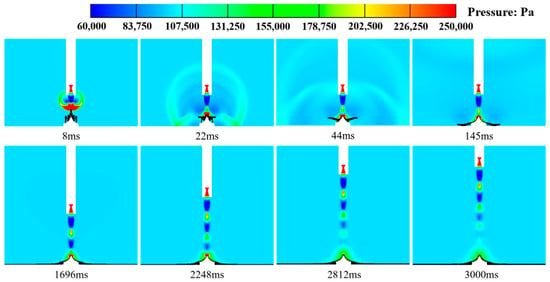
Figure 14.
Pressure distribution in the xy symmetry plane under the integrated dual-sided deflector system, and the black contour in the figure is the volume fraction of liquid water, with values ranging from 0 to 0.2.
Figure 15 illustrates comparisons of the pressure distribution between the conventional cooling system and the integrated dual-sided deflector system. From the figure, it can be observed that the conventional cooling system has a suppressing effect on the initial shockwave. The energy propagation of the shockwave is reduced, especially during the initial engine ignition, where the speed and intensity of the shockwave propagation are significantly delayed. As a result, the near-ground pressure environment experiences some improvement. However, a considerable area of the deflector surface is still affected by the pressure disturbances, and it remains in a high-pressure state for a prolonged period during the rocket launch. In comparison to the conventional cooling system, the integrated dual-sided deflector system exhibits a relatively weaker inhibitory effect on the propagation rate and shockwave intensity of the initial shockwave. However, the liquid water jets injected from the orifices of the deflector surface can cover the deflector and the surrounding ground area. This provides a certain level of pressure relief protection to the deflector, significantly reducing the area affected by the pressure disturbances. It primarily concentrates at the top and mid-body regions of the deflector. Additionally, when the shockwave propagates to the deflector surface, it disrupts the structure of the liquid water jet, causing deformation and spreading of the water jet. During this process, some of the energy of the shockwave is consumed. Furthermore, the inertia of liquid water is greater than that of gas, and the shockwave’s energy is also partially consumed when it induces vibrations in the liquid water molecules through localized oscillations. The combined effect of these two mechanisms effectively weakens the dynamic load impact intensity of the shockwave on the deflector, and reduces the duration and range of the pressure disturbances on the deflector surface. Therefore, the integrated dual-sided deflector system demonstrates superior improvement in terms of inhibiting the range and intensity of pressure disturbances.
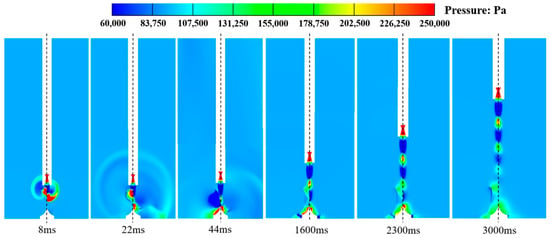
Figure 15.
Comparison of pressure distribution in the xy symmetry plane under the integrated dual-sided deflector system and the conventional cooling system (the left side is the conventional cooling system, and the right side is the integrated dual-sided deflector system).
4.2.2. Temperature Variation Process
The variation in temperature in the near-ground flow field is highly dependent on the parameters and flow characteristics of the gas jets. When the gas jet is injected at high velocity from the rocket engine, it carries high-temperature combustion products and thermal energy [37]. When interacting with the surrounding air and solid surfaces, it triggers complex flow phenomena, resulting in the propagation and alteration of temperature within the flow field.
Figure 16 illustrates the temperature distribution in the xy-symmetric plane of the flow field affected by the integrated dual-sided deflector system. From the figure, it can be observed that throughout the entire development of the gas jet’s main flow, there is no significant accumulation of high heat flux density on the deflector surface and its surrounding ground area. Instead, these regions remain at a relatively low temperature state. The main reason for this phenomenon is the convective interaction between the downward vertical gas jet and the upward vertical liquid water jet. On the one hand, the water jet is “captured” and vertically compressed by the gas jet, leading to intense momentum exchange and the dissipation of a significant amount of energy, including that of the high-temperature gas. On the other hand, the liquid water jet injected from the deflector’s surface continuously undergoes compression and changes in flow direction. This gradually forms a layer of liquid water “film” on the deflector surface and its surrounding ground area (Figure 12), effectively isolating the high-temperature gas jet from direct contact with the deflector surface and weakening its impact on the deflector. It can be concluded that the integrated dual-sided deflector system not only significantly reduces the thermal load impact intensity of the gas jet on the deflector, but also effectively performs insulation and cooling, improving the temperature environment in the near-ground flow field.
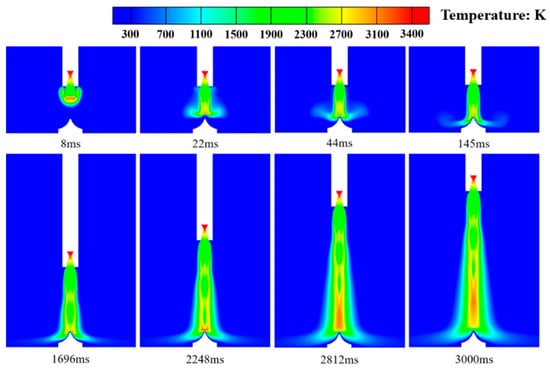
Figure 16.
Temperature distribution in the xy symmetry plane under the integrated dual-sided deflector sysytem.
Figure 17 presents a comparison of temperature distribution in the flow field between the conventional cooling system and the integrated dual-sided deflector system. From the figure, it can be observed that the conventional cooling system restricts the diffusion of the gas jet into the surrounding space, significantly reducing the range of areas near the ground affected by high-temperature gas. Specifically, there are no high-temperature regions near the ground in the vicinity of the dual-sided deflector. However, the surface of the deflector, especially the top and mid-body regions, still experiences prolonged and intense thermal load impact effects. In contrast, the integrated dual-sided deflector system effectively suppresses the dynamic thermal load impact of the high-temperature gas on the deflector. The convective interaction between the liquid water jet and the gas jet forms a protective “water film” on the surface of the deflector and its surrounding ground area (Figure 12). This directly blocks the impact of high-temperature gas, prevents the deflector surface from being enveloped by high-temperature gas and maintains it at a lower temperature state. Therefore, the integrated dual-sided deflector system demonstrates superior improvement in terms of enhancing the temperature environment in the near-ground flow field and providing active thermal protection for the deflector.
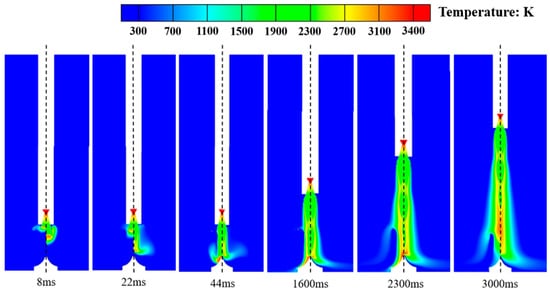
Figure 17.
Comparisons of temperature distribution in the xy symmetry plane under the integrated dual-sided deflector system and the conventional cooling system (the left side is the conventional cooling system, and the right side is the integrated dual-sided deflector).
Figure 18 presents a comparison of temperature distribution maps of the deflector surface under three different scenarios. In each set of three maps, corresponding to a specific moment, the leftmost map represents the traditional dual-sided deflector (traditional), the middle map represents the conventional cooling system (conventional), and the rightmost map represents the integrated dual-sided deflector system (integrated). Under the traditional dual-sided deflector, the deflector is subjected to severe thermal load impact from the gas jet during the initial stage of rocket launch. When the gas jet impacts the top of the deflector, it stagnates and forms a relatively high-temperature “core” region due to the obstruction of the top structure. Subsequently, this high-temperature “core” region spreads towards the surfaces of the deflector on both sides in an elliptical shape. At 1600 ms, high-temperature regions (2500 K to 3400 K) with a “hexagonal” distribution form on the deflector surface, and the temperature at the top of the deflector reaches 3400 K, while the temperature in the mid-body and downstream regions is around 3000 K. At 2300 ms, the high-temperature region on the deflector surface expands further, changing from a “hexagonal” shape to a “trapezoidal” shape. The temperatures at the top, mid-body, downstream, and step regions of the deflector all reach 3400 K. The thermal environment of the dual-sided deflector is extremely harsh. As the height of the carrier rocket continues to rise, the surface temperature of the deflector gradually decreases and exhibits a more uniform distribution. However, the overall deflector is still in a high-temperature state, with the highest temperature reaching close to 2100 K.
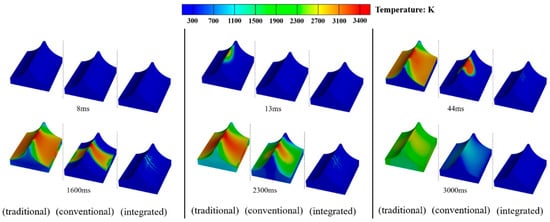
Figure 18.
Comparison of deflector surface temperature distribution under three different scenarios.
Compared to the traditional dual-sided deflector, the conventional cooling system in Figure 18 exhibits a delay of approximately 40 ms in the appearance of high-temperature gas on the deflector surface. Furthermore, there is a noticeable change in the distribution of high-temperature regions on the deflector surface, transitioning from the original “hexagonal” and “trapezoidal” shapes to “quadrilateral” and “U-shaped” patterns. Additionally, due to the lateral impact and vaporization reaction, a significant amount of energy is consumed from the high-temperature gas, reducing the impact of dynamic thermal load from the gas jet on the side edges, downstream, and step regions of the deflector. This improves the thermal environment on the deflector surface. However, due to the continuous impact of the gas jet core region, the regions at the top middle and mid-body of the deflector remain in a high-temperature state (3000 K to 3400 K) for a long time.
In comparison to the traditional dual-sided deflector and the conventional cooling system, the integrated dual-sided deflector system effectively mitigates the intense thermal load impact from the gas jet, providing superior thermal protection for the deflector. Throughout the complete development process of the gas jet mainstream, the integrated dual-sided deflector system disperses and guides the high-temperature gas jet through the convective impact of the gas–liquid two-phase flow. It reduces the concentration of high heat flux on the deflector surface. Additionally, due to the insulation and cooling effect of the “water film” formed by the liquid water, the temperature distribution on the deflector surface is uniform and always kept at a low temperature state, which effectively prevents the double-sided deflector from being overheated.
To quantitatively analyze the optimal improvement effect of the integrated dual-sided deflector system on the convective temperature environment, Figure 19 presents the variation curves of the maximum temperatures on the bottom surface of the rocket body and the surface of the deflector over time during three different scenarios. From Figure 19a, it can be observed that the integrated dual-sided deflector system significantly reduces the fluctuation range of the maximum temperature curve on the bottom surface of the rocket body, delays the occurrence of the peak, and the peak value is much lower than the other two scenarios. The reason for the higher peak value in the conventional cooling system is larger than the traditional dual-sided deflector is that the former has the liquid water injection orifices located near the engine exhaust. The impact and squeezing effect of the liquid water column on the gas jet exacerbates the “rolling” phenomenon of the gas, which results in an increase in temperature on the bottom surface of the rocket body. In the mid-stage of flow development, after the temperature curve on the bottom surface of the rocket body monotonically decreases to its minimum value, it shows a slight oscillation and upward trend. At this point, the minimum temperature value of the conventional cooling system is significantly lower than in the other two scenarios, but the temperature differences among the three scenarios are not large and all remain below 580 K. In the late stage of flow development, the variation curves of the maximum temperature on the bottom surface of the rocket body for all scenarios overlap and stabilize at around 530 K.
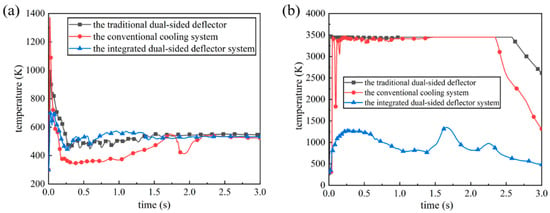
Figure 19.
Comparison of maximum temperature variation curves at the launch vehicle bottom and deflector surface: (a) the bottom of rocket; (b) the surface of deflector.
The data of temperature variation over time for seven monitoring points, P11 to P41 and P22 to P44, on the deflector surface are extracted in Figure 7, and the temperature curves of these points under three different scenarios are compared, as shown in Figure 20. It should be noted that monitoring point P11, located at the liquid water injection orifice position on the deflector surface, maintains a constant temperature value of 300 K and is not plotted in Figure 20c. Throughout the entire development process of the gas flow field, a comparison of Figure 20a–c reveals that under the traditional dual-sided deflector, except for monitoring point P41, the temperature curves of the other monitoring points remain within the range of approximately 2000 K to 3400 K. Under the conventional cooling system, the temperature on the deflector surface near the side edges exhibits slight oscillation and remains around 500 K. The temperature curve of the deflector surface at the mid-body position fluctuates around 2000 K, while the temperature near the xy-axisymmetric plane remains at a high-temperature state of 2500 K to 3400 K for a long time. In comparison to the other two scenarios, the temperature variation curves on the deflector surface for the integrated dual-sided deflector system show significant reduction, with none of the curves exceeding 750 K. In particular, the temperature curves for monitoring points P21, P31, and P41 consistently remain below 450 K. This indicates that the integrated dual-sided deflector system can more effectively optimize and regulate the temperature environment on the deflector surface. Compared to the other two scenarios, it demonstrates superior thermal protection for the deflector surface.
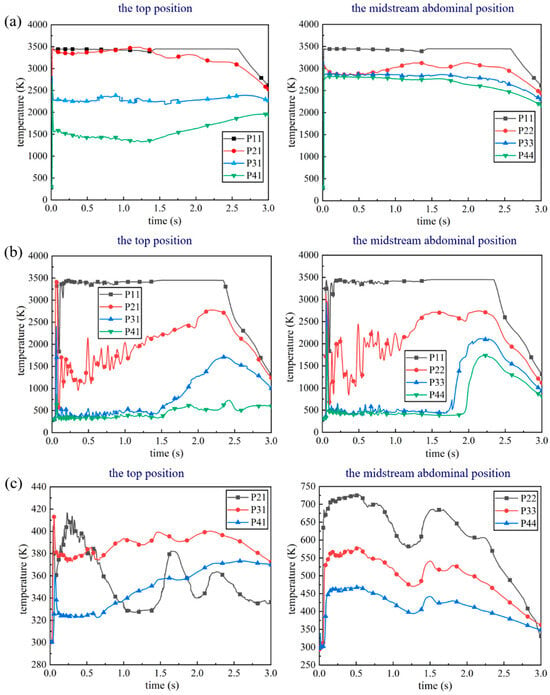
Figure 20.
Comparison of temperature variation curves at various monitoring points on the deflector surface: (a) the traditional dual-sided deflector; (b) the conventional cooling system; (c) the integrated dual-sided deflector.
The peak temperature values of the temperature curves on the deflector surface under three different scenarios are summarized in Figure 20 and presented in Table 3. Using the traditional double-sided deflector (traditional) as a baseline, the temperature reduction percentages of the peak values under other scenarios are calculated. From Table 3, it can be observed that the integrated dual-sided deflector system (integrated) exhibits a significantly greater reduction in the peak temperature values on the deflector surface compared to the conventional cooling system (conventional). The temperature reduction percentages for the former range from 76.86% to 91.29%, while the maximum reduction percentage for the latter is only 23.14%. Therefore, it can be concluded that the integrated dual-sided deflector system demonstrates superior performance in improving the temperature environment on the deflector surface.

Table 3.
Comparison of maximum temperature values at various monitoring points on the deflector surface.
In summary, the integrated dual-sided deflector system has a significant impact on the temperature variation process in the near-ground space of the launch site and effectively improves the temperature environment on the deflector surface. Through qualitative and quantitative comparative analysis of the thermal protection effectiveness of the deflector and its surface temperature variation curves, the superior performance of the integrated dual-sided deflector system in reducing the flow field temperature, suppressing temperature fluctuations, and providing long-lasting thermal protection has been validated. These improvements are crucial for ensuring the stability of the flow field, protecting ground launch equipment and facilities from the influence of high-temperature gases, and enhancing the operational efficiency of the ground launch system in space launch facilities.
4.2.3. The Degree of Vaporization of Liquid Water
In the area in contact with high-temperature gas jets, liquid water undergoes intense vaporization, and generates a large amount of water vapor. On the one hand, the liquid water undergoes an endothermic phase change, and consumes a significant amount of energy, including the initial shockwave and high-temperature gas. On the other hand, the generated water vapor partially dilutes the high-temperature gas, and alleviates the accumulation of high heat flux density near the deflector surface and the surrounding ground area. During vehicle launching, the degree of liquid water vaporization can change significantly with the selection of different heat protection and cooling solutions.
Figure 21 illustrates the distribution of liquid water vaporization phenomena within the temperature field affected by the conventional cooling system. The black contour lines in the figure represent the locations and extent of the liquid water vaporization reactions. After the high-temperature gas jet is rapidly impacted onto the liquid water column upon engine exhaust, significant vaporization reactions occur at the gas–liquid interface, with a maximum vaporization reaction rate of 0.1703 kg/(m3·s). When the gas jet impinges on the deflector it fully covers the top surface and the residual liquid water on the deflector surface undergoes vaporization reactions, with a maximum vaporization reaction rate of 0.4550 kg/(m3·s). Subsequently, as the gas jet diffuses and flows towards the ground, the vaporization zone of liquid water exhibits an “X-shaped” distribution pattern. As the rocket continues to accelerate upward, the vaporization reaction region gradually takes on an “eight-shaped” distribution, and expands along the trajectory of the gas jet. At this stage, the maximum vaporization reaction rate of the liquid water is 1.8029 kg/(m3·s).
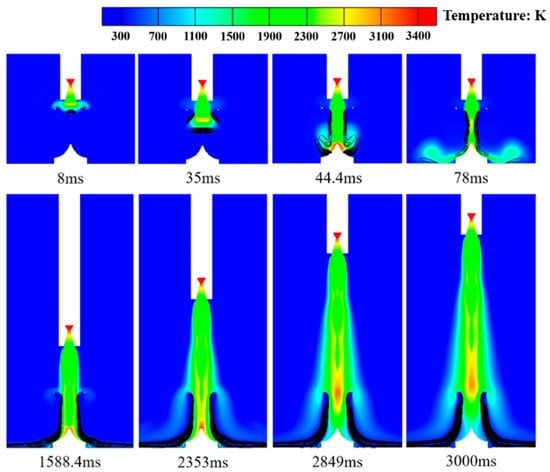
Figure 21.
Temperature distribution in gas–liquid two-phase flow field under the conventional cooling system (the black contour in the figure is the rate of vaporization reaction of liquid water, unit: kg/(m3·s)).
Unlike the conventional cooling system, the integrated dual-sided deflector system has its water spray system located on the deflector. This results in a significant change in the location of the liquid water vaporization reaction zone in the flow field. Figure 22 illustrates the distribution of liquid water vaporization phenomena within the temperature field affected by the integrated dual-sided deflector system. At the initial ignition of the engine, the high-temperature gas and liquid water move towards each other without making contact, resulting in minimal vaporization phenomena. When the convective impact occurs between the liquid water jet and the gas jet, vaporization reactions take place at the gas–liquid interface, with a maximum vaporization reaction rate of 5.8552 kg/(m3·s). Subsequently, as the gas jet diffuses and flows onto the deflector surface, the liquid water gradually covers the deflector surface. The vaporization reaction zone exhibits two different distribution patterns, namely, a “W-shaped” and an “eight-shaped” distribution, along the deflector’s surface. The maximum vaporization reaction rate reaches 13.3604 kg/(m3·s). When the gas flow further diffuses to the ground area away from the deflector, the liquid water has spread across the deflector surface and the surrounding ground region. The distribution range of the vaporization reaction zone expands, with a maximum vaporization reaction rate of 13.7594 kg/(m3·s). As the rocket accelerates upward to the higher position, the gas jet core gradually moves away from the deflector, resulting in a reduction in the vaporization reaction zone of the liquid water. At this stage, the maximum vaporization reaction rate is 11.9659 kg/(m3·s).
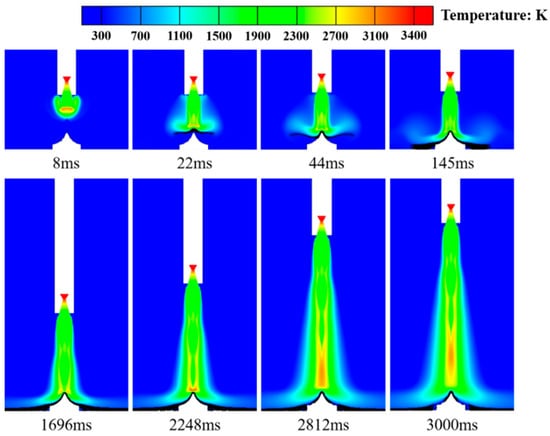
Figure 22.
Temperature distribution in gas–liquid two-phase flow field under the integrated dual-sided deflector system (the black contour in the figure is the rate of vaporization reaction of liquid water, unit: kg/(m3·s)).
A comprehensive comparison between Figure 20 and Figure 21 reveals that the maximum vaporization reaction rate of liquid water within the flow field affected by the integrated dual-sided deflector system is significantly higher than that of the conventional cooling system. In the former case, the maximum value reaches 13.7594 kg/(m3·s), while the latter case is only 1.8029 kg/(m3·s). This indicates that the integrated dual-sided deflector system, with the continuous injection of a liquid water jet through the surface orifices of the deflector, significantly increases the contact area between the gas and liquid phases. This enhances the degree of liquid water vaporization within the flow field, which effectively reduces the temperature and heat flux density of the flow field, and achieves optimal improvement in the flow field environment.
5. Conclusions
Aiming at the problem that the deflector is strongly scrubbed and eroded by the gas jets in the rocket launch process, an integrated dual-sided deflector system for convective cooling and thermal protection of the flow field is proposed. The interaction mechanism between liquid water and the gas jet, as well as the effectiveness of flow field improvement, are thoroughly investigated using the CFD method. Through a comparative analysis with the traditional dual-sided deflector and the conventional cooling system, the feasibility of the integrated dual-sided deflector system in providing active thermal protection for the deflector is validated. The main conclusions obtained are as follows.
Regarding the heat transfer during the phase change of compressible gas–liquid two-phase flow, and the varying distribution of different bubble shapes and sizes at the gas–liquid interface, a modified Lee model is derived. The rationality and accuracy of the phase-change mass transfer coefficient can be achieved by adjusting the equivalent diameter and shape factor of the bubbles. It has the advantage of a wide range of applications and can provide a high-precision heat and mass transfer process in gas–liquid two-phase flows.
Compared with the traditional double-sided deflector and the conventional cooling system, the integrated double-sided deflector achieves better improvement in the gas flow field environment, especially in the thermal environment of the double-sided deflector. Through the convective impact process of gas jet and liquid water jet, it not only consumes a large amount of energy in the flow field, including the initial shockwave, and reduces the propagation range and intensity of pressure disturbance, but also forms a layer of liquid water, “water film”, on the surface of the deflector and its nearby ground position. The “water film” effectively blocks the direct contact between high-temperature gas and the deflector surface, which increases the contact surface area of the gas–liquid two-phase flow, improves the utilization rate of liquid water, and greatly weakens the dynamic load impact strength of gas jet on the guide vane.
However, the variations in pressure and temperature in the gas-phase flow field are significantly influenced by factors related to jet injection. The study lacks the influence of jet velocity, jet aperture, and orifice number on the distribution characteristics of the gas-phase flow field structure, and further research is needed.
Author Contributions
Conceptualization, M.Z.; methodology, M.Z.; software, M.Z. and Y.J.; validation, M.Z.; formal analysis, M.Z.; investigation, M.Z.; resources, Y.J.; data curation, M.Z.; writing—original draft preparation, M.Z.; writing—review and editing, M.Z., Y.J. and Y.D.; visualization, M.Z.; supervision, Y.J. and Y.D.; project administration, Y.J.; funding acquisition, Y.J. All authors have read and agreed to the published version of the manuscript.
Funding
This research was funded by [the National Defense Basic Research Program Project] grant number [JCKY2021602B030] and the APC was funded by [Jiang, Y.].
Data Availability Statement
The data presented in this study are available on request from the corresponding author due to the confidentiality and privacy concerns.
Conflicts of Interest
The authors declare no conflict of interest.
References
- Kristian, R.; Christophe, D. Heat transfer and associated coherent structures of a single impinging jet from a round nozzle. Int. J. Heat Mass Transf. 2021, 173, 121197. [Google Scholar]
- Dalle, D.J.; Rogers, S.E.; Meeroff, J.G.; Burkhead, A.C.; Schauerhamer, D.G.; Diaz, J.F. Launch vehicle ascent computational fluid dynamics for the space launch system. J. Spacecr. Rocket. 2023, 61, 473–486. [Google Scholar] [CrossRef]
- Faheem, M.; Khan, A.; Kuma, R.; Khan, S.A.; Asrar, W.; Sapardi, A.M. Experimental study on the mean flow characteristic of a supersonic multiple jet configuration. Aerosp. Sci. Technol. 2021, 108, 106377. [Google Scholar] [CrossRef]
- Norris, R.S.; Kristensen, H.M. Nuclear U.S and Soviet/Russian intercontinental ballistic missiles. Bull. At. Sci. 2009, 65, 62–69. [Google Scholar] [CrossRef][Green Version]
- Vu, B.T.; Bachchan, N.; Peroomian, O.; Akdag, V. Multiphase modeling of water injection on flame deflector. In Proceedings of the 21st AIAA Computational Fluid Dynamics Conference, San Deigo, CA, USA, 24–27 June 2013. [Google Scholar]
- Li, J.; Jiang, Y.; Yu, S.Z.; Zhou, F. Cooling effect of water injection on a high-temperature supersonic jet. Energies 2015, 8, 13194–13210. [Google Scholar] [CrossRef]
- Lu, C.Y.; Zhou, Z.T.; Shi, Y.; Bao, Y.Y.; Le, G.G. Numerical simulations of water spray on launch pad during rocket launching. Spacecr. Rocket. 2021, 58, 566–574. [Google Scholar] [CrossRef]
- Zhou, Z.T.; Lu, C.Y.; Zhao, C.F.; Le, G.G. Numerical simulations of water spray on flame deflector during the four-engine rocket launching. Adv. Space Res. 2020, 65, 1296–1305. [Google Scholar] [CrossRef]
- Zhou, Z.T.; Zhang, L.J.; Le, G.G. Numerical study for the flame deflector design of four-engine liquid rockets. Eng. Appl. Comput. Fluid Mech. 2020, 14, 726–737. [Google Scholar] [CrossRef]
- Zhou, Z.T.; Sun, P.J.; Bao, Y.Y. Numerical simulations of thermal environment of the rocket impingement jet with afterburning under different water spray angles. Aerosp. Sci. Technol. 2022, 121, 107308. [Google Scholar] [CrossRef]
- Ji, T.Y. Numerical Study on Water Injection Cooling of Gas Plume in Solid Rocket Motor; Harbin Engineering University: Harbin, China, 2020. [Google Scholar]
- Xiong, Y. Numerical Simulation Study on High Temperature Gas Cooling System of Solid Rocket Motor; Academy of Aerospace Solid Propulsion Technology: Xi’an, China, 2021. [Google Scholar]
- Luo, T.P.; Liu, R.M.; Li, M.; Zhang, J.X. Numerical study on spray cooling of test bench flow channel based on DPM. Aerosp. Power 2018, 33, 497–507. [Google Scholar]
- Fang, B.; Zhao, T.S. The “Starship” explosion aftermath appearance of the launch pad damage. Beijing Bus. News 2023, 8. [Google Scholar] [CrossRef]
- Zhang, W.; Liu, J.J.; Liu, W.; Jin, X. Smart dragon 3 launch vehicle system. Aerosp. China 2022, 23, 3–10. [Google Scholar]
- Zhang, M.M.; Jiang, Y.; Shi, S.Y.; Deng, Y.G. Influence on flow field of hot launch in a W-shaped underground space by water injection. J. Acta Armamentarii 2023, 44, 1158–1170. [Google Scholar]
- Lee, W.H. A pressure iteration scheme for two-phase flow modeling. In Computational Methods for Two-Phase Flow and Particle Transport; Toh Tuck Link: Singapore, 1979; pp. 61–82. [Google Scholar]
- Hertz, H. On the evaporation of liquids, especially mercury, in vacuo. Ann. Der Phys. 1882, 17, 177. [Google Scholar]
- Knudsen, M. Maximum rate of vaporization of mercury. Ann. Der Phys. 1915, 47, 697. [Google Scholar]
- Da, R.E.; Del, C.D. Numerical simulation of laminar liquid film condensation in a horizontal circular minichannel. J. Heat Transf. Trans. ASME 2012, 135, 051019. [Google Scholar]
- Da, R.E.; Del, C.D.; Garimell, S.V.; Cavallini, A. The importance of turbulence during condensation in a horizontal circular minichannel. Int. J. Heat Transf. 2012, 55, 3470–3481. [Google Scholar]
- Deschepper, C.K.; Heynderickx, G.J.; Marin, G.B. Modeling the evaporation of a hydrocarbon feedstock in the convection of a steam cracker. Comput. Chem. Eng. 2009, 33, 122–132. [Google Scholar] [CrossRef]
- Wu, H.L.; Peng, X.F.; Ye, P.; Gong, Y.E. Simulation of refrigerant flow boiling in the serpentine tubes. Int. J. Heat Mass Transf. 2007, 50, 1186–1195. [Google Scholar] [CrossRef]
- Bortolin, S.; Da, R.E.; Del, C.D. Condensation in a square minichannel: Application of the VOF method. Heat Transf. Eng. 2014, 35, 193–203. [Google Scholar] [CrossRef]
- Qiu, G.D.; Cao, W.H.; Wu, Z.Y.; Jiang, Y. Analysis on the value of coefficient of mass transfer with phase change in Lee’s equation. J. Harbin Inst. Technol. 2014, 46, 15–19. [Google Scholar]
- Chen, G.; Nien, T.T.; Yan, X.H. An explicit expression of the empirical factor in a widely used phase change model. Int. J. Heat Mass Transf. 2020, 150, 119279. [Google Scholar] [CrossRef]
- Wang, X.D. Model Study of Mass Transfer at Gas-Liquid Interface; Xiangtan University: Xiangtan, China, 2021. [Google Scholar]
- Fu, J. Analytical Model Development and Numerical Simulation of Gas-Liquid Interface Mass Transfer; Xiangtan University: Xiangtan, China, 2017. [Google Scholar]
- Zhou, Y.Q.; Wang, W.W.; Duan, J.H. Research progress on bubble motion behavior in liquids. Pet. Refin. Eng. 2023, 53, 5–8. [Google Scholar]
- Shen, Y.; Zhang, L.L.; Wu, Y.R.; Chen, W.Z. The role of the bubbles-bubble interaction on radial pulsations of bubbles. Ultrason. Sonochemistry 2021, 73, 105535. [Google Scholar] [CrossRef]
- Li, W.P.; Cao, S.Y.; Liu, X.N. Effects of grain shape on incipient motion of non-uniform sediment. Adv. Water Sci. 2007, 3, 342–345. [Google Scholar]
- Xiao, Y.; Meng, M.; Daouadji, A.; Chen, Q.S.; Wu, Z.J.; Jiang, X. Effects of particle size on crushing and deformation behaviors of rockfill materials. Geosci. Front. 2020, 11, 375–388. [Google Scholar] [CrossRef]
- Lv, Y.R.; Wang, C.; Huang, H.X.; Zuo, D.J. Study on particle structure and crushing behaviors of coral sand. Rock Soil Mech. 2021, 42, 352–360. [Google Scholar]
- Zhan, G. Design and Research of Gas-Liquid Booster Pump; Donghua University: Shanghai, China, 2024. [Google Scholar]
- Zhou, P. Design on hydraulic pressure boosting system for forging press. Forg. Stamp. Technol. 2024, 49, 189–195. [Google Scholar]
- Wang, W.P.; Liu, F.S.; Zhang, N.C. Structural transformation of liquid water under shock compression condition. Acta Phys. Sin. 2014, 63, 270–274. [Google Scholar]
- Zhang, X.W.; Pan, L.; Wang, L.; Zou, J.J. Review on synthesis and properties of high-energy-density liquid fuels: Hydrocarbons, nanofluids and energetic ionic liquids. Chem. Eng. Sci. 2018, 180, 95–125. [Google Scholar] [CrossRef]
Disclaimer/Publisher’s Note: The statements, opinions and data contained in all publications are solely those of the individual author(s) and contributor(s) and not of MDPI and/or the editor(s). MDPI and/or the editor(s) disclaim responsibility for any injury to people or property resulting from any ideas, methods, instructions or products referred to in the content. |
© 2024 by the authors. Licensee MDPI, Basel, Switzerland. This article is an open access article distributed under the terms and conditions of the Creative Commons Attribution (CC BY) license (https://creativecommons.org/licenses/by/4.0/).