Abstract
In the last few years, many space surveillance initiatives have started to consider the problem represented by resident space object overpopulation. In particular, the European Space Surveillance and Tracking (EUSST) consortium is in charge of providing services like collision avoidance, fragmentation analysis, and re-entry, which rely on measurements obtained through ground-based sensors. BIRALES is an Italian survey radar belonging to the EUSST framework and is capable of providing measurements including Doppler shift, slant range, and angular profile. In recent years, the Music Approach for Track Estimate and Refinement (MATER) algorithm has been developed to retrieve angular tracks through an adaptive beamforming technique, guaranteeing the generation of more accurate and robust measurements with respect to the previous static beamforming approach. This work presents the design of a new data processing chain to be used by BIRALES to compute the angular track. The signal acquired by the BIRALES receiver array is down-converted and the receiver bandwidth is split into multiple channels, in order to maximize the signal-to-noise ratio of the measurements. Then, the signal passes through a detection block, where an isolation procedure creates, for each epoch, signal correlation matrices (CMs) related to the channels involved in the detection and then processes them to isolate the data stream related to a single detected source. Consequently, for each epoch and for each detected source, just the CM featuring the largest signal contribution is kept, allowing deriving the Doppler shift measurement from the channel illumination sequence. The MATER algorithm is applied to each CM stream, first estimating the signal directions of arrival, then grouping them in the observation time window, and eventually returning the target angular track. Ambiguous estimates may be present due to the configuration of the receiver array, which cause spatial aliasing phenomena. This problem can be addressed by either exploiting transit prediction (in the case of cataloged objects), or by applying tailored criteria (for uncatalogued objects). The performance of the new architecture was assessed in real operational scenarios, demonstrating the enhancement represented by the implementation of the channelization strategy, as well as the angular measurement accuracy returned by MATER, in both nominal and off-nominal scenarios.
1. Introduction
Given the increasing number of objects orbiting around the Earth, usually addressed as resident space objects (RSOs), in-orbit overcrowding is posing many challenges that space agencies, institutions, and private companies worldwide are tackling. Since the start of space activities, about 6500 successful launches have taken place, for which approximately 16,990 objects have been placed into Earth orbit [1]. Among these, 11,500 are still orbiting, but only 9000 are active satellites. Furthermore, about 640 break-ups, explosions, collisions, or anomalous events resulting in fragmentation have been recorded. Those events have further contributed to an increase in the man-made objects orbiting population. As a result of this, 35,110 debris objects are regularly tracked by space surveillance networks and maintained in their catalogs. In addition to these, statistical models estimate that there are 36,500 objects greater than 10 cm, 1 million objects between 1 cm and 10 cm, and 130 million objects between 1 mm and 1 cm [1]. In particular, the presence of space debris may jeopardize the operative missions of active satellites, as the consequences of a possible collision with space debris range from cumulative erosion of satellite surfaces to possible catastrophic consequences for the satellite.
Currently, different strategies are being studied and adopted to guarantee safe operations. To this end, the Inter-Agency Space Debris Coordination Committee (IADC) [2] was founded in 1993 as a forum for technical exchange and coordination on space debris matters. Space debris has also been a recurring agenda item for the Scientific & Technical Subcommittee of the United Nations’ Committee on the Peaceful Uses of Outer Space (UNCOPUOS) since 1994.
In this context, both national and international Space Surveillance and Tracking (SST) programs have been established, such as the United States Space Surveillance Network (US-SSN) [3], the European Space Agency (ESA) Space Situational Awareness (SSA) program [4], and the European Union Space Surveillance and Tracking (EUSST) framework [5]. The latter groups European national agencies and institutions from 15 member states and is in charge of carrying out collision avoidance, fragmentation analysis, and re-entry prediction services, as detailed below.
In the collision avoidance service, a space object catalog is screened to detect and characterize possible conjunctions, and if the collision risk crosses a threshold value, a collision avoidance maneuver is planned [6]. Methodologies to compute the probability of collision can either be analytical, like the ones in [7,8,9], or numerical, like those in [10,11]. Concerning collision avoidance maneuver planning, recent research has focused on optimal approaches, both for impulsive [12] and low-thrust maneuvers [13]; moreover, in [14] differential algebra [15] is exploited to approximate finite burn arcs associated with either short alert times or the use of low-thrust propulsion. The fragmentation analysis service aims to identify and characterize in-orbit break-up, predicting the fragment cloud evolution to assess possible conjunctions with other satellites. In [16], a critical study was conducted to identify the best criterion to assess the event epoch from the fragment ephemerides. In [17], the PUZZLE algorithm was proposed, which screens a catalog of ephemerides, detects possible break-ups of satellites, and identifies those related to fragments, through the filters presented in [18]. In [19], a stochastic approach was proposed for identifying the fragmentation epoch from the parent last available ephemeris and a single fragment orbital state of uncertainty. Concerning fragment cloud evolution modeling, an analytical approach was proposed in [20] to describe the evolution of a cloud of small fragments in terms of the change in the spatial density under the effect of atmospheric drag. An operational example of the fragmentation service was represented by the campaign regarding the break-up of the Russian satellite COSMOS 1408 [21], which occurred as a consequence of a kinetic anti-satellite (ASAT) test. Finally, the goal of the re-entry prediction service is to monitor the trajectory of a satellite re-entering the atmosphere, while also assessing possible on-ground risks. The work in [22] investigated whether a criterion exists for choosing a suitable time to calibrate the ballistic parameter, in order to improve the accuracy of satellite re-entry predictions. The work in [23] analyzed the casualty risk represented by uncontrolled re-entry and the errors affecting the estimate of the satellite residual lifetime a couple of weeks before re-entry.
These services exploit orbital ephemerides obtained through orbit determination (OD) procedures [24,25,26], which leverage measurements obtained through ground-based sensors, represented by optical [27,28,29], laser [30,31], and radar [32,33] means. The latter are commonly used to track debris flying in low Earth orbit (LEO), which can be distinguished in tracking and survey radars. The former are usually exploited to refine the orbit of a target whose transit prediction is available (cataloged case), by running refined orbit determination (ROD) processes. The latter allow instead characterizing the target orbital state from the measurements acquired by a single transit, without the need for any motion prediction of the observed satellite (uncatalogued scenario). This enables carrying out an initial orbit determination (IOD) process, which is vital to characterize the orbits of fragments generated by an in-orbit break-up, as well as in the last phases of a satellite re-entry, when the environment crossed by the object is so perturbed that the transit prediction reliability does not last long. Examples of radars involved in European SST operations are described as follows.
The German Tracking and Imaging Radar (TIRA) [34] combines two radar systems: a tracking radar operated in L-band with a central frequency of 1.3 GHz and an imaging radar operated in Ku-band with a central frequency of 16.7 GHz. The 34 m reflector antenna enables the imaging of LEO satellites with a high radiometric resolution. The French GRAVES system (Grand Réseau Adapté à la Veille Spatiale) [35,36] is a bistatic radar working with a VHF continuous wave pure carrier transmission at 143.05 MHz. The transmitting station composes four linearly polarized transmitting arrays. In the receiver, digital static beamforming is performed in more than one thousand different directions to conduct survey observations, and signal processing is performed in real time at the receiver antenna site. The Spanish S3TSR [37] is a survey radar, exploiting a close monostatic configuration, and which operates in L band. The transmitting and receiving antennas are separate electronically scanning arrays. The German Experimental Space Surveillance and Tracking Radar (GESTRA) [38,39] is a close monostatic pulsed phased array radar operated in the L-band (at about 1.3 GHz). Both antenna frontends use planar phased arrays with a diameter of 3 m, integrated into 3-axis positioners, in order to point the FoV in all space directions. Finally, BIRALES [40] is an Italian bistatic radar, whose transmitter is represented by a single parabolic antenna, and the receiver is composed of a multi-receiver array.
With specific reference to BIRALES, this sensor is capable of providing target Doppler shift (DS), slant range (SR), and angular track measurements. This work introduces the design of a new data processing chain to enhance the accuracy and robustness of angular track measurements. The signal acquired by the BIRALES receiver array is down-converted, and the receiver bandwidth is split in multiple channels, in order to maximize the signal-to-noise ratio (SNR) of the measurements. Then, the signal passes through a detection block where an isolation procedure creates, for each epoch, signal correlation matrices (CMs) related to the channels involved in the detection and then processes them to isolate the data stream related to a single detected source. Consequently, for each epoch and for each detected source, just the CM featuring the largest signal contribution is kept, allowing the derivation of the DS time trend from the channel illumination sequence. Each CM stream is analyzed through an adaptive beamforming technique to estimate the signal direction of arrival (DOA), which represents the target angular position in the receiver field of view (FoV). Grouping the DOAs on the observation time window allows estimating the target angular track. Ambiguous estimates may be present due to the configuration of the receiver array, which causes spatial aliasing phenomena. This problem can be addressed by either exploiting transit prediction (in the case of cataloged objects), or by applying tailored criteria (for uncatalogued objects).
This article is organized as follows. First, the BIRALES sensor is described (Section 2) and the algorithm for the angular track reconstruction is presented (Section 3). Then, the design of the new data processing architecture used by BIRALES to compute the angular track is outlined (Section 4), and the performance of the approach is assessed based on real data applications (Section 5). Finally, the conclusions sum up the work and outline future developments (Section 6).
2. BIRALES
BIRALES stands for Bistatic Radar for LEO Survey, and it is an Italian radar sensor operating in a bistatic configuration, with a baseline of 580 km [40]. The receiver is a portion of the Northern Cross of Medicina Radiotelescope, located in Medicina (near Bologna), while the transmitter is a radio frequency transmitter (Trasmettitore a Radio Frequenza, TRF), located at the Italian Joint Test Range of Salto di Quirra (Sardinia).
Concerning the BIRALES receiver, the Northern Cross Radio Telescope is a T-shaped radar array, consisting of two perpendicular branches: the East–West (E–W) arm is 564 m long and is composed of a single 35 m wide cylindrical antenna, whereas the North–South (N-S) branch is composed of 64 parallel cylindrical antennas, each 23.5 m long and 7.5 m wide. These cylinders can only be mechanically pointed in elevation, along the local meridian. The mechanical elevation limit ranges from 18 degree to 90 degree in both the North and South pointing configurations. This mechanical pointing involves all the array elements.
The first portion, which is dedicated to the BIRALES receiving system called the 1N-section, is an array composed of eight cylindrical parabolic concentrators belonging to the N–S branch. Each cylinder contains four receivers installed on the focal line (aligned with the E–W direction). Therefore, the receiving system is composed of a matrix of 8 × 4 receivers spaced 5.67 m in E–W and 10 m in N–S directions, as represented in Figure 1. Currently, more portions of the N–S branch are gradually being added to the system, with the final goal of including all 64 cylinders, and a new transmitter is being developed and installed at a longitude closer to the receiver, to better intersect the beams of the two stations [41].
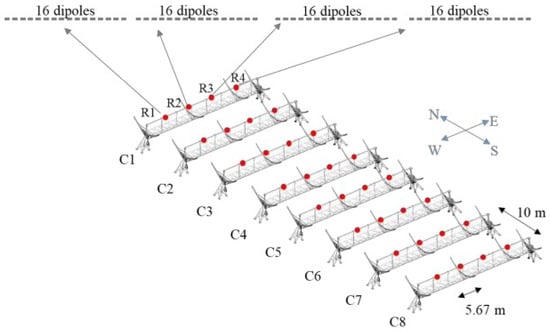
Figure 1.
BIRALES receivers (red dots) installed along the antenna focal line of the eight cylindrical parabolic concentrators called 1N-section. Each receiver contains 16 dipoles.
The transmitter is a single parabolic antenna able to transmit a theoretical peak power of 10 kW in the frequency range 410–415 MHz and it has a beamwidth of 7 degrees. The dish can be steered in both azimuth and elevation.
BIRALES owns two different systems, working at the same time: a multibeam continuous wave (CW) unmodulated radar system, operating at 410 MHz and used to measure DS, and a single beam pulse compressed radar system, based on a pulsed chirp at 412.5 MHz with a bandwidth of 4 MHz, for SR measurements. Since the receiver single beam for the compressed pulse currently covers just a portion of the 1N-section, there is no guarantee of having an SR measurement for any time a DS measurement is provided, and, even when present, the SR measurement tracks are generally shorter than the DS tracks.
Operationally, the CW is also used to generate angular track measurements exploiting the multibeam nature of the receiver array configuration. In the past, a data processing chain was designed, to employ a static beamforming technique which, from the illuminated beam history, can provide the time evolution of the angular coordinates in the receiver FoV [42]. Then, in recent years a new approach was developed to generate the angular track through an adaptive beamforming technique [43,44]. This method is less sensitive to the quality of the detected signal and enhances the angular measurements accuracy, both for cataloged and uncatalogued scenarios.
As mentioned in Section 1, this work focuses on this new approach, by presenting the design of a new data processing chain to optimally exploit this methodology in BIRALES operations. This, combined with the new transmitter station and the increase in the number of receivers involved in the BIRALES system, will improve the cataloging performance, in terms of the number of transits detected, the minimum detectable size, and the accuracy of angular track estimation.
3. Music Approach for Track Estimate and Refinement
As mentioned in Section 2, the methodology proposed in [43] is based on an adaptive beamforming technique to retrieve the target angular track in the BIRALES receiver FoV. The resulting music approach for track estimate and refinement (MATER) algorithm first estimates the signal DOAs through the MUSIC algorithm [45]. Then, these are clustered and time regression is performed to compute the angular profile. In this procedure, the algorithm also solves possible ambiguous estimations that may arise due to the receiver geometry, as discussed below.
The current section recaps the most remarkable points of the MATER algorithm.
3.1. Data Model
The signal received in time by an antenna can be expressed as follows:
where and s are the steering vector and the envelop of the signal impinging on the array, respectively. denotes the two angular deviations relative to the line of sight, in azimuth and elevation respectively, thus describing the signal DOA in the sensor reference frame. Finally, indicates the noise.
If sources are detected simultaneously, Equation (1) can be generalized:
Based on , the signal CM can be computed as
where is the expected value operator and is the hermitian of .
In the discrete time domain, is considered the number of samples integrated to generate one single CM. For the k-th sample, , and can be expressed as , and , respectively, and Equation (2) becomes
In this way, the discrete CM derived from integrating the samples can be expressed as
And the signal integration time is defined as
3.2. Multiple Signal Classification (MUSIC)
From , it is possible to estimate the signal DOA . Different approaches exist for this purpose, such as beamforming-based methodologies, and maximum likelihood and subspace methods [46]. As the name suggests, MATER employs the multiple signal classification (MUSIC) algorithm [45], which is outlined as follows.
Ideally, without any noise contribution, the rank is equal to the number of signal sources . In real scenarios, however, which are affected by noise, shows eigenvalues much larger than the other . Therefore, it is possible to split the space into signal and noise subspaces. Assuming the noise is uncorrelated with the signal, these two subspaces are mutually orthogonal. Denoting the largest eigenvalues matrix as and the corresponding eigenvectors subspace as and, similarly, indicating noise subspace matrices as and , the CM can be decomposed as
The MUSIC method [45] assumes that and span orthogonal complements, and (where is a identity matrix). Consequently, the estimate can be computed through the maximization of the following spectrum, which represents the array response to the impinging wave:
3.3. Ambiguity Problem
From the maximization of Equation (8), it is theoretically possible to estimate the signal DOA from the CM at each observation epoch, and these estimations can then be clustered to retrieve the angular track in the receiver FoV. However, a unique solution is only provided if the following condition is met [46]:
Equation (9) is analogous in the space-domain to the Shannon theorem: the mutual distance among array elements will be lower than half-wavelength. BIRALES does not respect this condition and, as a consequence, spatial aliasing occurs, resulting in spurious DOA estimations, with mutual spacing equal to
where and are the distances between receivers, measured in wavelengths, along the and directions, respectively. The integer indexes i and j indicate the i-th and j-th ambiguity, resulting in grating lobes, in the two directions. All these DOA estimations correspond to peaks in the array response described in Equation (8) and represent possible solutions. Figure 2 shows two array response examples, generated through simulated data based on BIRALES characteristics, in the case of one and two simultaneously detected sources.
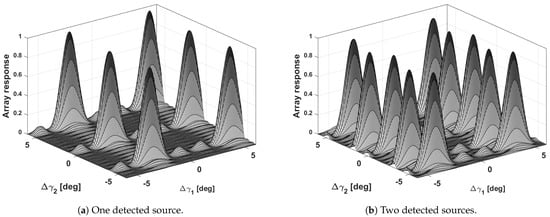
Figure 2.
MUSIC array responses, generated through simulated data based on BIRALES characteristics, for a single (a) and two sources (b) simultaneously detected.
Clustering and performing regression on all the estimated DOAs results in ambiguous angular tracks, out of which just one per observed target is correct. Thus, an ambiguity solving methodology can be identified.
3.4. MATER Algorithm
As mentioned above, MATER is a tailored algorithm aimed at computing the angular track of a target observed by BIRALES by exploiting the MUSIC algorithm. It is composed of a track estimation and a track refinement phase, and the procedure is different between cataloged and uncatalogued cases.
In a cataloged case, a transit prediction is available, and this is used as a first guess of the maximization of Equation (8). Consequently, a single DOA sequence is obtained at the end of the track estimation phase and is then clustered, as represented in Figure 3a for a simulated single-source scenario based on BIRALES characteristics. In this way, the ambiguity problem is solved and a quadratic regression in time, separately for the two angular coordinates, provides the angular track profile. Figure 3b shows the result of this track refinement phase.
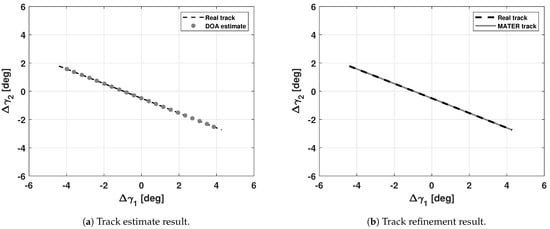
Figure 3.
Track estimate (a) and track refinement (b) results in the cataloged case.
In the uncatalogued case, however, given the CM related to one observation epoch, a preliminary coarse evaluation of Equation (8) is conducted on a discrete grid obtained by sampling the receiver FoV, thus searching for the maximum. The related angular coordinates provide one of the DOA first guesses, and the others are computed deterministically from the angular shift in Equation (10). These angular coordinates are used as first guesses of the maximization of Equation (8), and this allows computing all the DOA candidates (represented by the peaks in Figure 2a). Since no a priori information is available, all the solutions must be kept, and repeating this operation for all the observation epochs provides multiple DOA sequences at the end of the track estimation phase, as represented in Figure 4a. This, after the clustering and the time regression of the track refinement phase, results in multiple track candidates for each detected source, as shown in Figure 4b. Identifying the correct candidate would allow retrieving the same result as the cataloged case, which is the angular track in Figure 3b. To this end, some track candidates can be rejected according to geometrical considerations, like retaining only those that remain inside the receiver FoV during the entire detection. Although this allows reducing the problem in many operational applications, multiple tracks can remain after the application of this filtering. To overcome this problem, four ambiguity solving criteria were proposed in [43,44], which are summarized here.
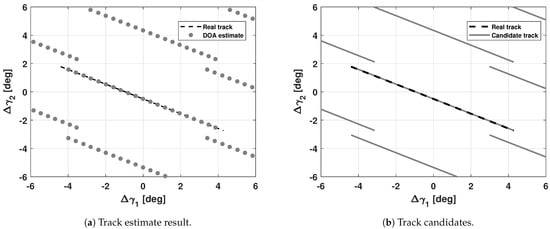
Figure 4.
Track estimate (a) and track refinement (b) results in the catalogued case.
3.4.1. Most Populated Cluster Criterion
The first criterion applies the assumption that the detected source spends a remarkable portion of the transit in a central part of the receiver FoV. At each observation epoch, just the DOA estimation closest to the center of the FoV is retained. This action is repeated throughout the transit, the DOAs are clustered, and the clusters are ranked based on the number of grouped estimations. Time regression is applied for each candidate, and the candidate tracks not respecting the geometrical constraint described above are rejected. Among the remaining candidates, the one related to the cluster with most DOA occurrences is considered correct.
This criterion works properly for transits respecting the assumption of spending a remarkable time in the central part of the receiver FoV. This is valid when the detected transit is accidentally located there, or when the observation has been scheduled for a specific target, and the schedule ensures it crosses through the center of the FoV (e.g., follow-up observation of a fragmentation event). For the same reason, this approach turns out to be less robust for transits that do not cross the center of the receiver FoV, which can occur either during a survey operation or while monitoring a re-entering object. In this latter scenario, the transit prediction used to schedule the observation can be unreliable, due to the highly perturbed dynamics of the target, and there is no guarantee that the object will cross the center of the FoV.
3.4.2. Delta-k Technique Based Criterion
From Equation (10) it can be noticed that signals at different frequencies experience different shifts of ambiguous estimation with respect to the correct solution, which instead stays fixed (being correct). Based on this, a criterion exploiting the delta-k technique was proposed in [44]. This criterion compares, at each time point, two sets of DOAs computed from two different CMs, with each one related to a specific frequency. Then, it selects the estimation presenting the smallest angular deviation, based on the fact that the ambiguous ones change from one frequency to another, while the correct solution theoretically remains fixed. The angular shift of the ambiguous solutions must exceed the difference in the angular position of the correct solution, which, although theoretically not changing from one set to another, presents an angular difference because of the noise effect. This poses constraints on the choice of the two frequency signals used, which must be different enough to induce a sufficient angular shift in the ambiguous estimations.
This procedure is repeated for all detection epochs, the solutions are clustered, and time regression is performed. The track candidate set is reduced based on the geometrical considerations above, and the angular profile related to the cluster presenting most DOAs is eventually selected.
The criterion based on the delta-k technique acts at a signal processing level and does not rely on any assumptions, but it requires computing the signal CMs at two sufficiently different frequencies. Considering the transmitted monochromatic signal whose reflection is exploited by BIRALES to create CMs, the detected signal, related to the same target, can be at different frequencies simultaneously for two reasons:
- Since the target is moving, its relative velocity with respect to the station changes during the signal integration time in which the CM is created. Thus, this induces different Doppler shift effects in the transmitted signal.
- Regardless of its attitude and tumbling, the different target surfaces move with a peculiar relative velocity with respect to the receiver, and this provokes Doppler shift effects in the transmitted signal.
A proper channelization strategy can create a signal CM at two different frequencies in the same epoch, as further discussed in Section 4. This theoretically allows the application of a criterion based on the delta-k technique. However, the frequency difference would be too small, preventing obtaining an angular shift that overcomes the angular difference induced by the noise.
3.4.3. Orbit Determination and Signal-to-Noise Ratio Criteria
The ambiguity solving operation can also take advantage of OD techniques. Given the angular tracks that passed geometrical filtering, an IOD is conducted to compute a target orbital state for each candidate. To this end, the algorithm presented in [25] is exploited, using either the measured SR, if available, or the SR reconstructed from the candidate angular track and the DS. In the latter situation, the approach illustrated in [47] is exploited. Then, the determined orbital state is propagated throughout the transit. For the OD criterion, the measurements are simulated and the Mahalanobis distance (MD) [48] with respect to the measurements used to determine the orbital state is computed. The MD undergoes a test, which provides a correlation index. Meanwhile, for the SNR criterion, each determined orbital state is propagated throughout the transit and the SNR is simulated, which is then compared to the one actually recorded. This procedure is conducted for all the angular track candidates, and the one featuring the best correlation index and the minimum SNR residual, for the OD and the SNR criterion, respectively, is considered correct.
These two criteria introduce OD procedures into the process, and this causes a dependency on the IOD algorithm used. Furthermore, additional measurements besides the signal CMs are necessary. It is worth pointing out that, for a detection of the CW system (the one used to compute the signal CM), the SR is not always available, because the beam of the ranging system is smaller, as mentioned in Section 2. Similarly, nor is the detected power always provided by the system, and this prevents applying the SNR criterion. On the contrary, the DS is derived from the same CM-based process and, thus, it is present each time there is a set of angular track candidates, as better detailed in Section 4. Thus, the OD criterion can always be applied through the IOD procedure based on angles and DS. However, the SR estimation from angles and DS is remarkably sensitive to the measurement quality, and this can deteriorate the robustness of the procedure.
3.5. MATER in Multiple Source Scenarios
Given that MUSIC is capable of estimating the signal DOA of multiple sources detected simultaneously, the MATER algorithm was extended in [49] for managing scenarios in which multiple targets are observed at the same time. This is typically the case for survey operations, fragment clouds [21], and proximity monitoring operations [50,51]. To this end, the same process as described in Section 3.4 can be used after having identified the number of detected sources at each time instant, which is the quantity in Equation (4). In [49], the criterion based on the delta-k technique was used to solve the ambiguity in an uncatalogued case. Figure 5 and Figure 6 show the MATER application, for cataloged and uncatalogued cases, respectively, for a scenario in which the detection of four sources overlapped in time. As in in [44], in the uncatalogued case, the ambiguity is solved through a delta-k technique-based criterion, as visible in Figure 6b, which shows the DOA estimation selection result.
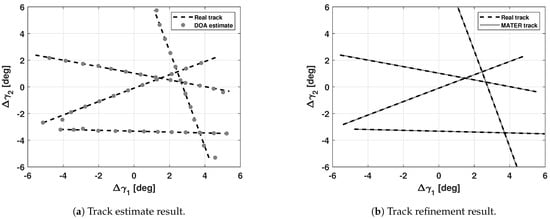
Figure 5.
Track estimate (a) and track refinement (b) results in the cataloged case for a multiple source scenario.
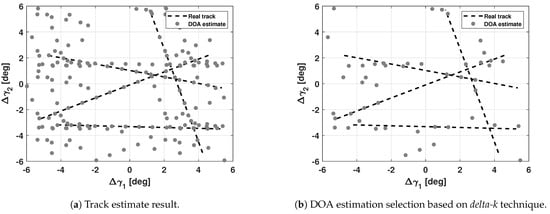
Figure 6.
Track estimate result (a) and the DOA estimation selection based on delta-k technique-based criterion (b) in the uncatalogued case for the multiple sources scenario.
4. Architectural Design
To employ the MATER algorithm in BIRALES, a proper data processing chain needed to be designed. In this operation, the most remarkable driver is represented by the maximization of the SNR linked to the detection, as it is proportional to the angular track accuracy returned by MATER. Given that the detected power is constrained by the maximum transmitter power and the observation geometry, a down-conversion strategy coupled with a channelization architecture was designed, to decrease the receiver bandwidth and, therefore, the related noise affecting the detection. The current section describes this pipeline and then focuses on the isolation block that allows computing the signal CMs, to cluster them per detected source, and to retrieve a single data stream to be used as input the MATER algorithm. Throughout this section, the workflow is described with the support of data acquired during an observation conducted on 18 April 2023, whose processing provides an operational example of the illustrated pipeline. This observation was scheduled for a transit of the satellite Sentinel-3B (norad ID 43437) and, during the acquisition, the satellite Starlink-4114 (norad ID 53162) was also detected. The high-level workflow of the data processing chain is presented in Figure 7 and is detailed as follows.
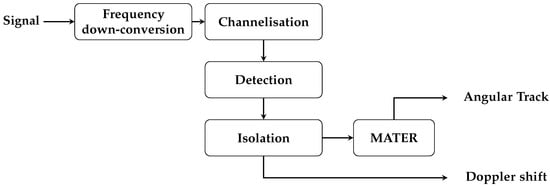
Figure 7.
Flow diagram of the BIRALES processing chain for the MATER algorithm.
During an acquisition, the signal is detected by the receiver with a 16 MHz bandwidth and is then digitized and down-converted to 85.54 kHz. The original pipeline used in the first MATER application directly created the signal CMs based on this bandwidth, but given the maximum transmitted power of 10 kW, this choice induced such a low SNR that the DOA estimation quality generally prevented accurate angular track computation. For this reason, a channelization strategy was implemented, which splits the receiver bandwidth into 8192 channels, reducing it from kHz to Hz. In this way, at a specific epoch related to a satellite detection, the signal is only present in those channels containing the transmitted frequency affected by the Doppler shift. As mentioned in Section 3.4 about the delta-k technique, these channels can be more than one, because of the relative motion between the target and station during the signal integration period (Equation (6)) and due to the different signal reflections on the target surfaces. In addition, multiple targets can be detected, as discussed in Section 3.5.
Subsequently, the channelized signal enters the detection block, where the signal CMs are created on a set of channels each 9.6 × , which represents the integration time, and are geometrically and instrumentally calibrated considering the observation pointing. Figure 8a shows all the eigenvalues (normalized based on the maximum value) of the signal CMs created, for a set of channels, in the acquisition time window regarding the observation on 18 April 2023, introduced above.
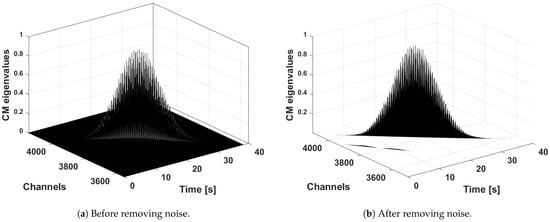
Figure 8.
CM eigenvalues related to the acquisition on 18 April, by function of the observation time window and illuminated channels, before and after removing noise. Two detection trends can be noticed: the largest CM eigenvalue trend represents the satellite Sentinel-3B, for which the observation was scheduled, while the smaller one concerns the satellite Starlink-4114, which was also detected during the acquisition.
At this point, a filtering operation rejects data connected to eigenvalues below a threshold value , which are considered noise, and the signal CM stream linked to a detected signal is identified. This operation is represented in Figure 8b, where it is possible to appreciate the presence of two detected sources: the largest CM eigenvalue trend represents the satellite Sentinel-3B, for which the observation was scheduled, while the smaller one concerns the satellite Starlink-4114, which was also detected during the acquisition (as mentioned above).
Once the signal detections have been identified, the workflow proceeds with the isolation block. First, the channel illumination sequence is clustered in time using the RANSAC algorithm [52], identifying the number of detected sources and isolating the data connected to a single transit, such that each data stream is separately analyzed. The result of this operation is represented in Figure 9a. Then, each channel cluster is analytically associated with a DS sequence through the following relationship:
where is the carrier frequency, the considered channel number, and and are the receiver bandwidths before and after the channelization, as defined above. The term represents the difference between the carrier frequency and the center of the bandwidth , while the term indicates the frequency shift related to the channel illumination. Equation (11) can be easily simplified as
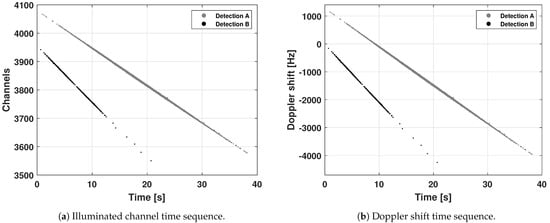
Figure 9.
Time evolution of the detected signal, in terms of illuminated channels and Doppler shift. Two detection trends can be noticed: the longer one (Detection A) is related to the detection of the satellite Sentinel-3B, while the shorter one is related (Detection B) to the satellite Starlink-4114.
It is worth pointing out that, in this way, the DS data resolution is determined by the term Hz, which is the single channel bandwidth. Thus, the channel illumination sequence is converted to the DS one using Equation (12), as represented in Figure 9b. It can be noticed that the trends are the same as in Figure 8.
Referring to Figure 9, it is worth highlighting that, in the central portion of the detection, both the channels and the DS tracks are thicker, as multiple channels are simultaneously illuminated. This indicates that, at a given observation epoch, multiple signals at similar frequencies were detected. Besides the above considerations, this can also occur in the case of fragment cloud and proximity operation monitoring, in which multiple targets feature, at the same time, similar Doppler shift effects in the transmitted signal. For the sake of simplicity, the current operational pipeline does not consider this situation, and focuses on the single source case.
To this end, the CM eigenvalue trends returned by the detection block are first isolated based on the channel clustering, as represented in Figure 10a, and then, for each cluster and for each observation epoch, just the CM related to the maximum eigenvalue is kept. Figure 10b shows the resulting time profile of the CM eigenvalues related to the channel featuring the largest eigenvalue. For each cluster, this action also reduces the DS measured to a single value per acquisition epoch returned by the pipeline, as visible from the trends in Figure 11.
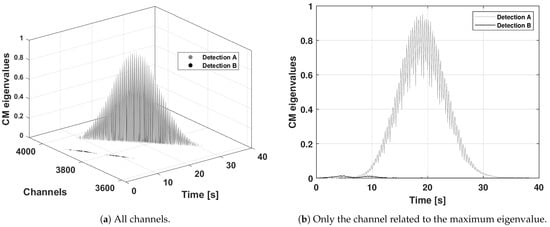
Figure 10.
Clustered CM eigenvalues related to the acquisition on 18 April. Two detection trends can be noticed: the larger eigenvalue one (Detection A) is related to the detection of the satellite Sentinel-3B, while the smaller eigenvalue is related (Detection B) to the satellite Starlink-4114.
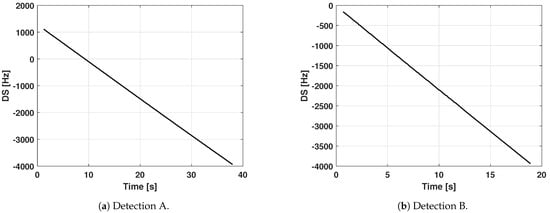
Figure 11.
Doppler shift time profile returned by the pipeline. Detection A refers to the satellite Sentinel-3B, while Detection B refers to the satellite Starlink-4114.
At this point, a single time profile of DS and signal CM stream per detected source is present, and the MATER algorithm can be run. To guarantee a finer DOA estimation, the track estimate phase is only applied on those epochs with a maximum CM eigenvalue above a threshold value, defined as
where is the threshold CM eigenvalue quantity used in the detection block. This operation reduces the number of epochs, to focus on in the track estimation phase of the MATER algorithm, while, in the track refinement phase, the time regression is conducted on all detection epochs. Figure 12 shows the angular tracks resulting from the MATER algorithm. It can be noticed that the angular profile (continuous black line) is longer than the path covered by the estimated signal DOAs. Indeed, the DOA estimation is carried out at the track estimate epochs, reduced as mentioned above, while the time regression is performed on all detection epochs, which last longer and can provide the angular track measurement at the same epochs as the DS measurement.
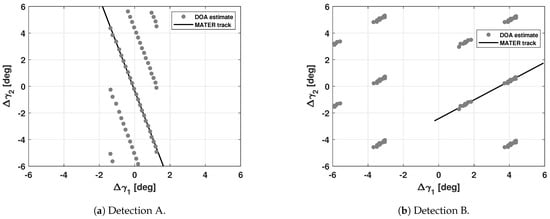
Figure 12.
DOA estimations and angular tracks returned by the MATER algorithm. Detection A refers to the satellite Sentinel-3B, while Detection B refers to the satellite Starlink-4114. The angular track (continuous black line) is longer than the path covered by the estimated signal DOAs, as the former is related to all detection epochs, while the latter is related to a reduced time window, guaranteeing a more accurate DOA estimation in the track estimate phase of the MATER algorithm.
The angular tracks are eventually returned by the pipeline with the DS time profile previously computed (Figure 11).
5. Operational Applications
The current section presents the application of the data processing architecture presented in Section 4 to operational scenarios. In particular, Section 5.1 shows the benefit gained using the designed pipeline in retrieving more accurate and denser measurements with respect to the original implementation, as well as showing an operational application of the MATER algorithm to a multiple source scenario. Then, Section 5.2 describes an application during the monitoring of a satellite re-entry, demonstrating the success of MATER in also computing the angular track measurement when the transit prediction is not reliable. Finally, Section 5.3 assesses the performance of MATER and the designed architecture on a set of real observation data.
5.1. SARAL Transit Observation
On 2 December 2022, the SARAL satellite was observed and data were processed with the original pipeline, which created a single CM stream using a 85.54 kHz bandwidth, as the channelization had not yet been implemented. This necessitated a longer integration time, equal to 4.8 × s, such that a sufficient signal contribution was present in each CM. During the entire transit acquisition, an additional source was detected, whose signal was more intense than the target one and lasted longer. This can be visualized in Figure 13a, which reports the two largest CM eigenvalues: it can be appreciated that the largest value remained almost constant throughout the acquisition, while the smaller value featured the usual belt shape of a satellite detection.
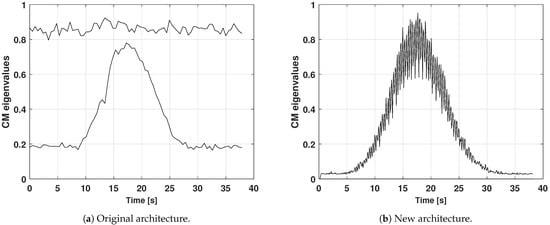
Figure 13.
SARAL satellite observation: eigenvalue time trend. By processing the data with the original architecture (a), that is without the channelization strategy, the two largest CM eigenvalue trends could be identified, related to a Cassiopea-A radio-astronomical source (the larger) and to the target satellite (the smaller). With the new architecture pipeline (b), just the latter trend remained.
To have a more effective insight into the problem, the MATER algorithm was run considering the two detected sources, that is, by applying the multiple source scenario described in Section 3.5. Figure 14a shows the BIRALES array response at a generic observation epoch, where two simultaneous DOA estimations, with related ambiguities, can be noticed. The result of MATER is represented in Figure 15a, where the target angular track returned by the algorithm and the related DOA estimation are clearly visible. In addition, besides the noisy solutions randomly spread on the FoV, four concentric clusters could be visualized: they feature circles rather than tracks, indicating that the related source remained reasonably fixed throughout the acquisition, and this was connected to the constant behavior shown by the maximum CM eigenvalue trend shown in Figure 13a. To understand the origin of the signal, the CM stream was geometrically calibrated with respect to the most intense radio-astronomical sources in the sky, one by one, and then processed through MATER. One of the four clusters was eventually aligned towards a Cassiopea-A radio-astronomical source (the other 3 being the related ambiguities), whose right ascension and declination are reported in Table 1. This also justified why its CM eigenvalue trend was larger than the target one. Indeed, on the one hand, radio-astronomical sources radiate at all frequencies, that is, over all the 85.54 kHz receiver bandwidth; on the other hand, the frequency reflected by the satellite involved only a specific portion of this bandwidth. This implies that, in a single CM, the Cassiopea-A signal power contribution is always larger than the SARAL satellite contribution.
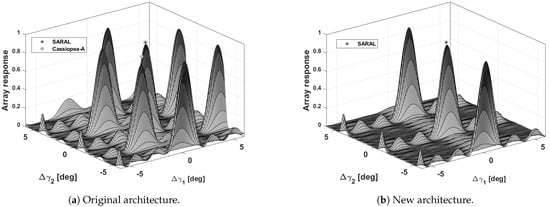
Figure 14.
SARAL satellite observation: array response at a generic acquisition epoch. By processing the data with the original architecture (a), that is, without the channelization strategy, both the DOA estimation of the Cassiopea-A radio-astronomical source and that of the target satellite can be noticed, together with the related ambiguities. With the new architecture pipeline (b), at the same generic epoch, only the DOA estimation of the target satellite remains, together with the ambiguous solutions.
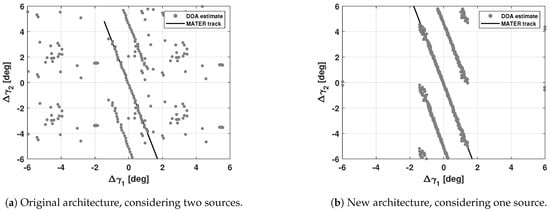
Figure 15.
SARAL satellite observation: MATER angular track. By processing the data with the original architecture (a), that is, without the channelization strategy, the DOA estimations of both the Cassiopea-A radio-astronomical source (circle clusters) and that of the target satellite (which constitutes angular sequences) can be noticed. With the new architecture pipeline (b), only the DOA estimations related to the target satellite remain. It can be also noticed that the DOA estimations in the new architecture are denser than in the original one, because of the shorter integration time, and the angular track returned by MATER is longer.

Table 1.
Coordinates of Cassiopea A radio-astronomical source.
The same observation data were processed again with the new pipeline presented in Section 4. In this way, the Cassiopea-A interference was rejected, and it is not present in Figure 13b. For this reason, MATER in the single source scenario was applied, as represented in Figure 14b and in Figure 15b. In addition, it can be noticed that the data plotted in Figure 13b and Figure 15b are denser with respect to Figure 13a and Figure 15a, and this was due to the shorter integration time used in the new pipeline (9.6 × s, as mentioned in Section 4). Finally, the detection time turned out to be longer, as more epochs presented a sufficiently effective signal power thanks to the channelization strategy, and this can be visualized in the larger base of the belt shape graph in Figure 13b and in the longer angular track returned by MATER in Figure 15b, which lasted 36.14 s.
Therefore, the new architecture is capable of compensating for interference signals, even when these are radiated by sources in the sky, as well as guaranteeing a longer angular track measurement duration.
5.2. Aeolus Re-Entry
The first operational involvement of the new architecture illustrated in Section 4 was represented by the monitoring of the assisted re-entry of the Aeolus satellite of ESA, which occurred on 28 July 2023, around 18:42 UTC [53]. EUSST supported ESA, in a first collaboration of this kind, and BIRALES contributed to the re-entry campaign by observing the target on 26 July and 27 July. During the latter observation, Aeolus was maneuvering and this, combined with the highly perturbed environment the satellite was crossing, required running the MATER algorithm in the uncatalogued case. From Table 2, which shows the Aeolus orbital parameters at the first detection epoch, it is possible to appreciate the low altitude (around 240 km) the satellite was flying at during the acquisition. Nevertheless, the MATER algorithm was capable of providing the correct angular track (lasting 12.37 s), as represented in Figure 16, by removing ambiguous angular track candidates thanks to the geometrical filters (thus, with no need of the criteria discussed in Section 3.4).

Table 2.
Observation of the Aeolus satellite on 27 July 2023, during its assisted re-entry: target orbital parameters in the first detection epoch.
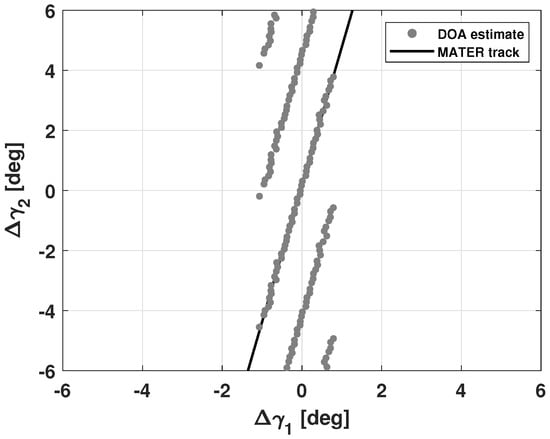
Figure 16.
Observation of the Aeolus satellite on 27 July 2023, during its assisted re-entry: DOA estimations and angular track returned by the MATER algorithm in the uncatalogued case. The ambiguity was solved thanks to the geometrical filters.
The difference with respect to the transit prediction, provided by the two-line element from Space-Track [54], is reported in Table 3 in terms of the root mean square error (RMSE), defined as
where and stand for the estimated angular position and the position provided by the prediction, respectively, at the i-th detection epoch, whose total number was N. Considering the angular position estimated by MATER closest to the center of the FoV and comparing the related detection epoch to that at which the transit prediction provided the closest quantity (indicated as ), it was possible to asses the time difference between the estimation and prediction, as follows:

Table 3.
Observation of the Aeolus satellite on 27 July 2023, during its assisted re-entry: MATER algorithm results in terms of the angular RMSE and time difference with respect to the transit prediction, for the two angular coordinates separately. The equal time difference between the two coordinates indicated that the RMSEs were due to a transit prediction delay rather than to an incorrect result being returned by MATER.
Table 3 reports this evaluation for each angular coordinate separately, and it can be noticed that both gave the same result. This confirmed that the angular RMSE was due to the predicted transit delay rather than due to an estimation inaccuracy, as otherwise the two time differences would not be equal. This is also confirmed in Figure 17, where the MATER and predicted angular tracks are parallel along both angular coordinates. Finally, Figure 17b shows the BIRALES array response at a generic acquisition epoch, where the angular shift of the predicted value with respect to the estimation can be seen.
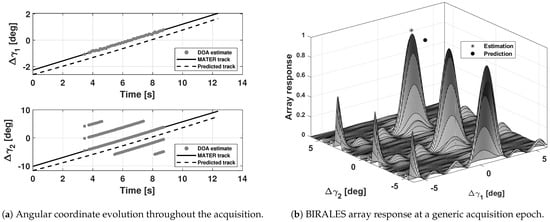
Figure 17.
Observation of the Aeolus satellite on 27 July 2023, during its assisted re-entry: transit prediction delay with respect to the MATER estimation represented through the angular coordinate evolution throughout the entire acquisition (a) and using the BIRALES array response at a generic acquisition epoch (b).
To recap, this real case scenario confirmed the operational reliability of both the MATER algorithm and the new architectural pipeline in providing angular track measurements in off-nominal conditions, like the Aeolus re-entry monitoring.
5.3. Calibrators Data Set
The performance of the new architecture was assessed by testing it against a large set of real observations for which an accurate orbital prediction was available. Namely, 29 transits of 7 calibrator satellites from the International Laser Ranging Service catalog [55], listed in Table 4, were analyzed. Their orbital features are represented in Figure 18 using the cumulative distribution function (CDF) of the semi-major axis and eccentricity (describing the orbital shape), as well as of the inclination and of the right ascension of the ascending node (describing the orbital orientation), all evaluated at the observation epoch. All the targets flew in LEO at altitudes ranging from about 700 to 1300 km in low eccentricity orbits, whose inclination varied from about 66 deg to 98 deg. The analysis was conducted for both the cataloged and the uncatalogued pipeline. Since observations were scheduled for these transits, the correct angular track was expected to spend a remarkable portion of time in the center of the receiver FoV, and this motivated selecting the maximum occurrence criterion to solve the ambiguity in the uncatalogued case.

Table 4.
Calibrator satellites from the International Laser Ranging Service catalog [55] observed by BIRALES, and whose acquisition data were analyzed to assess the performance of the new architecture. The number of analyzed transits per satellite is also reported.
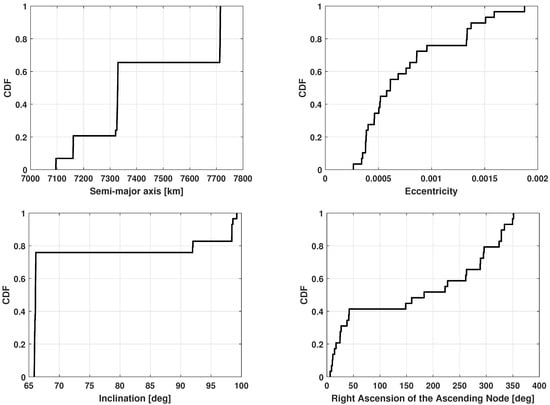
Figure 18.
Calibrator data set: cumulative distribution functions describing the orbits of the observed objects at the detection epoch. The orbits are represented in terms of the semi-major axis, eccentricity, inclination, and right ascension of the ascending node.
Figure 19 shows the CDFs of the RMSE, defined as in Equation (14), for both cataloged and uncatalogued cases, and for the two angular coordinates separately. In addition, Table 5 reports the three quartiles (25%, 50%, 75%) of the RMSE, defined as in Equation (14). Overall, the cataloged and uncatalogued cases showed similar results, and the angular track turned out to be more accurate along the direction than along the direction, although the latter direction had a larger number of receivers (8 against 4, as described in Section 2) and should have granted a finer estimation. As pointed out in the numerical simulations in [44], this was due to the length of the angular path traveled during the integration time, which was longer along than along , given the high inclinations of the orbits considered. It is also worth pointing out that, for the uncatalogued case, the results were only reported when the ambiguity was correctly solved, which was in all cases but one. This regards the observation of the satellite COSMOS 2517 (norad ID 41579), conducted on 7 April 2022, whose MATER result is represented in Figure 20: it can be noticed that the satellite was detected despite being out of the [−6, +6] deg receiver FoV, whose center was not crossed by the source.Thus, the maximum occurrence criterion failed, as it relies on the assumption that the source spends a remarkable amount of time in the center of the receiver FoV.
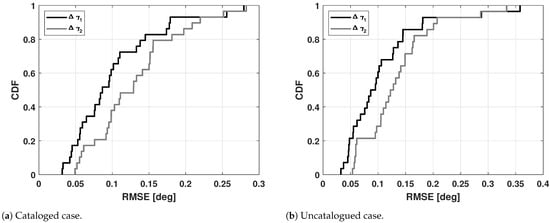
Figure 19.
Calibrator data set: cumulative distribution functions of the angular RMSE, for both cataloged and uncatalogued cases, for the two angular coordinates separately. Overall, the cataloged and uncatalogued cases showed similar results, and the angular track turned out to be generally more accurate along the direction than along the one, because of the length of the angular path traveled during the integration time.

Table 5.
Calibrator data set: results of the real data validation of the MATER algorithm in terms of the three quartiles (25%, 50%, and 75%) of the angular RMSE, for both cataloged and uncatalogued cases, and for the two angular coordinates separately. Overall, the cataloged and uncatalogued cases featured similar results, and the angular track turned out to be generally more accurate along the direction than along the one, because of the length of the angular path traveled during the integration time.
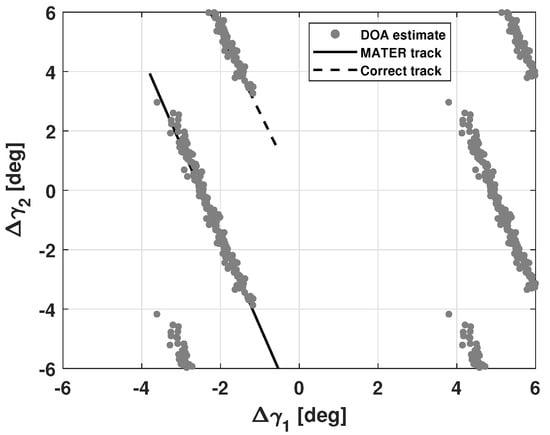
Figure 20.
Calibrators data set: angular track and DOA estimations returned by the MATER algorithm for the observation of the satellite COSMOS 2517 (norad ID 41579) conducted on 7 April 2022. An incorrect angular track was returned by the exploited ambiguity solving criterion, as the assumption that the source spent a remarkable portion of the transit in the central region of the receiver FoV was not matched.
To summarize, the real data set analysis confirmed the capability of the new architecture to provide the angular track measurement, both in the cataloged and uncatalogued case. However, in the latter situation, the maximum occurrence criterion could fail when the transit did not cross the receiver FoV.
6. Conclusions
This work presented the design of a new data processing chain to be used by BIRALES to compute the angular track measurement using the MATER algorithm, which embeds an adaptive beamforming technique to estimate the signal direction of arrival from the signal correlation matrix. A channelization strategy conducted upstream allows both analyzing each detected source separately, and maximizing the signal-to-noise ratio, guaranteeing a longer and more accurate angular track is returned by the process.
Real application of the new data processing architecture showed an enhancement with respect to the former pipeline, and proved its operational capability in both nominal and off-nominal situations. However, when no transit prediction was available and the source did not transit through the center of the receiver FoV, the problem of the ambiguity in the signal direction of arrival estimation (due to array geometry) could not be solved, and an incorrect angular track was returned by the process.
Currently, this architecture is being implemented such that the operational path presented in this work is run automatically. To this end, a dedicated correlation block will be designed to link a measurement track to a cataloged object, which operationally will allow exploiting the transit prediction in solving the angular track ambiguity, thus reducing it to a cataloged case. Concerning the uncatalogued case, however, a more robust strategy to solve the ambiguity problem will be investigated, possibly by also defining an index that describes the reliability of the angular track returned by the process.
In addition, an improvement in the detection block would allow detecting the transit before the correlation, thus allowing the creation of signal correlation matrices on only those channels involved in the detection, saving computational time. Finally, the overall pipeline will be extended to include the other elements of the Northern Cross of Medicina Radiotelescope in the context of the BIRALES receiver upgrade.
Author Contributions
Conceptualization, M.M. and G.B.; methodology, M.F.M., M.M. and A.M.; software, M.F.M., M.A.D.L., M.M. and A.M.; validation, M.F.M., M.A.D.L. and A.M.; formal analysis, M.F.M. and M.A.D.L.; investigation, M.F.M., M.A.D.L. and M.M.; resources, G.B.; data curation, M.F.M. and M.A.D.L.; writing—original draft preparation, M.F.M.; writing—review and editing, M.F.M., M.A.D.L., M.M., G.B. and A.M.; visualization, M.F.M., M.A.D.L. and M.M.; supervision, G.B. and M.M.; project administration, G.B.; funding acquisition, G.B. All authors have read and agreed to the published version of the manuscript.
Funding
The research activities described in this paper were carried out with the contribution of the NextGenerationEU funds within the National Recovery and Resilience Plan (PNRR), Mission 4—Education and Research, Component 2—From Research to Business (M4C2), Investment Line 3.1—Strengthening and creation of Research Infrastructures, Project IR0000026—Next Generation Croce del Nord–Project Identification Code (CUP) C53C22000880006.
Data Availability Statement
No new data were created or analyzed in this study. Data sharing is not applicable to this article.
Conflicts of Interest
The authors declare no conflicts of interest.
Abbreviations
The following abbreviations are used in this manuscript:
| BIRALES | Bistatic Radar for LEO Survey |
| CDF | Cumulative Distribution Function |
| CM | Correlation Matrix |
| CW | Continuous Wave |
| DOA | Direction of Arrival |
| DS | Doppler Shift |
| ESA | European Space Agency |
| ESA-SSA | ESA Space Situational Awareness Programme |
| EUSST | European Union Space Surveillance and Tracking consortium |
| FoV | Field of View |
| IADC | Inter-Agency Space Debris Coordination Committee |
| IOD | Initial Orbit Determination |
| LEO | Low Earth Orbit |
| MD | Mahalanobis Distance |
| OD | Orbit Determination |
| RMSE | Root Mean Square Error |
| ROD | Refined Orbit Determination |
| RSO | Resident Space Object |
| SNR | Signal-to-Noise Ratio |
| SR | Slant Range |
| SST | Space Surveillance and Tracking |
| TRF | Radio Frequency Transmitter |
| UNCOPUOS | United Nations’ Committee on the Peaceful Uses of Outer Space |
| US-SSN | United States Space Surveillance Network |
References
- Space Debris by the Numbers. European Space Agency. 2023. Available online: https://www.esa.int/Space_Safety/Space_Debris/Space_debris_by_the_numbers (accessed on 9 December 2023).
- Space Debris Mitigation Guidelines. Inter-Agency Space Debris Coordination Committee (IADC). 2023. Available online: https://iadc-home.org (accessed on 9 December 2023).
- Chatters, M.E.P.; Crothers, M.B.J. Chapter 19—Space Surveillance Network. In AU-18 Space Primer; Air University Press, Maxwell Air Force Base: Montgomery, AL, USA, 2009; pp. 249–258. [Google Scholar]
- Flohrer, T.; Krag, H. Space surveillance and tracking in ESA’s SSA programme. In Proceedings of the 7th European Conference on Space Debris, Darmstadt, Germany, 18–21 April 2017; Volume 7. [Google Scholar]
- European Union Space Surveillance and Tracking. In EUSST Service Portfolio. Available online: https://www.satcen.europa.eu/keydocuments/EUSST_Service_Portfolio622b4b653172450001cfa321.pdf (accessed on 9 December 2023).
- Bonaccorsi, S.; Montaruli, M.F.; Di Lizia, P.; Peroni, M.; Panico, A.; Rigamonti, M.; Del Prete, F. Conjunction Analysis Software Suite for Space Surveillance and Tracking. Aerospace 2024, 11, 122. [Google Scholar] [CrossRef]
- Chan, F.K. Spacecraft Collision Probability; Aerospace Press: El Segundo, CA, USA, 2008. [Google Scholar]
- Serra, R.; Arzelier, D.; Joldes, M.; Lasserre, J.B.; Rondepierre, A.; Salvy, B. Fast and Accurate Computation of Orbital Collision Probability for Short-Term Encounters. J. Guid. Control Dyn. 2016, 39, 1009–1021. [Google Scholar] [CrossRef]
- García-Pelayo, R.; Hernando-Ayuso, J. Series for Collision Probability in Short-Encounter Model. J. Guid. Control Dyn. 2016, 39, 1904–1912. [Google Scholar] [CrossRef]
- Alfano, S. Satellite conjunction Monte Carlo analysis. Adv. Astronaut. Sci. 2009, 134, 2007–2024. [Google Scholar]
- Patera, R.P. General Method for Calculating Satellite Collision Probability. J. Guid. Control Dyn. 2001, 24, 716–722. [Google Scholar] [CrossRef]
- Bombardelli, C.; Hernando-Ayuso, J. Optimal Impulsive Collision Avoidance in Low Earth Orbit. J. Guid. Control Dyn. 2015, 38, 217–225. [Google Scholar] [CrossRef]
- De Vittori, A.; Palermo, M.F.; Lizia, P.D.; Armellin, R. Low-Thrust Collision Avoidance Maneuver Optimization. J. Guid. Control Dyn. 2022, 45, 1815–1829. [Google Scholar] [CrossRef]
- Armellin, R. Collision avoidance maneuver optimization with a multiple-impulse convex formulation. Acta Astronaut. 2021, 186, 347–362. [Google Scholar] [CrossRef]
- Armellin, R.; Di Lizia, P.; Bernelli-Zazzera, F.; Berz, M. Asteroid close encounters characterization using differential algebra: The case of Apophis. Celest. Mech. Dyn. Astron. 2010, 107, 451–470. [Google Scholar] [CrossRef]
- Di Mare, L.; Cicalò, S.; Rossi, A.; Alessi, E.M.; Valsecchi, G.B. In-Orbit Fragmentation Characterization and Parent Bodies Identification by Means of Orbital Distances. In Proceedings of the First International Orbital Debris Conference, Houston, TX, USA, 9–12 December 2019; Volume 2109, p. 6007. [Google Scholar]
- Romano, M.; Muciaccia, A.; Trisolini, M.; Di Lizia, P.; Colombo, C.; Di Cecco, A.; Salotti, L. Characterising in-orbit fragmentations with the PUZZLE software. In Proceedings of the 8th International Conference on Astrodynamics Tools and Techniques (ICATT), Virtual, 23–24 June 2021. [Google Scholar]
- Hoots, F.R.; Crawford, L.L.; Roehrich, R.L. An analytic method to determine future close approaches between satellites. J. Celest. Mech. Dyn. Astron. 1984, 33, 143–158. [Google Scholar] [CrossRef]
- Montaruli, M.F.; Di Lizia, P.; Cordelli, E.; Ma, H.; Siminski, J. A stochastic approach to detect fragmentation epoch from a single fragment orbit determination. Adv. Space Res. 2023, 72, 3713–3733. [Google Scholar] [CrossRef]
- Letizia, F.; Colombo, C.; Lewis, H.G. Analytical Model for the Propagation of Small-Debris-Object Clouds after Fragmentations. J. Guid. Control Dyn. 2015, 38, 1478–1491. [Google Scholar] [CrossRef]
- Muciaccia, A.; Facchini, L.; Montaruli, M.F.; Purpura, G.; Detomaso, R.; Colombo, C.; Massari, M.; Di Lizia, P.; Di Cecco, A.; Salotti, L.; et al. Radar observation and recontruction of Cosmos 1408 fragmentation. J. Space Saf. Eng. 2023, 11, 143–149. [Google Scholar] [CrossRef]
- Pardini, C.; Anselmo, L. Impact of the time span selected to calibrate the ballistic parameter on spacecraft re-entry predictions. Adv. Space Res. 2008, 41, 1100–1114. [Google Scholar] [CrossRef]
- Pardini, C.; Anselmo, L. Assessing the risk and the uncertainty affecting the uncontrolled re-entry of manmade space objects. J. Space Saf. Eng. 2018, 5, 46–62. [Google Scholar] [CrossRef]
- Tapley, B.D.; Schutz, B.E.; Born, G.H. Chapter 4—Fundamentals of Orbit Determination. In Statistical Orbit Determination; Tapley, B.D., Schutz, B.E., Born, G.H., Eds.; Academic Press: Burlington, NC, USA, 2004; pp. 159–284. [Google Scholar] [CrossRef]
- Siminski, J. Techniques for assessing space object cataloguing performance during design of surveillance systems. In Proceedings of the 6th International Conference on Astrodynamics Tools and Techniques (ICATT), Darmstadt, Germany, 14–17 March 2016; pp. 14–17. [Google Scholar]
- Montaruli, M.F.; Purpura, G.; Cipollone, R.; De Vittori, A.; Facchini, L.; Di Lizia, P.; Massari, M.; Peroni, M.; Panico, A.; Cecchini, A.; et al. An orbit determination software suite for Space Surveillance and Tracking applications. CEAS Space J. 2024. [Google Scholar] [CrossRef]
- Maruskin, J.M.; Scheeres, D.J.; Alfriend, K.T. Correlation of Optical Observations of Objects in Earth Orbit. J. Guid. Control Dyn. 2009, 32, 194–209. [Google Scholar] [CrossRef]
- Pastor, A.; Escribano, G.; Sanjurjo-Rivo, M.; Escobar, D. Satellite maneuver detection and estimation with optical survey observations. J. Astronaut. Sci. 2022, 69, 879–917. [Google Scholar] [CrossRef]
- De Vittori, A.; Cipollone, R.; Di Lizia, P.; Massari, M. Real-time space object tracklet extraction from telescope survey images with machine learning. Astrodynamics 2022, 6, 205–218. [Google Scholar] [CrossRef]
- Cordelli, E.; Vananti, A.; Schildknecht, T. Analysis of laser ranges and angular measurements data fusion for space debris orbit determination. Adv. Space Res. 2020, 65, 419–434. [Google Scholar] [CrossRef]
- Cordelli, E.; Schlatter, P.; Lauber, P.; Schildknecht, T. Use of a night-tracking camera for characterization and orbit improvement of defunct spacecraft. arXiv 2019, arXiv:1903.00210. [Google Scholar]
- Reihs, B.; Vananti, A.; Schildknecht, T. A method for perturbed initial orbit determination and correlation of radar measurements. Adv. Space Res. 2020, 66, 426–443. [Google Scholar] [CrossRef]
- Reihs, B.; Vananti, A.; Schildknecht, T.; Siminski, J.; Flohrer, T. Application of attributables to the correlation of surveillance radar measurements. Acta Astronaut. 2021, 182, 399–415. [Google Scholar] [CrossRef]
- Cerutti-Maori, D.; Rosebrock, J.; Carloni, C.; Budoni, M.; Klare, J. A Novel High-Precision Observation Mode for the Tracking and Imaging Radar TIRA—Principle and Performance Evaluation. In Proceedings of the 8th European Conference on Space Debris, Darmstadt, Germany, 20–23 April 2021; Volume 8. [Google Scholar]
- Muller, F. GRAVES Space Surveillance System: Life Extension and Upgrade Program. In Proceedings of the 7th European Conference on Space Debris, Darmstadt, Germany, 18–21 April 2017; Volume 7. [Google Scholar]
- Jouadé, A.; Barka, A. Massively Parallel Implementation of FETI-2LM Methods for the Simulation of the Sparse Receiving Array Evolution of the GRAVES Radar System for Space Surveillance and Tracking. IEEE Access 2019, 7, 128968–128979. [Google Scholar] [CrossRef]
- Gómez, R.C.; Besso, P.; Pinna, G.M.; Alessandrini, M.; Salmerón, J.M.; Prada, M.A.R. Initial operations of the breakthrough Spanish Space Surveillance and Tracking Radar (S3TSR) in the European Context. In Proceedings of the 1st NEO and Debris Detection Conference, Darmstadt, Germany, 22–24 January 2019; Volume 1. [Google Scholar]
- Wilden, H.; Bekhti, B.N.; Hoffmann, R.; Kirchner, C.; Kohlleppel, R.; Reising, C.; Brenner, A.; Eversberg, T. GESTRA—Recent Progress, Mode Design and Signal Processing. In Proceedings of the 2019 IEEE International Symposium on Phased Array System Technology (PAST), Waltham, MA, USA, 15–18 October 2019; pp. 1–8. [Google Scholar] [CrossRef]
- DLR. GESTRA—German Experimental Space Surveillance and Tracking Radar. Technical report, 58th session of the Scientific and Technical Subcommittee of UNCOPUOS. 2021. Available online: https://www.unoosa.org/documents/pdf/copuos/stsc/2021/tech-29E.pdf (accessed on 9 December 2023).
- Bianchi, G.; Naldi, G.; Fiocchi, F.; Di Lizia, P.; Bortolotti, C.; Mattana, A.; Maccaferri, A.; Magro, A.; Roma, M.; Schiaffino, M.; et al. A new concept of bi-static radar for space debris detection and monitoring. In Proceedings of the 2021 International Conference on Electrical, Computer, Communications and Mechatronics Engineering (ICECCME), Mauritius, Mauritius, 7–8 October 2021. [Google Scholar] [CrossRef]
- Bianchi, G.; Montaruli, M.F.; Roma, M.; Mariotti, S.; Di Lizia, P.; Maccaferri, A.; Facchini, L.; Bortolotti, C.; Minghetti, R. A new concept of transmitting antenna on bi-static radar for space debris monitoring. In Proceedings of the 2022 International Conference on Electrical, Computer, Communications and Mechatronics Engineering (ICECCME), Maldives, Maldives, 16–18 November 2022. [Google Scholar] [CrossRef]
- Losacco, M.; Di Lizia, P.; Massari, M.; Naldi, G.; Pupillo, G.; Bianchi, G.; Siminski, J. Initial orbit determination with the multibeam radar sensor BIRALES. Acta Astronaut. 2020, 167, 374–390. [Google Scholar] [CrossRef]
- Montaruli, M.F.; Facchini, L.; Lizia, P.D.; Massari, M.; Pupillo, G.; Bianchi, G.; Naldi, G. Adaptive track estimation on a radar array system for space surveillance. Acta Astronaut. 2022, 198, 111–123. [Google Scholar] [CrossRef]
- Montaruli, M.F.; Di Lizia, P.; Tebaldini, S.; Bianchi, G. Delta-k approach for space surveillance multireceiver radars. Astrodynamics 2024. [Google Scholar]
- Schmidt, R. Multiple emitter location and signal parameter estimation. IEEE Trans. Antennas Propag. 1986, 34, 276–280. [Google Scholar] [CrossRef]
- Van Trees, H.L. Arrays and Spatial Filters. In Optimum Array Processing; John Wiley & Sons, Ltd.: Hoboken, NJ, USA, 2002. [Google Scholar] [CrossRef]
- Yanez, C.; Mercier, F.; Dolado, J.C. A Novel Initial Orbit Determination Algorithm from Doppler and Angular Observations. In Proceedings of the 7th European Conference on Space Debris, Darmstadt, Germany, 18–21 April 2017; Volume 7. [Google Scholar]
- Mahalanobis, P.C. On the generalized distance in statistics. Proc. Natl. Inst. Sci. India 1936, 2, 49–55. [Google Scholar]
- Montaruli, M.F. Multireceiver radar technologies for space surveillance and tracking. Ph.D. Thesis, Politecnico di Milano, Milan, Italy, 2023. Available online: https://hdl.handle.net/10589/196600 (accessed on 22 December 2023).
- Faraco, N.; Maestrini, M.; Di Lizia, P. Instance Segmentation for Feature Recognition on Noncooperative Resident Space Objects. J. Spacecr. Rocket. 2022, 59, 2160–2174. [Google Scholar] [CrossRef]
- Maestrini, M.; De Luca, M.A.; Di Lizia, P. Relative Navigation Strategy About Unknown and Uncooperative Targets. J. Guid. Control Dyn. 2023, 46, 1708–1725. [Google Scholar] [CrossRef]
- Torr, P.; Zisserman, A. MLESAC: A New Robust Estimator with Application to Estimating Image Geometry. Comput. Vis. Image Underst. 2000, 78, 138–156. [Google Scholar] [CrossRef]
- Right on Track: Aeolus Reentry Map. European Space Agency. 2023. Available online: https://www.esa.int/ESA_Multimedia/Images/2023/08/Right_on_track_Aeolus_reentry_map (accessed on 22 December 2023).
- Space-Track. Space-Track Website. 2022. Available online: https://www.space-track.org/auth/login (accessed on 6 June 2022).
- International Laser Ranging Service. NASA. 2023. Available online: https://ilrs.gsfc.nasa.gov/ (accessed on 22 December 2023).
Disclaimer/Publisher’s Note: The statements, opinions and data contained in all publications are solely those of the individual author(s) and contributor(s) and not of MDPI and/or the editor(s). MDPI and/or the editor(s) disclaim responsibility for any injury to people or property resulting from any ideas, methods, instructions or products referred to in the content. |
© 2024 by the authors. Licensee MDPI, Basel, Switzerland. This article is an open access article distributed under the terms and conditions of the Creative Commons Attribution (CC BY) license (https://creativecommons.org/licenses/by/4.0/).