Article

Instrument to Study Plume Surface Interactions (PSI) on the Lunar Surface: Science Motivation, Requirements, Instrument Overview, and Test Plans

by
Ariana Bueno
1,*,
Michael J. Krasowski
2,
Norman Prokop
2,
Lawrence C. Greer
2,
Christina M. Adams
2 and
Nilton O. Rennó
1
1
Climate and Space Sciences and Engineering Department, University of Michigan, Ann Arbor, MI 48109, USA
2
NASA Glenn Research Center, Cleveland, OH 44135, USA
*
Author to whom correspondence should be addressed.
Aerospace 2024, 11(6), 439; https://doi.org/10.3390/aerospace11060439
Submission received: 23 April 2024 / Revised: 24 May 2024 / Accepted: 27 May 2024 / Published: 29 May 2024
(This article belongs to the Special Issue Spacecraft Sample Collection)

Abstract

:
Safe landings are imperative to accomplish NASA’s Artemis goal to enable human exploration on the Moon, including sample collection missions. However, a process known as plume surface interaction (PSI) presents a significant hazard to lunar landings. PSI occurs when the engine exhaust of a lander interacts with the surface ejecting large amounts of regolith particles at high velocities that can interfere with the landing, disturb the surface, and damage hardware. To better understand PSI, the particle impact event (PIE) sensor is being developed to measure the kinetic energy and the flux of ejecta during landings, to quantify the potential damage, and to quantify the ejecta displaced. Multiple parameters were estimated to define the PIE instrument requirements. These estimates demonstrate that ejecta can travel at velocities of up to 800 m/s and impact the surrounding area with energies of up to 400 µJ. A significant amount of ejecta can be deposited several 10 s of meters away from the landing site, modifying the surface and causing dust-related challenges. The PIE sensor will be launched for the first time in an upcoming lunar lander. Then, PIE measurements will be used to improve PSI prediction capabilities and develop mitigation strategies to ensure safe landings.

1. Introduction

1.1. Overview of PSI and Its Importance

NASA’s Artemis plan for lunar exploration aims to land astronauts and cargo on the Moon to conduct science investigations and technology demonstrations on its surface, including lunar sample collection missions. For Artemis to be successful, ensuring safe landings is a top priority. When landing on a planetary body, a process referred to as plume surface interaction (PSI) occurs, where rocket exhaust plumes impinge on the surface forcing regolith particles to be ejected from the surface at high velocities. This interaction can pose significant hazards during landings on the Moon. Regolith particles ejected from the lunar surface at high velocities can damage the spacecraft and nearby surface hardware, spoof navigation systems, as well as cause high convective heating of exposed hardware during powered descents and landings [1]. Of four recent lunar lander missions, Chang’e, SLIM, Nova-C, and Chandrayaan, it has been reported that Chang’e’s 3 ranging sensors were turned off from an altitude of 20 m above the surface because of PSI interference [2]. The displacement of ejecta from this interaction could pose problems to lunar surface investigations including sample collection missions by contaminating collection sites and causing damage to surface hardware.
To ensure the success of sustainable exploration missions in which landers play an important role, like sample collection missions, we must deepen our understanding of the potential risks by directly measuring PSI effects. This article discusses the on-going development of an instrument, the particle impact event (PIE) sensor, in collaboration between the University of Michigan (U-M) and the particle impact event (PIE) sensor team at NASA Glenn Research Center (GRC). PIE is one of various tools and instruments that have been recently developed to further advance PSI understanding [3,4,5,6]. The PIE instrument is being developed under the Game Changing Development (GCD) Program of NASA’s Space Technology Mission Directorate. This Program advances space technologies that may lead to entirely new approaches for the Agency’s future space missions and provide solutions to significant national needs. Specifically, PIE is being developed to support these plume surface interaction (PSI) study initiatives on the lunar surface. The data collected from PIE will shed new light on PSI effects and provide information to support engineers with the development of mitigation strategies for future lunar missions. PIE will also provide data to help advance dust mitigation technologies to mitigate dust contamination, gain new knowledge about the surface of the Moon, and reduce risks to surface sample collection.
Previous research on PSI by Mehta et al. [1] determined that PSI can be categorized into three types of distinct processes: erosion physics, ejecta dynamics, and plume physics. The PIE sensor measures ejecta dynamics and erosion physics effects including the quantification of ejecta speed and energy and the total displacement of ejected particles. Erosion physics occurs when the rocket exhaust directly transports regolith particles from the surface. Erosion physics processes can create depressions on the surface that could lead to destabilization of a lander upon touchdown, and damage hardware by unplanned contact with the surface. This process of depression formation is observed more commonly on Mars than on the Moon [7].
Ejecta dynamics refers to the lifting and acceleration of ejecta removed from the surface via erosion. This process is illustrated in Figure 1, on images taken during the Apollo 12 landing. Ejecta dynamics modify the environment, creating dust clouds that reduce visibility and interfere with radars and navigation systems during landings. PSI can eject regolith particles with velocities exceeding the lunar escape velocity (2.38 km/s), making it possible for ejected particles to affect spacecraft traveling around the Moon [8]. Thus, ejecta dynamics can cause long-term dust deposition on the lunar surface.
Plume physics processes refers to the plume gas interactions with the environment, which can lead to aerodynamic destabilization of spacecraft during landing and cause high convective heating. In addition, rocket plume gas injected into the permeable regolith can cause chemical contamination that can interfere with scientific measurements, while the ionization of plume gas can interfere with radar signals [10,11]. While plume physics processes are significant, PIE will not be measuring characteristics of the plume directly, but other instruments under development will be.

1.2. Past Missions

There is evidence that PSI caused various problems in past lunar missions, reinforcing the need to understand PSI to reduce the risks to future missions. For example, interpretations of transcripts from the Apollo 15 mission suggest that poor visibility caused by erosion physics and ejecta dynamics prevented the Apollo 15 lander crew from avoiding landing on a broad crater’s rim, causing the front footpad to remain entirely off the surface upon touchdown [11]. In the Apollo 11 mission, plume heating on the lander struts exceeded the design limits and charred the thermal blanket which in turn forced the redesign of the plume shield for the subsequent missions [12]. Indeed, pieces of Surveyor III returned to Earth showed clear evidence of damage caused by PSI during landings. Apollo 12 landed around 150 m away from Surveyor III, causing pitting and cracking by the impacts of ejecta from Apollo 12 [13].
Thus far, we have analyzed PSI mainly by observing video and transcripts from landings, and by developing numerical models to predict this interaction [14]. We learned from past observations that on the Moon, rocket plumes generally spread out with modest pressure perturbations on the surface sweeping away mostly loose material. This plume impingement can modify the surface texture over a wide area [7]. For mid-size landers (like the Apollo descent module), PSI begins when the lander is roughly 20–50 m above the surface and the plume spreads horizontally away from the impingement zone [15,16,17]. Based on images of Surveyor III’s surface pitting, shown in Figure 2, the range in velocity of impacts caused by PSI was estimated to be between 300 and 2000 m/s [13]. Analysis of Apollo landing videos and numerical simulations indicated that PSI caused rocks as large as 10 cm in size to move [17,18].
The engine configuration and operations procedure of the lander such as whether it is multi-engine, single engine, or a long hover could affect PSI. A multi-engine configuration could possibly redirect the plume back up into the spacecraft, while hovering could extend the PSI time span [19]. Depending on the lander size, photometric disturbance analysis on Apollo and Chang’e-5 landing sites show that surface disturbances can extend tens of meters away from the landing area [20,21]. Other things to consider include the landing location site and the regolith particles’ characteristics, especially for sample collection missions. There are still many unknowns in PSI, but PIE will get us one step closer to filling gaps in knowledge as it will collect in-flight data during landings.
To summarize, the two main science objectives of the PIE instrument measurements are (1) to characterize the PSI environment and (2) to determine the potential contamination inflicted by PSI on landing sites. These objectives are summarized in the traceability matrix, Table 1. PIE will help us meet these objectives by directly measuring PSI ejecta characteristics. It will also provide data to meet the technology objective of verifying current lunar dust transport models. This article describes the calculations performed to develop the instrument requirements, provides a brief description of the instrument and its capabilities, and discusses future tests needed to verify the instrument’s performance and qualifications for flight.

2. Development of Instrument Requirements—Method and Results

The PIE sensor’s main objectives are to measure the kinetic energy and flux of PSI ejecta. The kinetic energy of particle impacts can be used to determine the potential damage inflicted on a lander and surrounding hardware. The flux of ejecta can be used to estimate the total transport of regolith and potential site contamination caused by ejecta per landing event. To develop the PIE instrument requirements, the total particle flux per landing event, the ejecta velocity, and the duration of PSI events were estimated. In addition, the environmental conditions that the instrument will be required to survive and operate in are being considered.
PIE is a piezoelectric sensor that measures individual particle impacts so the size and energy range of the particles that will impact the sensor needs to be known. Upcoming lunar missions are set to land on the south pole of the Moon. In the absence of data and samples from this region, we use the size distribution obtained from Apollo regolith samples as an order of magnitude estimate of the range of particles expected to impact the PIE sensor [22]. The lunar regolith particle size distribution from regolith samples of seven landing sites on the Moon, including the Apollo missions analyzed by Carrier [23], is shown in Figure 3. It indicates that 33% of regolith (by mass) is fine sand (0.074 to 0.425 mm) and 51% is silt (0.002 to 0.07 mm) with a median diameter of 0.070 mm [23,24]. We consider the size range between 1 µm and 1 mm for our analysis to capture the range encompassing most of the ejecta size distribution.
Our calculations were based on impingements on a flat surface, with interactions with boulders and surface features like crater slopes and mounds neglected. Based on results from numerical simulations and the following lunar missions, Apollo, Chang’e, and Nova-C, we assume that the lunar lander altitude in which PSI starts ranges from 15 to 50 m above the surface, with an average around 30 m [2,7,25]. The estimates were based on a single impingement point, that is effects due to interactions of multiple plumes were neglected. The lunar regolith particles were assumed to be spherical and follow ballistic trajectories after leaving the PSI plume. PIE will most likely fly on a small class lander in the Commercial Lunar Payload Services (CLPS) initiative but at this point we do not know which exact lander PIE will fly on; thus, we use rough order of magnitude estimates to determine the instrument requirements.

2.1. Particle Flux and Time Duration

The particle flux estimation is based on data collected by the Apollo program. We use the total mass of regolith removed during an Apollo landing event to estimate the total number of particles ejected during a lunar landing. The total mass was estimated through video analysis of the Apollo landings. Several methods for estimating the mass of regolith removed are discussed by Metzger et al. [7] with the conclusion that it is reasonable to expect that between 1 ton and several (~5) tons of soil are ejected during an Apollo-like landing. We estimated the number of particles (n) in masses of regolith ejecta ranging from 1000 kg to 5000 kg by assuming the particles are spherical with sizes ranging from 1 µm to 1000 µm, and with a mineral density of 3100 kg/m3 [26]. The size distribution estimation we use is based on least squares fit to the data from Carrier’s [23] analysis. It follows from it that n~107 particles are ejected per landing event.
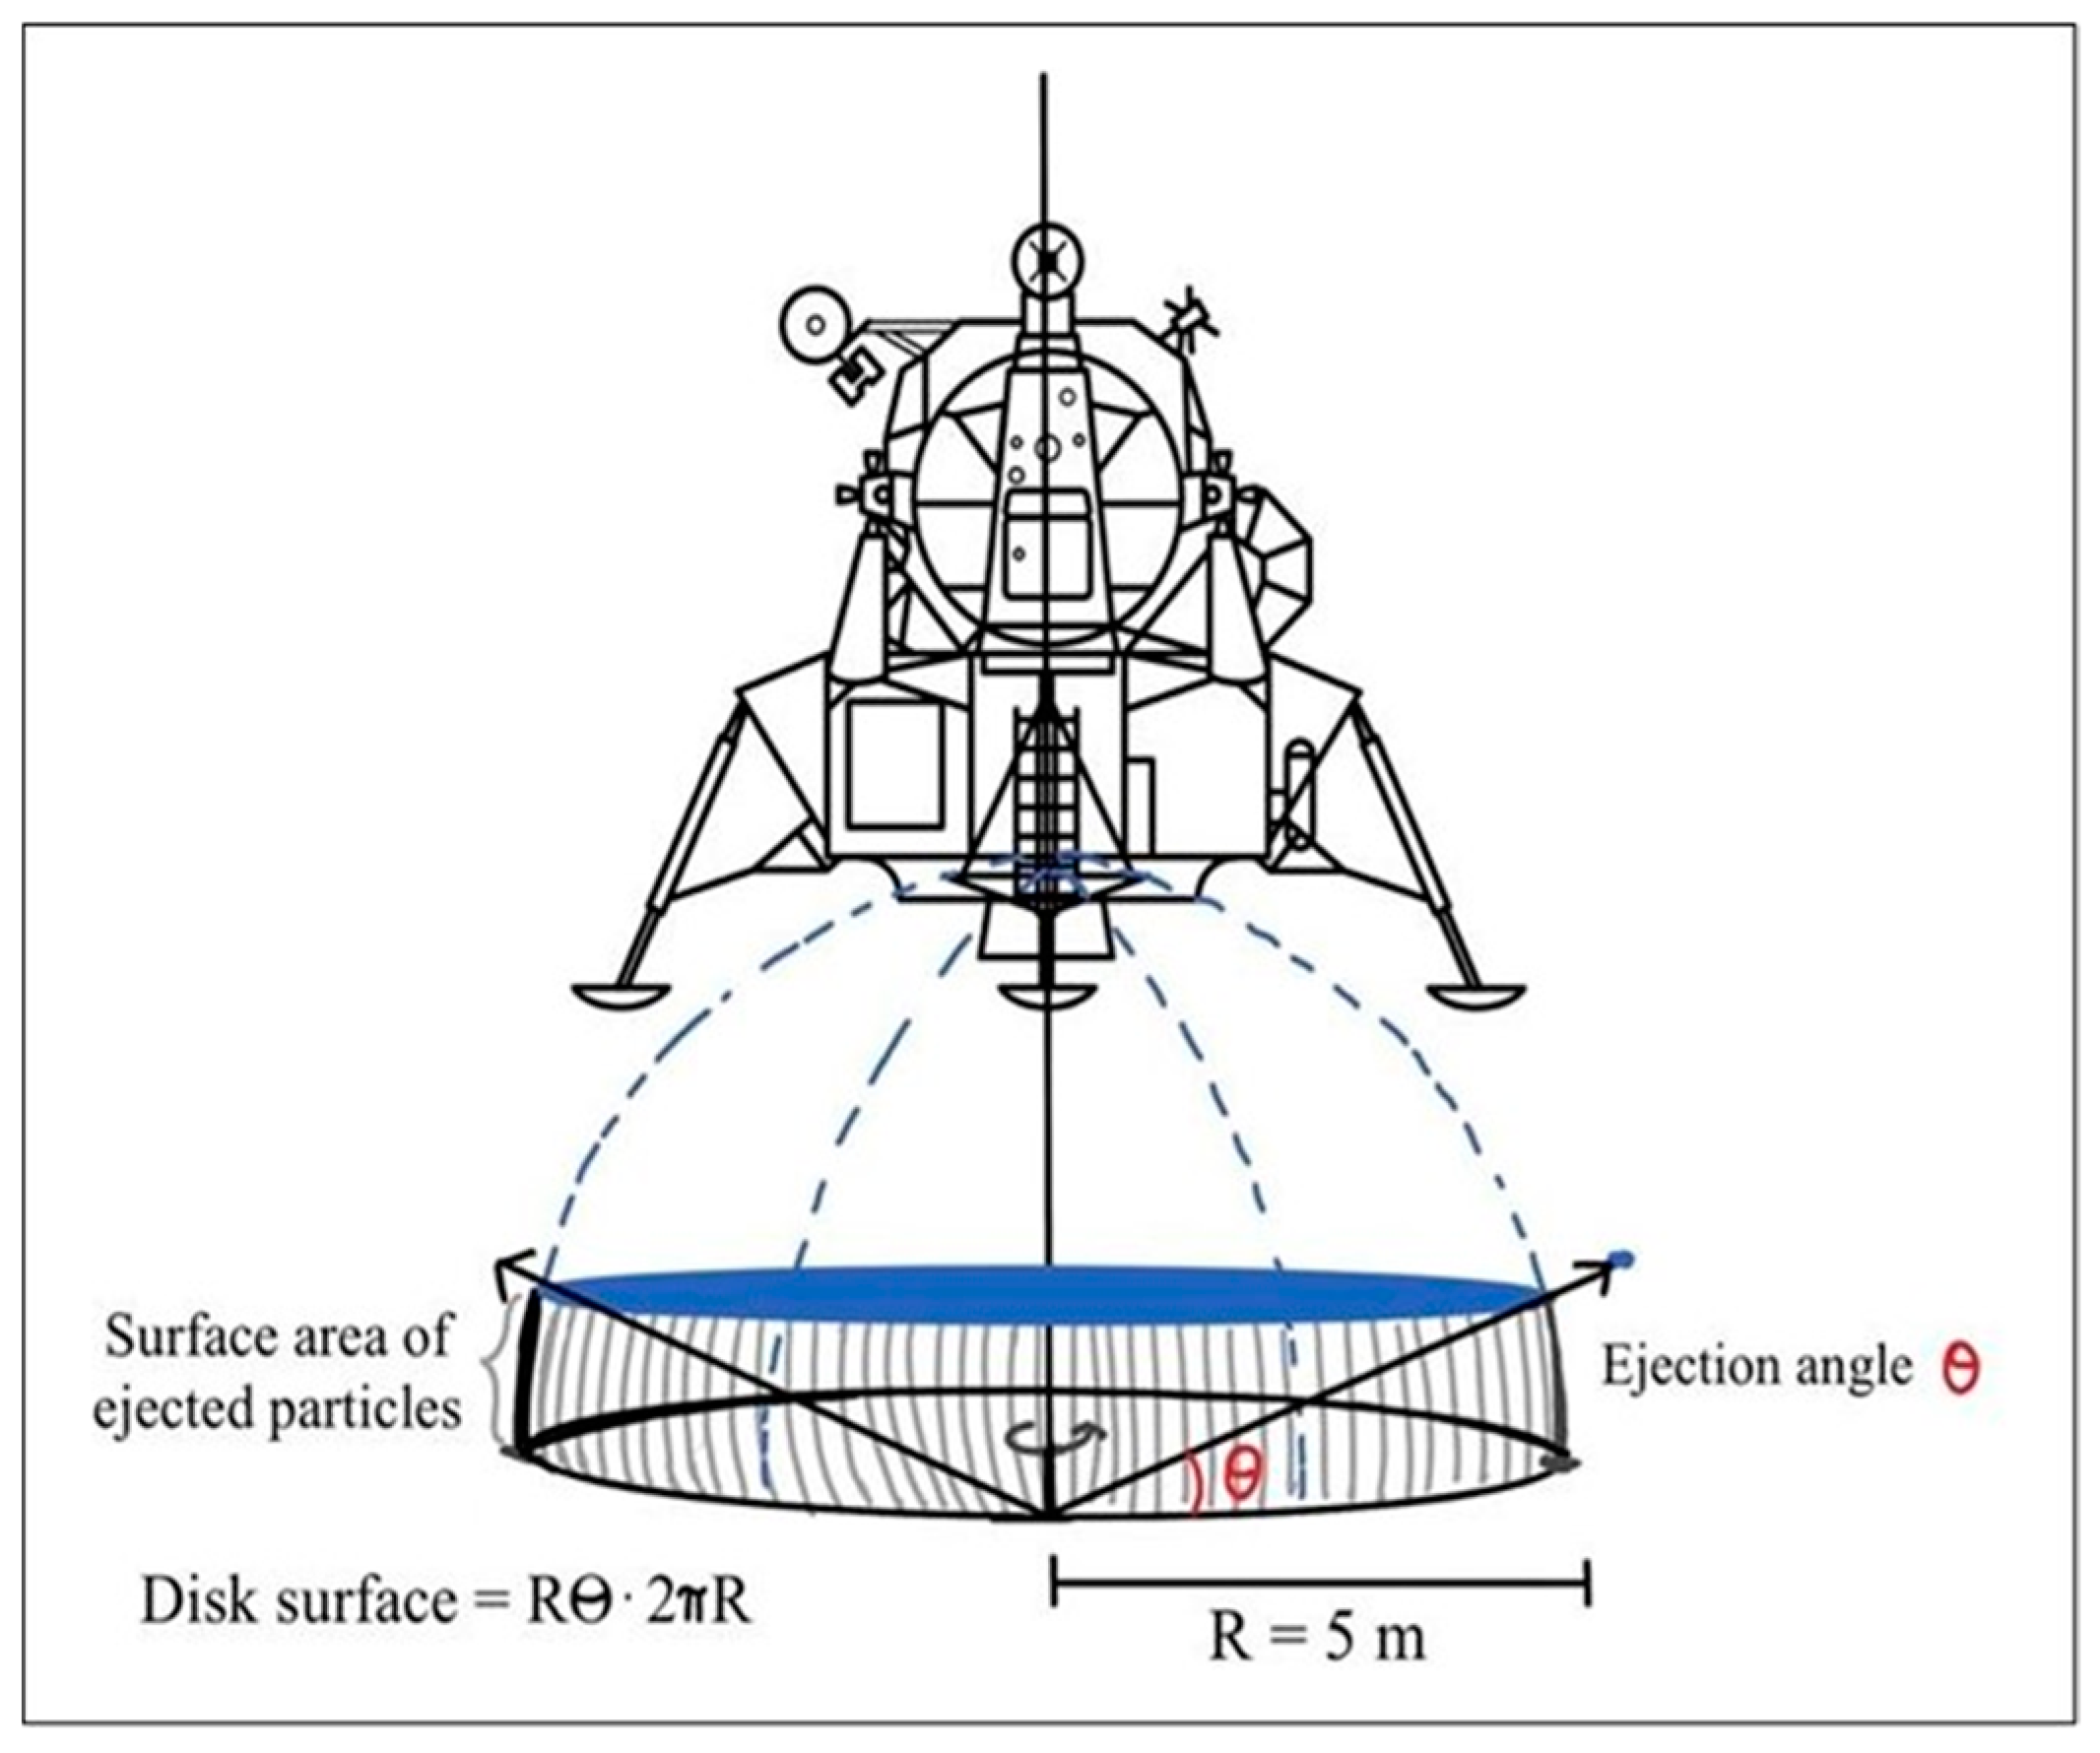
The particle flux is then calculated by dividing the total number of particles by the area around the lander enclosing the ejecta sheet at the distance in which PIE is expected to be placed, as illustrated in Figure 4, and the total time duration of the PSI event. The flux area encompasses a disk around the lander’s struts where PIE is expected to be mounted. Indeed, this is approximately the distance at which the probability of high-energy impacts by ejecta is highest as the lander gets closer to the surface. In this case, R is the radius of the lander including the landing struts and θ is the angle of ejection. This angle of ejection was estimated from Apollo mission data by Immer [17] and Lane et al. [18] using video photogrammetry to be θ ≈ 3 deg.
The total time of the plume surface interaction is estimated from Apollo transcripts. Taking into consideration multiple Apollo missions, we find that PSI lasts around 10–30 s. For example, Apollo 11 descended at ~0.7 m/s from around 15 m above the surface (the distance at which astronauts reported first signs of dust) to the surface [27] which gives us a total PSI time of about 20 s. With these order of magnitude estimates for time and area we get that the particle flux is on the order of 100,000 particles/m2·s or around 10 particles/cm2·s
For a smaller class lander (that is, for a Commercial Lunar Payload Services (CLPS) mission) we might expect a lower particle flux because of their smaller thrusters. However, a small class lander would have a smaller area enclosing the ejecta, and therefore the particle flux could be larger. A CLPS lander with around 1–4.5 kN of thrust compared to ~13–45 kN for the Apollo lander [28], with a ratio of 1:10, suggests that a smaller class lander would have a flux of around 10,000 particles/m2·s. This is supported by the scaling arguments provided in the next subsection.

2.2. Scaling for Landers of Various Sizes

Like Mehta’s scaling analysis for rocket plume flow physics [29], we develop scaling laws to generalize the PSI estimates for lunar landers of various size classes. The scaling of ejecta parameters such as particle velocity, kinetic energy, and fluxes are based on the values of dimensionless numbers derived using Buckingham’s Pi theorem with three primary dimensions, mass (M), length (L), and time (T), and the following physical variables relevant to PSI:
  • Plume gas density: [ρ] = M/L3
  • Plume gas velocity: [v] = L/T
  • Plume gas kinematic viscosity: [µ] = L2/T
  • Plume gas nozzle exit diameter: [D] = L
  • Lander altitude above the lunar surface at which PSI starts: [h] = L
  • Particle diameter: [d] = L
  • Particle mass: [mp] = M
  • Lander thrust force: [F] = M·L/T2
  • Lander descent velocity: [w] = L/T
  • Celestial body’s gravitational acceleration: [g] = L/T2
  • Regolith bulk density: [ρb] = M/L3
  • Regolith cohesion (pressure): [C] = M/(L·T2)
  • Speed of sound in the regolith: [c] = L/T
It follows from Buckingham’s Pi theorem that for n = 13 physical variables and m = 3 primary dimensions that n − m = 10 nondimensional numbers control the dynamics of plume soil interactions. Those nondimensional numbers are in addition to the nondimensional drag coefficient CD. Based on our physical understanding of PSI processes, we propose the following nondimensional numbers as the most relevant:
14.
a = D h
15.
R e = v D μ
16.
F r = v g D
17.
τ = h v w D
18.
β = F m p g
19.
ε = v w
20.
δ = v 2 h w μ
21.
f = 1 ρ b ρ p
22.
M a = v c
23.
σ = 4 F C π d 2
where (1) a represents geometrical similarity, a necessary condition for dynamical similarity, here represented by the ratio of the lander nozzle exit diameter (D) to the lander altitude from the lunar surface (h) at which PSI starts; (2) Re is the Reynolds number, the ratio between an ejecta particle’s inertial and viscous accelerations; (3) Fr is the Froude number, the ratio of an ejecta particle’s inertial and gravity accelerations; (4) τ is the ratio of the time of the plume interaction with the surface with the plume advection time; (5) β is the ratio of the lander thrust force with the gravitational force on the ejecta; (6) ε is the ratio of the plume gas velocity with the lander descent velocity; (7) δ is the ratio of the plume’s turbulence or eddy time scale, created as the lander descends towards the surface, to the plume’s viscous time scale; (8) f is the regolith porosity, the ratio of bulk regolith density with the median particle density; (9) M a is the Mach number, the ratio of the speed of the flow to the speed of sound in the regolith [30]; and (10) σ is the ratio of the lander thrust pressure (thrust force over nozzle exit area) with the cohesion of regolith particles [31].
The calculations we present in the next section for velocity and energy are for small size class landers; they are valid for the values of the various nondimensional numbers listed in Table 2 under the title “Small-Scale Lander”. When the values of these nondimensional numbers are like those for other size class landers such as the “Apollo Large-Scale Lander”, the results of our calculations can be directly applied to make predictions for them, because PSI is dynamically similar in both.
As shown in Table 2, the values of the nondimensional parameters for the small class lander we used for the calculation are like those for the larger Apollo lander, indicating that the results of our calculations for the small-scale lander applies to the larger-scale Apollo lander and vice versa. The values for the small lander were derived from Hutton [32]. For the Apollo lander scale, nondimensional parameters were derived from information provided by Morris et al. [28] and Fontes et al. [33]. The scaling parameters 1, 3, 4, 6, and 9 are the most relevant for similarity of PSI ejecta dynamics. Their values are roughly similar, demonstrating that the results of our calculations for velocity and kinetic energy for a small-scale lander can be applied to the larger scale lander. Rocket exhaust parameters like Re and δ vary because of differences in decomposition reactions of the plume gas and the variations in viscosity.
The parameters 5 and 10 are most relevant for thrust dynamics and regolith ejection, as pertaining to erosion physics. As indicated in Table 2, there is a difference in the magnitude of these nondimensional values, by a factor of 10, between the small-scale and the larger Apollo lander. This is because the larger lander has a much larger thrust force. The larger thrust force over the lander area pushing against similar cohesive and gravitational forces is expected to eject a larger amount of regolith particles during PSI. With this information we can refer to Section 2.1 where we calculated flux for an Apollo sized lander and can use the scaling parameter similarity to determine the potential flux for a small-scale lander. With these assumptions, we verify that a small class lander produces a flux of around 10,000 particles/m2⋅s.
The nondimensional number ƒ indicates how the type of regolith affects PSI. This nondimensional number depends on the density of the regolith which could change based on landing locations. This nondimensional number can be used in the future as we acquire knowledge on regolith properties at south pole landing sites. We conclude that our calculations can be used for lunar landers of various size classes, targeting different landing site locations.

2.3. Velocity and Energy Range

To provide an estimate of the maximum energy of impacts we first calculate the ejection velocity of lunar regolith particles. We calculate velocity as a function of particle size since particles of different sizes are affected by drag forces in the thruster plume differently, with smaller size particles following the gas velocity more closely than larger particles [18]. To determine the maximum ejection velocity, we estimate the acceleration due to the drag force from the plume gas, FD, and the frictional force, Ff, of loose particles on the regolith. In the drag force, ρ g is the plume gas density, u is the relative velocity u = (ugup), CD is the coefficient of drag (for a rough sphere, range between 0.3 and 0.6), and Ap is the cross-sectional area of the particle. In the frictional force, µ is the coefficient of friction [34] and g is the acceleration of gravity on the Moon. To estimate the particle mass, we use the regolith particle density, ρ p , and volume. Thus, we get:
1 2 ρ g u g u p 2 C D A p μ ρ p V g = ρ p V d u p d t
The first order differential Equation (1) is integrated to calculate the particle velocity, with the initial condition that the particle is at rest at time 0. We assume gas velocity of 2500 m/s and gas properties such as gas density for a single engine small class lander based on Hutton [32]. These values assume a nozzle height of 1.5 m and an initial distance of 1.5 m away from the plume stagnation point, which gives the maximum ejection velocity (below the lunar escape velocity). Here, the time of integration is the time the particle travels within the plume gas. Since we do not know the particle’s velocity (this is what we solve for), we cannot initially calculate the time it will be in the plume. Thus, we make a first guess for the time and then use an iterative procedure to calculate the actual time the particle is in the plume. The results shown in Figure 5 indicate that the maximum velocity from micron size particles is ~800 m/s, with the largest mm size particles traveling at velocities of ~10 m/s.
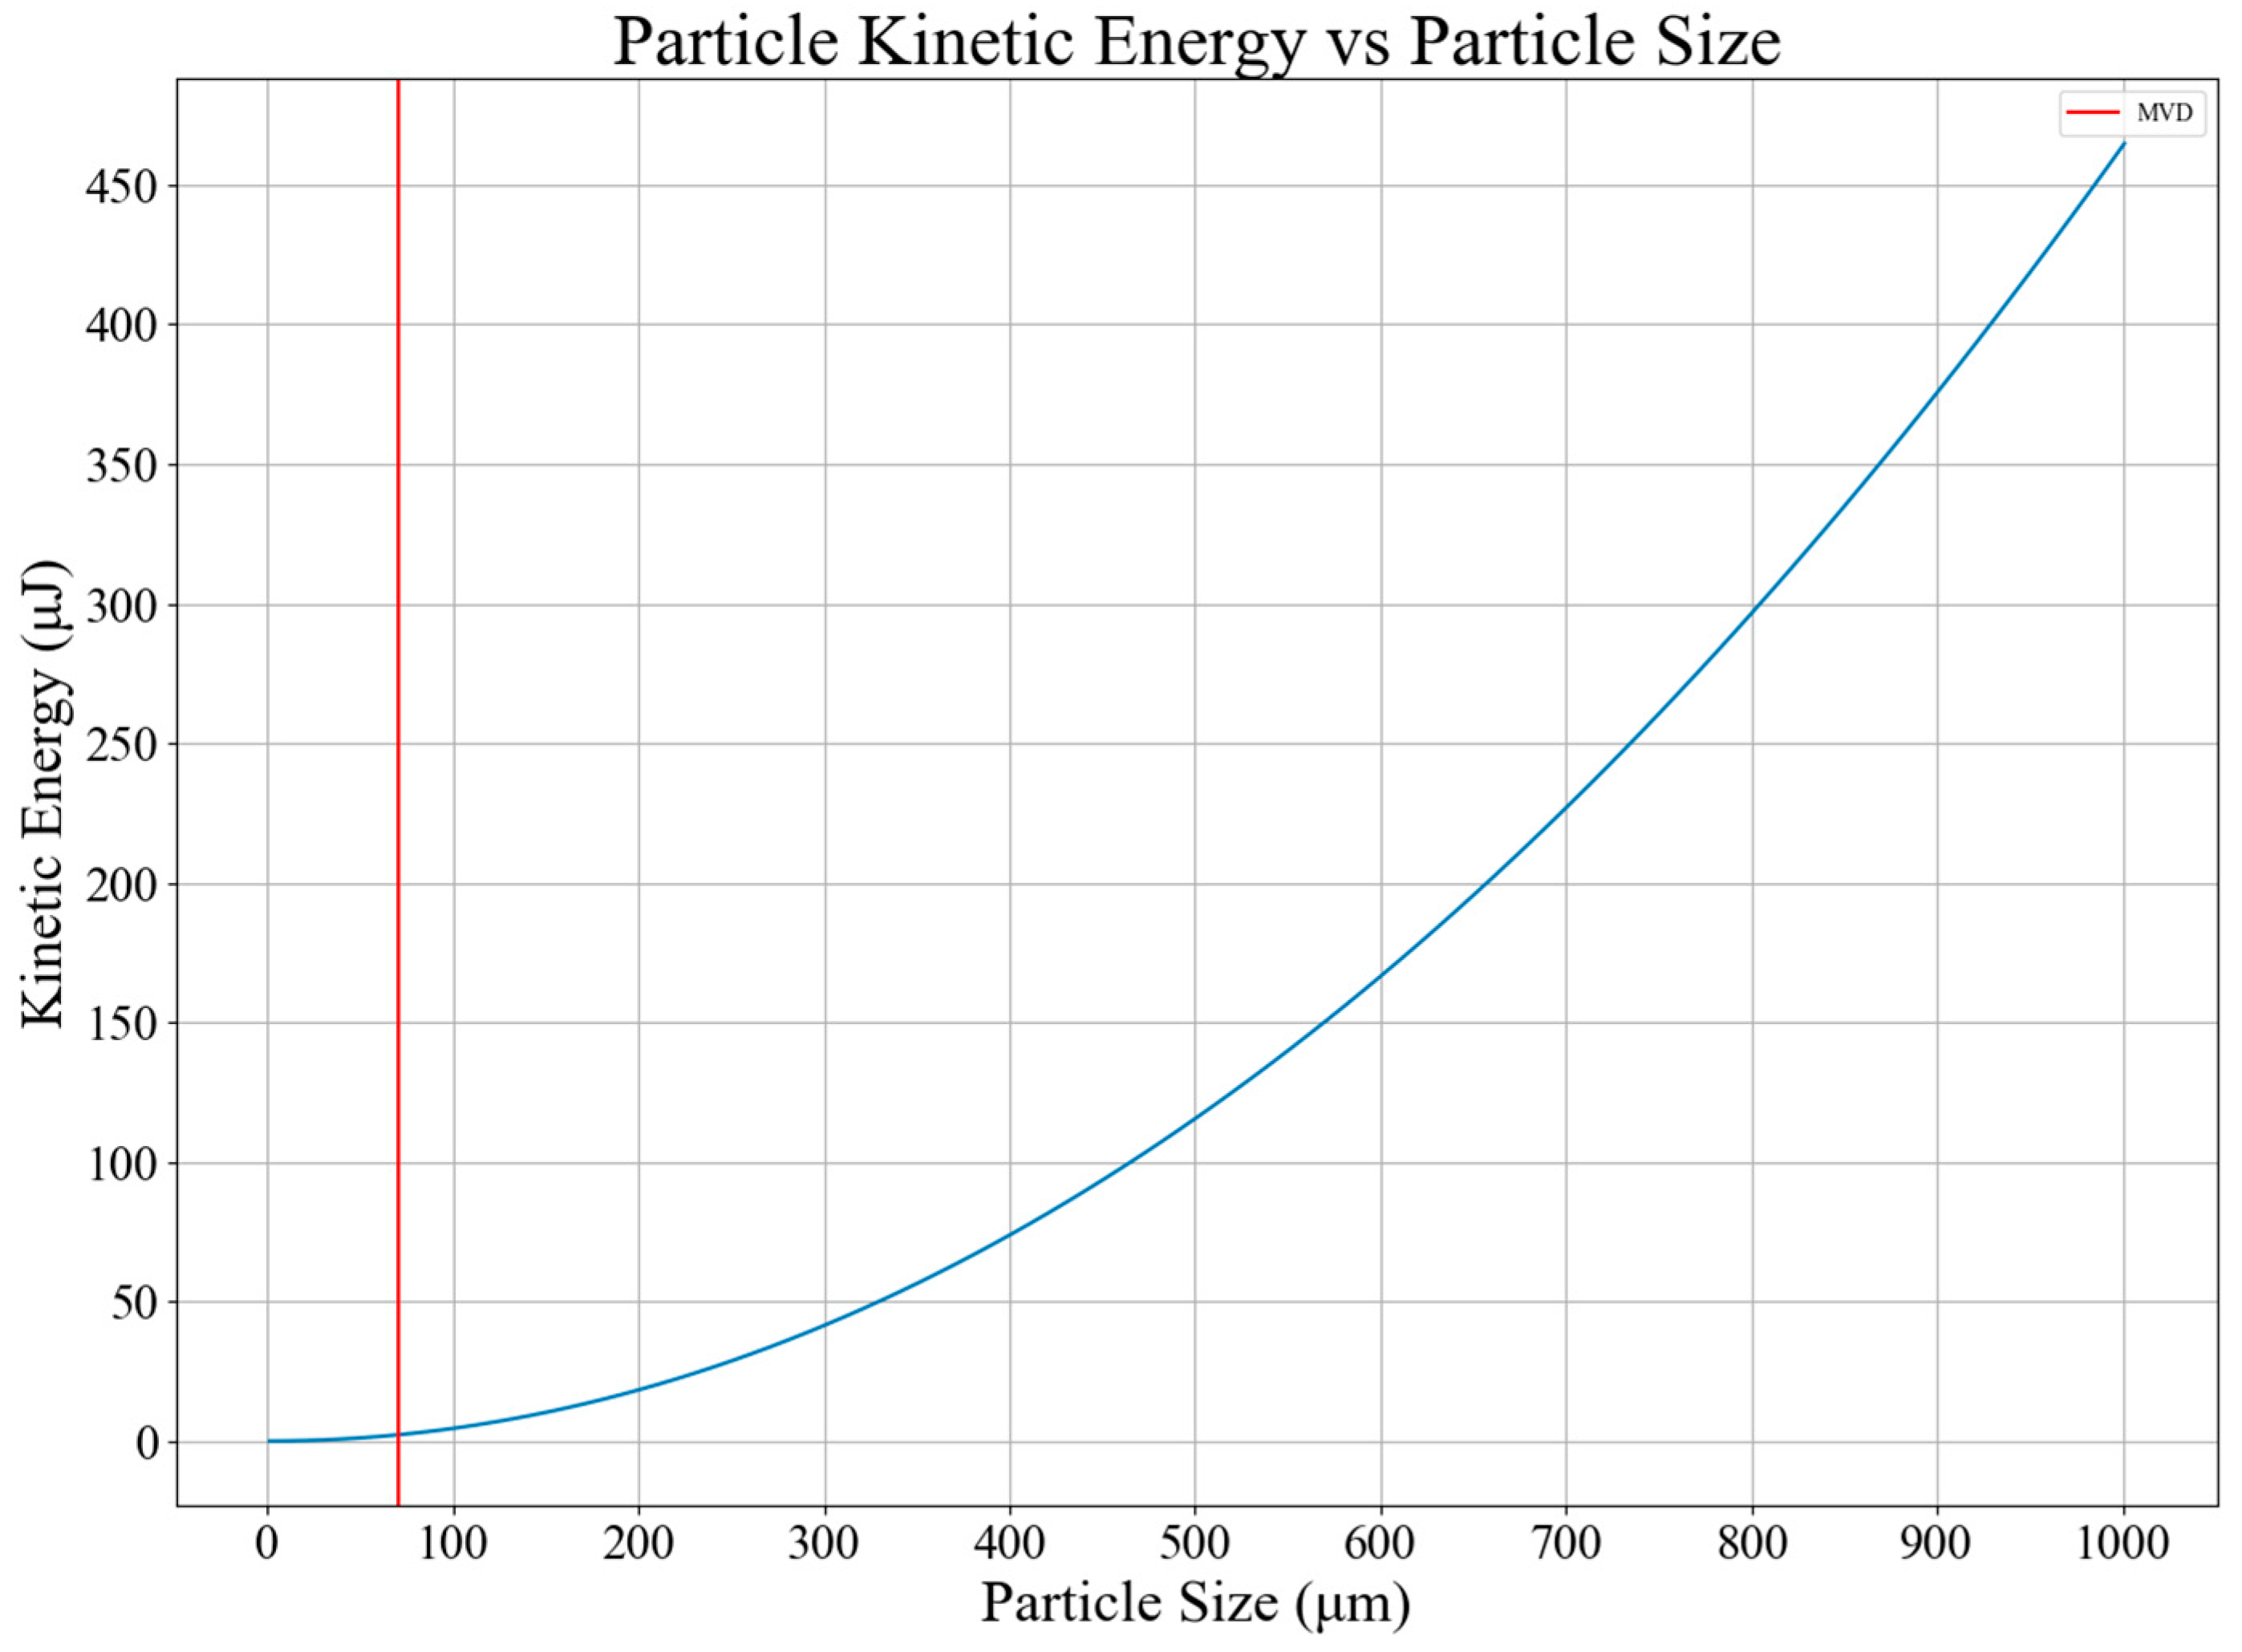
We use these velocities to solve for the kinetic energy of particle impacts as a function of particle size as shown in Figure 6. The kinetic energy ranges from 0.1 nJ to 400 µJ. This is the maximum case using a constant value for the coefficient of drag. Although smaller sized particles have a higher ejection velocity, the larger particles have higher kinetic energy because of their larger mass. These results show that the PIE instrument is required to cover a wider range of impact energies. This will be further discussed in Section 3. It is also important to note that these values are for individual impacts, if we consider this individual impact energy distribution along with the total flux of particles ejected it becomes even more apparent that PSI will cause significant damage during each landing event.

2.4. Measurement Frequency and Environmental Conditions

The PIE instrument will need to measure individual particle impacts throughout the duration of a PSI event. Since the instrument measurement frequency is constrained by its electronics, the particle flux estimation is used to determine the size of the instrument’s sensing surface, so that individual impacts can be measured. The instrument microcontroller and onboard analog-to-digital converter limits the sample rate to 300 kHz.
Besides typical space qualification tests, the PIE instrument will be required to operate through the entire landing sequence while being affected by the hot plume gas. Temperature, pressure, vibration, and shock conditions will need to be established to ensure survivability during operation in these extreme conditions. Appropriate regolith particle impact testing will also have to be performed [35,36].

2.5. Requirements

The PIE requirements are summarized in Table 3. The measurement requirements follow from calculations for a small class lander.
Overall, the functional requirements are driven by the main objectives to measure energy and flux of lunar ejecta during PSI. Requirements 1 and 2 specify the ranges of energy and flux we are interested in measuring based on a small class lander. Requirement 3 is set by the current hardware used for the instrumentation and requirements 4–8 are all based on the environmental conditions the instrument needs to survive in to ensure mission success. Although we calculated these values and set our requirements for a general small class lander, requirements for lunar landers of other size classes can be derived from the scaling we developed.

3. Particle Impact Event (PIE) Sensor

PSI effects depend strongly on lander size, overall spacecraft design, descent engine configuration, and even landing terrain. PIE will be able to measure against these conditions and quantify the effects based on various factors. This is necessary because past and current studies of lunar PSI have been mainly theoretical simulations. The Apollo missions were the first to witness the effects of PSI on the Moon and now, more than 50 years later in the Artemis era, we are developing instruments to characterize these effects. A description of the particle impact event (PIE) instrument including its heritage and current development status is provided in the next sections.

3.1. Particle Impact Event (PIE) Sensor Heritage—Saltation Sensor

The PIE sensor is a modification of the Saltation Sensor (SALT) developed by the NASA GRC team, in support of NASA’s planetary exploration program, to measure the flux and energy of saltating particles impacting the surface of Mars [37]. Saltation refers to particle transport by wind, where saltating particles hop along the surface resulting in a horizontal displacement of soil mass [38]. SALT was developed to acquire saltation data to advance our understanding of Martian saltation. The energies SALT was designed to measure in wind-blown sand particles are in the range of 0.1–1 µJ while for lunar PSI ejecta the energy ranges from 0.1 nJ to 400 μJ so changes to instrument electronics were required to measure this larger range of energies.
PIE uses the same basic design and components as SALT, which primarily consists of the sensor electronics and a thin-film piezoelectric plate as the sensing element. Piezoelectric film is a transducer technology that can produce voltage in proportion to compressive or tensile mechanical stress or strain, in this case the stress applied by ejecta impacts. The film is characterized as piezoelectric due to its interlocking crystal structure that has both positive and negative charges such that when stress is put onto the crystal elements the symmetry is slightly broken and a voltage is generated. Piezoelectric film is lightweight and flexible and has excellent sensitivity to low-energy impacts. The original design of SALT is a tube-shaped device where piezoelectric films are affixed to the interior of an aluminum tube that provides protection to the sensor from the elements without compromising the signal of particle impact events. The tube shape design was selected after experimentation revealed that pre-stressing the piezoelectric thin-film by curving it further heightened its sensitivity [37]. As shown in Figure 7, the original instrument design consists of a four-quadrant configuration that can enable coarse measurements on particle direction. A particle’s three-dimensional incoming direction can be determined by mounting two sensors 90° with respect to each other.
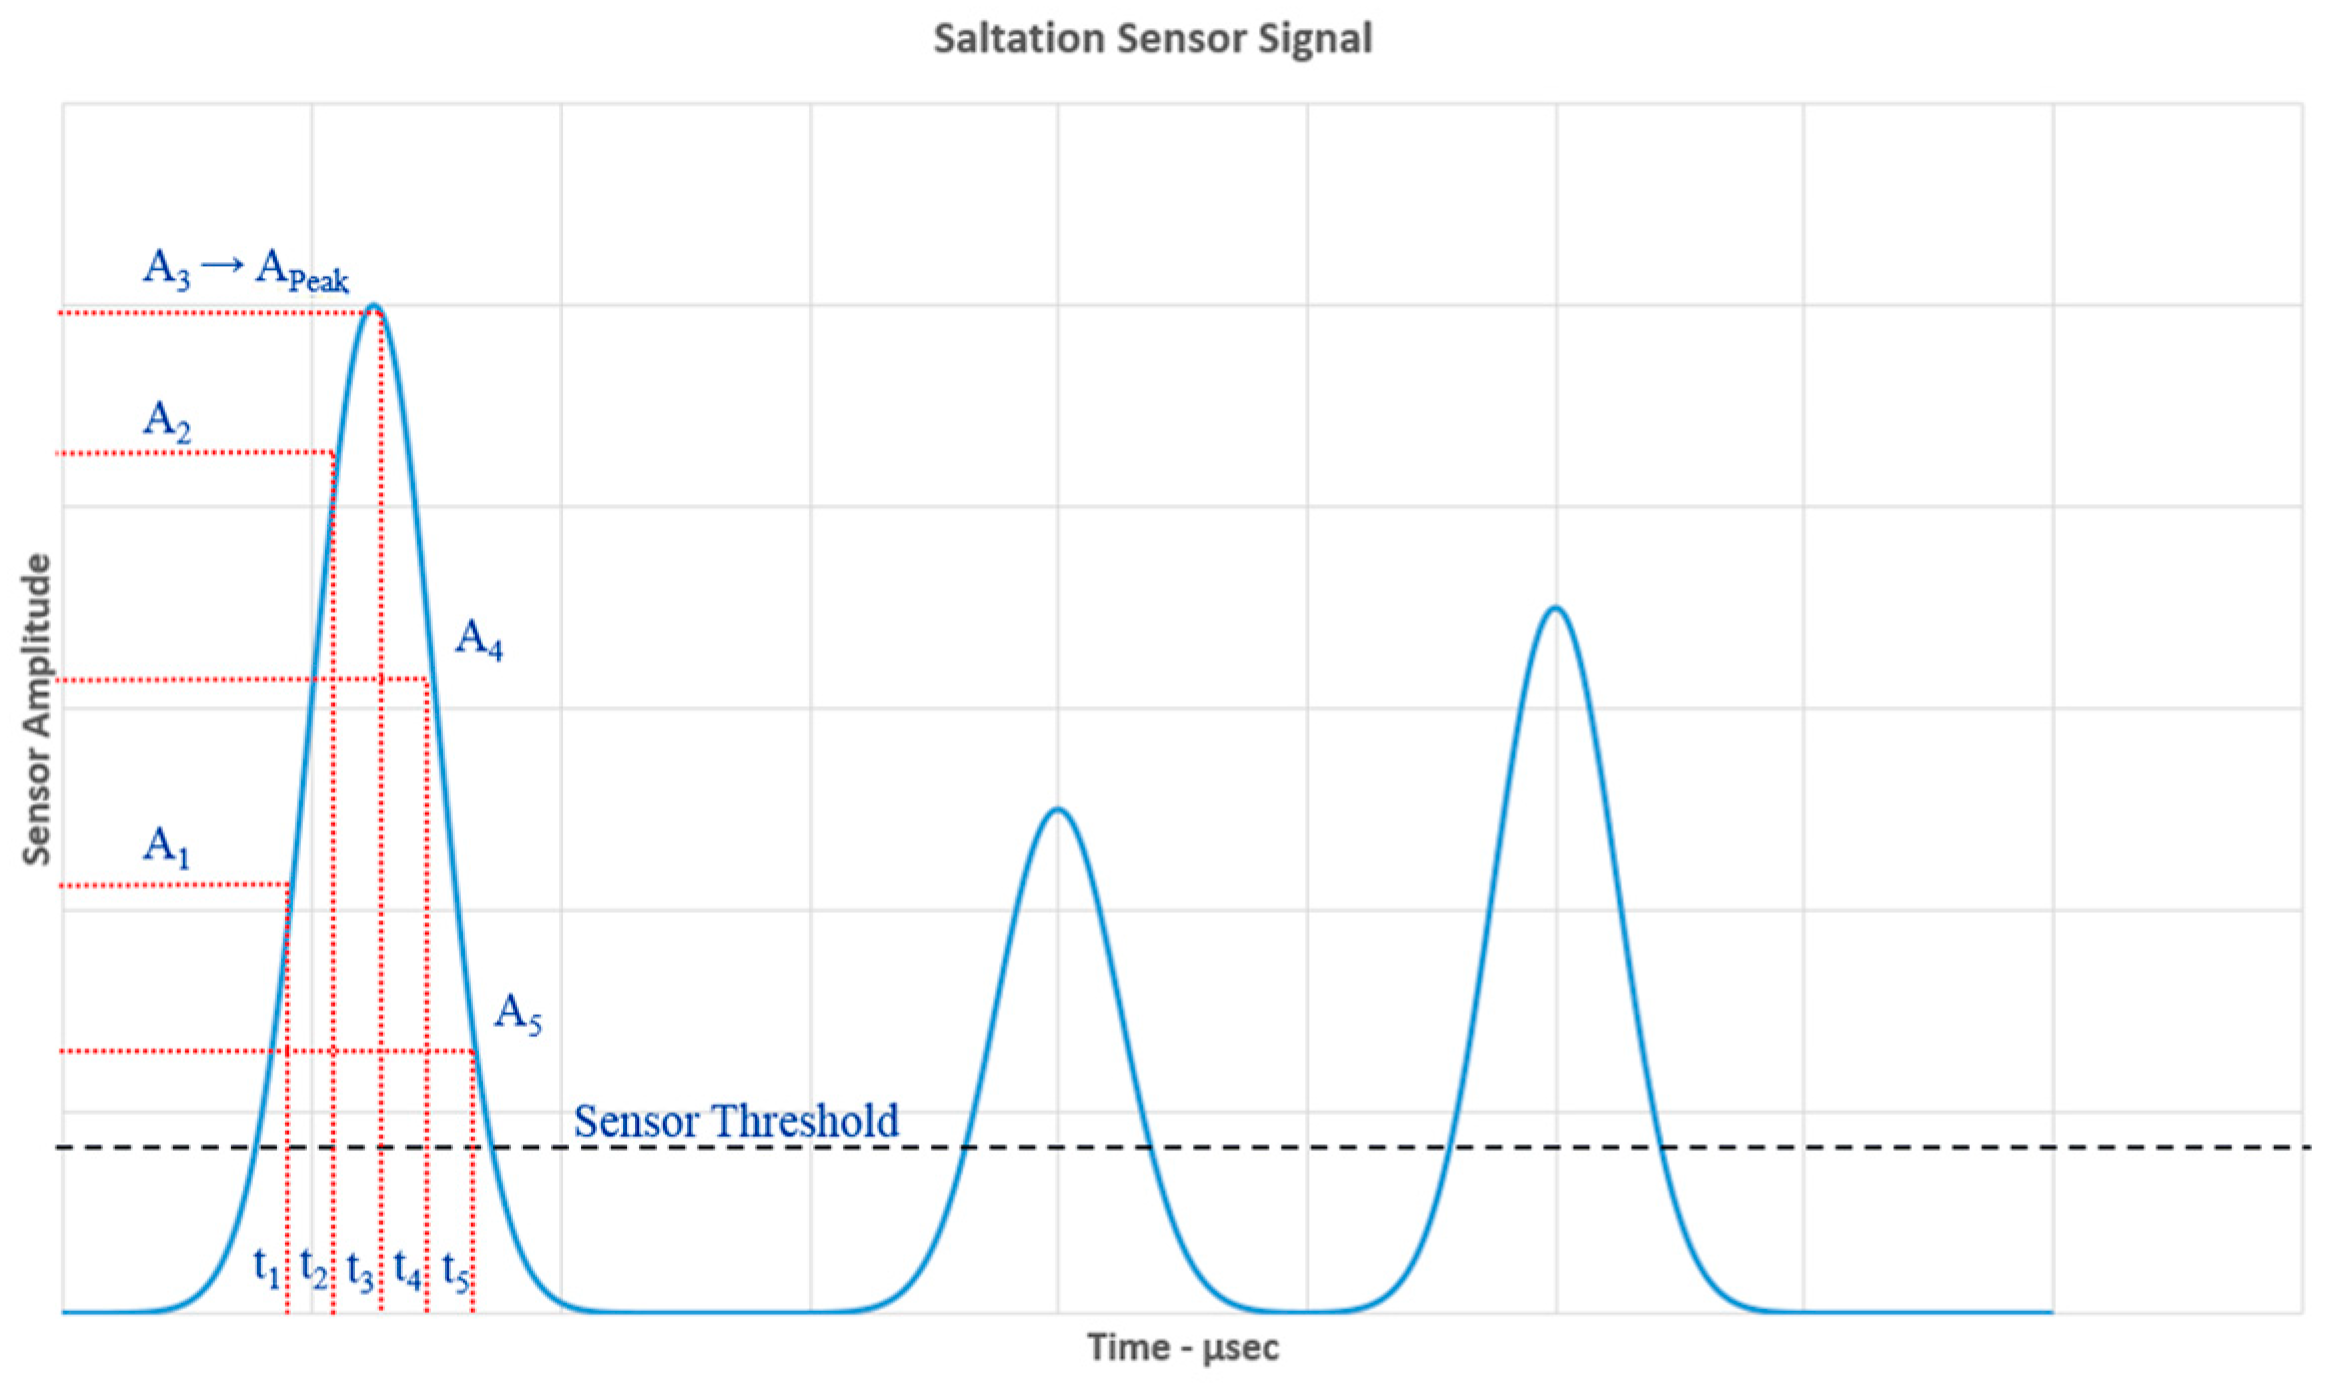
In SALT, impact events are first pulse-shaped into a quasi-Gaussian curve and digitized directly to measure the pulse height. Pulse heights are then used to determine the energy of each individual impact since the area under each pulse curve is proportional to the energy of the impact event that created it. The instrument determines the ejecta flux by counting the number of particles impacting per unit time. The particle impact signals separated into Gaussian-shaped pulses are filtered using threshold values to perform impact counting [39]. An example of the Saltation Sensor signal is shown in Figure 8. PIE also uses this method to count particle impacts.
SALT was matured to Technical Readiness Level (TRL) 6 but only for measuring saltation on Mars, therefore modifications are being made to ensure PIE meets the requirements for lunar PSI. A more in-depth internal document written by the NASA GRC team details the electronics and the environmental testing done for the Saltation Sensor, “A Saltation Sensor for the Martian Aqueous Habitat Reconnaissance Suite (MAHRS)” [39].

3.2. Current PIE Sensor Design

The current design of the PIE sensor is being developed at NASA GRC and has changed from SALT’s tube shape structure to a flat plate to reduce the instrument size. Additionally, a tube shape is no longer needed since we do not need to measure the direction of the ejecta during PSI. The plate’s main component is the piezoelectric film (DT1-028K) with an aluminum shield and an RTV (room temperature vulcanizing) silicone substrate around it to isolate the piezoelectric film as shown in Figure 9. The piezoelectric film is bonded to the aluminum plate with low outgassing epoxy (3M 2216). The RTV substrate, Momentive RTV 511, is used to vibrationally isolate the piezoelectric film and is capable of handling the extreme temperatures (−115 °C to 260 °C continuously and up to 316 °C for short periods of time) that the sensor will need to survive in the lunar space environment. The aluminum plate size is around 50 × 50 mm with a total instrument thickness of 12 mm, but this can be adjusted if needed. The piezoelectric film itself is 28 μm thick, with the total sensor thickness being 40 μm. The GRC engineering team has refined the instrument electronics to ensure it meets the PIE energy requirements. To do this, a custom PIE logarithmic amplifier board to increase the sensing range was developed.
Besides the modifications required on the electronics, the material used for the sensor housing needs to be modified to meet the lunar thermal requirements. The south pole temperatures during landing on the Moon as well as thermal interaction with the lander plume need to be considered. In addition to temperature requirements, different size apertures should be considered to limit the number of impacts on the sensor per unit of time. Additionally, various sensors could be mounted on a single lunar lander to capture a variety of particle flux range throughout the PSI process. The installation location is still to be determined. Once we confirm which lander the instrument will fly on and the location of the sensor is finalized, we can refine the requirements. Ideally the instrument will be mounted on the lander strut but can be mounted at various locations to capture a range of data throughout descent. Power and communications wiring and electronic boards are also being finalized. Our current approach is to stack the electronics and provide heaters during integration with the lunar lander as necessary. Heating requirements will be determined through environmental testing of the prototype instrument.

3.3. Testing

Tests planned to mature the PIE sensor are the following:
  • Drop tower calibration testing: functional controlled laboratory testing using simulant particles that will be dropped to produce similar energies to PSI on the Moon. This test will verify if the instrument meets the PSI energy range requirements.
  • Impact flux calibration testing: functional controlled test used to measure impact counts to verify the instrument meets the PSI flux measurement requirements.
  • Thermal testing: environmental testing to ensure the sensor can withstand the thermal conditions during launch, flight, and landing sequences.
  • Pressure testing: environmental testing to ensure operability in lunar pressure conditions during lunar lander descent and landing.
  • EMI and EMS testing:
    Electromagnetic susceptibility (EMS) testing to ensure sensor electronics operate as intended for expected electromagnetic radiation conditions at the lunar south pole and the in-transit space environment.
    Electromagnetic interference (EMI) testing to ensure that the sensor electronics do not negatively interfere with lunar lander electronics or communications.
  • Shock and vibration testing: testing to ensure the instrument can measure particle impacts without interference from the shock and vibrations during launch and descent.
  • Dust exposure test: although the instrument can measure the lunar regolith particles as they impact the sensor it is important that the overall instrument can withstand constant dust exposure during landing, so the instrument does not degrade during measurements.
These tests will be done at GRC, Langley Research Center (LaRC), and/or with partner laboratories including university labs. It is important we simulate every aspect of the launch, flight, and landing sequences to ensure the instrument will work throughout the mission and successfully measure PSI effects in real time.

4. Conclusions and Future Work

A specific challenge for NASA’s Artemis program is to understand the particle dispersal and regolith erosion during the descent of a lunar lander module. Modeling these ejecta and erosion processes during actual lunar landing and/or ascent will be critical to developing standards for future lunar missions, not only for lunar landing hardware, but also future lunar infrastructure and sample collection missions. Therefore, instruments to measure PSI are currently being launched and developed to measure these characteristics, such as the particle impact event sensor. PIE is based on a Martian Saltation sensor and the University of Michigan and GRC are working on modifications to ensure PIE is designed to meet lunar PSI measurement requirements. PIE will measure the energy and flux of lunar regolith particles during PSI to allow us to determine the direct damage imposed by PSI and determine mitigation strategies to ensure safe lunar landings. We have estimated the impact energies and flux of lunar PSI ejecta necessary to mature PIE for lunar missions. Silt-sized particles ejected from PSI can travel at speeds up to 800 m/s and larger sized particles in the mm range travel at around 10 m/s giving an impact energy range of 0.1 nJ to 400 μJ. We expect the particle flux to be around 10,000 particles/m2⋅s for a small class lander. From these results we developed our requirements to mature PIE for lunar PSI applications.
We were also able to estimate the horizontal displacement these ejected particles might travel. Particles ejected from the surface with an average angle of 3 degrees can travel anywhere from 200 m away to 10 s of kms away from the lander. This is valuable information to determine how far surface hardware or habitats should be to avoid damages by PSI and to determine optimal locations to collect samples by avoiding contamination. Currently the PIE team is working on calibration and functional testing to ensure the electronics can measure the expected energy and flux ranges with the accuracy and precision required for the final lander selected. We envision PIE to be integrated into a future lunar lander to directly measure the effects of PSI during lunar descent. PIE will most likely fly on a CLPS lander but can also be used on Human Landing Systems (HLS), at a much larger scale, and even other planetary missions that deal with PSI during landing, like Mars. Getting PIE one step closer to flight readiness is crucial to gain a deeper understanding of PSI processes and aid in the development of dust hazard mitigation strategies as well as prediction capabilities, including particle transport modeling. Altogether this will ensure safer landings for future lander missions and help plan successful sample collection missions on the Moon.

Author Contributions

Conceptualization, A.B.; methodology, A.B.; visualization, A.B.; resources, M.J.K., L.C.G., N.P. and C.M.A.; writing—original draft preparation, A.B.; writing—review and editing, N.O.R. and N.P.; supervision, N.P.; project administration, N.P. All authors have read and agreed to the published version of the manuscript.

Funding

This research was funded by NASA, grant number 80NSSC20K1454. Notice for copyrighted information: This manuscript is a joint work of employees of the National Aeronautics and Space Administration and Ariana Bueno of University of Michigan under Grant No. 80NSSC20K1454 with the National Aeronautics and Space Administration. The United States Government may prepare derivative works, publish, or reproduce this manuscript and allow others to do so. Any publisher accepting this manuscript for publication acknowledges that the United States Government retains a non-exclusive, irrevocable, worldwide license to prepare derivative works, publish, or reproduce the published form of this manuscript, or allow others to do so, for United States government purposes.

Data Availability Statement

The original contributions presented in the study are included in the article, further inquiries can be directed to the corresponding author.

Conflicts of Interest

The authors declare no conflicts of interest.

References

  1. Mehta, M. Rocket Plume Interactions for NASA Landing Systems. NASA-DLR Technical Interchange Meeting on Powered Descent and Plume-Surface Interaction Environments. 2019. Available online: https://ntrs.nasa.gov/api/citations/20200000979/downloads/20200000979.pdf (accessed on 29 March 2024).
  2. Li, S.; Jiang, X.; Tao, T. Guidance Summary and Assessment of the Chang’e-3 Powered Descent and Landing. J. Spacecr. Rocket. 2016, 53, 258–277. [Google Scholar] [CrossRef]
  3. Metzger, P.; Dove, A.; Conroy, M.; Gloria, J.; O’Reilly, A.; St John, A. Ejecta Sheet Tracking, Opacity and Regolith Maturity (Ejecta Storm): An Instrument for Lunar Landing Plume Effects and Dust Dynamics. In Proceedings of the 52nd Lunar and Planetary Science Conference, Woodlands, TX, USA, 15–19 March 2021. no. 2548. [Google Scholar]
  4. Tyrrell, O.K.; Thompson, R.J.; Danehy, P.M.; Dupuis, C.J.; Munk, M.M.; Nguyen, C.P.; Maddock, R.W.; Fahringer, T.W.; Krolick, W.C.; Weaver, A.; et al. Design of a lunar plume-surface interaction measurement system. In Proceedings of the AIAA SCITECH 2022 Forum, San Diego, CA, USA; Virtual, 3–7 January 2022; American Institute of Aeronautics and Astronautics: Reston, VA, USA, 2022; p. 1693. [Google Scholar] [CrossRef]
  5. Peale, R.E.; Hathnagoda, D.; Kelley, C.; Fredricksen, C.J.; Walker, C.; Posada, C.; Zorovich, J.; Cariker, C.; Dhakal, N.; Gonzalez, J.; et al. Laser particle sizer for lunar plume-surface interaction studies. In Laser Radar Technology and Applications XXVIII; Turner, M.D., Kamerman, G.W., Magruder, L.A., Eds.; SPIE: Orlando, FL, USA, 2023; pp. 67–74. [Google Scholar] [CrossRef]
  6. Langton, A.G.; Mantovani, J.G.; Kemmerer, B.W.; Atkins, A.R.; Batcheldor, D.P. A Millimeter Wave Doppler Radar to Measure Plume Surface Interactions Ejecta Velocities. In Proceedings of the ASCEND 2022, Las Vegas, NV, USA; Online, 24–26 October 2022; American Institute of Aeronautics and Astronautics: Reston VA, USA, 2022; p. 4282. [Google Scholar] [CrossRef]
  7. Metzger, P.T.; Smith, J.; Lane, J.E. Phenomenology of soil erosion due to rocket exhaust on the Moon and the Mauna Kea lunar test site. J. Geophys. Res. 2011, 116, E06005. [Google Scholar] [CrossRef]
  8. Metzger, P.T.; Mantovani, J.G. The Damage to Lunar Orbiting Spacecraft Caused by the Ejecta of Lunar Landers. arXiv 2023, arXiv:2305.12234. [Google Scholar] [CrossRef]
  9. Apollo 12 Landing from PDI to Touchdown. 2014. [Online Video]. Available online: https://www.youtube.com/watch?v=kFSa6vUix70 (accessed on 29 March 2024).
  10. Korzun, A.M.; Eberhart, C.J.; West, J.; Liever, P.; Weaver, A.; Mantovani, J.; Langton, A.; Kemmerer, B.; Atkins, A.; Rubio, J.S.; et al. Design of a Subscale, Inert Gas Test for Plume-Surface Interactions in a Reduced Pressure Environment. In Proceedings of the AIAA SCITECH 2022 Forum, San Diego, CA, USA; Virtual, 3–7 January 2022; American Institute of Aeronautics and Astronautics: Reston VA, USA, 2022. [Google Scholar] [CrossRef]
  11. McDivitt, J. Apollo 15 Mission Report; Technical Report; NASA Manned Spacecraft Center: Houston, TX, USA, 1971.
  12. Taylor, T.J. Apollo Experience Report: Thermal Protection from Engine-Plume Environments. NASA Technical Note (TN) 19720018272. 1972. Available online: https://ntrs.nasa.gov/api/citations/19720018272/downloads/19720018272.pdf (accessed on 1 January 2024).
  13. Immer, C.; Metzger, P.; Hintze, P.E.; Nick, A.; Horan, R. Apollo 12 Lunar Module exhaust plume impingement on Lunar Surveyor III. Icarus 2011, 211, 1089–1102. [Google Scholar] [CrossRef]
  14. Liever, P.A.; Gale, M.P.; Mehta, R.S.; Weaver, A.B.; West, J.S.; Westra, D.G. Gas-Particle Flow Simulations for Martian and Lunar Lander Plume-Surface Interaction Prediction. In Proceedings of the Earth and Space, Virtual, 19–23 April 2021; American Society of Civil Engineers: Reston, WV, USA, 2021; pp. 84–98. [Google Scholar] [CrossRef]
  15. NASA. Apollo 12 Technical Air-to-Ground Voice Transcription; NASA Manned Space Center: Houston, TX, USA, 1969.
  16. NASA Manned Space Center. Apollo 17 Technical Debriefing; Rep. MSC-7631; NASA Manned Space Center: Houston, TX, USA, 1973.
  17. Immer, C.; Lane, J.; Metzger, P.; Clements, S. Apollo video photogrammetry estimation of plume impingement effects. Icarus 2011, 214, 46–52. [Google Scholar] [CrossRef]
  18. Lane, J.E.; Metzger, P.T.; Carlson, J.W. Lunar Dust Particles Blown by Lander Engine Exhaust in Rarefied and Compressible Flow. arXiv 2021, arXiv:2104.06332. [Google Scholar] [CrossRef]
  19. Wang, T.-S.; Canabal, F.; Knox, K.S.; Hawkins, R.F. Base Heating Environment During Ground Testing of a Lunar Lander Demonstrator. J. Thermophys. Heat Transf. 2020, 34, 826–835. [Google Scholar] [CrossRef]
  20. Qiao, L.; Hess, M.; Xu, L.; Wöhler, C.; Head, J.W.; Chen, J.; Wang, Y.; Bugiolacchi, R.; Xiao, A.; Zhang, F.; et al. Extensive Lunar Surface Disturbance at the Chang’e-5 Mission Landing Site: Implications for Future Lunar Base Design and Construction. J. Geophys. Res. Planets 2023, 128, e2022JE007730. [Google Scholar] [CrossRef]
  21. Kaydash, V.; Shkuratov, Y.; Korokhin, V.; Videen, G. Photometric anomalies in the Apollo landing sites as seen from the Lunar Reconnaissance Orbiter. Icarus 2011, 211, 89–96. [Google Scholar] [CrossRef]
  22. Johnson, K.J.; Eckman, E.M.; Swank, A.J.; Zemba, M.J. RF Metrology of Lunar Highlands Regolith Simulant NU-LHT-2M. In Proceedings of the 28th Ka and Broadband Communications Conference (Ka), Bradford, UK, 23–26 October 2023. [Google Scholar]
  23. Carrier, D.W. The Four Things You Need to Know about the Geotechnical Properties of Lunar Soil; Lunar Geotechnical Institute: Lakeland, FL, USA, 2005. [Google Scholar]
  24. Carrier, W.D. Particle Size Distribution of Lunar Soil. J. Geotech. Geoenviron. Eng. 2003, 129, 956–959. [Google Scholar] [CrossRef]
  25. Getchius, J.; Renshaw, D.; Posada, D.; Henderson, T.; Hong, L.; Ge, S.; Molina, G. Hazard Detection and Avoidance for the Nova-C Lander. arXiv 2022, arXiv:2204.00660. [Google Scholar] [CrossRef]
  26. Roberts, B.C. Cross-Program Design Specification for Natural Environments (DSNE) Revision G; NASA: Washington, DC, USA, 2019.
  27. NASA Manned Space Center. Apollo 11 Technical Air-to-Ground Voice Transcription; NASA Manned Space Center: Houston, TX, USA, 1969.
  28. Morris, A.B.; Goldstein, D.B.; Varghese, P.L.; Trafton, L.M. Approach for Modeling Rocket Plume Impingement and Dust Dispersal on the Moon. J. Spacecr. Rockets 2015, 52, 362–374. [Google Scholar] [CrossRef]
  29. Mehta, M. Plume-Surface Interactions Due to Spacecraft Landings and the Discovery of Water on Mars. Ph.D. Thesis, University of Michigan, Ann Arbor, MI, USA, 2010. Available online: https://deepblue.lib.umich.edu/handle/2027.42/78975 (accessed on 30 March 2024).
  30. Teramoto, K.; Yano, H. Measurements of Sound Speed in Granular Materials Simulated Regolith. In Proceedings of the 36th Annual Lunar and Planetary Science Conference, League City, TX, USA, 14–18 March 2005; p. 1856. [Google Scholar]
  31. Mitchell, J.K.; Houston, W.N.; Scott, R.F.; Costes, N.C.; Carrier, D.W.; Bromwell, L.G. Mechanical properties of lunar soil—Density, porosity, cohesion, and angle of internal friction. In Proceedings of the Lunar Science Conference, Houston, TX, USA, 10–13 January 1972; Legacy CDMS. p. 3235. [Google Scholar]
  32. Hutton, R.E. Mars Surface Soil Erosion Study—Technical Report. NTRS-NASA Technical Report Server, Pasadena, CA, Technical Report 0934-6001-R000. 1968. Available online: https://ntrs.nasa.gov/api/citations/19690015515/downloads/19690015515.pdf (accessed on 30 November 2023).
  33. Fontes, D.; Mantovani, J.G.; Metzger, P. Numerical estimations of lunar regolith trajectories and damage potential due to rocket plumes. Acta Astronaut. 2022, 195, 169–182. [Google Scholar] [CrossRef]
  34. Kim, Y.-B.; Jeong, H.-J.; Park, S.-M.; Lim, J.H.; Lee, H.-H. Prediction and Validation of Landing Stability of a Lunar Lander by a Classification Map Based on Touchdown Landing Dynamics’ Simulation Considering Soft Ground. Aerospace 2021, 8, 380. [Google Scholar] [CrossRef]
  35. Cannon, K.M.; Dreyer, C.B.; Sowers, G.F.; Schmit, J.; Nguyen, T.; Sanny, K.; Schertz, J. Working with lunar surface materials: Review and analysis of dust mitigation and regolith conveyance technologies. Acta Astronaut. 2022, 196, 259–274. [Google Scholar] [CrossRef]
  36. NASA. Classifications and Requirements for Testing Systems and Hardware to be Exposed to Dust in Planetary Environments. 2021. Available online: https://ntrs.nasa.gov/api/citations/20210019714/downloads/2021-08-21%20NASA-STD-1008-Approved.pdf (accessed on 30 November 2023).
  37. Rennó, N.O.; Backhus, R.; Cooper, C.; Flatico, J.M.; Fischer, E.; Greer, L.C.; Krasowski, M.J.; Kremic, T.; Martínez, G.M.; Prokop, N.F.; et al. A Simple Instrument Suite for Characterizing Habitability and Weathering: The Modern Aqueous Habitat Reconnaissance Suite (MAHRS). Astrobiology 2019, 19, 849–866. [Google Scholar] [CrossRef] [PubMed]
  38. Shao, Y. (Ed.) The Dynamics and Modelling of Saltation. In Physics and Modelling of Wind Erosion. Atmospheric and Oceanographic Sciences Library; Springer: Dordrecht, The Netherlands, 2009; Volume 37, pp. 149–210. [Google Scholar] [CrossRef]
  39. Greer, L.C.; Krasowski, M.J. A Saltation Sensor for the Martian Aqueous Habitat Reconnaissance Suite (MAHRS); NASA Glenn Research Center: Cleveland, OH, USA, 31 May 2021.
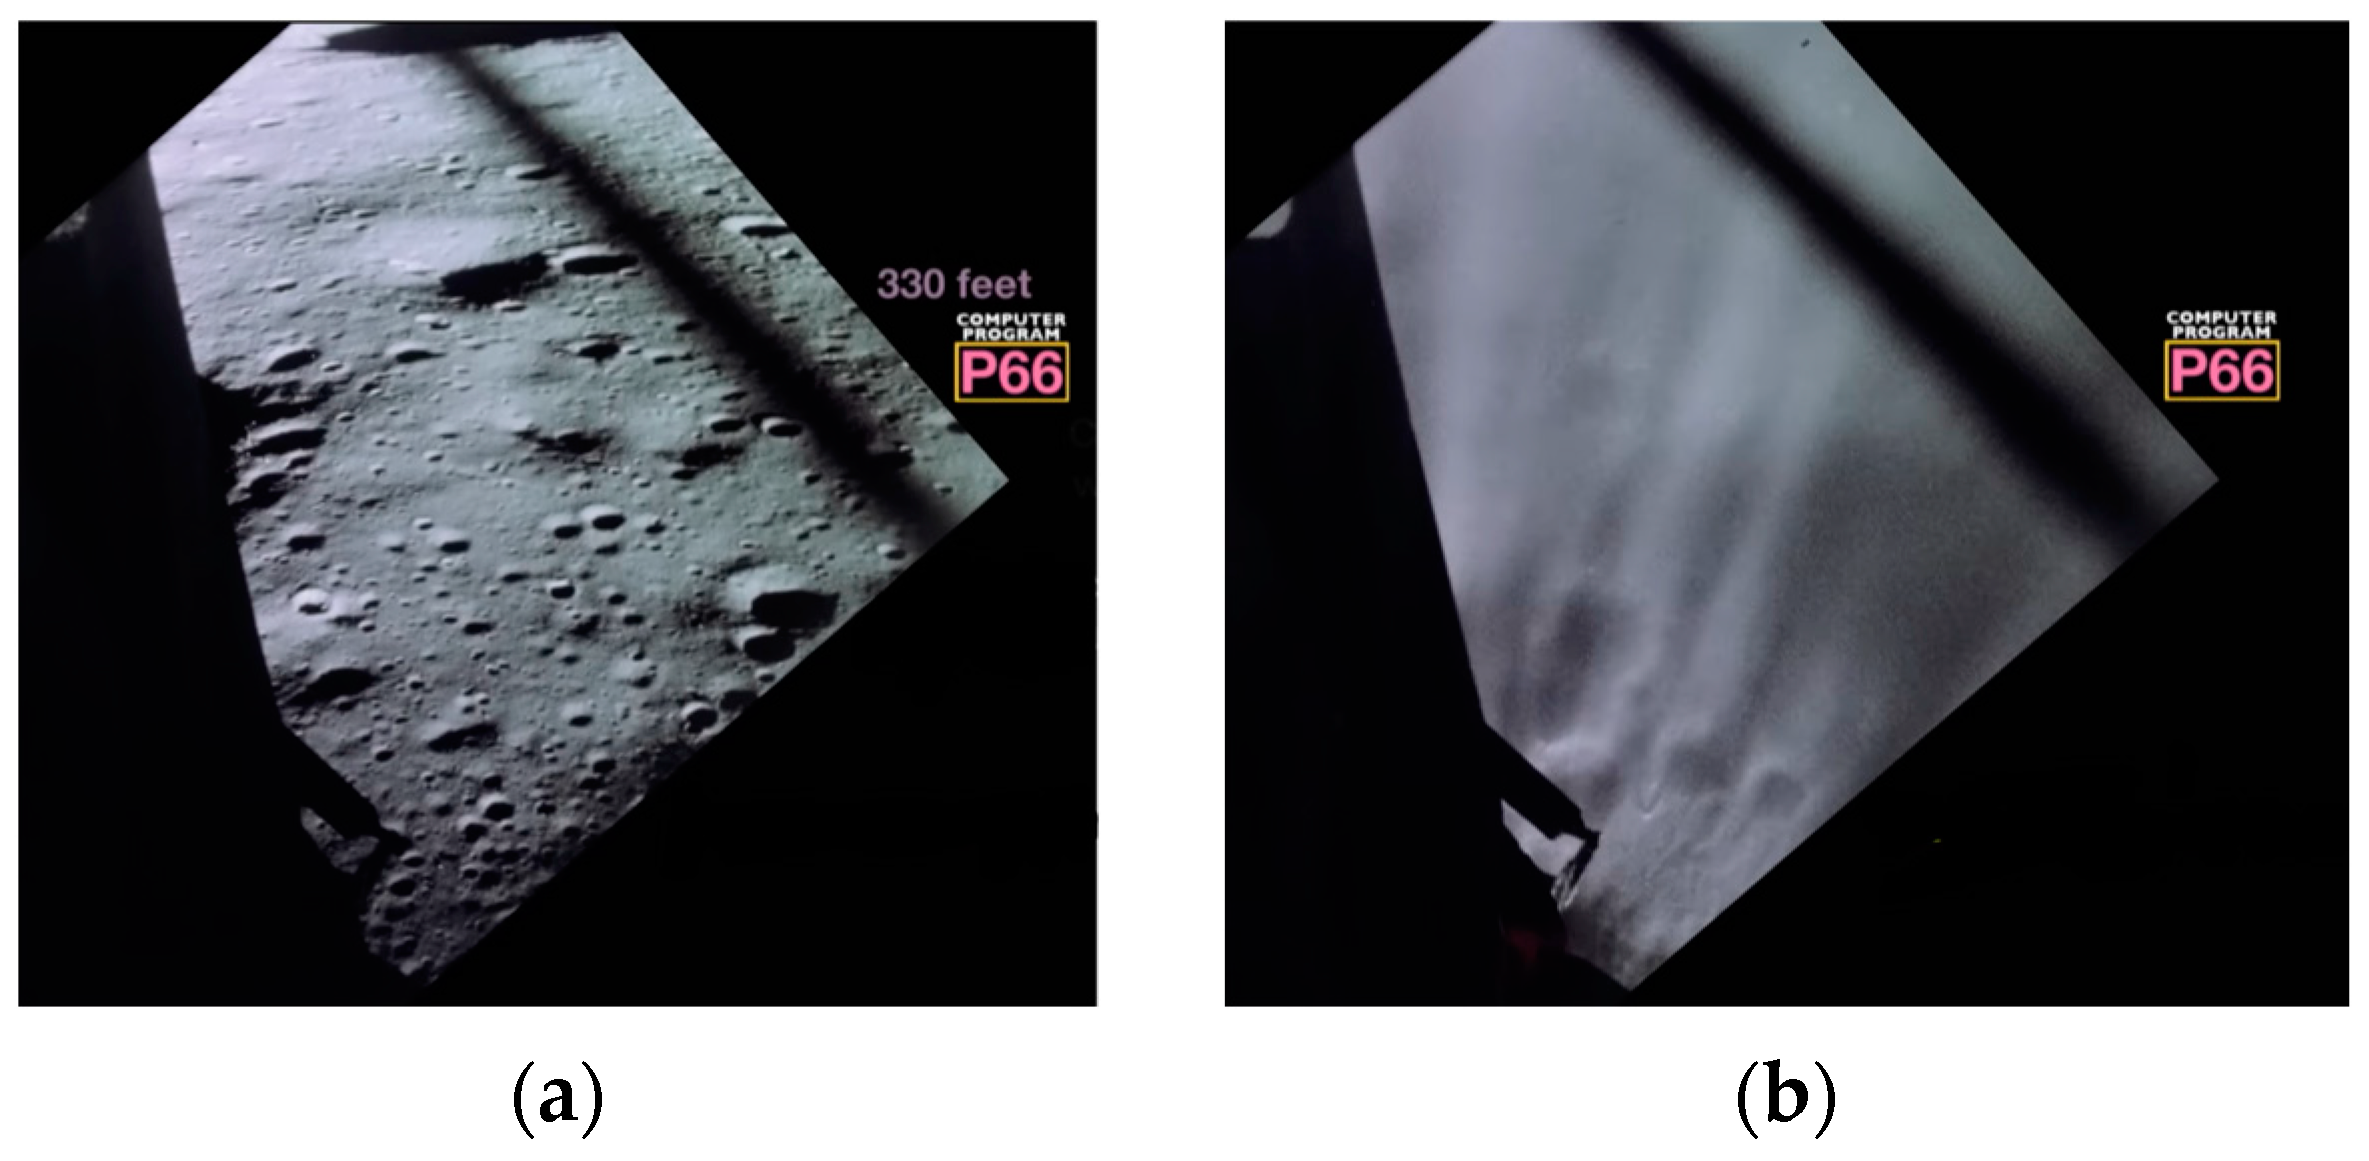
Figure 1. Apollo 12 lunar landing footage. (a) Video imagery of surface during initial landing around 100 m above the surface; (b) video image seconds later as the lander gets closer to the surface (around 10 m above surface) when visibility was vigorously reduced by ejecta [9].
Aerospace 11 00439 g001
Figure 2. Scanning electron microscope images of a piece of Surveyor III (a) shows the surface of an unexposed area; (b) shows an area that was exposed to the elements, evidence of paint with cracks and the area partially covered with lunar dust [13].
Aerospace 11 00439 g002
Figure 3. Lunar regolith particle size distribution by mass from samples collected from seven landing sites on the Moon during the Apollo missions and Luna 24. The middle curve shows the average distribution; the left-hand and right-hand curves show ± one standard deviation. There are approximately 4500 data points marked by x from the results of nearly 350 particle size analyses done by Carrier [23].
Aerospace 11 00439 g003
Figure 4. Illustration of the particle flux surface area, the disk around the lander radius enclosing the ejecta as the lander descends.
Aerospace 11 00439 g004
Figure 5. Ejection velocity of lunar regolith particles by diameter size. Smaller sized particles in the silt range will travel at much higher velocities in the 100 m/s order of magnitude.
Aerospace 11 00439 g005
Figure 6. Individual particle kinetic impact energy with respect to particle size. The line in red demonstrates the median value diameter of the particle distribution, showing that the median energy value is of order of magnitude 1 µJ.
Aerospace 11 00439 g006
Figure 7. CAD drawing of the interior of Saltation sensor. The original design was a tube shaped with four quadrants to determine impact direction [39].
Aerospace 11 00439 g007
Figure 8. Screen capture of a sensor signal. The area under the peaks of the reshaped saltation sensor signal is approximated by the Riemann sum of Ant, where An is the captured signal amplitude level and t is the constant time interval between acquisitions. An experimentally derived constant is used to correlate the pulse area or pulse peak with the energy of the sensor impacts where t is absorbed within this constant [39].
Aerospace 11 00439 g008
Figure 9. Particle impact event sensor prototype; (a) shows the current PIE sensor, a flat plate design with an aluminum plate shielding the piezoelectric material surrounded by substrate to help with vibrations; (b) shows the computer-aided design (CAD) of the PIE sensor including the detailed structure and layers of the sensor. As shown in the CAD, the piezoelectric film used for the PIE sensor still has a curved shape design to increase its sensitivity as discussed in the previous section.
Aerospace 11 00439 g009
Table 1. Traceability matrix for the particle impact event sensor to measure ejecta dynamics effects due to plume surface interactions (PSI) indicating that PIE responds to the top priorities of NASA’s Artemis plan.
NASA’s Artemis Plan Recommendations
  • Perform science investigations on the lunar surface, and in orbit around the Moon.
  • Develop Human Landing Systems.
  • Enable lunar surface innovation initiatives (e.g., human/robotic exploration, dust mitigation technologies, lunar sample collection).
CLPS PSI Suite
Project Goals
Goal 1:
Develop capability to quantify PSI effects in the lunar
environment.
Goal 2:
Mature concepts to measure the fundamental PSI process of ejecta dynamics, plume physics, and erosion physics.
Goal 3:
Support scientists and engineers developing dust transport modeling.
Goal 4:
Advance PSI science to inform commercial providers of Human Landing Systems (HLS) and Commercial Lunar Payload Services (CLPS) landers of the potential risks to their vehicles during landing.
Particle Impact Event SensorScience RequirementsInstrument RequirementsStrategyMission Requirements
ObservablesPhysical parameters
measured
Accuracy and
precision
Sampling rate
Objectives:
Measure the effects of ejecta dynamics and erosion physics during PSI.
Determine the potential damage caused by PSI.
Determine the potential contamination inflicted by PSI on landing sites.
The flux of PSI ejecta.
The kinetic energy of PSI ejecta impacts.
Particle impact counts as Gaussian-shaped pulses. Flux ranging from 0 to 10,000 particles/m2s and kinetic energy of ejecta 0.1 nJ–400 µJ (1 µm < d < 1 mm; 10 m/s < v < 1 km/s) with uncertainty 10%.300 kHzMeasure the particle impact counts using piezoelectric material that has excellent sensitivity to energy impacts. Apply the Gaussian-shaped pulses to a threshold and measure the number of impacts to determine flux. Measure the kinetic energy proportional to the area under the impact pulses. Survive and operate during landing in the lunar south pole environment.
Accommodate a suite of instruments on the lander, preferably on the struts with minimal obstruction to the lander.
Provide power for the instrument to operate during terminal phase of landing.
Table 2. PSI nondimensional scaling parameters for a small class lander and a large-scale lander, like the Apollo module.
#Nondimensional
Parameter
Small-Scale Lander
(D = 0.24 m)
Apollo Large-Scale Lander (D = 1.62 m)
1 a 0.040.05
2Re25 × 1052.0 × 105
3Fr~4000~2000
4τ~40,000~50,000
5β1.0 × 10121.4 × 1013
6 ε 16002700
7δ11 × 10101 × 1010
8f0.460.46
9Ma~16~20
10σ2.5 × 1083.5 × 109
Table 3. Requirements for the particle impact event sensor to measure ejecta dynamics and erosion physics effects due to PSI.
PIE Sensor Requirements for Lunar Plume Surface Interaction(s) Measurement
1.0The instrument shall measure lunar regolith ejecta particle flux ranging from 1 to 10,000 particles/m2·s with 10% uncertainty.
2.0The instrument shall measure the kinetic energy ranging from 0.1 nJ to 400 μJ of lunar ejecta impactors (10 m/s < v < 1000 m/s; 1 μm < d < 1 mm) with 10% uncertainty.
3.0The instrument shall be capable of capturing measurements at 300 kHz for the entirety of the PSI process.
4.0The instrument should meet the measurement requirements even when exposed to spacecraft vibrations.
5.0The instrument shall be capable of operating with any combination of other PSI instruments.
6.0Instrument subsystems that are externally mounted onto the lunar lander shall be compatible with a non-operating environment consistent with launch and travel conditions.
7.0Instrument subsystems that are externally mounted onto the lunar lander shall meet operational and measurement requirements even while exposed to regolith impacts.
8.0Instrument subsystems shall be compatible with an operating pressure and temperature environment consistent with landing conditions.
Disclaimer/Publisher’s Note: The statements, opinions and data contained in all publications are solely those of the individual author(s) and contributor(s) and not of MDPI and/or the editor(s). MDPI and/or the editor(s) disclaim responsibility for any injury to people or property resulting from any ideas, methods, instructions or products referred to in the content.