
Structural Strength Analysis and Optimization of Commercial Aircraft Nose Landing Gear under Towing Taxi-Out Conditions Using Finite Element Simulation and Modal Testing


Abstract
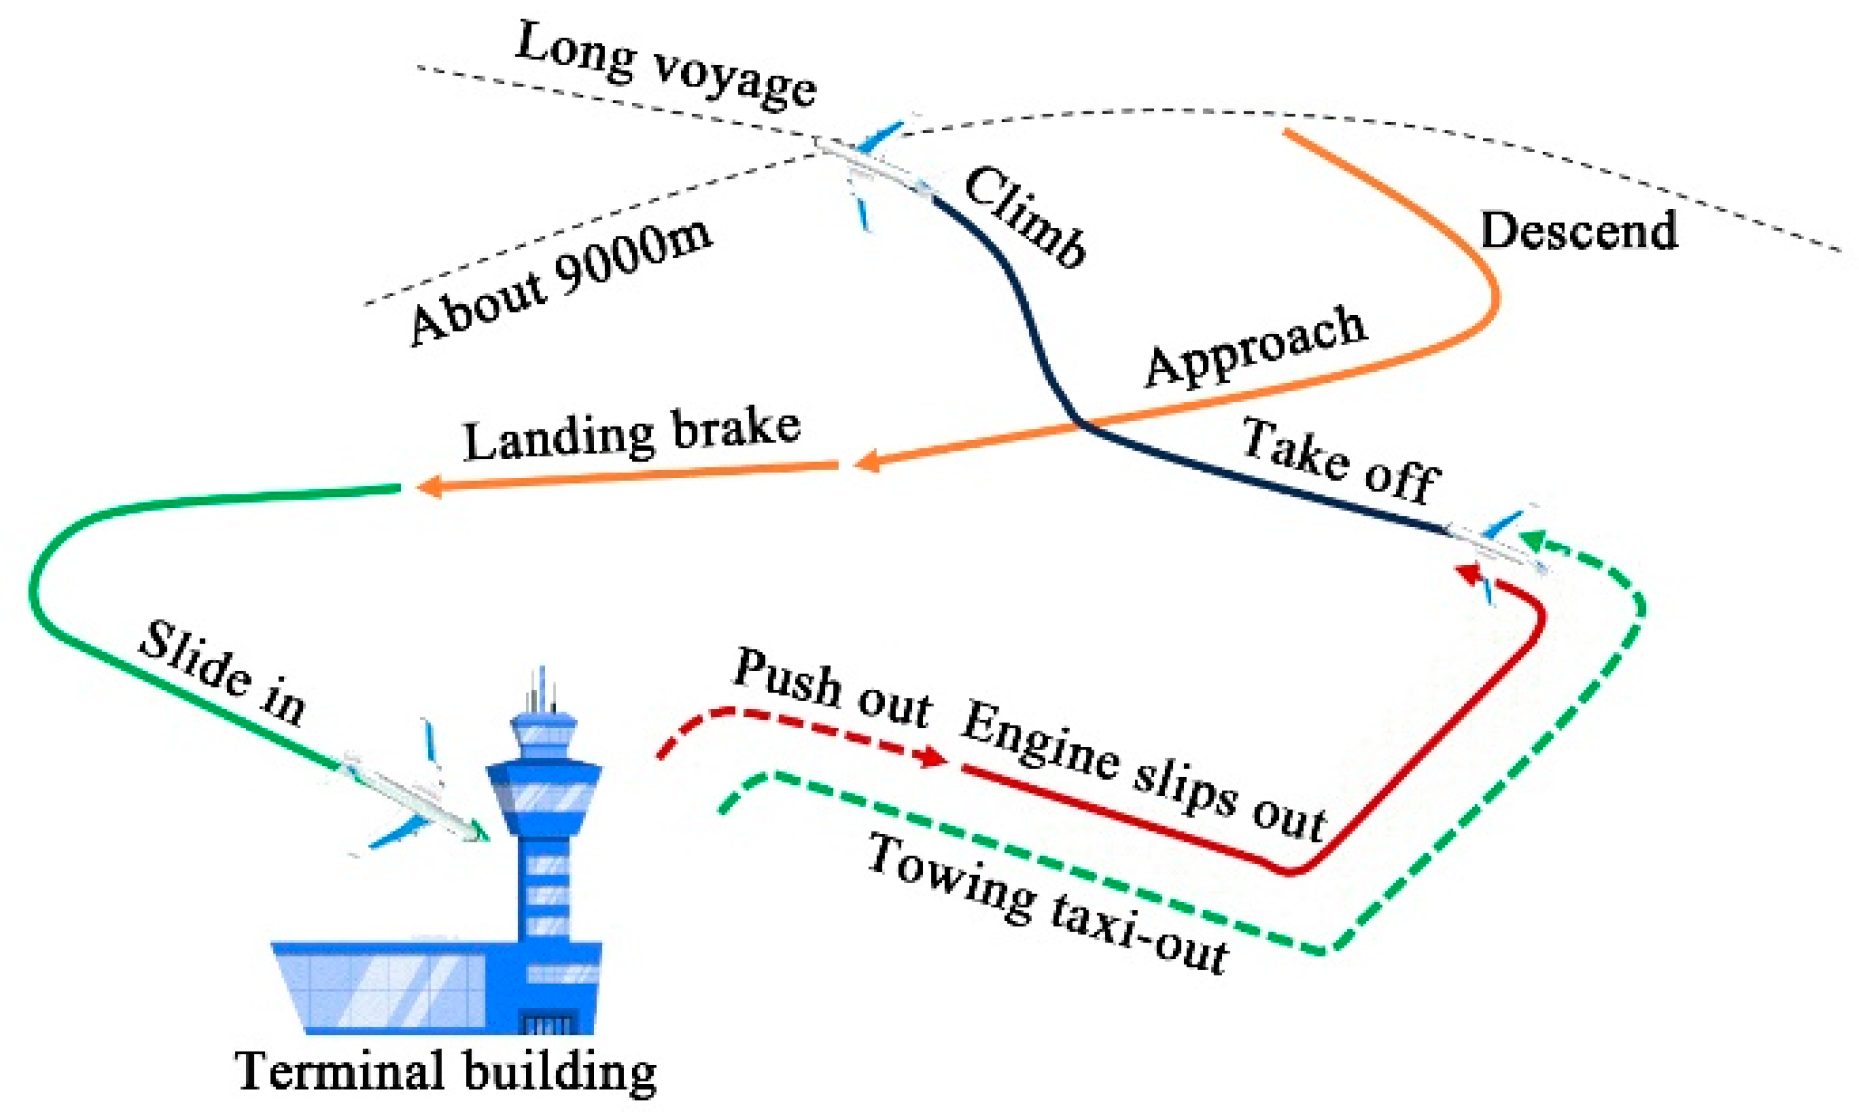
1. Introduction
2. Model Verification
2.1. Modal Theory
- represents the mass matrix;
- represents the damping matrix;
- represents the stiffness matrix;
- represents the nodal acceleration vector;
- represents the nodal velocity vector;
- represents the nodal displacement vector.
- represents the force vector.
- represents the i-th mode natural frequency of the structure;
- represents the i-th mode shape of the structure.
2.2. Finite Element Modeling
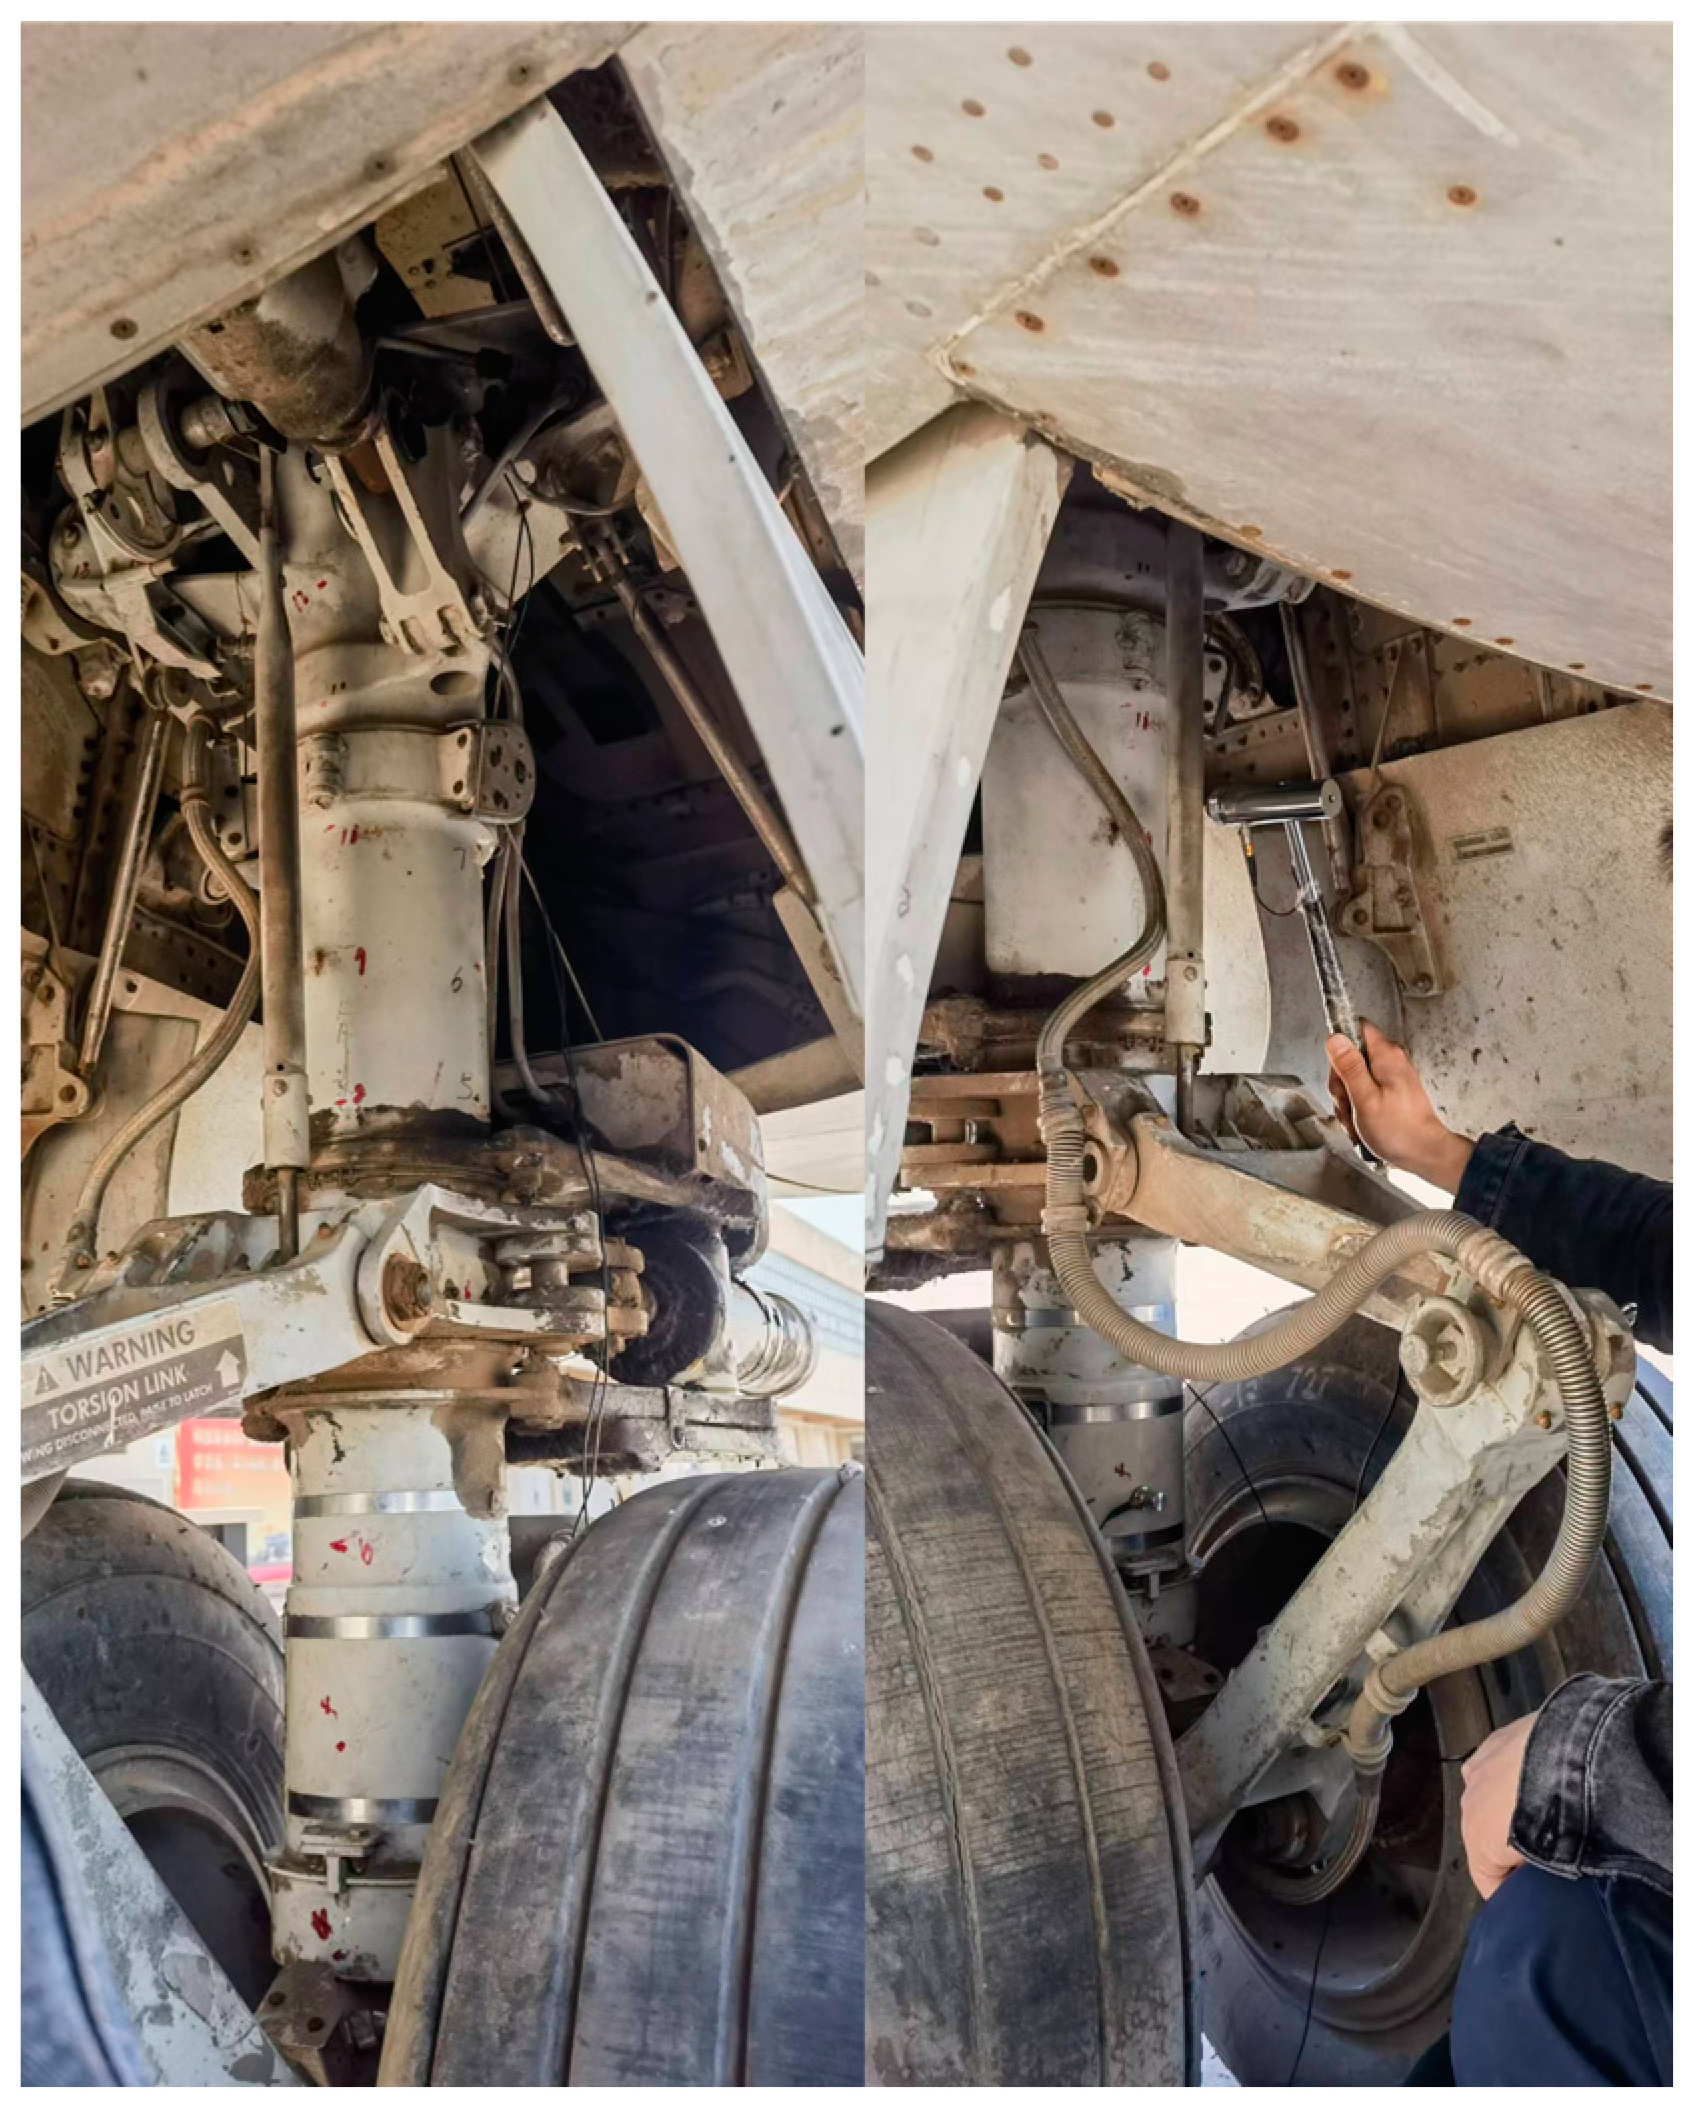
2.3. Modal Testing
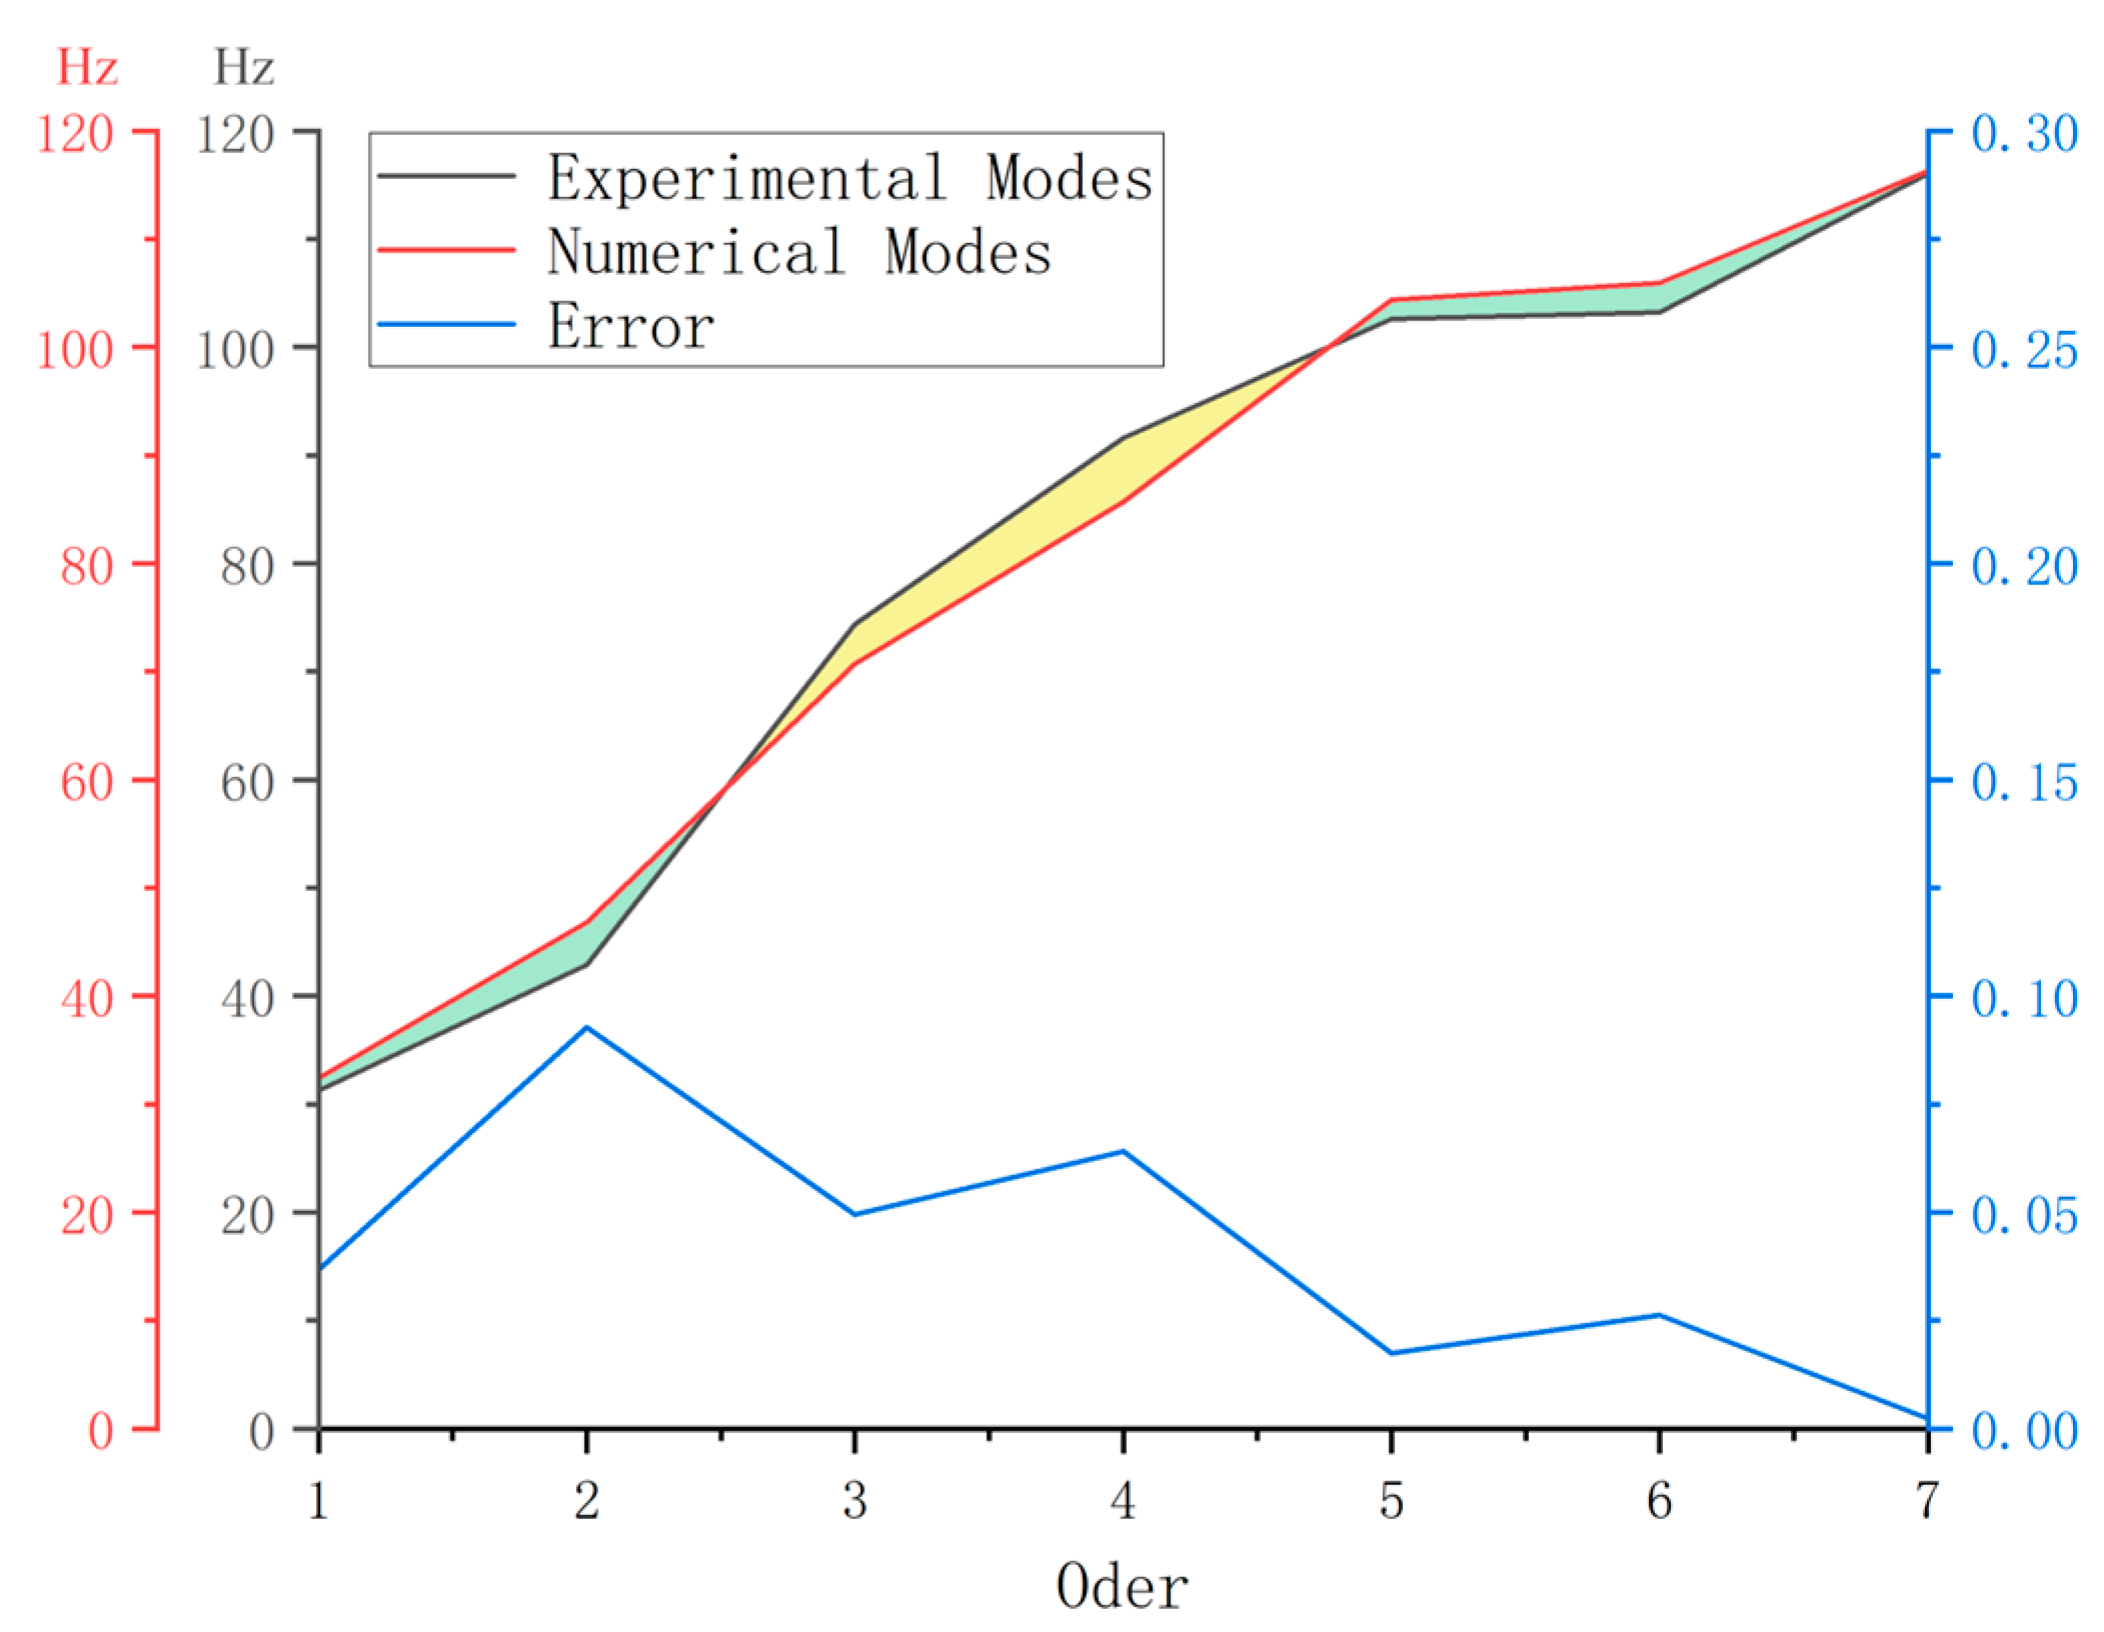
2.4. Comparative Analysis
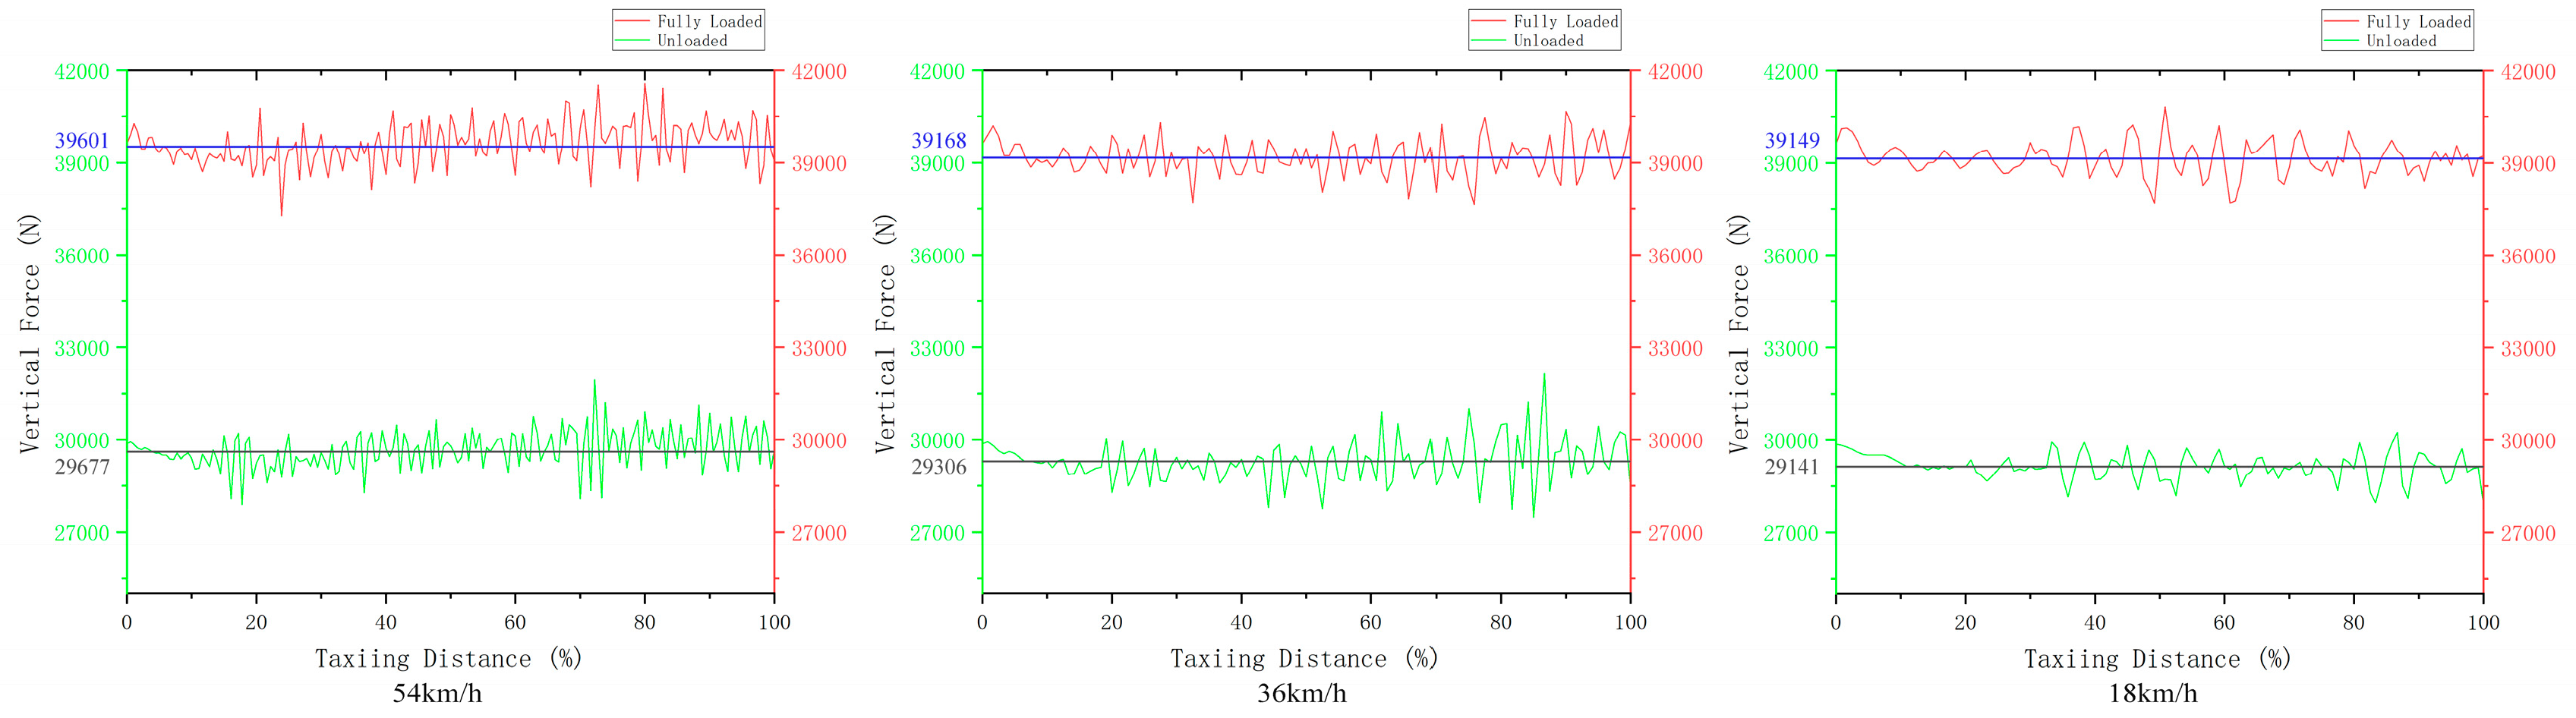
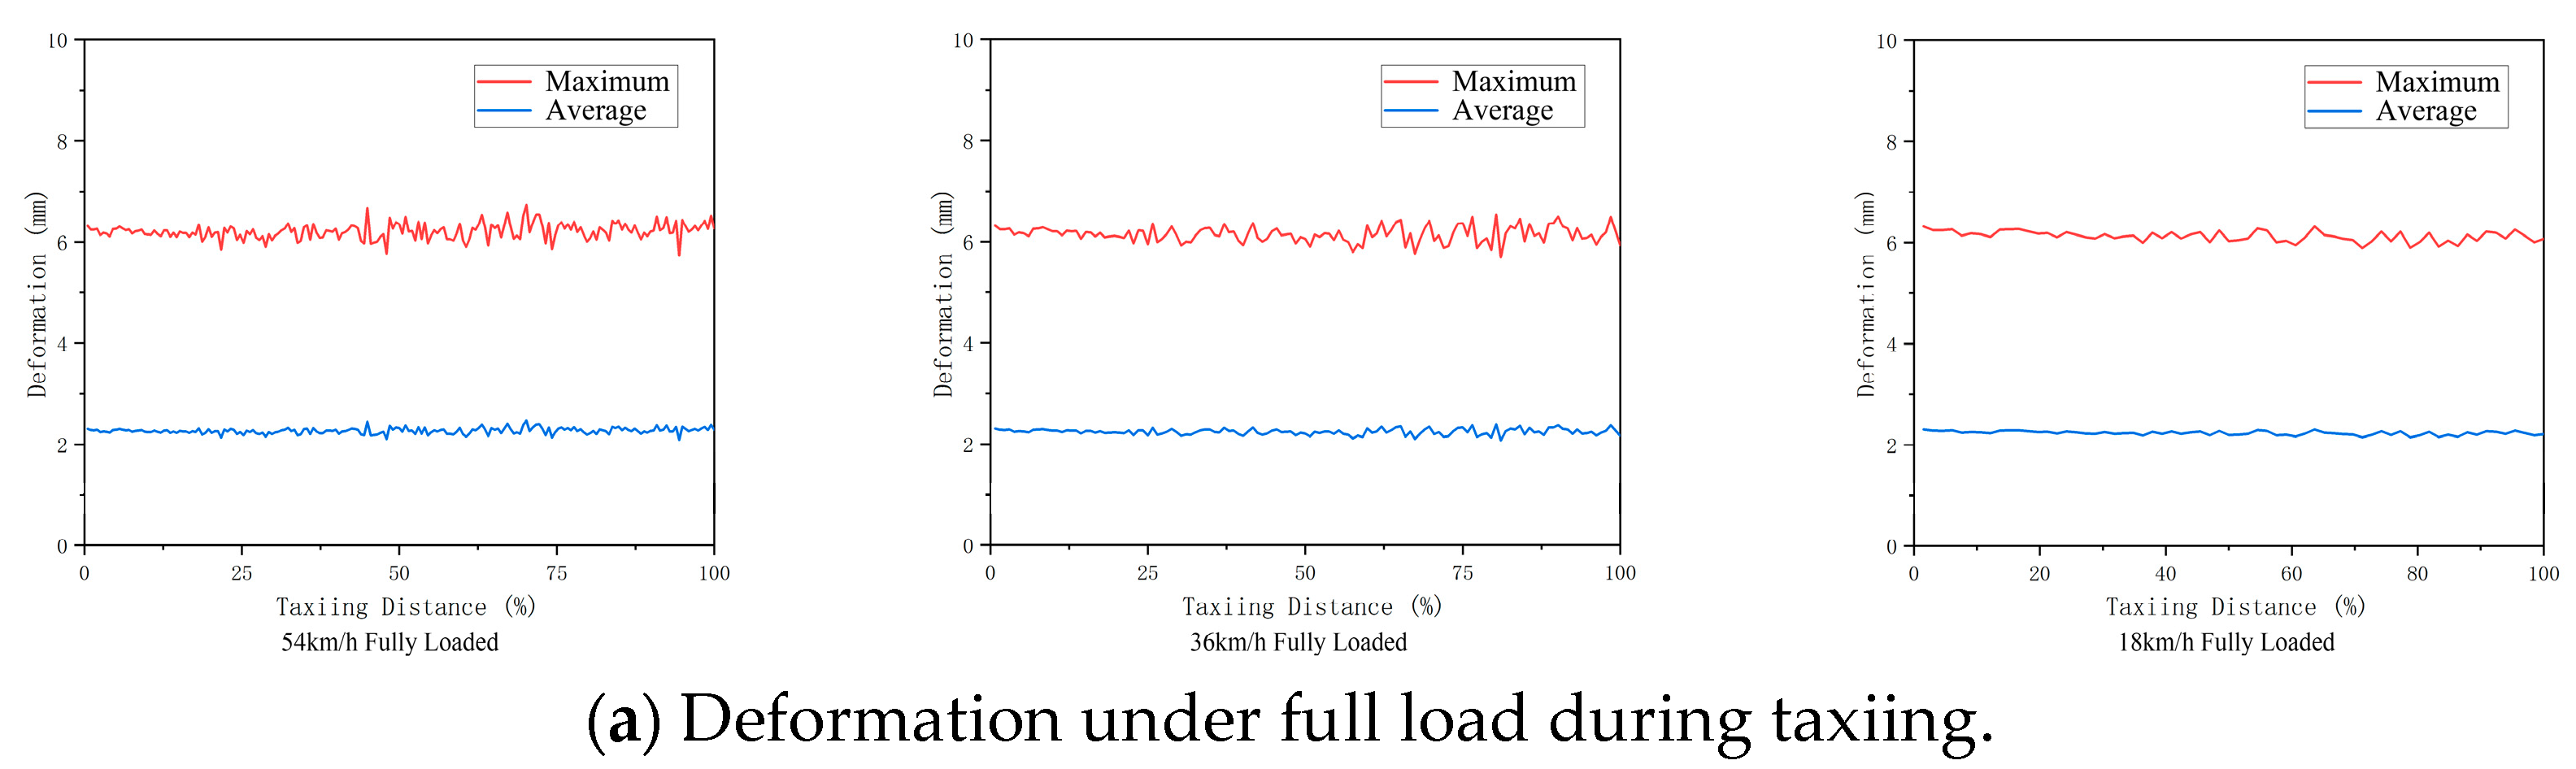
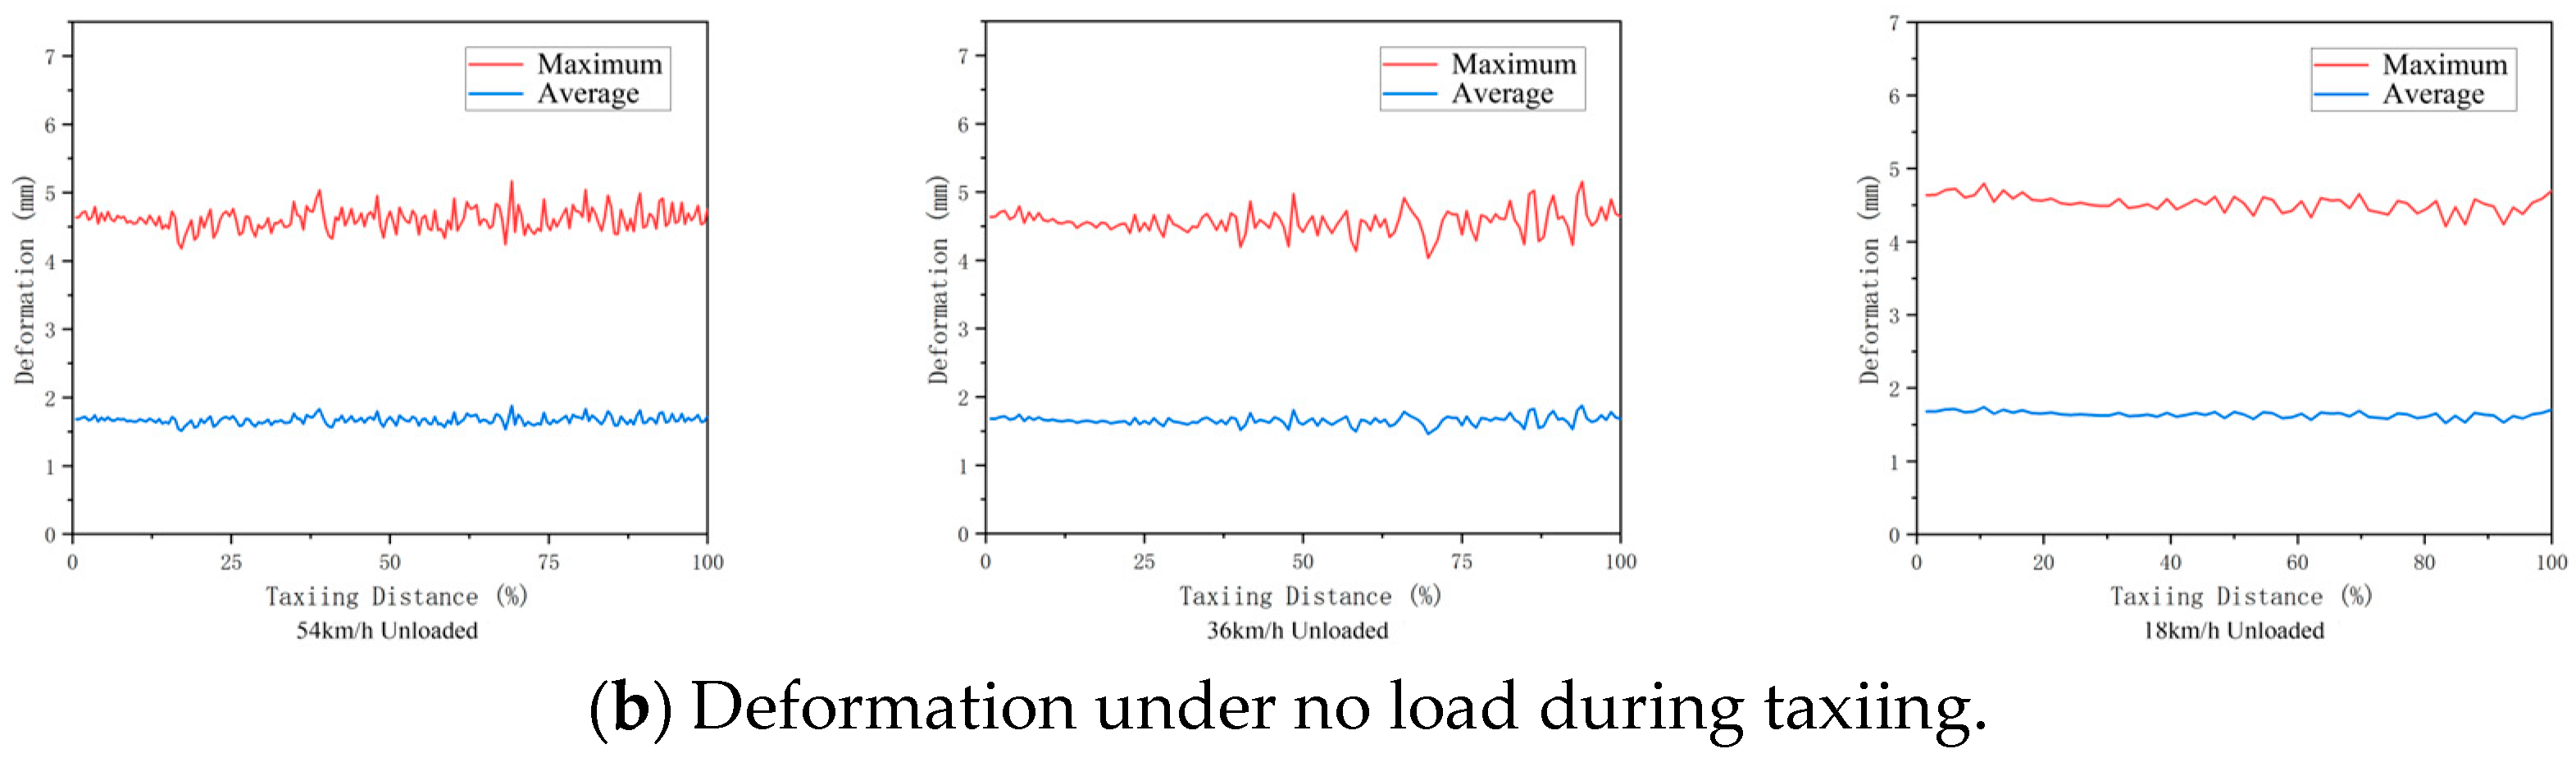
3. Dynamic Simulations
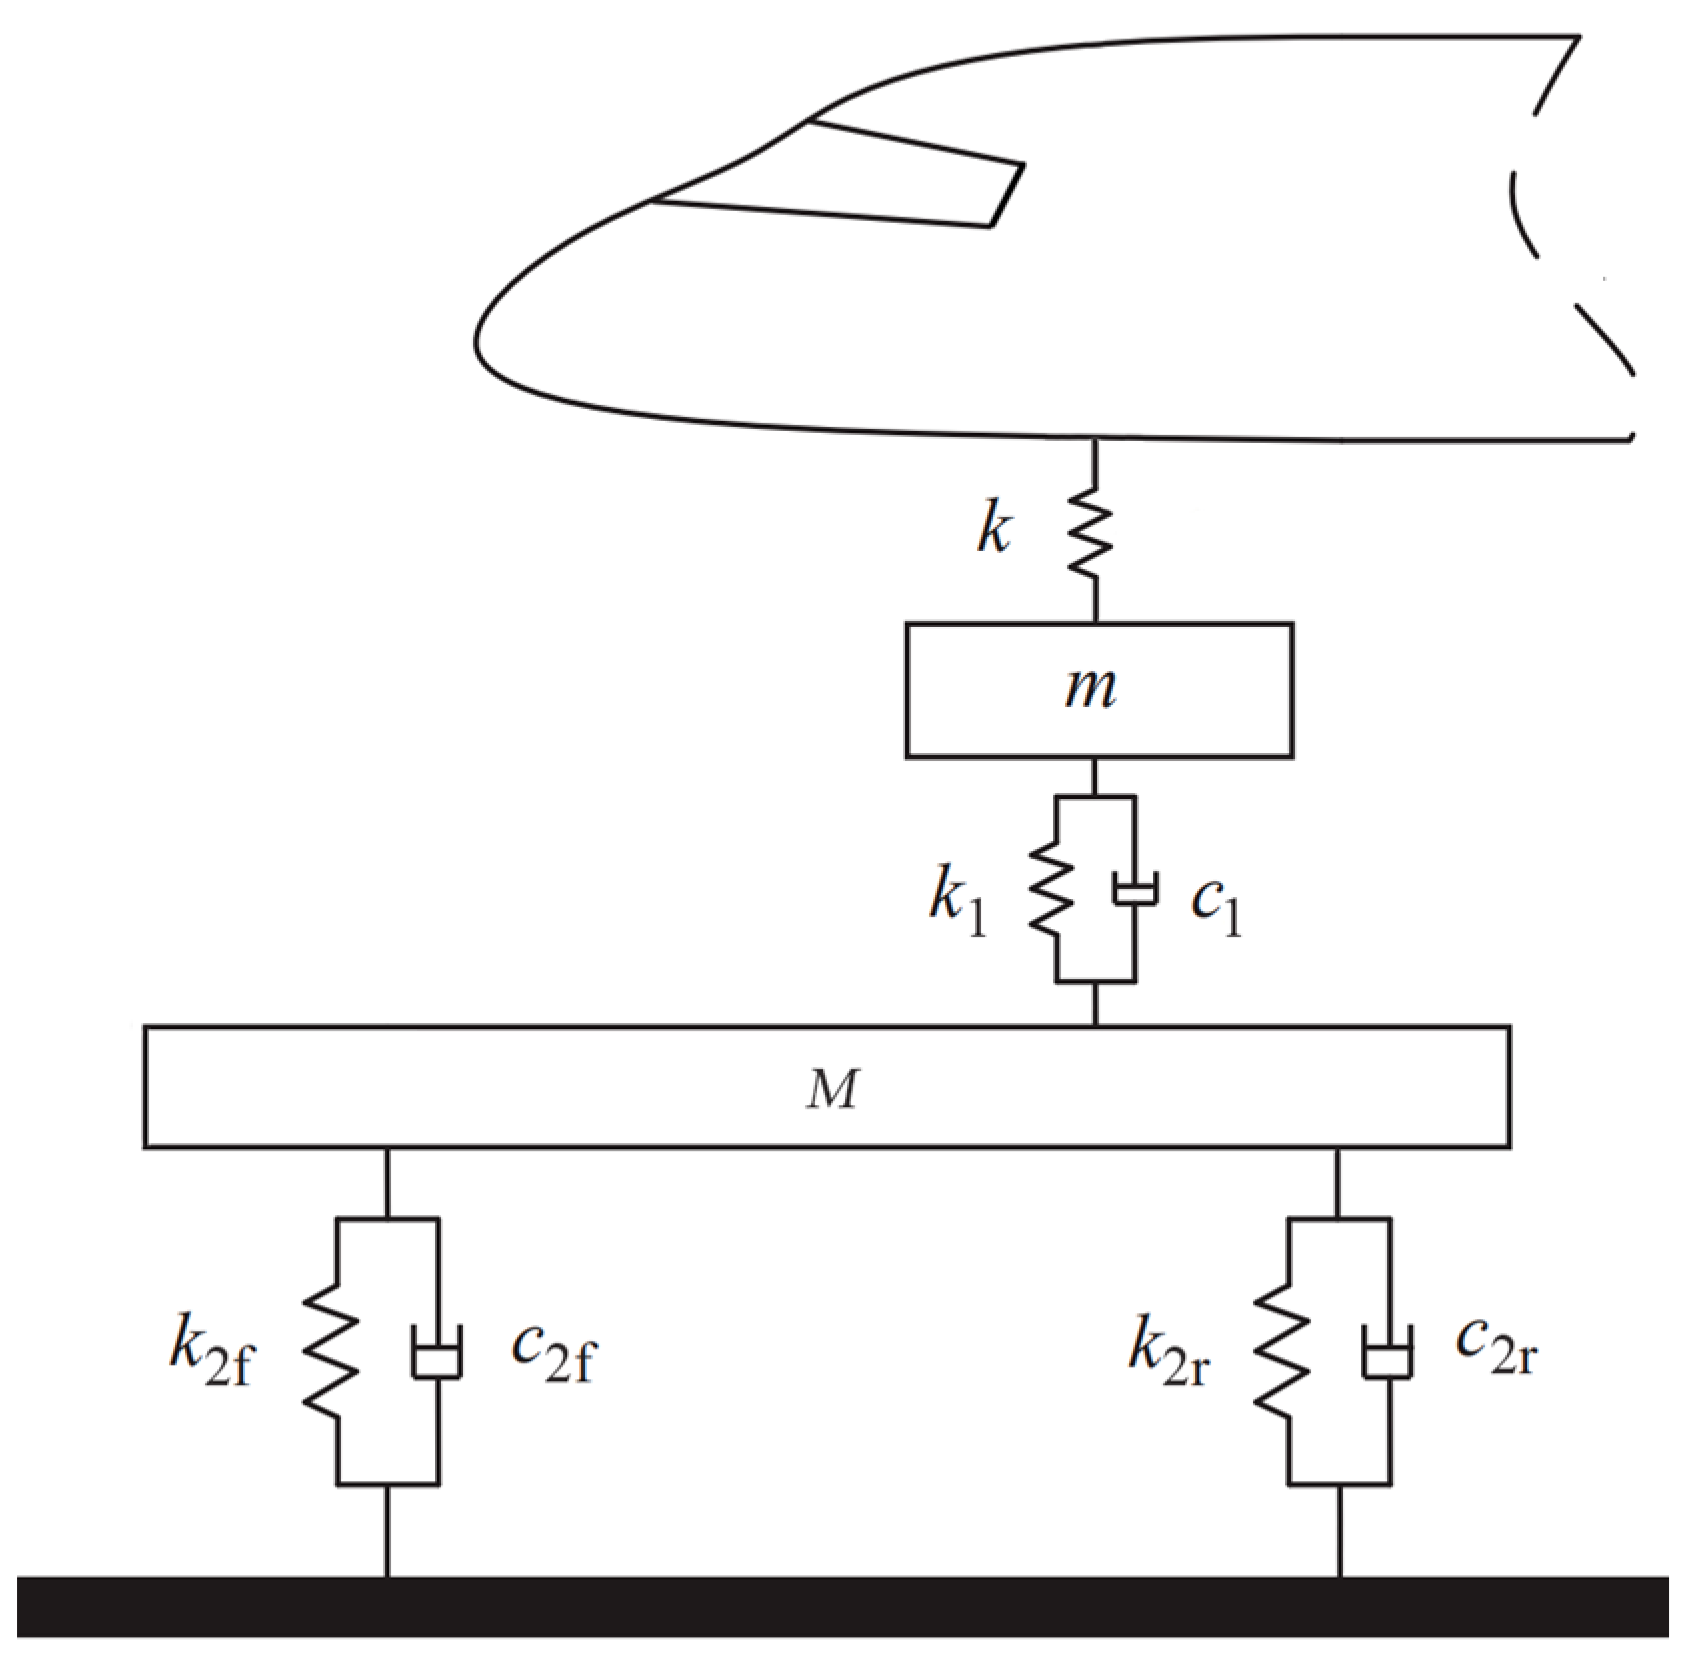
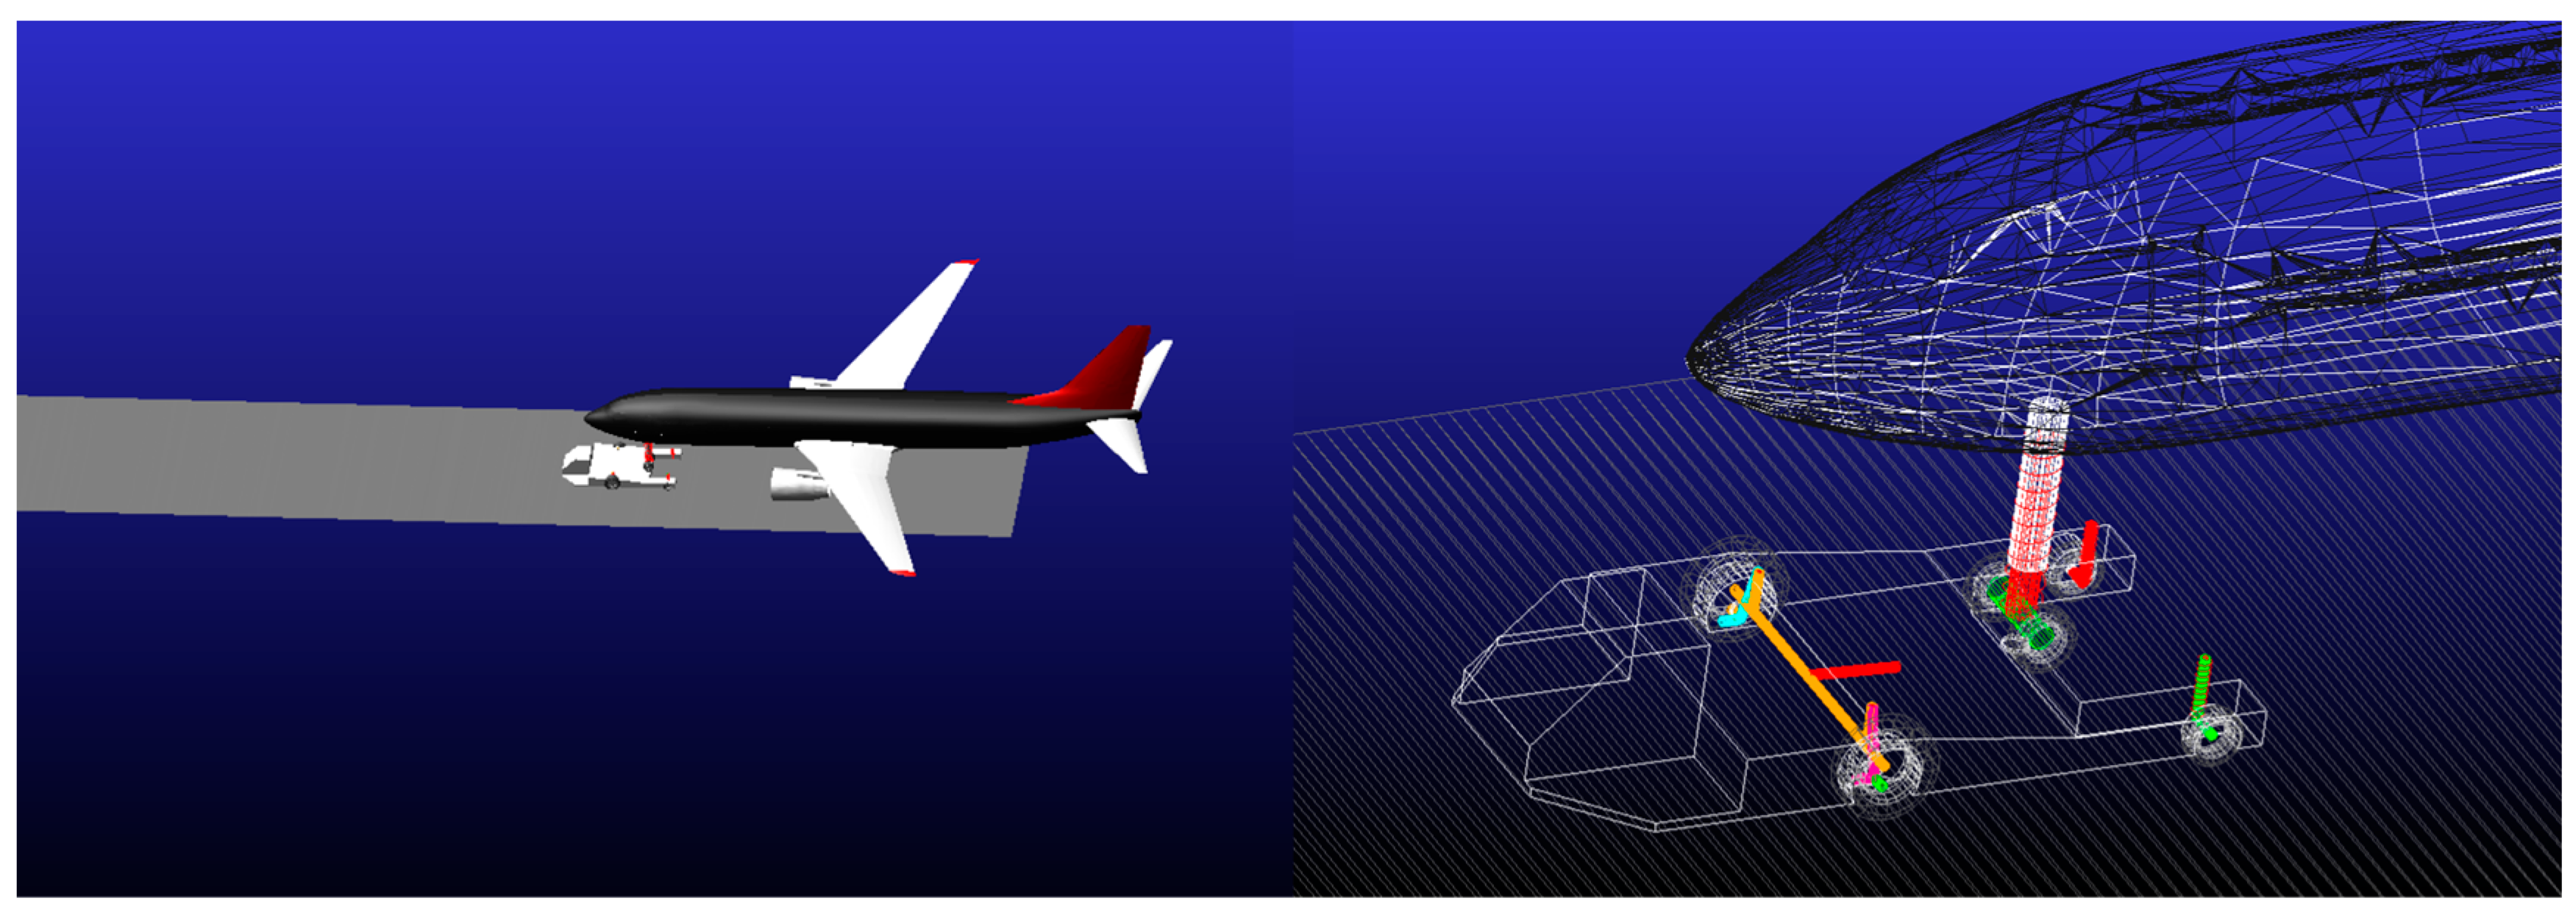
3.1. Dynamic Modeling
3.2. Simulation Results
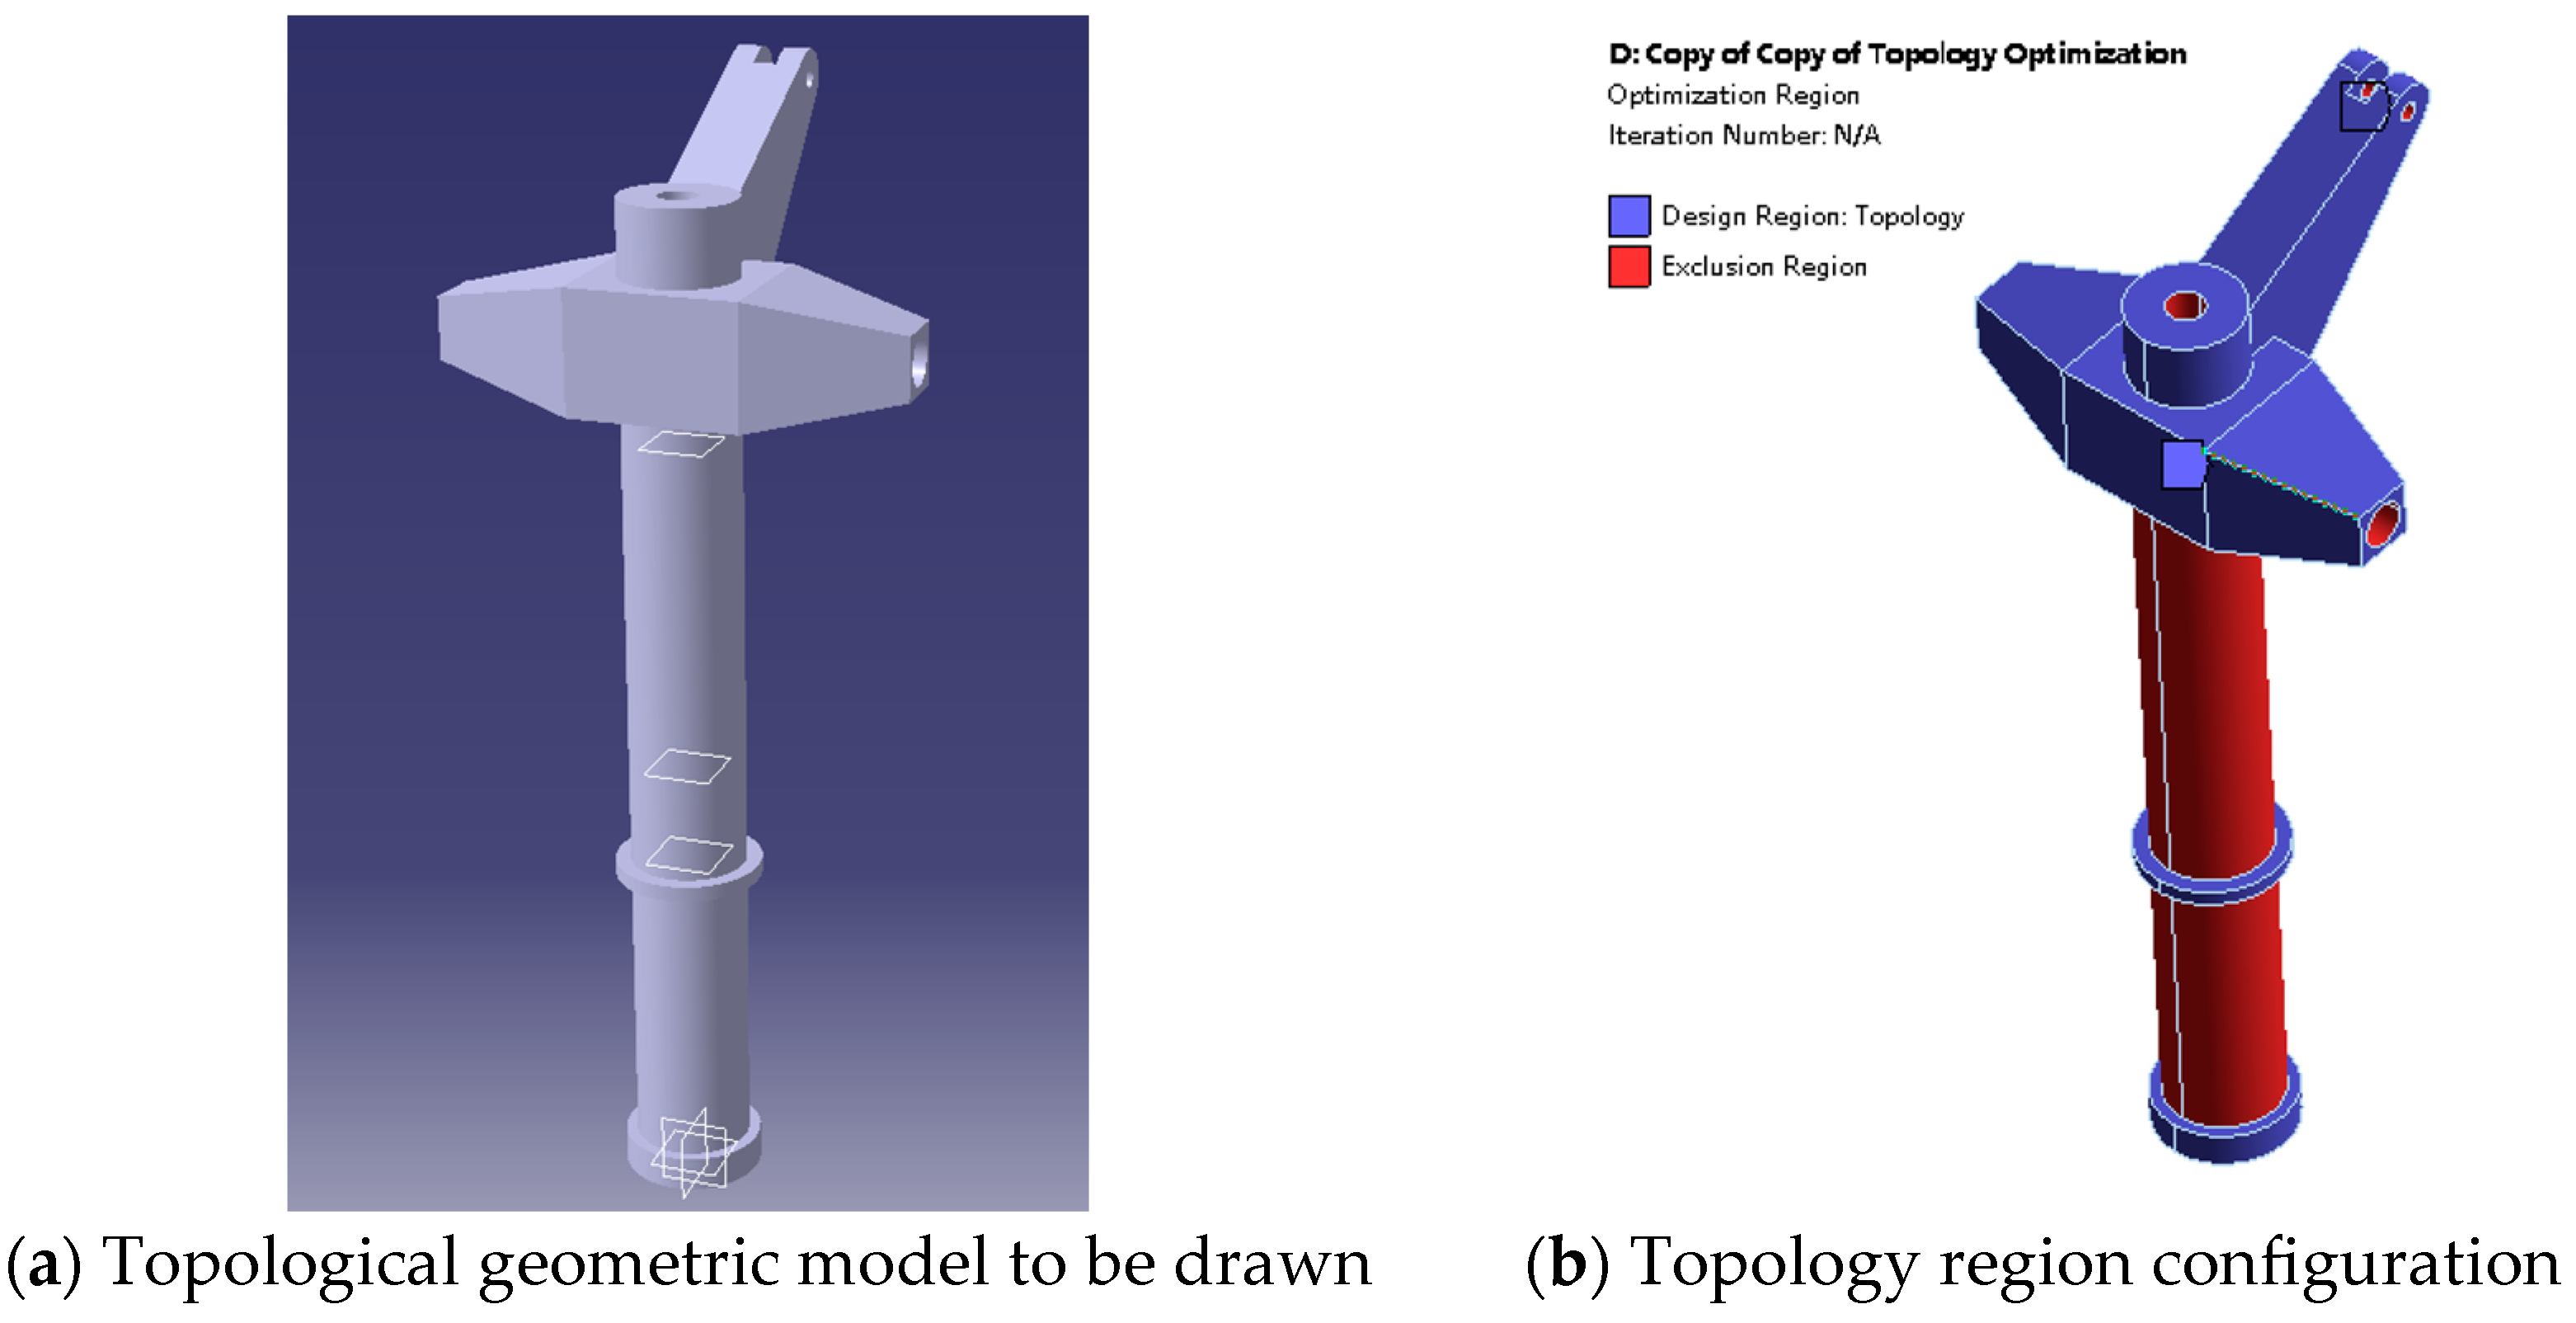
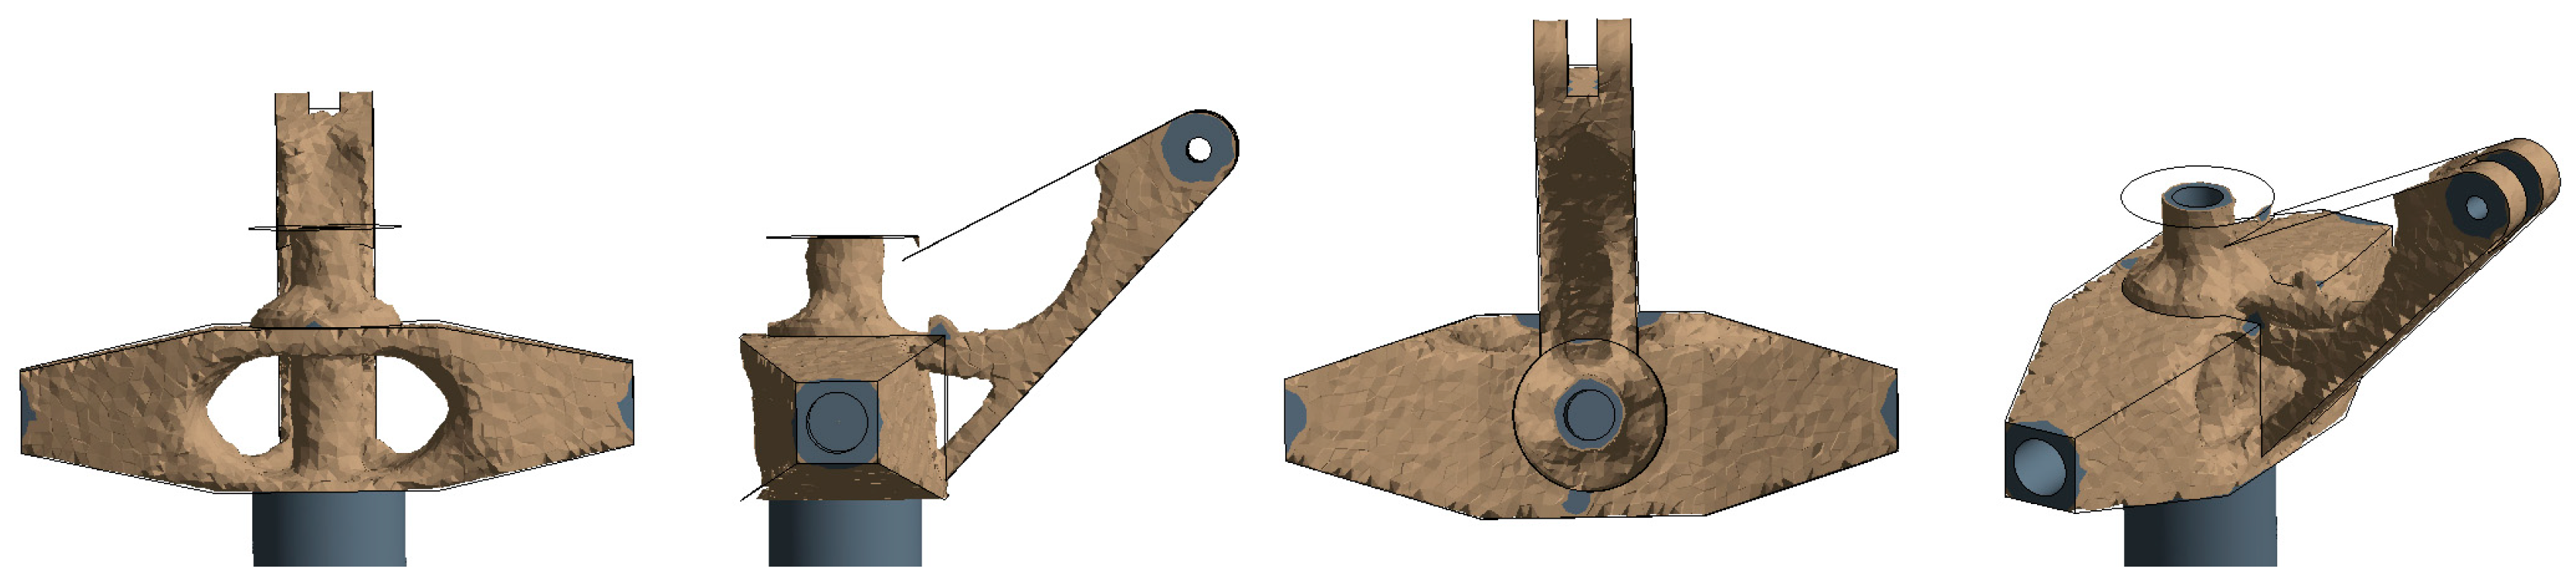
4. Structure Optimization
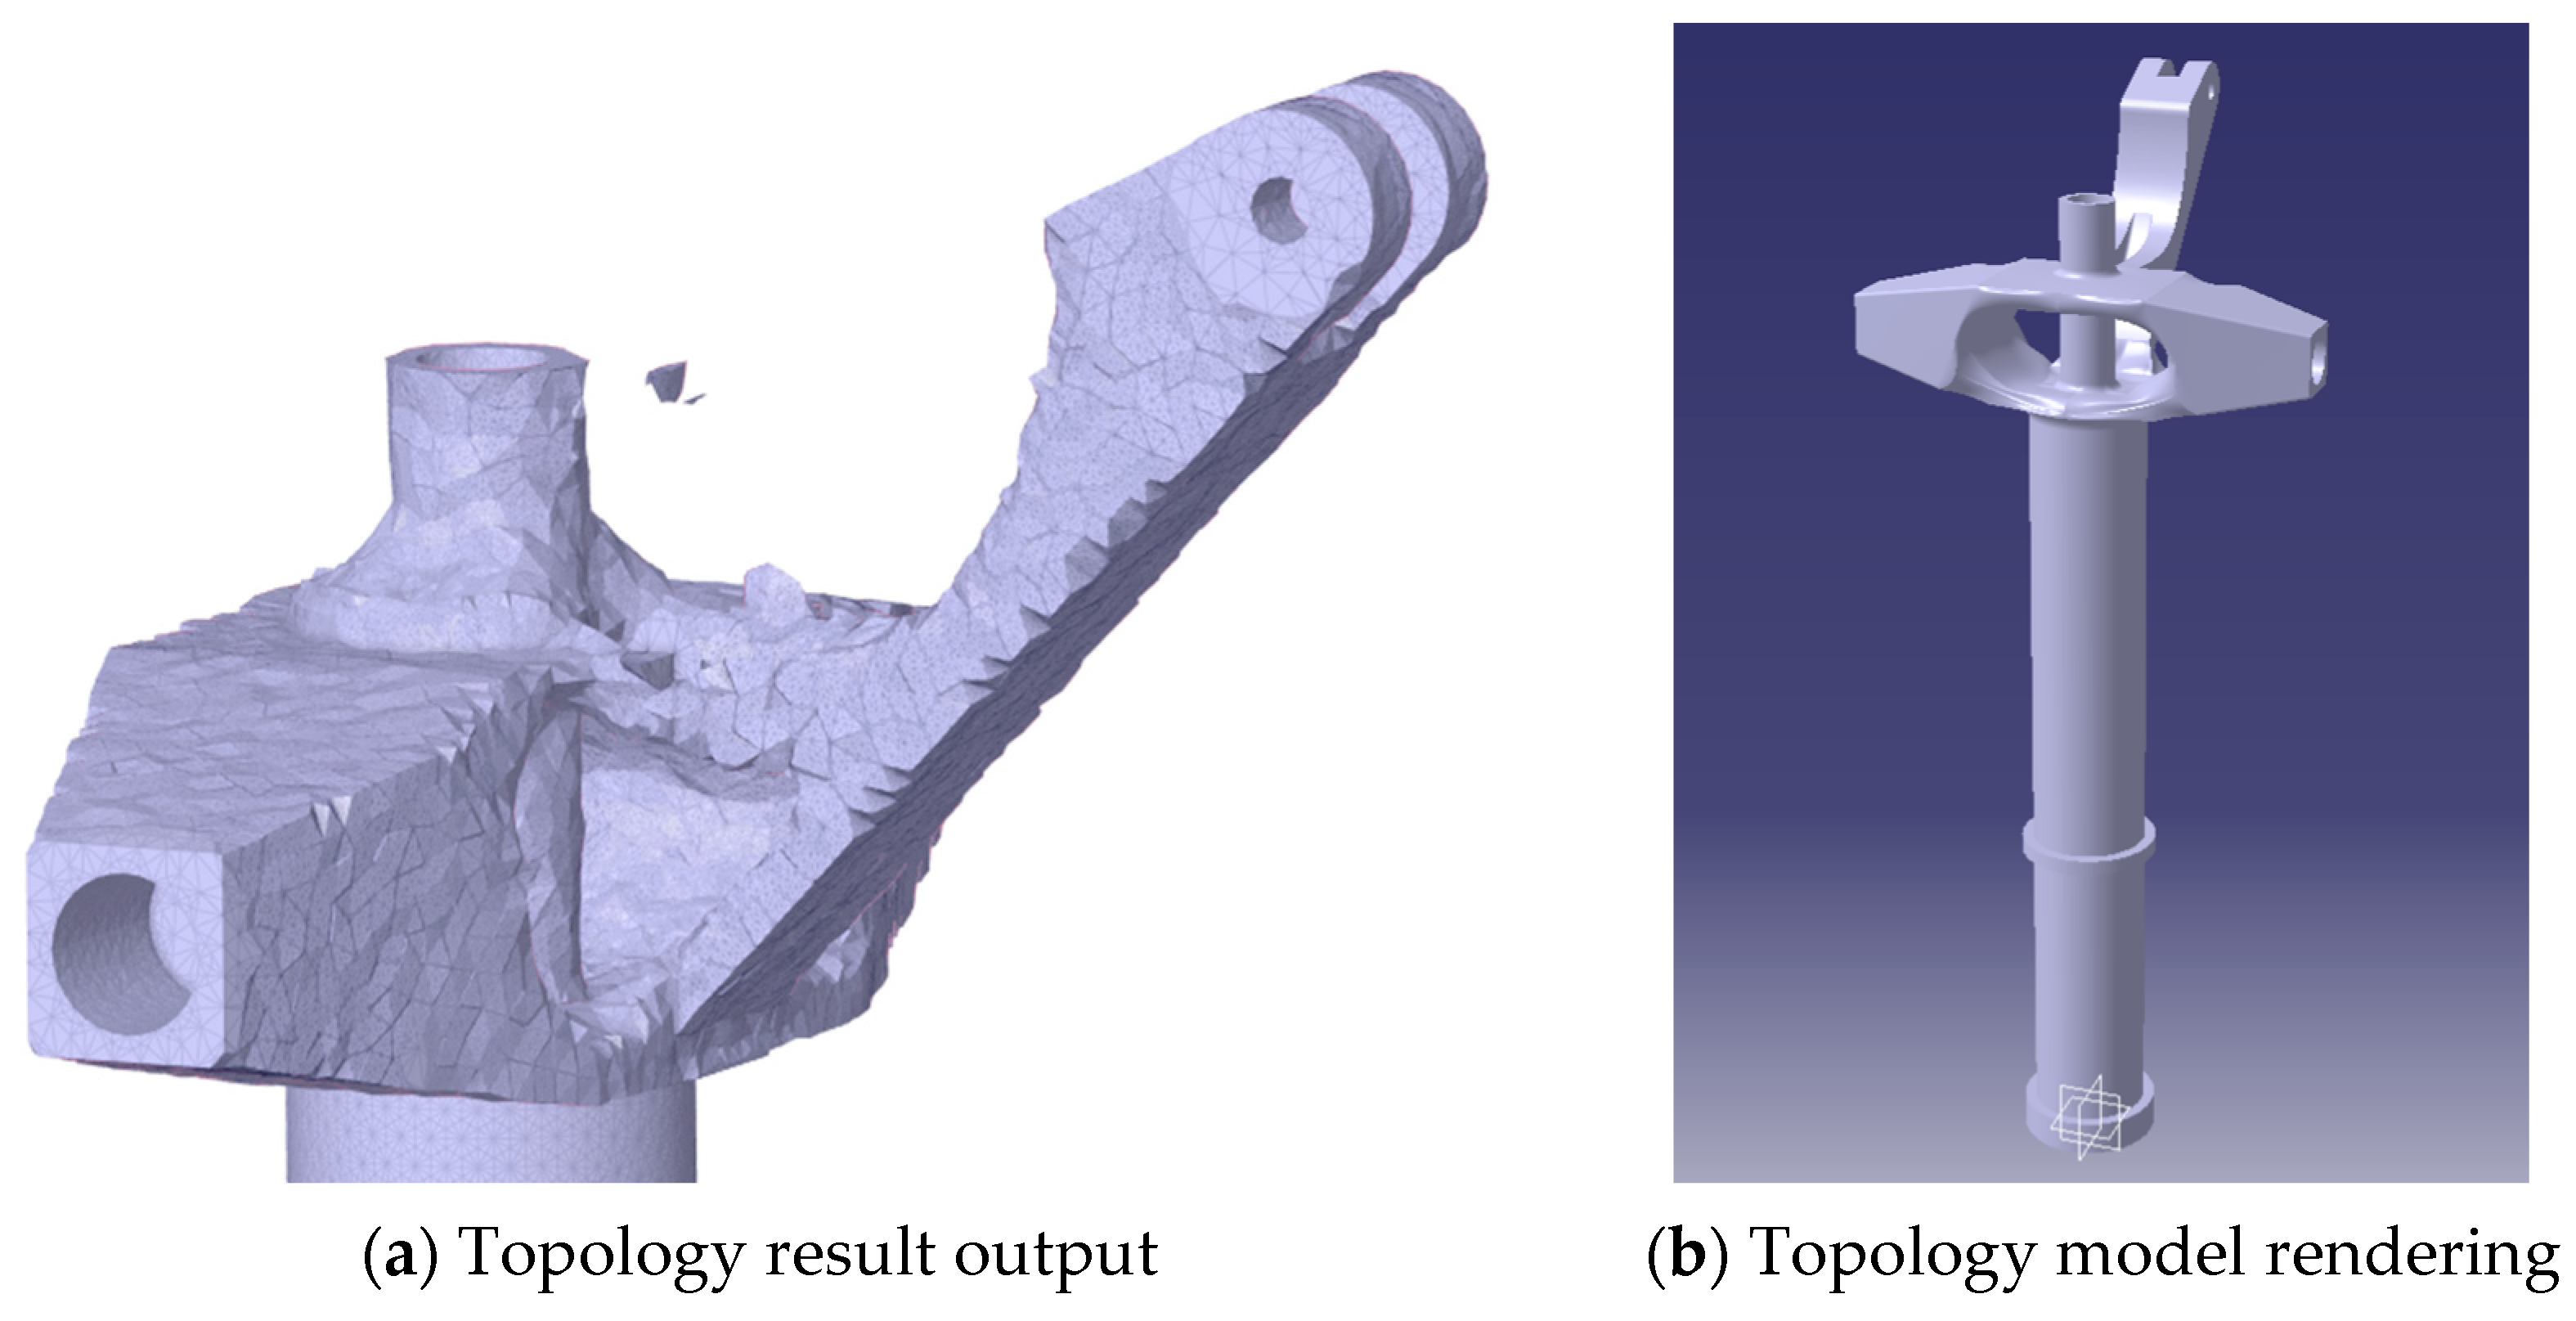
4.1. Topological Optimization
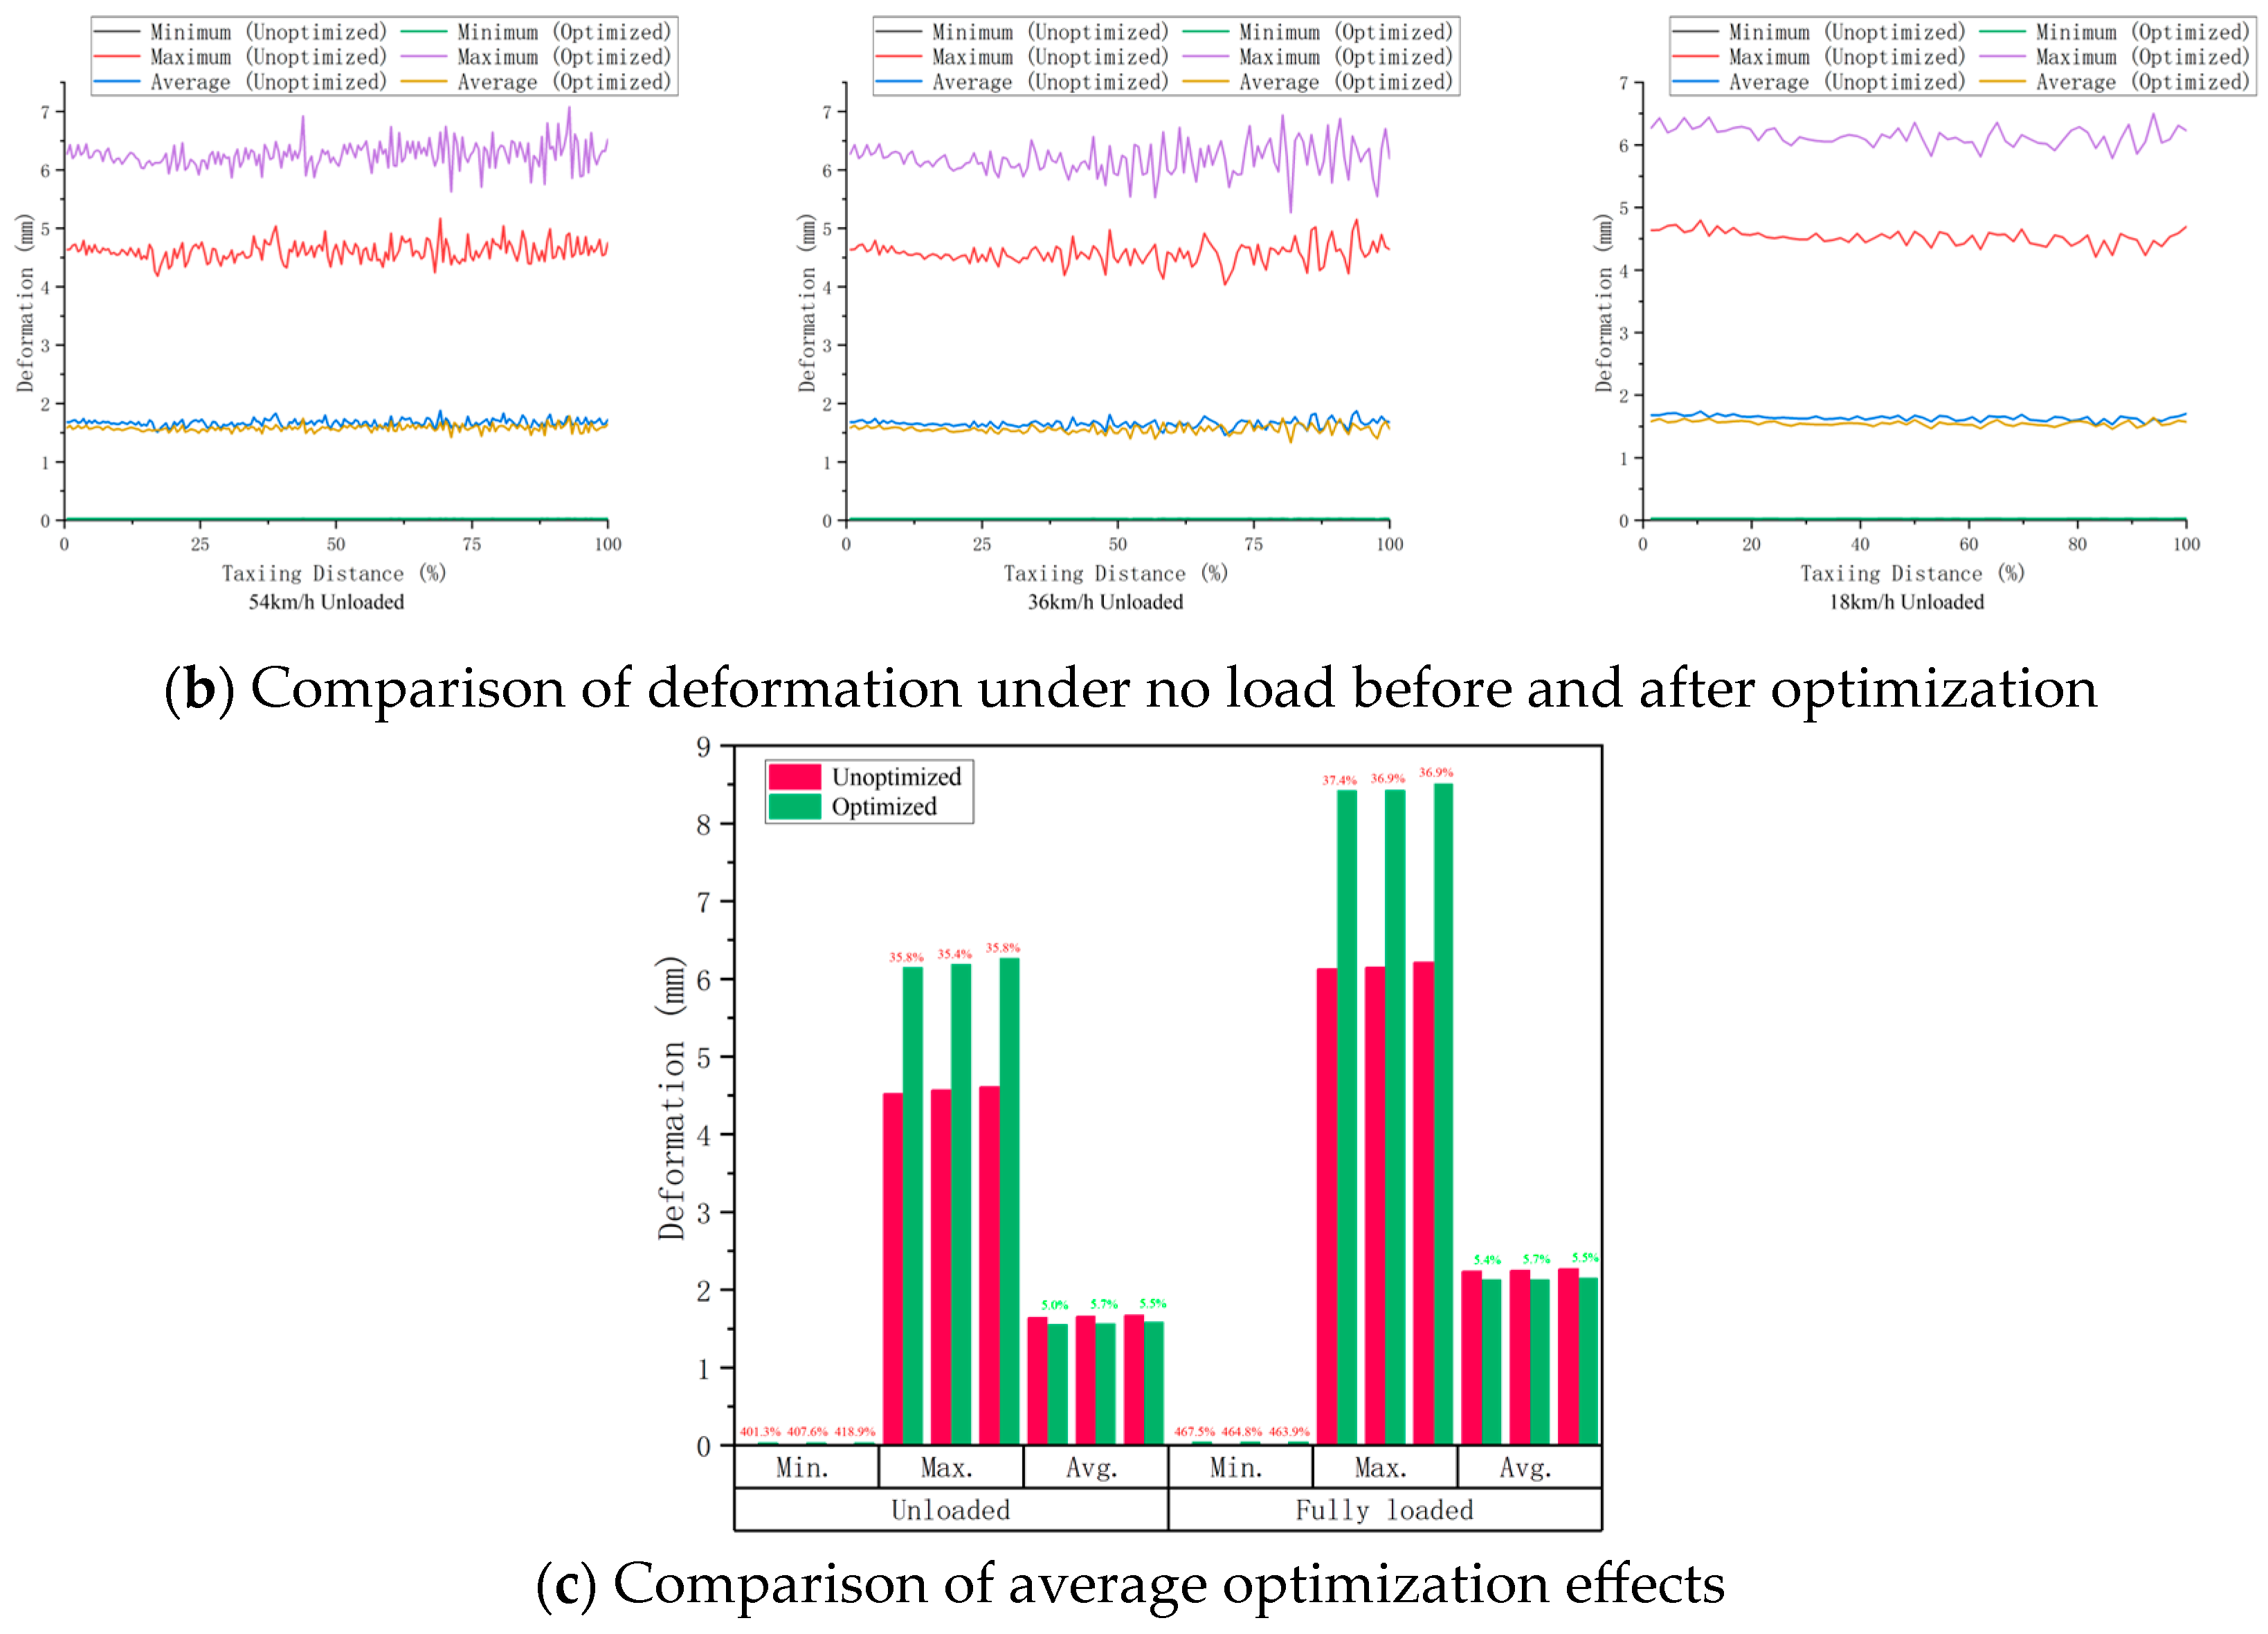
4.2. Result Analysis
5. Conclusions
Author Contributions
Funding
Data Availability Statement
Conflicts of Interest
References
- Tang, Y.D. Design and Optimization of Landing Gear Structure for New Large Passenger Aircraft. Master’s Thesis, Lanzhou University of Technology, Lanzhou, China, 2021. [Google Scholar]
- Zhang, H.; Jiao, Z.X.; Shang, Y.X.; Liu, X.C.; Qi, P.Y.; Wu, S. Ground maneuver for front-wheel drive aircraft via deep reinforcement learning. Chin. J. Aeronaut. 2021, 34, 166–176. [Google Scholar] [CrossRef]
- Boeing Commercial Airplanes. Statistical Summary of Commercial Jet Airplane Accidents. Worldwide Operations 2008. Available online: https://www.boeing.com/content/dam/boeing/boeingdotcom/company/about_bca/pdf/statsum.pdf (accessed on 13 May 2024).
- ASN Wikibase Occurrence # 224818. [EB/OL]. Available online: https://aviation-safety.net/wikibase/224818 (accessed on 23 January 2020).
- Liu, C.X. Research on Ground Towing Safety of Aircraft. Master’s Thesis, Nanjing University of Aeronautics and Astronautics, Nanjing, China, 2018. [Google Scholar]
- MH/T 3011.3-2006; Civil Aircraft Maintenance Ground Safety Part 3: Towing of Civil Aircraft. Civil Aviation Administration of China: Beijing, China, 2006.
- Hein, K.; Baumann, S. Acoustical comparison of conventional taxiing and dispatch towing-Taxibot’s contribution to ground noise abatement. In Proceedings of the 30th Congress of the International Council of the Aeronautical Sciences (ICAS), Daejeon, Republic of Korea, 25–30 September 2016. [Google Scholar]
- Tao, J.F.; Guo, J.X.; Liu, C.L. A review of powered wheel for aircraft. In Proceedings of the 2016 IEEE International Conference on Aircraft Utility Systems (AUS), Beijing, China, 10–12 October 2016. [Google Scholar]
- Sun, Y.K.; Zhang, W.; Yang, X.W.; Liu, J.H.; Zhu, H.J.; Liu, Y.X.; Qin, J.H. Overview of Aircraft Towing and Taxiing Techniques. J. Traffic Transp. Eng. 2023, 23, 23–43. [Google Scholar]
- MH 5001-2021; Technical Standards for Flight Areas of Civil Airports. Civil Aviation Press of China: Beijing, China, 2021. (In Chinese)
- Wollenheit, R.; Mühlhausen, T. Operational and environmental assessment of electric taxi based on fast-time simulation. Transp. Res. Rec. 2013, 2336, 36–42. [Google Scholar] [CrossRef]
- Re, F. Viability and state of the art of environmentally friendly aircraft taxiing systems. In Proceedings of the 2012 Electrical Systems for Aircraft, Railway and Ship Propulsion, Bologna, Italy, 16–18 October 2012; pp. 1–6. [Google Scholar]
- Available online: http://www.airbus.com/support/maintenance-engineering/technical-data/aircraft-characteristics/ (accessed on 5 November 2010).
- Galea, M.; Xu, Z.; Hamiti, T.; Gerada, C.; Pickering, S. Development of an aircraft wheel actuator for green taxiing. In Proceedings of the 2014 International Conference on Electrical Machines (ICEM), IEEE, Berlin, Germany, 2–5 September 2014. [Google Scholar]
- Raminosoa, T.; Hamiti, T.; Galea, M.; Gerada, C. Feasibility and electromagnetic design of direct drive wheel actuator for green taxiing. In Proceedings of the 2011 IEEE Energy Conversion Congress and Exposition, IEEE, Phoenix, AZ, USA, 17–22 September 2011. [Google Scholar]
- Airbus MoU with IAI to Explore Eco-Efficient “Engines-off” Taxiing [EB/OL]. Available online: https://www.airbus.com/newsroom/press-releases/en/2009/06/airbus-mou-with-iai-to-explore-eco-efficient-apos-engines-off-apos-taxiing.html (accessed on 13 February 2015).
- Lukic, M.; Hebala, A.; Giangrande, P.; Klumpner, C.; Nuzzo, S.; Chen, G.; Gerada, C.; Eastwick, C.; Galea, M. State of the art of electric taxiing systems. In Proceedings of the 2018 IEEE International Conference on Electrical Systems for Aircraft, Railway, Ship Propulsion and Road Vehicles & International Transportation Electrification Conference (ESARS-ITEC), IEEE, Nottingham, UK, 7–9 November 2018. [Google Scholar]
- Postorino, M.N.; Mantecchini, L.; Paganelli, F. Improving taxi-out operations at city airports to reduce CO2 emissions. Transp. Policy 2019, 80, 167–176. [Google Scholar] [CrossRef]
- Coetzee, E.; Krauskopf, B.; Lowenberg, M. Analysis of medium-speed runway exit maneuvers. J. Aircr. 2011, 48, 1553–1564. [Google Scholar] [CrossRef]
- Dzikus, N.M.; Wollenheit, R.; Schaefer, M.; Gollnick, V. The benefit of innovative taxi concepts: The impact of airport size, fleet mix and traffic growth. In Proceedings of the 2013 Aviation Technology, Integration, and Operations Conference, Los Angeles, CA, USA, 12–14 August 2013. [Google Scholar]
- Tabares, D.A.; Mora-Camino, F. Aircraft ground operations: Steps towards automation. CEAS Aeronaut. J. 2019, 10, 965–974. [Google Scholar] [CrossRef]
- Chen, S.W.; Liu, H.; Liu, H.; Li, F.H.; Zhang, H. Analysis of Aircraft Ground Towing Load with Contact Collision. J. Harbin Eng. Univ. 2017, 38, 1794–1799. [Google Scholar]
- Liang, Q.X.L.; Hu, B.T.; Wang, Z. Static Strength Test Design of Aircraft Nose Landing Gear Based on Vertical Self-Balanced Loading. Test Technol. Test. Mach. 2023, 63, 40–42. [Google Scholar]
- Li, Z.P.; Wu, B.; Wang, X.M.; Lv, W.; Fan, Q.B. A Fatigue Test Method for Aircraft Nose Landing Gear Outer Cylinder Suspension Street Towing Takeoff. Chinese Patent CN108163225A, 29 November 2017. [Google Scholar]
- Li, Y.M.; Li, X.Y.; Chai, Y.J.; Yang, X.W. Dynamic Response Analysis of Front Landing Gear under New Towing Slipway Mode for Aircraft. Acta Aeronaut. Astronaut. Sin. 2022, 43, 214–227. [Google Scholar]
- Kharghani, N.; Guedes Soares, C. Analytical and experimental study of the ultimate strength of delaminated composite laminates under compressive loading. Compos. Struct. 2019, 228, 111355. [Google Scholar] [CrossRef]
- Caputo, F.; De Luca, A.; Greco, A.; Maietta, S.; Marro, A.; Apicella, A. Investigation on the static and dynamic structural behaviors of a regional aircraft main landing gear by a new numerical methodology. Frat. Ed Integrità Strutt. 2018, 12, 191–204. [Google Scholar] [CrossRef]
- Zhu, H.J.; Lv, X.; Zhang, B.Z. Research on the Smoothness of the Traction System of a Cableless Aircraft Considering Flexible Frame. Mech. Sci. Technol. Aerosp. Eng. 2022, 41, 1458–1467. [Google Scholar]
- Zhang, Y.; Jin, Z.R.; Jia, W.T.; Liu, X.C.; Xu, Y. Random Response and Reliability Analysis of Aircraft Landing Gear under Uneven Runway Excitation. J. Vib. Eng. 2024, 37, 497–504. [Google Scholar]
- Qin, J.H.; Liu, J.W.; Lin, Q.W.; Zhang, W. Research on Instability and “Jack-Knifing” of Civil Aircraft Towing Taxi-Out System. Appl. Sci. 2023, 13, 3636. [Google Scholar] [CrossRef]
- Munk, D.J.; Auld, D.J.; Steven, G.P.; Vio, G.A. On the benefits of applying topology optimization to structural design of aircraft components. Struct. Multidiscip. Optim. 2019, 60, 1245–1266. [Google Scholar] [CrossRef]
- Xue, C.J.; Dai, J.H.; Wei, T.; Liu, B.; Deng, Y.Q.; Ma, J. Structural optimization of a nose landing gear considering its fatigue life. J. Aircr. 2012, 49, 225–236. [Google Scholar] [CrossRef]
- Deng, Y. Application of shape optimization in landing-gear structural design of small aircraft. Mech. Eng. 2008, 30, 47–51. [Google Scholar]
- Yang, G.; He, P.; Wang, Y.; Liu, C. Structural Optimization of the Lower Door of the Main Landing Gear of an Aircraft. J. Phys. Conf. Ser. 2023, 2557, 012019. [Google Scholar] [CrossRef]


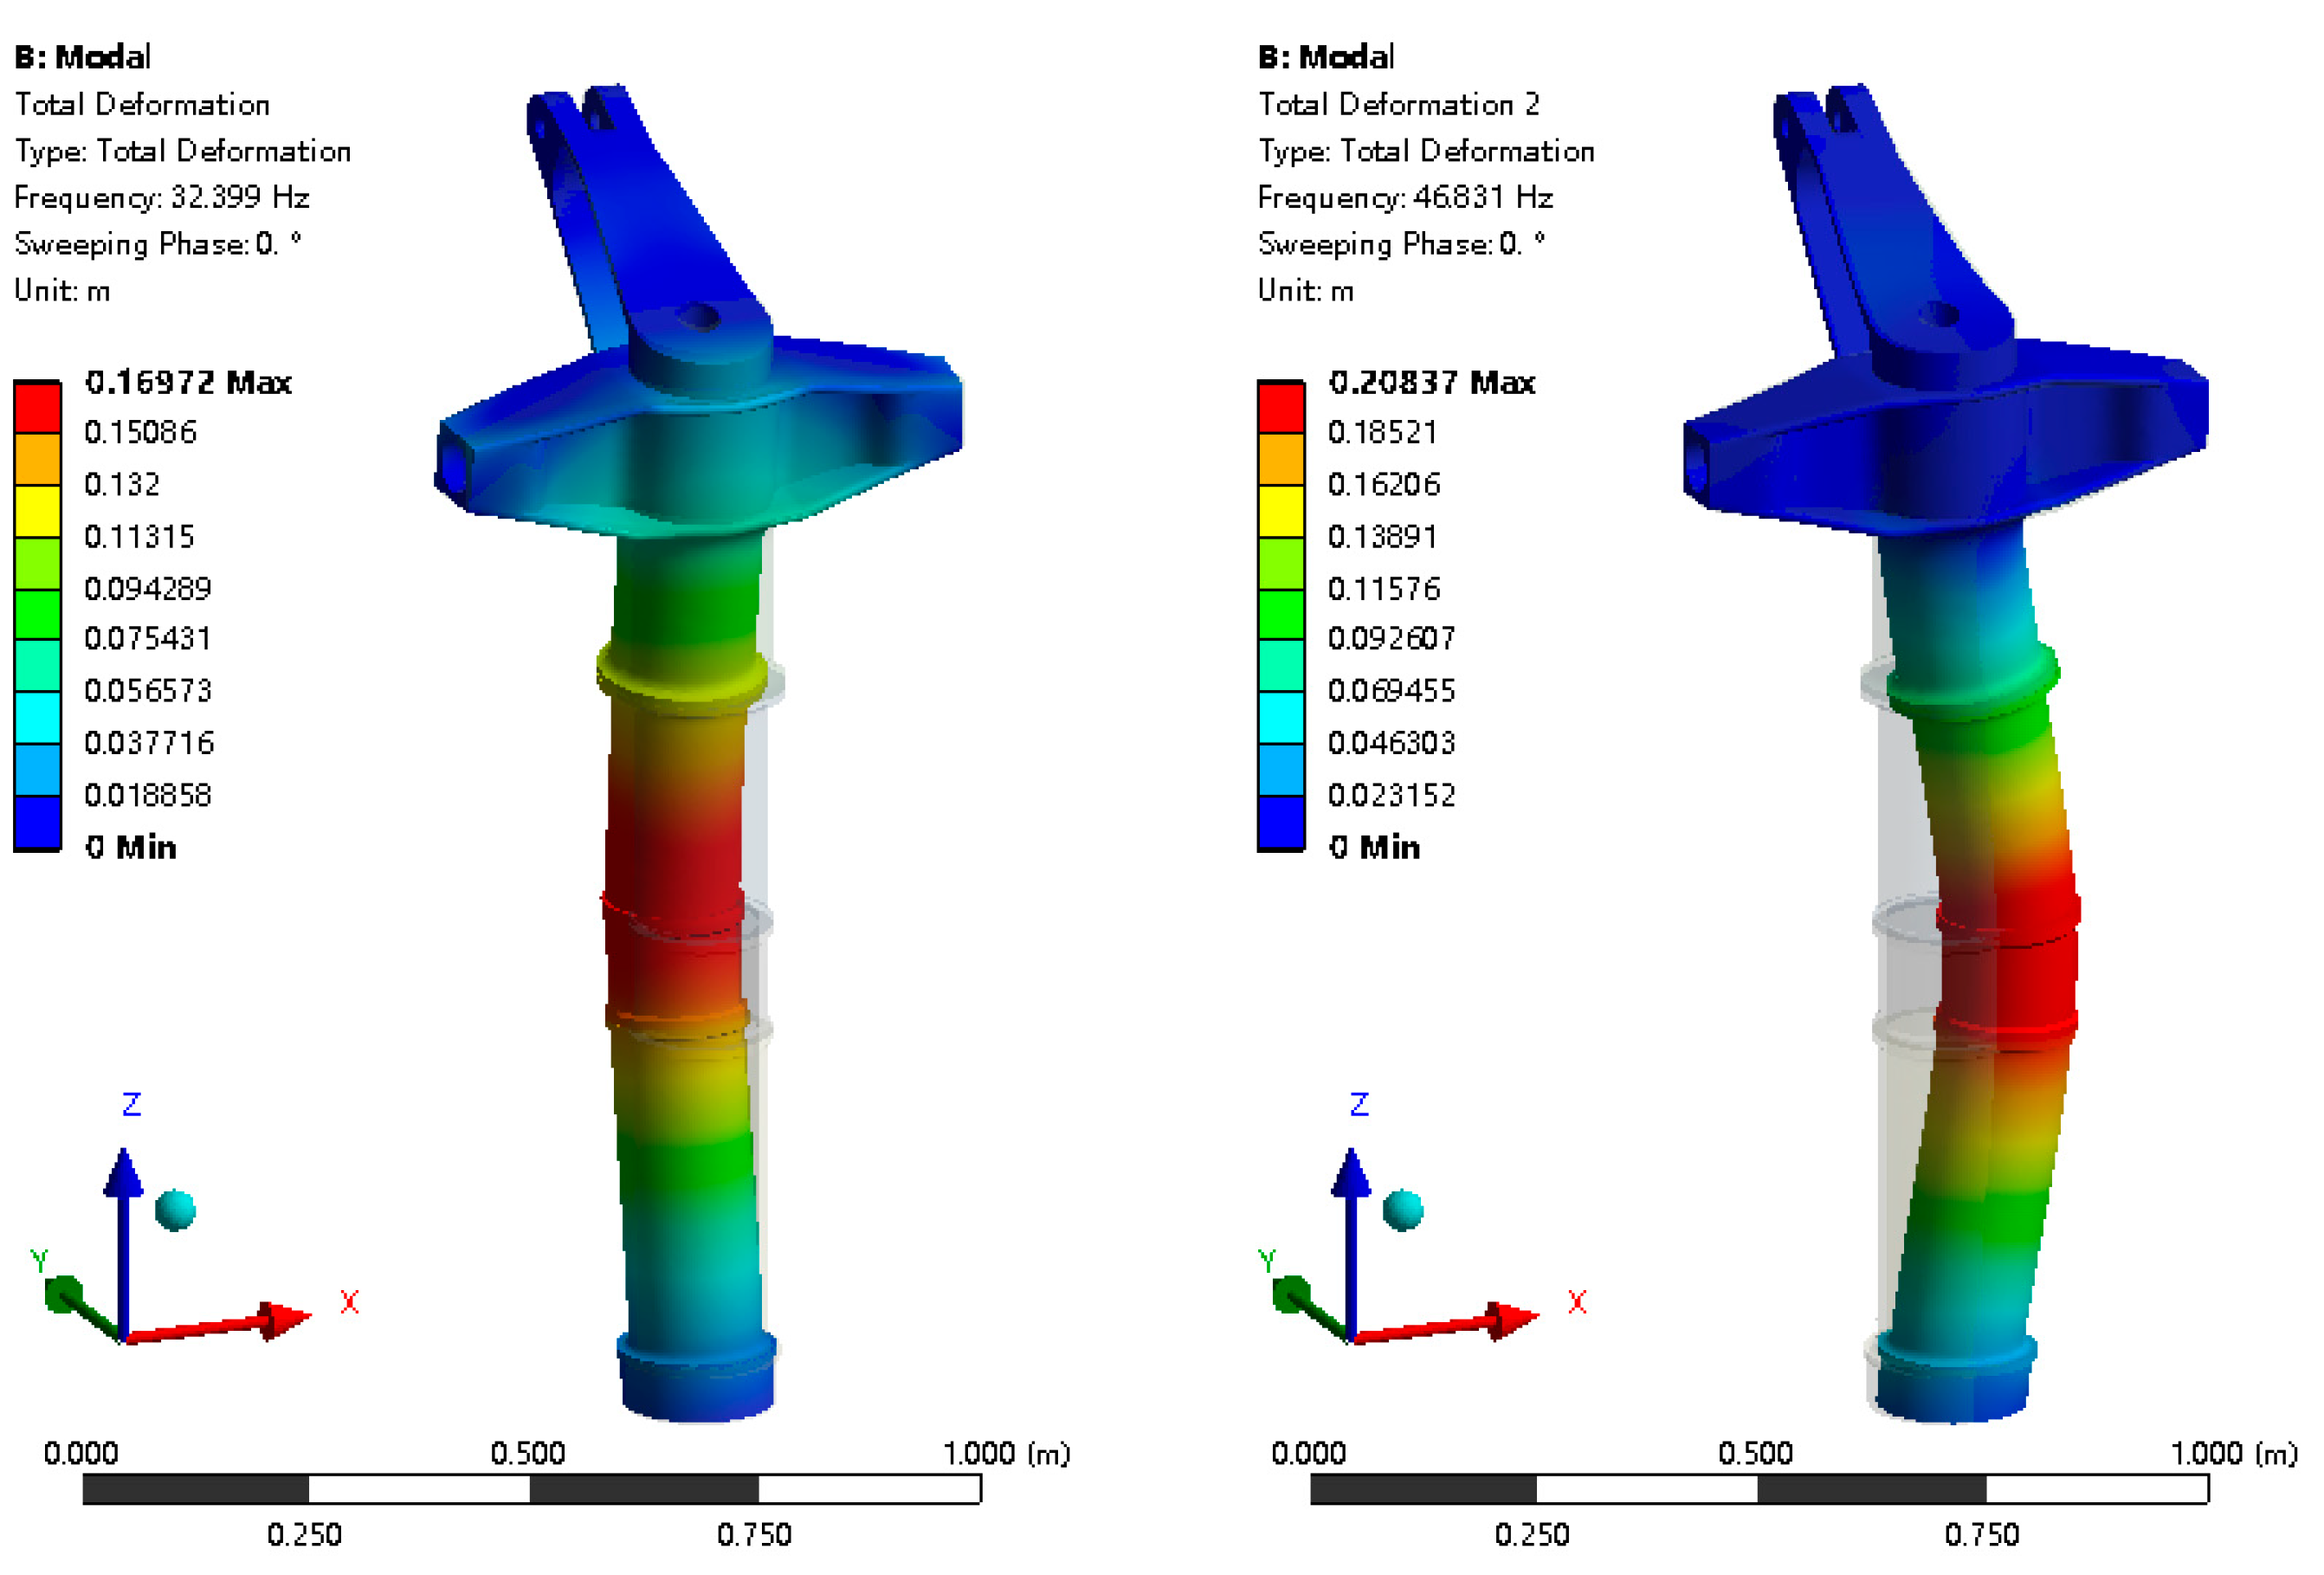
| Modal Order | Natural Frequency/Hz | Mode Shape |
|---|---|---|
| 1 | 32.399 | Bending vibration in the middle section of the shock strut along the Y-axis |
| 2 | 46.831 | Bending vibration in the middle section of the shock strut along the X-axis |
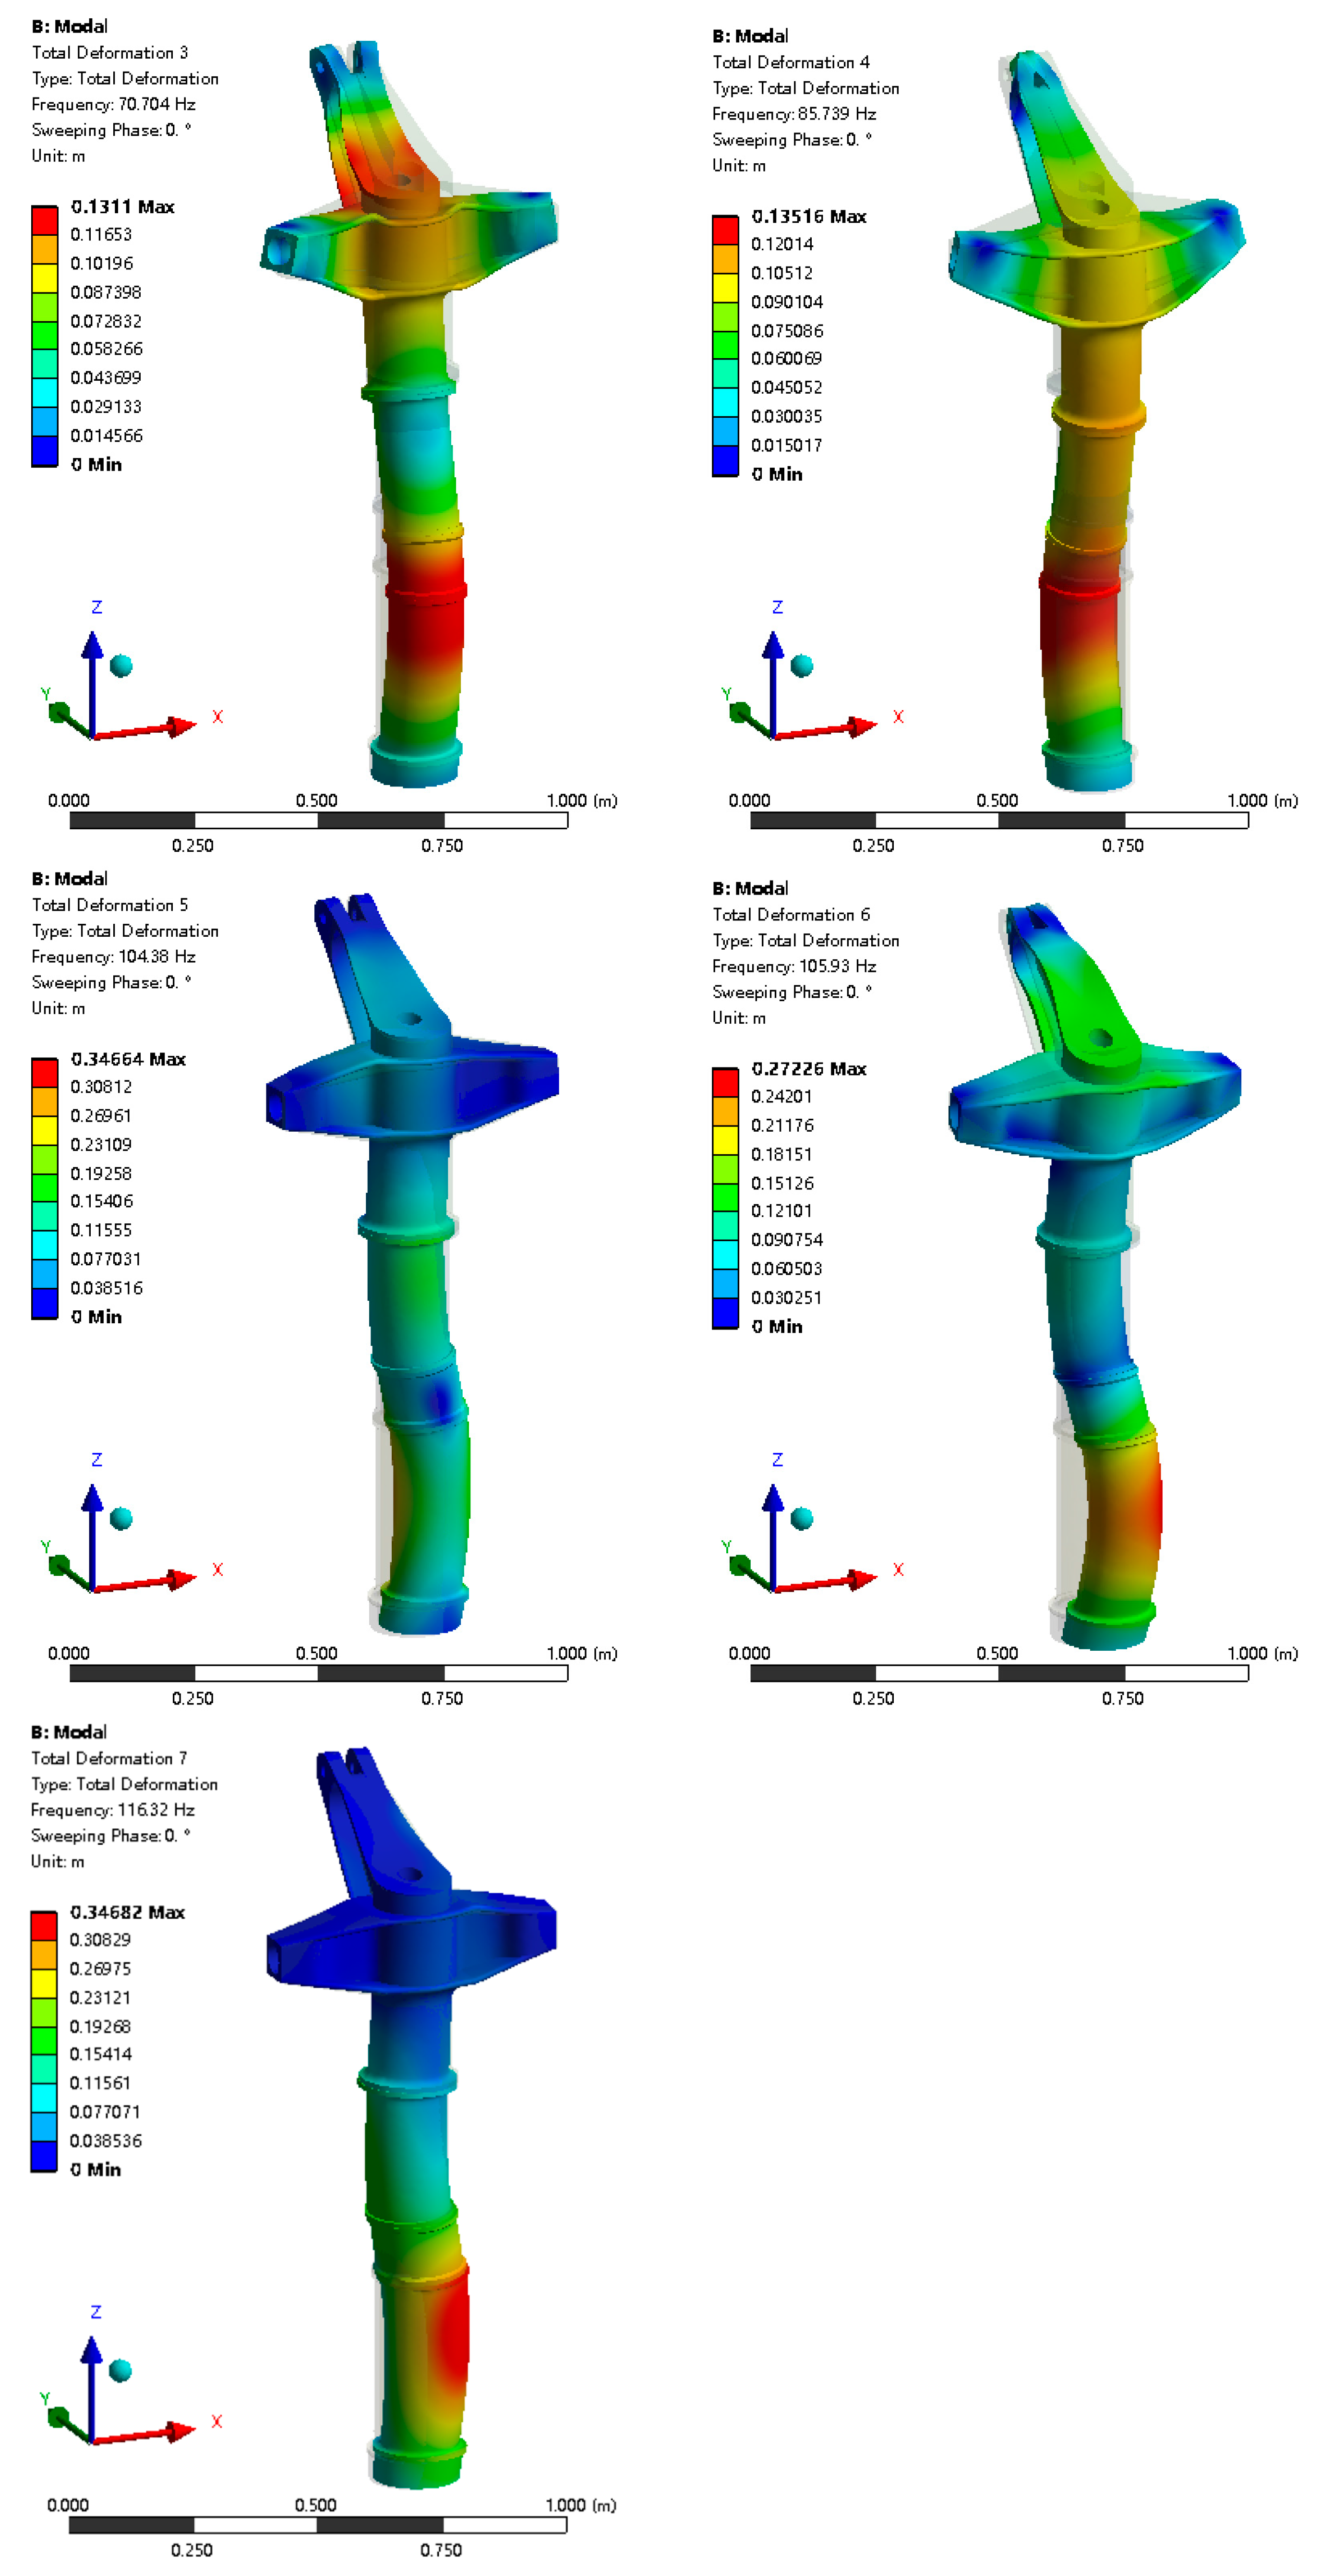
| 3 | 70.704 | Bending vibration in the drag strut along the Y-axis, with both the upper and lower segments of the shock strut also experiencing bending vibration along the Y-axis |
| 4 | 85.739 | Bending vibration in the upper and lower sections of the shock strut along the Y-axis |
| 5 | 104.37 | Torsional vibration around the Z-axis in the middle and lower sections of the shock strut |
| 6 | 105.93 | Torsional vibration around the Z-axis in the middle and lower sections of the shock strut |
| 7 | 116.32 | Torsional vibration around the Z-axis in the lower section of the shock strut |
| Modal Order | Natural Frequency/Hz |
|---|---|
| 1 | 31.252 |
| 2 | 42.856 |
| 3 | 74.391 |
| 4 | 91.613 |
| 5 | 102.580 |
| 6 | 103.213 |
| 7 | 116.057 |
| Parameters | Value |
|---|---|
| Empty Aircraft Weight /kg | 44,330 |
| Fully Loaded Aircraft Weight /kg | 78,100 |
| Towing Force of Empty Aircraft by Tow Tractor /N | 66,495 |
| Towing Force of Fully Loaded Aircraft by Tow Tractor /N | 117,150 |
| Landing Gear Wheel Stiffness /(kN·m−1) | 2000 |
| Landing Gear Wheel Damping /(kN·s·m−1) | 0.8 |
| Landing Gear Stiffness /(kN·m−1) | 27,100 |
| Landing Gear Mass /kg | 600 |
| Tow Tractor Mass /kg | 13,000 |
| Front Wheel Stiffness of Tow Tractor /(kN·m−1) | 4000 |
| Rear Wheel Stiffness of Tow Tractor /(kN·m−1) | 4000 |
| Front Wheel Damping of Tow Tractor /(kN·s·m−1) | 1 |
| Rear Wheel Damping of Tow Tractor /(kN·s·m−1) | 1 |
Disclaimer/Publisher’s Note: The statements, opinions and data contained in all publications are solely those of the individual author(s) and contributor(s) and not of MDPI and/or the editor(s). MDPI and/or the editor(s) disclaim responsibility for any injury to people or property resulting from any ideas, methods, instructions or products referred to in the content. |
© 2024 by the authors. Licensee MDPI, Basel, Switzerland. This article is an open access article distributed under the terms and conditions of the Creative Commons Attribution (CC BY) license (https://creativecommons.org/licenses/by/4.0/).
Share and Cite
Lin, Q.; Yang, C.; Bai, Y.; Qin, J. Structural Strength Analysis and Optimization of Commercial Aircraft Nose Landing Gear under Towing Taxi-Out Conditions Using Finite Element Simulation and Modal Testing. Aerospace 2024, 11, 414. https://doi.org/10.3390/aerospace11050414
Lin Q, Yang C, Bai Y, Qin J. Structural Strength Analysis and Optimization of Commercial Aircraft Nose Landing Gear under Towing Taxi-Out Conditions Using Finite Element Simulation and Modal Testing. Aerospace. 2024; 11(5):414. https://doi.org/10.3390/aerospace11050414
Chicago/Turabian StyleLin, Qiwei, Chang Yang, Yuhao Bai, and Jiahao Qin. 2024. "Structural Strength Analysis and Optimization of Commercial Aircraft Nose Landing Gear under Towing Taxi-Out Conditions Using Finite Element Simulation and Modal Testing" Aerospace 11, no. 5: 414. https://doi.org/10.3390/aerospace11050414
APA StyleLin, Q., Yang, C., Bai, Y., & Qin, J. (2024). Structural Strength Analysis and Optimization of Commercial Aircraft Nose Landing Gear under Towing Taxi-Out Conditions Using Finite Element Simulation and Modal Testing. Aerospace, 11(5), 414. https://doi.org/10.3390/aerospace11050414