Article

An Experimental and Analytical Approach to Evaluate Transponder-Based Aircraft Noise Monitoring Technology

1
School of Technology and Professional Services Management, Eastern Michigan University, Ypsilanti, MI 48197, USA
2
School of Aviation and Transportation Technology, Purdue University, West Lafayette, IN 47906, USA
*
Author to whom correspondence should be addressed.
Aerospace 2024, 11(3), 199; https://doi.org/10.3390/aerospace11030199
Submission received: 22 December 2023 / Revised: 26 February 2024 / Accepted: 29 February 2024 / Published: 1 March 2024

Abstract

:
Aviation is a vital modern transportation sector connecting millions of passengers globally. Sustainable aviation development holds substantial community benefits, necessitating effective management of its environmental impacts. This paper addresses the need for an accurate and cost-effective aircraft noise monitoring model tailored to non-towered general aviation airports with limited resources for official air traffic data collection. The existing literature highlights a heavy reliance on air traffic data from control facilities in prevailing aircraft noise modeling solutions, revealing a disparity between real-world constraints and optimal practices. Our study presents a validation of a three-stage framework centered on a low-cost transponder unit, employing an innovative experimental and analytical approach to assess the model’s accuracy. An economical Automatic Dependent Surveillance-broadcast (ADS-B) receiver is deployed at Purdue University Airport (ICAO Code: KLAF) to estimate aircraft noise levels using the developed approach. Simultaneously, a physical sound meter is positioned at KLAF to capture actual acoustic noise levels, facilitating a direct comparison with the modeled data. Results demonstrate that the developed noise model accurately identifies aircraft noise events with an average error of 4.50 dBA. This suggests the viability of our low-cost noise monitoring approach as an affordable solution for non-towered general aviation airports. In addition, this paper discusses the limitations and recommendations for future research.

1. Introduction

Air transportation is an indispensable pillar in modern global connectivity, facilitating the travel of millions of passengers worldwide. The sustainable and consistent growth of the aviation sector is of paramount importance to society, as it contributes to the livelihoods of 87.7 million individuals and generates an impressive USD 3.5 trillion in global GDP [1]. However, this remarkable progress is accompanied by an environmental challenge—aircraft noise, which has the potential to cause considerable residential disturbance, impeding the development and expansion of airports [2,3]. The Civil Aviation Authority (CAA) of the United Kingdom (UK) concluded that noise is the main environmental concern regarding GA operations near the local community [4]. Hot topics concerning aviation noise include circuit training, aerobatics, parachute dropping/glide tug aircraft, and piston engines. Circuit training is essential to pilot training as it exercises coordination and judgment, teaches student pilots to make safe maneuvers such as takeoff and landing, and coordinates turns. Some important features of such training are the extremely repetitive maneuvers with aircraft flying at low altitudes (below ~5000 ft) for prolonged periods of time.
Several studies focus on the noise complaints triggered by local airport operations. A study aimed to investigate the local community’s perspective regarding the type of operations at eight airports in Massachusetts [5]. Another study surveyed two hundred thirty-one respondents who lived in the vicinity of the Decatur, Illinois Airport (ICAO Code: KDEC) and found that the percent of respondents were highly annoyed versus DNL and reasonable comparisons between the respondents’ predicted traffic and truth traffic data [6]. In more recent studies, Friedt and Cohen [7] indicated noise complaints are a reliable measure of residential noise annoyance and significantly affect home prices, extending nearly twice as far (10 km) as contours.
Schomer [8] examined issues regarding noise monitoring in the vicinity of moderate-sized airports using day/night average sound levels (DNL) and concluded that selecting quiet sites would reduce the community noise impact in the noise monitoring procedure. Therefore, a comprehensive comprehension of aircraft noise is imperative for minimizing and mitigating aviation’s environmental impact on surrounding communities [9,10,11].
To address this challenge, various aviation environmental modeling tools have been developed, including the Aviation Environmental Design Tool (AEDT) and the Aircraft Noise Prediction Program 2 (ANOPP2) by the Federal Aviation Administration (FAA) and the National Aeronautics and Space Administration (NASA) [12,13,14]. These tools primarily rely on air traffic data to calculate noise levels, as Figure 1 [15] depicts. However, such modeling approaches are notably limited in their applicability, particularly in non-towered general aviation (GA) airports, where acquiring reliable air traffic data poses significant resource challenges. According to the FAA’s National Plan of Integrated Airport Systems (NPIAS) report for 2021–2025, a substantial portion of existing airports (2000 out of 3304) lack air traffic facilities or full-time personnel to record air traffic data [16]. This disparity between current aircraft noise modeling methodologies and the absence of dependable air traffic data at non-towered GA airports forms the focal point of this study.
The Aviation Environmental Design Tool (AEDT) has been a cornerstone in aviation environmental impact assessment in the U.S., particularly at airports where comprehensive aircraft operation and fleet mix data are readily available [11,12,17]. Researchers have explored strategies for optimizing aircraft departure and arrival procedures to enhance aviation environmental impact assessments, heavily relying on AEDT [18,19,20,21,22,23,24,25,26,27,28,29,30,31]. Notably, Behere et al. [30] pioneered a data-driven approach to refining noise assessments using AEDT and openly accessible surveillance data. Ang and Cui [31] also defined the aircraft noise metrics commonly used to assess environmental impacts.
However, while these environmental assessment tools are invaluable for primary commercial airports with robust air traffic data, a significant challenge arises at the 2000 non-primary airports designated in the National Plan of Integrated Airport Systems (NPIAS). Many of these non-primary airports lack the necessary resources, including funding and full-time personnel, to implement physical acoustic sound meters or utilize airport environmental modeling tools [16,32,33]. Researchers are now driven to explore cost-effective solutions for these airports’ air traffic estimation challenges. Among these solutions, using aircraft transponder data is a practical and feasible method for estimating aircraft noise levels at non-towered airports.
One of the primary hurdles in estimating aircraft noise impact using aircraft transponder data is the requirement for direct air traffic data, encompassing information on aircraft operations and fleet composition. The Automatic Dependent Surveillance-broadcast (ADS-B), a Next-gen communication, navigation, and surveillance (CNS) technology in the United States, plays a pivotal role in this context [34,35]. Recent years have witnessed a growing interest in estimating aircraft operations through analyzing ADS-B messages [36,37,38,39,40,41]. Mott [36] demonstrated the cost-effectiveness of ADS-B messages for estimating operations at non-towered airports. Yang et al. [40] introduced an innovative approach leveraging ICAO identification codes to extract fleet mix data from FAA public databases. Building on these developments, the potential of using ADS-B messages for aircraft noise estimation is evident [39]. Still, further investigation and validation are necessary to realize this technology’s potential.
Considering these considerations, our study introduces an innovative low-cost noise monitoring technology tailored to non-towered general aviation airports. This technology is subjected to a rigorous evaluation using an experimental and analytical approach. Firstly, we estimate aircraft noise impacts based on a three-stage framework developed by Yang and Mott [41]. Secondly, we employ a physical acoustic sound meter to capture the actual aircraft noise levels, and the corresponding noise events are meticulously documented to serve as a reference for evaluation and validation.
Preliminary evaluation results form the basis for a segmentation analysis, allowing for a more nuanced understanding of the proposed technology’s performance. Our study underscores the potential of Automatic Dependent Surveillance-broadcast (ADS-B) messages as a cost-effective and accessible resource for noise modeling solutions to non-towered airports.
As our research unfolds, we will present the outcomes of this study, engage in a thoughtful discussion of the technology’s limitations, and provide recommendations for future research. These insights aim to chart a path for refining and advancing this innovative technology, ensuring its continued relevance and utility in aviation environmental impact assessment.

2. Materials and Methods

The methodology employed in this study is elucidated through the following procedural steps:
  • ADS-B Data Collection and Processing: Initial data acquisition involves collecting and processing Automatic Dependent Surveillance-broadcast (ADS-B) data from aircraft operating at Purdue University Airport (KLAF). These data are subject to processing using heuristics established by Yang and Mott [41]. This step forms the foundation for our aircraft noise impact estimation.
  • Noise Event Documentation: Noise events occurring during the data collection are meticulously recorded. These records serve as crucial reference points for the subsequent analytical procedures, facilitating an in-depth evaluation of the developed noise estimation approach.
  • Ground Truth Data from Gain Express® (sourced from Hongkong, China): Aircraft noise data gathered via the deployment of the Gain Express® acoustic sound meter at KLAF is considered the “ground truth” against which our modeled noise data is benchmarked. This step ensures that the accuracy and reliability of the noise modeling process are rigorously evaluated.
The methodological framework described above forms the basis for our investigation, providing a structured and systematic approach for assessing the feasibility and accuracy of the innovative low-cost noise monitoring technology tailored to the specific needs of non-towered general aviation airports.

2.1. Low-Cost Noise Monitoring Model

2.1.1. Aircraft Trajectory and Fleet Mix Estimation

This stage of the study entails using ADS-B messages to estimate aircraft trajectory and the composition of the fleet mix.
  • Filtering Raw ADS-B Records: Raw ADS-B records are initially subjected to a rigorous filtering process to enhance the accuracy of the trajectory estimation. This filtering is based on a predefined geo-fence, which includes two critical parameters:
    • Altitude: The original ADS-B records are cleaned using altitude criteria in alignment with the traffic pattern altitude suggested by Mott [36]. This ensures that only relevant data are considered for trajectory estimation, enhancing the precision of the analysis.
    • Distance to the Airport: Given that the ADS-B receiver is typically installed within or near the airport, the distance between the aircraft and the receiver is approximated as the distance between the aircraft and the airport. This approximation further refines the dataset, focusing on aircraft near the airport.
  • Utilizing ICAO Aircraft Identification Code: A pivotal element in aircraft noise modeling, the ICAO aircraft identification code is a unique identifier linking aircraft to their registration in the United States [42]. To enrich the analysis, we draw from the innovative data integration procedure developed by Yang et al. [40]. This procedure enables acquiring crucial fleet mix information, encompassing aircraft types, models, and engine specifications, directly from the FAA aircraft registration databases. This integration empowers us to comprehensively understand the aircraft fleet mix, a key component in accurate noise modeling.
This initial stage forms the cornerstone of our methodology, setting the stage for precise trajectory estimation and comprehensive fleet mix analysis [40,43]. By leveraging ADS-B messages and advanced data integration procedures, we ensure that the subsequent stages of our study are built upon a solid foundation of high-quality data.

2.1.2. Aircraft Operation Mode and Thrust Estimation

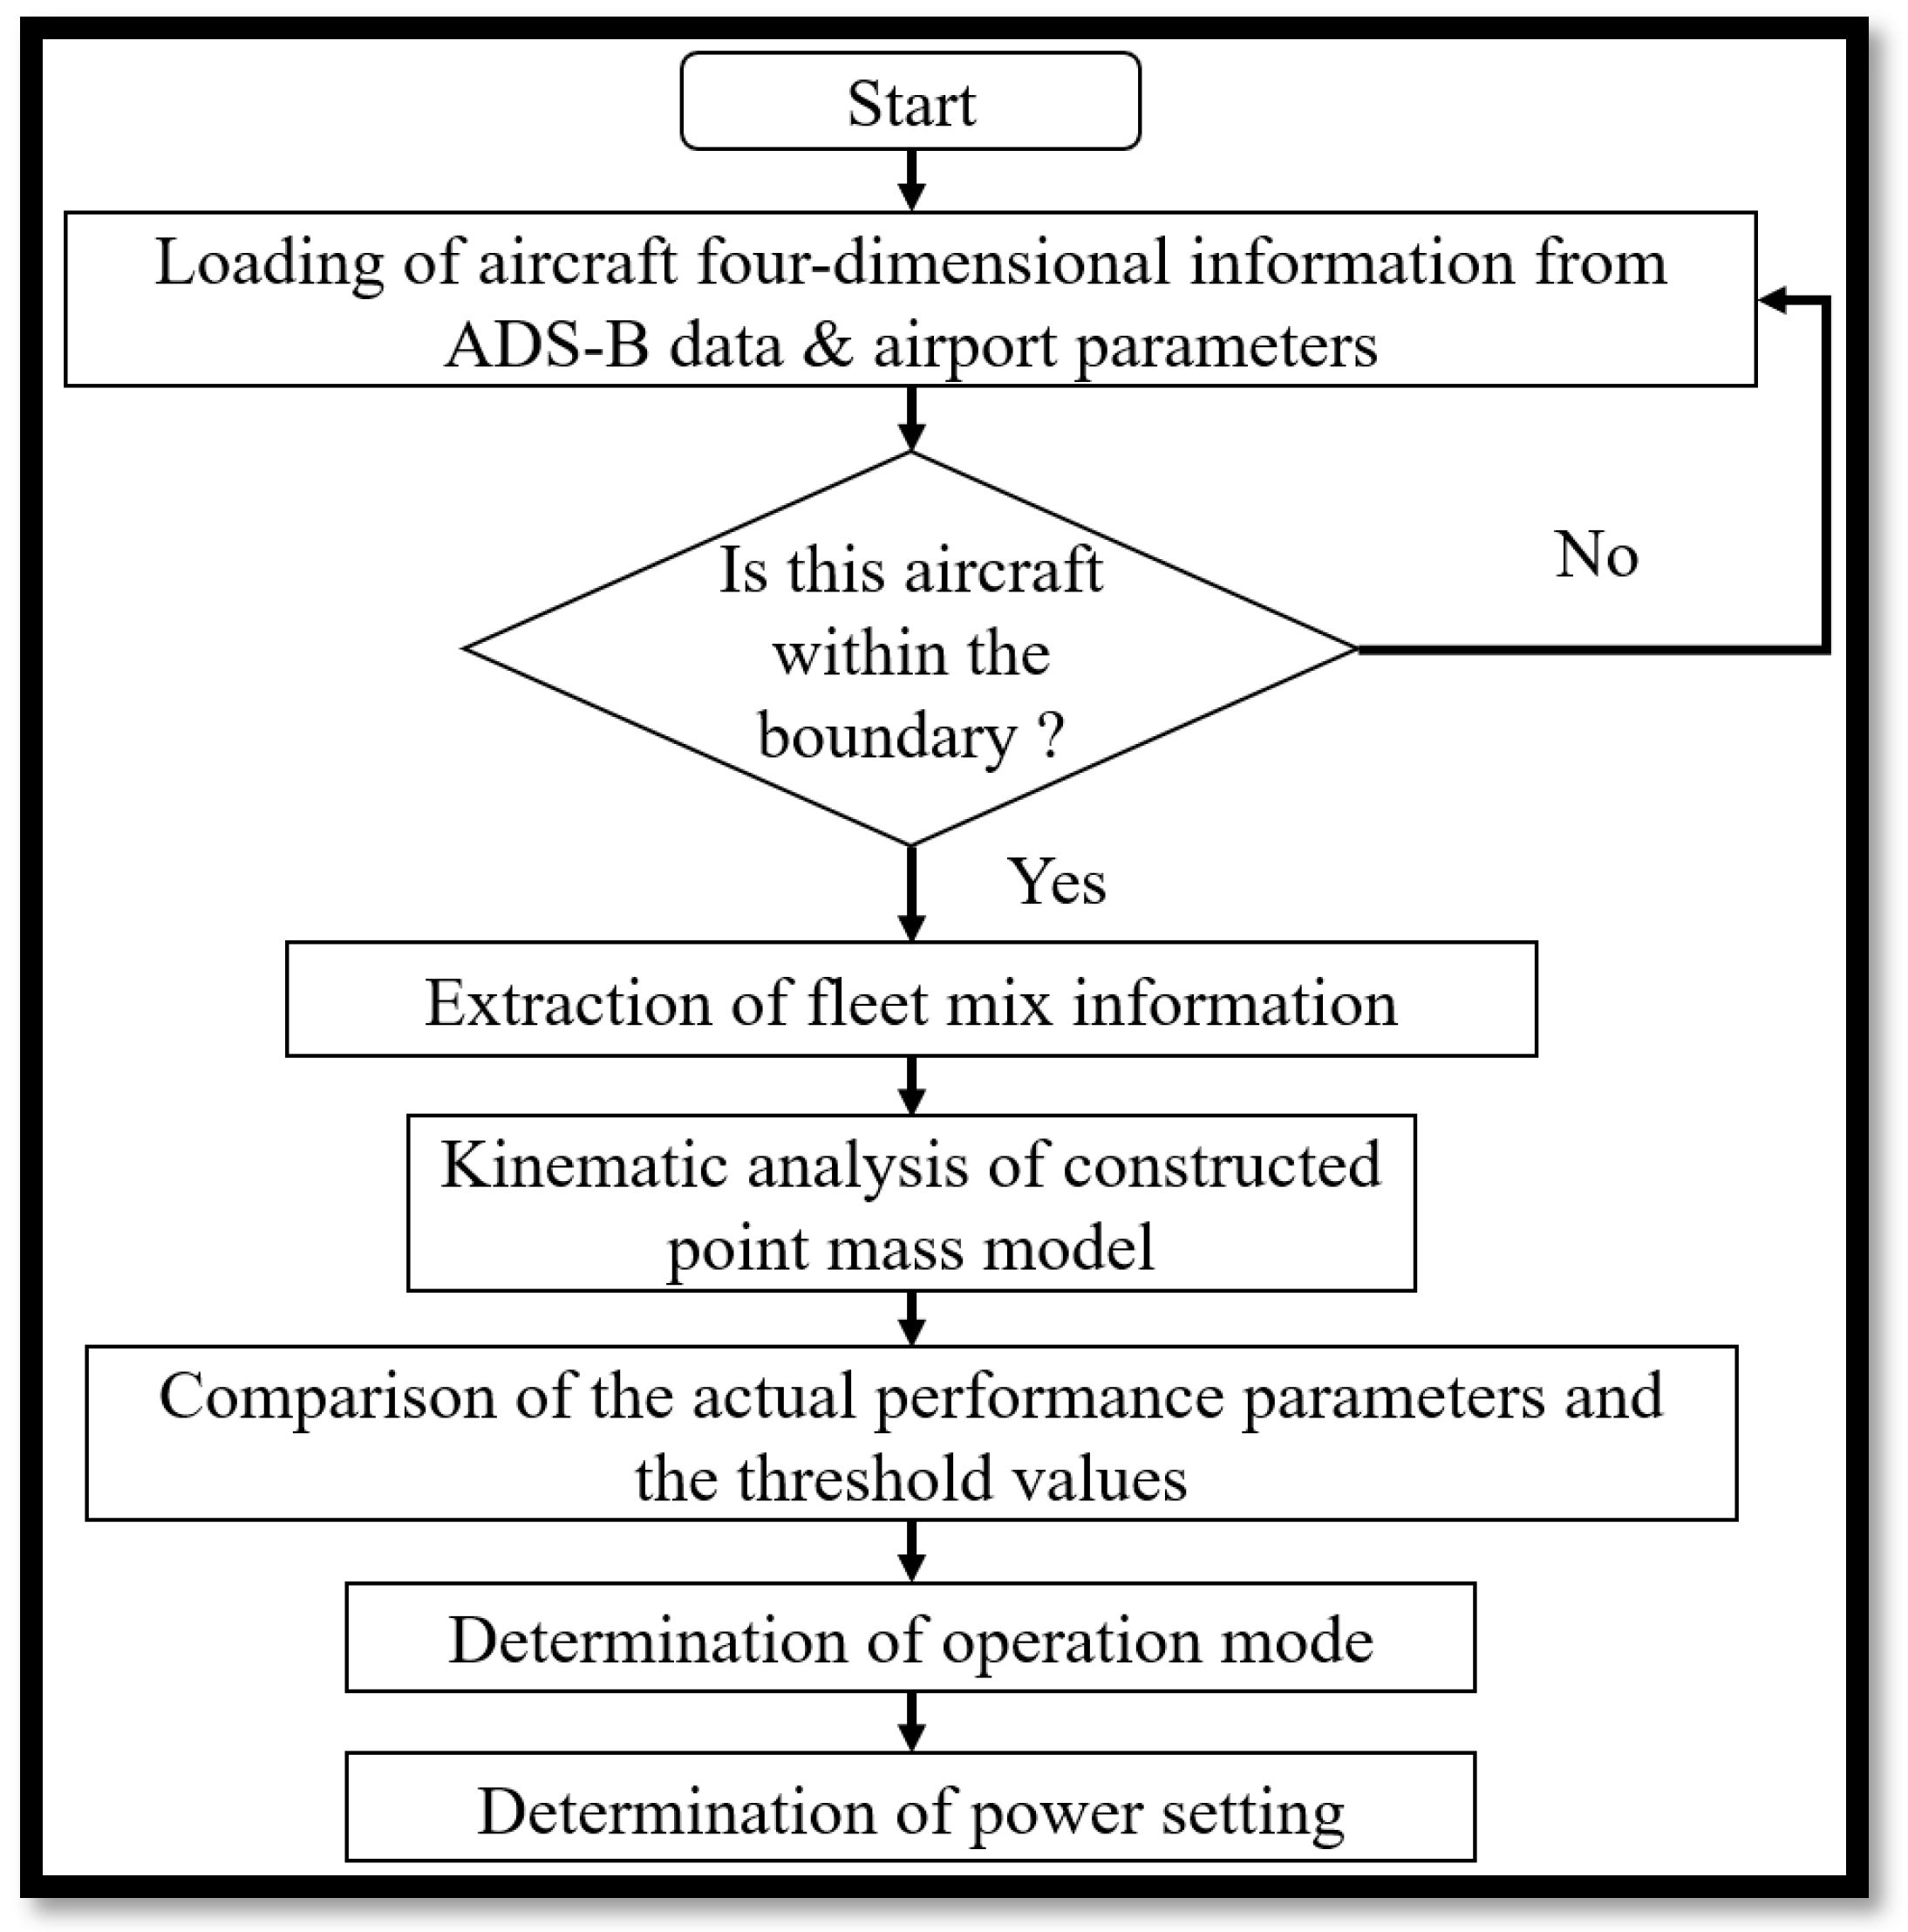
This stage focuses on developing a Point Mass Model (PMM) to facilitate the kinematic analysis of aircraft trajectories derived from Stage 1 (refer to Figure 2) [43]. Given the correlations among noise vs. power vs. distance in the EUROCONTROL NPD curves [44], it is imperative to highlight the critical role of operation mode and thrust (power setting) in this study’s noise metrics computation.
  • Aircraft Performance Parameters and Operation Mode Determination: According to Yang and Mott [43], various aircraft performance parameters, including ground speed, mean acceleration/deceleration, and rate of climb/descent, were derived directly or indirectly from the ADS-B messages. These parameters are instrumental in determining the operation mode of the aircraft, a pivotal aspect in our noise modeling process.
  • Handling Thrust Values: One of the challenges encountered in our approach pertains to thrust (power setting) values. To address this, we assumed the thrust value as the median between two bounded values derived from the determined aircraft operation mode [41,44]. Moreover, it is essential to note that different aircraft may possess distinct units for thrust (power setting) values. For instance, consider the power setting values of a Piper Warrior aircraft in departure mode, bounded between 2150 and 2600 revolutions per minute (RPM). Similarly, the thrust values of a Cessna 172 aircraft in departure mode are between 59.6% and 100% of the maximum static thrust. In this paper, when we identified a sampled aircraft as a Piper Warrior aircraft in departure mode, the corresponding power setting was set at 2375 RPM (the median value between the lower bound of 2150 and the upper bound of 2600 RPM). Similarly, when a sampled aircraft was identified as a Cessna 172 in departure mode, the corresponding thrust (power setting) value was established at 79.8% of the maximum static thrust (the median value between the lower bound of 59.6% and the upper bound of 100% of maximum static thrust). Should a sampled aircraft be identified in cruise mode, we established the corresponding power setting as the median value between the upper bound of the approach and the lower bound of departure modes. The rationale of this assumption is based on the statistical central limit theorem. Since the sample size is larger than 30, the sampling distribution of the means of the power setting for the cruise mode will always be normally distributed. Therefore, a median value between the upper bound of the approach and the lower bound of departure will be statistically reasonable to represent the cruise mode power setting. However, this is one of the limitations of this design, which needs to incorporate onboard flight data recorders (FDRs) to improve prediction in future studies.
This stage ensures that our aircraft noise modeling process is underpinned by a robust and standardized method for handling thrust values, essential for accurate noise metric calculations.

2.1.3. Estimation of Aircraft Noise Levels

Our aircraft noise database draws upon the EUROCONTROL noise-to-power-to-distance (NPD) curves, as employed within the U.S. FAA’s Aviation Environmental Design Tool (AEDT) technical manual [13]. These NPD curves serve as the cornerstone of our noise metric calculations, ensuring accuracy and consistency in our analyses.
In cases necessitating interpolation, we adhered to the upper and lower-bound power settings outlined within the NPD curves [44]. This constraint ensures that the power settings utilized for noise metric calculations remain harmonious with the NPD curves, aligning our computations with established standards. Similarly, our methodology enforced constraints on the slant range, also bounded by the NPD slant range distance values. This bounding of the slant range distance further fortified the precision and reliability of our noise metric computations. In instances requiring extrapolation, we determined the thrust (power setting) values and the slant range distances as the values closest to the derived power and slant range distances, respectively [38]. This approach safeguards the integrity of our noise modeling, even when extrapolation is essential to the analysis. AEDT prescribed a standardized baseline noise metric interpolation and extrapolation equations for our noise metric calculations. These equations, denoted by Equation (3), integrate the thrust (power setting) values and distances sourced from the NPD curves.
L P U , d = L P U , d 1 + ( L P U , d 2 L P U , d 1 ) · ( l o g 10 d l o g 10 d 1 ) ( l o g 10 d 2 l o g 10 d 1 )
L P L , d = L P L , d 1 + ( L P L , d 2 L P L , d 1 ) · ( l o g 10 d l o g 10 d 1 ) ( l o g 10 d 2 l o g 10 d 1 )
The thrust values, represented as PL and PU, encompass the lower and upper bounds as defined by the NPD curves, while d1 and d2 encapsulate the bounded values of the slant range distance from the NPD curves.
As a result, Equation (3) emerges as the bedrock for our baseline noise metrics, synthesizing thrust values and distances in harmony with the NPD curves. This standardized approach underpins the accuracy and consistency of our noise metric computations:
L P , d = L P L , d + ( L P U , d L P L , d ) · ( P P L ) ( P U P L )

2.1.4. Experimental Design

We systematically gather flight information data and noise data from the Purdue University Airport (KLAF). This essential data collection process is integral to the comprehensive analysis of our noise monitoring technology. The Purdue University Airport (KLAF) hosts a diverse array of aircraft, encompassing 85 unique units. This aircraft roster includes 3 helicopters, 2 jet aircraft, 73 single-engine aircraft, and 7 multi-engine aircraft [45,46]. This extensive and varied fleet is an intrinsic component of our data collection, enabling a comprehensive evaluation of our noise monitoring technology.
The richness and diversity of aircraft types at KLAF provide us with valuable insights into the adaptability and robustness of our technology across different aircraft categories, thus contributing to a more encompassing understanding of its utility in real-world aviation scenarios.
As presented in Table 1, the collection of ADS-B messages was meticulously executed using a cost-effective ADS-B receiver and a data-logging device, expertly configured following Mott’s specifications [36]. To decode these messages, we employed open-source software, specifically the dump1090, installed on a Raspberry Pi 3 computer (see Figure 3 [47]. The software-defined radio (SDR) functioned as the receiver, capturing and relaying ADS-B records to the system. This cost-effective USB dongle, coupled with the Raspberry Pi, transformed into a microcomputer-based radio scanner, thereby enabling the reception of real-time radio messages.
Notably, this entire setup, with a total investment cost of approximately USD 170, was strategically installed in Room 225 of the terminal building at KLAF. This setup was the backbone for our data collection efforts, offering a robust and affordable solution for acquiring ADS-B messages essential for our noise modeling.
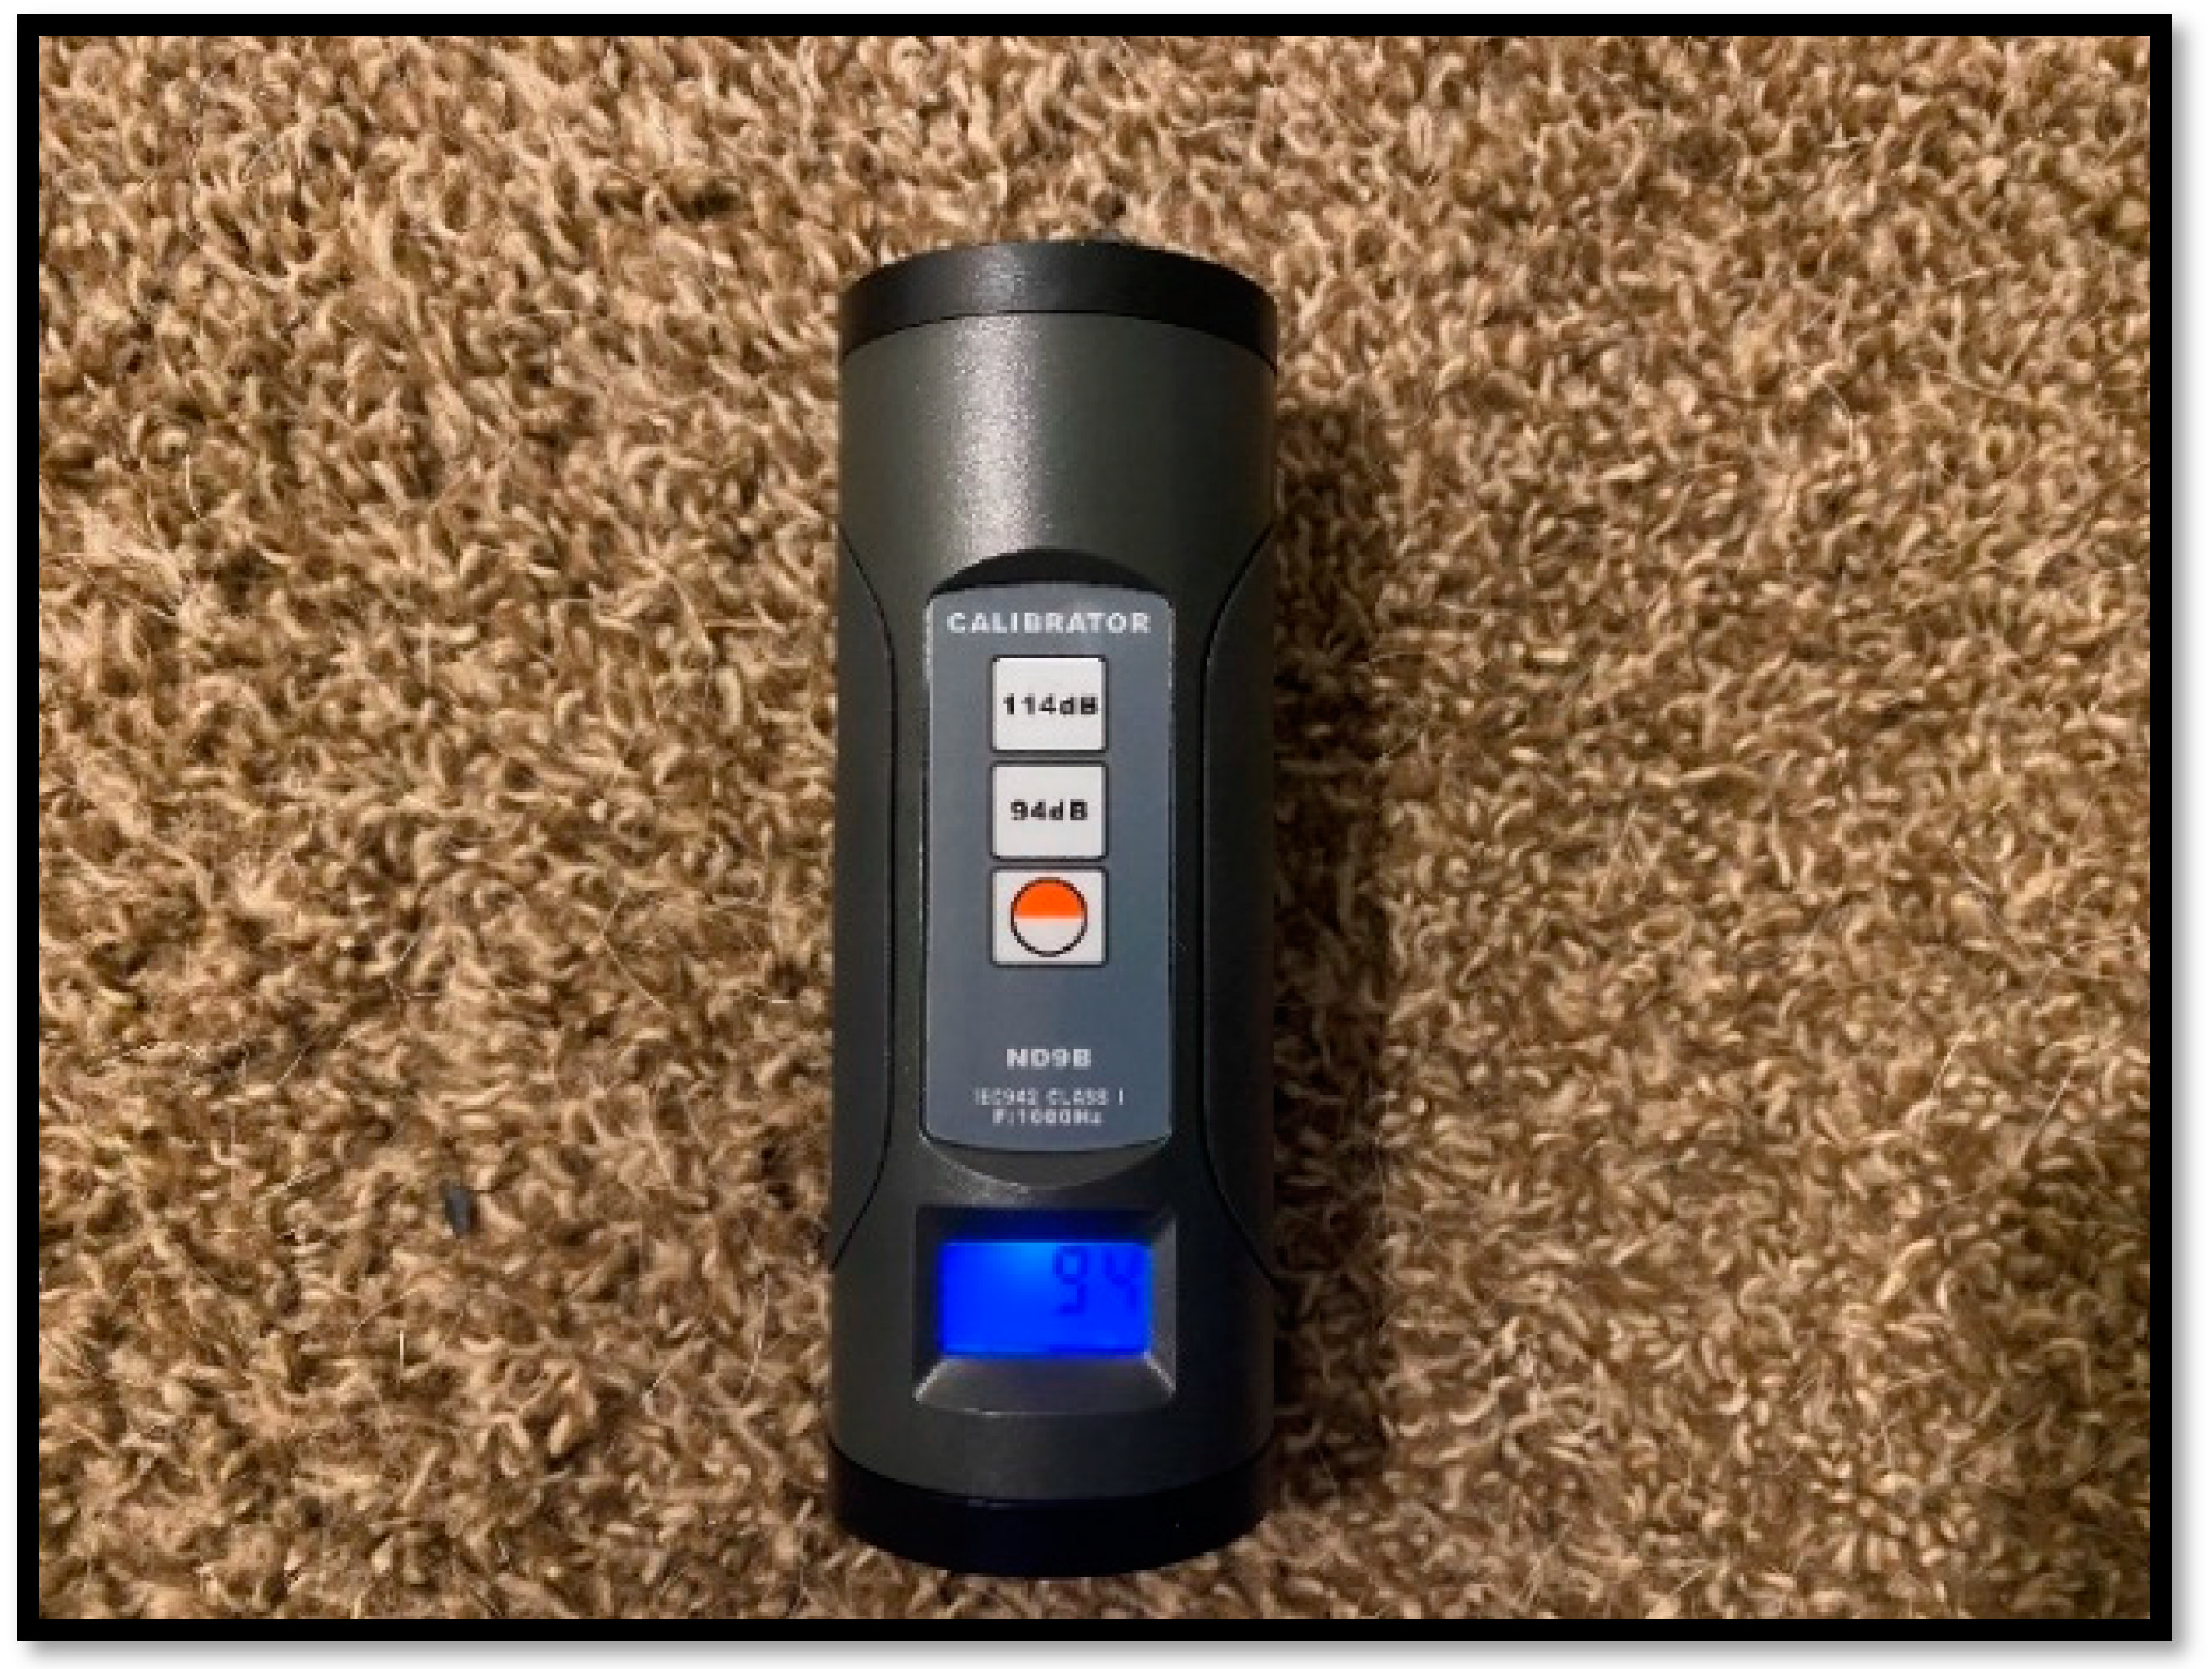
Our noise model’s validation stage involved deploying a Gain Express® acoustic sound meter, specially positioned at KLAF, to capture the ambient aircraft noise (see Figure 3). The used SLM-25 Sound Level Meter (IEC651 Type 2, ANSI SI.4 Type 2) has an accuracy of +1.5 dB (reference sound pressure standard, 94 dB@1 KHz) (Source from Hong Kong, China) [48]. In addition, a calibrator was used for the daily examination and calibration of the acoustic sound meter (See Figure 4). The used DN9B Digital Sound Level Meter Calibrator 94 dB and 114 dB for the used acoustic sound meter has an accuracy of ±0.3 dB (20 °C, 760 mm Hg) and a standard of IEC60942 (IEC942) Class 1 (Sourced from Hong Kong, China) [49]. In addition, the calibrator was also calibrated before it was used to calibrate the sound meter.
In our study, the selection of three distinct locations (see Figure 5) was based on the real-time configuration of Purdue University Airport (KLAF) during the noise data collection period (as delineated in Table 2). Airport configuration varied based on the day of operation. Our ADS-B data collected aircraft departures from Runway 28; however, we did not have the “ground truth” data for this study. Locations A, B, and C are the locations where the research team parked their vehicle and collected aircraft noise in person. Unfortunately, at the end of Runway 28, placing our acoustic sound meter is impractical because of the significant ambient noise from a construction site in the southeast direction (~150 ft) of Runway 28. Each of these locations was strategically chosen to capture the nuances and variations in aircraft noise emissions, contingent on the specific runway used for departures:
  • Location A was used only when the aircraft departed from Runway 23;
  • Location B was used only when the aircraft departed from Runway 05;
  • Location C was used only when the aircraft departed from Runway 10.
Regarding the specific duration of noise measurement, the research team intended to choose an approximately two-hour duration of the day in Table 3, where most aircraft operations would be expected at KLAF, based on weather. For example, the research team measured the noise events at Location A from 14:19 EST (U.S. Eastern Time) to 16:26 EST on 22 July 2021. On 4 August 2021, we measured the noise events at Location B from 10:41 EST to 12:50 EST. In addition, the terrain altitudes of three locations were recorded to assess the slant range distance between the noise receptor and the aircraft in the developed noise estimation model.
Selecting these distinct locations by runway-specific departures ensured that our data collection was sensitive to the dynamic operational conditions at KLAF. This spatial differentiation allowed us to capture the unique noise profiles associated with departures from each runway, enriching our study with a comprehensive understanding of aircraft noise dynamics within the airport’s operational context.

2.1.5. Noise Data Recording and Processing

In this study, our noise sound meter meticulously recorded A-weighted noise levels per second based on Equivalent Continuous Sound Level (LAeq). Each aircraft noise event was further segmented into several mini-events, each spanning a one-second duration to facilitate a meaningful comparison between modeled and measured acoustic noise levels.
The calculation of standardized noise levels, based on the parameters derived from Stage 1 and Stage 2, relied on the Sound Exposure Level (SEL) metric sourced from the EUROCONTROL NPD curves. This metric forms the foundation for our comprehensive analysis of noise data.
The International Organization for Standardization (ISO) established ISO 20906, which provides guidelines for unattended monitoring of aircraft sound near airports [50]. In background noise filtering, ISO 20906 recommends maintaining a 15 dB gap between the Maximum Expected Sound Exposure Level (MESPL) of aircraft noise events and the Average Residual Sound Pressure Level (ARSPL) for noise monitoring and measurement.
Based on the NPD curves from the EUROCONTROL ANP database, the MESPL for GA aircraft, such as the Cessna 172, is established at 84.9 dBA (considering a power setting of 100% maximum static thrust and a slant range distance of 200 ft). Additionally, it is essential to recognize that a minimum Yearly Day–Night Average Sound Level (Ldn) of 65 dB is a crucial threshold used by federal agencies like the FAA to assess compatible land use and planning [50,51]. Therefore, this study applied a 60 dBA threshold as the average residual sound level for filtering background noise from the measured data.
In addition to background filtering, we meticulously recorded various events, including aircraft operations and road traffic, during the physical noise collection stage (see Table 3). This manual recording process furnishes us with invaluable data, aiding in assessing the accuracy and validity of our developed noise monitoring approach.
By scrutinizing the aircraft noise data and cross referencing it with the corresponding operations logs, we derived the duration of each aircraft noise event. This determination was achieved by applying a rigorous filtration process that effectively removed background noise, specifically adhering to the established noise threshold of 60 dBA.
The results revealed that, on average, aircraft noise events from the sampled data at the Purdue University Airport (KLAF) have a duration of approximately 16.8 s. Consequently, based on this empirical evidence, we considered a comprehensive general aviation (GA) aircraft noise event to be approximately 17 s long.
Our analytical approach focused on standardized modeled aircraft noise levels exceeding the 60 dBA threshold. These elevated noise levels were rigorously compared with the acoustic noise data measured on site. Noise levels below this threshold were classified as background noise and were not included in the comparative analysis.
This rigorous analysis and filtering process allowed us to discern and evaluate the precise characteristics of aircraft noise events, ensuring that our assessment was based on comprehensive and representative data.

3. Results

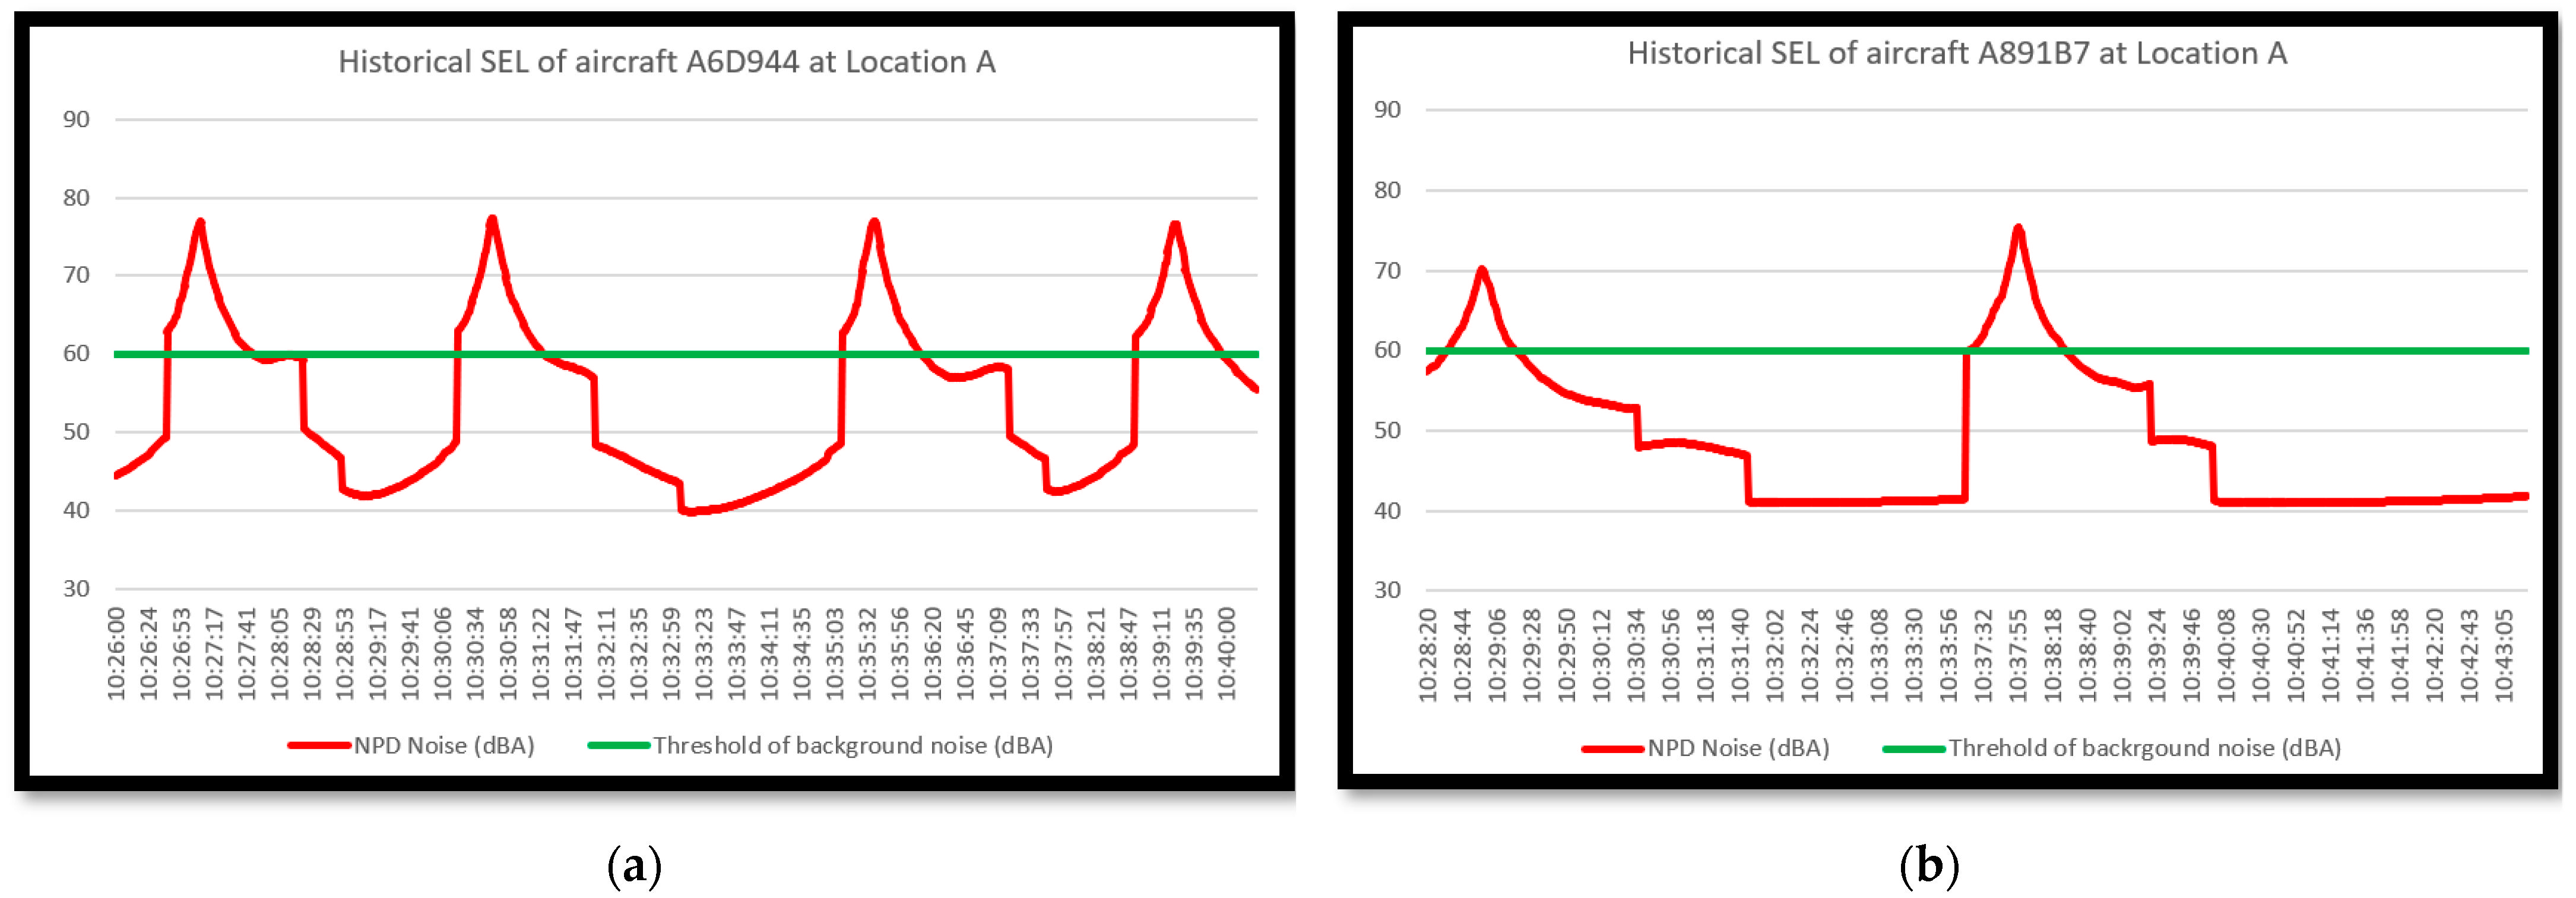
The cumulative noise impacts at selected locations were synthesized by integrating historical single noise levels for each aircraft traversing these points. As an illustrative example, our approach, based on analyzing ADS-B messages, enabled us to identify and track aircraft that passed through Location A at the Purdue University Airport (KLAF) between 10:27:09 and 10:39:20 EST. A6D944 and A891b7 are identified as two different models of piston-engine aircraft [42].
In Figure 6, we present the corresponding graphs illustrating the single-aircraft historical Sound Exposure Levels (SEL) for aircraft with identification codes A6D944 and A891B7 as they flew through Location A. These graphs visually represent the SEL profiles, contributing to our comprehensive analysis.
The culmination of these single-aircraft SEL data points is depicted in Figure 6, where the synthesized historical standardized Sound Exposure Levels (SEL) are systematically presented. This synthesis facilitates a holistic understanding of the cumulative noise impacts at the selected locations, providing detailed insight into the overall acoustic environment at these specific points.
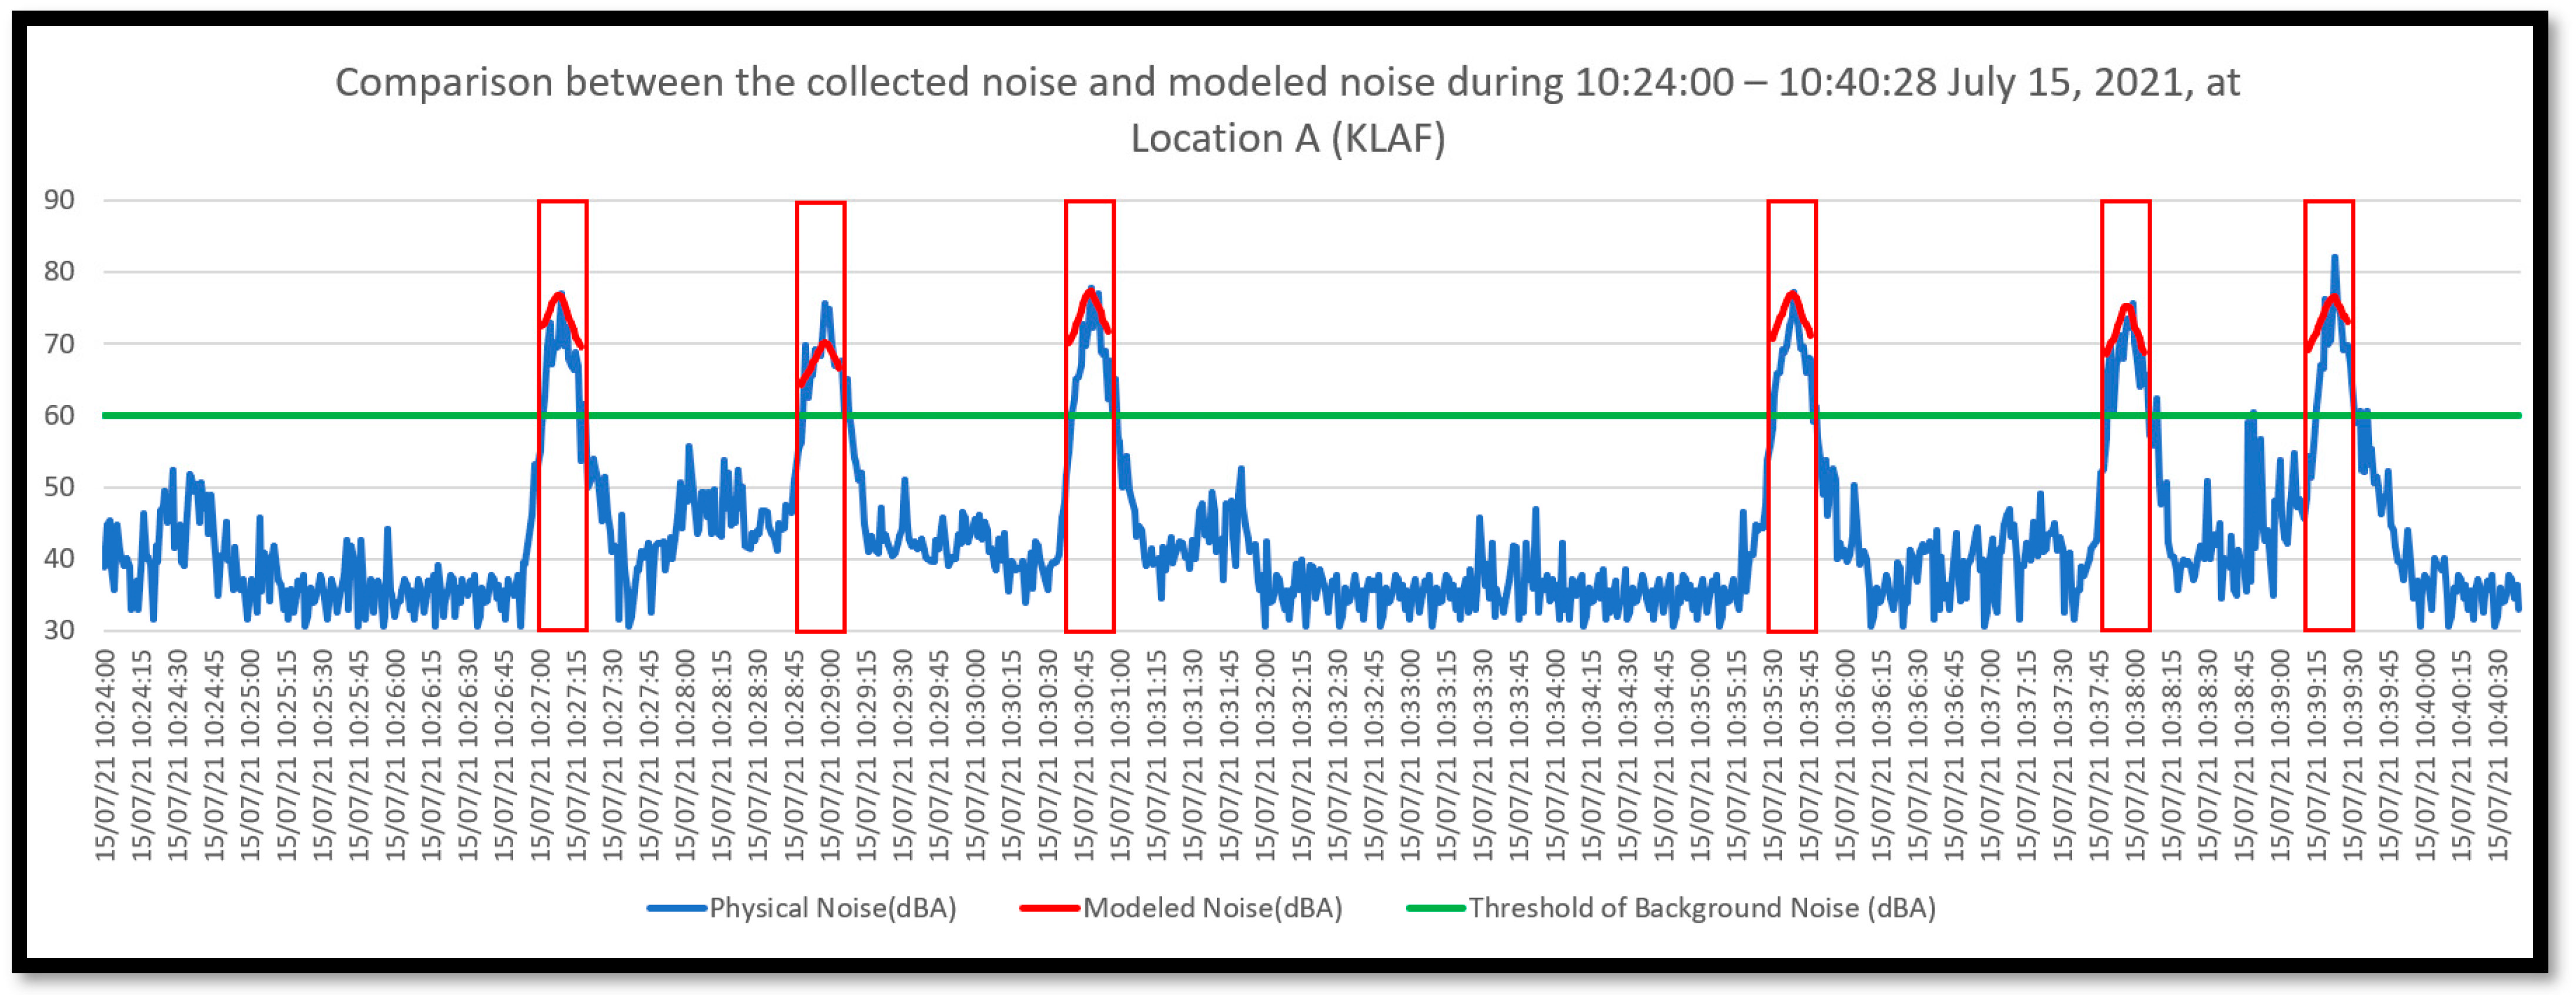
Figure 7 presents six noise events that were successfully identified during the 10:24:00 to 10:40:28 EST 15 July 2021, at Location A. Six framed curves represent the segmented comparison between measured noise levels and estimated noise levels. Table 4 compares the measured and modeled noise during the peak time. We can identify that the red curve (estimated noise levels) is flatter than the blue curve (measured actual noise level), which indicates the measured actual aircraft noise attenuation is more significant than our estimation. This might be explained by the lack of various attenuation adjustments in our prototype design [13]. The mean of raw average error is 4.5 dBA, ranging from 0.0 dBA to 6.1 dBA, while the average of the absolute error is 5.2 dBA with a range of 2.5 to 6.7 dBA.
While comparing the modeled and physical noise levels at Location A, the authors noticed that the standardized noise curves were flatter than those of physical noise levels. The noise event, therefore, is divided into three stages with equal durations:
  • Start stage: it contains the first five-second duration of the event;
  • Peak stage: it presents the time (±three seconds) when the slant range distance (SLR) between the noise receptor and the aircraft is minimal;
  • End stage: it contains the last five-second duration of the event.
The comparison between the measured and modeled noise during the peak stage is presented in Table 5. The mean of the raw error is 2.7 dBA, ranging from −1.14 to 4.7 dBA, while the mean of the absolute error is 3.8 dBA with a range of 1.9 to 4.8 dBA. The error during the peak stage indicated that the developed approach could correctly identify aircraft noise events with an average error of 5 dBA.
The overall error in the start stage is significantly higher than those in the peak stage. The raw average error ranges from 2.7 to 13.6 dBA, while the mean of average absolute error is 8.1 dBA with a range of 4.4 to 13.6 dBA (Table 6). The research team found that the terrain altitude at Location A is lower than that of Runway 05 at KLAF. The actual noise propagation is significantly affected when the aircraft is taxiing and taking off from the northeastern to the southwestern direction of Runway 05. Therefore, a reasonable explanation is that the noise estimation model does not apply an adjustment for the line-of-sight blockage effect [12].
Table 7 presents the comparison results in the end stage at Location A. The mean of the raw error is 3.6 dBA, which is between the start stage (7.8 dBA) and peak stage (2.8 dBA). Although the effect of engine installation for a propeller-driven aircraft is zero, we should not ignore the overall lateral attenuation effect [12]. Therefore, a lateral attenuation adjustment for sound propagation should be included in future studies.
Similarly, the comparisons between the sampled noise predictions and measured noise level at Locations B and C are presented in Table 8 and Table 9. Similar to Location A, the pre-defined three-stage noise errors at Location B and C are computed, respectively. The mean of absolute errors at Locations B and C is 4.3 dBA and 4.6 dBA, respectively. Regarding the segmentation analysis at different locations, the greatest mean of absolute errors (6.2 dBA) at Location B is identified during the peak stage, while the third stage (the last five seconds) has the greatest mean of absolute errors of 5.3 dBA at Location C.
Remarkably, the EUROCONTROL ANP database does not contain all types of aircraft/engine noise data, which led to several aircraft operations that could not be modeled in this case. For example, the NPD dataset did not identify Cessna 152, CIRRUS SR 20, and Piper Cherokee [44].

4. Discussion

Our study builds upon the existing body of research that has explored the estimation of airport operations using ADS-B messages. To enhance the precision and optimization of aircraft trajectory approximation, we identify several avenues for potential future research and improvement.

4.1. Model Accuracy

According to 14 CFR (Code of Federal Regulations) Part 150 Airport Noise Compatibility Planning Appendix A, it specifies the Noise Exposure Map Development must contain and identify three noise contours resulting from aircraft operations, with an interval of 5 dB (65, 70, 75). In addition, the different land use compatibilities are classified by 5 dB [52,53]. This study aims to offer airport managers/operators, local and federal agencies, and other stakeholders a better understanding of the noise impact and facilitate the development of land use compatibility near non-towered airports. A more recent study by Giladi and Menachi [54] used AEDT at Heathrow Airport to conduct a case study. It yielded a variation of less than 2 dBA for landings and a variation reaching 10 dBA for takeoffs, respectively. Given that our developed model does not incorporate several adjustments per AEDT [12] but yields an average error of less than 5 dBA, it is expected to be a promising tool for noise prediction at non-towered airports with adjustment applications.

4.2. Optimizing Aircraft Configuration and Performance Approximation

One of the limitations of our developed noise modeling approach pertains to the estimation of engine thrust (power setting). Our study assumed a median value based on the bounded values derived from aircraft operation modes using EUROCONTROL NPD curves. Also, the aircraft configuration and performances are different during touch and go compared to departure and arrival operations. A prospective area for improvement lies in leveraging artificial intelligence techniques, particularly Convolutional Neural Networks (CNNs), to accurately determine aircraft operation modes and their corresponding thrust values. Deep learning techniques could come into play when data collection expands to include multiple airports, and Garmin G1000® flight performance records are used as “ground truth” information.

4.3. Human Perception of Aircraft Noise

Our study primarily evaluates the accuracy of our low-cost noise monitoring approach. We recommend implementing a pilot study to delve into the human perceptions of aircraft noise, gaining insights into how it impacts residents physically and psychologically. By examining the consistency between these psychological and physical studies, we can offer a more holistic understanding of the consequences of aircraft noise on communities.

4.4. Facilitating Decision Making with Contour Maps

In noise management and planning, we suggest the creation of contour maps that incorporate the FAA’s Day–Night Average Sound Levels (DNLs). These maps can be invaluable tools for airports and aviation stakeholders, aiding decision-making processes related to noise abatement procedures and land use compatibility planning.
In summary, our study lays the groundwork for various avenues of future research to refine and expand the capabilities of low-cost noise monitoring and aircraft trajectory approximation. These advancements are critical as we continue to address the complex and multifaceted challenges of aircraft noise control and mitigation.

5. Conclusions

This study validated a novel, low-cost noise monitoring technology solution for airports lacking reliable air traffic data. Our investigation has unveiled an innovative three-stage framework, building upon the work of Yang & Mott [40], which demonstrates promising capabilities in addressing the pressing need for accessible and affordable noise monitoring tools. Central to our approach was utilizing an affordable Automatic Dependent Surveillance-broadcast (ADS-B) receiver with a 1090 MHz antenna deployed at the Purdue University Airport (ICAO Code: KLAF). This receiver effectively harnessed our developed framework to estimate aircraft operations and model aircraft noise levels, offering a cost-effective avenue for noise data acquisition. The modeled aircraft noise levels were compared with these empirical acoustic measurements. This analysis demonstrated the framework’s ability to identify aircraft noise events with an average error of 4.5 dBA. Our study underscores the potential of the developed framework as an affordable and accessible solution for noise modeling, particularly beneficial for non-towered general aviation (GA) airports. This paves the way for equitable access to essential noise monitoring capabilities in diverse airport settings. While our findings are promising, we acknowledge the variations and limitations encountered during our investigation. These considerations provide fertile ground for future studies and enhancements in noise monitoring. As the aviation industry continues to evolve, our work offers a valuable contribution towards sustainable and harmonious airport–community coexistence, and we anticipate a fruitful path of development in aircraft noise monitoring and assessment technology.

Author Contributions

Conceptualization, C.Y.; methodology, C.Y. and J.H.M.; validation, C.Y.; formal analysis, C.Y.; investigation, C.Y.; resources, C.Y. and J.H.M.; data curation, C.Y.; writing—original draft preparation, C.Y.; writing—review and editing, C.Y. and J.H.M.; visualization, C.Y.; supervision, J.H.M.; project administration, J.H.M.; funding acquisition, C.Y. and J.H.M. All authors have read and agreed to the published version of the manuscript.

Funding

This research was partially funded by Old Dominion University Research Foundation (16100119).

Data Availability Statement

The data presented in this study are available on request from the corresponding author. Data are not available due to the organizational policy.

Acknowledgments

This project was supported by the Purdue University Airport Manager Adam Baxmeyer.

Conflicts of Interest

The authors declare no conflicts of interest.

Abbreviations

List of abbreviations and terminologies.
NameExplanationNameExplanation
ACRPAirport Cooperative Research ProgramIASIndicated Airspeed
ADS-BAutomatic Dependent Surveillance-BroadcastICAOInternational Civil Aviation Organization
AEDTAviation Environmental Design ToolISOInternational Organization for Standardization
AEMArea Equivalent MethodKHUFTerre Haute Regional Airport, USA
AGLAbove Ground LevelKLAFPurdue University Airport, USA
AIPAirport Improvement ProgramKTYQIndianapolis Executive Airport, USA
ANPAircraft Noise and Performance DatabaseMSLMean Sea Level
CASCalibrated AirspeedNPDNoise-to-Power-to-Distance curve
CPAClosest Point of ApproachROCRate of Climb
dBADecibel in A-weightedRODRate of Descent
DNLDay–Night Average Sound LevelRPMRevolutions Per Minute
DOTDepartment of Transportation (USA)SAESociety of Automotive Engineer
FAAFederal Aviation Administration (USA)SLRSlant Range Distance
GAGeneral AviationTASTrue Airspeed
GPSGlobal Positioning SystemTAGTouch and Go

References

  1. Air Transport Action Group. Social and Economic Benefits of Aviation. Available online: https://www.atag.org/our-activities/social-and-economic-benefits-of-aviation.html (accessed on 21 July 2022).
  2. Basner, M.; Clark, C.; Hansell, A.; Hileman, J.I.; Janssen, S.; Shepherd, K.; Sparrow, V. Aviation noise impacts: State of the science. Noise Health 2017, 19, 41. [Google Scholar] [PubMed]
  3. Federal Aviation Administration. Community Response to Noise. Available online: https://www.faa.gov/regulations_policies/policy_guidance/noise/community/ (accessed on 1 June 2022).
  4. Civil Aviation Authority. Noise Considerations at General Aviation (GA) Aerodromes. Available online: https://publicapps.caa.co.uk/docs/33/NoiseConsiderationsAtGAAerodromesFINAL.pdf (accessed on 25 January 2024).
  5. Harris, A.S. Noise Abatement at General Aviation Airports. Noise Control Eng. 1978, 10, 80–84. Available online: https://www.ingentaconnect.com/contentone/ince/nce/1978/00000010/00000002/art00005?crawler=true&mimetype=application/pdf (accessed on 1 February 2024). [CrossRef]
  6. Schomer, P.D. A survey of community attitudes towards noise near a general aviation airport. J. Acoust. Soc. Am. 1983, 74, 1773–1781. [Google Scholar] [CrossRef] [PubMed]
  7. Friedt, F.L.; Cohen, J.P. Perception vs. reality: The aviation noise complaint effect on home prices. Transp. Res. Part D Transp. Environ. 2021, 100, 103011. [Google Scholar] [CrossRef]
  8. Schomer, P.D. Noise monitoring in the vicinity of general aviation airports. J. Acoust. Soc. Am. 1983, 74, 1764–1772. [Google Scholar] [CrossRef]
  9. Federal Aviation Administration. Aviation Noise. Available online: https://www.faa.gov/regulations_policies/policy_guidance/noise/ (accessed on 23 May 2022).
  10. International Civil Aviation Organization. Balanced Approach to Aircraft Noise Management. Available online: https://www.icao.int/environmental-protection/Pages/noise.aspx (accessed on 15 July 2022).
  11. Roof, C.J. The Aviation Environmental Design Tool (AEDT). 2015. Available online: https://rosap.ntl.bts.gov/view/dot/12347 (accessed on 12 April 2023).
  12. Lee, C.; Thrasher, T.; Boeker, E.R.; Downs, R.S.; Gorshkov, S.; Hansen, A.J.; Hwang, S.; Koopmann, J.; Malwitz, A.; Noel, G.J. AEDT Version 3c [Technical Manual]; Department of Transportation, Federal Aviation Administration: Washington, DC, USA, 2020. [CrossRef]
  13. Lopes, L.; Burley, C. ANOPP2 User’s Manual: Version 1.2. 2016. Available online: https://ntrs.nasa.gov/api/citations/20160014858/downloads/20160014858.pdf (accessed on 22 March 2021).
  14. Federal Aviation Administration. National Plan of Integrated Airport Systems, 2019–2023, Report to Congress. Available online: https://www.faa.gov/airports/planning_capacity/npias/current/historical/media/2019/NPIAS-Report-2019-2023-Narrative.pdf (accessed on 12 June 2022).
  15. Yang, C. A Low-Cost Technology to Assess Aircraft Noise at Non-Towered General Aviation Airports. Ph.D. Thesis, Purdue University, West Lafayette, IN, USA, 2022. [Google Scholar]
  16. Federal Aviation Administration. Air Traffic by the Numbers. Available online: https://www.faa.gov/air_traffic/by_the_numbers/media/Air_Traffic_by_the_Numbers_2020.pdf (accessed on 23 July 2022).
  17. Lim, D.; Behere, A.; Jin, Y.-C.D.; Li, Y.; Kirby, M.; Gao, Z.; Mavris, D.N. Improved noise abatement departure procedure modeling for aviation environmental impact assessment. In Proceedings of the AIAA Scitech 2020 Forum, Orlando, FL, USA, 6–10 January 2020; p. 1730. [Google Scholar] [CrossRef]
  18. ECAC Doc 29. Report on Standard Method of Computing Noise Contours around Civil Airports, Fourth Edition. 2016. Available online: https://www.ecac-ceac.org/images/documents/ECAC-Doc_29_4th_edition_Dec_2016_Volume_3_Part_1.pdf (accessed on 27 January 2024).
  19. Behere, A.; Lim, D.; Kirby, M.; Mavris, D.N. Alternate Departure Procedures for Takeoff Noise Mitigation at Atlanta Hartsfield-Jackson International Airport. In Proceedings of the AIAA Scitech 2019 Forum, San Diego, CA, USA, 7–11 January 2019; p. 2090. [Google Scholar] [CrossRef]
  20. Behere, A.; Isakson, L.; Puranik, T.G.; Li, Y.; Kirby, M.; Mavris, D. Aircraft landing and takeoff operations clustering for efficient environmental impact assessment. In Proceedings of the AIAA Aviation 2020 Forum, Virtual, 15–19 June 2020; p. 2583. [Google Scholar] [CrossRef]
  21. Behere, A.; Lim, D.; Li, Y.; Jin, Y.-C.D.; Gao, Z.; Kirby, M.; Mavris, D.N. Sensitivity Analysis of Airport level Environmental Impacts to Aircraft thrust, weight, and departure procedures. In Proceedings of the AIAA Scitech 2020 Forum, Orlando, FL, USA, 6–10 January 2020; p. 1731. [Google Scholar] [CrossRef]
  22. Gao, Z.; Behere, A.; Li, Y.; Lim, D.; Kirby, M.; Mavris, D.N. Development and analysis of improved departure modeling for aviation environmental impact assessment. J. Aircr. 2021, 58, 847–857. [Google Scholar] [CrossRef]
  23. Geissbuhler, M.; Behere, A.; Rajaram, D.; Kirby, M.; Mavris, D.N. Improving airport-level noise modeling by accounting for aircraft configuration-related noise at arrival. In Proceedings of the AIAA SCITECH 2022 Forum, San Diego, CA, USA, 3–7 January 2022; p. 1650. [Google Scholar] [CrossRef]
  24. Behere, A.; Puranik, T.; Kirby, M.; Mavris, D. Parametric optimization of aircraft arrival trajectories for aviation noise mitigation using BADA4 performance model. In Proceedings of the INTER-NOISE and NOISE-CON Congress and Conference Proceedings, Washington, DC, USA, 1–5 August 2021; pp. 4641–4651. [Google Scholar] [CrossRef]
  25. Behere, A.; Mavris, D.N. Optimization of takeoff departure procedures for airport noise mitigation. Transp. Res. Rec. 2021, 2675, 81–92. [Google Scholar] [CrossRef]
  26. Behere, A.; Rajaram, D.; Puranik, T.G.; Kirby, M.; Mavris, D.N. Reduced order modeling methods for aviation noise estimation. Sustainability 2021, 13, 1120. [Google Scholar] [CrossRef]
  27. Behere, A.; Kirby, M.; Mavris, D.N. Relative Importance of Parameters in Departure Procedure Design for LTO Noise, Emission, and Fuel Burn Minimization. In Proceedings of the AIAA AVIATION 2022 Forum, Chicago, IL, USA, 27 June–1 July 2022; p. 3916. [Google Scholar] [CrossRef]
  28. Peng, H.; Bhanpato, J.; Behere, A.; Mavris, D.N. A Rapid Surrogate Model for Estimating Aviation Noise Impact across Various Departure Profiles and Operating Conditions. Aerospace 2023, 10, 627. [Google Scholar] [CrossRef]
  29. Gao, Z.; Kampezidou, S.I.; Behere, A.; Puranik, T.G.; Rajaram, D.; Mavris, D.N. Multi-level aircraft feature representation and selection for aviation environmental impact analysis. Transp. Res. Part C Emerg. Technol. 2022, 143, 103824. [Google Scholar] [CrossRef]
  30. Behere, A.; Bhanpato, J.; Puranik, T.G.; Kirby, M.; Mavris, D.N. Data-driven approach to environmental impact assessment of real-world operations. In Proceedings of the AIAA Scitech 2021 Forum, Virtual, 11–15 January 2021; Virtual, 19–21 January 2021. p. 8. [Google Scholar]
  31. Ang, L.Y.L.; Cui, F. Remote work: Aircraft noise implications, prediction, and management in the built environment. Appl. Acoust. 2022, 198, 108978. [Google Scholar] [CrossRef] [PubMed]
  32. Filippone, A. Aircraft noise prediction. Prog. Aerosp. Sci. 2014, 68, 27–63. [Google Scholar] [CrossRef]
  33. Muia, M.J.; Johnson, M.E. Evaluating Methods for Counting Aircraft Operations at Non-Towered Airports. 2015. Available online: https://nap.nationalacademies.org/download/22182 (accessed on 21 October 2020).
  34. Federal Aviation Administration. Automatic Dependent Surveillance-Broadcast (ADS-B). Available online: https://www.faa.gov/nextgen/programs/adsb/ (accessed on 3 May 2021).
  35. Federal Aviation Administration. Current Equipage Levels. Available online: https://www.faa.gov/nextgen/equipadsb/installation/current_equipage_levels/ (accessed on 1 June 2023).
  36. Mott, J.H. Measurement of airport operations using a low-cost transponder data system. J. Air Transp. 2018, 26, 147–156. [Google Scholar] [CrossRef]
  37. Yang, C.; Mott, J.H.; Hardin, B.; Zehr, S.; Bullock, D.M. Technology assessment to improve operations counts at non-towered airports. Transp. Res. Rec. 2019, 2673, 44–50. [Google Scholar] [CrossRef]
  38. Mott, J.H.; Yang, C.; Bullock, D.M. Atmospheric pressure calibration to improve accuracy of transponder-based aircraft operations counting technology. J. Aviat. Technol. Eng. 2020, 9, 35. [Google Scholar] [CrossRef]
  39. Yang, C.; Marshall, Z.A.; Mott, J.H. A novel platform design for aircraft noise impact assessment. In Proceedings of the 2021 Systems and Information Engineering Design Symposium (SIEDS), Charlottesville, VA, USA, 29–30 April 2021; pp. 1–6. [Google Scholar] [CrossRef]
  40. Yang, C.; Mott, J.; Bullock, D.M. Leveraging aircraft transponder signals for measuring aircraft fleet mix at non-towered airports. Int. J. Aviat. Aeronaut. Aerosp. 2021, 8, 1. [Google Scholar] [CrossRef]
  41. Yang, C.; Mott, J.H. Developing a Cost-Effective Assessment Method for Noise Impacts at Non-Towered Airports: A Case Study at Purdue University. Transp. Res. Rec. 2022, 2676, 786–797. [Google Scholar] [CrossRef]
  42. Federal Aviation Administration. Aircraft Registration: Releasable Aircraft Database Download. Available online: https://www.faa.gov/licenses_certificates/aircraft_certification/aircraft_registry/releasable_aircraft_download/ (accessed on 1 May 2022).
  43. Yang, C.; Mott, J.H. Using transponder signals to model aircraft performance at non-towered airports. In Proceedings of the 2021 IEEE Aerospace Conference (50100), Big Sky, MT, USA, 6–13 March 2021; pp. 1–8. [Google Scholar] [CrossRef]
  44. EUROCONTROL. Aircraft Noise and Performance Database. Available online: https://www.easa.europa.eu/en/domains/environment/policy-support-and-research/aircraft-noise-and-performance-anp-data/anp-legacy-data (accessed on 12 June 2022).
  45. Federal Aviation Administration. Airport Facilities Data. Available online: https://adip.faa.gov/agis/public/#/airportSearch/advanced (accessed on 2 June 2022).
  46. Federal Aviation Administration. Aeronautical Information Services. Available online: https://nfdc.faa.gov/nfdcApps/services/ajv5/airportDisplay.jsp?airportId=KLAF (accessed on 10 July 2022).
  47. Sanfilippo, S. Dump1090. Available online: https://github.com/antirez/dump1090 (accessed on 26 May 2018).
  48. SLM-25 Sound Level Meter with Backlit Display High Accuracy Measuring 30 dB~130 dB with Data Logging Function Instrument Compact Professional. Available online: https://www.gainexpress.com/products/slm-25 (accessed on 4 February 2021).
  49. ND9B Digital Sound Level Meter Calibrator 94dB & 114dB for 1/2” and 1” inch Microphone, Professional Noise Decibel Calibration Tool Accuracy Check with Backlight. Available online: https://www.gainexpress.com/products/nd9b (accessed on 17 February 2021).
  50. ISO 20906:2009; Acoustics—Unattended Monitoring of Aircraft Sound in the Vicinity of Airports. International Organization for Standardization: Geneva, Switzerland, 2009. Available online: https://www.iso.org/standard/35580.html#:~:text=ISO%2020906%3A2009%20specifies%3A%20a,pressure%20levels%20of%20aircraft%20sound (accessed on 7 December 2021).
  51. Federal Aviation Administration. Land Use Compatibility and Airports, a Guide for Effective Land Use Planning. Available online: https://www.faa.gov/about/office_org/headquarters_offices/apl/noise_emissions/planning_toolkit/ (accessed on 12 May 2022).
  52. 14 C.F.R. Sec. A150.101. Available online: https://www.ecfr.gov/current/title-14/chapter-I/subchapter-I/part-150 (accessed on 3 February 2024).
  53. 14 C.F.R. Sec. A161. Available online: https://www.ecfr.gov/current/title-14/chapter-I/subchapter-I/part-161 (accessed on 10 February 2024).
  54. Giladi, R.; Menachi, E. Validating aircraft noise models: Aviation environmental design tool at Heathrow. J. Air Transp. Manag. 2024, 116, 102557. [Google Scholar] [CrossRef]
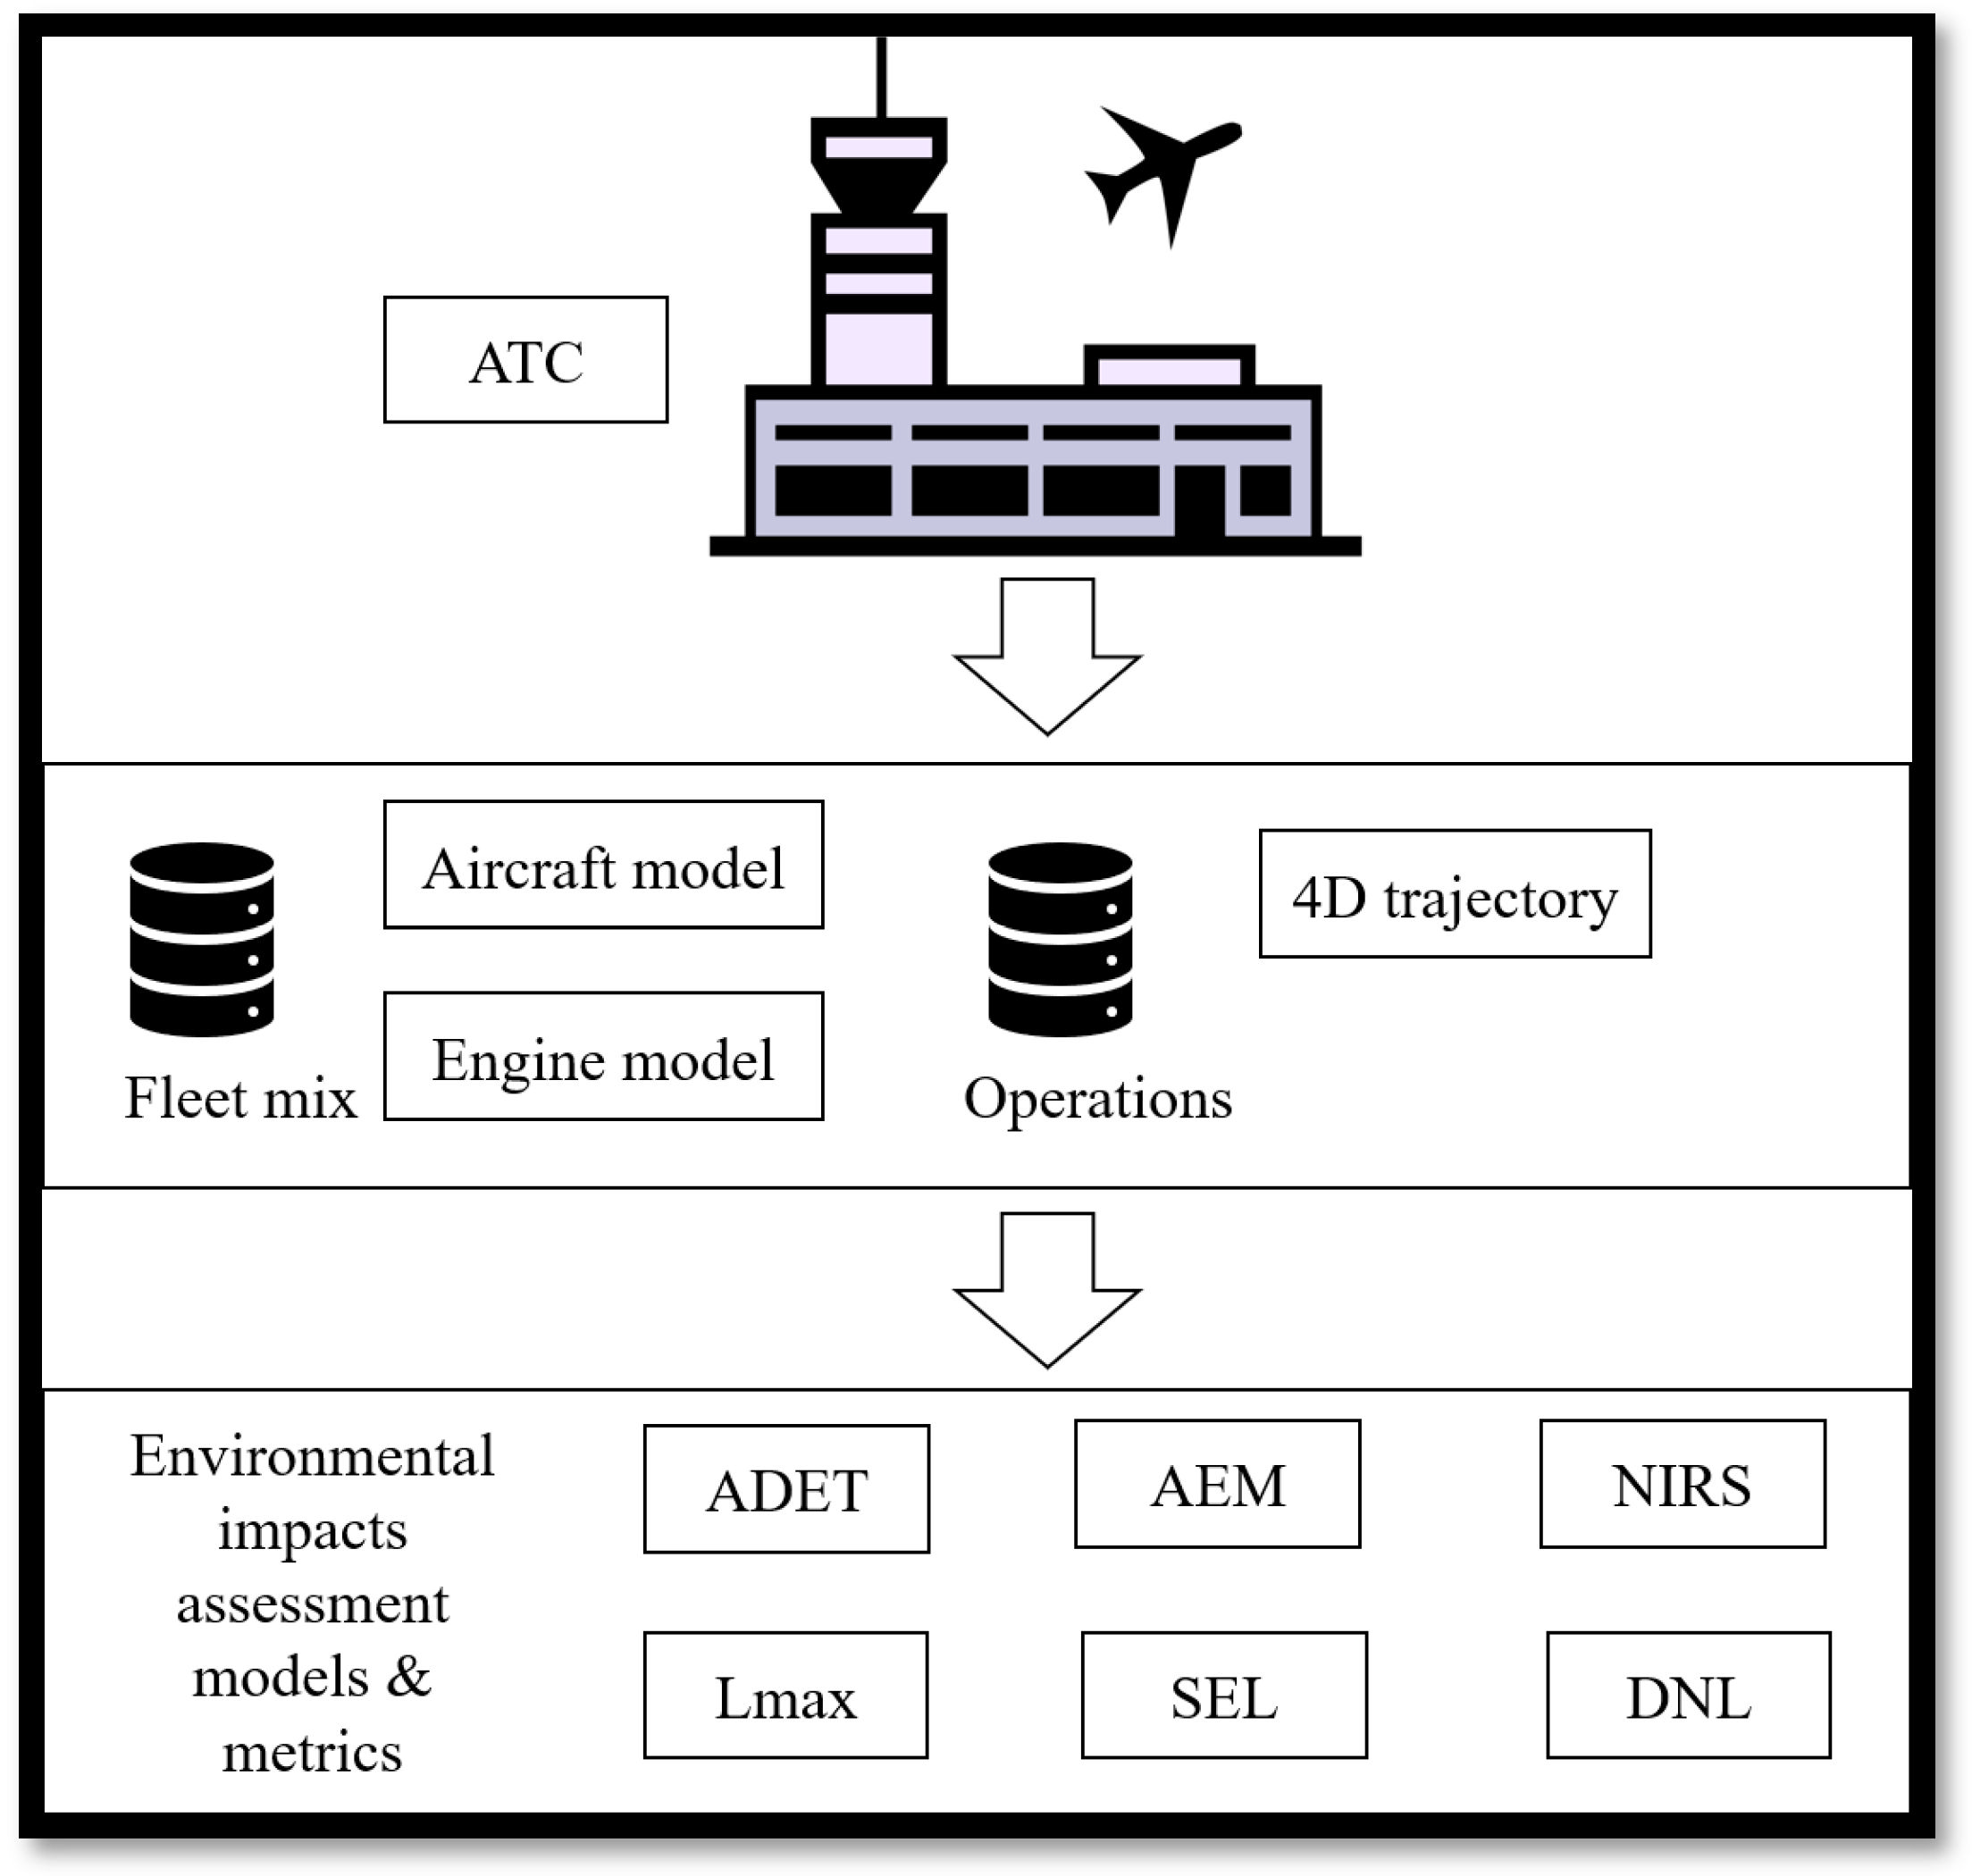
Figure 1. Existing aviation environmental modeling approaches [15].
Aerospace 11 00199 g001
Figure 2. Flow diagram of the developed noise modeling approach [15].
Aerospace 11 00199 g002
Figure 3. Details of deployed (a) ADS-B receiver and (b) acoustic sound meter.
Aerospace 11 00199 g003
Figure 4. Details of calibrator used for the acoustic sound meter. This meticulous calibration process, combined with the consistent data collection from the sound meter, formed the bedrock of our validation efforts, affirming the reliability of our noise model. The strategic placement of the equipment and the daily calibration procedures guaranteed that our noise data was of the highest quality, contributing to the robustness of our overall analysis.
Aerospace 11 00199 g004
Figure 5. Field deployment at the Purdue University Airport (KLAF) [46].
Aerospace 11 00199 g005
Figure 6. Standardized noise level of aircraft flown by Location A during 10:24:00–10:40:28: (a) A6D944 and (b) A891B7.
Aerospace 11 00199 g006
Figure 7. Comparison of the modeled noise levels and the measured noise during 10:24:00–10:40:28 EST 15 July 2021, at Location A (KLAF).
Aerospace 11 00199 g007
Table 1. Details of data used in this study.
NameSource (s)
Primary Data
ADS-B ADS-B Receiver with 1090 MHz Antenna
Perceived aircraft noiseGain Express Sound Meter
Event(s)Manually recorded by the research team
Secondary Data
Aircraft/engine typeAircraft Registration Database [42]
Aircraft/engine modelAircraft Registration Database [42]
Aircraft noise metricNPD Curve [44]
Airport configuration parametersAeronautical Information Services [46]
Table 2. Details of noise data acquisition at the Purdue University Airport (KLAF).
LocationCoordinatesDaysDate
A (Runway 05) *40.408816, −86.9406162522–24 June 2021
14–15, 21–22, 27, 30 July 2021
11, 23–27, 30 August 2021
9, 13–14, 17 September 2021
14, 19, 21, 27 October 2021
B (Airport Parking)40.415909, −86.9259342029 June 2021
1–2, 6–7, 9, 19–21, 26 July 2021
2 August 2021
1–3, 16, 29 September 2021
1, 26 October 2021
C (Localizer)40.410667, −86.92344123 August 2021
30 September 2021
* The determination of locations is based on the actual configuration of KLAF.
Table 3. An example of field notes recorded by researchers at Location A on 15 July 2021.
Time (EST)Events
OperationsDuration (Second)Other
10:27 a.m.1 (TAG)17N/A
10:28 a.m.218Road Traffic
10:29 a.m.N/AN/ARoad Traffic
10:30 a.m.3 (TAG)18N/A
10:35 a.m.417N/A
10:38 a.m.520N/A
10:39 a.m.621N/A
Table 4. Comparison between the measured noise levels and the modeled noise levels during a total of 17 s duration at Location A.
Aircraft IDPeak TimeOperationError (dBA)
Raw MeanAbsolute Mean
A6D94410:27:09TAG6.16.2
A891B710:28:56Takeoff0.02.5
A6D94410:30:47TAG5.96.1
A6D94410:35:38TAG5.25.2
A891B710:37:56TAG4.04.3
A6D94410:39:20TAG5.96.7
Table 5. Comparison between the measured noise levels and the modeled noise levels during the peak time at Location A.
Aircraft IDPeak TimeOperationError (dBA)
Raw MeanAbsolute Mean
A6D94410:27:09TAG4.74.8
A891B710:28:56Takeoff−1.11.9
A6D94410:30:47TAG3.94.0
A6D94410:35:38TAG3.63.7
A891B710:37:56TAG3.03.6
A6D94410:39:20TAG2.64.5
Table 6. Comparison between the measured noise levels and the modeled noise levels during the start stage (first five seconds) at Location A.
Aircraft IDPeak TimeOperationError (dBA)
Raw MeanAbsolute Mean
A6D94410:27:09TAG6.66.6
A891B710:28:56Takeoff2.74.4
A6D94410:30:47TAG10.210.2
A6D94410:35:38TAG8.18.1
A891B710:37:56TAG5.95.9
A6D94410:39:20TAG13.613.6
Table 7. Comparison between the measured noise levels and the modeled noise levels during the last five seconds at Location A.
Aircraft IDPeak TimeOperationError (dBA)
Raw MeanAbsolute Mean
A6D94410:27:09TAG7.87.8
A891B710:28:56Takeoff−1.11.6
A6D94410:30:47TAG4.35.0
A6D94410:35:38TAG4.64.6
A891B710:37:56TAG3.33.5
A6D94410:39:20TAG2.62.6
Table 8. Comparison between the measured noise levels and the modeled noise levels at Location B on 4 August 2021.
Aircraft IDPeak TimeAircraft TypeError (dBA)
Raw MeanAbsolute Mean
A8956E12:20:26Cessna 172 S1.01.9
−4.14.1
2.02.0
AD182512:23:17Cessna 152 1N/AN/A
ABCA6712:34:55CIRRUS SR 22 1N/AN/A
ABBEFA12:35:58Piper Cherokee 1N/AN/A
N/A 212:38:14N/AN/AN/A
A8CD9112:42:55Cessna 172 S−1.81.8
−8.58.5
−1.61.6
1 Such aircraft noise-to-power-to-distance data are unavailable in the EUROCONTROL ANP database. 2 This noise event was an aircraft operation. However, no related ADS-B data were logged.
Table 9. Comparison between the measured noise levels and the modeled noise levels at Location C on 3 August 2021.
Aircraft IDPeak TimeAircraft TypeError (dBA)
Raw MeanAbsolute Mean
ABB78C12:11:22Piper Warrior 7.97.9
5.45.4
4.34.3
ABB01E12:19:49Piper Cherokee 1N/AN/A
ACBE6212:25:17Cessna 172 S0.82.9
1.54.3
9.69.6
A8C70F12:26:54Cessna 172 S−3.13.1
−2.02.1
−0.11.9
ABBEFA12:28:42Piper Cherokee 1N/AN/A
1 Such aircraft noise-to-power-to-distance data are unavailable in the EUROCONTROL ANP database.
Disclaimer/Publisher’s Note: The statements, opinions and data contained in all publications are solely those of the individual author(s) and contributor(s) and not of MDPI and/or the editor(s). MDPI and/or the editor(s) disclaim responsibility for any injury to people or property resulting from any ideas, methods, instructions or products referred to in the content.