Article

Online Deterministic 3D Trajectory Generation for Electric Vertical Take-Off and Landing Aircraft

1
Institute of Flight System Dynamics, Technical University of Munich, 85748 Garching, Germany
2
Institute for Aerospace Studies, University of Toronto, Toronto, ON M3H 5T6, Canada
*
Author to whom correspondence should be addressed.
These authors contributed equally to this work.
Aerospace 2024, 11(2), 157; https://doi.org/10.3390/aerospace11020157
Submission received: 20 December 2023 / Revised: 30 January 2024 / Accepted: 13 February 2024 / Published: 15 February 2024
(This article belongs to the Special Issue Advanced GNC Solutions for VTOL Systems)

Abstract

:
The use of non-piloted eVTOL aircraft in non-segregated airspace requires reliable and deterministic automatic flight guidance systems for the aircraft to remain predictable to all the users of the airspace and maintain a high level of safety. In this paper we present a 3D trajectory generation module based on clothoid transition segments in the horizontal plane and high order polynomial transition segments in the vertical plane. The expressions of the coefficients of the polynomial are derived offline are used to generate the trajectory online, making the system capable of running in real time without requiring enormous computational power. For the horizontal plane, we focus on the flyby transition, and therefore present a thorough analysis of the flyby geometry and the limitations linked to this geometry and the construct of three-segment trajectory generation around a fixed turn rate. We present feasible solutions for these limitations, and show simulation results for the combined horizontal and vertical plane concepts, allowing the system to generate complex 3D trajectories.

1. Introduction

Electric Vertical Take-Off and Landing (eVTOL) aircraft have received much attention recently for their versatility and wide range of applications. This includes urban air mobility, medical evacuations, firefighting, and so on. In this framework, there is an increasing need for reliable automatic flight guidance systems for both manned and unmanned eVTOL aircraft. The reliability requirement for trajectory generation and control implies the ability to withstand the strict certification procedure of safety-critical systems. Furthermore, the systems are intended for use in non-segregated airspace. Therefore, they are expected to be predictable to the air traffic controllers, and to other users of the airspace, while maintaining the versatility expected of a human pilot. The development of such systems remains an active research topic in the international scientific community.
Current literature mainly focuses on non-deterministic and sampling-based trajectory generation methods, such as RRT or RRT* [1,2,3,4]. Zhao et al. [5] explore various computational intelligence-based methods for path planning including Fuzzy logic, neuron computing, genetic computing, and probabilistic computing. These approaches are promising for small UAVs operated in secluded and safe environments. However, as they are all probability-based methods, they are non-deterministic and are, therefore, unsuitable for eVTOL aircraft operated in non-segregated airspace.
Qu et al. [6] consider a Reinforcement learning-based grey wolf optimizer (RLGWO) for optimal path planning and use a cubic B-spline to ensure a continuous trajectory. This hybrid approach comes with its unique set of advantages, but runs into the same limitations as the other non-deterministic methods.
Al Satai et al. [7] propose using any-angle path-finding algorithms like Basic Theta*, Lazy Theta*, and Phi* paired with Bézier curves to smooth the generated paths to be converted to a flyable trajectory. This is a novel approach to efficiently construct optimal trajectories, but may be limited by its computational complexity for real-time performance. The approach presented in [8] looks at real-time path planning based on bi-level programming (BLP).The approach aims to integrate various path planning requirements, including convergence to a target, obstacle avoidance, path length optimization, flight path smoothing, and adaptability, to changes in UAV kinematic and sensory properties. However, it is also limited by the computational complexity.
Bousson et al. [9] address the 4D trajectory generation problem. In addition to the geographic location, they also consider the arrival time at the waypoints. They construct an optimization problem in which Lagrange and Chebyshev polynomials approximate the solution space. Two simulations verified that the approach is able to generate smooth trajectories. However, high-order polynomials are required to capture the system’s nonlinear behavior, and they are used in the optimization problem. This makes the algorithm infeasible for online use.
In [10], deterministic path planning for a forklift truck is investigated. Given a specified number of waypoints, linear line segments are combined with polar splines. The splines are constrained on the radius, slope, and curvature to achieve 2-order continuity of the generated trajectory. However, the approach only covers geometrical considerations. Characteristics of the dynamical system are neglected during the trajectory design process.
Schneider et al. [11,12] use line and circular arc segments to construct the trajectory. For the transition between segments, a clothoid function is used to ensure C 2 -order continuity of the trajectory. The clothoid function is designed based on the aircraft characteristics, namely the roll dynamics. While the approach is proven to work well for fixed-wing aircraft, flight path construction is more restrictive when considering eVTOL configurations. The clothoid-based approach is widely used for its simplicity and the system presented in [11] has been successfully flight tested on a fixed-wing aircraft [13].
In this paper, we conduct an analysis of flyby maneuvers and the implications of the geometrical construction of these maneuvers and the resulting limitations, and propose an extension to the system developed in [11] to make it suitable for an eVTOL aircraft. One aspect analyzed is the turn distance. This is important because it controls how far apart two successive waypoints need to be. This is particularly important for eVTOL aircraft as they are typically intended to be flown in urban environments and other environments with short distances. The other aspect is the inherent limitation of the allowable maximum angle between two successive legs in the flight plan. We show that this limitation applies to trajectory generation systems designed by combining straight lines, transition segments, and circular arcs. Then, we present an analytical derivation of the problem, exposing the variables and the potential solutions. We pursue the solution involving a dynamic change of the design turn rate. This allows the system to accommodate a wider range of flight plans.
In addition to the clothoid-based generation for lateral trajectory, we use a higher order polynomial for the vertical trajectory, where, instead of the optimization framework presented in [9], the expressions for coefficients of the polynomial are calculated analytically beforehand, taking into account predefined continuity requirements, and no optimization is performed. This allows us to maintain a low computational complexity.
As shown in the literature review above, most of the current literature considers trajectory optimization, which not only requires considerable computational power, but also is difficult to certify. The purpose of this work is to present a system capable of generating deterministic 3D trajectories online with a low computational cost. Therefore, rather than considering the optimality of the generated path, we only consider the determinism. This is essential for use in non-segregated airspace where the behavior of the aircraft needs to be predictable to other users of the airspace. Additionally, this makes the system relatively easy to certify.
This paper is organized as follows: Section 2 provides a complete mathematical description of each element of the trajectory composition (straigt line, circular arc segment, and clothoid segment). Section 3 deals with the construction of the trajectory by merging the mathematical preliminaries with the aircraft dynamics. Section 4 details the flyby implications for eVTOLs. Finally, Section 5 illustrates our key findings and analysis.

2. Trajectory Construction: Overview

It is widely known that the shortest path between two points is a straight line. Ref. [14] shows that, if there are constraints that need to be satisfied, such as a given orientation at both the starting and end points, then the shortest path is a combination of straight lines and circular arcs also known as a Dubin’s path. This is the approach followed in [15], which is the basis of the work carried out in this paper.
Since the trajectory is made up of straight lines and circular arcs, there is a curvature discontinuity arising at the joints of the two segments. As shown in [16], a straight line has a curvature κ = 0 , while a circle has a curvature inversely proportional to its radius κ = 1 / r . This is also shown later in Section 2.2 and Section 2.3 of this paper.
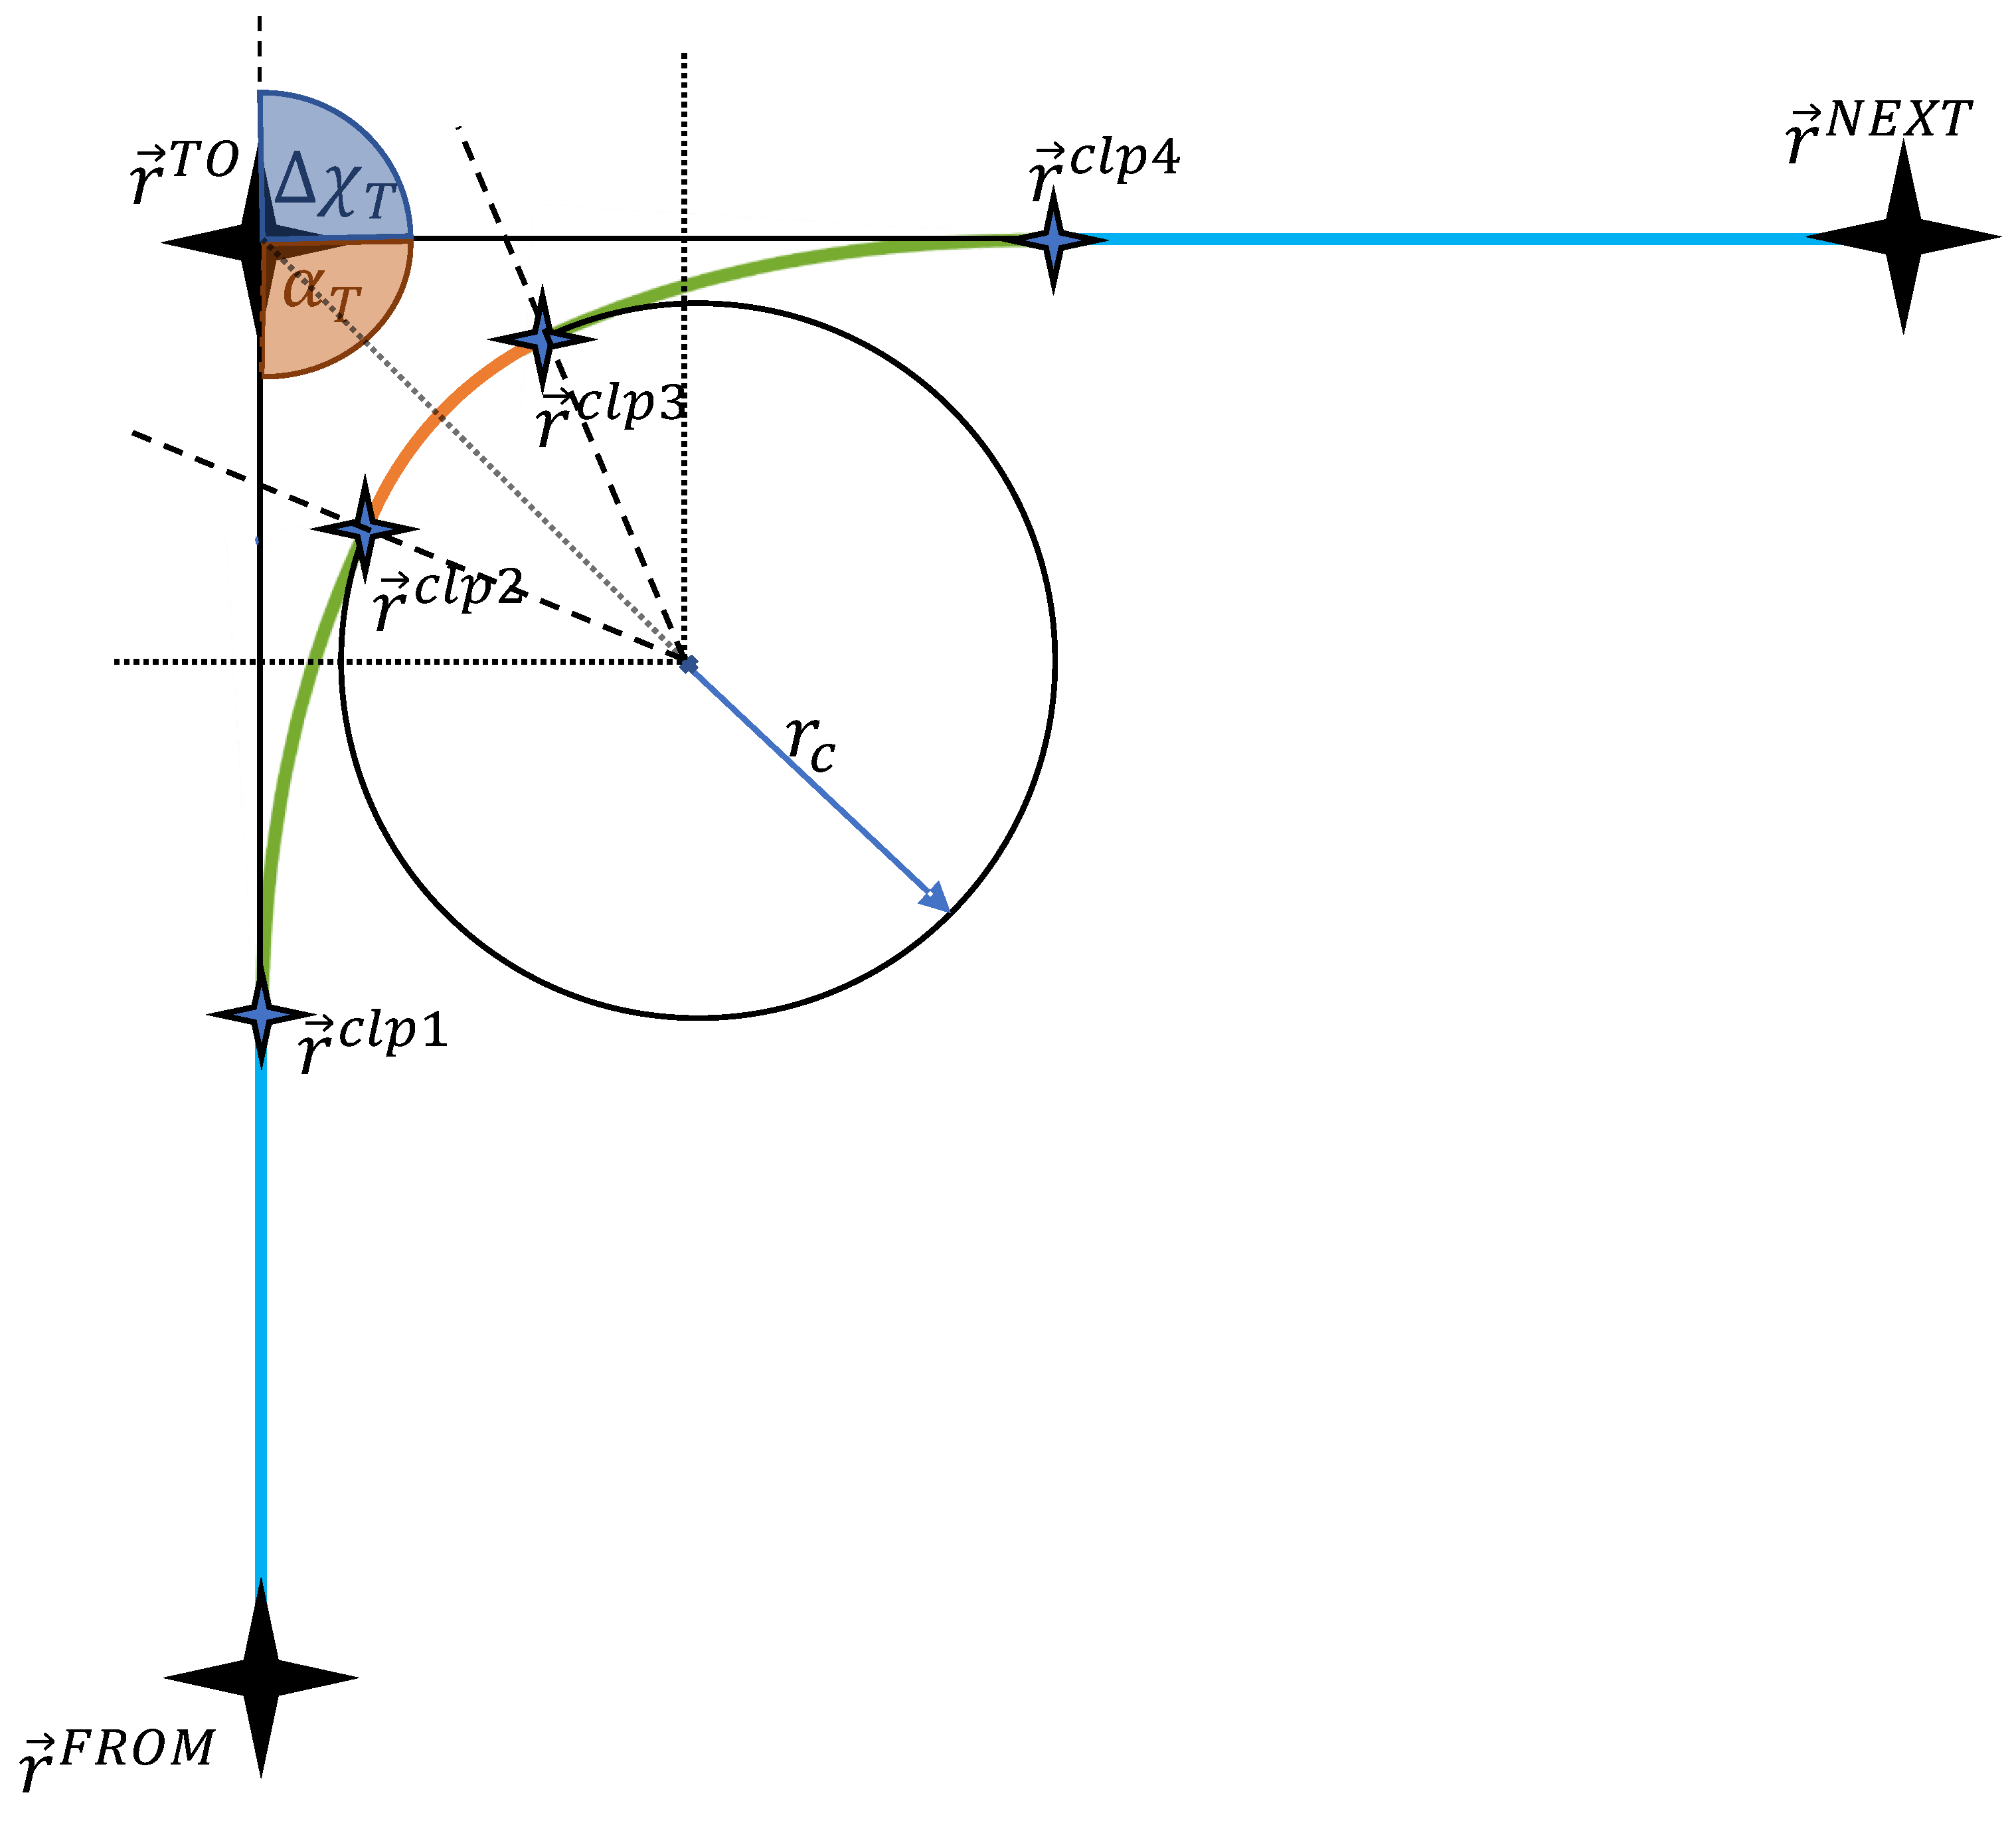
A clothoid or Euler spiral is a curve with the property that its curvature linearly increases with the arc length [17,18]. This makes the clothoid a particularly good candidate for transition segments that connect the straight line and circle as shown in Figure 1 where the straight line is shown in blue, the clothoid in green and the circular arc in orange and stars are delimiting different sections.
In the following section we will first recapitulate how the curvature of a plane curve is calculated. In Section 2.2, Section 2.3 and Section 2.4, the curve parametrization will be given, and the curvature will be calculated, for each of the elements in Figure 1 (line, clothoid, circle).

2.1. On Plane Curves

This section introduces important mathematical preliminaries for plane curves. These mathematical relations will be used throughout this paper.
In general, a curve in two-dimensional Euclidean space can be parametrized as a piecewise differentiable function [19]:
c = c x c y = c τ R 2
where τ is the running parameter of the parametrization.
The arc length s of the curve between two instants τ 1 and τ 2 can be calculated as [20]:
s τ 1 , τ 2 = τ 1 τ 2 | | c ˙ τ | | d τ
where | | c ˙ τ | | = c ˙ x ( τ ) 2 + c ˙ y ( τ ) 2 is the 2-norm of the first derivative of the curve with respect to the running parameter.
According to [21], the pointwise curvature of a curve c τ R 2 is the norm of the derivative of the unit tangent vector T at that point with respect to the arc length:
κ ( τ ) = d T d s = T ( s )
where s is the arc length. The derivative of the unit tangent vector with respect to the arc length can be found as follows:
We know the tangent vector t is simply the first derivative of the position vector with respect to time, or in our case, the running parameter τ :
t = d c d τ = c ˙ ( τ )
And the unit tangent vector with respect to τ is:
T ( τ ) = t t = c ˙ ( τ ) c ˙ ( τ )
If we take the derivative of Equation (2) with respect to τ , we obtain:
d s d τ = c ˙ ( τ )
Replacing the result of Equation (6) into Equation (5), we obtain:
c ˙ ( τ ) = T ( τ ) · d s d τ
Using the chain rule, we can rewrite Equation (3) in terms of d τ as follows:
κ ( τ ) = d T d s = d T d τ · d τ d s
With the information we have from Equation (6), we obtain:
κ ( τ ) = d T d τ · d τ d s = d T d τ · 1 c ˙ ( τ ) = T ˙ ( τ ) c ˙ ( τ )
Another representation of the curvature that will prove useful is derived in [16], and shown in Equation (10). This gives us the angle φ representing the change in direction covered over an arc length s.
κ ( τ ) = d φ d s τ
Now that we have derived the mathematical expressions for curvature and arc length, we can apply them to the segments that define our trajectory, starting with straight line segments.

2.2. On Straight Line Segments

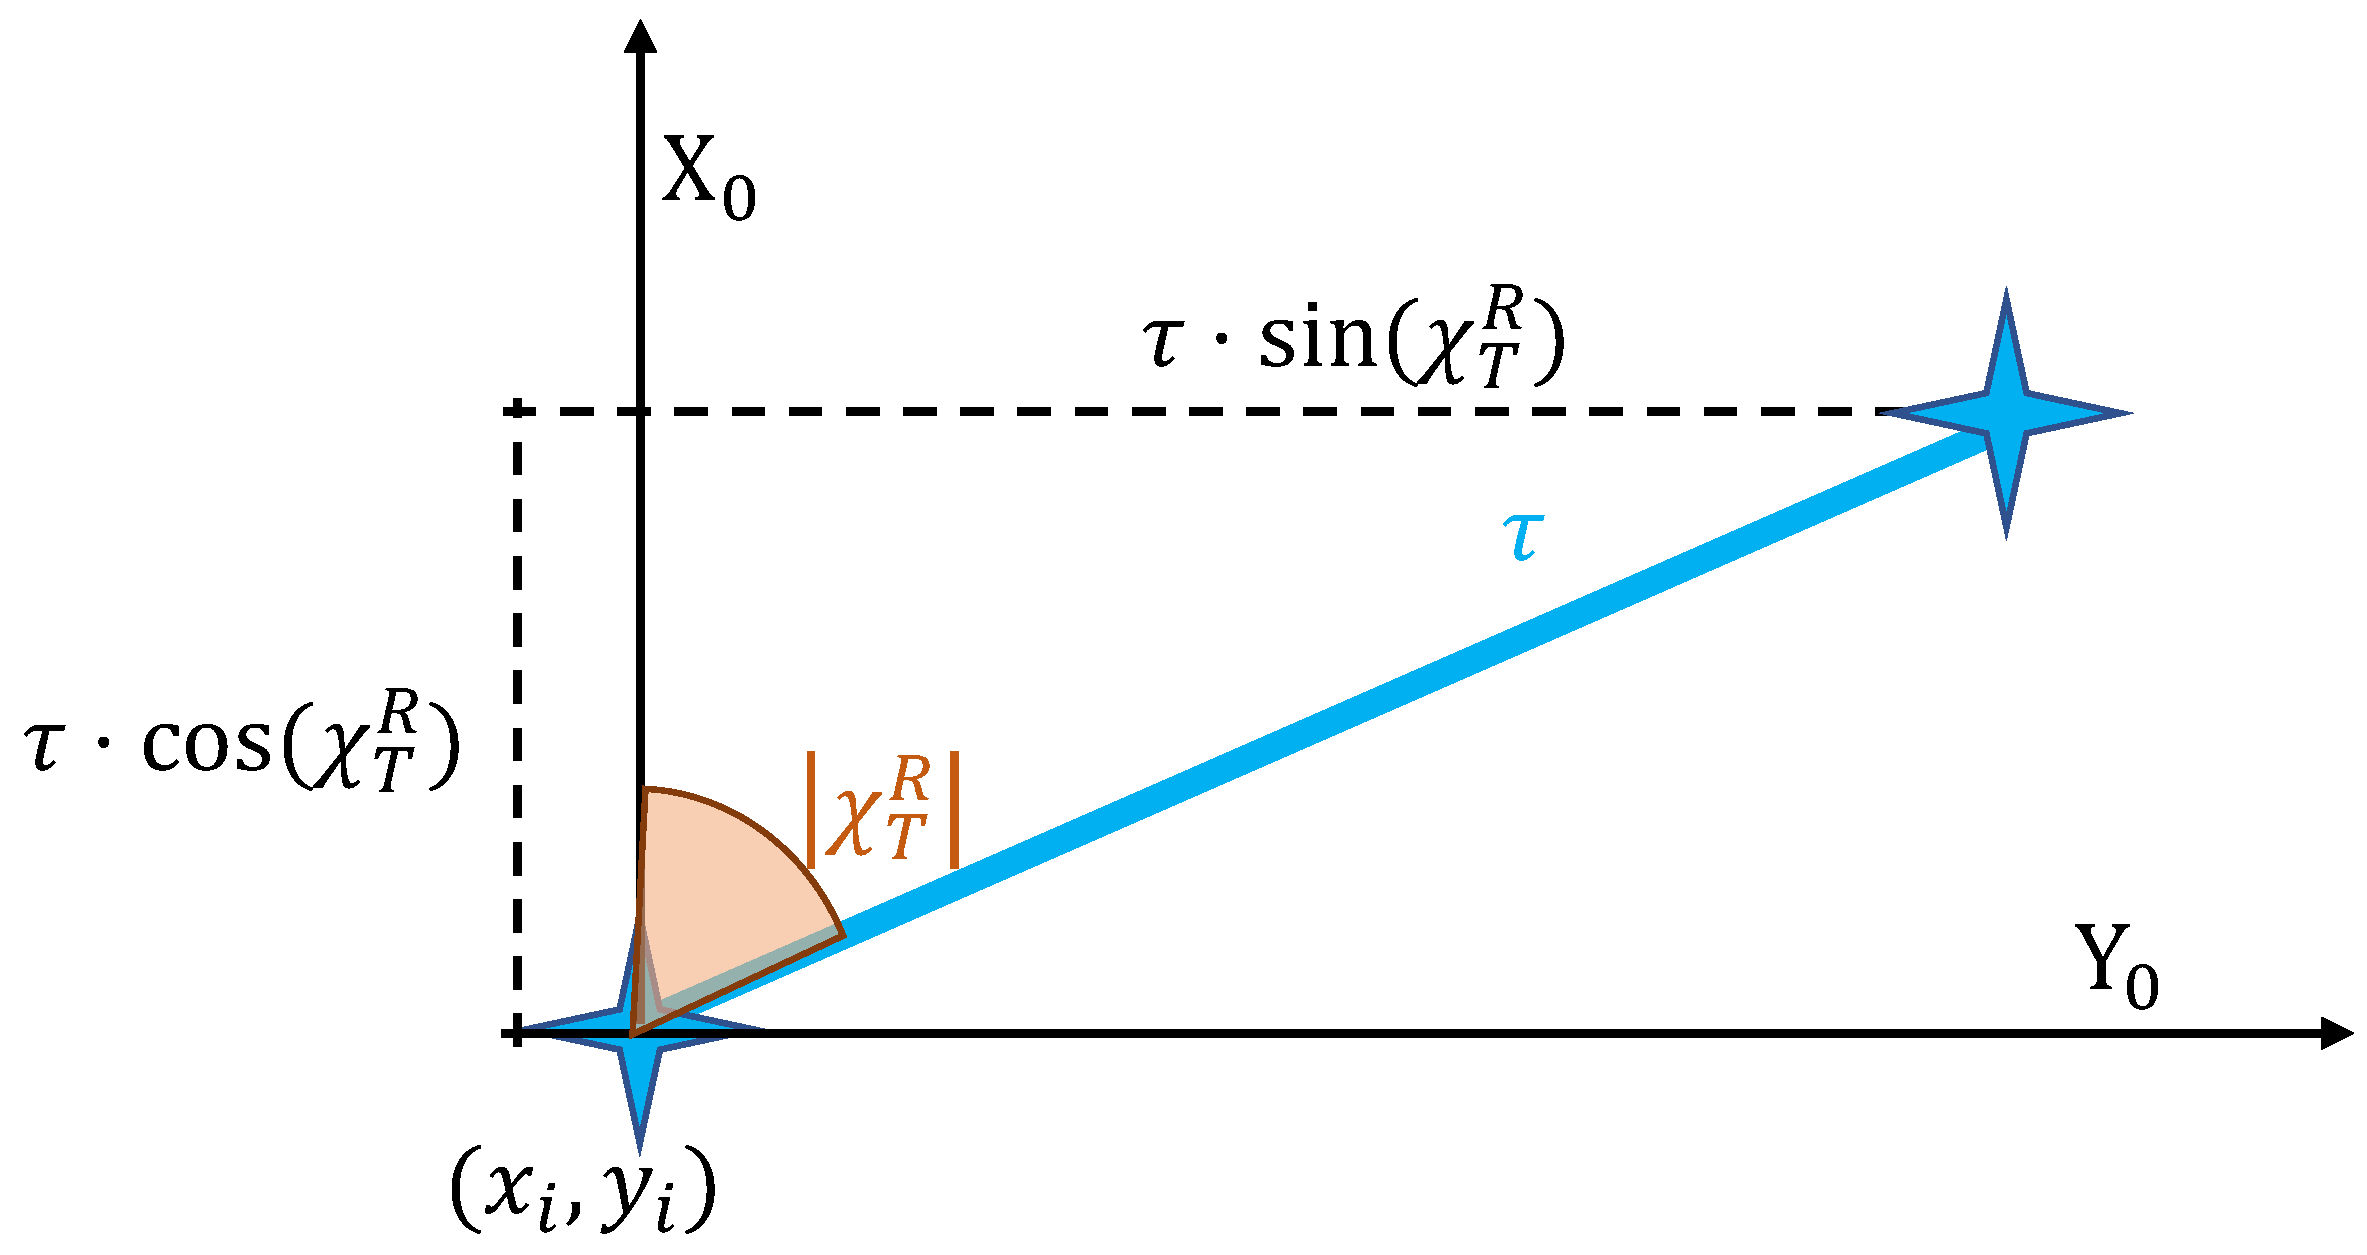
From the fundamental principles of geometry in [22], we can deduce the parametrization of a straight line followed by an aircraft flying with a course angle χ T R as shown in Figure 2:
c ( τ ) = c x l i n e c y l i n e = x i + τ · cos χ T R y i + τ · sin χ T R
where τ is the distance traveled on the line, measured from the coordinates of starting position of the line given by x i and y i .

Curvature and Arc Length of the Line Segment

We can apply Equation (9) to find the curvature. We therefore need the first derivatives of the unit tangent vector and the parametrization of the line itself.
The derivative of the line curve is:
c ˙ ( τ ) = cos χ T R sin χ T R
The tangent vector is calculated using Equation (5):
T ( τ ) = c ˙ x c ˙ x 2 + c ˙ y 2 = cos χ T R c ˙ y c ˙ x 2 + c ˙ y 2 = sin χ T R
We can now immediately see that, as expected, the curvature calculated with Equation (9) is zero as T ˙ ( τ ) = [ 0 , 0 ] T . Additionally, as we mentioned before that τ represent the distance traveled along the line, it also makes it the arc length, such that:
s l i n e ( 0 , τ ) = τ

2.3. On Circle Segment

A circle centered at ( x i , y i ) as shown in Figure 3 can be parametrized as [23]:
c ( τ ) = c x c c y c = x i + r c · cos τ y i + r c · sin τ
where x i and y i are the coordinates of circle center and r c is the radius of the circle.

2.3.1. Curvature of the Circle Segment

Applying Equation (9) we find the curvature.
The derivative of the circle parametrization with respect to τ is:
c ˙ ( τ ) = r c · sin τ r c · cos τ
The tangent vector is calculated using Equation (5):
T ( τ ) = c ˙ x c ˙ x 2 + c ˙ y 2 = sin τ c ˙ y c ˙ x 2 + c ˙ y 2 = cos τ
And its derivative with respect to τ is:
T ˙ ( τ ) = cos ( τ ) sin ( τ )
Replacing these solutions in Equation (9) we find the curvature:
κ c = cos ( τ ) sin ( τ ) r c · sin τ r c · cos τ = 1 r c

2.3.2. Arc Length of the Circle Segment

The arc length of the circle segment parametrized as shown in Equation (15) is calculated using Equation (2):
s c τ 1 , τ 2 = τ 1 τ 2 r c · sin τ r c · cos τ d τ = r c · ( τ 2 τ 1 )
Assuming τ 1 = 0 and τ 2 = τ , we obtain:
s c ( 0 , τ ) = r c · τ

2.4. On Clothoid Segment

As shown in [15,24], an exact parametrization of the clothoid curve, as shown in Figure 4, is given by the irreducible Fresnel integrals:
c ( τ ) = c x c l c y c l = x i + A · 0 τ cos τ 2 d τ y i + A · 0 τ sin τ 2 d τ
where A is the shaping parameter, which is further explained in Section 2.4.4, and x i and y i are the starting position of the clothoid curve.
The goal is to have a clothoid section starting with a curvature κ = 0 and ending with the curvature of the circular arc used for the maneuver κ = 1 r c .

2.4.1. Curvature of the Clothoid Segment

To calculate the curvature at a given instant, we start by taking the first derivative of the clothoid curve with respect to τ :
c ˙ ( τ ) = A · cos τ 2 A · sin τ 2
Then we find the unit tangent vector from Equation (5):
T ( τ ) = c ˙ x c ˙ x 2 + c ˙ y 2 = cos τ 2 c ˙ y c ˙ x 2 + c ˙ y 2 = sin τ 2
Taking the derivative of the unit tangent vector with respect to τ we obtain:
T ˙ ( τ ) = 2 τ sin τ 2 2 τ cos τ 2
We substitute c ˙ ( τ ) and T ˙ ( τ ) into Equation (9) and obtain the parametrized curvature of the clothoid:
κ c l ( τ ) = 2 τ sin τ 2 2 τ cos τ 2 A · cos τ 2 A · sin τ 2 = 2 · τ A

2.4.2. Arc Length of the Clothoid Segment

We can now calculate the arc length:
s c l τ 1 , τ 2 = τ 1 τ 2 A · cos τ 2 A · sin τ 2 d τ = A · ( τ 2 τ 1 )
Assuming that τ 1 = 0 and τ 2 = τ , we obtain:
s c l ( 0 , τ ) = A · τ
Equation (28) shows the simplicity of the clothoid curve, which lies in the fact that it can be defined completely by the shaping parameter A.

2.4.3. Change in Direction

Now that we have the arc length and curvature of the clothoid segment, we can use the second representation of curvature shown by Equation (10), to calculate the angle representing the change in direction throughout the clothoid segment:
2 τ A = d φ d ( A τ ) τ
This leads to:
d φ τ = 2 τ A · A · d τ
Integrating Equation (30) with respect to τ , we obtain a very simple representation of change in angle, which is really a change in tge course angle incurred while flying the clothoid segment:
φ c l ( τ ) = τ 2

2.4.4. Clothoid Approximation

As shown earlier in this section, the clothoid can be exactly represented using Fresnel integrals. The Fresnel integrals are transcendental functions that cannot be solved analytically [25]. Given that the system is intended to be used for real-time computations, ref. [15] introduce a power series approximation of the clothoid:
Δ x c l ( τ ) Δ y c l ( τ ) = A · m = 0 5 ( 1 ) m ( 2 m ) ! · ( 4 m + 1 ) · τ 4 m + 1 A · m = 0 5 ( 1 ) m ( 2 m + 1 ) ! · ( 4 m + 3 ) · τ 4 m + 3 ,
As shown in [15], the fifth-order power series is accurate enough for trajectory generation applications. A comparison of the exact representation and the approximation is shown in Figure 5. As we can see, the power series approximation is accurate even for extreme cases of a change in the angle of 180 . Note that the clothoid shaping parameter A seen in Equation (32) simply controls the rate of growth of the clothoid curve.
In this section we presented the generalities of trajectory generation, and introduced the clothoid segment that connects straight lines and circular arcs. Since the clothoid is represented by Fresnel integrals that are rather difficult to solve online, we use a fifth-order power series approximation. The simplicity of the clothoid segment lies in the fact that it has only a single variable, which is the shaping parameter A. This variable will be determined in the next section, and connected to the aircraft dynamics.

3. Trajectory Construction: Flyby

The flyby transition is mainly based on the developments in [15]. A geometrical overview is shown in Figure 6, where the clothoid segment is shown in green. The flyby transition has three segments: the turn-in, circle, and turn-out. In the horizontal plane, the turn-in and turn-out segments are clothoid sections and are assumed to be symmetrical. As introduced earlier in this paper, they are used to provide continuous curvature in the generated trajectory. In this section we want to derive the geometry of the maneuver as depicted in Figure 6 and use it, together with the relations derived in Section 2 for the three different segments (line, clothoid, circle), to derive an expression for the turn distance (see Figure 7) that only depends on the following parameters:
  • Fixed parameters resulting from the flight plan:
    course angle change between two subsequent legs Δ χ T , kinematic speed V T ;
  • Fixed parameters resulting from the inner loop controller design, the resulting inner loop dynamics and aircraft performance:
    roll time constant T p , roll rate command p c m d ;
  • Trajectory design parameter:
    desired turn rate χ ˙ T d .
Figure 6. Flyby geometry—an overview.
Aerospace 11 00157 g006
Note that the desired turn rate above is strictly positive as the direction of the turn is defined by the positions of waypoints in the flight plan. See Figure 6 as an example of a right turn, which is independent of the turn rate. This direction is multiplied directly to the turn rate command generated by the trajectory generation module as 1 for a right turn and 1 for a left turn.

3.1. Horizontal Plane

From an aircraft perspective, there are two main parts to the maneuver:
1.
Straight line: the aircraft is flying in a straight line with a kinematic bank angle μ = 0 .
2.
Circle: The aircraft is performing a turn with a kinematic bank angle as given by Equation (33)
μ = arctan V T · χ ˙ T d g 0
where V T is the kinematic speed, χ ˙ T d is the desired turn rate, and g 0 is the gravitational acceleration.
The desired turn rate can be used to describe the radius of the maneuver circle:
r c = V T χ ˙ T d
As we see, in one instant, we have a zero kinematic bank angle, and in the next instant, we require a non-zero bank angle in order to have that non-zero turn rate from Equation (33). This discontinuity is represented geometrically by the step in curvature of the trajectory. Therefore, the clothoid segment should help the aircraft build up the necessary bank angle, in order to achieve the desired turn rate. [15] describes a method to find the time needed for the aircraft to build up a bank angle μ , given a constant roll rate p, and considering the aircraft turn performance through the roll time constant T p . This is shown in Equation (35).
t c l = 2 · T p + μ c m d p c m d
We know the clothoid arc length from Equation (28). And from the basic physics of motion, given a distance and a speed, we can calculate the time it takes to travel that distance. This gives us a relationship between the transition time t c l and the clothoid shaping parameter A.
t c l = s ( 0 , τ c l ) V T = A · τ c l V T
where the arc length s c l ( 0 , τ c l ) = A · τ c l calculated in Equation (28) was inserted.
Solving Equation (36) for the running parameter τ c l , allows us to express it as a function of the shaping parameter A and the physical transition time t c l during which we need to fly a clothoid segment.
τ c l = V T · t c l A
As we stated before, our goal is to have a clothoid section that starts with a curvature κ = 0 and ends with a curvature κ = 1 r c , which is the curvature of the maneuver circle calculated by Equation (34). This means that we want the curvature of the clothoid, which we can parametrize with Equation (26), to equal 1 r c :
κ c = 1 r c κ c l = 2 · τ c l A
Replacing τ c l in Equation (38) with the expression for τ c l given in Equation (36) we obtain:
1 r c = 2 · V T · t c l A 2
We can now solve Equation (39) for A:
A = 2 · V T · r c · t c l
Substituting Equation (35), we obtain the final expression for the shaping parameter A:
A = 2 · V T · r c · 2 · T p + μ c m d p c m d
where μ c m d and r c are calculated using Equation (33) and Equation (34), respectively.
Equation (41) gives us a parametrization of the clothoid shaping parameter A as a function of the aircraft dynamics and performance. As shown in Figure 5, this parameter controls the rate of growth of the clothoid. This means that, although the start and end points of the clothoid are defined by the curvatures of the straight line and maneuver circle, the space occupied by the clothoid, and therefore the distance flown by the aircraft, is dependent on the aircraft performance. And this can be traced back to Equation (36) which defines the time needed for the aircraft to build up a certain bank angle.

3.1.1. Turn Distance

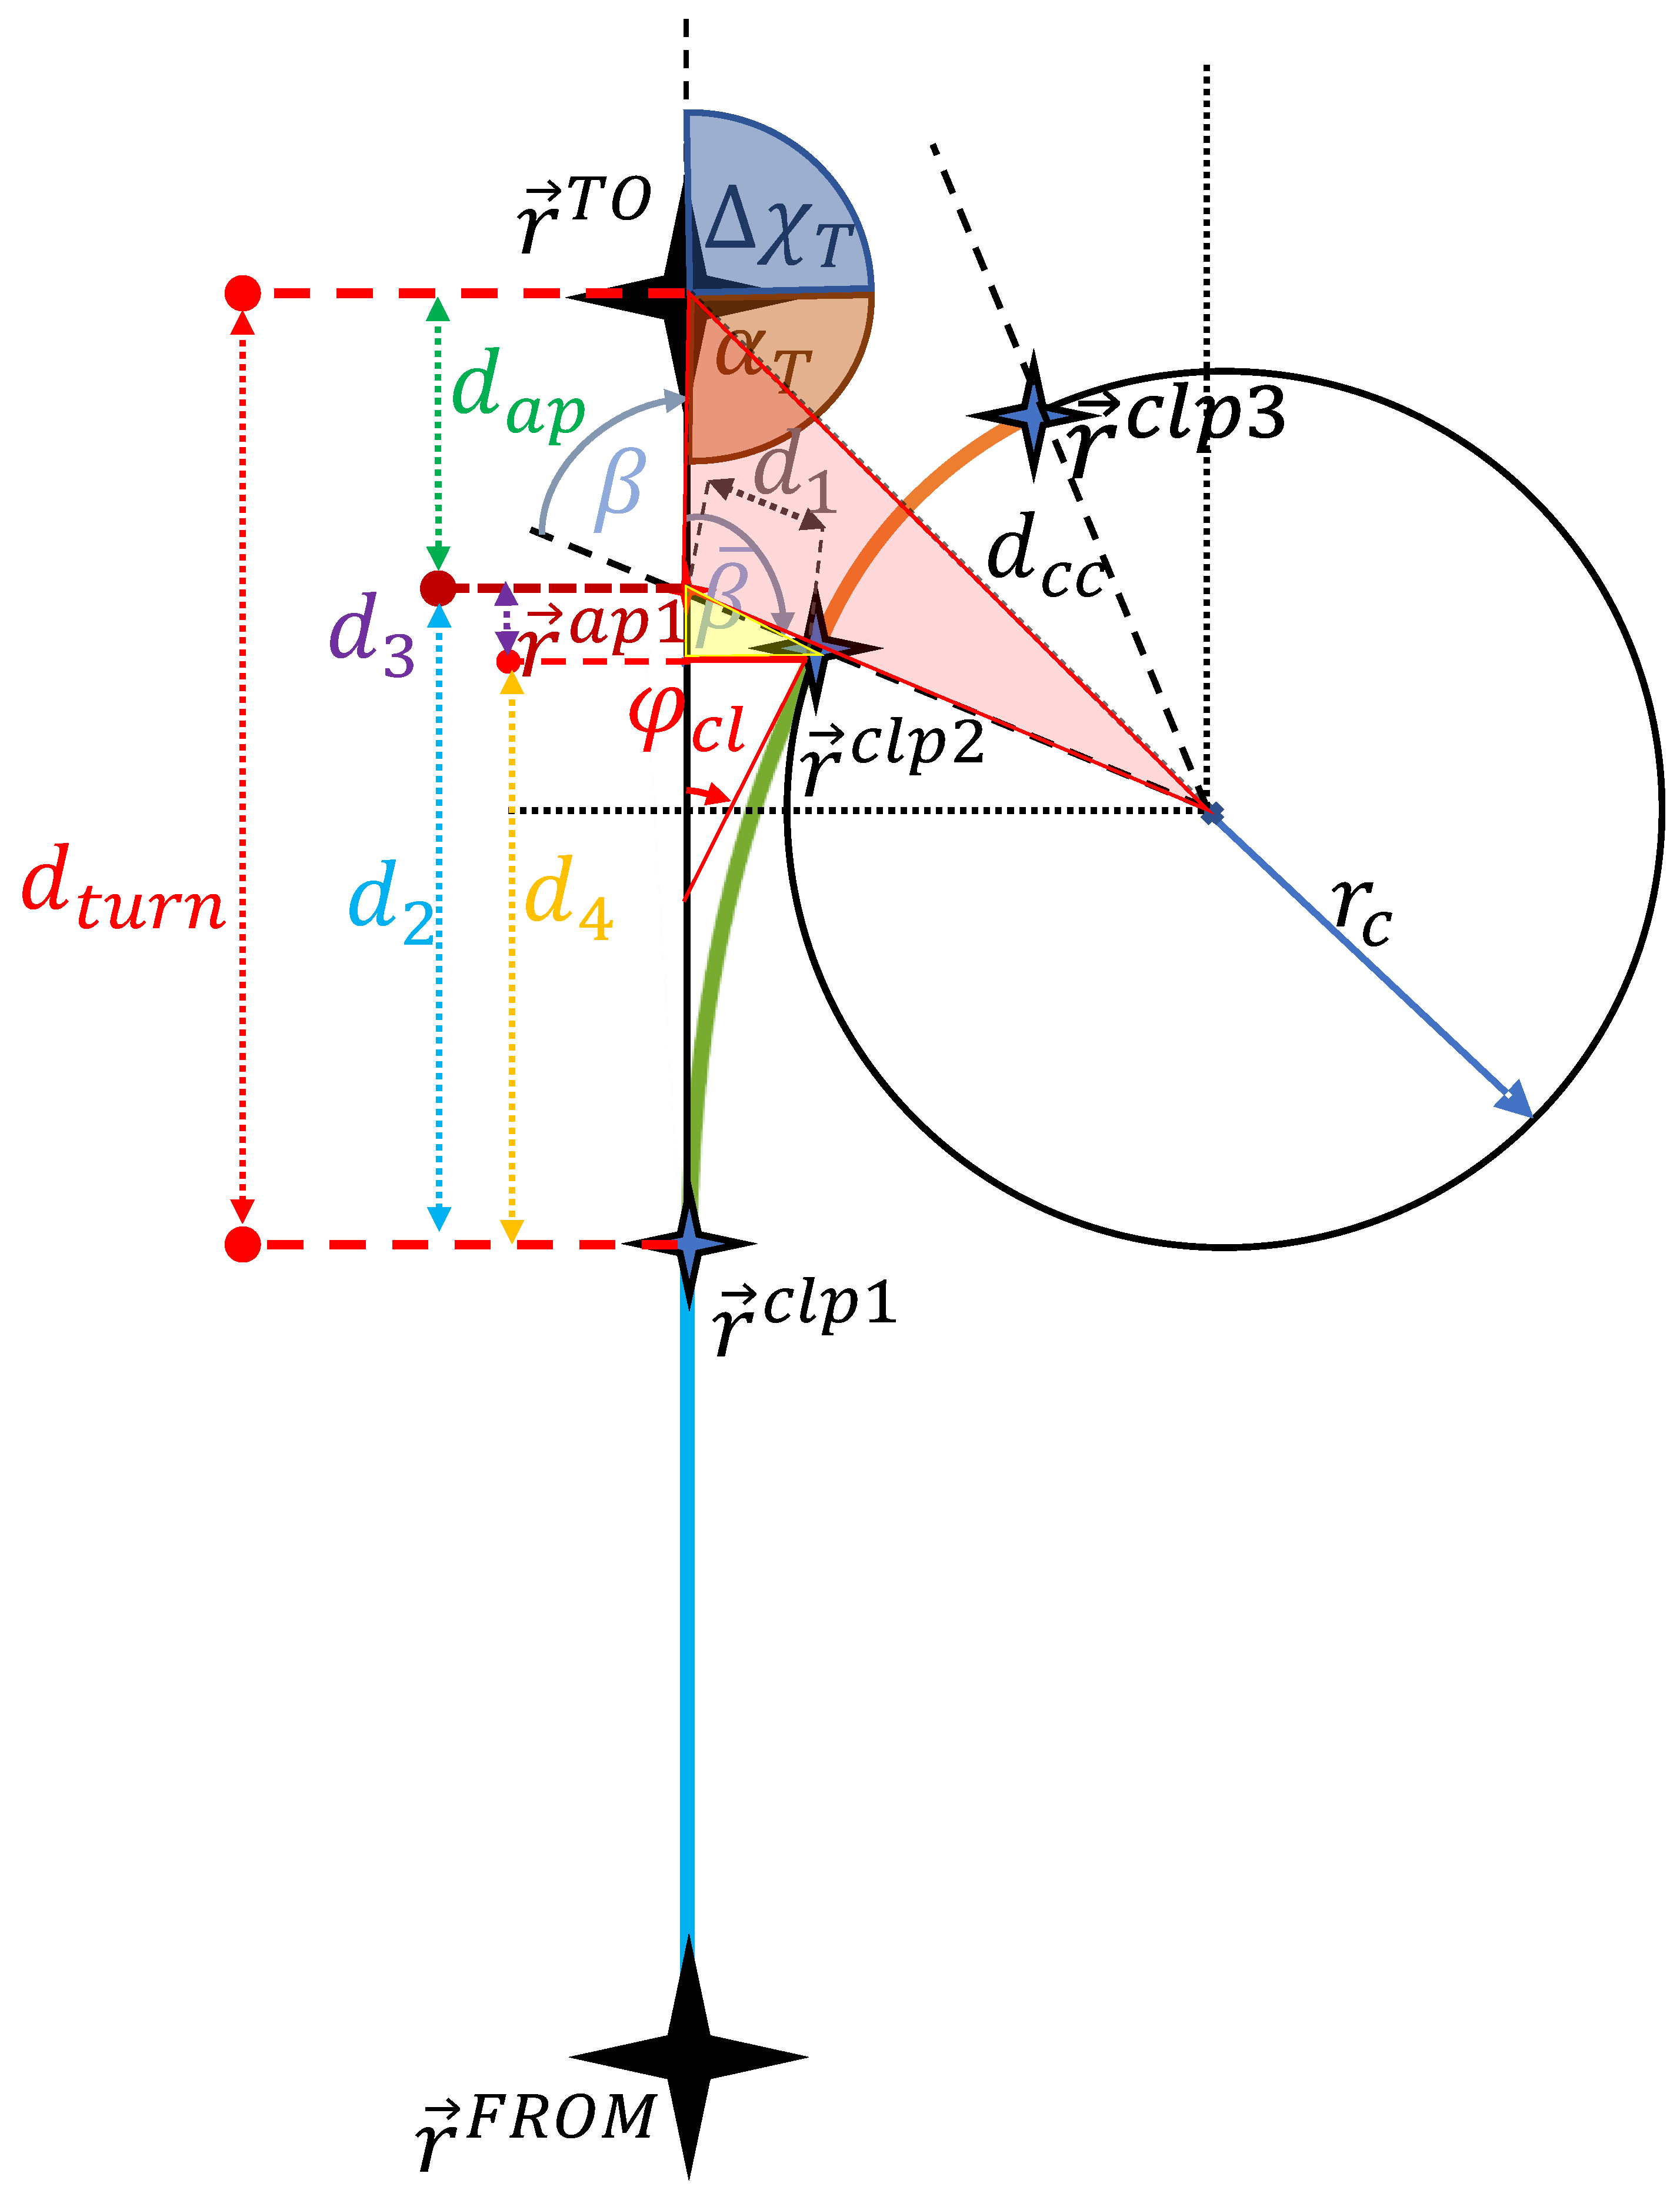
Now that we have established some general features of the flyby, we need to calculate the turn distance d t u r n between the T O waypoint and the first clothoid point c l p 1 as shown in Figure 7. This will be used to define the location r c l p 1 where the turn maneuver needs to start. The aim is to derive an expression that only depends on the parameters V T , Δ χ T , T p , p c m d , and the design parameter χ ˙ T d .
Figure 7. Turn distance.
Aerospace 11 00157 g007
In Figure 7, we can already see that, geometrically, the turn distance is made up of the distance between the T O and the auxiliary point a p 1 , and the distance d 2 :
d t u r n = d a p + d 2
We see a triangle formed between the circle center c c , the T O and the a p 1 points. The left side of that triangle is exactly d a p . The triangle has the angle β ¯ (see Equation (47) at the a p 1 vertex and angle Δ χ T * / 2 (due to the symmetry of the maneuver) at the c c vertex. We can apply the law of sines [26] to find the d a p side:
d a p = d c c · sin Δ χ T * 2 sin β ¯
where d c c is the distance between the T O and the circle’s center. This distance can also be calculated using the law of sines, considering that the angle at the T O vertex is α T / 2 , and knowing that the side opposite to d c c is r c + d 1 :
d c c = r c + d 1 · sin β ¯ sin α T 2
where α T = π Δ χ T as can be seen in Figure 7 and where d 1 is the distance between the clothoid point c l p 2 and the auxiliary point a p 1 . This distance can be found by considering the right triangle formed between c l p 2 , a p 1 , and the point marking the end of d 3 . The side opposite to the a p 1 vertex represents the lateral distance traveled throughout the clothoid segment Δ y c l , f = Δ y c l ( τ c l , A ) (see Section 2.4.4). Keeping in mind that the angle opposite to β is also equal to β [27], we can find the d 1 distance considering the right triangle:
d 1 = Δ y c l , f s i n ( β )
In the expressions above, α T is the angle between the legs of the flight plan and the angles β and β ¯ are defined geometrically as:
β = π 2 φ c l
which is obtained from the angle sum of the right triangle defined by a p 1 , c c and the perpendicular intersection to the F R O M T O leg.
β ¯ = π β
which becomes clear when looking at the line connecting the c c and a p 1 points.
The distance d 2 needed in Equation (42) can be further broken down into a sum of d 3 and d 4 . d 3 is a side of the right triangle explored earlier to find d 1 . Since we already have d 1 and we know Δ y c l , f , we can apply the Pythagorean theorem [26] to find d 3 :
d 3 = d 1 2 Δ y c l , f 2
The remaining distance, d 4 is geometrically the distance covered by the clothoid segment along the x-axis. It is therefore:
d 4 = Δ x c l ( τ c l , A ) = Δ x c l , f
We can now substitute Equations (34) and (43)–(45) into Equation (42), as well as d 2 = d 3 + d 4 with d 3 and d 4 given by Equations (48) and (49). Then the resulting expression for d t u r n is:
d t u r n = V T χ ˙ T d + Δ y c l , f sin ( β ) · sin Δ χ T * 2 sin α T 2 + Δ x c l , f + Δ y c l , f sin ( β ) 2 Δ y c l , f 2 = V T χ ˙ T d + Δ y c l , f sin ( β ) · sin Δ χ T * 2 sin α T 2 + Δ x c l , f + Δ y c l , f tan ( β )
Figure 8 shows that the total change in course angle Δ χ T is the sum of the change in course incurred while flying the turn-in, circle, and turn-out segments:
Δ χ T = Δ χ T * + 2 φ c l
If we now replace Δ χ T * with Δ χ T 2 φ c l , β with Equation (46), α T = π Δ χ T and φ c l = τ c l 2 (see Equation (31)) in Equation (50), we obtain an expression for d t u r n which only depends on V T , Δ χ T , χ ˙ T d , Δ x c l , f , Δ y c l , f , and τ c l :
d t u r n = V T χ ˙ T d + Δ y c l , f sin ( π 2 τ c l 2 ) · sin Δ χ T 2 τ c l 2 2 sin π Δ χ T 2 + Δ x c l , f + Δ y c l , f tan ( π 2 τ c l 2 )
The clothoid distances Δ x c l , f = Δ x c l ( τ c l , A ) , Δ y c l , f = Δ y c l ( τ c l , A ) are given by Equation (32), where A, according to (41), only depends on V T , χ ˙ T d , T p , p c m d . Finally, we reformulate τ c l by inserting Equations (34) and (39) into (37):
τ c l = V T t c l 2 V T V T χ ˙ T d t c l = t c l χ ˙ T d 2
With t c l given by Equation (35) and μ c m d by (33), we obtain an expression for τ c l which only depends on p c m d , T p , χ ˙ T d and V T :
τ c l = χ ˙ T d 2 2 T p + arctan V T χ ˙ T d g 0 p c m d
Hence, Equation (52), gives an expression for d t u r n , together with (32), (41), and (54), that only depends on the design parameter χ ˙ T d , and the given fixed parameters V T , Δ χ T , T p , p c m d .

3.1.2. Implementation Considerations

To implement the equations presented in the previous section, we need to start by defining the speed, which is used in the said equations. This is the speed with which the maneuvers are planned. Looking at Equation (34), it is clear that the speed is proportional to the maneuver radius r c . Therefore, the higher the speed, the bigger the maneuver circle will be. This means that, if the turns are planned with a speed lower than the speed of the aircraft, then the turn will not be achievable. On the other hand, if the turn is planned with a higher speed than the aircraft is carrying, the maneuver remains feasible. Therefore it is safer to always plan the maneuvers with a speed that is slightly higher than the predicted speed of the aircraft. This will allow us to implicitly account for wind, which would change the kinematic speed of the aircraft. We can calculate the planning speed as shown in Equation (55) where V T , c m d is the commanded kinematic speed, V T is the kinematic speed of the aircraft, and V b u f f e r is a the safety buffer speed. The buffer is defined from the knowledge of the aircraft and wind speeds in the operational environment.
V p = max V T , c m d , V T + V b u f f e r
Using the planning speed, the calculation process can be summarized as follows:
1.
Calculate the maneuver circle r c using Equation (34), where χ ˙ T d is defined during design.
2.
Calculate the corresponding bank angle μ c m d using Equation (33).
3.
Calculate the clothoid transition time t c l using Equation (35), where p c m d is the maximum achievable roll rate.
4.
Calculate the clothoid shaping parameter A using Equation (40).
5.
Calculate the clothoid running parameter (dimensionless time) τ c l using Equation (37).
6.
Calculate the clothoid displacement Δ x c l ( τ ) , Δ y c l ( τ ) using Equation (32).
7.
Calculate the turn distance d t u r n using Equation (52).
The turn distance is then used to calculate the r c l p 1 position (see Figure 7), which defines the point at which the turn mode is activated.

3.2. Vertical Plane

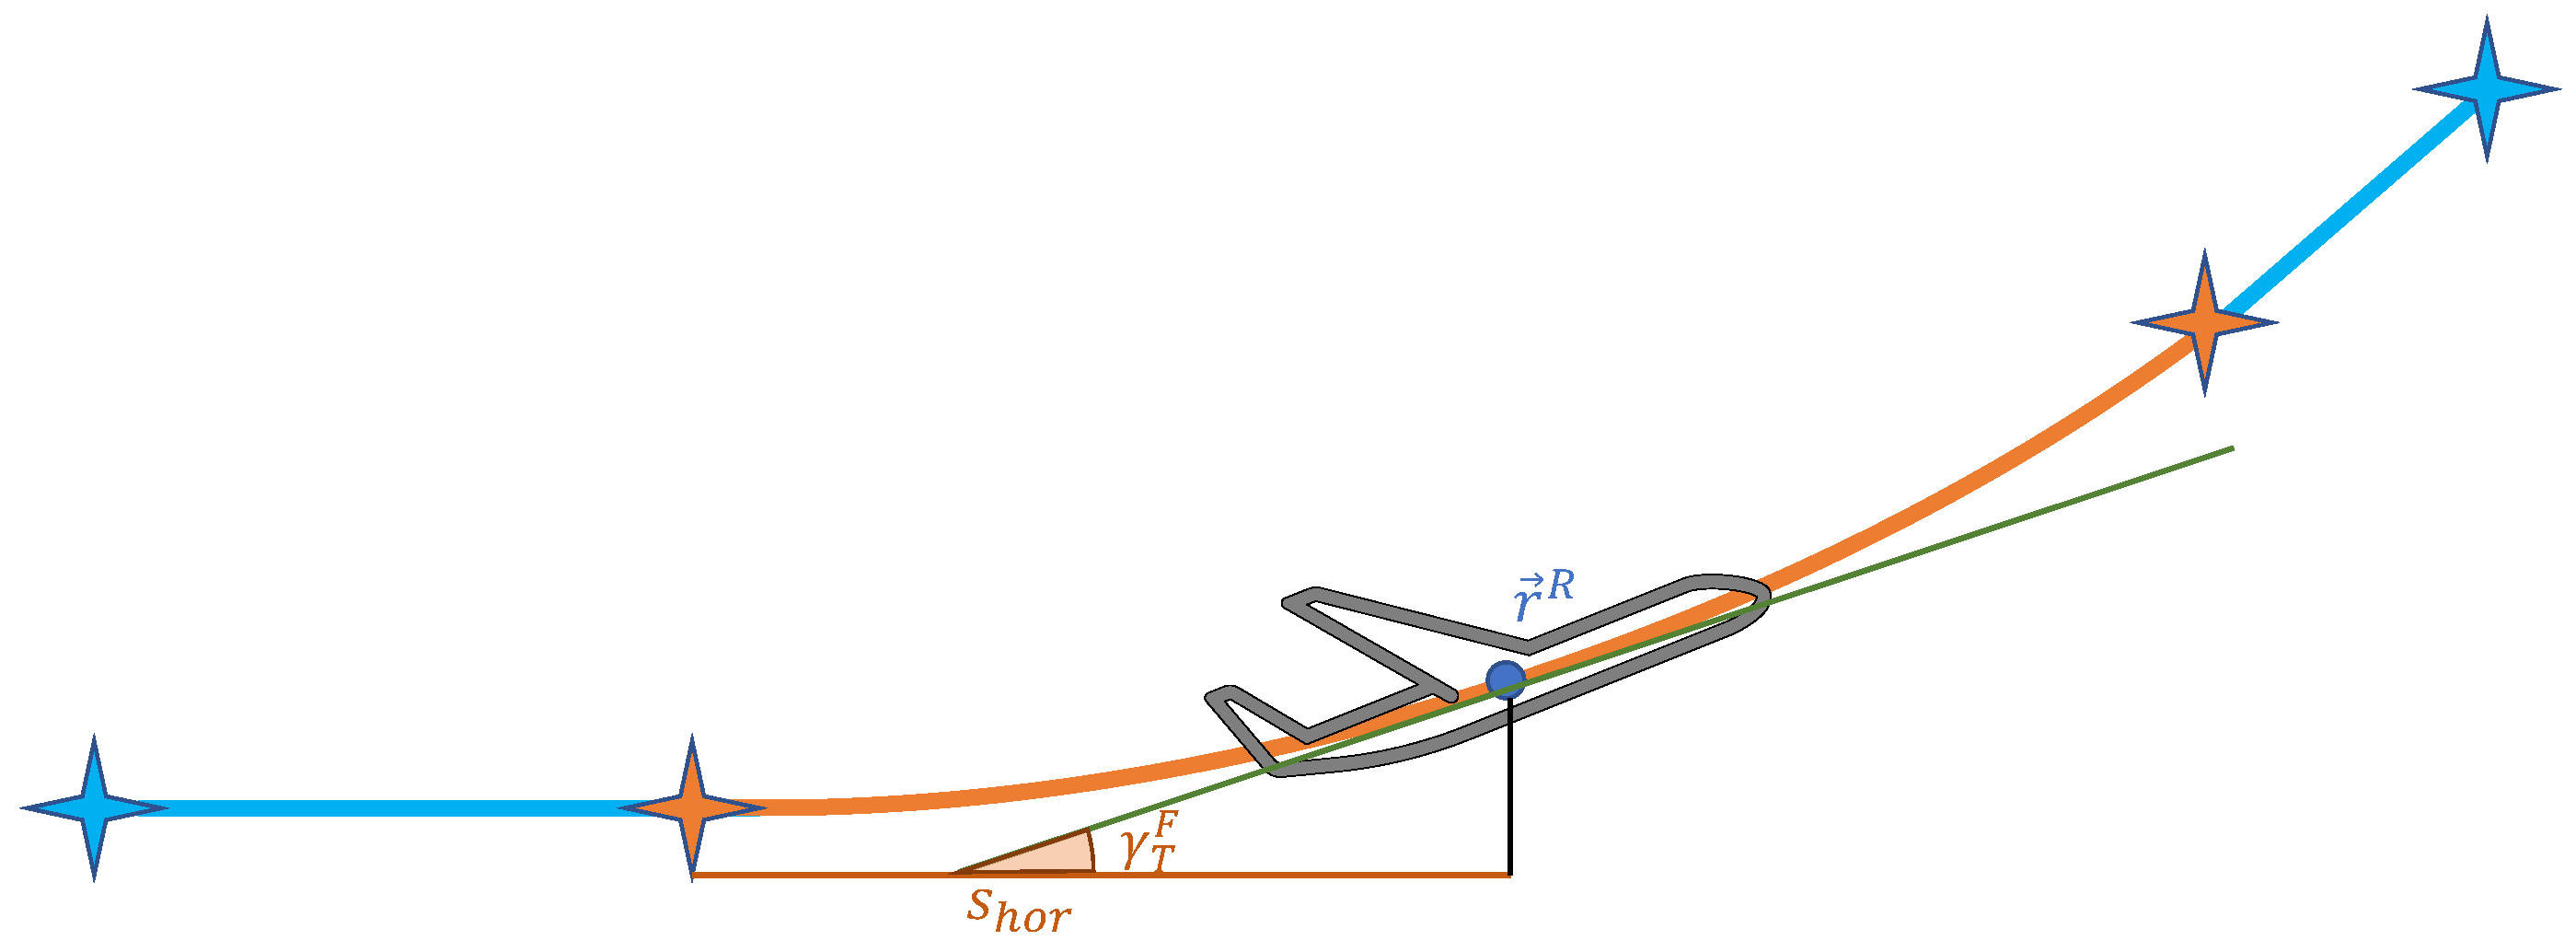
The flyby maneuver in the vertical plane retains the same structure as the horizontal plane. The difference is that the transition segment is made of a higher order polynomial instead of a clothoid section, in order to achieve a higher degree of continuity in the altitude change. These transition segments are used to connect segments of constant altitude with segments of linearly changing altitude as seen in Figure 9 where the linear sections are shown in blue and the polynomial transition section shown in orange. Note that the vertical plane does not consider the aircraft climb performance. It only considers the continuity constraints. It is assumed that the aircraft is able to complete the transition segment within the same duration as the horizontal turn.

3.2.1. Altitude Polynomial Definition

In order to define the polynomial connecting a straight line and circle, we first start by defining the conditions that we want the polynomial to fulfill. The conditions are based on the desired degree of continuity.
We want to have a continuity up to the fourth derivative of the altitude, or C 4 continuity. Therefore we have five conditions for the start of the polynomial, and five conditions for the end. Therefore, we need to have a ninth order polynomial, as it will have 10 coefficients, implying 10 degrees-of-freedom to apply constraints:
h T F s h o r = m = 0 9 a m · s h o r m
where s h o r is the current distance traveled in the horizontal plane.
The next thing we need is the climb angle γ T F along the curve. We start by writing down the expression for the climb angle at any point along a line between two altitudes as:
γ T F s h o r l i n e = arctan Δ h T F s h o r
where Δ h T F / s h o r represents the slope of the line at the s h o r point as seen in Figure 9, assuming that the starting point is defined by s h o r = 0 . Therefore, for the curve, we need to find the slope and take the arctangent of the later.
The slope of a curve is the first derivative of that curve. Therefore, we take the derivative of Equation (56) with respect to s h o r :
h ˙ T F s h o r = m = 1 9 m · a m · s h o r m 1
We then take the arctan of the slope to find the climb angle γ T F :
γ T F s h o r = arctan m = 1 9 m · a m · s h o r m 1
For flight trajectory applications, ref. [15] gives an example table of conditions that need to be satisfied:
In Table 1, s is the running parameter of the polynomial and s = 0 represents the starting point of the polynomial ( P 1 ). In contrast, s t o t , h o r is the total distance expected to be traveled and s = s t o t , h o r represents the end point of the polynomial ( P 2 ).

3.2.2. Polynomial Coefficients

Now that we have defined the general shape of the polynomial and the conditions that it needs to satisfy, we need to find the coefficients of the polynomial. We can do this by building a system of 10 equations, such that each equation satisfies one condition in Table 1 as shown in Equation (60).
h T F s h o r = h T P 1 s h o r = 0 h T F s h o r = h T P 2 s h o r = s t o t , h o r h T F s h o r = tan γ T P 1 s h o r = 0 h T F s h o r = tan γ T P 2 s h o r = s t o t , h o r h T F s h o r = 0 s h o r = 0 h T F s h o r = 0 s h o r = s t o t , h o r h T F s h o r = 0 s h o r = 0 h T F s h o r = 0 s h o r = s t o t , h o r h T F s h o r = 0 s h o r = 0 h T F s h o r = 0 s h o r = s t o t , h o r
The system of equations (60) is not overly difficult to solve because we are guaranteed that at least half of them will be simplified by the fact that they are evaluated at s h o r = 0 . After solving it, we obtain expressions for each of the coefficients, as shown in Table 2. Note that, for readability, the following simplifications are assumed:
  • h T P n h p n ;
  • tan γ T P 1 h b n ;
  • s t o t , h o r s t o t .

4. Trajectory Construction: Flyby Implications for eVTOLs

4.1. Minimum Distance between Waypoints

The developments in [15] are carried out assuming a fixed-wing aircraft. When considering eVTOLs applications, we need to also consider the small flight distances anticipated. Therefore, we need to calculate the minimum distance between waypoints that the trajectory generation system can handle.
When we look at the geometrical construction of the flyby maneuver in Figure 6, we can empirically establish that we need at least the 2 · d t u r n to account for the turn-in section and the turn-out section of the potential flyby we made at the previous waypoint. To explicitly show this, we can consider the flight shown in Figure 10, where we have two flyby transitions at the T O and at the N E X T waypoints.
We see that the distance between the T O and N E X T waypoints needs to necessarily be greater than twice that of the turn distance in case that the heading change and velocity are the same at both waypoints. In practice, the turn distance could be different for the two maneuvers, as it also depends on the angle between the legs α T and the velocity V T at which the legs are flown.
In Section 3 and Section 3.1.1, we derived an expression for the turn distance for the fly-by which depends only on the given fixed parameters V T , Δ χ c l , T p , p c m d and the desired turn rate χ ˙ T d (see Equation (52)). The roll time constant T p and roll rate command p c m d are given by the aircraft performance and inner loop dynamics. Hence, we can summarize: The minimum distance between the waypoints is influenced by
  • Aircraft speed V T : The slower the aircraft, the less distance we need to turn.
  • Desired turn rate χ ˙ T d : The higher the turn rate, the less distance we need to turn.
The speed of the aircraft is given in the flight plan for each leg. That leaves the desired turn rate as the only variable that can be changed during design to minimize the minimum distance between waypoints, which is important for eVTOLs applications. We can now advance the following theorem:
Theorem 1.
For trajectory generation systems designed around a fixed desired turn rate, the minimum distance between waypoints can be reduced by increasing the fixed desired turn rate, so long as it stays within the performance range of the aircraft.

4.2. Maximum Angle α T between Legs

Although this may seem trivial because an angle of α T = 180 between two legs will result in a straight line flight, we will see in this section that α T is actually limited and not allowed to exceed a certain value. Furthermore, we will see that increasing the turn rate as given by Theorem 1 in order to reduce the minimum turn distance will decrease the maximum angle α T allowed between the legs.
When we take a closer look at the geometry of flyby transitions, we see that the total change in course angle Δ χ T is the sum of the change in course incurred while flying the turn-in, circle, and turn-out segments:
Δ χ T = Δ χ T * + 2 φ c l
where φ c l is simply τ c l 2 according to Equation (31) and with τ c l given in Equation (54), φ c l becomes
φ c l = χ ˙ T d 2 2 T p + arctan V T χ ˙ T d g 0 p c m d
As we see, the change in course angle incurred while flying the clothoid segment does not depend on the waypoints or the angle between them. Rather it depends only on the aircraft performance given by T p and p c m d , speed V T , and the desired turn rate χ ˙ T d , which is the only parameter that can be set during design.
This implies that Δ χ T is limited to Δ χ T 2 φ c l in order for Equation (61) to hold true, and only the desired turn rate can be modified in order to affect this limitation. We know that Δ χ T is directly related to the flight plan by Δ χ T = π α T , where α T is the angle between two legs. This means that the limitation applies directly to the angle between legs in the flight plan that the system is able to handle. We can also see this graphically in Figure 8. The total course angle change Δ χ T needs to allow for two transition segments that will have a course angle change of φ c l each, which is independent of the flight plan itself. We can write down the expression for minimum course angle change as:
min Δ χ T = 2 · φ c l = χ ˙ T d 2 T p + arctan V T χ ˙ T d g 0 p c m d
And the maximum angle between two legs in the flight plan is:
max α T = π min Δ χ T
We can now advance the following theorem:
Theorem 2.
For trajectories designed as a combination of straight lines, transition sections, and circular arcs, there is an inherent limitation on the maximum angle between two legs of the flight plan that is independent of the flight plan geometry.
Theorem 2 implies that, if the flight plan has any two legs such that the angle between the legs is a perfect 180 or within some threshold around it, then the two legs will be treated as a straight line. If, however, the angle is in the range [ max α T , 180 ) , i.e., above its limit value, then the angle required by the turn-in and turn-out, i.e., 2 φ c l , will be larger than the Δ χ T that is specified in the flight plan. This would lead to a maneuver that is not feasible considering Equation (61), as well as Figure 8, and that Δ χ T * 0 . Hence, such a situation needs to be inhibited as it results in a non-deterministic behavior. This can be achieved by making the desired turn rate dynamic, depending on the required α T .

4.2.1. Making the Turn Rate Dynamic

Theorem 1 shows that, in order to decrease the minimum distance between waypoints, which is important for eVTOL aircraft, we need to increase the desired turn rate. Hence, we need to choose the desired turn rate such that it allows us to meet the required minimum distances between waypoints, so long as it is within the performance range of the aircraft.
When we look at Theorem 2 and Equation (63), we notice that there is a limitation on the maximum angle between legs and it not only depends on the performance of the aircraft, but also on the desired turn rate. The higher the turn rate, the lower the maximum angle allowed between two legs. Equation (63) shows that, in order to increase the allowed α T , m a x we need to decrease the desired turn rate. Hence, the initial choice of the desired turn rate, which fulfills the minimum distance requirement assumed during planning, would lead to overly restrictive allowed values for α T .
We can overcome this apparent contradiction by making the desired turn rate dynamic, i.e., in the case that the desired α T given by the planned waypoints, exceeds α T , m a x the turn rate will be decreased such that the resulting α T , m a x allows for the desired α T . Of course this will again increase the turn distance d t u r n required to accomplish the maneuver, and it needs to be confirmed that it does not exceed the available distance between the two waypoints. Section 4.2.2 will address this topic. For now, in order to calculate the required turn rate to obtain the desired α T , m a x value, Equation (63) needs to be solved for χ ˙ T d . Looking at the equation, it is apparent that it cannot be solved analytically, because the variable of interest, i.e., χ ˙ T d , is both inside and outside an arctan function. This makes the equation transcendental. We therefore need to find an approximation for the arctangent function, which allows us to solve (63) for χ ˙ T d .
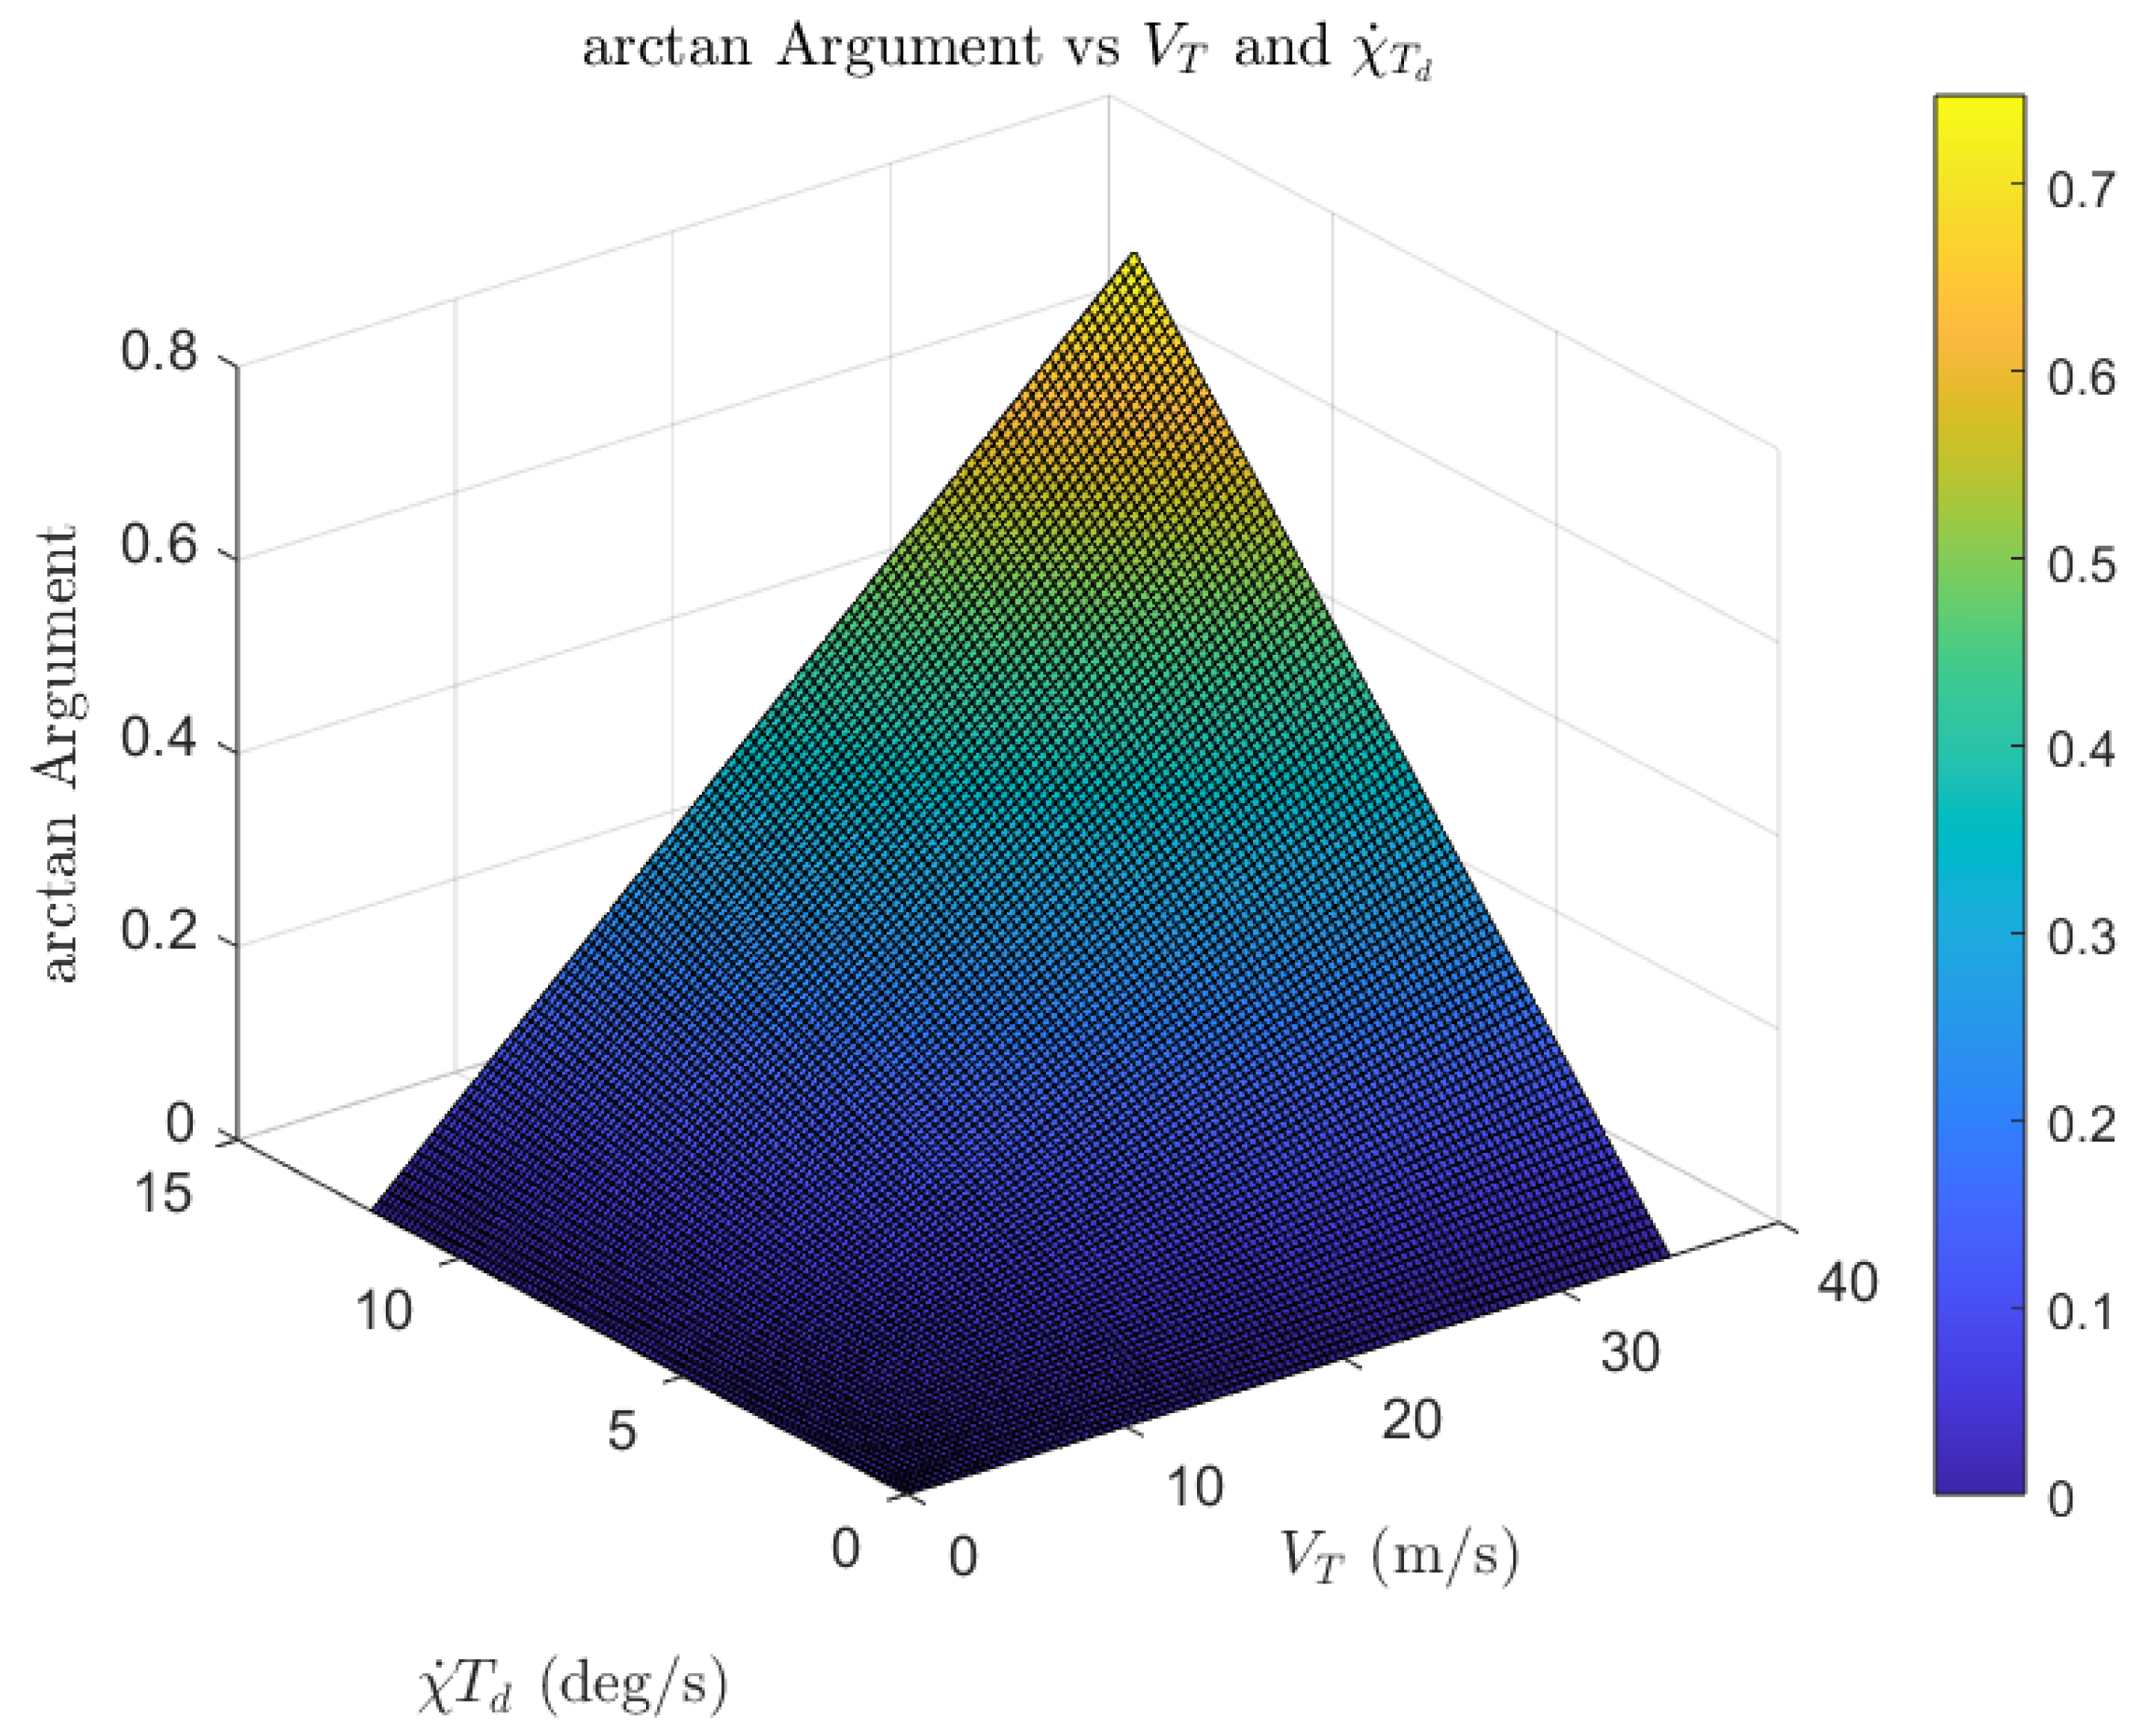
There are several known approximations for the arctangent function with different levels of accuracy. The first step in choosing an approximation is to define the magnitude of the arctan argument. And this is application dependent. Figure 11 shows the magnitude of the arctan function argument, i.e., V T χ ˙ T d / g 0 , for the typical range of motion of eVTOL aircraft, where the maximum velocity is 30 m/s and the maximum turn rate is 12 d e g / s based on experimental data. As we can see, the argument remains strictly positive, and reaches a maximum of 0.8 .
We also have to keep in mind that Equation (63) has a product between the χ ˙ T d outside the arctan function and inside. Therefore, the equation that needs to be solved after substituting the arctan will have an order n + 1 , where n is the order of the approximation. This makes the Taylor series approximations of order n > 2 unlikely candidates as the resulting equation becomes too complex.
Figure 11. Typical arctan argument for eVTOL aircraft (see Equation (63)).
Aerospace 11 00157 g011
Another promising arctan approximation is:
t ( x ) = x 1 + b x 2
where b is a tuning parameter. This function is a particularly good candidate because it has a low order and has the same shape as the arctan function. It is, however, overly complicated for our use case, as the argument of the function is strictly positive and no larger than 0.8 , and the approximation leads to a third-order equation whose solution is not trivial. Therefore, we instead choose to approximate it with a line fitted to minimize the mean squared error. Figure 12 shows a comparison between the actual function and the approximation, where b 0 = 0.89813 is the tuning parameter.
Substituting the approximation into Equation (63), and replacing max ( α T ) with the desired angle α T , d , we can solve for χ ˙ d :
χ ˙ T d = g 0 p c m d g 0 p c m d T p 2 + π α T , d V T b o T p g 0 p c m d V T b o g 0 p c m d g 0 p c m d T p 2 + π α T , d V T b o + T p g 0 p c m d V T b o
The χ ˙ d computed here is used for the planning of the maneuver as shown in Section 3, and is defined to be strictly positive. Therefore, we take the solution which is positive:
χ ˙ T d = g 0 p c m d g 0 p c m d T p 2 + π α T , d V T b o T p g 0 p c m d V T b o
Proof. 
Validity of Equation (67): Since the denominator V T b o is positive, we can show that (67) is positive by showing that
g 0 p c m d g 0 p c m d T p 2 + π α T , d V T b o > T p g 0 p c m d
Because both terms under the square root are greater than zero: T p 2 g 0 2 p c m d 2 > 0 as well as g 0 p c m d π α T , d V T b 0 > 0 , the square root of their sum will also be greater than zero: T p 2 g 0 2 p c m d 2 + g 0 p c m d π α T , d V T b 0 > 0 . Because, additionally, T p g 0 p c m d > 0 holds, the inequality in (68) can be proven to hold true by showing that the inequality holds for the squared values of both sides:
T p 2 g 0 2 p c m d 2 + g 0 p c m d π α T , d V T b 0 > T p 2 g 0 2 p c m d 2
which is the case because the left part of the inequality is a sum of the right part and some other positive expression. Therefore, the left part is always greater than the right part, making the expression under (67) strictly positive.
Another thing to consider is that Equation (67) gives the expression for the maximum χ ˙ d that we can have in order to be able to perform a flyby with a specified or desired angle α T , d between the legs. We can take a value that is 10 % lower as a safety margin. We then obtain the final expression for χ ˙ d :
χ ˙ T d = 0.9 g 0 p c m d g 0 p c m d T p 2 + π α T , d V T b o T p g 0 p c m d V T b o

4.2.2. Integrating the Dynamic Turn Rate

Now that we have derived the expression for the desired turn rate as a function of the desired angle between legs, we need to integrate it into the system as a whole, while still applying Theorem 1, i.e., making sure that the minimum distance required for the flyby, which results from the applied turn rate, does not exceed the available distance between the planned waypoints. We can perform this as shown in Figure 13. Note that the algorithm in Figure 13 only terminates when the trajectory generation module terminates. Therefore, there is no termination link depicted.
When there is an upcoming flyby maneuver, we check whether the design-fixed turn rate results in a max ( α T ) that is large enough to encompass the required α T , d of the flyby. If this is the case, then we continue with the maneuver planning.
If, however, max ( α T ) < α T , d , then we use Equation (70) to calculate a new χ ˙ T d , which is then used only for the upcoming maneuver. As mentioned earlier, decreasing the desired turn rate increases the turn distance needed for the maneuver. This is an inherent limitation of the trajectory-generation concept, which cannot handle arbitrarily small distances between waypoints. We therefore need to ensure that the maneuver remains feasible when we decrease the turn rate. This is performed in the mission management when the flight plan is uploaded. The mission management, including the feasibility checks, is described in detail in [28].
Figure 13. Integrating dynamic turn rate.
Aerospace 11 00157 g013
In this section we conducted an analysis of the flyby geometry and exposed some limitations to the construction of trajectories as a combination of the straight lines, transition segments, and circular arcs, with a fixed design turn rate. For eVTOL aircraft, the applications typically require short distances between waypoints. We showed that this distance is limited by the distance required to make turns. One way to decrease the turn distance is to increase the turn rate. For fixed-wing aircraft, it is general practice to use a standard turn rate of 3 d e g / s . However, eVTOL aircraft can achieve much higher turn rates. Therefore we recommended using the highest turn rate achievable by the aircraft. Another thing that the analysis revealed is that the higher turn rate will introduce a limitation to the maximum angle allowed between two legs in the flight plan. We suggested making the turn rate dynamic in order to alleviate this limitation. A more detailed discussion of this analysis and implications is presented in the next section.

5. Consolidation and Results

In Section 2 we introduced the preliminaries of trajectory generation, which can be summarized as follows:
Following the proof in [14], it is common practice to build up trajectories for flying vehicles moving by combining straight lines and circular arcs, to make the so-called Dubins paths [29,30]. One problem that arises with Dubins paths is that connecting straight lines and circular arcs lead to a step in the curvature of the trajectory. As shown in Section 3.1, the step in curvature can be explained physically as an instantaneous step in the required kinematic bank angle of the aircraft. One solution to the curvature step problem is to use transition segments. These segments are typically high-order polynomials such as Bezier curves [31], or other types of cubic splines [32]. In this paper we used the clothoid approach presented in [11].
Regardless of the type of transition segment used, it is needed to accomplish one task; that is, to build up the bank angle of the aircraft. Equation (35) shows an approximation of the time it would take an aircraft to build up a certain bank angle, given the performance of the aircraft, as reflected through the roll time constant ( T p ) and the roll rate command ( p c m d ). The roll rate command described here is usually the maximum roll rate that the aircraft can achieve. The geometrical length of the transition segment, which is the clothoid in our case, is such that the initial point has the curvature of 0, and the end point has the curvature of the maneuver circle whose radius is calculated with Equation (34).
In Section 3.1 we go through the derivation of the connection between the time it takes the aircraft to bank, and the clothoid shaping parameter A. This results in Equation (41). And, as shown in Figure 5, the shaping parameter A controls the rate of growth of the clothoid. This means that we have established a direct relationship between the aircraft performance and the physical space occupied by the transition segment. This relationship is important because the implications apply regardless of the type of transition segment used. One of those implications is the turn distance as introduced in Section 3.1.1.

5.1. Turn Distance

The expression of Equation (50) shows that, in addition to the angle between the legs, the turn distance is also, and mainly, affected by the speed, V, turn rate, χ ˙ T d and Δ x c l , f , and Δ y c l , f , which indirectly represent the aircraft’s performance as they are the distances occupied by the transition segment.
The turn distance is important because it controls how far apart two successive waypoints need to be. Because, as shown in Section 4.1, we need to account for the turn distance at the previous waypoint, and the turn distance at the upcoming waypoint. This defines the minimum distance that can be between waypoints. This is particularly important for eVTOL aircraft as they are typically intended to fly short distances. And what we see here is that there is an inherently lower limit on the distance that can be between waypoints. And this minimum distance is mainly dependent on the performance of the aircraft.
To see this implication in detail, let us take an example of a hypothetical aircraft configuration defined by:
  • Roll rate command: p c m d = 30
  • Roll time constant: T p = 0.5 s
  • Design turn rate: χ ˙ T d = 10 / s
The value of the design turn rate χ ˙ T d is chosen to be close to the maximum achievable by the aircraft following Theorem 1 which says that the turn distance d t u r n can be decreased by increasing the design turn rate.
We can start by looking at how d t u r n varies with the angle between the legs and the velocity.
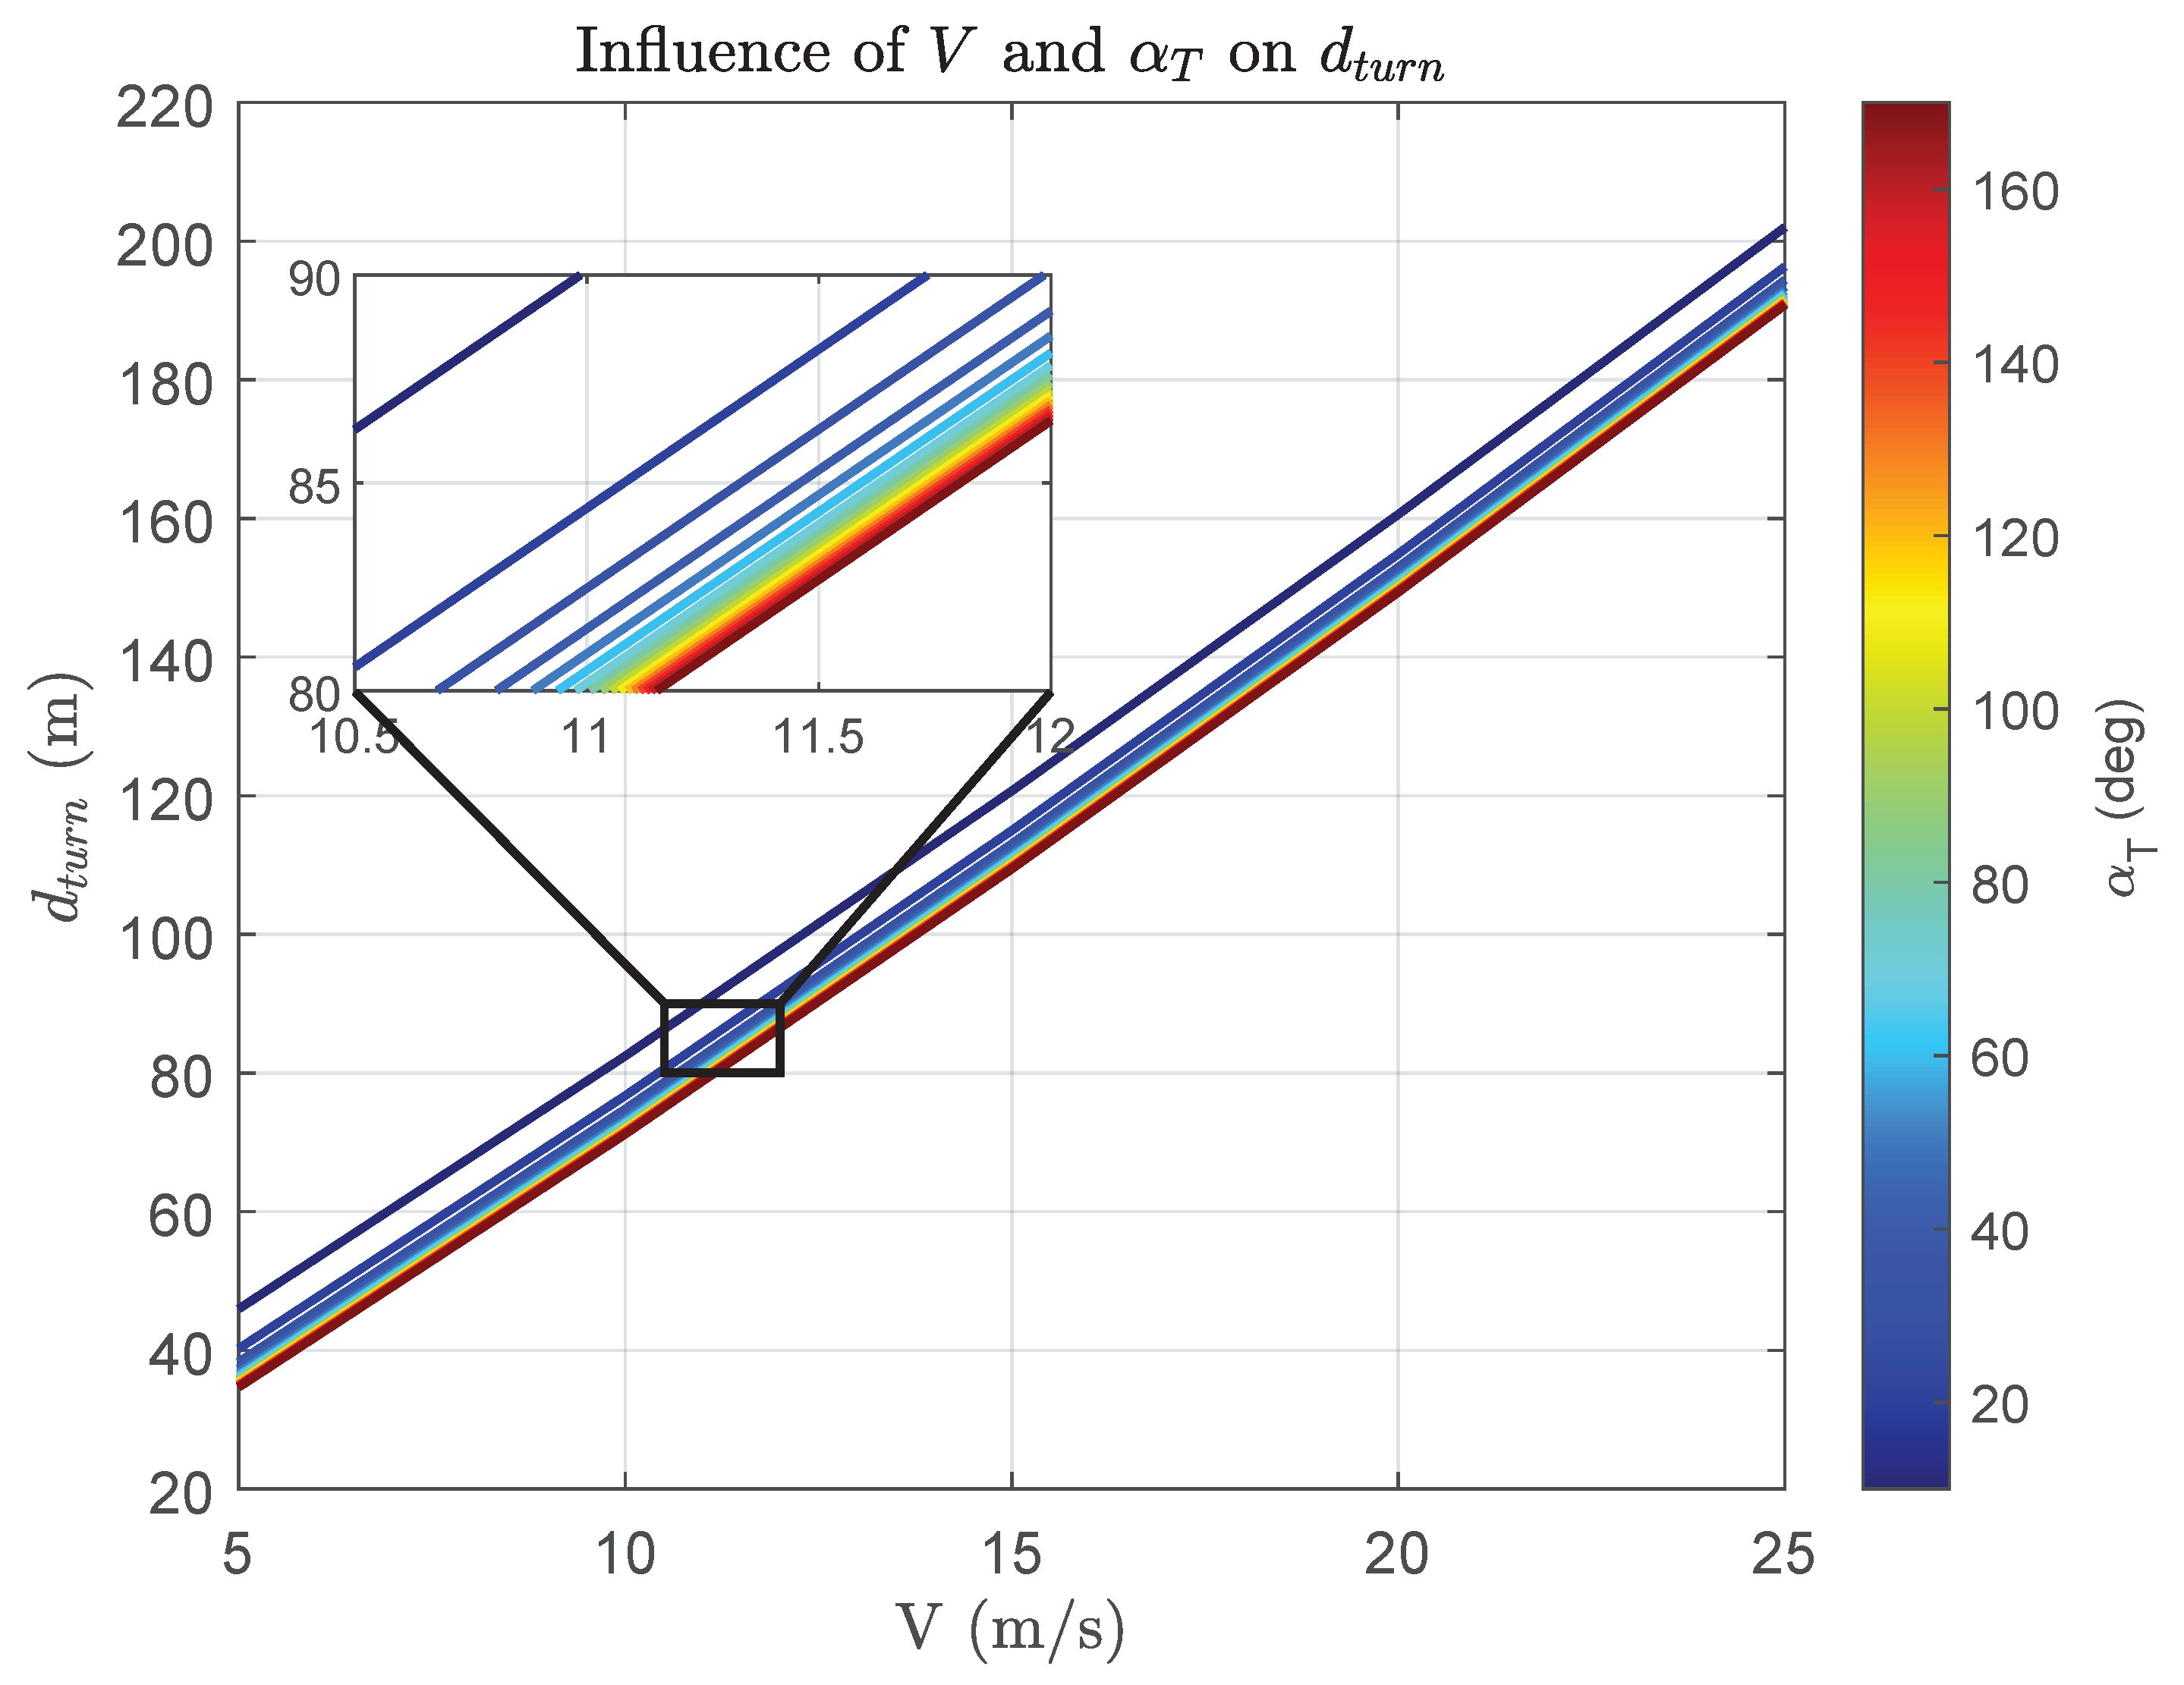
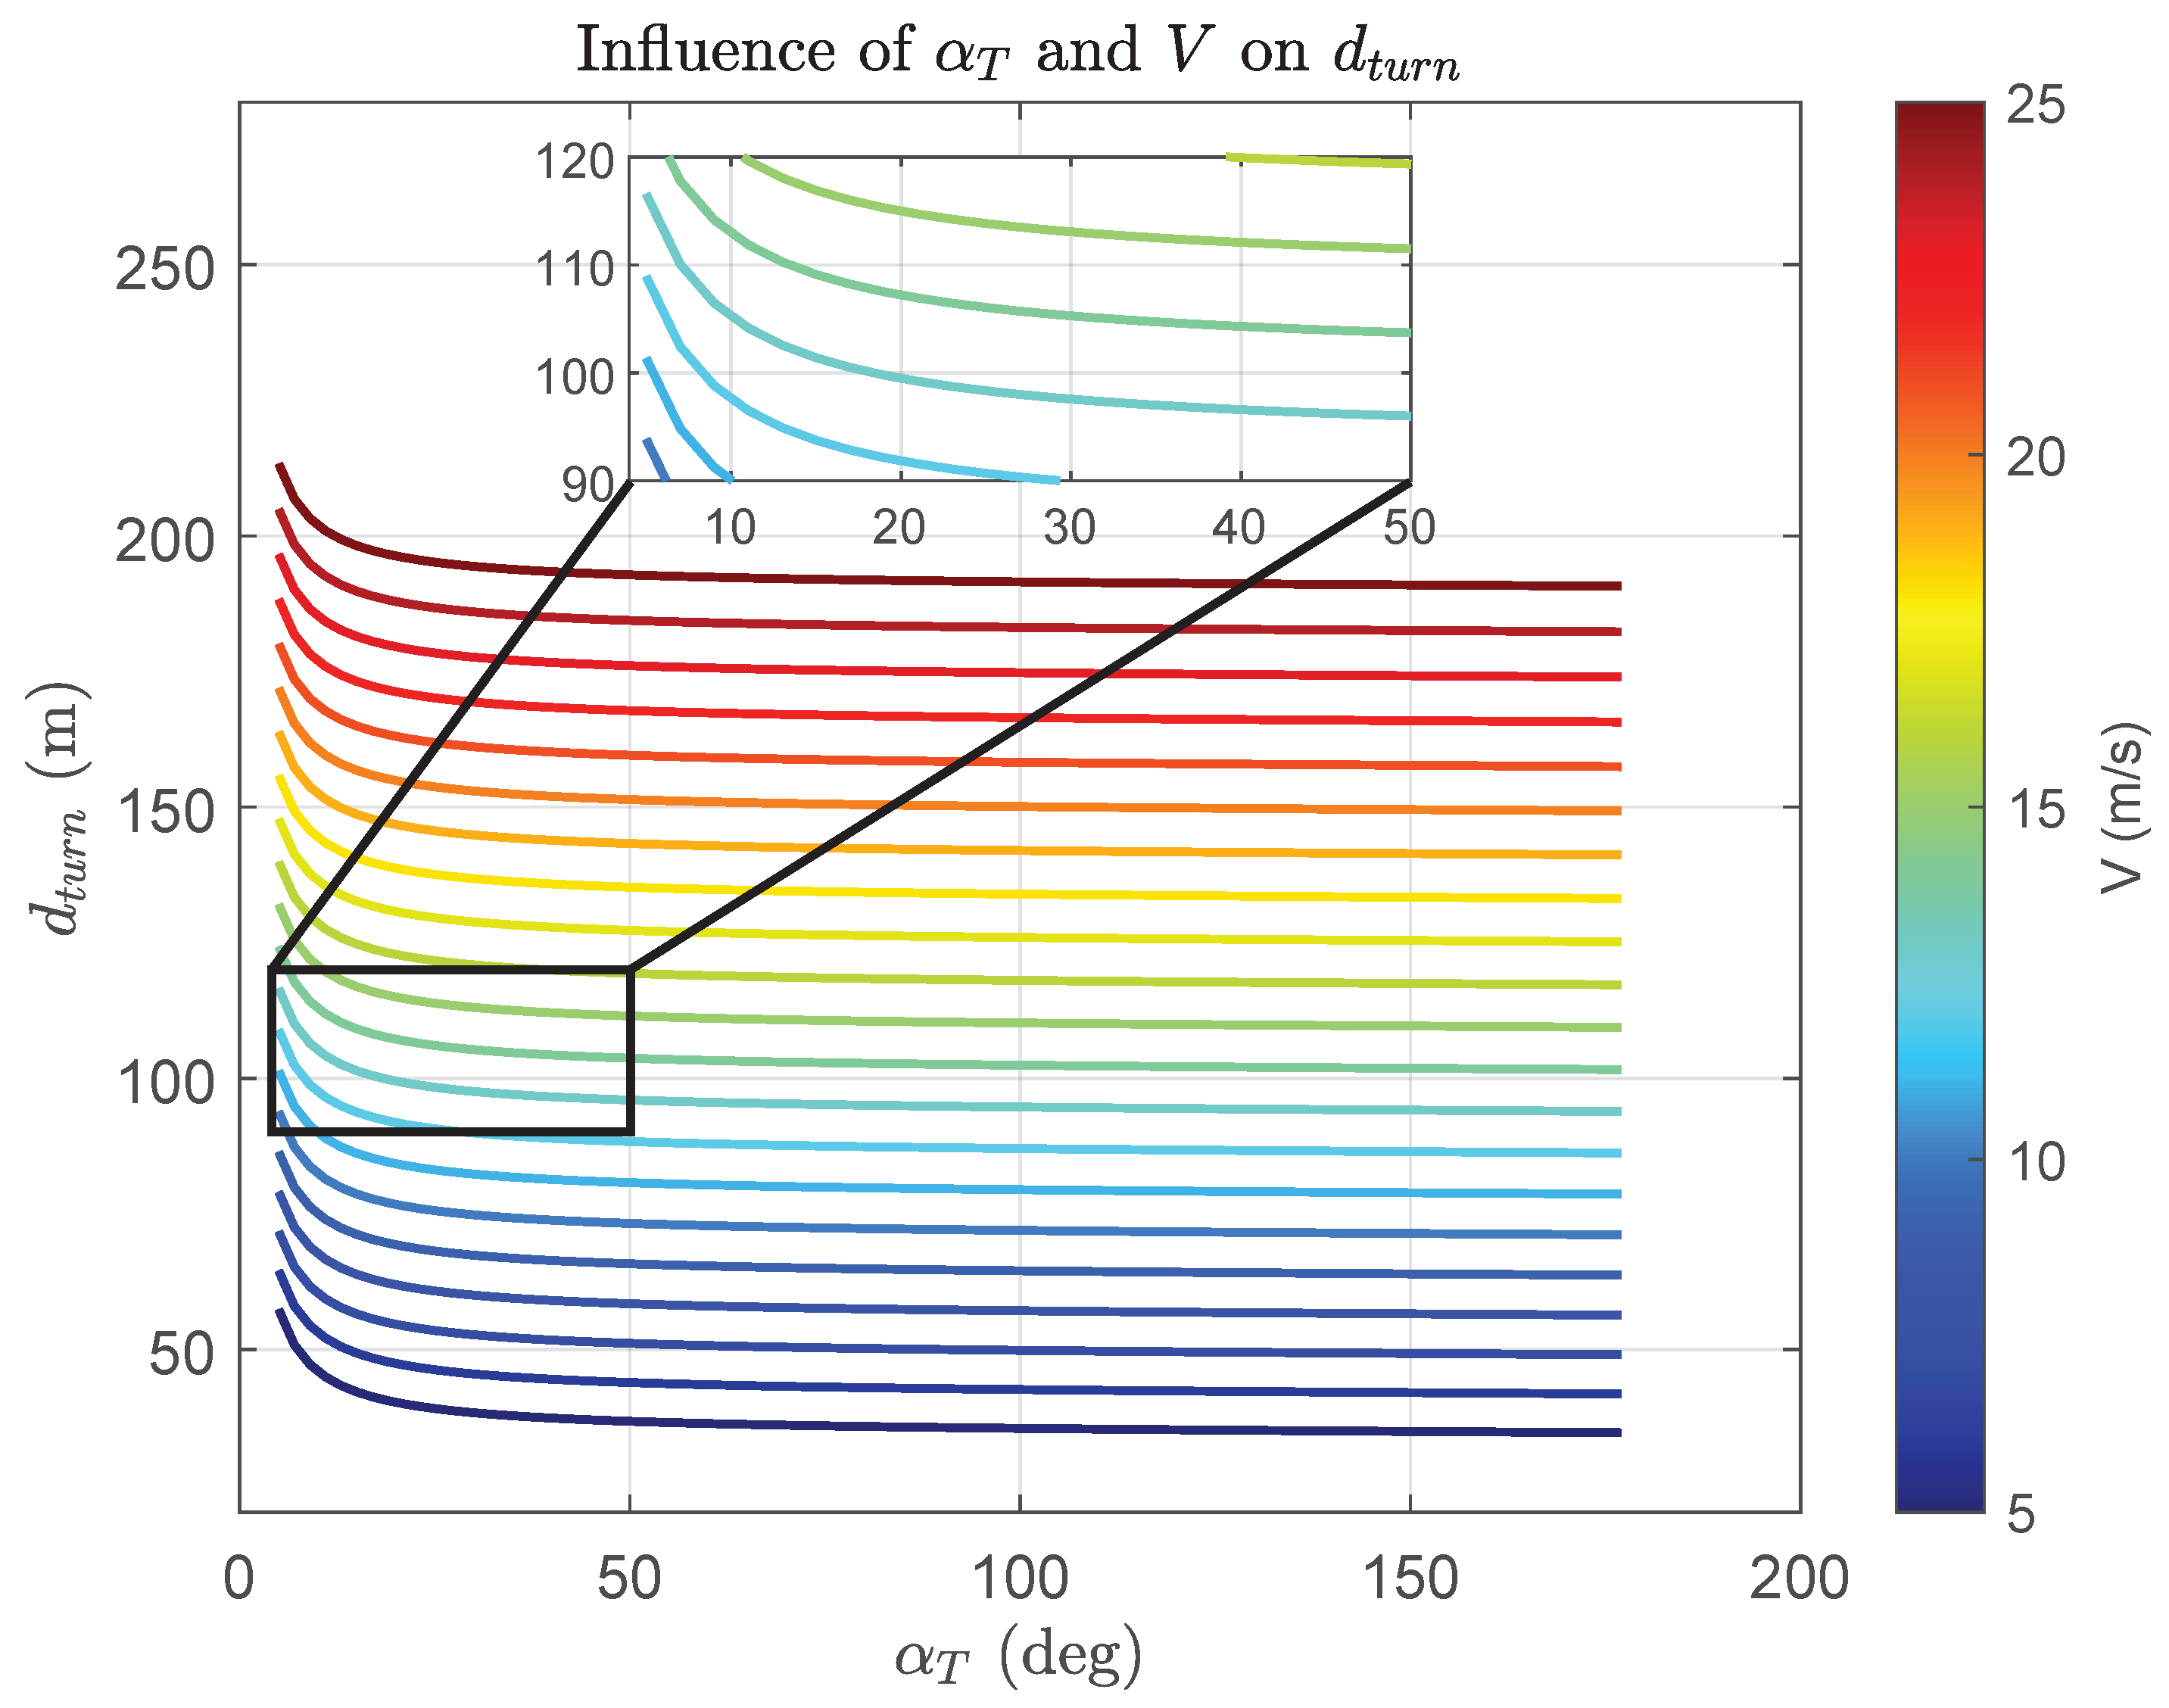
In Figure 14 we can see that there is a linear relationship between d t u r n and the velocity V. The higher the velocity, the more distance we need to turn, and by implication, the more distance we need between waypoints. The same Figure also shows a nonlinear dependency of d t u r n on the angle between legs α T , shown by the different color. This is better shown in Figure 15.
Note that the angle α T was chosen to be only up to 177 . This is because there is a margin of 3 around the 180 line to account for small errors when building a flight plan and placing waypoints in a straight line.
What we see in Figure 15 is that, for values of α T lower than a certain threshold, which can be put around 30 to 40 degrees, there is a a slightly sharp increase in the d t u r n . However, as α T start increasing, the turn distance stays almost constant, reflecting the same thing seen in Figure 14. Therefore, in the implementation of the trajectory generation system, the angle between legs of the flight plan for a flyby is limited to 30 to avoid the region of large turn distances.
Another thing that we notice both in Figure 14 and Figure 15 is that the turn distance is heavily influenced by the velocity. So, a possible way to decrease d t u r n would be to decrease the velocity. But the velocity is given as part of the flight plan as an attribute of each leg. Although this possibility is certainly feasible, it begs several questions, such as, at what point does the aircraft need to start slowing down? If the velocity is to be reduced right before the turn, then the problem becomes vaguely defined, because, as we see in Equation (50), the turn distance does depend on the velocity as well. The turn will start when the aircraft reaches the r c l p 1 point from Figure 7. This point is calculated as the point at d t u r n distance from the T O waypoint. Therefore, the velocity is very much needed in the planning of maneuvers, which happens before the maneuver occurs.
Figure 14. Influence of V and α T on d t u r n .
Aerospace 11 00157 g014
Another problem with reducing the velocity is the energy loss that will occur while decelerating and accelerating the aircraft again. Especially if the reason driving the need to reduce the speed is to reduce the turn distance, which will reduce the minimum distance between waypoints. It certainly means that there is a short distance between waypoints, and we might need to start decelerating again as soon as we finish the acceleration at the previous waypoint. We then end up in a vicious circle of accelerations and decelerations, which also defeats the whole purpose of having a velocity assigned to the leg in the flight plan.
It is worth noting that, although the argument above seems to show all the reasons not to try to change the speed assigned in the flight plan in an online trajectory generation system, it is certainly not intended to deter the reader from considering this approach. It is an approach that might work, if considered thoroughly, in addition to a consideration of the regulations over speed changes in the type of airspace where the system is intended to operate.
The solution presented in this paper, to reduce turn distances, and by implication the minimum distance between waypoints, is to simplify increasing the turn rate, as reflected in Theorem 1. The influence of the turn rate is shown in Figure 16 where the black arrow show indicates the increasing velocity.
As we see in Figure 16, the turn distance can be decreased considerably by increasing the turn rate χ ˙ T d . But this effect is only considerable up to a certain value where the influence on d t u r n becomes constant. Additionally, in the same Figure, we see the inconsiderable effect of the angle between the legs in the flight plan, and we see the d t u r n lines being shifted upwards as the velocity increases.
Here, it is also worth mentioning that Theorem 1 is not meant to mean that we need to go to the maximum achievable turn rate. We need to consider Equation (33) which shows that, for different velocities, the turn rate can result in different bank angles. We therefore need to consider the maximum allowed bank angle for the specific type of aircraft and type of intended operations when deciding on the the design turn rate to set in the trajectory generation system.
Figure 15. Influence of α T and V on d t u r n .
Aerospace 11 00157 g015
Another implication of the flyby geometrical construction is the maximum angle allowed between legs α T , as presented in Section 4.2.
Figure 16. Influence of χ ˙ T d , α T and V on d t u r n .
Aerospace 11 00157 g016

5.2. Maximum Angle between Legs

As shown in Section 4.2, when we go away from Dubins paths and add transition segments to connect straight lines and circular arcs, there is a limitation that gets introduced to the angle between the legs of the flight that the system is able to handle with deterministic behavior. This limitation comes directly from the geometrical construction of the maneuver, and is influenced directly by the performance of the aircraft. As we see in Figure 8, there is a course angle change ϕ c l incurred while flying the turn-in transition segment, and another ϕ c l during the turn-out.
As we established earlier, the transition segment depends on the performance of the aircraft. Therefore, it is evident that the course angle incurred during the transition segment also depends on the aircraft performance. This is reflected in Equation (62), where we only see the turn rate, the roll time constant, the roll rate command, and the velocity. This means that, for the typical trajectory generation systems that are designed with a fixed turn rate χ ˙ T d , the ϕ c l angle will always be the same for a given velocity, regardless of the total course angle change Δ χ required at one waypoint or another. The implication is that Equation (61) needs to always hold true, such that we are always able to make a turn-in, reach a nominal bank angle, and then a turn-out. For the user of the system, it means that there is an inherent maximum allowed angle α T between two legs in the flight plan for the maneuver to be feasible.
Unsurprisingly, the solution to mitigate this limitation is to reduce the turn rate as shown in Section 4.2.1. This solution works because, as Equation (33) shows, the turn rate defines the bank angle. And we are simply saying that we do not always want to go to the maximum bank angle (defined by the design turn rate). Sometimes, when the angle between the legs is large, i.e., the change in course that we need to perform is small, we can carry out the maneuver with a smaller bank angle, and by implication, a smaller turn rate. By reducing the turn rate, the maneuver circle becomes larger (see Equation (34)). As the circle becomes larger, the curvature becomes smaller (see Equation (19)). To satisfy Equation (38) with the new curvature, the arc length of the clothoid decreases, which also, via Equation (31), decreases the course angle change incurred during the transition segment (This can also be seen graphically in Figure 8). And this makes Equation (61) valid again, making the maneuver feasible.
The expression for the turn rate as a function of the angle α T is shown in Equation (70). It is worth noting that this expression is not universally applicable. As shown in Section 4.2.1, Equation (70) is obtained by solving Equation (63) for χ ˙ T d . To reach the solution, the arctan function was approximated with a straight line. This approximation was accepted as being valid because, for the use case in this paper, the argument of the arctan function, i.e., V T χ ˙ T d / g 0 , reaches a maximum of 0.8 as shown in Figure 11. Therefore, the straight line approximation was valid (see (Figure 12)). For another application, this approximation might need to be replaced with one that is more accurate, and the expression in Equation (70) would be invalid. It would then need to be obtained again by solving Equation (63) with the new arctan approximation.
To see the effects of the other variables on the maximum allowed angle between legs, we can start by looking at Figure 17.
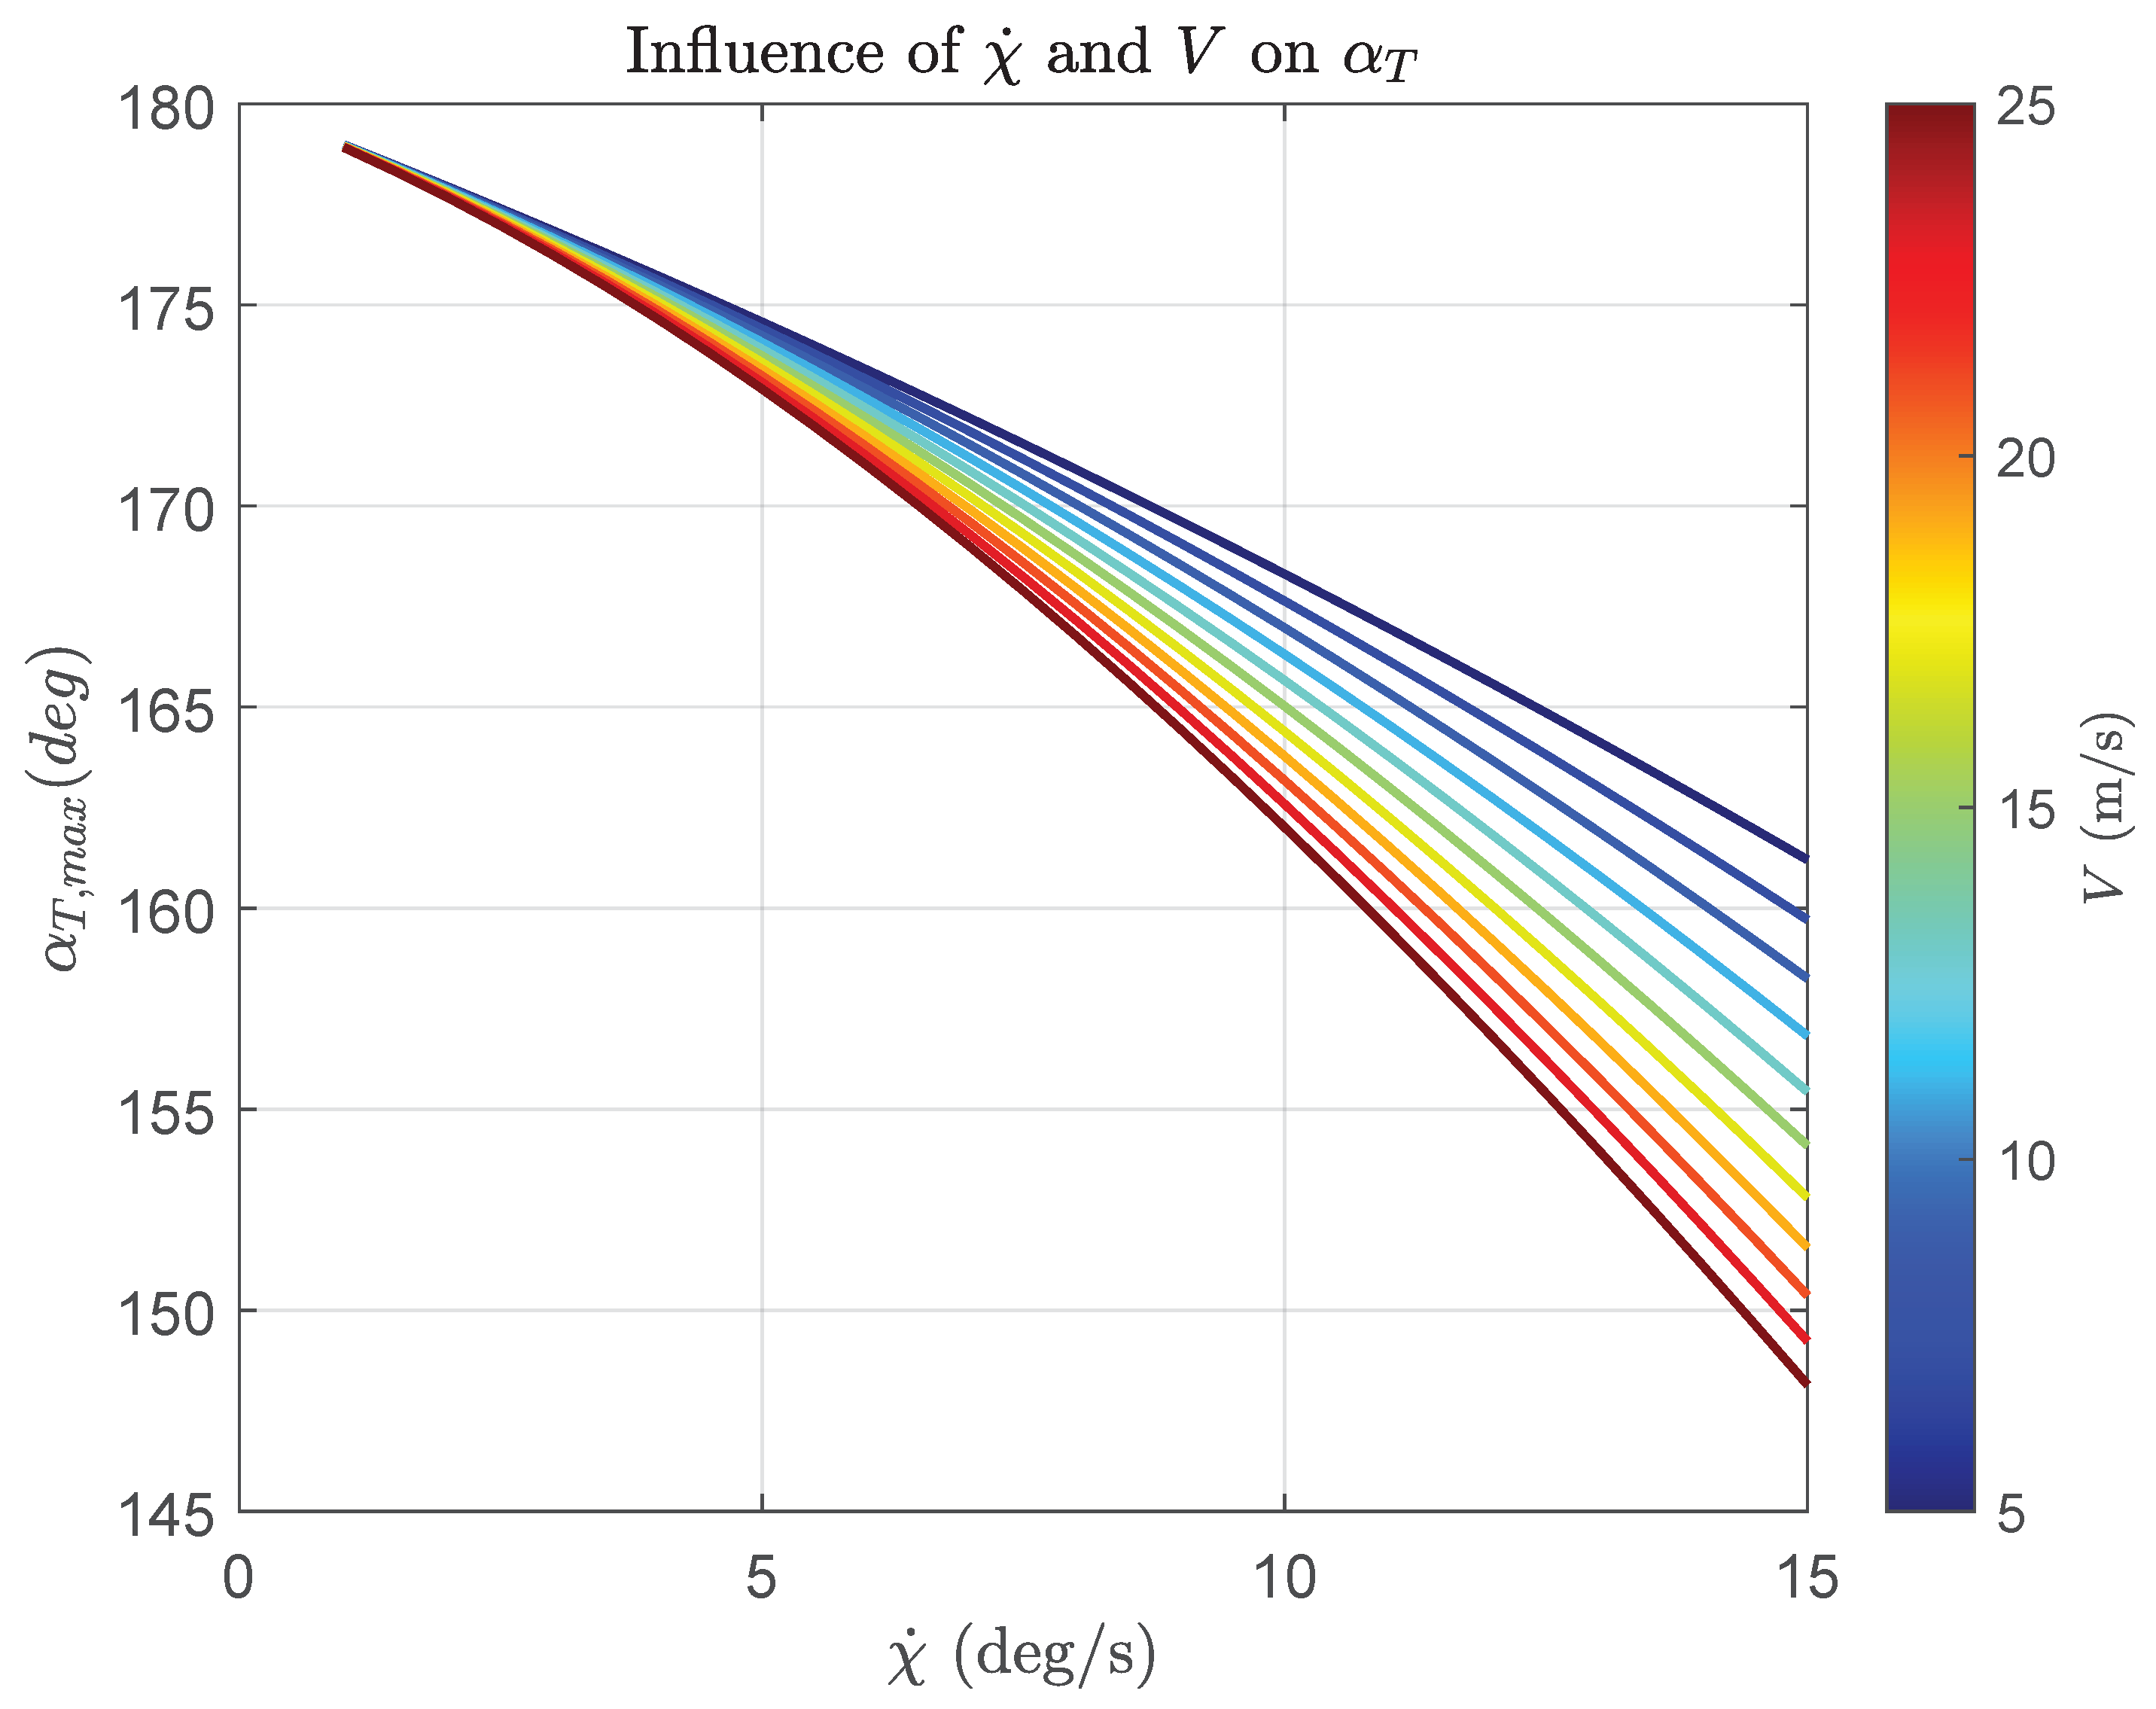
We see in Figure 17 that, as we decrease χ ˙ T d , the lines of max ( α T ) start converging towards 180 for all the velocities shown in Section 4.2.1. We can see this clearly also in Figure 18, where max ( α T ) becomes practically constant, around 180 , over the change in velocity, for lower turn rates.
Hence, if the α T of the two given legs of the flight plan is higher than our max ( α T ) with the design χ ˙ T d , then we can decrease χ ˙ T d , such that the resulting max ( α T ) is larger or equal to the desired α T . This is shown in Figure 13.
Although this seems to solve all our problems, there is a catch. Looking at Figure 16, we see that decreasing the turn rate results in a higher turn distance d t u r n . And we run the risk of requesting a χ ˙ T d which results in a d t u r n higher than the distance between the waypoints. For the category of trajectory generation systems considered here there is just no way around this apparent contradiction. Therefore, it is mandatory to have a trajectory verification module that includes all the calculations presented in this paper among other things, in order to check the feasibility of the flight plan when uploaded. The flight plan will be sent to the trajectory generation system only if it is feasible [28].
Figure 17. Influence of χ ˙ T d , and V on max ( α T ) .
Aerospace 11 00157 g017
Figure 18. Influence of V and χ ˙ T d on max ( α T ) .
Aerospace 11 00157 g018

5.3. Simulation Results

5.3.1. Testing Environment Overview
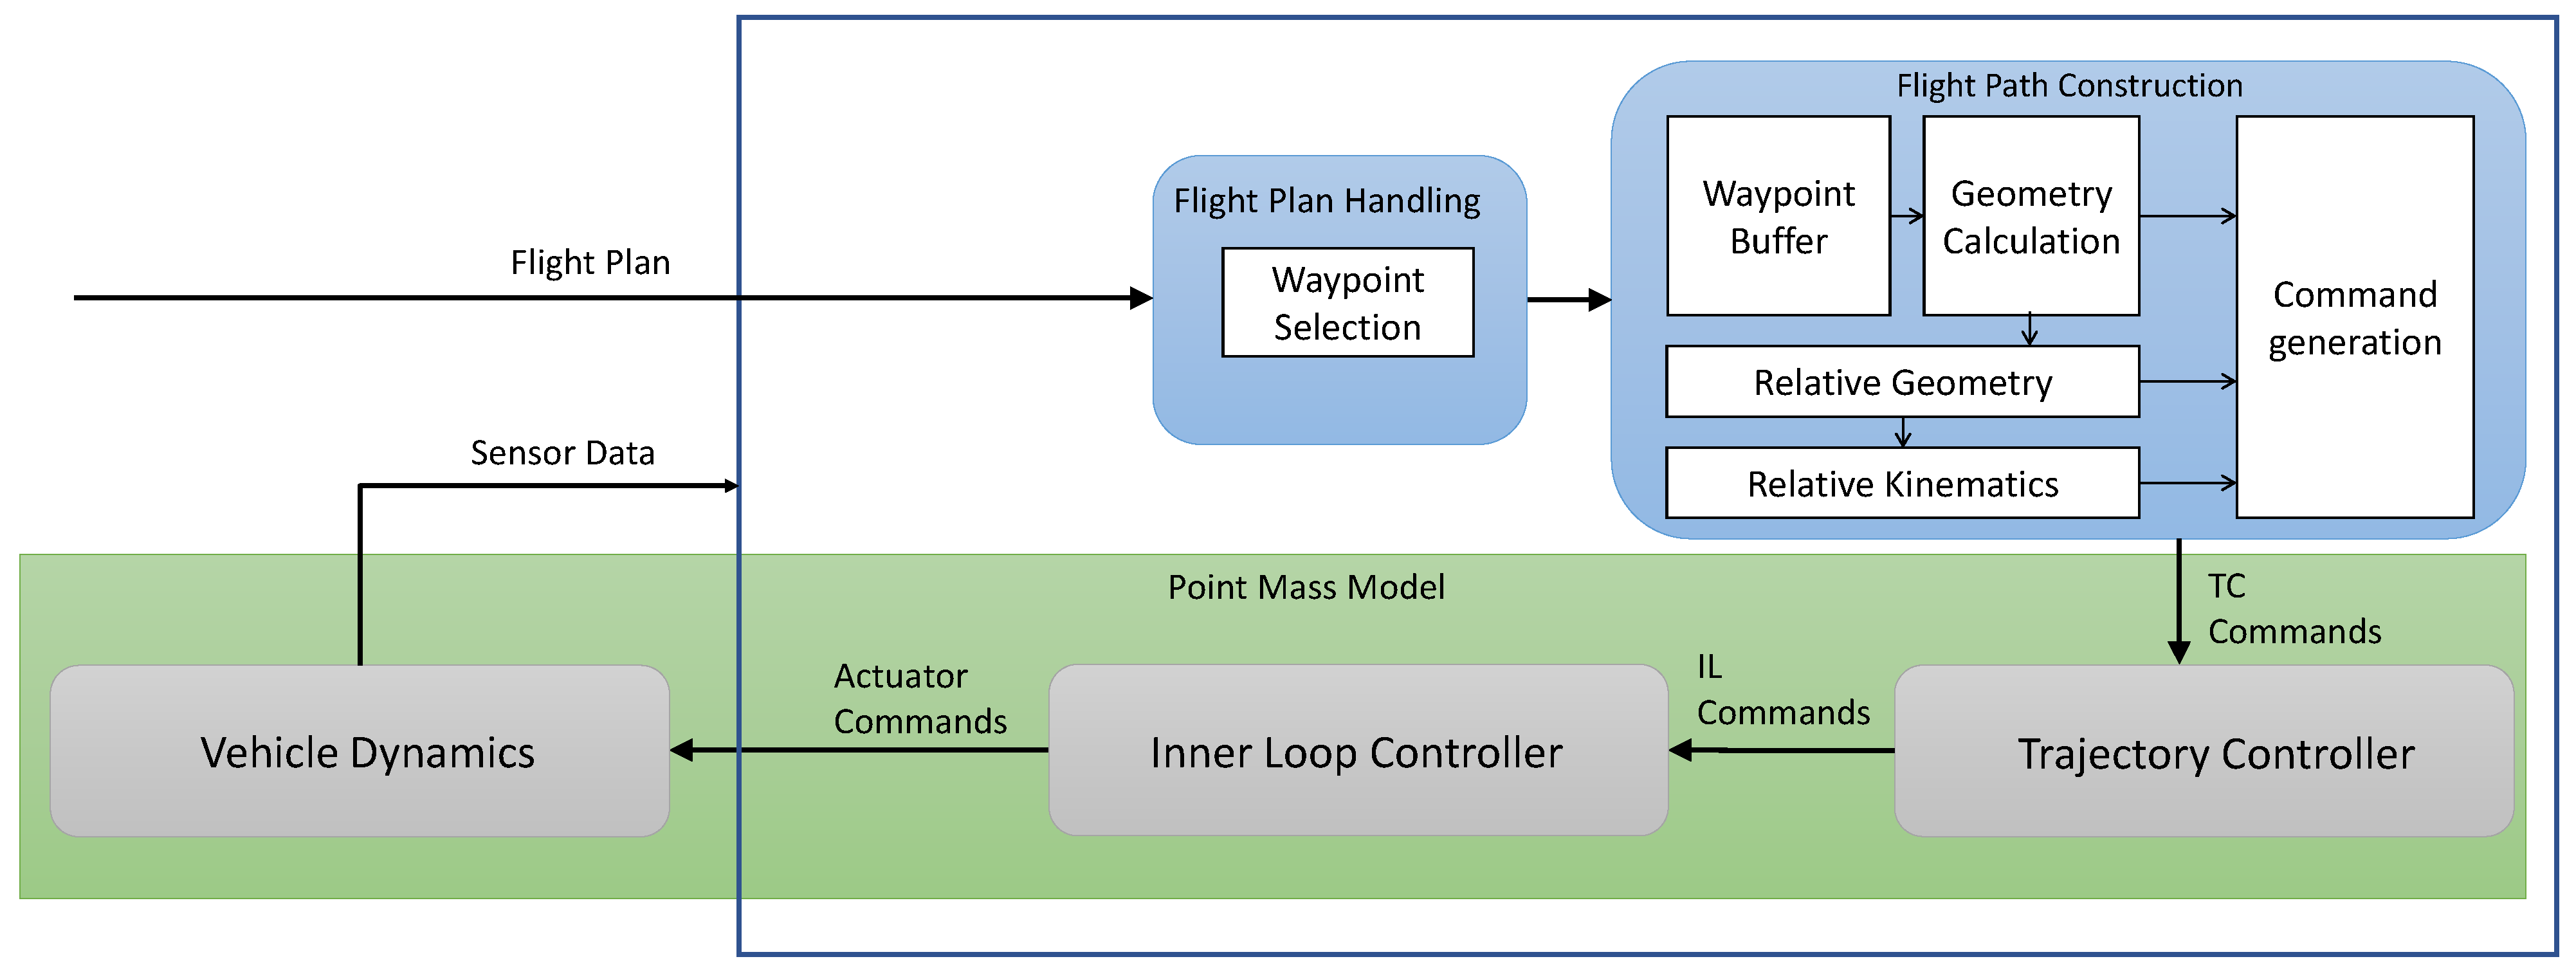
With the equations from Section 3, an online trajectory generation system was implemented in Simulink® following strict guidelines, allowing us to obtain a code-compliant software according to the DO-178/DO-331 [33]. The clothoid-based lateral implementation of the trajectory generation system has been successfully flight tested on a fixed wing aircraft [13].
As input, the system takes a flight plan consisting of waypoints defining the route to be followed, and generates commands that are sent to a trajectory control system. Each waypoint in the flight plan is defined by its location (longitude, latitude, and altitude), and the speed that the aircraft needs to reach during the leg leading to the said waypoint. For the results shown in this section, a point mass model was implemented to simulate the aircraft and inner loop dynamics, in order to test the functionalities of the trajectory generation system in a neutral environment without the overhead of multiple other systems. An overview of the test harness is shown in Figure 19.
As seen in Figure 19, the flight-plan-handling module is responsible for the selection of the specific waypoint in the flight plan to be sent to the flight path construction module (FPC). The FPC module in turn contains a waypoint buffer which always contains the three waypoints necessary for the maneuver construction as discussed in Section 3. After all the geometry is calculated, the commands to be sent to the trajectory controller are computed. This includes the course angle χ T and its derivatives, the climb angle γ T and its derivatives, and the error dynamics, which are obtained as the difference between the position of the aircraft and the position of the trajectory reference point. The calculation of the trajectory reference point is detailed in [15]. The calculations for the relative kinematics and derivatives of the commands are covered in [12,34].
Figure 19. Trajectory generation testing module implementation overview.
Aerospace 11 00157 g019

5.3.2. Point Mass Model

The first step in the definition of the point mass model is to define the kinematic speed V T of the aircraft. This is feedforwarded directly from the attributes of the waypoints by the trajectory generation module (TrajGen). The kinematic speed is then fed through a first order filter that simulates the velocity dynamics, and allows to obtain the derivative of the velocity as shown in Figure 20.
Now, we can use the χ T and γ T commands from the TrajGen module to transform the kinematic speed into its North East Down (NED) component as shown in Equation (71).
V O = u T v T w T = V T · cos χ T · cos γ T sin χ T · cos γ T sin γ T
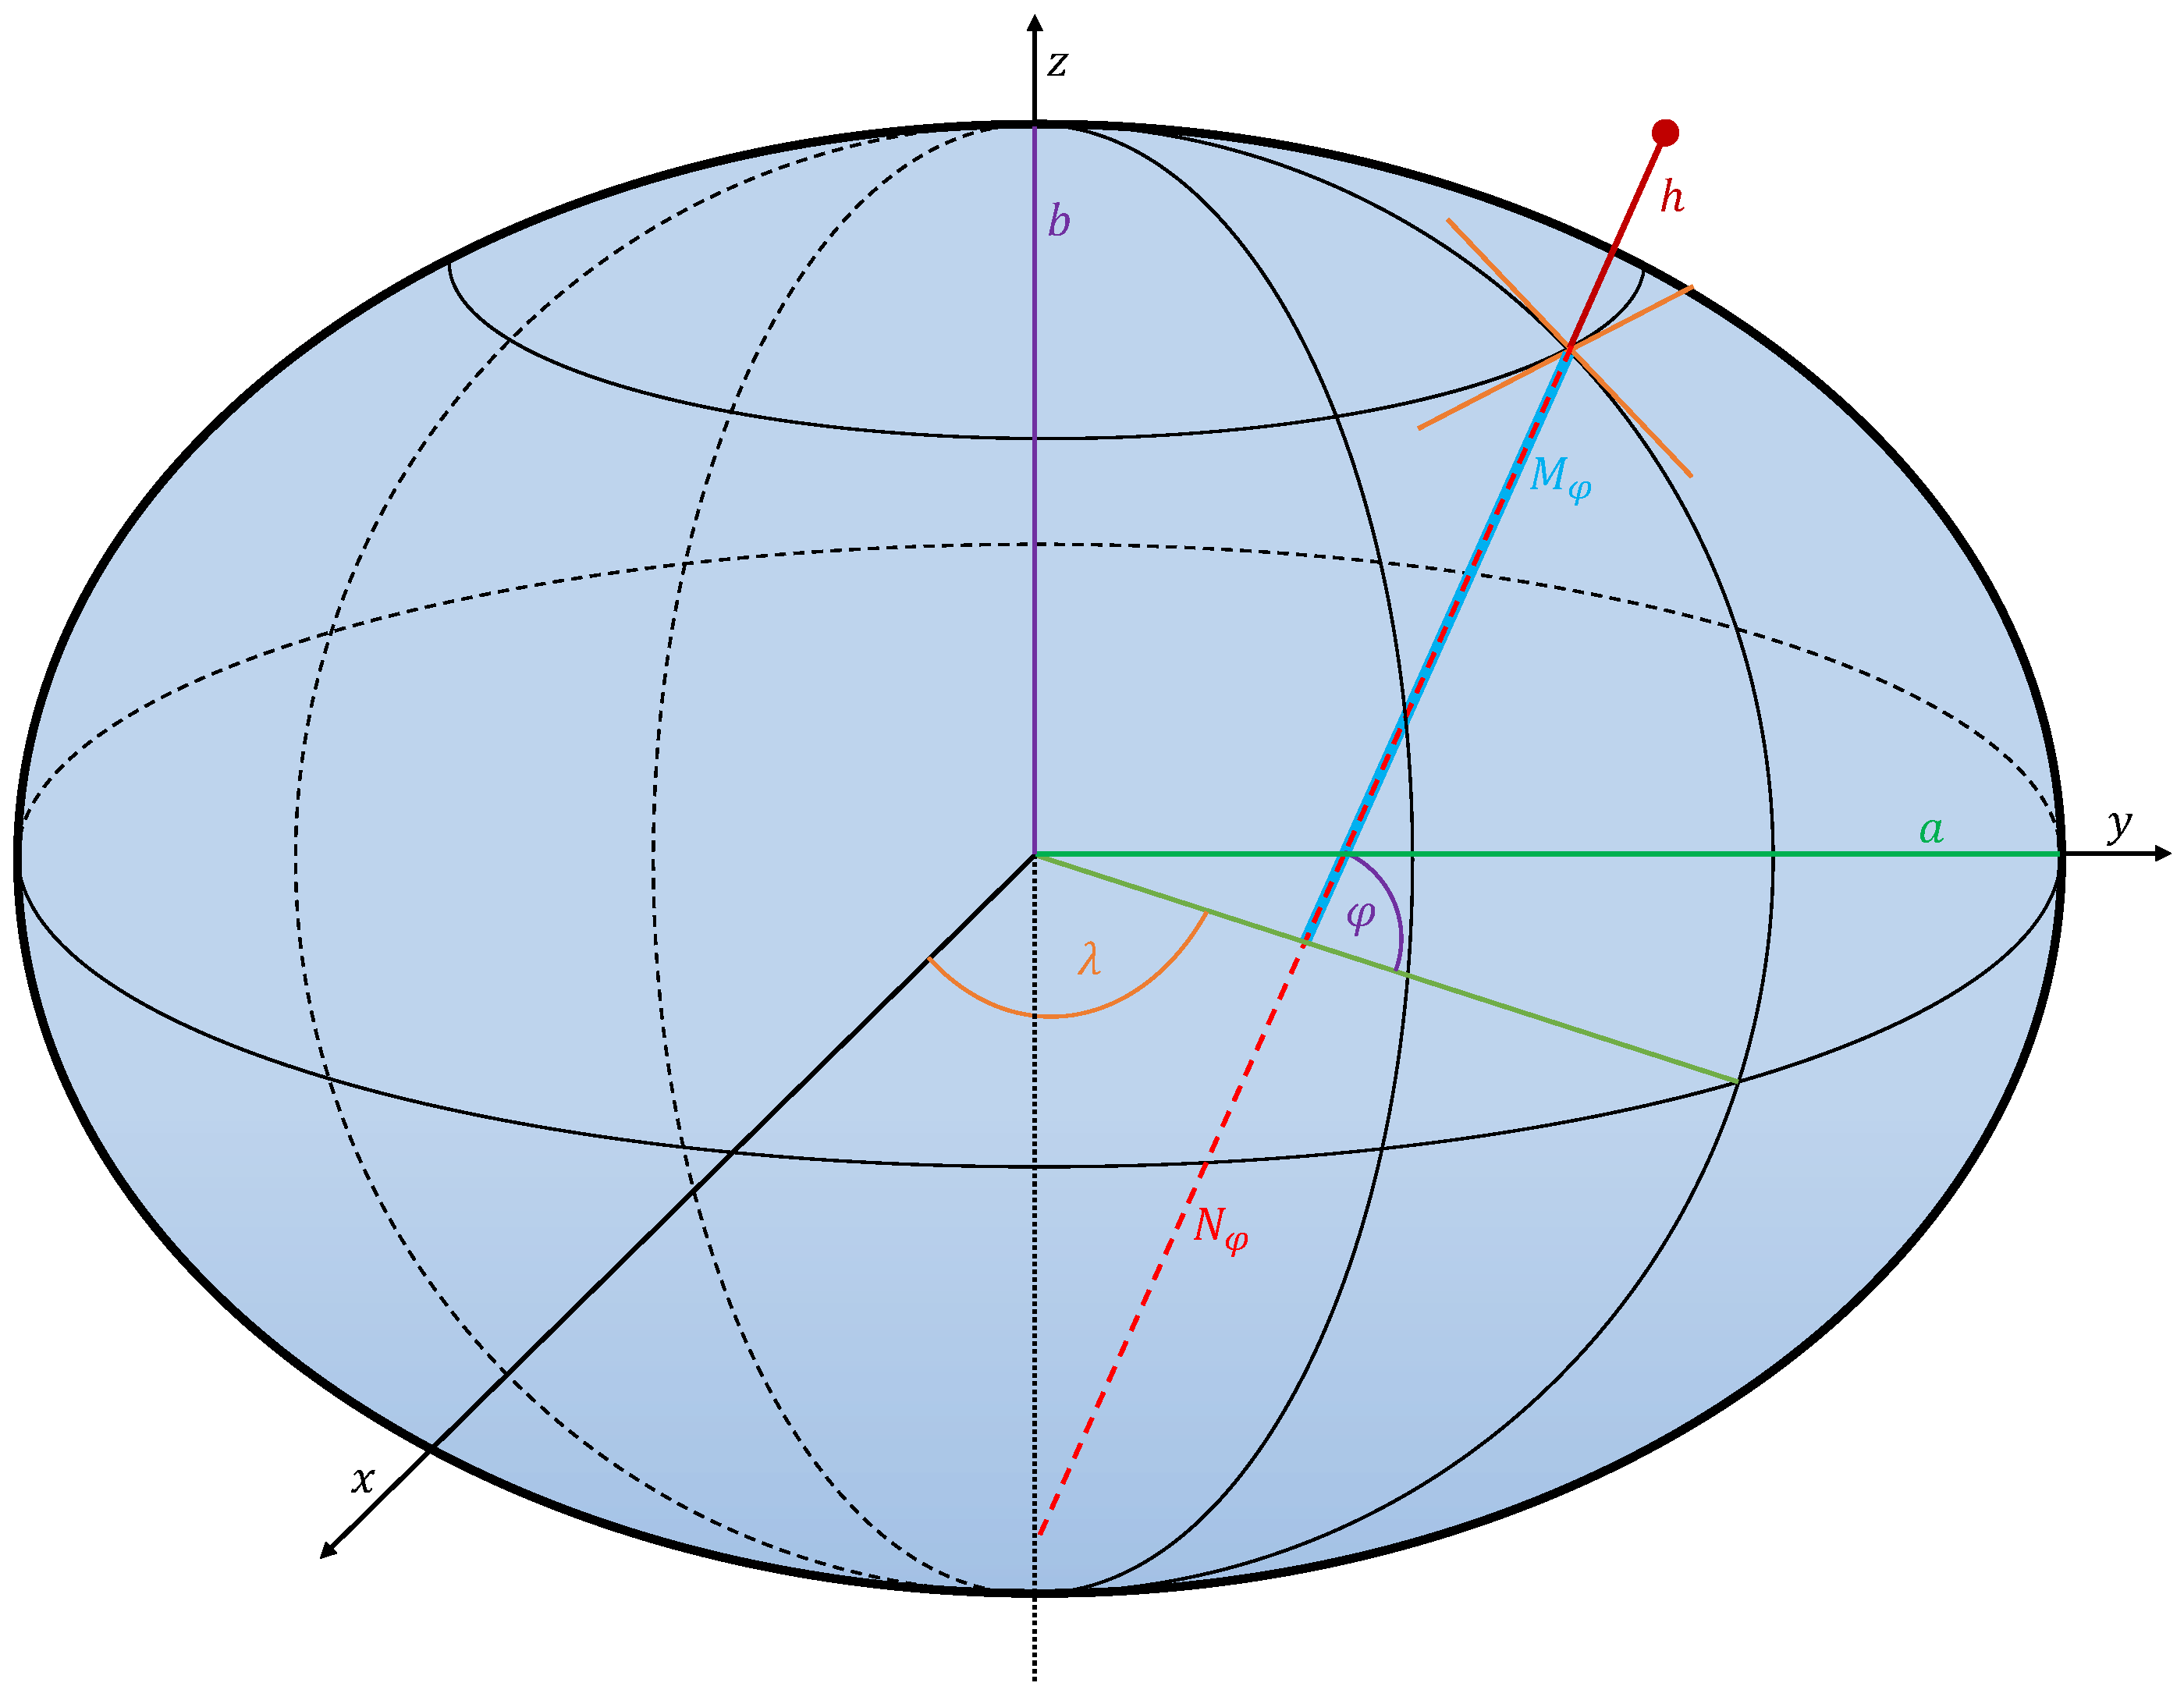
The NED velocities represent a change in position, which can then be propagated into a change in the WGS84 coordinates (longitude, latitude, and height). To achieve that, we start by calculating the different radii of curvature of the WGS84 spheroid as shown in Figure 21 where the different line formats and colors are intended to improve readability and highlight the different variables in the figure.
  • The prime vertical radius of curvature, N φ is:
    N φ = a 1 e 2 sin 2 φ
  • The meridian radius of curvature, M φ is:
    M φ = N φ · 1 e 2 1 e 2 s i n 2 φ
    where:
  • φ is the latitude;
  • a = 6 , 378 , 137 m is the length of the semi-major axis;
  • b = 6 , 356 , 752.3142 m is the length of the semi-minor axis;
  • e is the first eccentricity, calculated as:
    e 2 = 2 f f 2
    where the flattening f is:
    f = a b a
The derivation of the geodetic equations above is given in [35].
Using the NED velocity components and the radii of the earth, we find the first derivative of the geodetic coordinates as:
λ ˙ φ ˙ h ˙ = v T N φ + h cos φ u T M φ + h w T
where h is the altitude.
We can then integrate the derivatives of Equation (76) starting from an initial position, to obtain the current position. Note that the integrators are reset, frozen, or flipped accordingly, to account for the spheroid shape of the earth.
Figure 21. WGS84 spheroid properties of a point above the surface.
Aerospace 11 00157 g021

5.3.3. Results

For the experiments, a simple flight plan containing three waypoints was defined, similar to Figure 6.
In Section 2 we discussed the generalities of the trajectory generation, and we saw that steps in the curvature of the trajectory occur when using the traditional Dubin’s paths. And accordingly, we discussed the use of the clothoid segment to mitigate this problem. To illustrate this one more time, we simulated the flyby with two TrajGen systems. One based on Dubin’s paths, and another based on the clothoid transition.
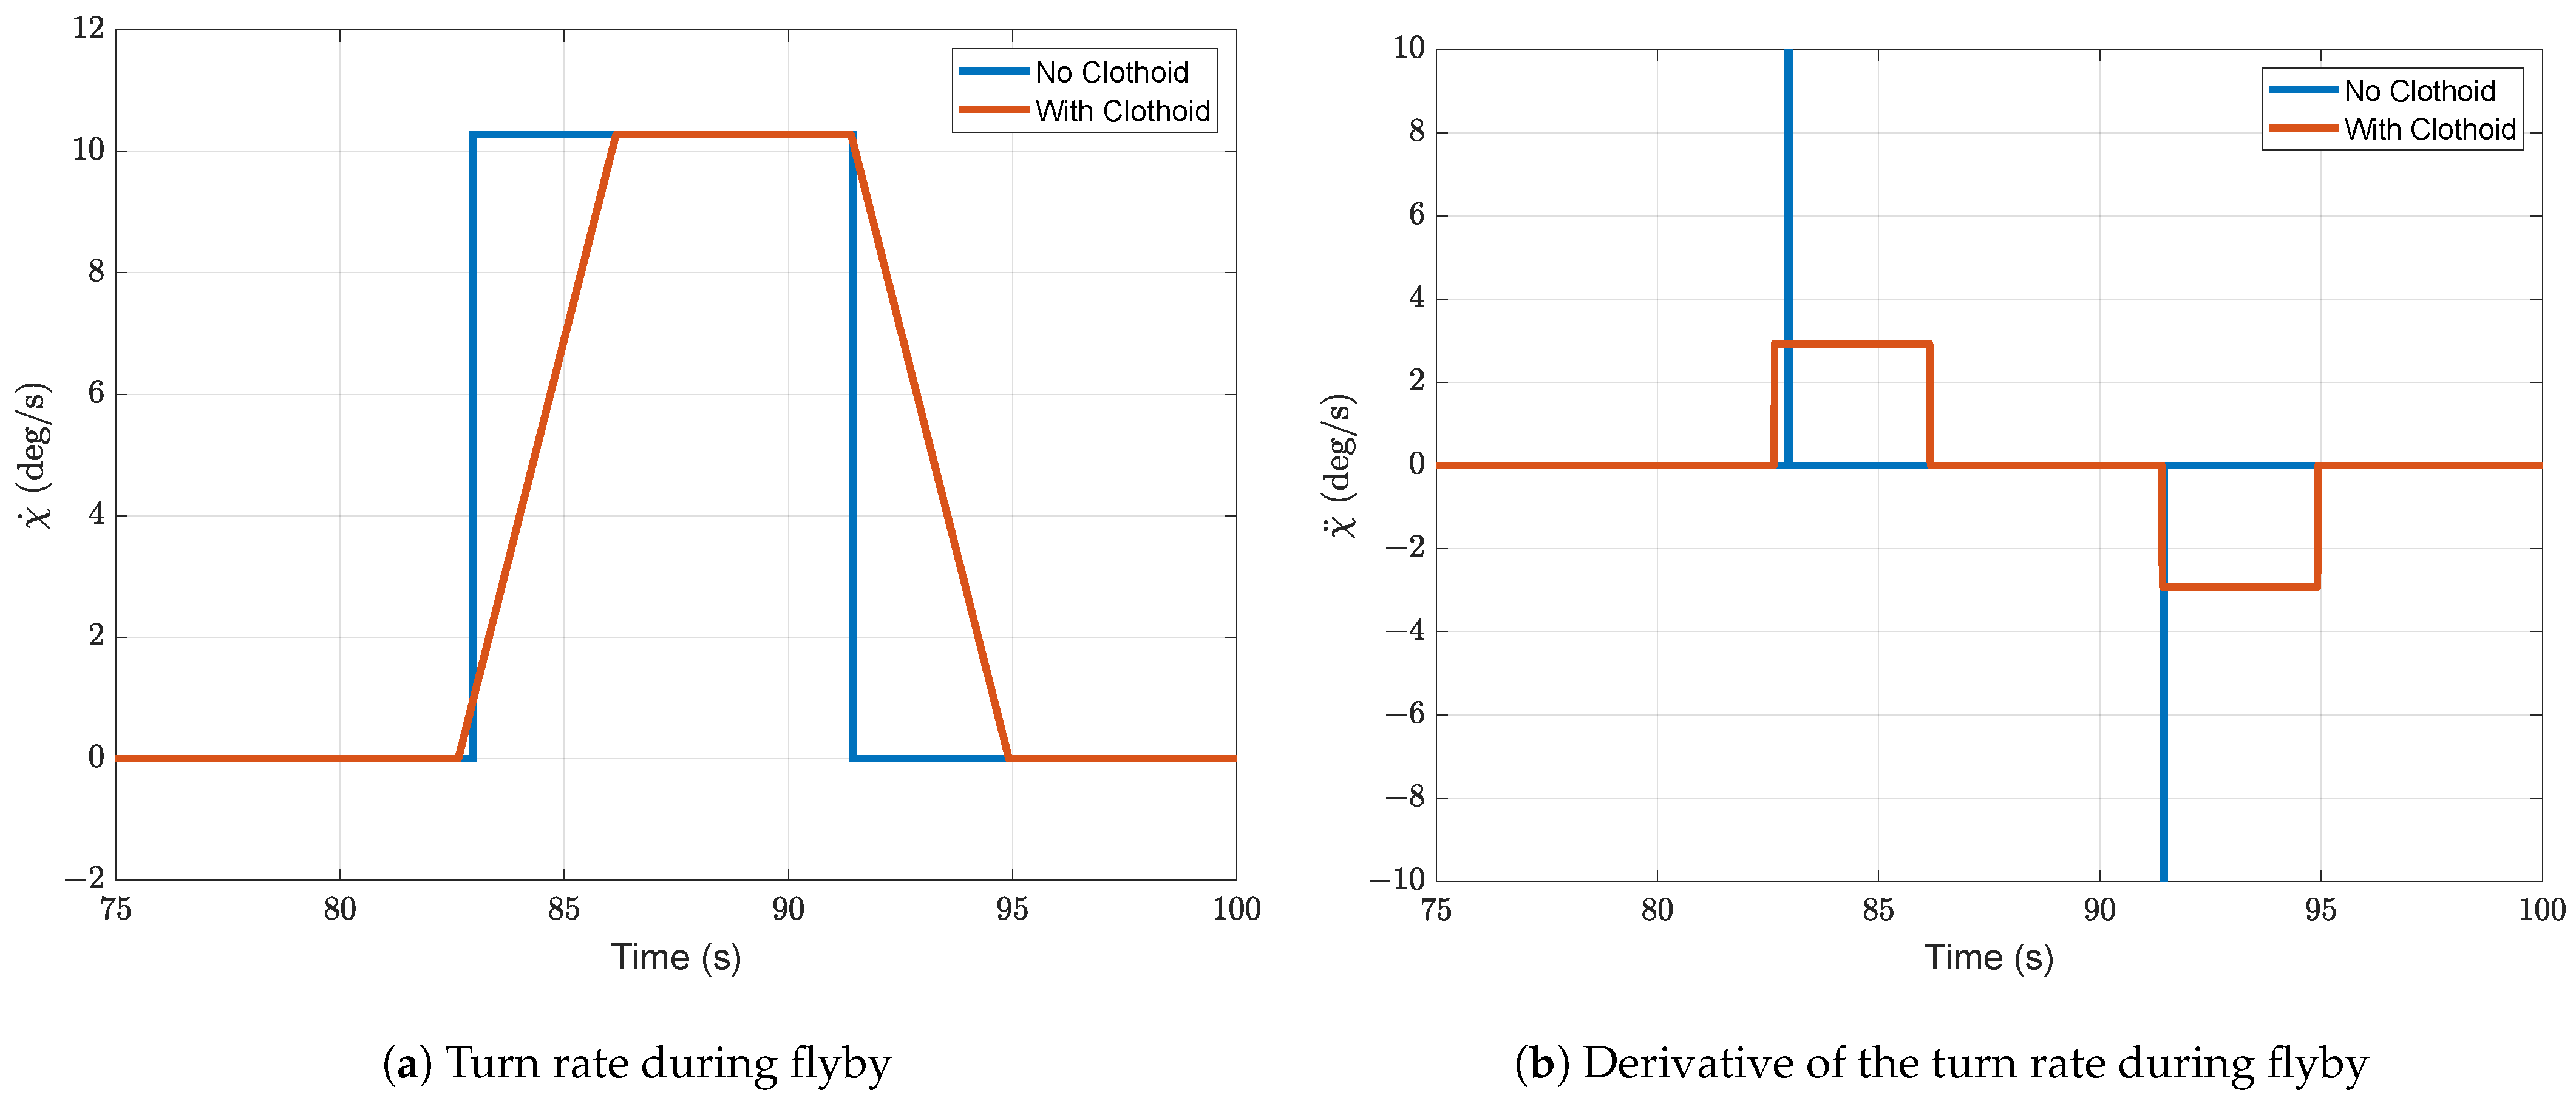
Figure 22a shows the turn rate command generated by the TrajGen system during a flyby. For the Dubin’s path-based system (no clothoid), we see an instanteneous change in the turn rate. On the other hand, when using the clothoid transition, we obtain a linearly changing turn rate, representing the linearly changing curvature of the trajectory. Another observation that we can make is that it takes significantly less time for the Dubin’s path system to finish the turn. However, this turn remains non-physical as an aircraft cannot have a discontinuous bank angle behavior, which would lead to unavoidable errors in the tracking behavior of the aircraft. The discontinuity in the turn rate is seen clearly in Figure 22b, where we see that the derivative of the turn rate for Dubin’s paths is infinite.
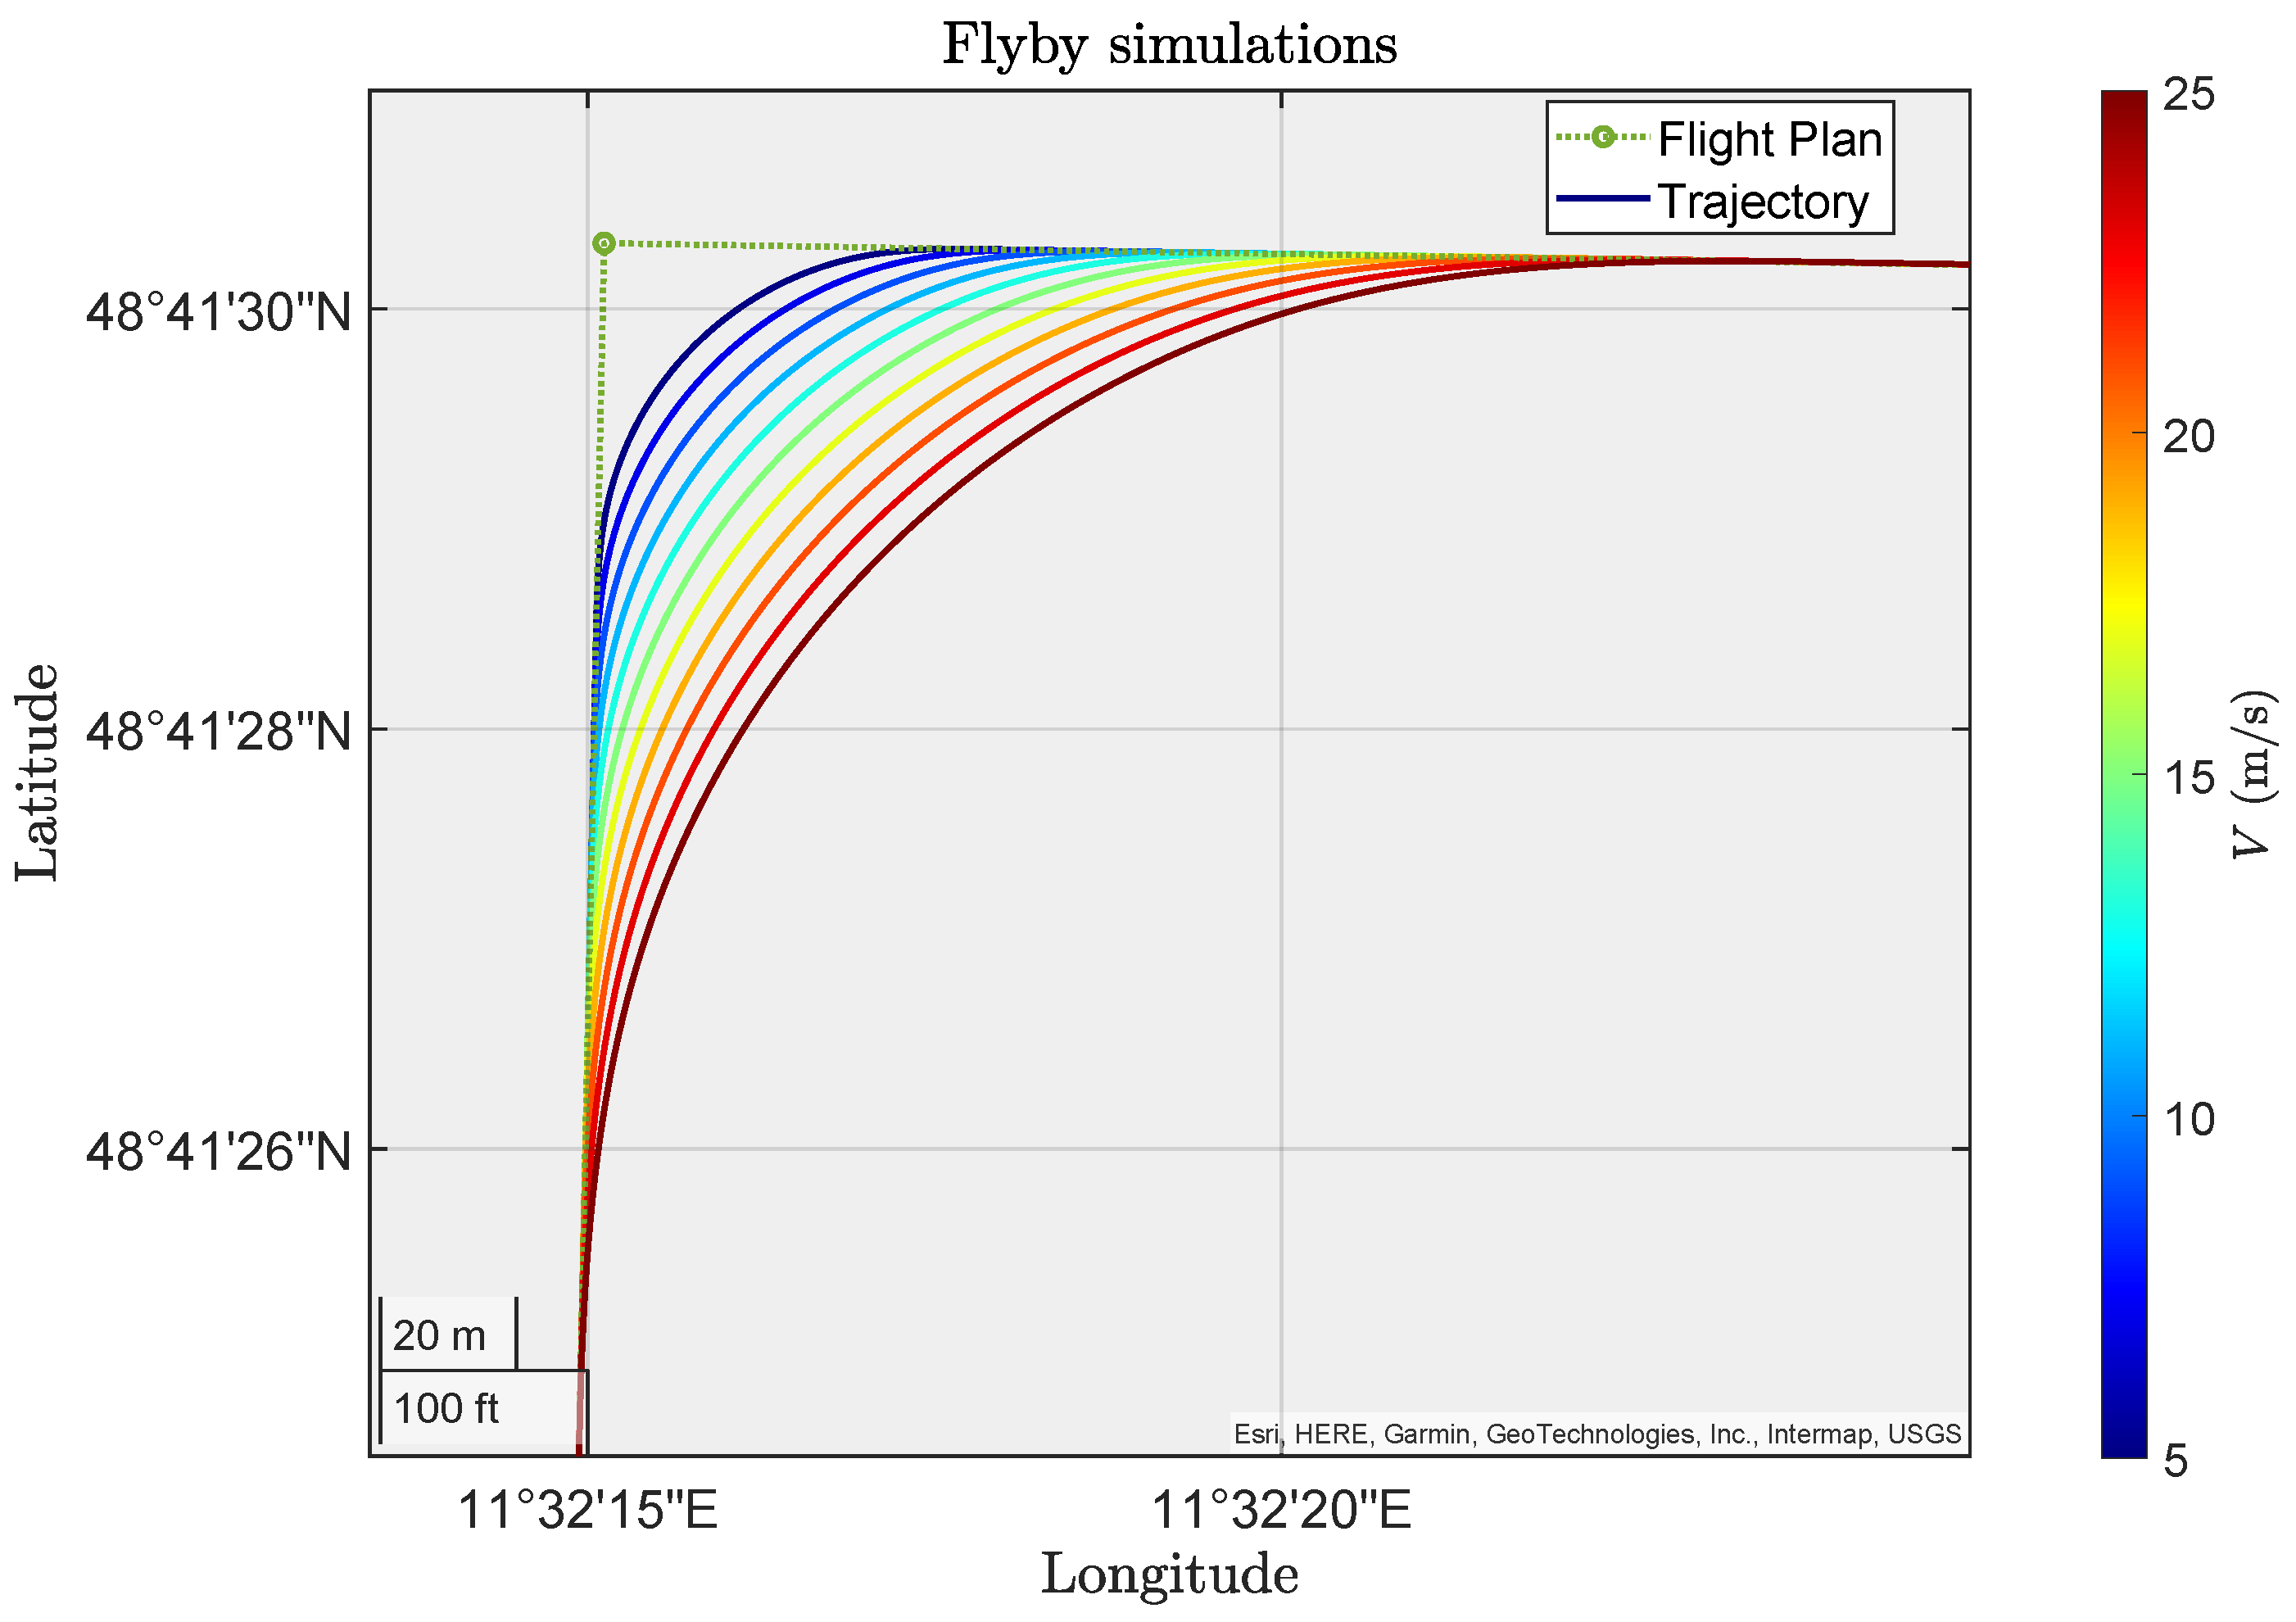
Further, in Section 5.1 we show the relationship between d t u r n and V T showing that an increase in velocity leads to an increase in turn distance. This is well illustrated by the equidistant lines in Figure 23 which move further away from the intersection between the legs as the velocity increases. But, as stated earlier, in this work we did not look at the possibility to adjust the velocity in order to obtain a desired turn distance. Although this is certainly an alternative to the method presented in this paper, we made the basic assumption that the velocity is part of the flight plan uploaded by the user and therefore cannot be changed. Another approach that will be explored in future work is to present the user with an alternative velocity at the moment of the flight plan upload, in case the distance between waypoints is not enough to make turns given the current velocity attributes of the waypoints.
Figure 22. Trajectory-generation commands during flyby.
Aerospace 11 00157 g022
One solution presented in the paper to deal with limited distances between waypoints is to simply increase the desired turn rate, given that eVTOL aircraft can achieve much higher turn rates that fixed wing aircraft.
Figure 23. Influence of the velocity on the flight path.
Aerospace 11 00157 g023
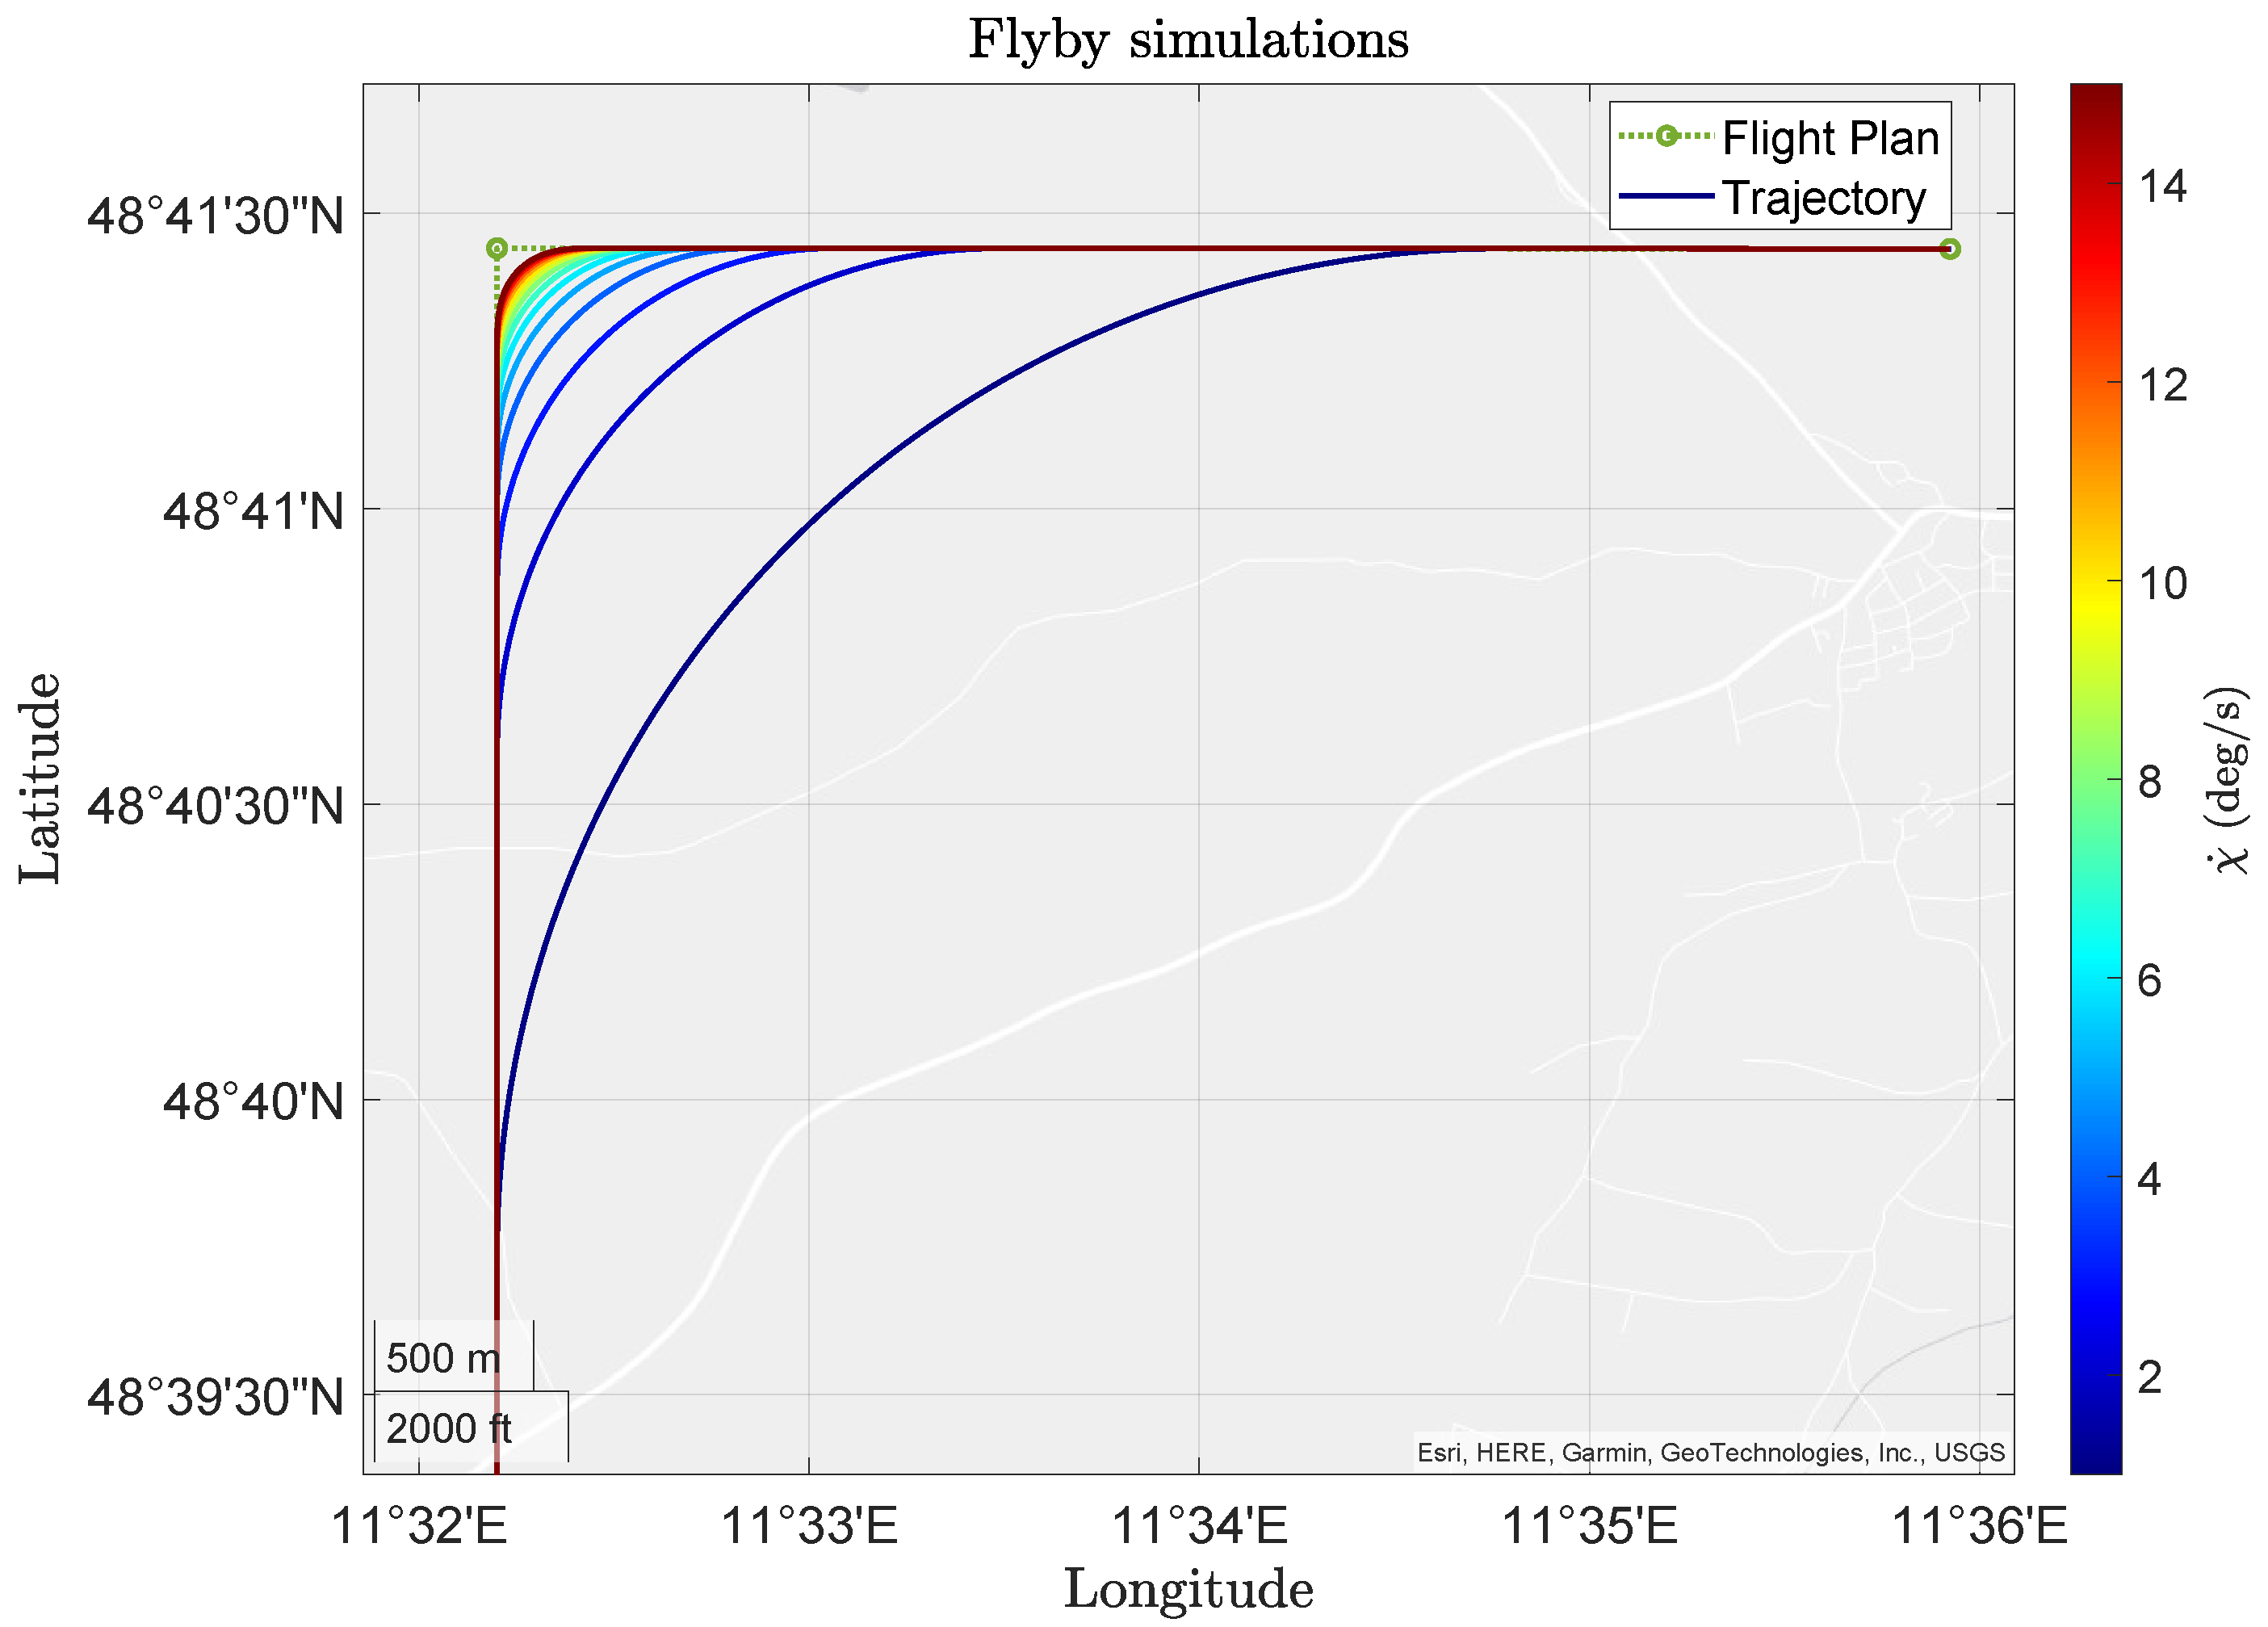
Figure 24 gives us a visual representation of the influence of the turn rate on the turn distance as shown in Figure 16. We can increase the desired turn rate to initially drastically reduce d t u r n but the effectiveness of increasing χ ˙ decreases simultaneously. In the limit, the increase in turn rate has no effect on the decrease in turn distance anymore. This can be seen by the decrease in distance between the flight paths in Figure 24.
Finally, the simulation results will help us build a more visual representation of the results shown at the beginning of Section 5. In Section 5.1, the turn distance d t u r n was said to be influenced by the angle between the legs α T , the velocity V T , and the desired turn rate χ ˙ T d .
In Figure 25, we can clearly see the influence of the angle between the legs in the flight plan. The smaller α T is, the earlier the turn needs to start, and this results in a higher d t u r n , which in turn would limit the minimum distance between the two waypoints.
All the results shown so far have been looking at the trajectory generation in the horizontal plane. The trajectory in the vertical plane is implemented using the equations shown in Section 3.2.
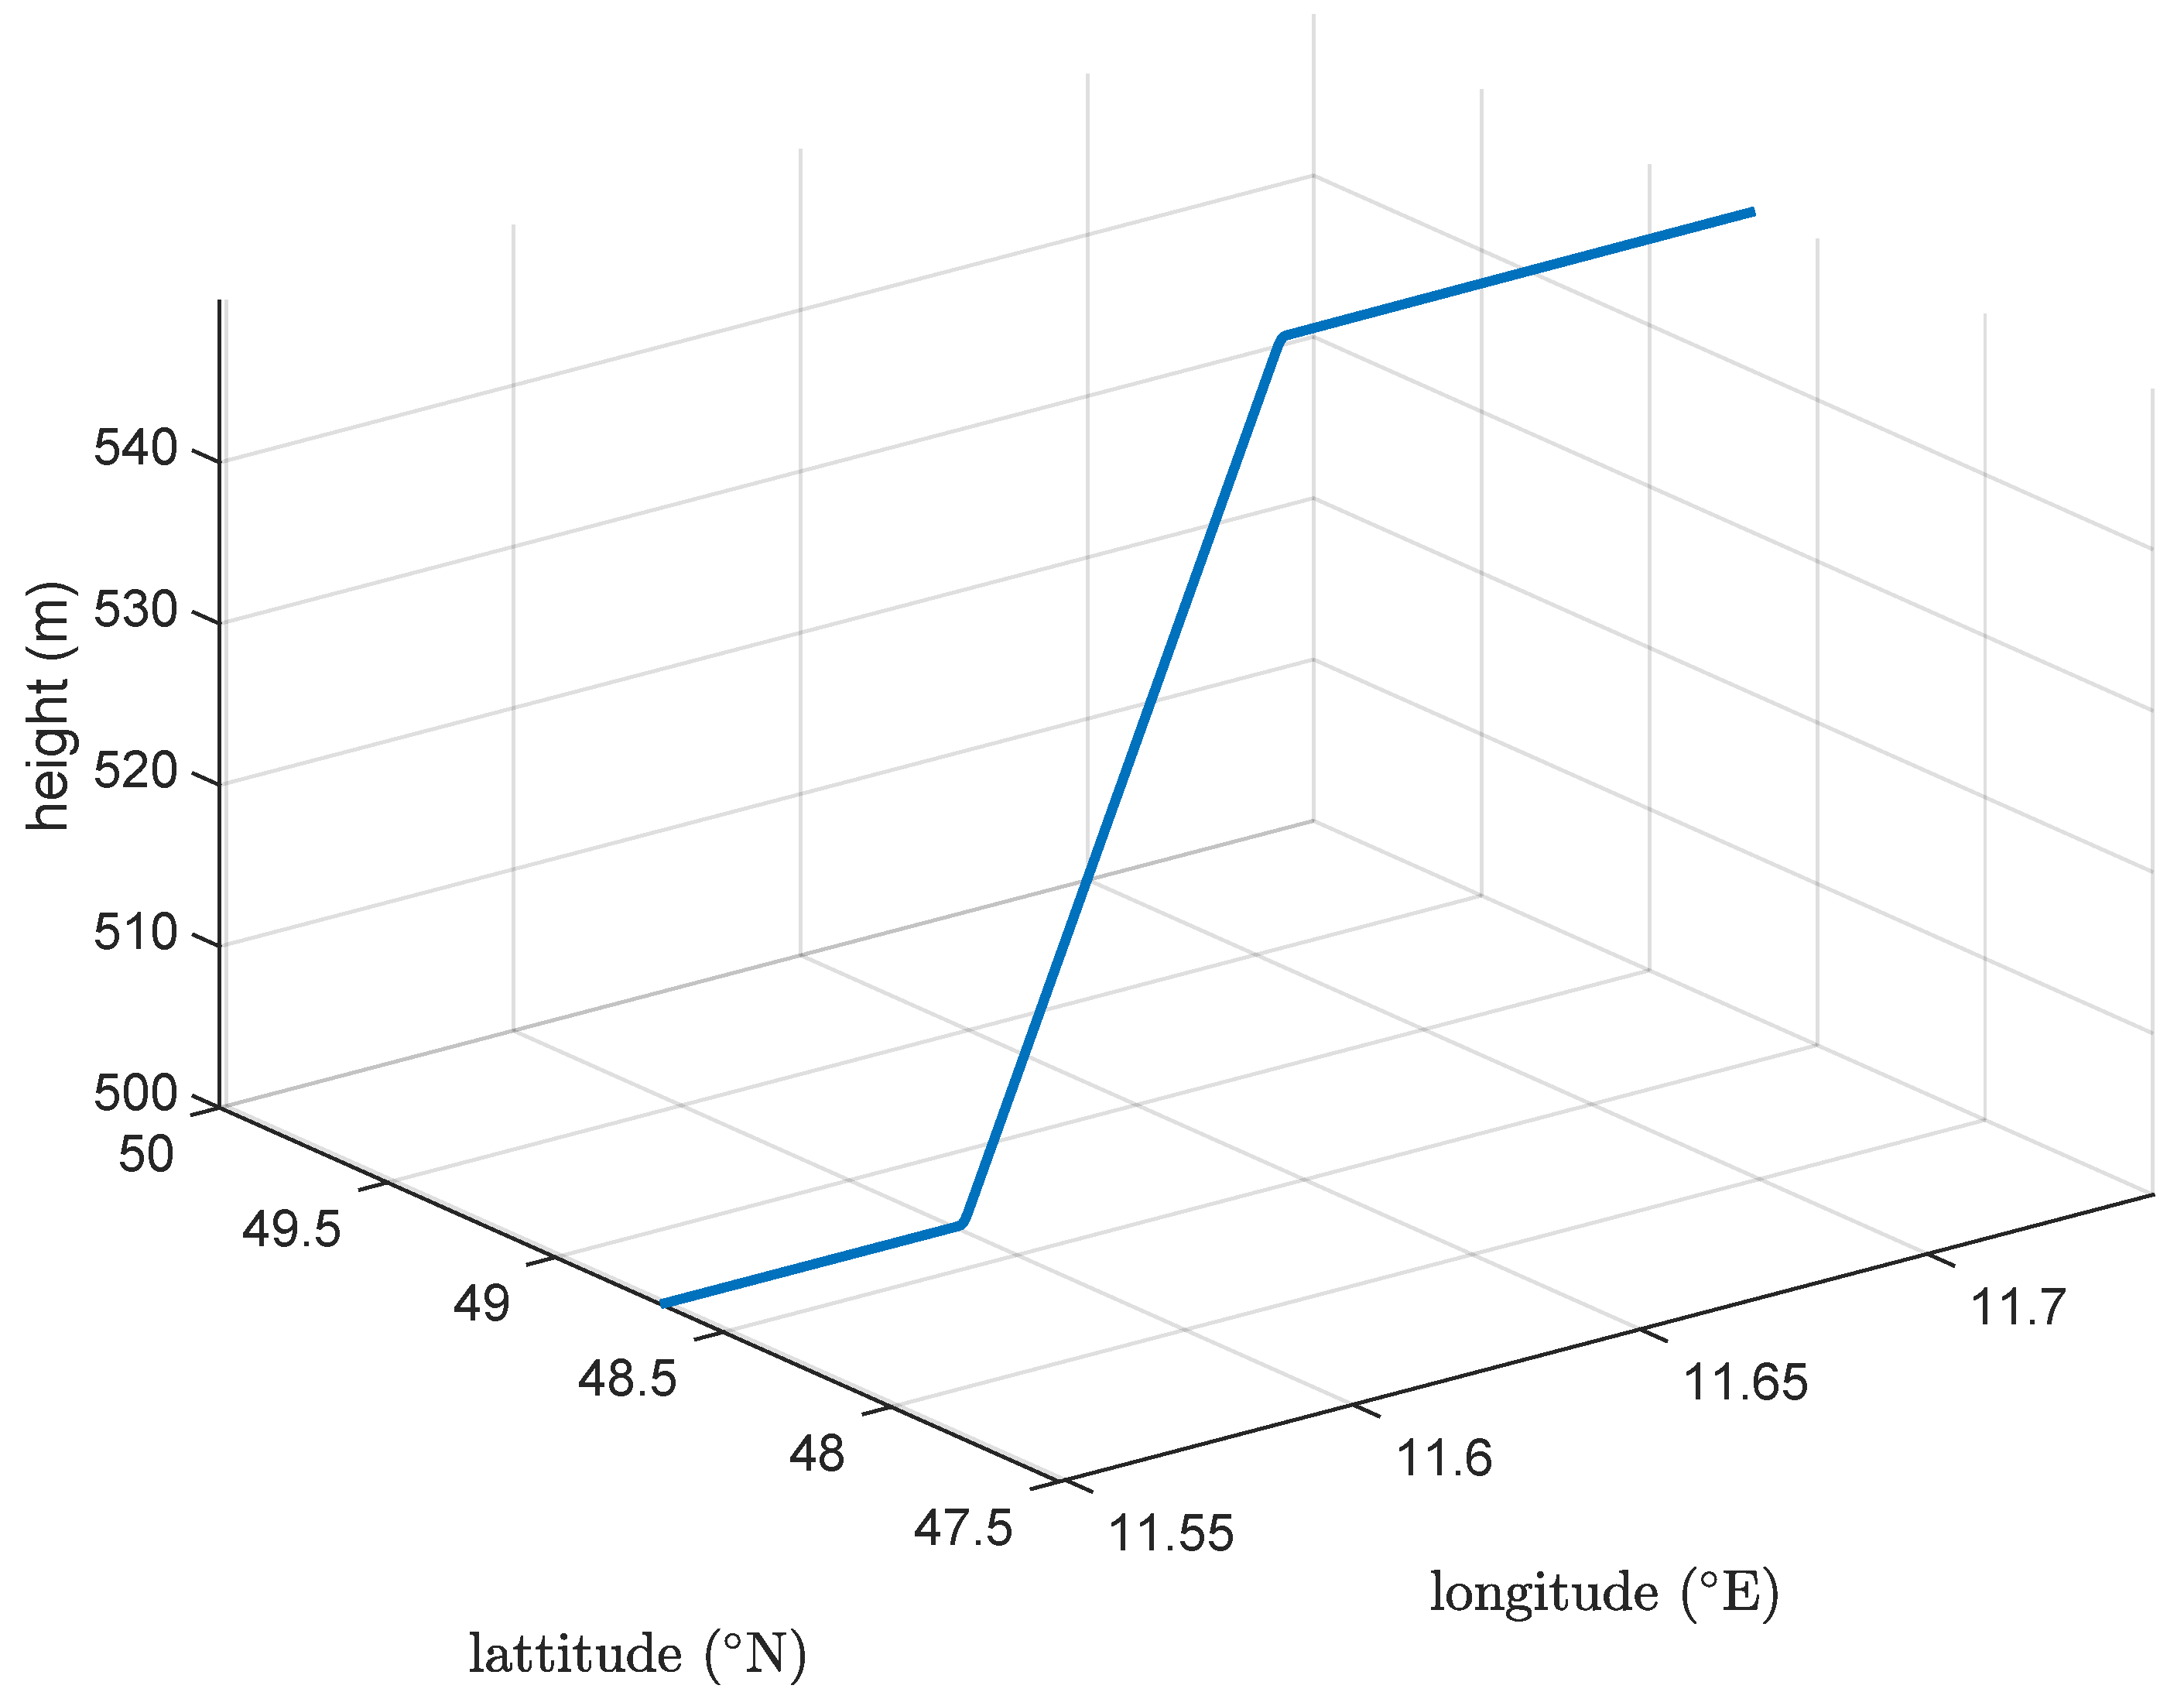
In Figure 26 we see a straight line in the horizontal plane, and only a climb is performed. This is an example of a case where the waypoints are placed in a straight line, but at different altitudes. At the intersections of the horizontal straight line, and the vertical straight line, a vertical flyby is performed, as seen in Figure 27, in order to maintain a smooth trajectory. The vertical flyby is achieved by the polynomial shown in Section 3.2.
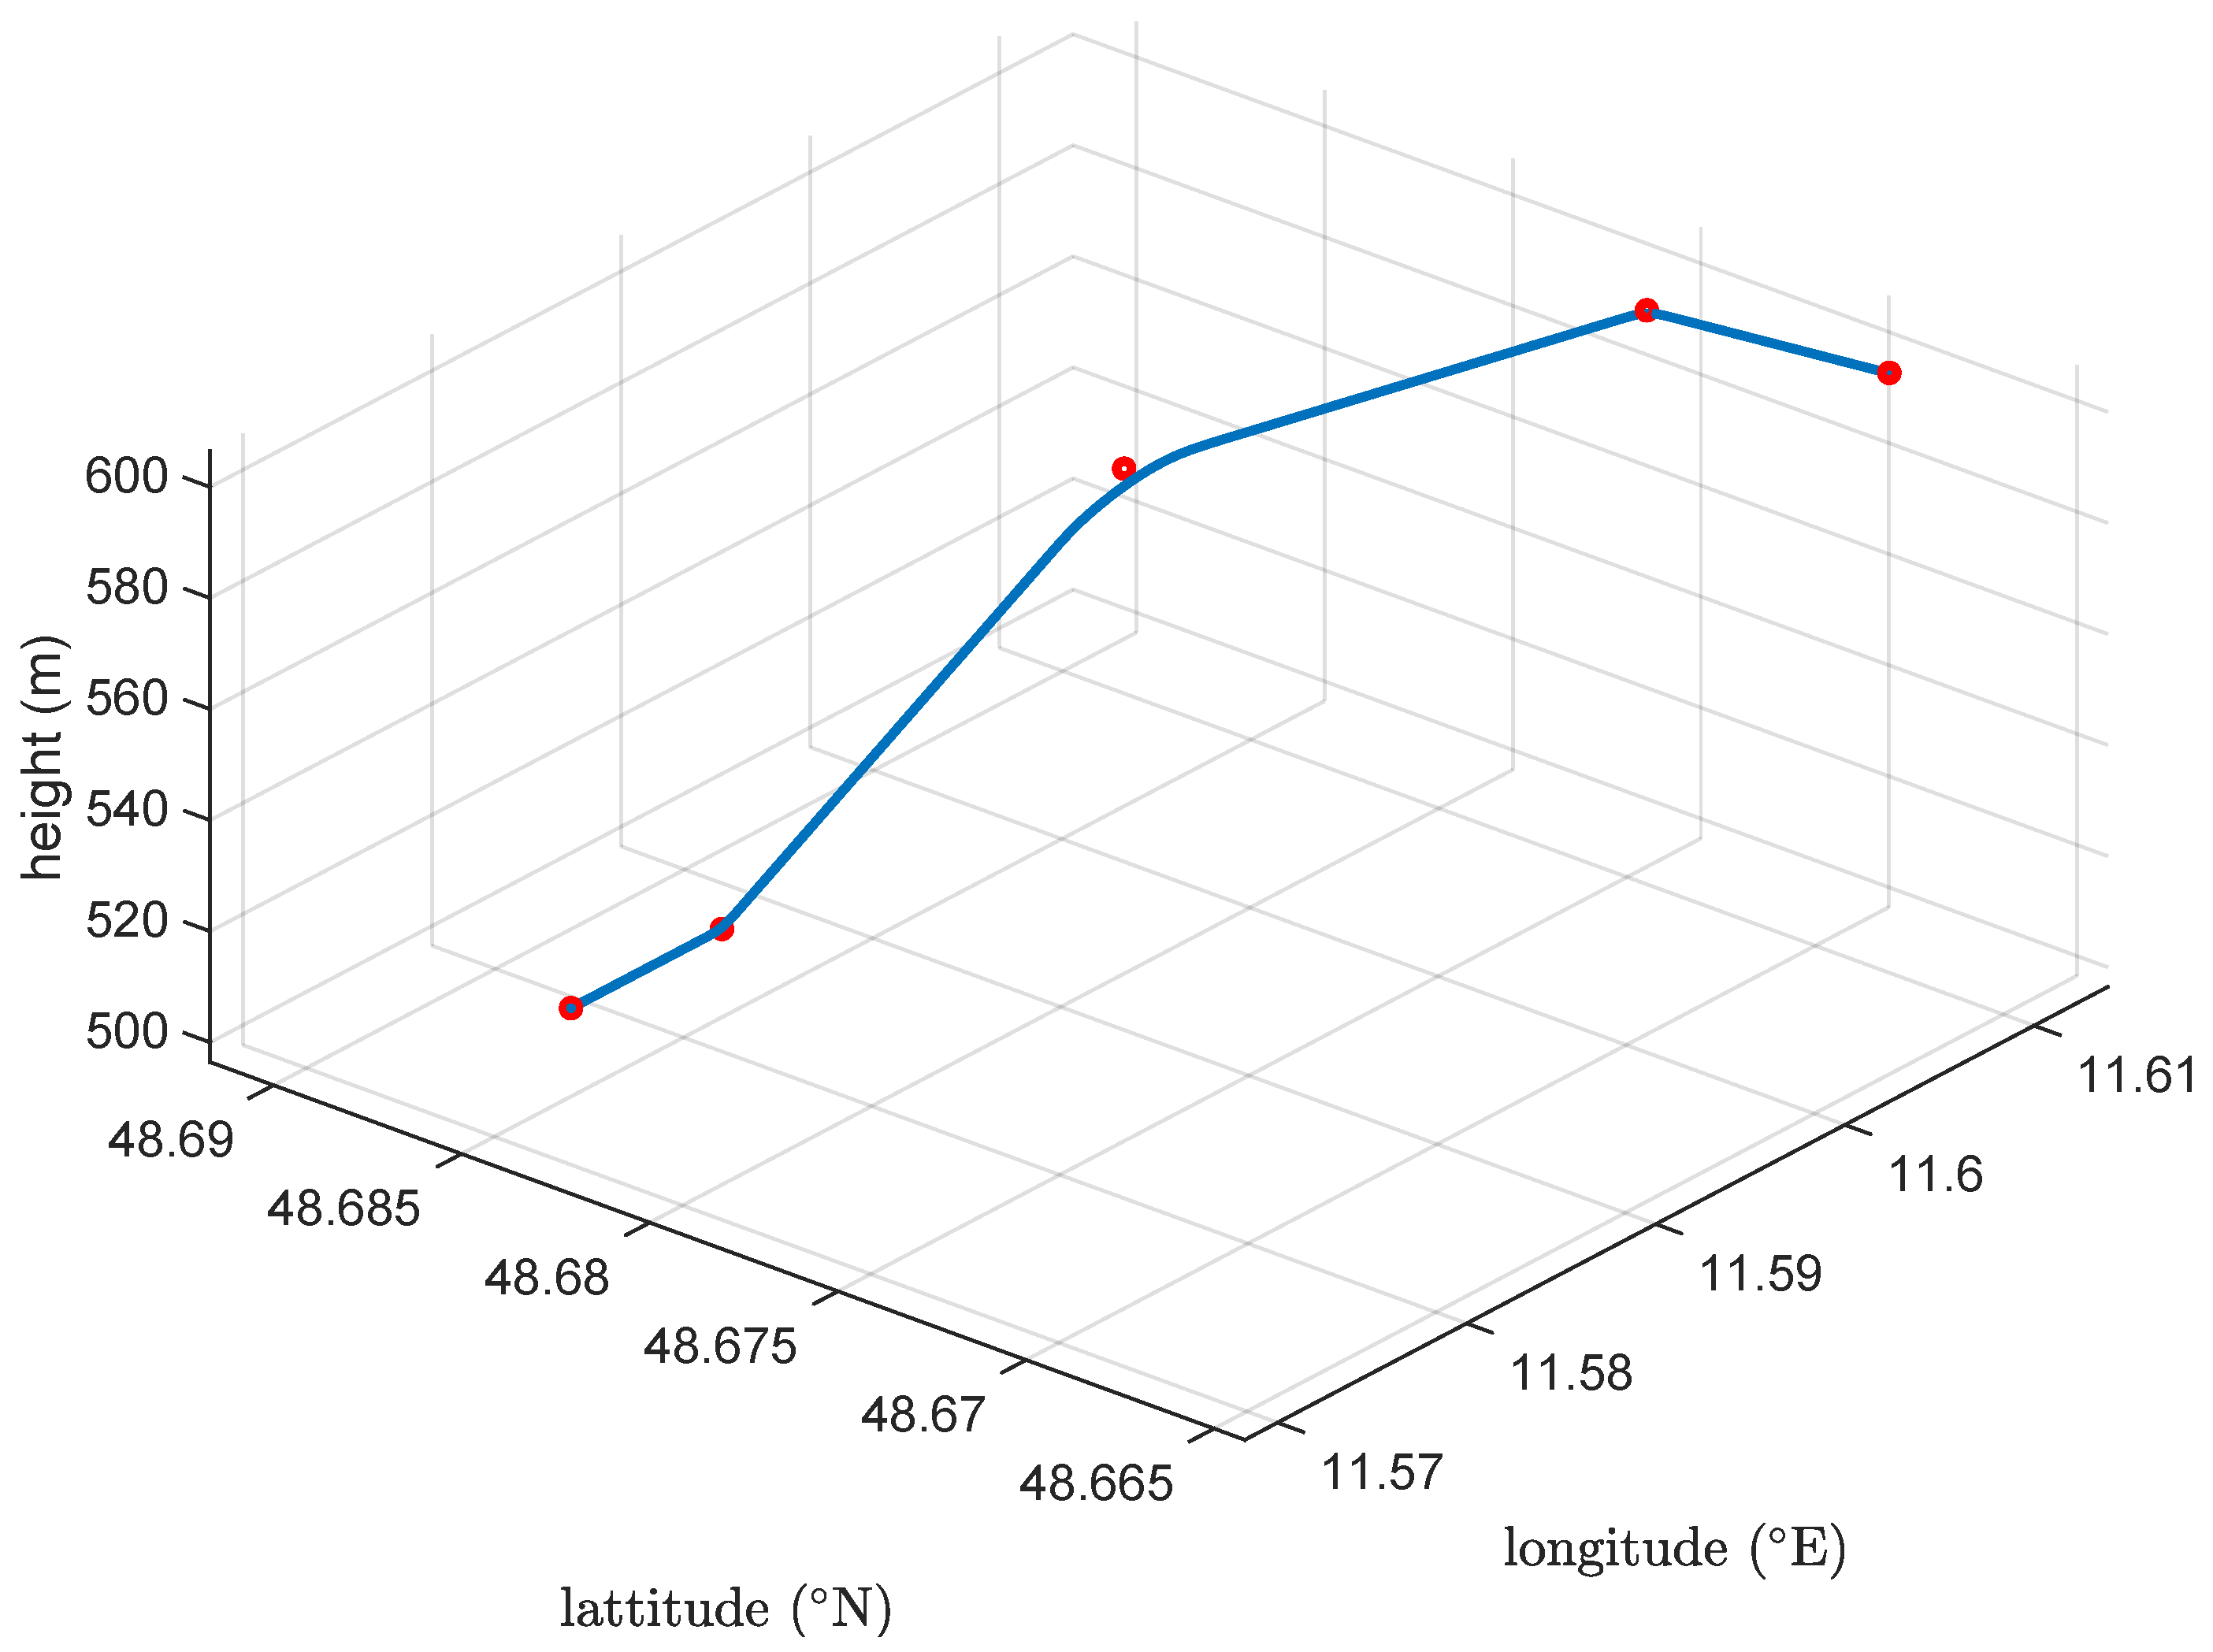
Although the horizontal and vertical planes are developed separately, they are combined in order to be able to generate 3D trajectories. This is illustrated in Figure 28 where the waypoints, indicated in red, are not placed in a straight line, and are placed at different altitudes. The resulting trajectory is a combination of a horizontal flyby with a vertical one, and flying straight lines in both the horizontal and vertical planes in between waypoints. This means that, when two waypoints are placed at different altitudes, they will be connected by a line of constant climb as seen in Figure 26. The feasibility of the climb is not considered in the trajectory generation module. The feasibility gateway [28] verifies the altitudes of the waypoints when they are uploaded, to make sure the climb performance of the aircraft allows us to achieve required climb rate.
These 3D trajectory capabilities are not limited to the simple maneuvers shown so far. The waypoints can be placed at strategic locations in order to achieve much more complicated trajectories as seen in Figure 29. This trajectory is made up of several waypoints with the flyby transition. Circular trajectories can be generated by simply placing flyby waypoints close to each other.
The “start” and “finish” points in Figure 29 do not represent the take-off and landing. As mentioned before, the derivatives of the commands are calculated by making a prediction of the aircraft’s position and trajectory in the future. This requires the use of course and climb angles. These angles are not defined when the aircraft is at a stop. Therefore, the TrajGen module presented in this work can be activated only when the aircraft is already in motion. The takeoff and initial acceleration, and landing can be performed by another module such as the one presented in [36,37]. For the results shown in Figure 29, the trajectory was initialized with a nonzero speed. In addition, it is worth noting that the trajectory was generated for a more agile aircraft, represented by the inner loop dynamics with a roll time constant T p = 0.6 s and a maximum achievable roll rate of p c m d = 50 d e g / s .
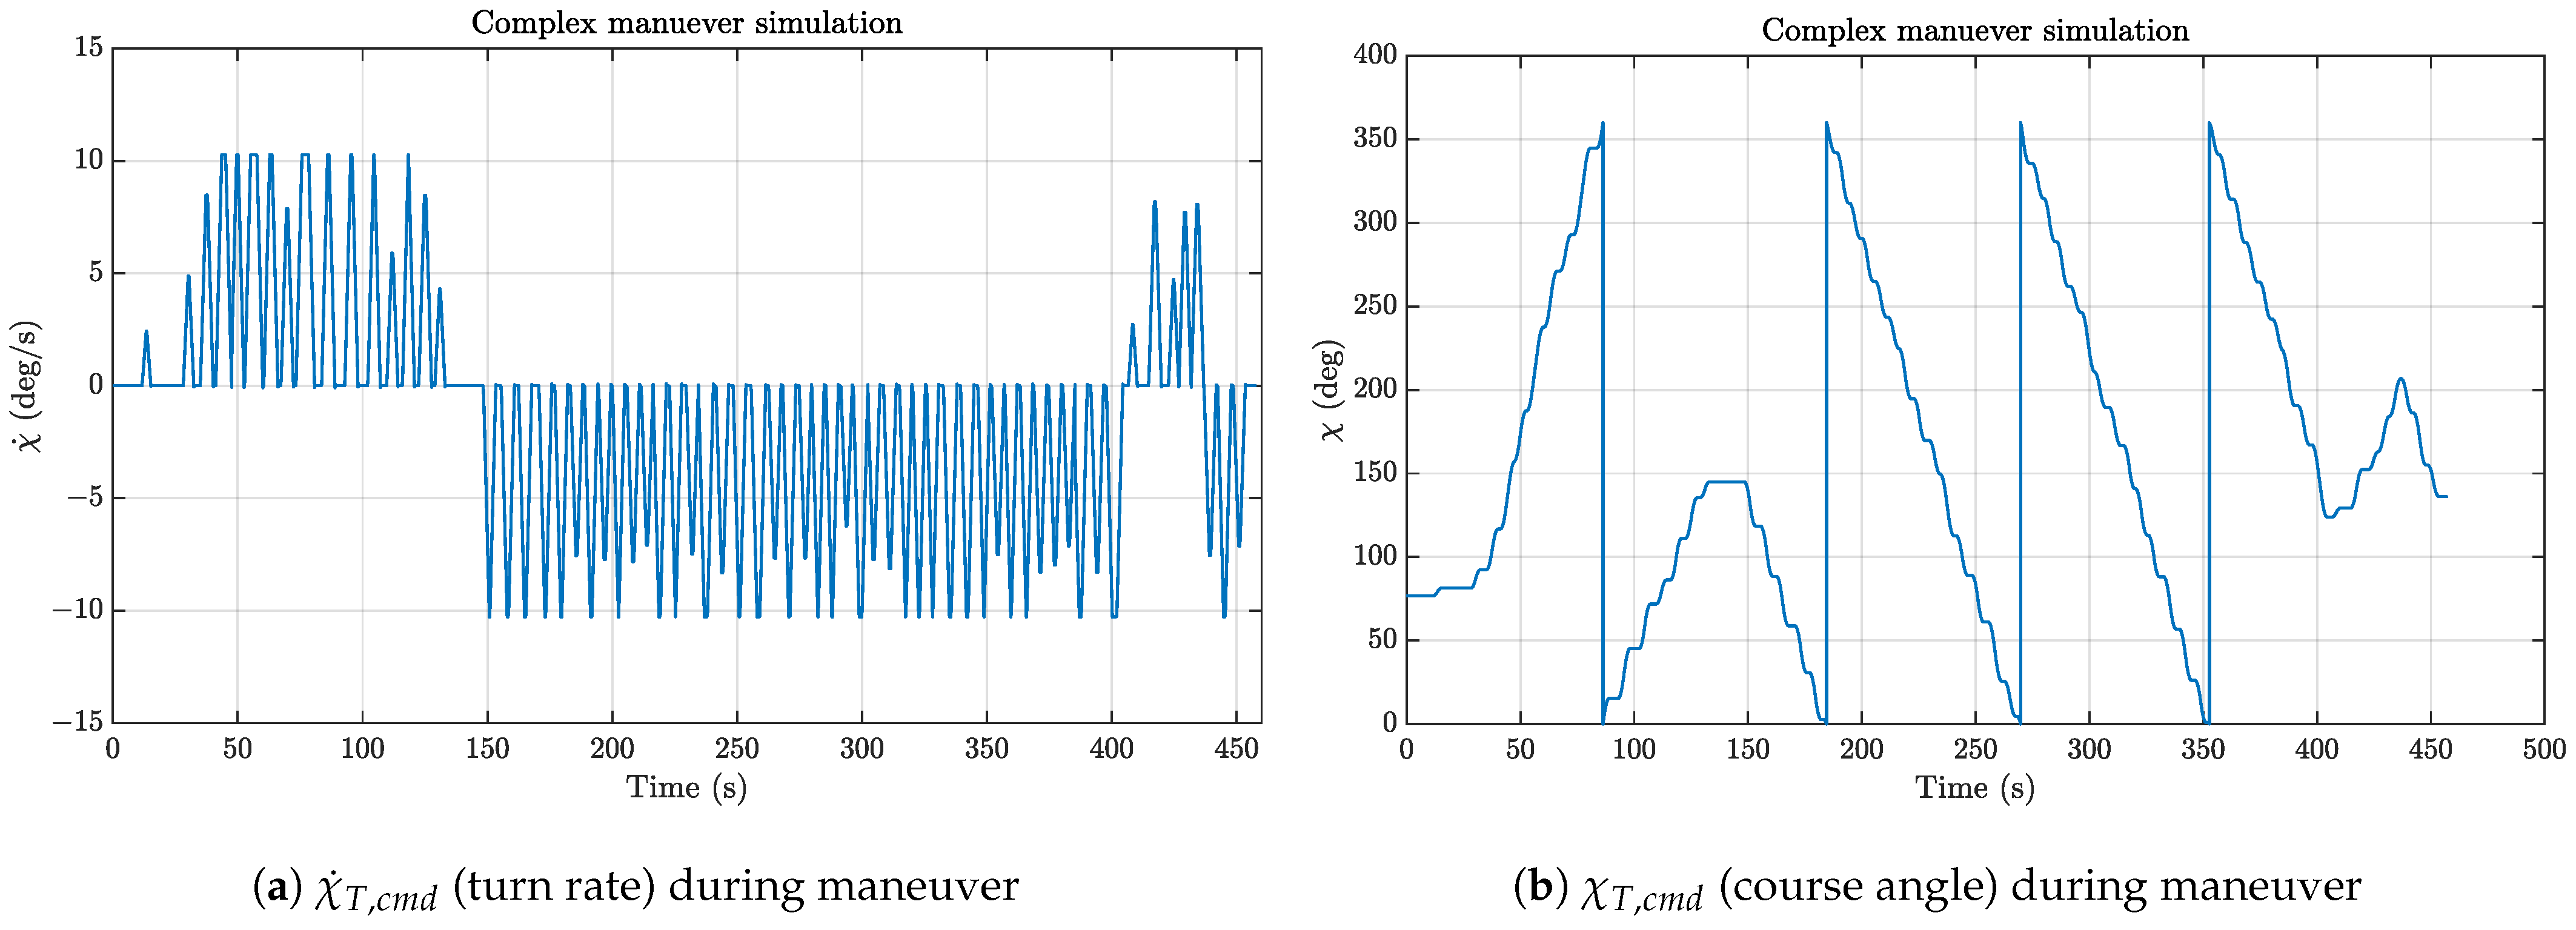
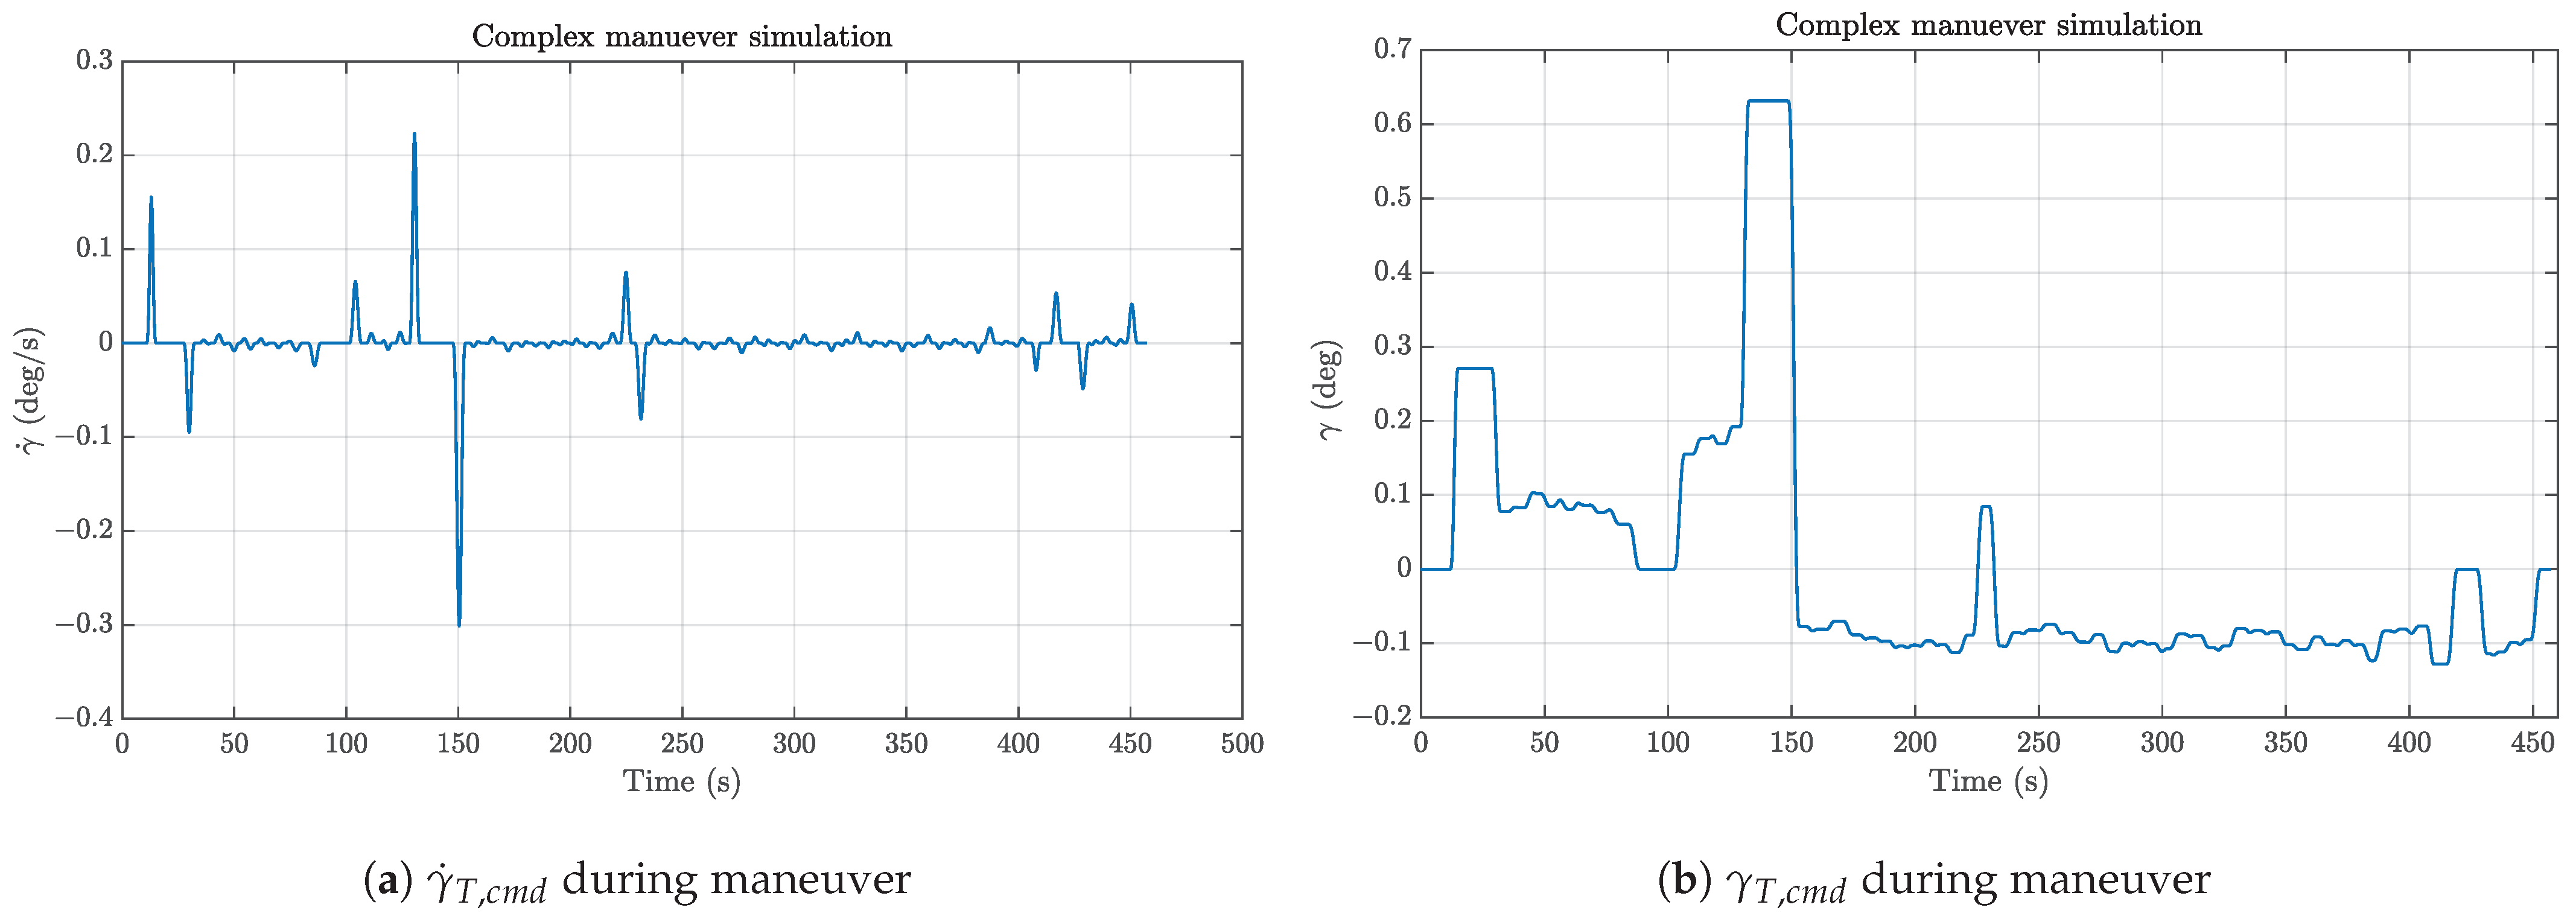
As mentioned earlier, the trajectory is represented by the commands that are generated and sent to the trajectory controller. For the complex 3D trajectory showcased, the commands are shown in Figure 30 and Figure 31.
Looking at the turn rate, χ ˙ T , c m d in Figure 30a, the first thing we notice is that we have a small region where it is positive, followed by a larger region where it goes into the negative values. This simply represents the direction of the turn as we see in Figure 29, where the first circular maneuver is going to the right, while the following three circular maneuvers are going to the left. The next thing we see is that we do not have a constant turn rate. Rather, it goes to some steady state value and rapidly comes back to 0. This is also reflected in Figure 30a, where the course χ T , c m d exhibits a smooth staircase-like behavior when rising or falling. This is because, as mentioned earlier, the trajectory is made up of several waypoints with the flyby transition. And a flyby is made of a turn-in section, circular arc, and turn-out section, to go back to a straight line. By placing several flyby waypoints close to each other, we are able to simulate circular maneuvers within a certain degree of accuracy. Additionally, we see four apparent jumps in χ T , c m d . These happen during the turns, and are simply the angle wrapping between 0 and 360 degrees.
Figure 29. 3D trajectory.
Aerospace 11 00157 g029
Figure 30. Horizontal plane commands during maneuver of Figure 29.
Aerospace 11 00157 g030
Figure 31. Vertical plane commands during maneuver of Figure 29.
Aerospace 11 00157 g031
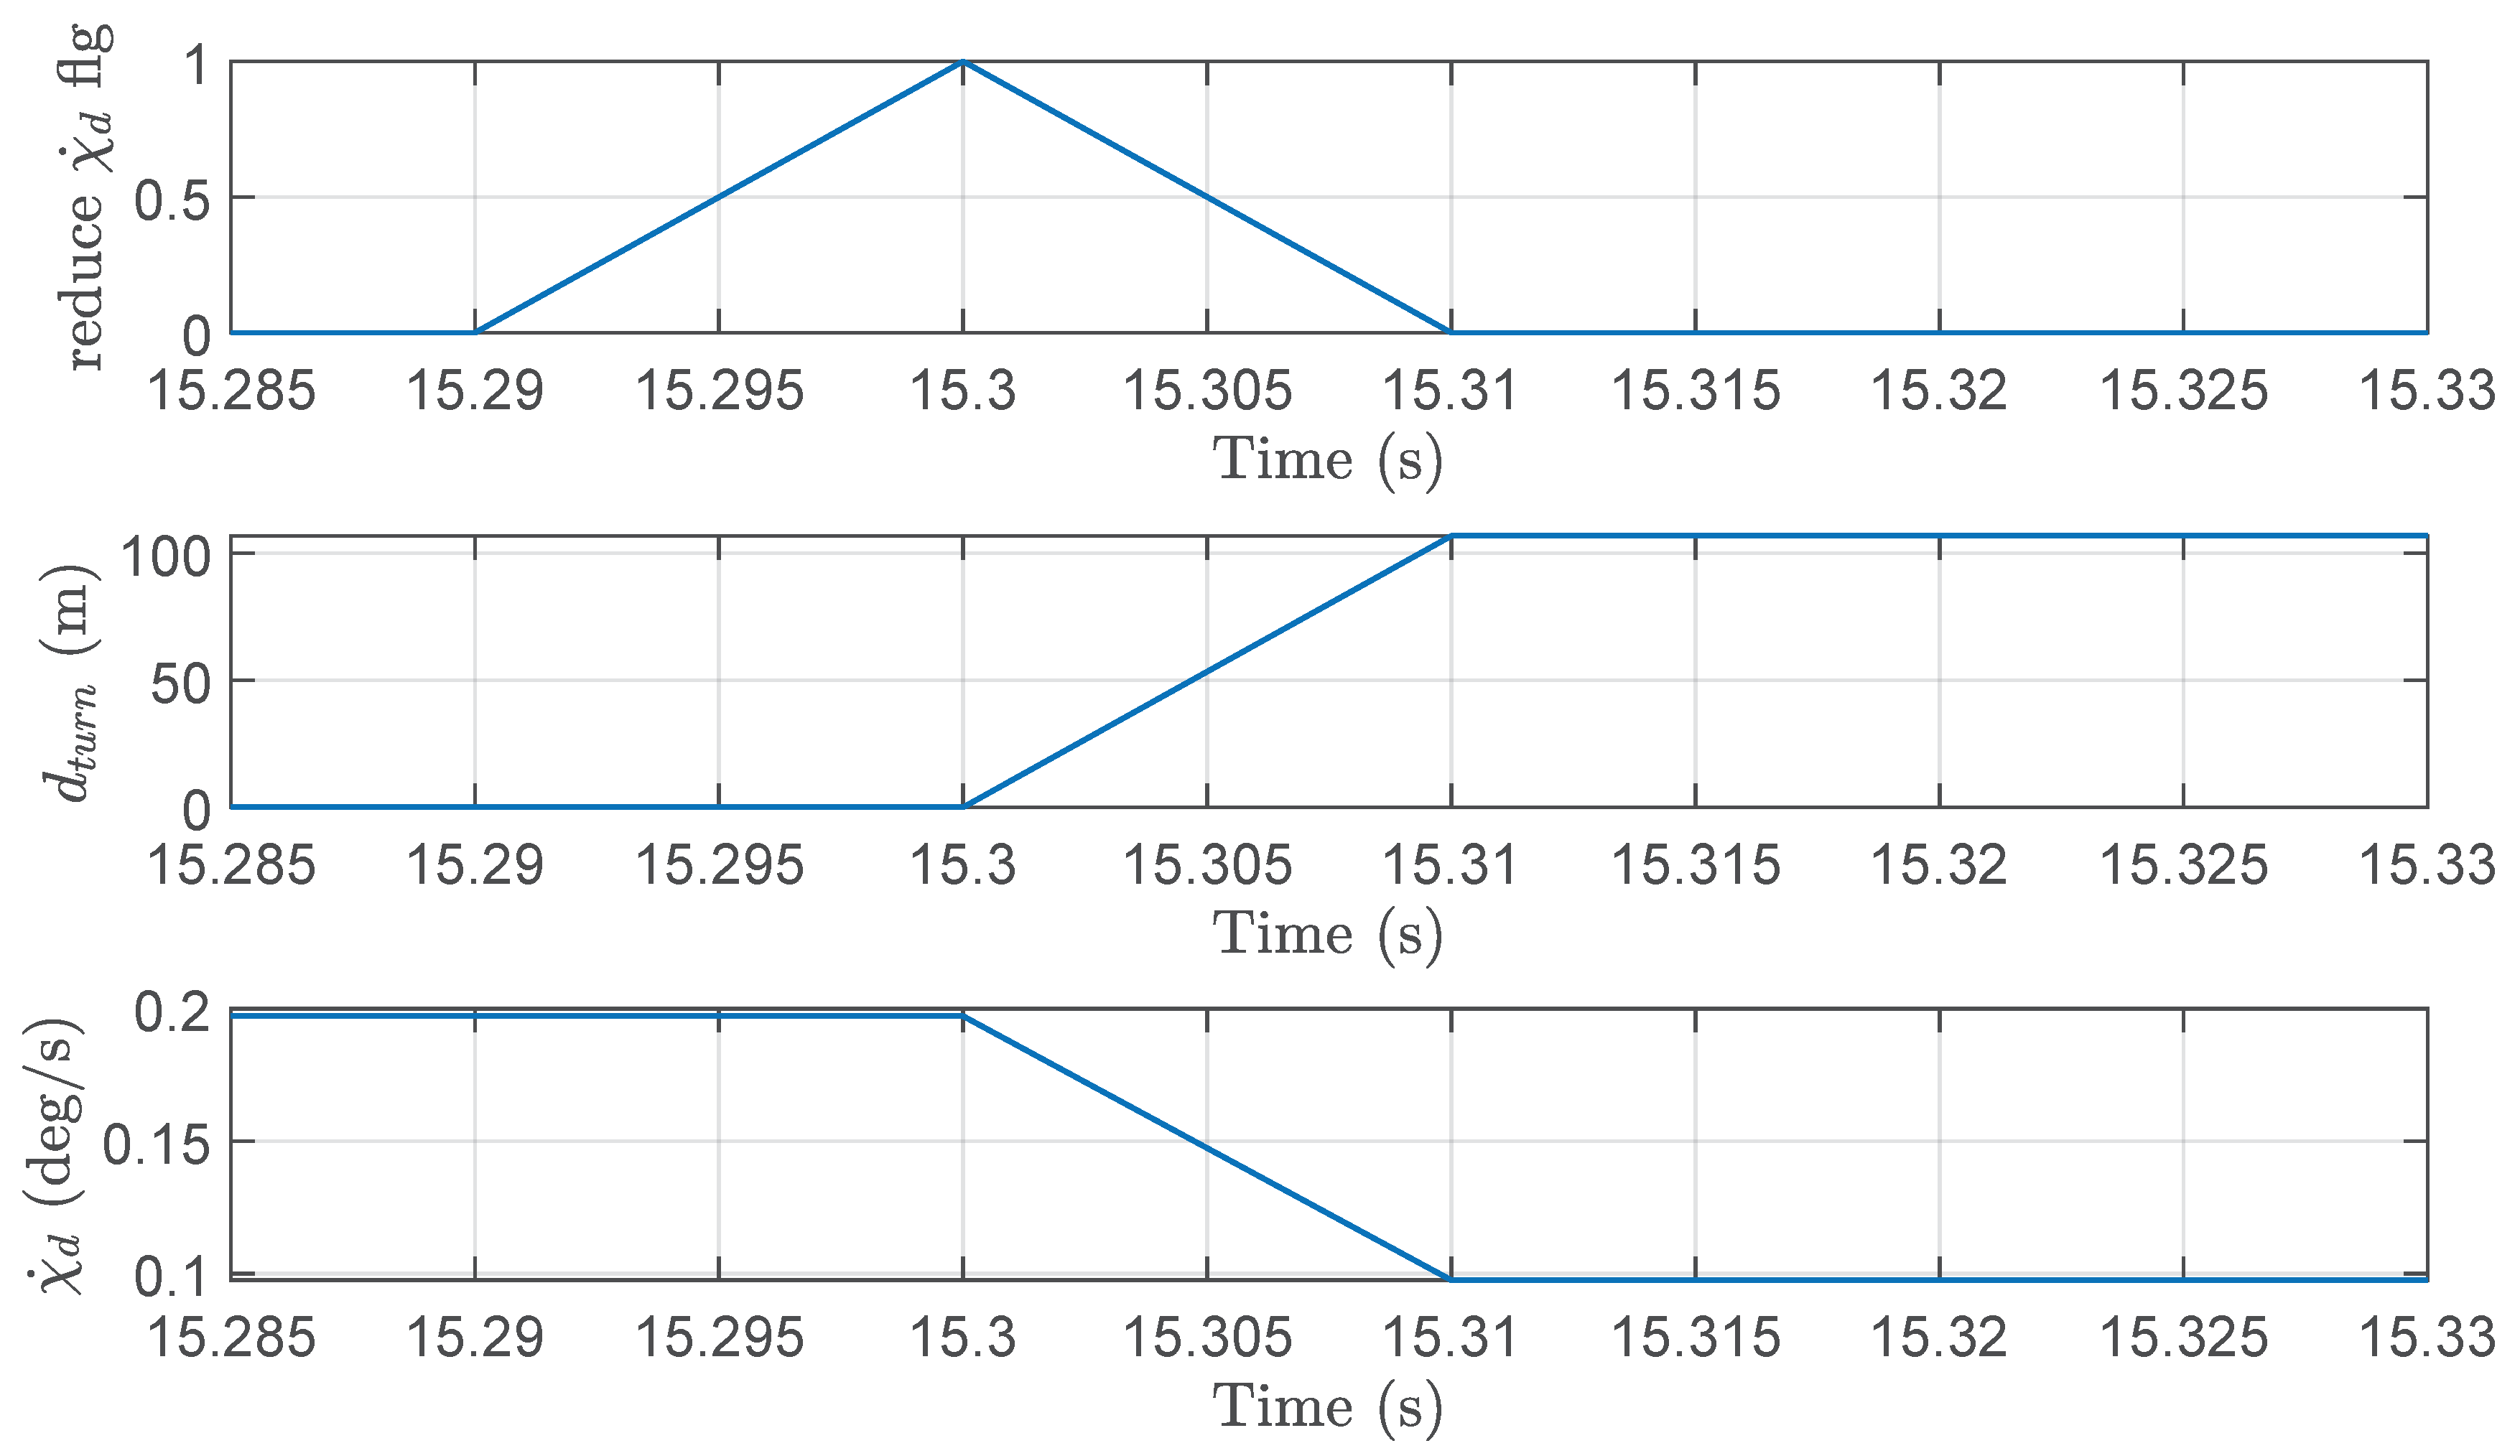
Finally, we notice that, for most of the turns, the turn rate χ ˙ T , c m d goes to a steady state value of just a little over 10 deg/s. This is the design turn rate. However, for some of the turns, χ ˙ T , c m d goes to a value that seems to be random. These are turns where the angle between the legs is larger than the limit (see Equation (64)), and the dynamic turn rate formula shown in Section 4.2.1 is triggered, effectively adjusting the desired χ ˙ T , d .
A closer look at the internal moding is shown in Figure 32. In the first sub-figure, we see the moment when the system realizes that χ ˙ T , d is too high to perform the upcoming turn, and it raises the reduce χ ˙ T , d flag. We also know that the system is unable to perform the turn because the turn distance d t u r n in the second sub-figure is zero, meaning that the turn mode will not be activated. We will simply have a jump in the χ T , c m d command when we reach the waypoint. Next, we see in the third sub-figure that the desired turn rate is reduced from 0.2 to 0.1 , which effectively makes the turn possible, and the d t u r n goes to a non-zero value.
In Figure 31, we see the commands in the vertical plane, which are given simultaneously with those in the horizontal plane to achieve the 3D trajectory in Figure 29. The values of γ T , c m d and γ ˙ T , c m d are relatively small compared to the other commands because the maneuver is performed with a small change in altitude, with a maximum altitude of 20 m.
Figure 32. Dynamic turn rate moding.
Aerospace 11 00157 g032

6. Conclusions

This paper presents a deterministic trajectory-generation module based on clothoid in the horizontal plane and a high-order polynomial in the vertical plane for eVTOL applications. The clothoid-based approach used in the horizontal plane was also discussed in [38], where three suitable functions for generating deterministic trajectories are presented: cubic splines, trigonometric splines, and clothoids. These functions are widely used for path planning due to their simplicity in constructing smooth trajectories.
The trajectory is constructed by combining straight line, clothoid, and circular arc segments. The clothoid is used here as a transition segment between the straight line and clothoid, to provide continuous curvature in the trajectory. We conducted an analysis of the geometrical construction of flyby maneuvers, where a turn is made by a turn-in segment (clothoid), a circular arc segment, and a turn-out segment (clothoid). By using this three-segment approach for the flyby, we show that there will be an inherent limitation to the maximum angle allowed between legs in the flight plan. We show that this limitation is also linked to the use of a constant turn design turn rate used for the maneuvers. Therefore, the solution presented is to make the turn rate dynamic in order to accommodate larger angles between legs.
Our analysis also looks at the turn distance, which affects the required minimum distance between any two waypoints in the flight plan. We show the connection between the turn rate and the turn distance and propose to use a high turn rate for eVTOL in order to minimize the required minimum distance between waypoints. Therefore, the design turn rate is set to the maximum achievable by the aircraft, and is dynamically changed if the angle between the legs is too large. This highlights the need for a feasibility gateway, which checks the flight plan at the moment of upload, to make sure that the distance between waypoint is enough for the maneuvers, and if the angle between the legs is too large, that the resulting turn rate, and correspondingly turn distance would still be feasible.
The analysis presented in this paper is carried out through an analytical derivation of the equations governing the trajectory generation construct, and is confirmed via the simulation of a point mass model and the derived equations.
In addition to the clothoid-based horizontal plane trajectory, we present a polynomial-based approach for the vertical plane. We use a ninth-order polynomial where the expressions of the coefficients of the polynomial are calculated offline by considering the continuity requirements in the trajectory. This allows us to use a high-order polynomial without the high computational requirements typically associated with the optimization of the polynomial. We then combined the horizontal and vertical planes in order to generate 3D trajectories.
The concepts presented in the paper were implemented in Simulink® R2021a, together with a point mass model assuming perfect tracking of the commands generated by the TrajGen module. The results of our analysis are shown in the paper, along with simulation results.

7. Recommendations for Future Work

The clothoid segment used in this work allowed us to only achieve a second-degree continuity in the control commands. In the future, this function should be replaced with a higher degree of continuity without requiring an excessive amount of computational power.
In addition, as shown in the paper, the clothoid only uses the linearly estimated time for the duration of a bank angle maneuver. This is an oversimplification, and it does not account for the aircraft dynamics. Future works should consider possible ways of accounting for all the dynamics. This point also stands for the polynomial used in the vertical plane.
Another thing is that this paper only considers the flyby maneuver. However, one of the goals of this endeavor is to fully support the maneuvers defined in the ARINC 424 standard [39]. Therefore, future works are planned to extend the supported maneuvers of the system.
Finally, this paper only considers the cruise flight mode for eVTOLs. Future works should consider the extended maneuver envelope of eVTOLs in order to fully explore their capabilities.

Author Contributions

Conceptualization, Z.M., A.S., M.S. and F.H.; methodology, Z.M., A.S., D.H., M.S. and F.H.; software, Z.M., P.R. and A.S.; validation, Z.M., A.S. and D.H.; formal analysis, Z.M., A.S. and H.L.; investigation, Z.M., A.S. and P.R.; resources, F.H.; data curation, Z.M., A.S. and P.R.; writing—original draft preparation, Z.M., A.S., D.H., P.R. and M.S.; writing—review and editing, Z.M., A.S., H.L., D.H. and F.H.; visualization, Z.M., A.S. and P.R.; supervision, F.H. and H.L.; project administration, F.H.; funding acquisition, F.H. All authors have read and agreed to the published version of the manuscript.

Funding

This research received no external funding.

Data Availability Statement

Data are contained within the article.

Conflicts of Interest

The authors declare no conflicts of interest.

Abbreviations

The following abbreviations are used in this manuscript:
eVTOLElectric Vertical Take-Off and Landing
RRTRapidly exploring Random Tree
BLPBi-Level Programming
UAVUnmanned Aerial Vehicle
TrajGenTrajectory Generation
Symbol
AClothoid shaping parameter
a m Coefficient of a polynomial
c Curve in a 2D Euclidean space
b 0 Line coefficient for approximation of atan
c x , c y x- and y- components of a curve c
c l p n Clothoid point n
subscript   c m d Command
d a p Distance from the TO waypoint to the auxiliary point
d c c Distance from the TO waypoint to the center of the maneuver circle
d t u r n Turn distance
subscript   d Desired
g 0 gravity acceleration
h T F Altitude of a reference point F
M φ Meridian radius of curvature
N φ Prime vertical radius of curvature
pRoll rate
r c Radius of a maneuver circle
sArc length of a curve c
s h o r Distance traveled in the horizontal plane
t tangent vector
T Unit tangent vector
T p Roll time constant
V p Planning speed
V b u f f e r Buffer speed used for in the planning speed
V T Kinematic speed
Δ x c l , Δ y c l Change in position of induced by a clothoid segment
μ Kinematic bank angle command
χ ˙ T Turn rate
Δ χ T Change in course
α T Angle between two legs in the flight plan
γ T F Climb angle of a reference point F
ω Bandwidth
τ Running parameter/dimensionless time of a curve c
χ T R Kinematic course angle of a reference point R
λ Longitude
κ Curvature
φ Angle representing change in direction over an arc length s

References

  1. Goerzen, C.; Kong, Z.; Mettler, B. A survey of motion planning algorithms from the perspective of autonomous UAV guidance. J. Intell. Robot. Syst. 2010, 57, 65–100. [Google Scholar] [CrossRef]
  2. Karaman, S.; Frazzoli, E. Sampling-based algorithms for optimal motion planning. Int. J. Robot. Res. 2011, 30, 846–894. [Google Scholar] [CrossRef]
  3. Devaurs, D.; Siméon, T.; Cortés, J. Optimal path planning in complex cost spaces with sampling-based algorithms. IEEE Trans. Autom. Sci. Eng. 2015, 13, 415–424. [Google Scholar] [CrossRef]
  4. LaValle, S.M.; James J Kuffner, J. Randomized Kinodynamic Planning. SageJournals 2001, 20, 378–400. [Google Scholar] [CrossRef]
  5. Zhao, Y.; Zheng, Y.L. Survey on computational-intelligence-based UAV path planning. Knowl.-Based Syst. 2018, 158, 54–64. [Google Scholar] [CrossRef]
  6. Qu, C.; Gai, W.; Zhong, M.; Zhang, J. A novel reinforcement learning based grey wolf optimizer algorithm for unmanned aerial vehicles (UAVs) path planning. Appl. Soft Comput. 2020, 89, 106099. [Google Scholar] [CrossRef]
  7. Satai, H.A.; Zahra, M.M.A.; Rasool, Z.I.; Abd-Ali, R.S.; Pruncu, C.I. Bézier Curves-Based Optimal Trajectory Design for Multirotor UAVs with Any-Angle Pathfinding Algorithms. Sensors 2021, 21, 2460. [Google Scholar] [CrossRef] [PubMed]
  8. Liu, W.; Zheng, Z.; Cai, K.Y. Bi-level programming based real-time path planning for unmanned aerial vehicles. Knowl.-Based Syst. 2013, 44, 34–47. [Google Scholar] [CrossRef]
  9. Bousson, K.; Machado, P.F. 4D trajectory generation and tracking for waypoint-based aerial navigation. WSEAS Trans. Syst. Control 2013, 3, 105–119. [Google Scholar]
  10. Hentschel, M.; Lecking, D.; Wagner, B. Deterministic path planning and navigation for an autonomous fork lift truck. IFAC Proc. Vol. 2007, 40, 102–107. [Google Scholar] [CrossRef]
  11. Schneider, V.; Piprek, P.; Schatz, S.P.; Baier, T.; Dörhöfer, C.; Hochstrasser, M.; Gabrys, A.; Karlsson, E.; Krause, C.; Lauffs, P.J.; et al. Online trajectory generation using clothoid segments. In Proceedings of the 2016 14th International Conference on Control, Automation, Robotics and Vision (ICARCV), Phuket, Thailand, 13–15 November 2016; pp. 1–6. [Google Scholar]
  12. Schneider, V.; Mumm, N.C.; Holzapfel, F. Trajectory generation for an integrated mission management system. In Proceedings of the 2015 IEEE International Conference on Aerospace Electronics and Remote Sensing Technology (ICARES), Bali, Indonesia, 3–5 December 2015; pp. 1–7. [Google Scholar]
  13. Schatz, S.P.; Schneider, V.; Karlsson, E.; Holzapfel, F.; Baier, T.; Dörhöfer, C.; Hochstrasser, M.; Gabrys, A.; Krause, C.; Lauffs, P.J.; et al. Flightplan flight tests of an experimental DA42 general aviation aircraft. In Proceedings of the 2016 14th International Conference on Control, Automation, Robotics and Vision (ICARCV), Phuket, Thailand, 13–15 November 2016; pp. 1–6. [Google Scholar]
  14. Dubins, L.E. On curves of minimal length with a constraint on average curvature, and with prescribed initial and terminal positions and tangents. Am. J. Math. 1957, 79, 497–516. [Google Scholar] [CrossRef]
  15. Schneider, V. Trajectory Generation for Integrated Flight Guidance. Ph.D. Thesis, Technische Universität München, Munich, Germany, 2018. [Google Scholar]
  16. Casey, J. Exploring Curvature; Springer Science & Business Media: Berlin/Heidelberg, Germany, 2012. [Google Scholar]
  17. Walton, D.J.; Meek, D.S. A controlled clothoid spline. Comput. Graph. 2005, 29, 353–363. [Google Scholar] [CrossRef]
  18. Levien, R. The Euler Spiral: A Mathematical History; Technical Report No. UCB/EECS-2008-111; University of California: Berkeley, CA, USA, 2008. [Google Scholar]
  19. Sendra, J.R.; Winkler, F. Symbolic parametrization of curves. J. Symb. Comput. 1991, 12, 607–631. [Google Scholar] [CrossRef]
  20. Peterson, J.W. Arc Length Parameterization of Spline Curves. J. Comput. Aided Des. 2006. Available online: http://www.saccade.com/writing/graphics/RE-PARAM.PDF (accessed on 10 December 2023).
  21. Morvan, J.M.; Morvan, J. Generalized Curvatures; Springer: Berlin/Heidelberg, Germany, 2008. [Google Scholar]
  22. Alexander, D.C.; Koeberlein, G.M. Elementary Geometry for College Students; Cengage Learning: Singapore, 2014. [Google Scholar]
  23. Herman, E.; Strang, G. Calculus Volume 2; OpenStax: Houston, TX, USA, 2016. [Google Scholar]
  24. Farouki, R.T.; Pelosi, F.; Sampoli, M.L. Approximation of monotone clothoid segments by degree 7 Pythagorean–hodograph curves. J. Comput. Appl. Math. 2021, 382, 113110. [Google Scholar] [CrossRef]
  25. Sandoval-Hernandez, M.; Vazquez-Leal, H.; Hernandez-Martinez, L.; Filobello-Nino, U.; Jimenez-Fernandez, V.; Herrera-May, A.; Castaneda-Sheissa, R.; Ambrosio-Lazaro, R.; Diaz-Arango, G. Approximation of Fresnel integrals with applications to diffraction problems. Math. Probl. Eng. 2018, 2018, 4031793. [Google Scholar] [CrossRef]
  26. Abramson, J. Precalculus 2e; OpenStax: Houston, TX, USA, 2021. [Google Scholar]
  27. Euclid. Euclid’s Elements; 300 BC; Printed by Erhard Ratdolt; Green Lion Press: Santa Fe, Mexico, 1482. [Google Scholar]
  28. Heimsch, D.; Söpper, M.; Speckmaier, M.; Mbikayi, Z.; Kellringer, S.; Holzapfel, F. Development and Implementation of a Safety Gateway for a Medical Evacuation eVTOL Aircraft. In Proceedings of the 2024 AIAA AVIATION Forum, Las Vegas, NV, USA, 29 July–3 August 2024. [Google Scholar]
  29. McLain, T.; Beard, R.W.; Owen, M. Implementing dubins airplane paths on fixed-wing uavs. In Handbook of Unmanned Aerial Vehicles; Springer: Berlin/Heidelberg, Germany, 2014. [Google Scholar]
  30. Lugo-Cárdenas, I.; Flores, G.; Salazar, S.; Lozano, R. Dubins path generation for a fixed wing UAV. In Proceedings of the 2014 International Conference on Unmanned Aircraft Systems (ICUAS), Orlando, FL, USA, 27–30 May 2014; pp. 339–346. [Google Scholar]
  31. Sabetghadam, B.; Cunha, R.; Pascoal, A. Real-time trajectory generation for multiple drones using bézier curves. IFAC-PapersOnLine 2020, 53, 9276–9281. [Google Scholar] [CrossRef]
  32. Petit, P.J.; Wartmann, J.; Fragnière, B.; Greiser, S. Waypoint based online trajectory generation and following control for the ACT/FHS. In Proceedings of the AIAA Scitech 2019 Forum, San Diego, CA, USA, 7–11 January 2019; p. 0918. [Google Scholar]
  33. Dmitriev, K.; Zafar, S.A.; Schmiechen, K.; Lai, Y.; Saleab, M.; Nagarajan, P.; Dollinger, D.; Hochstrasser, M.; Holzapfel, F.; Myschik, S. A lean and highly-automated model-based software development process based on do-178c/do-331. In Proceedings of the 2020 AIAA/IEEE 39th Digital Avionics Systems Conference (DASC), San Antonio, TX, USA, 11–15 October 2020; pp. 1–10. [Google Scholar]
  34. Piprek, P.; Schneider, V.; Fafard, V.; Schatz, S.P.; Dörhöfer, C.; Lauffs, P.J.; Peter, L.; Holzapfel, F. Enhanced kinematics calculation for an online trajectory generation module. Transp. Res. Procedia 2018, 29, 312–322. [Google Scholar] [CrossRef]
  35. Vanicek, P.; Krakiwsky, E.J. Geodesy: The Concepts; Elsevier: Amsterdam, The Netherlands, 2015. [Google Scholar]
  36. Scherer, S.; Speckmaier, M.; Gierszewski, D.; Mishra, C.; Steinert, A.C.; Steffensen, R.; Wulf, S.; Holzapfel, F. AUTOMATIC TAKE-OFF AND LANDING OF A VERY LIGHT ALL ELECTRIC OPTIONALLY PILOTED AIRCRAFT. In Proceedings of the 33rd Congress of the International Council of the Aeronautical Sciences (ICAS), Stockholm, Sweden, 4–9 September 2022. [Google Scholar]
  37. Scherer, S.; Mishra, C.; Holzapfel, F. Extension of the capabilities of an automatic landing system with procedures motivated by visual-flight-rules. In Proceedings of the 33rd Congress of the International Council of the Aeronautical Sciences (ICAS), Stockholm, Sweden, 4–9 September 2022. [Google Scholar]
  38. Labakhua, L.; Nunes, U.; Rodrigues, R.; Leite, F.S. Smooth trajectory planning for fully automated passengers vehicles: Spline and clothoid based methods and its simulation. In Proceedings of the Informatics in Control Automation and Robotics: Selected Papers from the International Conference on Informatics in Control Automation and Robotics 2006; Springer: Berlin/Heidelberg, Germany, 2008; pp. 169–182. [Google Scholar]
  39. Aeronautical Radio, Inc. ARINC 424-20 Navigation System Database; Aeronautical Radio, Inc.: Annapolis, ML, USA, 2011. [Google Scholar]
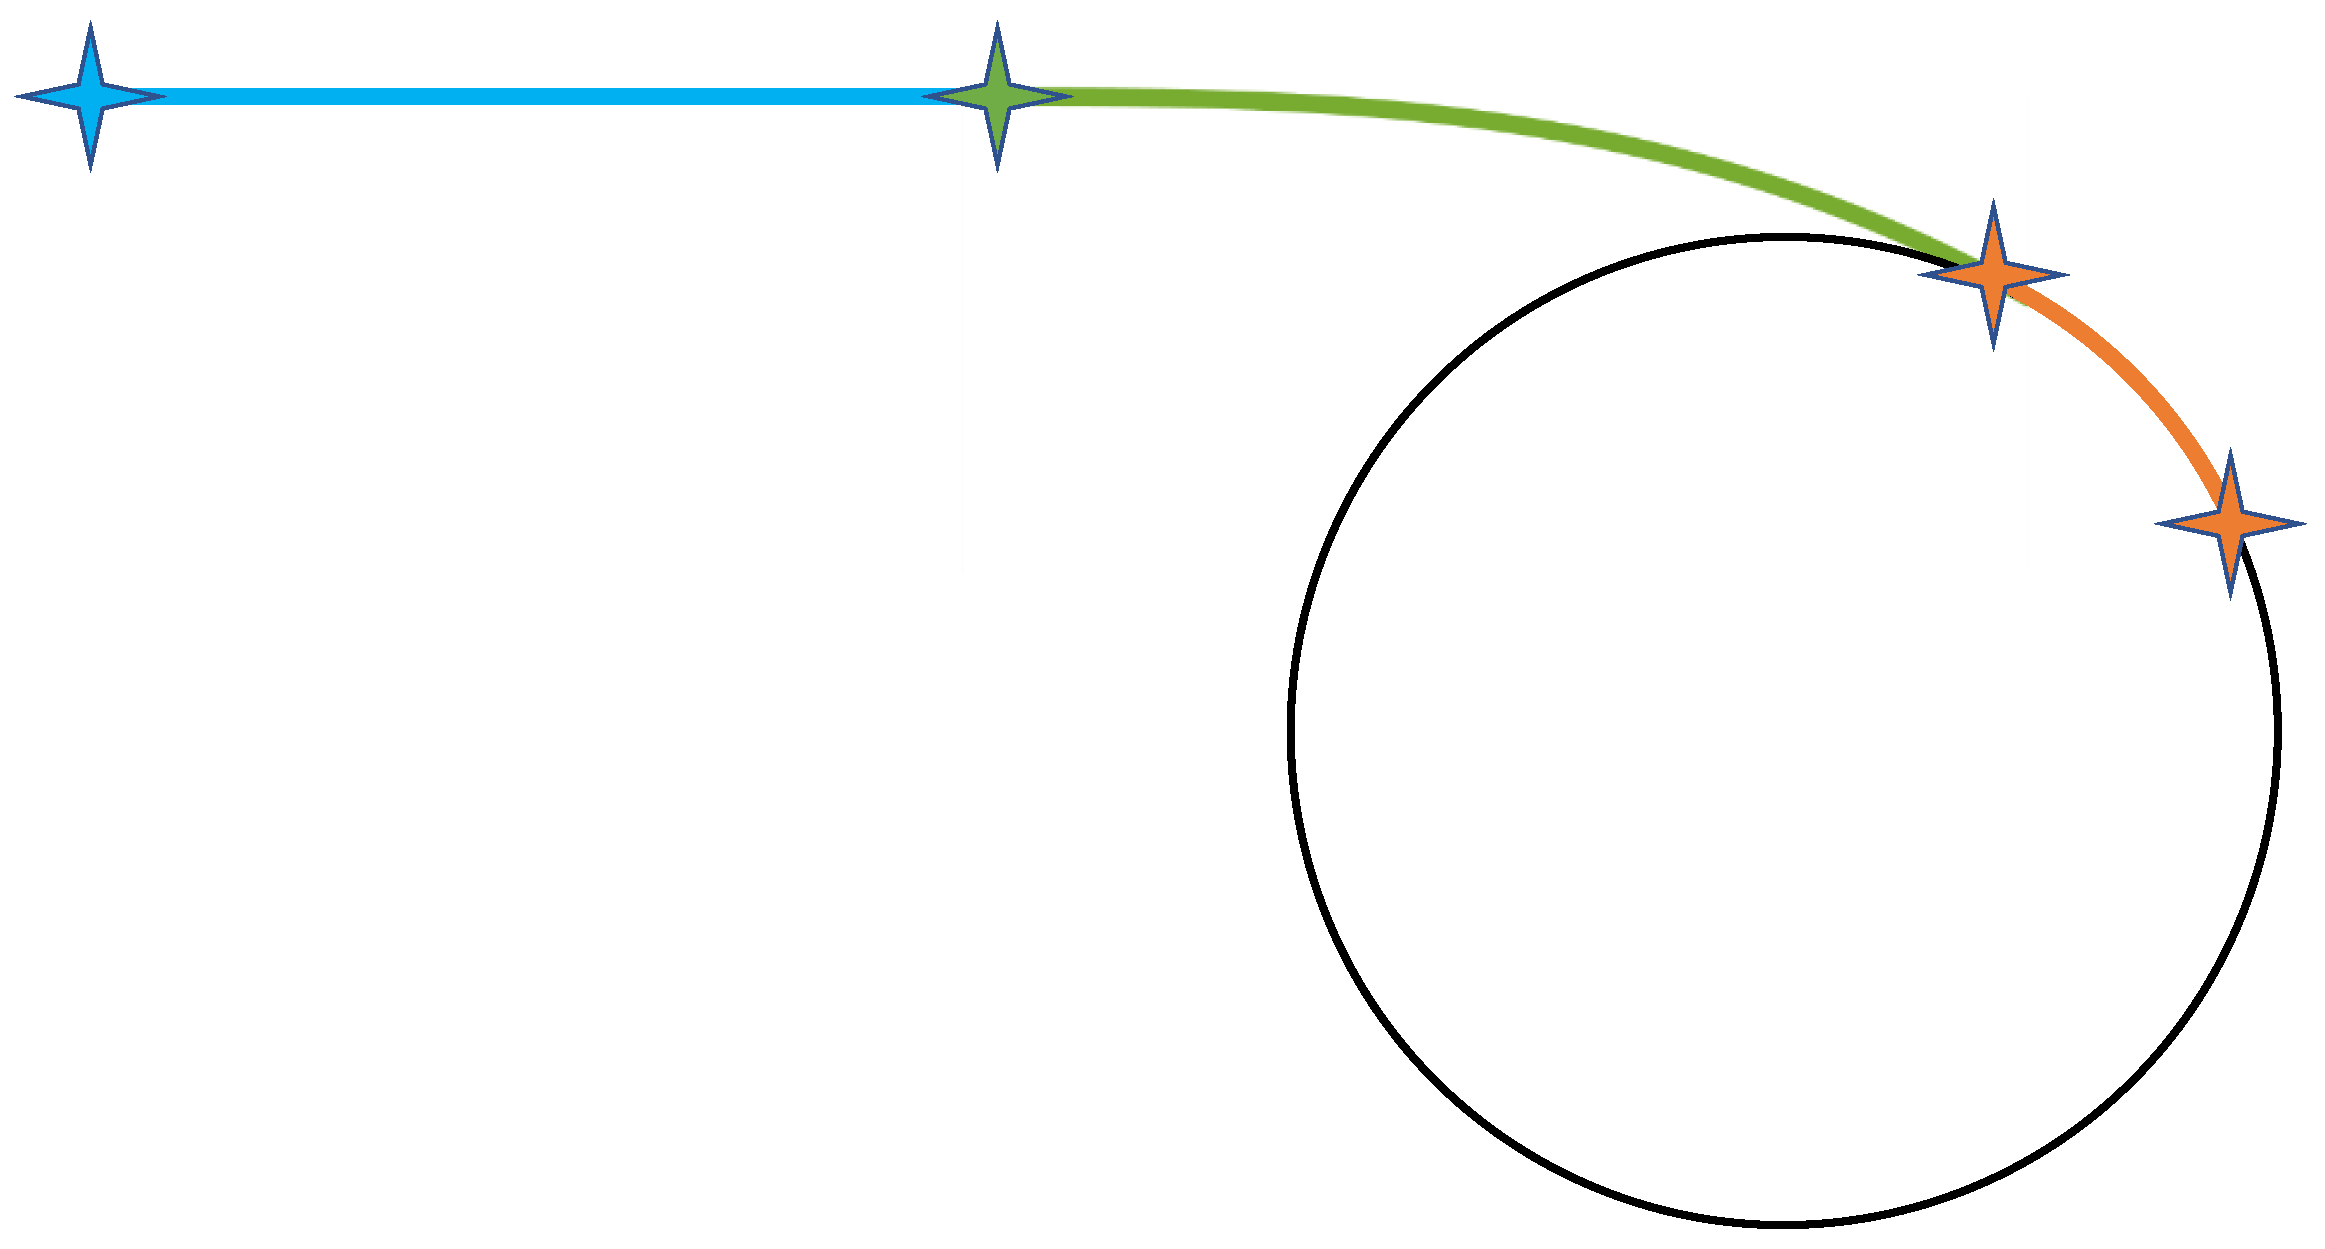
Figure 1. Connecting a straight line to a circle with a clothoid segment.
Aerospace 11 00157 g001
Figure 2. Straight line segment.
Aerospace 11 00157 g002
Figure 3. Circle segment.
Aerospace 11 00157 g003
Figure 4. Clothoid segment.
Aerospace 11 00157 g004
Figure 5. Comparison of power series approximation with Fresnel integral.
Aerospace 11 00157 g005
Figure 8. Closer look at the flyby geometry.
Aerospace 11 00157 g008
Figure 9. Vertical flyby.
Aerospace 11 00157 g009
Figure 10. Two successive fly-by transitions.
Aerospace 11 00157 g010
Figure 12. Approximation of the arctan function.
Aerospace 11 00157 g012
Figure 20. First order filter for dynamics simulation and differentiation.
Aerospace 11 00157 g020
Figure 24. Influence of χ ˙ on the flight path.
Aerospace 11 00157 g024
Figure 25. Influence of α T on the flight path.
Aerospace 11 00157 g025
Figure 26. Vertical plane trajectory.
Aerospace 11 00157 g026
Figure 27. Vertical flyby close-up.
Aerospace 11 00157 g027
Figure 28. Combined vertical and horizontal flyby.
Aerospace 11 00157 g028
Table 1. Conditions for altitude polynomial [15].
Condition ParameterCondition for s = 0 Condition for s = s tot , hor
h T F h T P 1 h T P 2
h T F tan γ T P 1 tan γ T P 2
h T F 00
h T F 00
h T F 00
Table 2. Coefficients of the altitude polynomial of Equation (56).
CoefficientExpression
a 0 h p 1
a 1 h p 2
a 2 0
a 3 0
a 4 0
a 5 14 9 h p 1 9 h p 2 + 5 h b 1 s tot + 4 h b 2 s tot s tot 5
a 6 28 15 h p 1 15 h p 2 + 8 h b 1 s tot + 7 h b 2 s tot s tot 6
a 7 20 27 h p 1 27 h p 2 + 14 h b 1 s tot + 13 h b 2 s tot s tot 7
a 8 5 63 h p 1 63 h p 2 + 32 h b 1 s tot + 31 h b 2 s tot s tot 8
a 9 35 2 h p 1 2 h p 2 + h b 1 s tot + h b 2 s tot s tot 9
Disclaimer/Publisher’s Note: The statements, opinions and data contained in all publications are solely those of the individual author(s) and contributor(s) and not of MDPI and/or the editor(s). MDPI and/or the editor(s) disclaim responsibility for any injury to people or property resulting from any ideas, methods, instructions or products referred to in the content.