
Round-Robin Study for Ice Adhesion Tests

 , ,
, ,  ,
,  ,
,  , , ,
, , ,  , ,
, ,  and
and
Abstract
1. Introduction
2. Materials and Methods
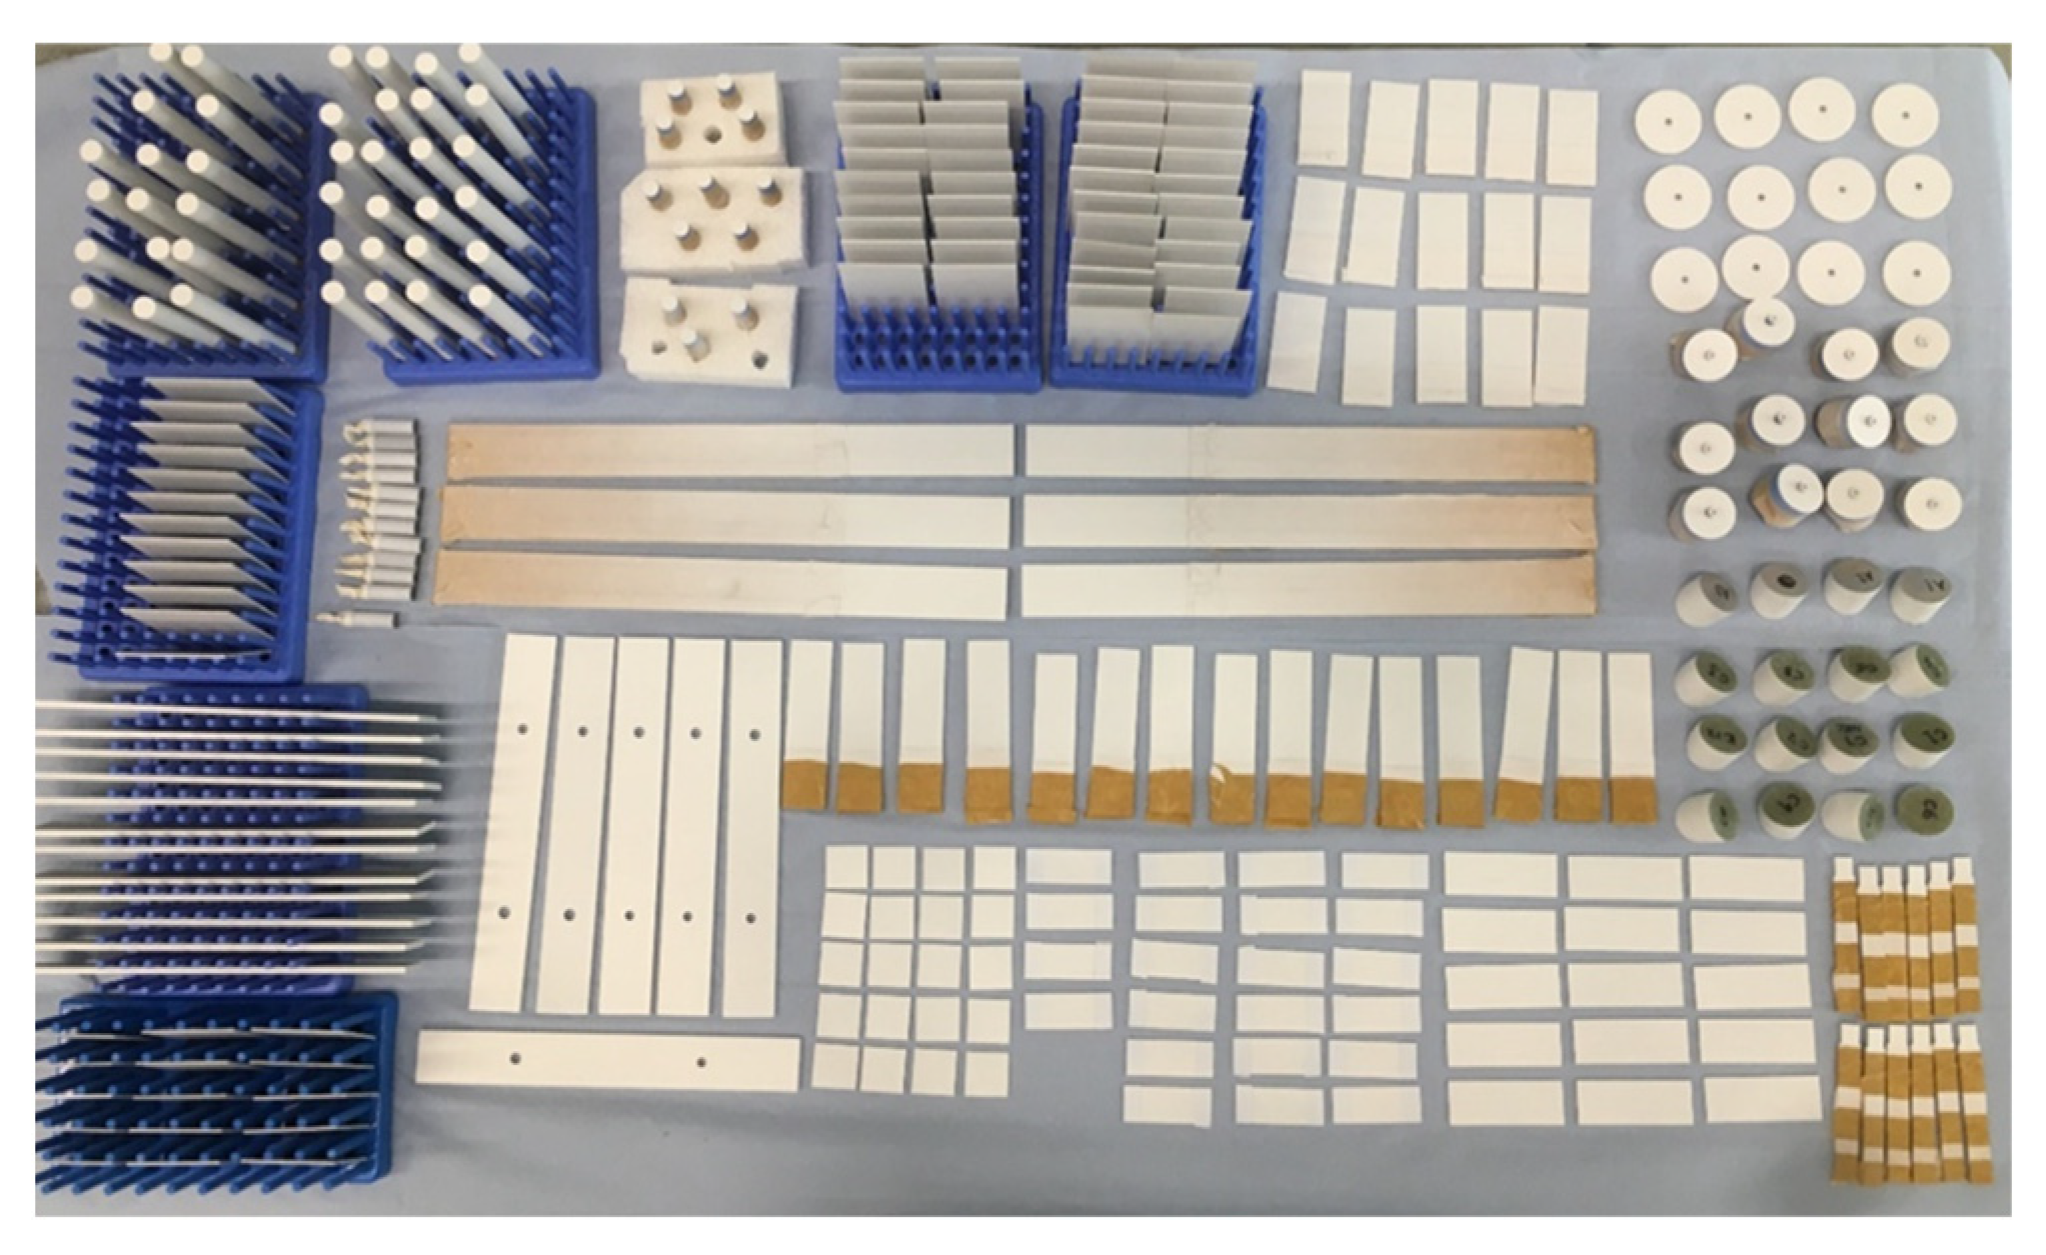
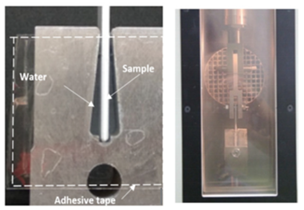
2.1. Test Sample Preparation
2.2. Surface Characterizations
2.3. Ice Adhesion Test Methods
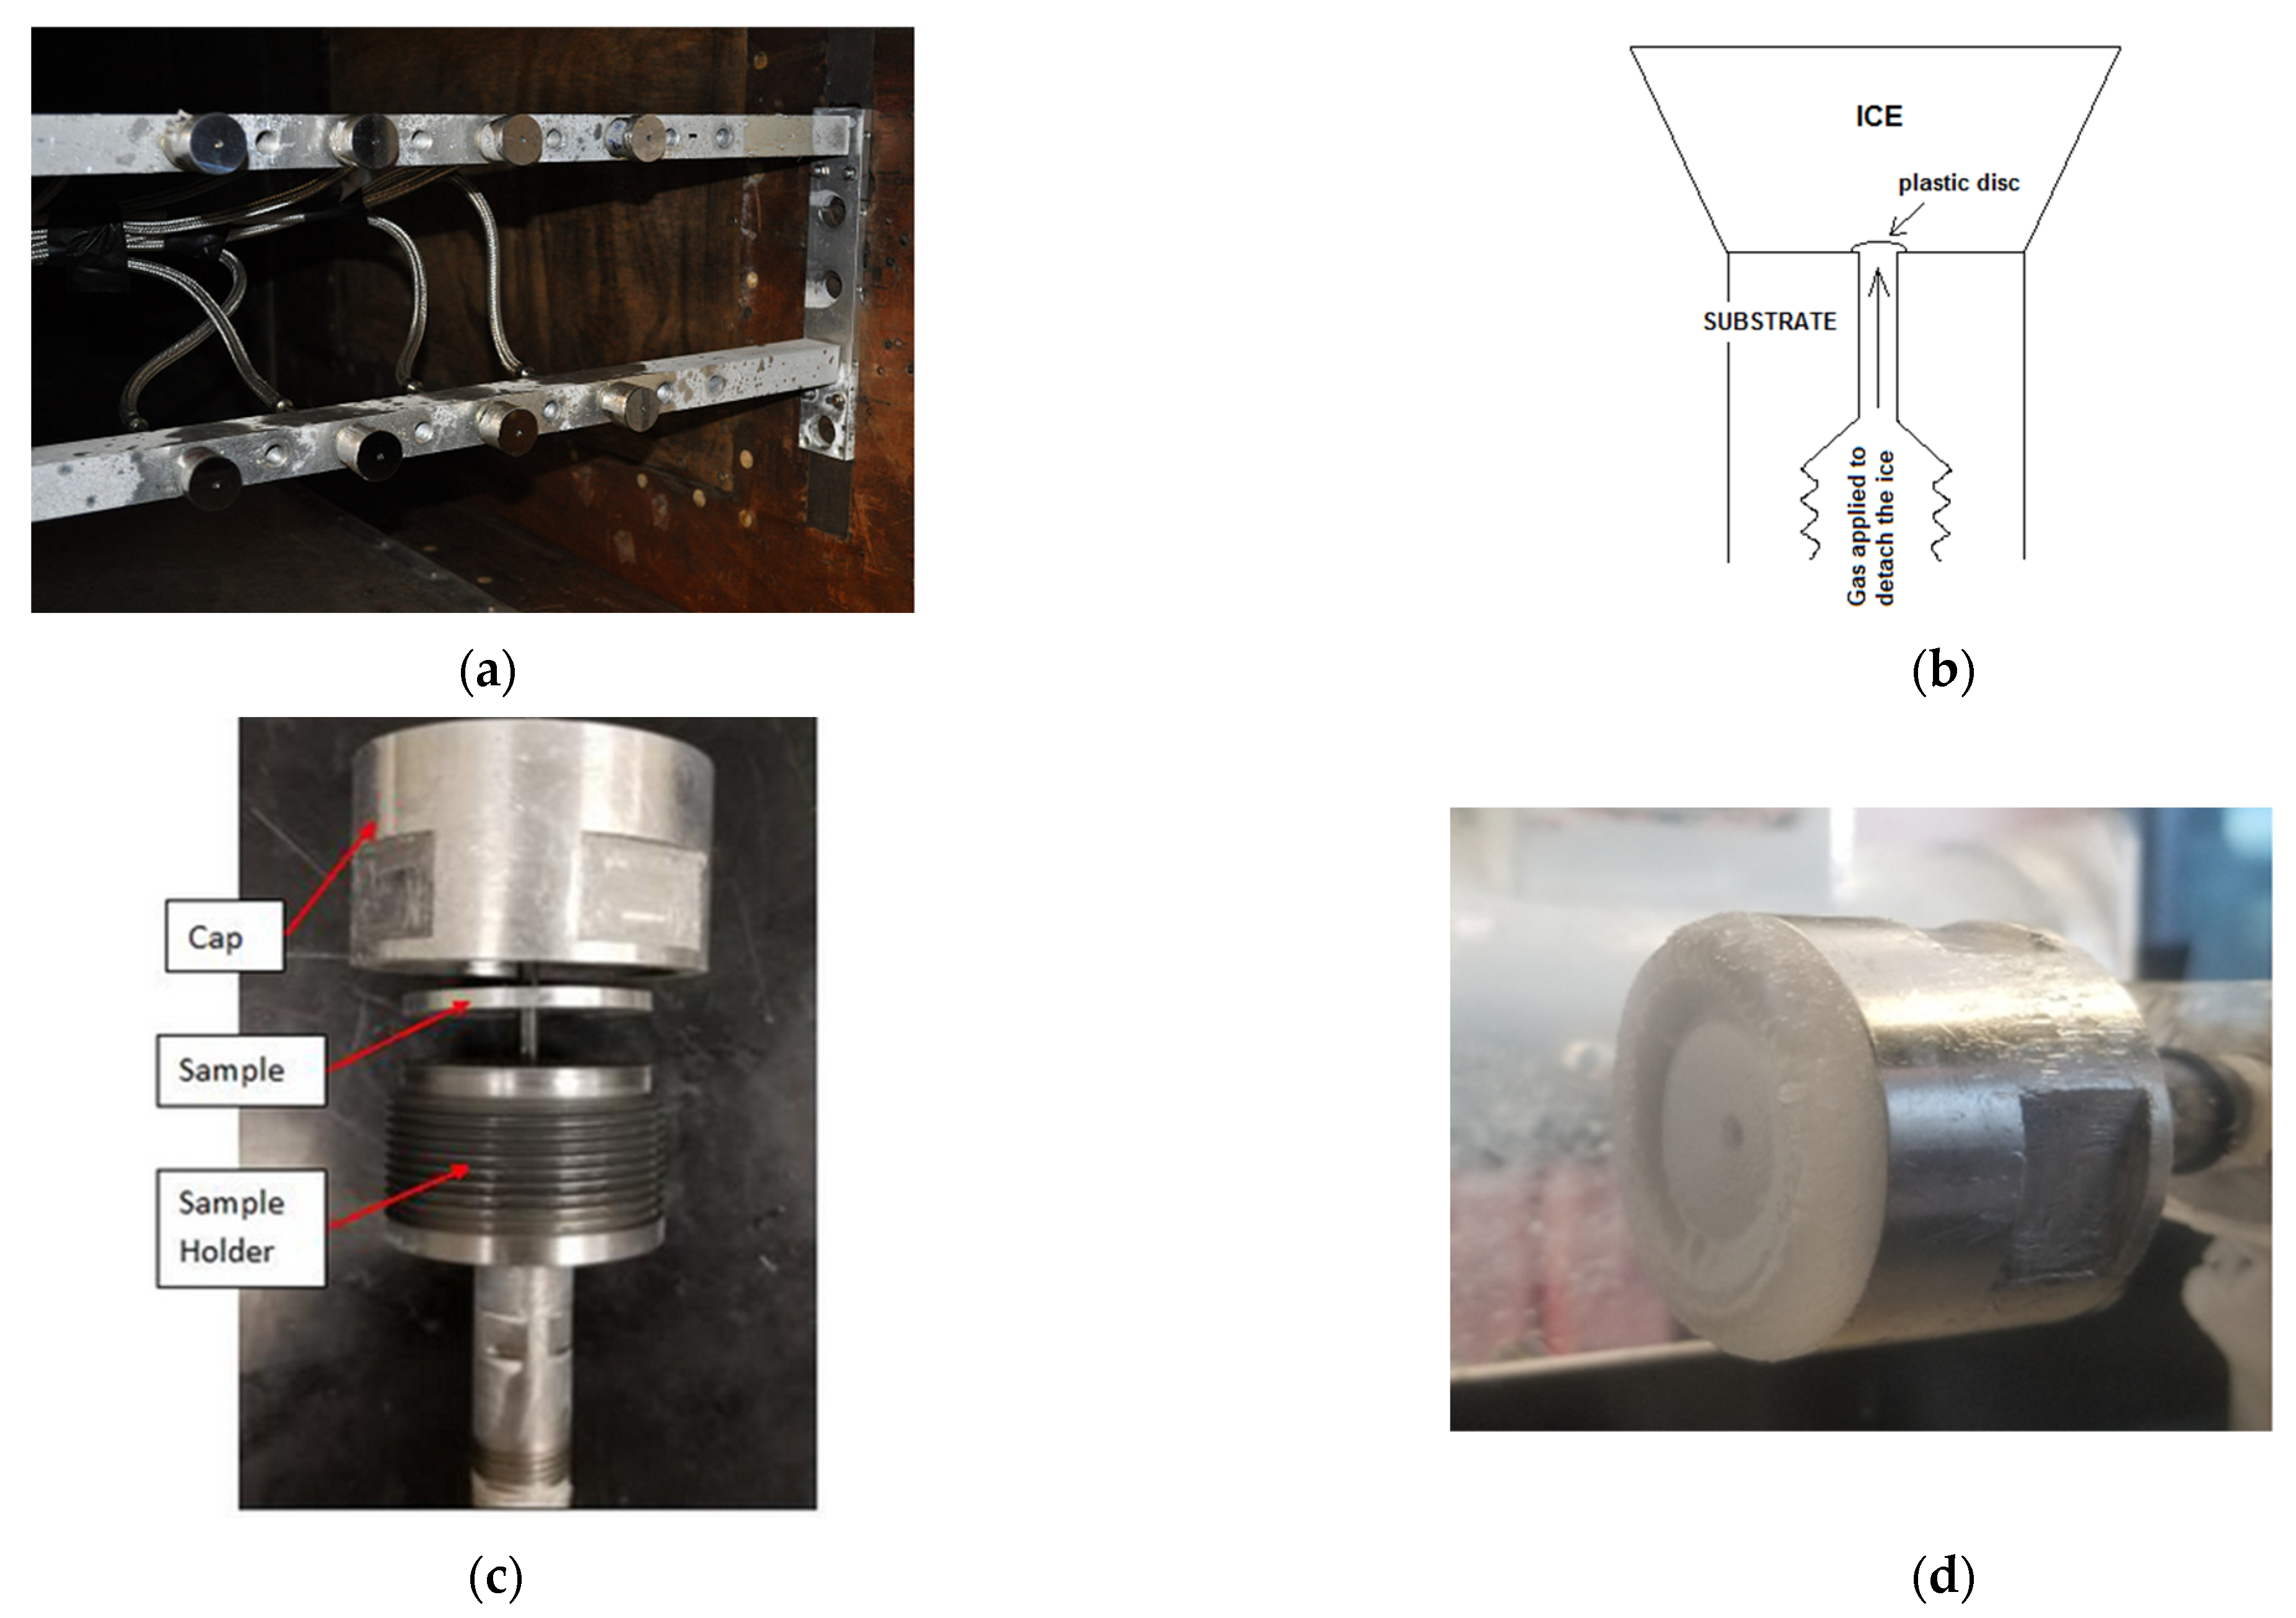
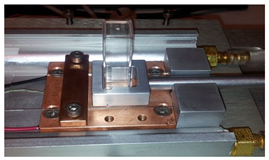
2.3.1. Direct Mechanical Tests (RSE, INTA, NTNU, RISE, ND, and CRREL)
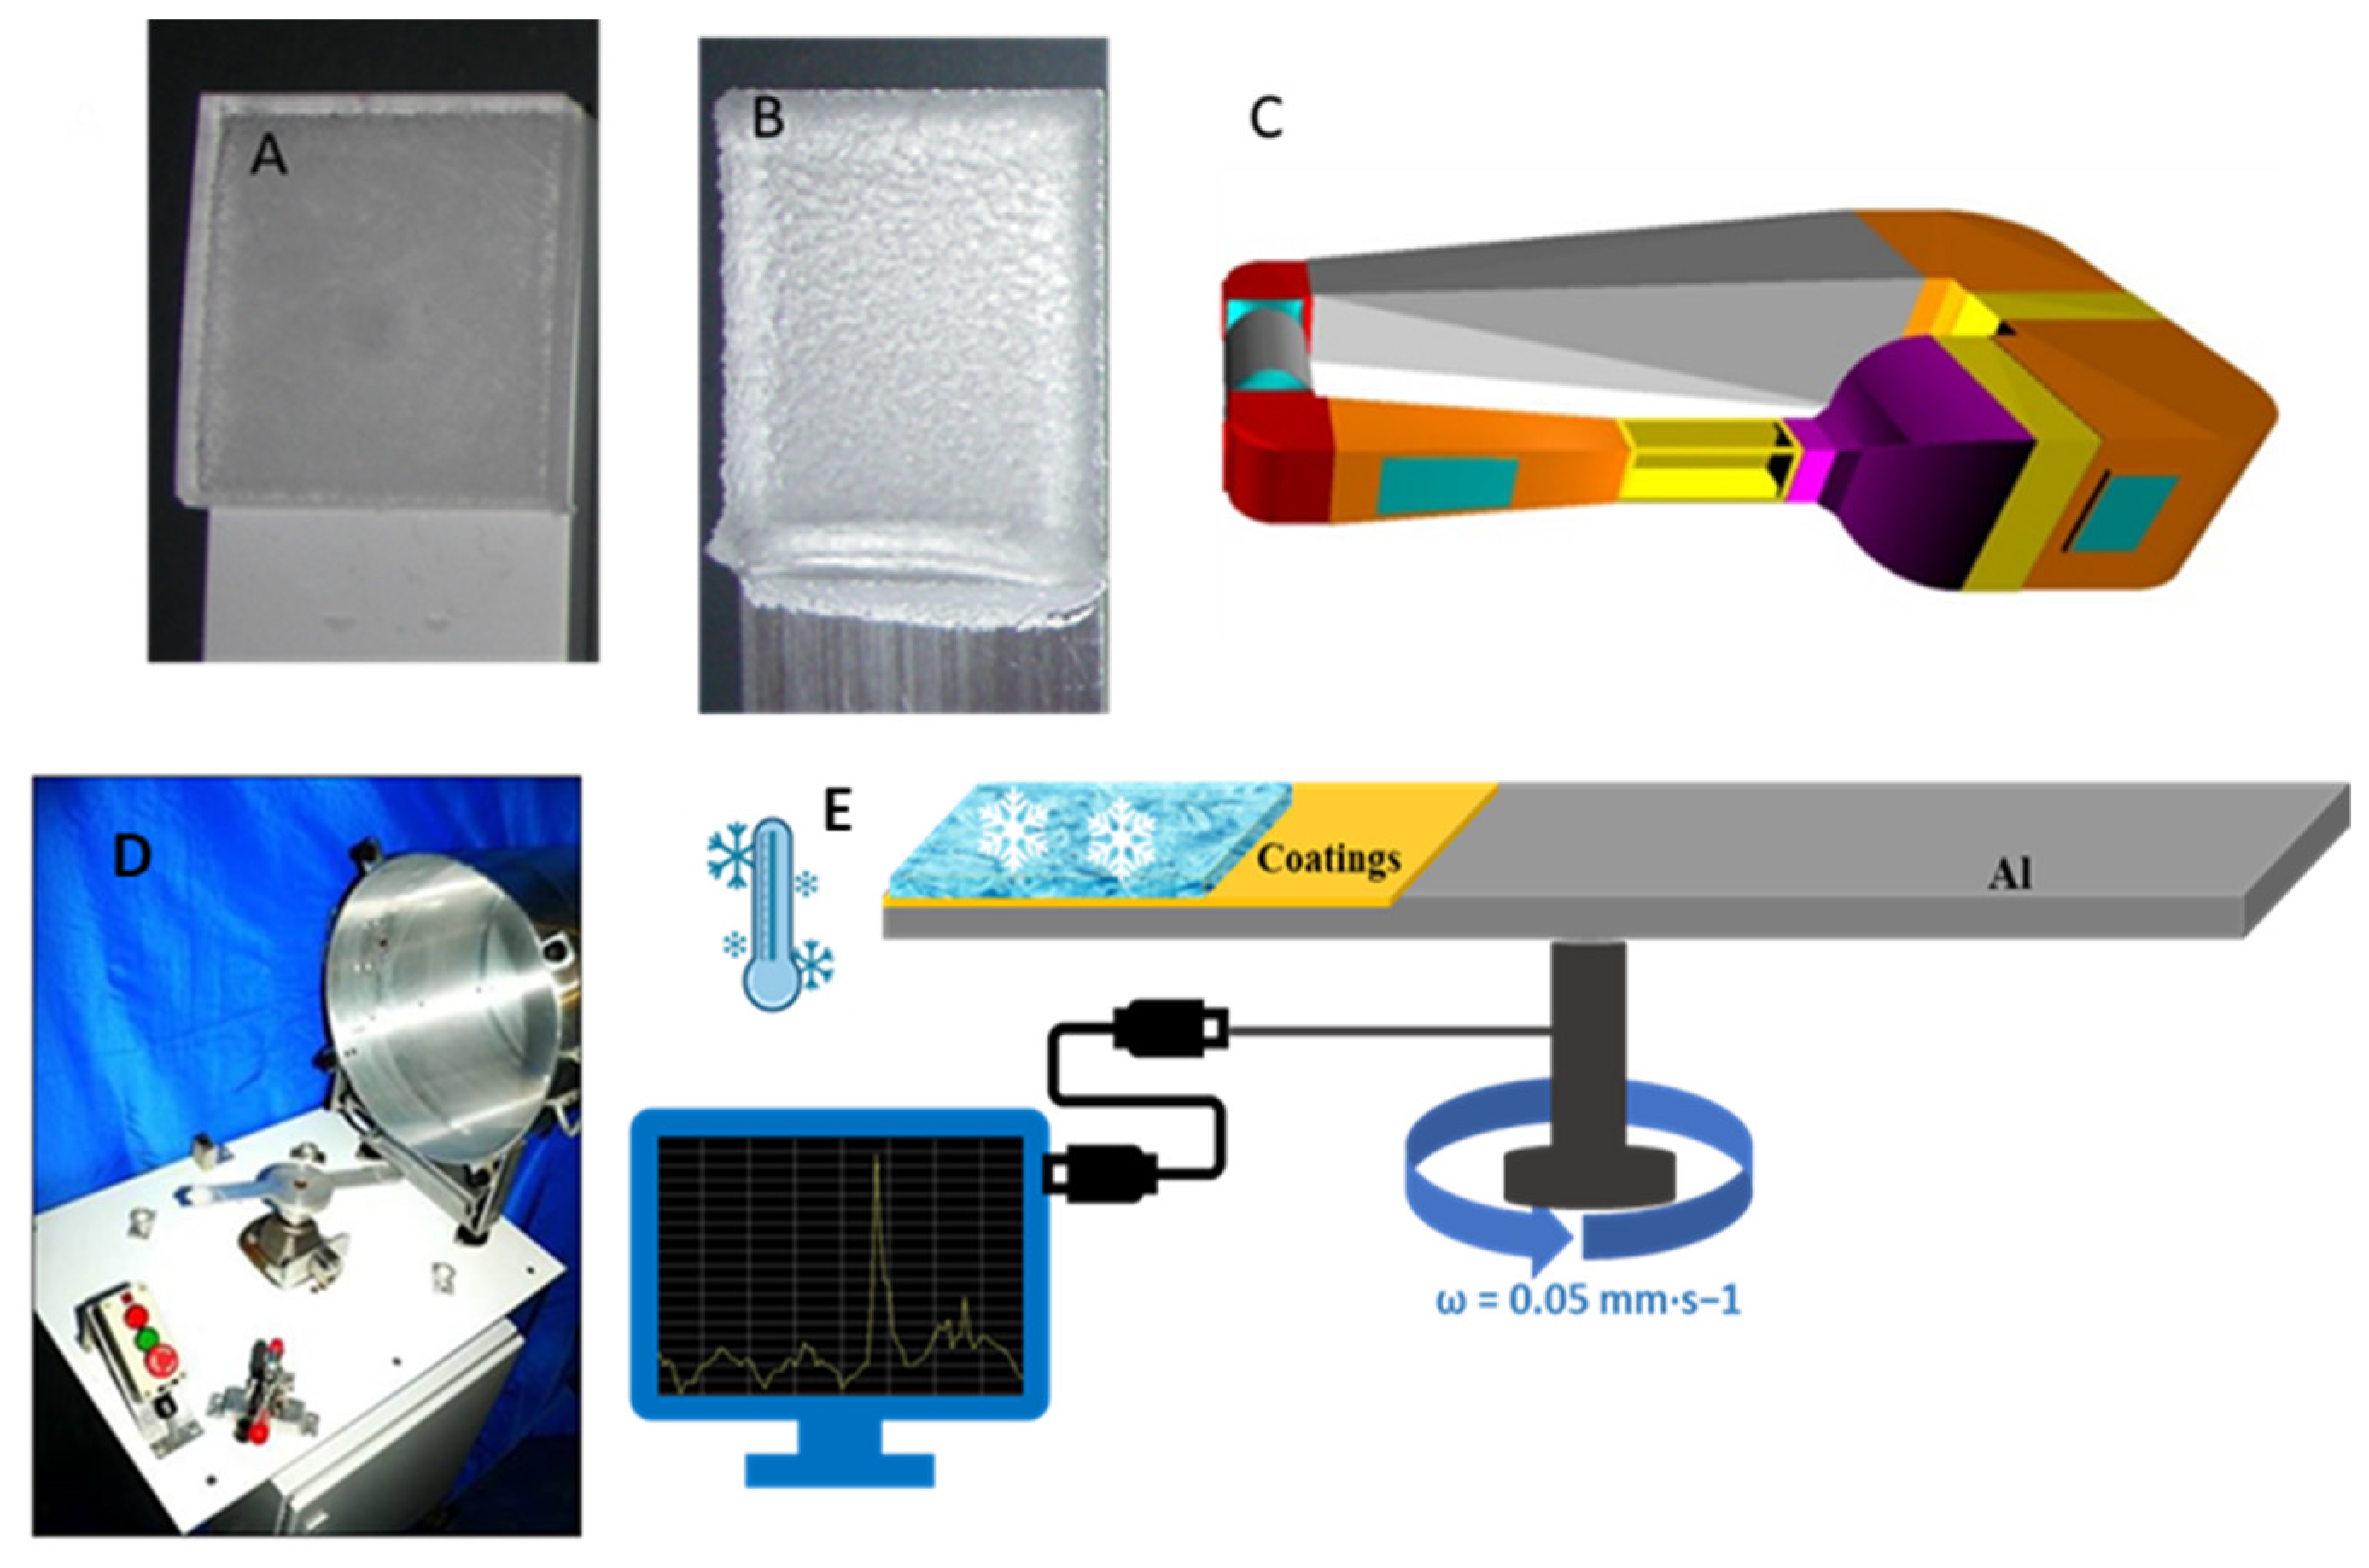
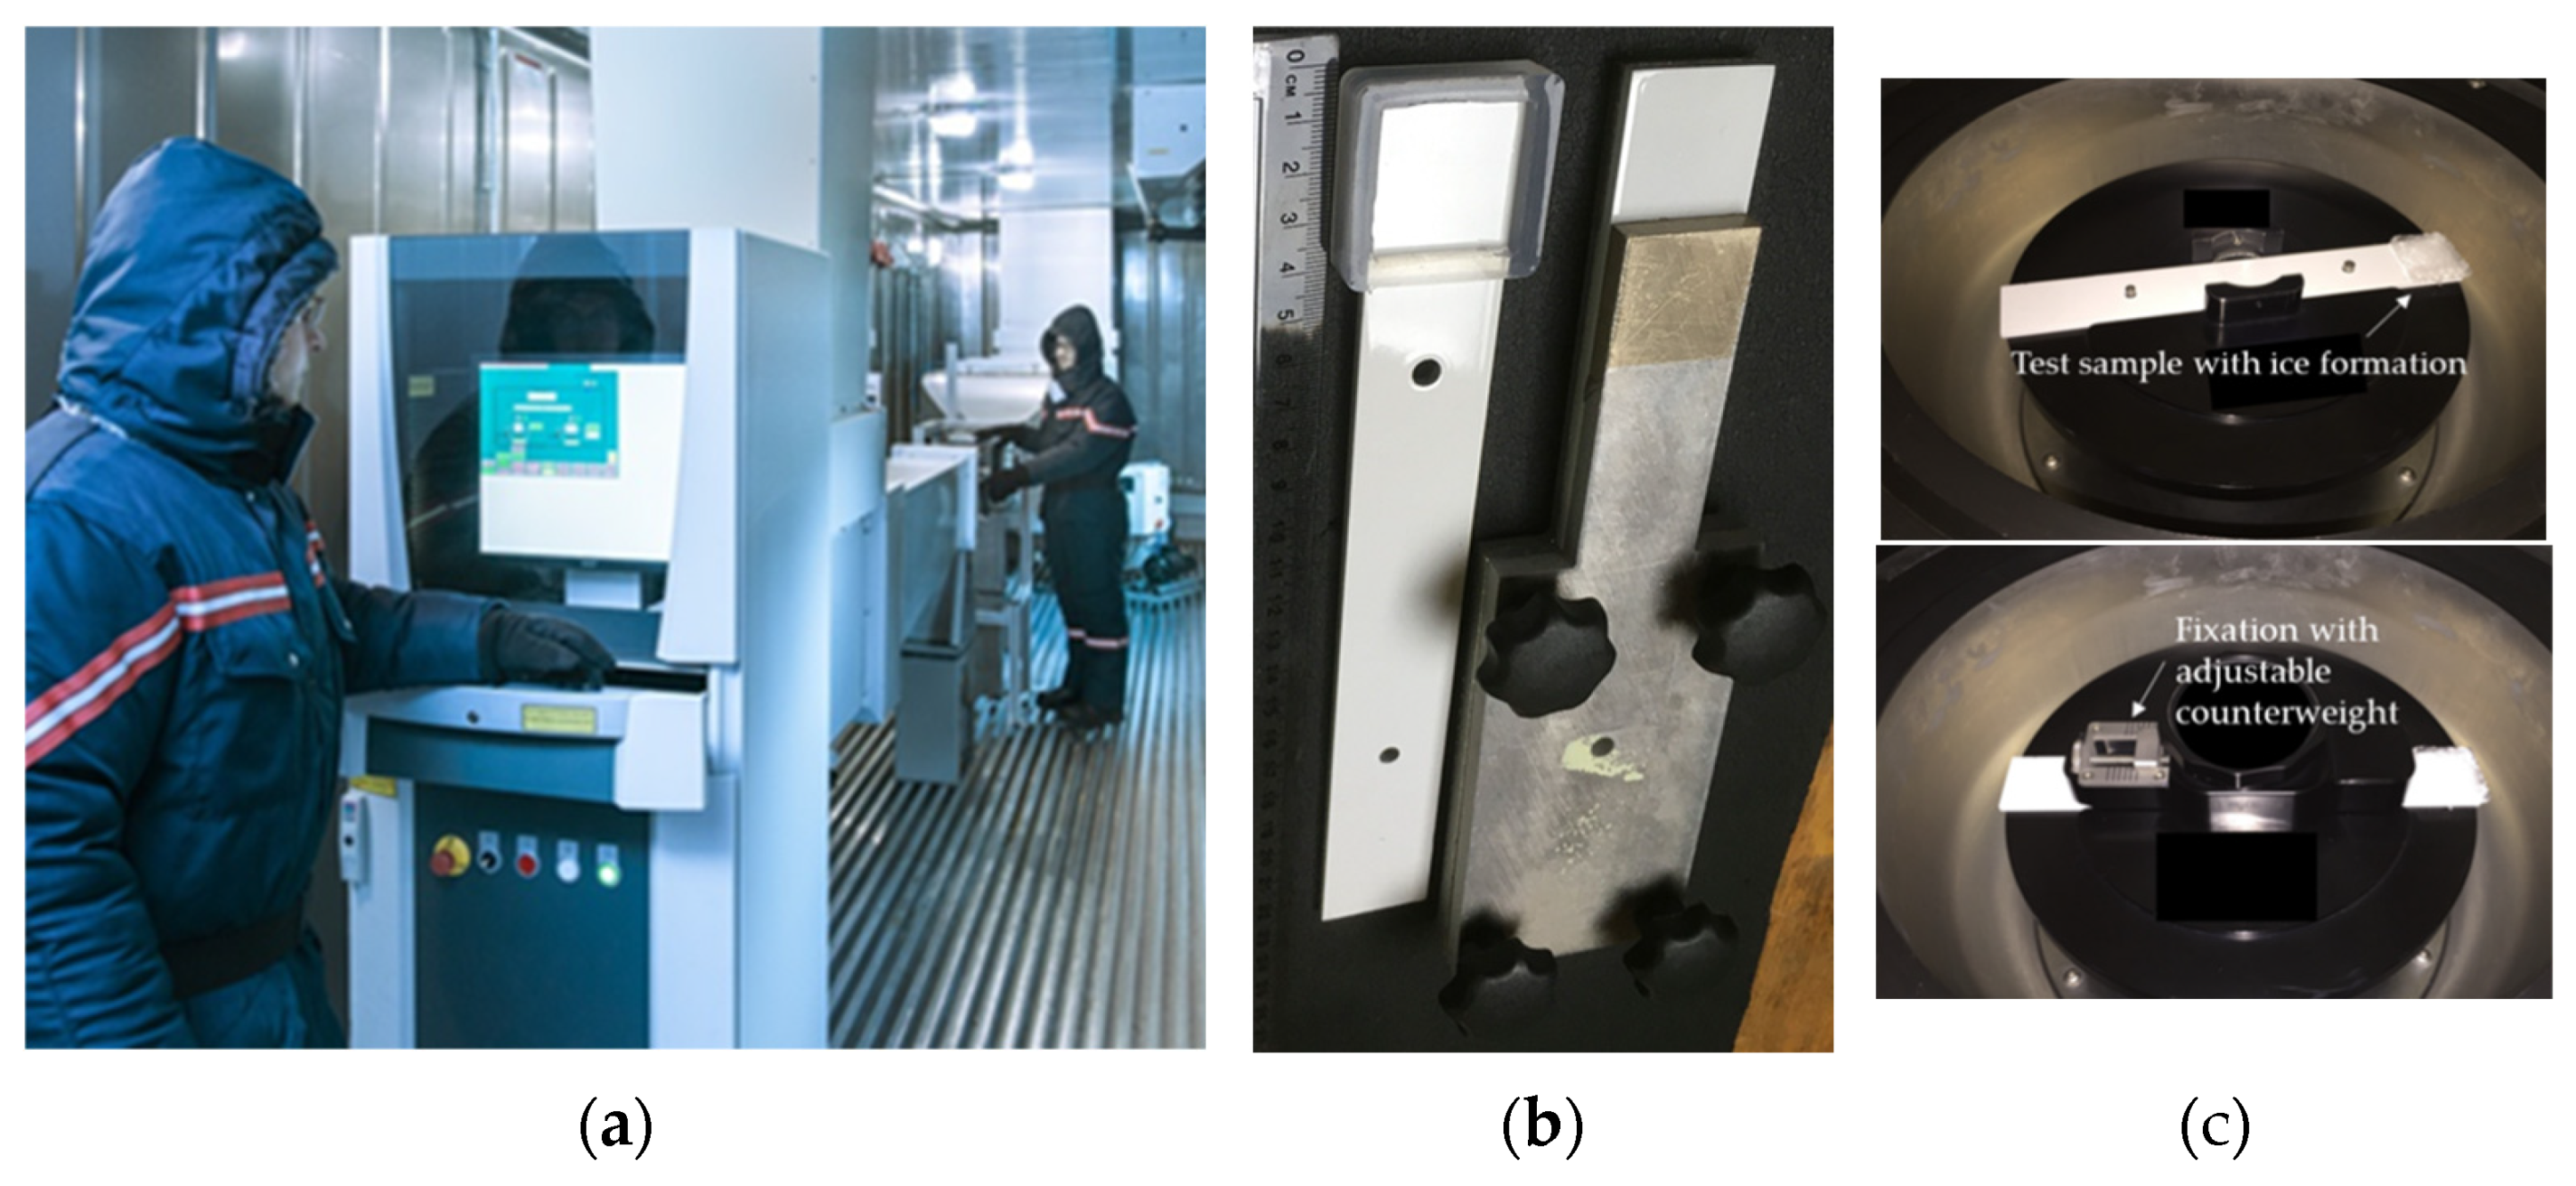
2.3.2. Centrifuge Tests (AMIL, IFAM, NU, TAU, and P-A)
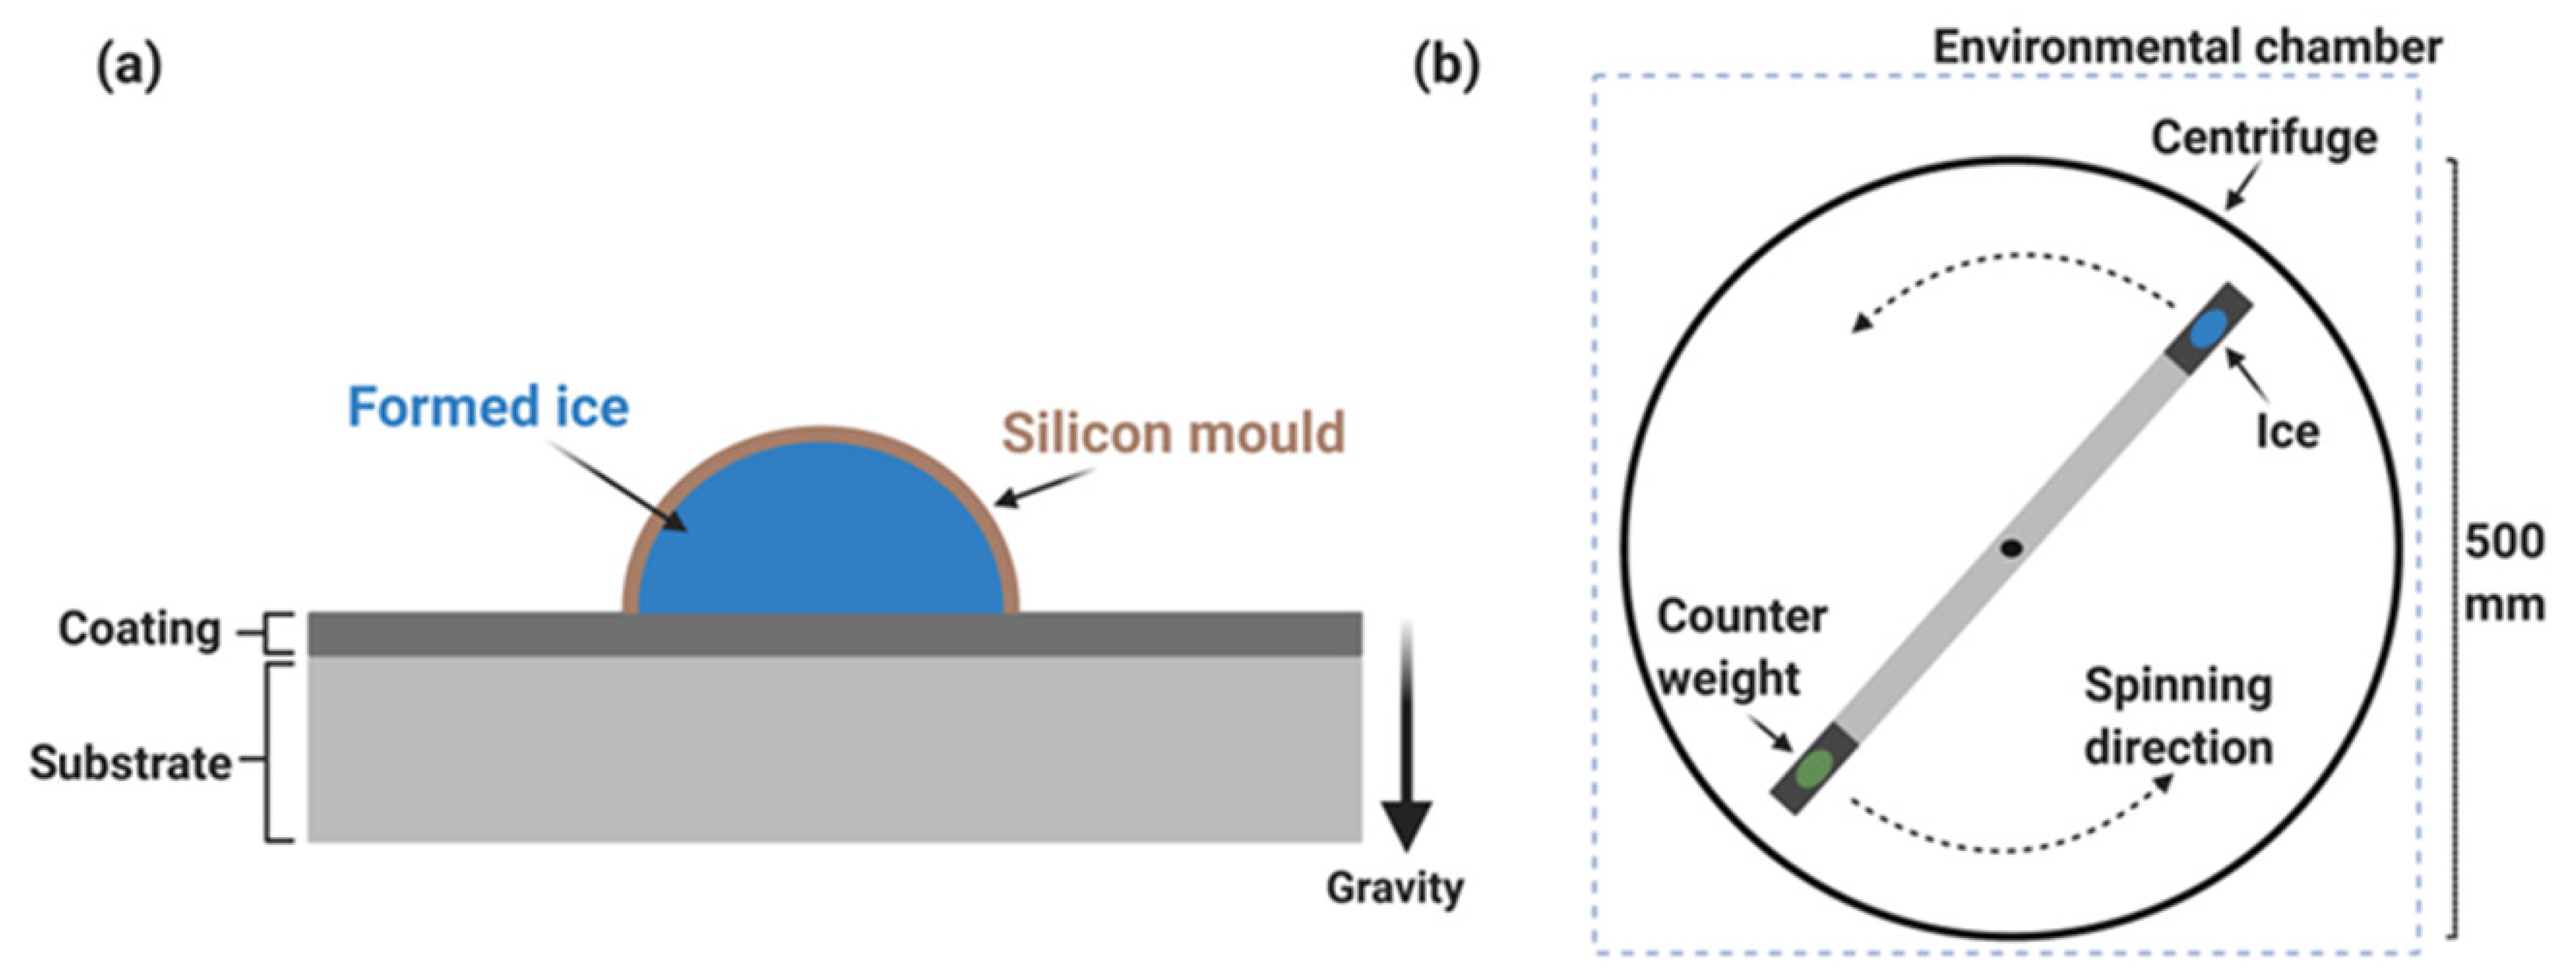
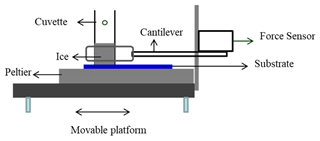
2.3.3. Mode I Tests (CU, ConU)
2.4. Test Parameter Definition
3. Results
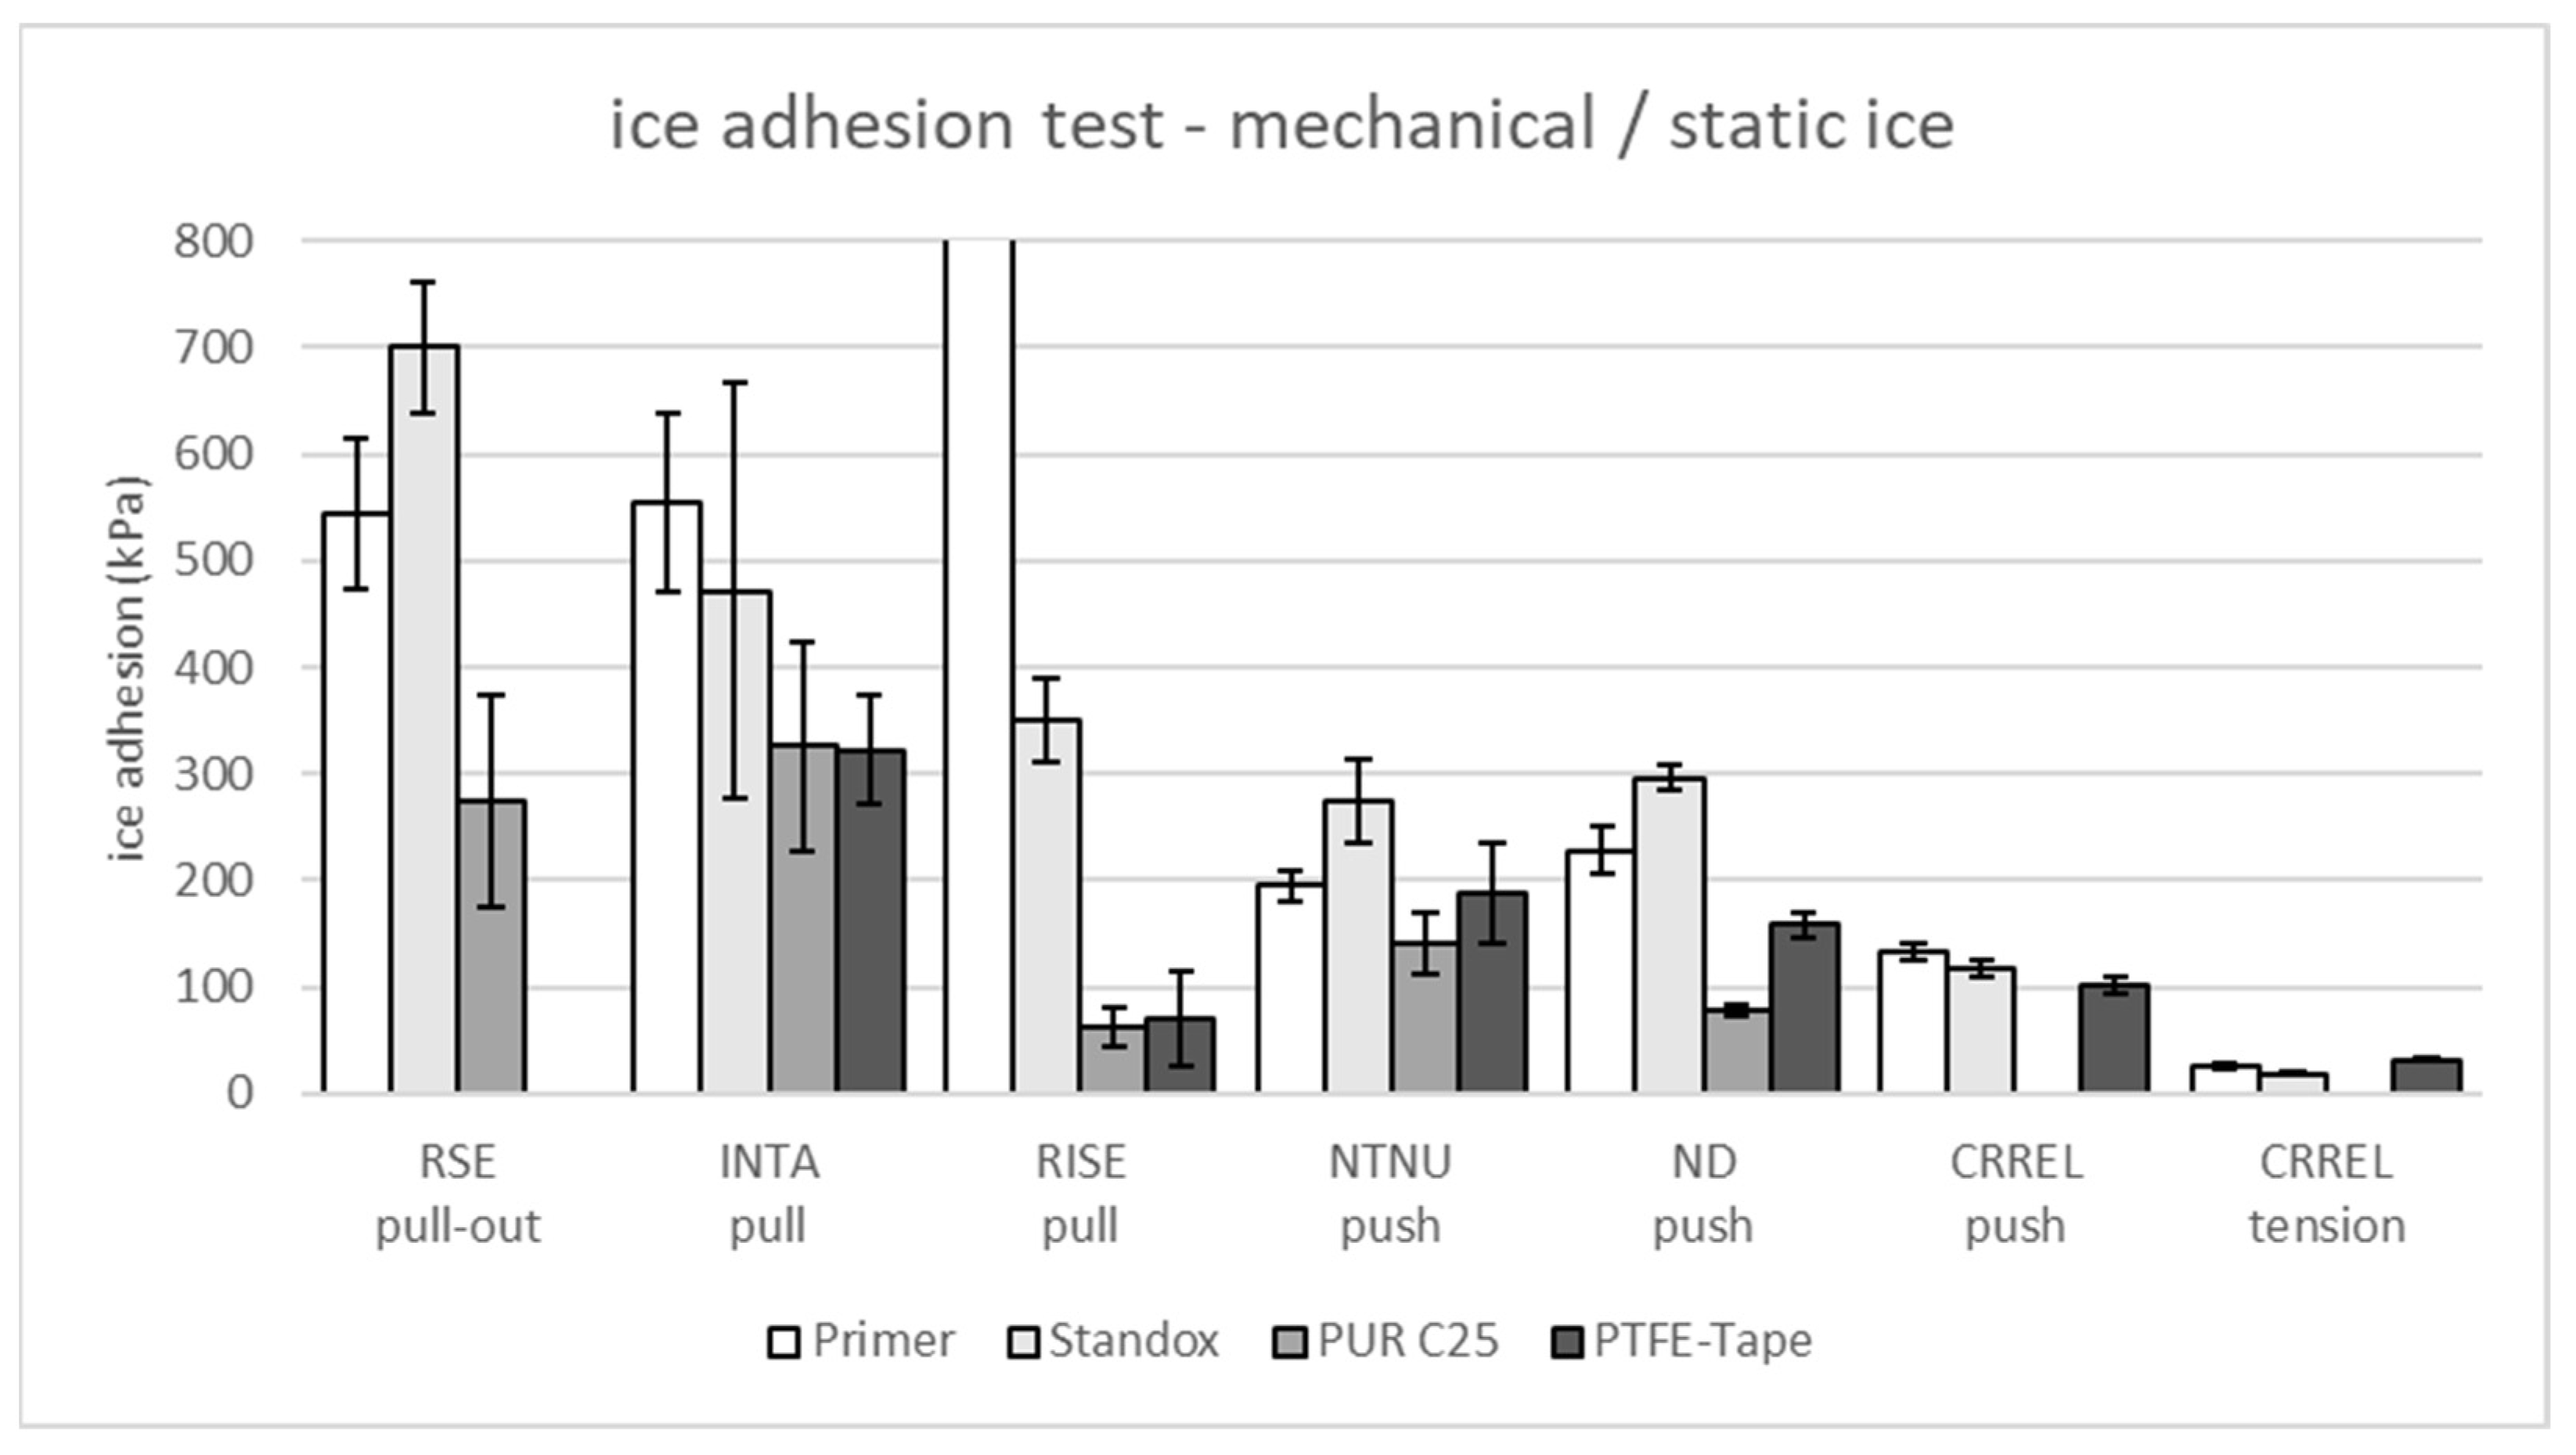
3.1. Direct Mechanical Tests Using Static Ice (RSE, INTA, NTNU, RISE, ND, and CRREL)
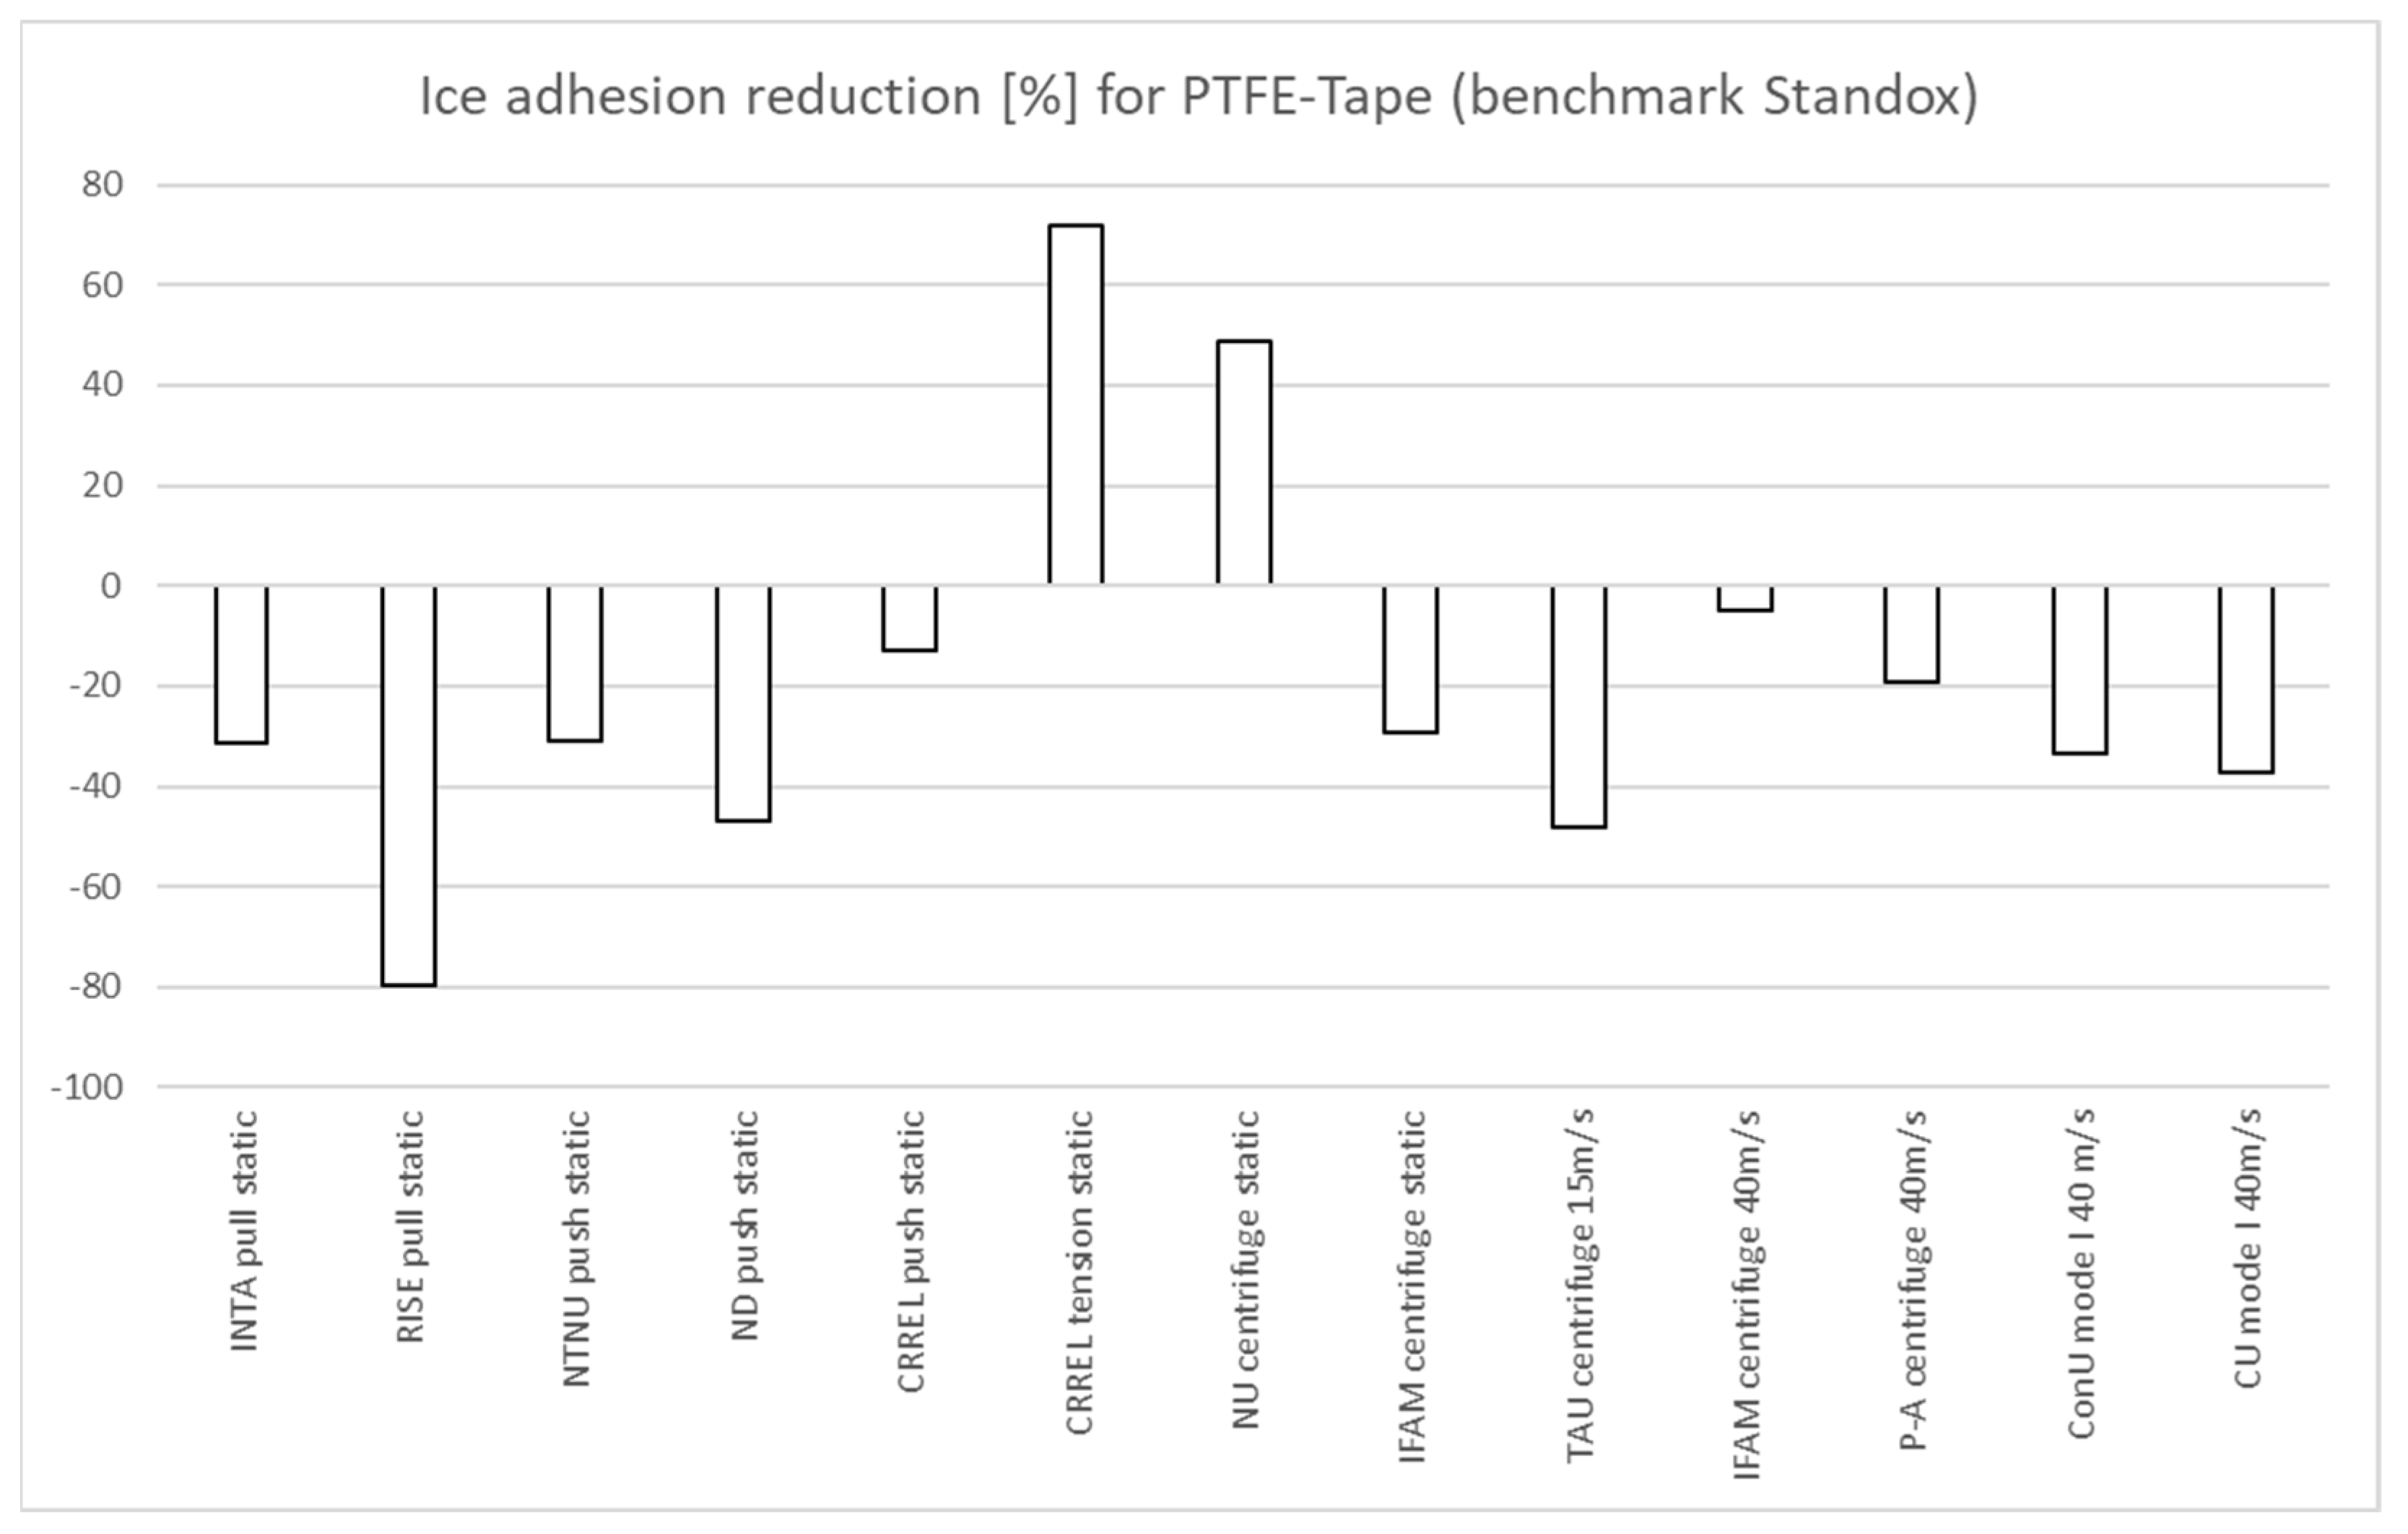
- The standard deviations showed that there is good agreement between RSE and INTA results. For both tests, ice formations were conducted overnight. For the other round-robin tests, icing times between 35 min and 180 min were used (see Table 5). Additionally, the test samples were completely embedded in the ice compound for the RSE and INTA tests instead of only one flat homogeneous surface that was covered by ice (see Table 4). These differences might have led to increased ice adhesion results, especially for PUR C25 and PTFE tape, compared with the remaining shear test results.
- The deviation in the ice formation temperature for RSE (−19 °C instead of the harmonized −8 °C for the rest of the test program, Table 5) did not seem to affect the results significantly.
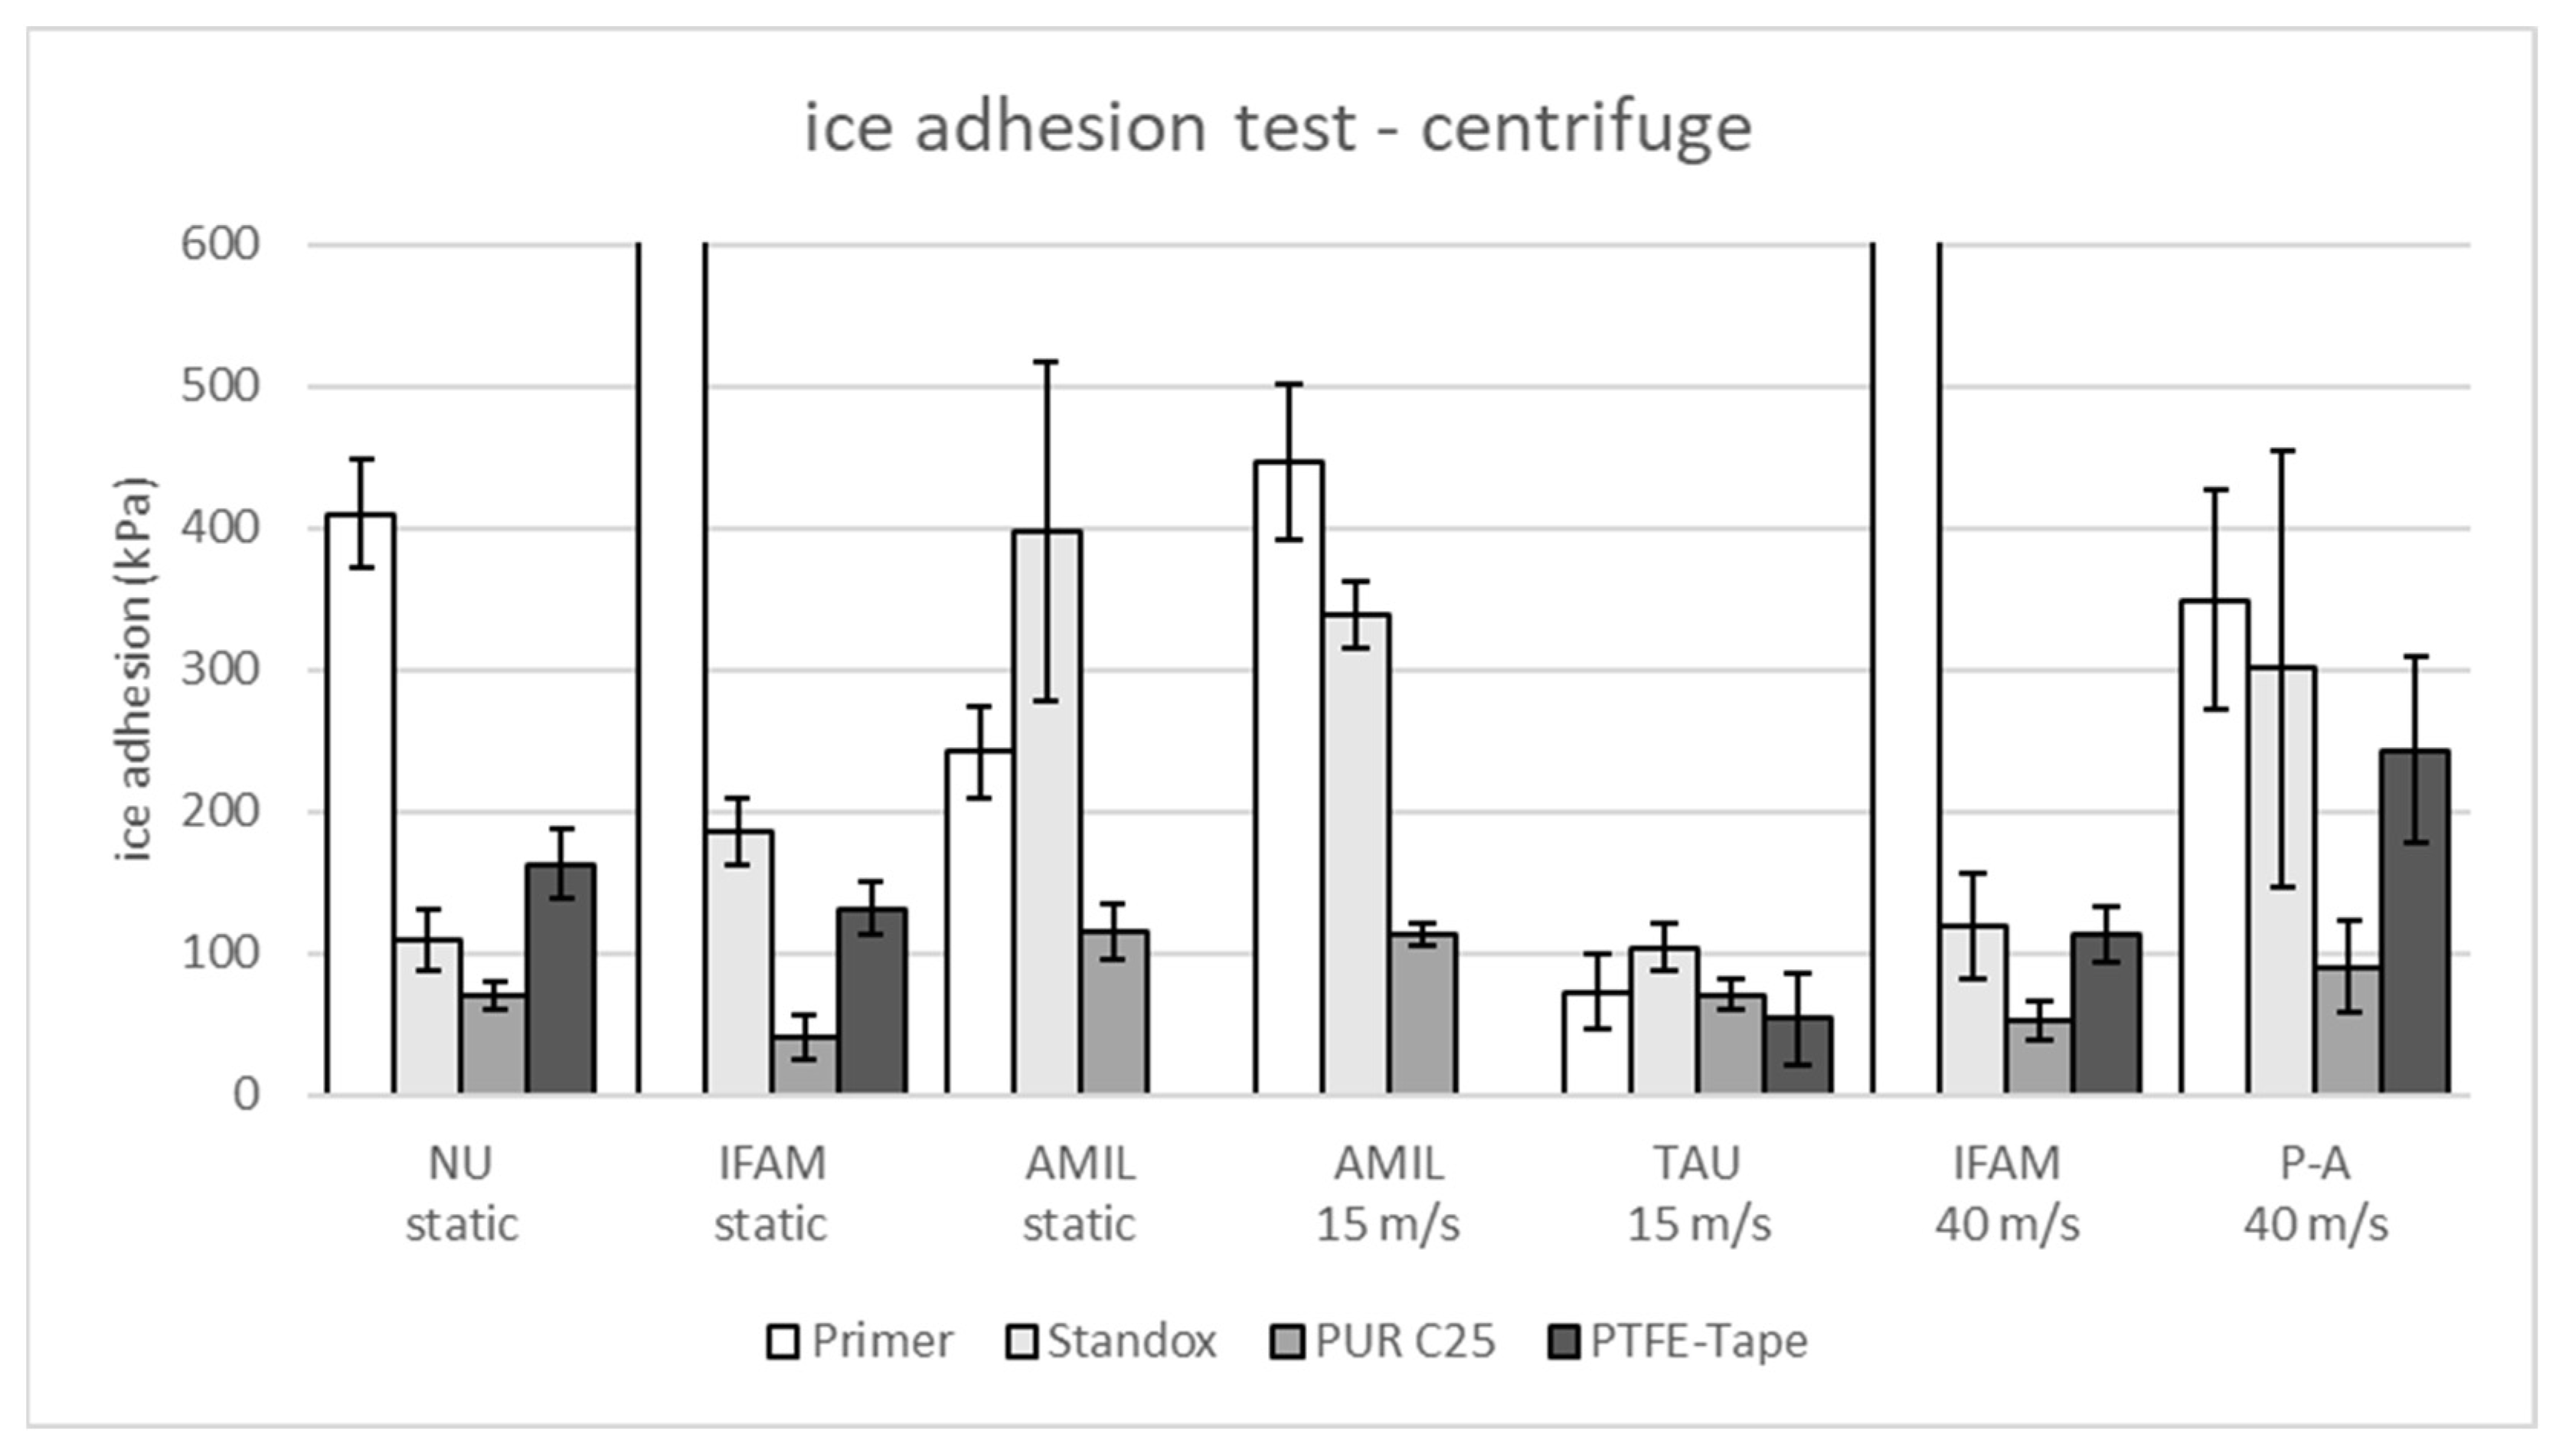
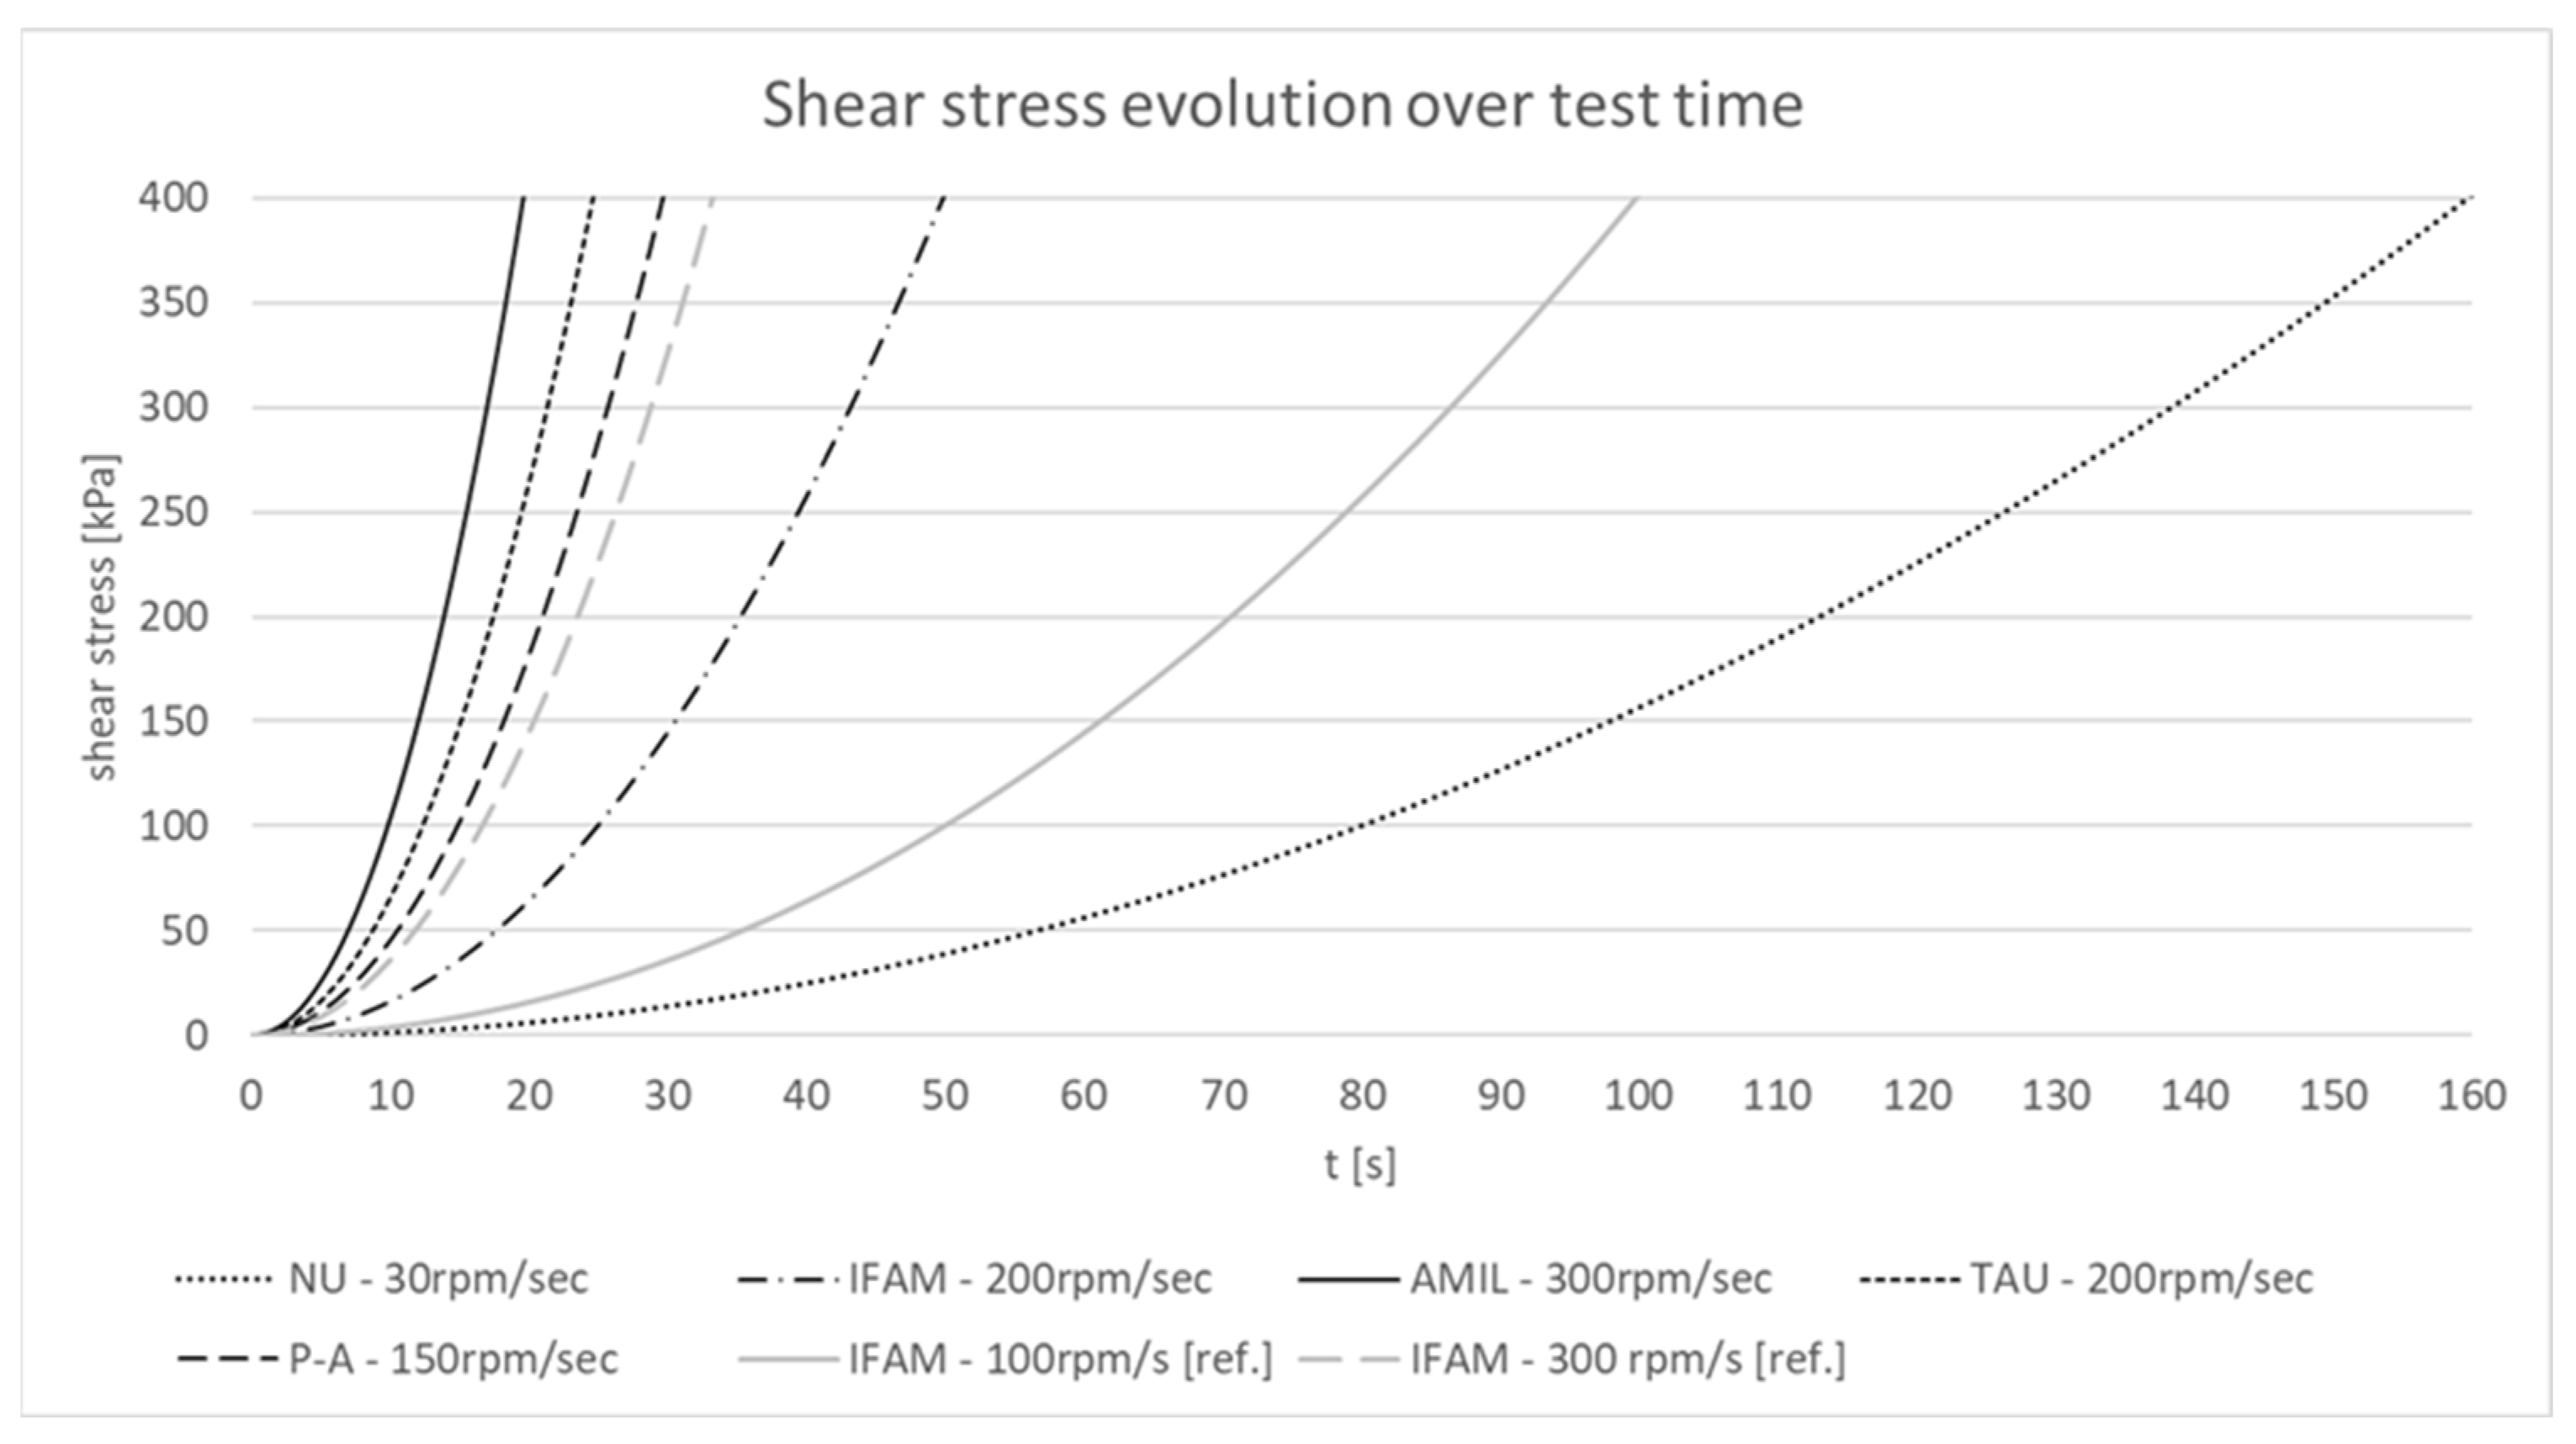
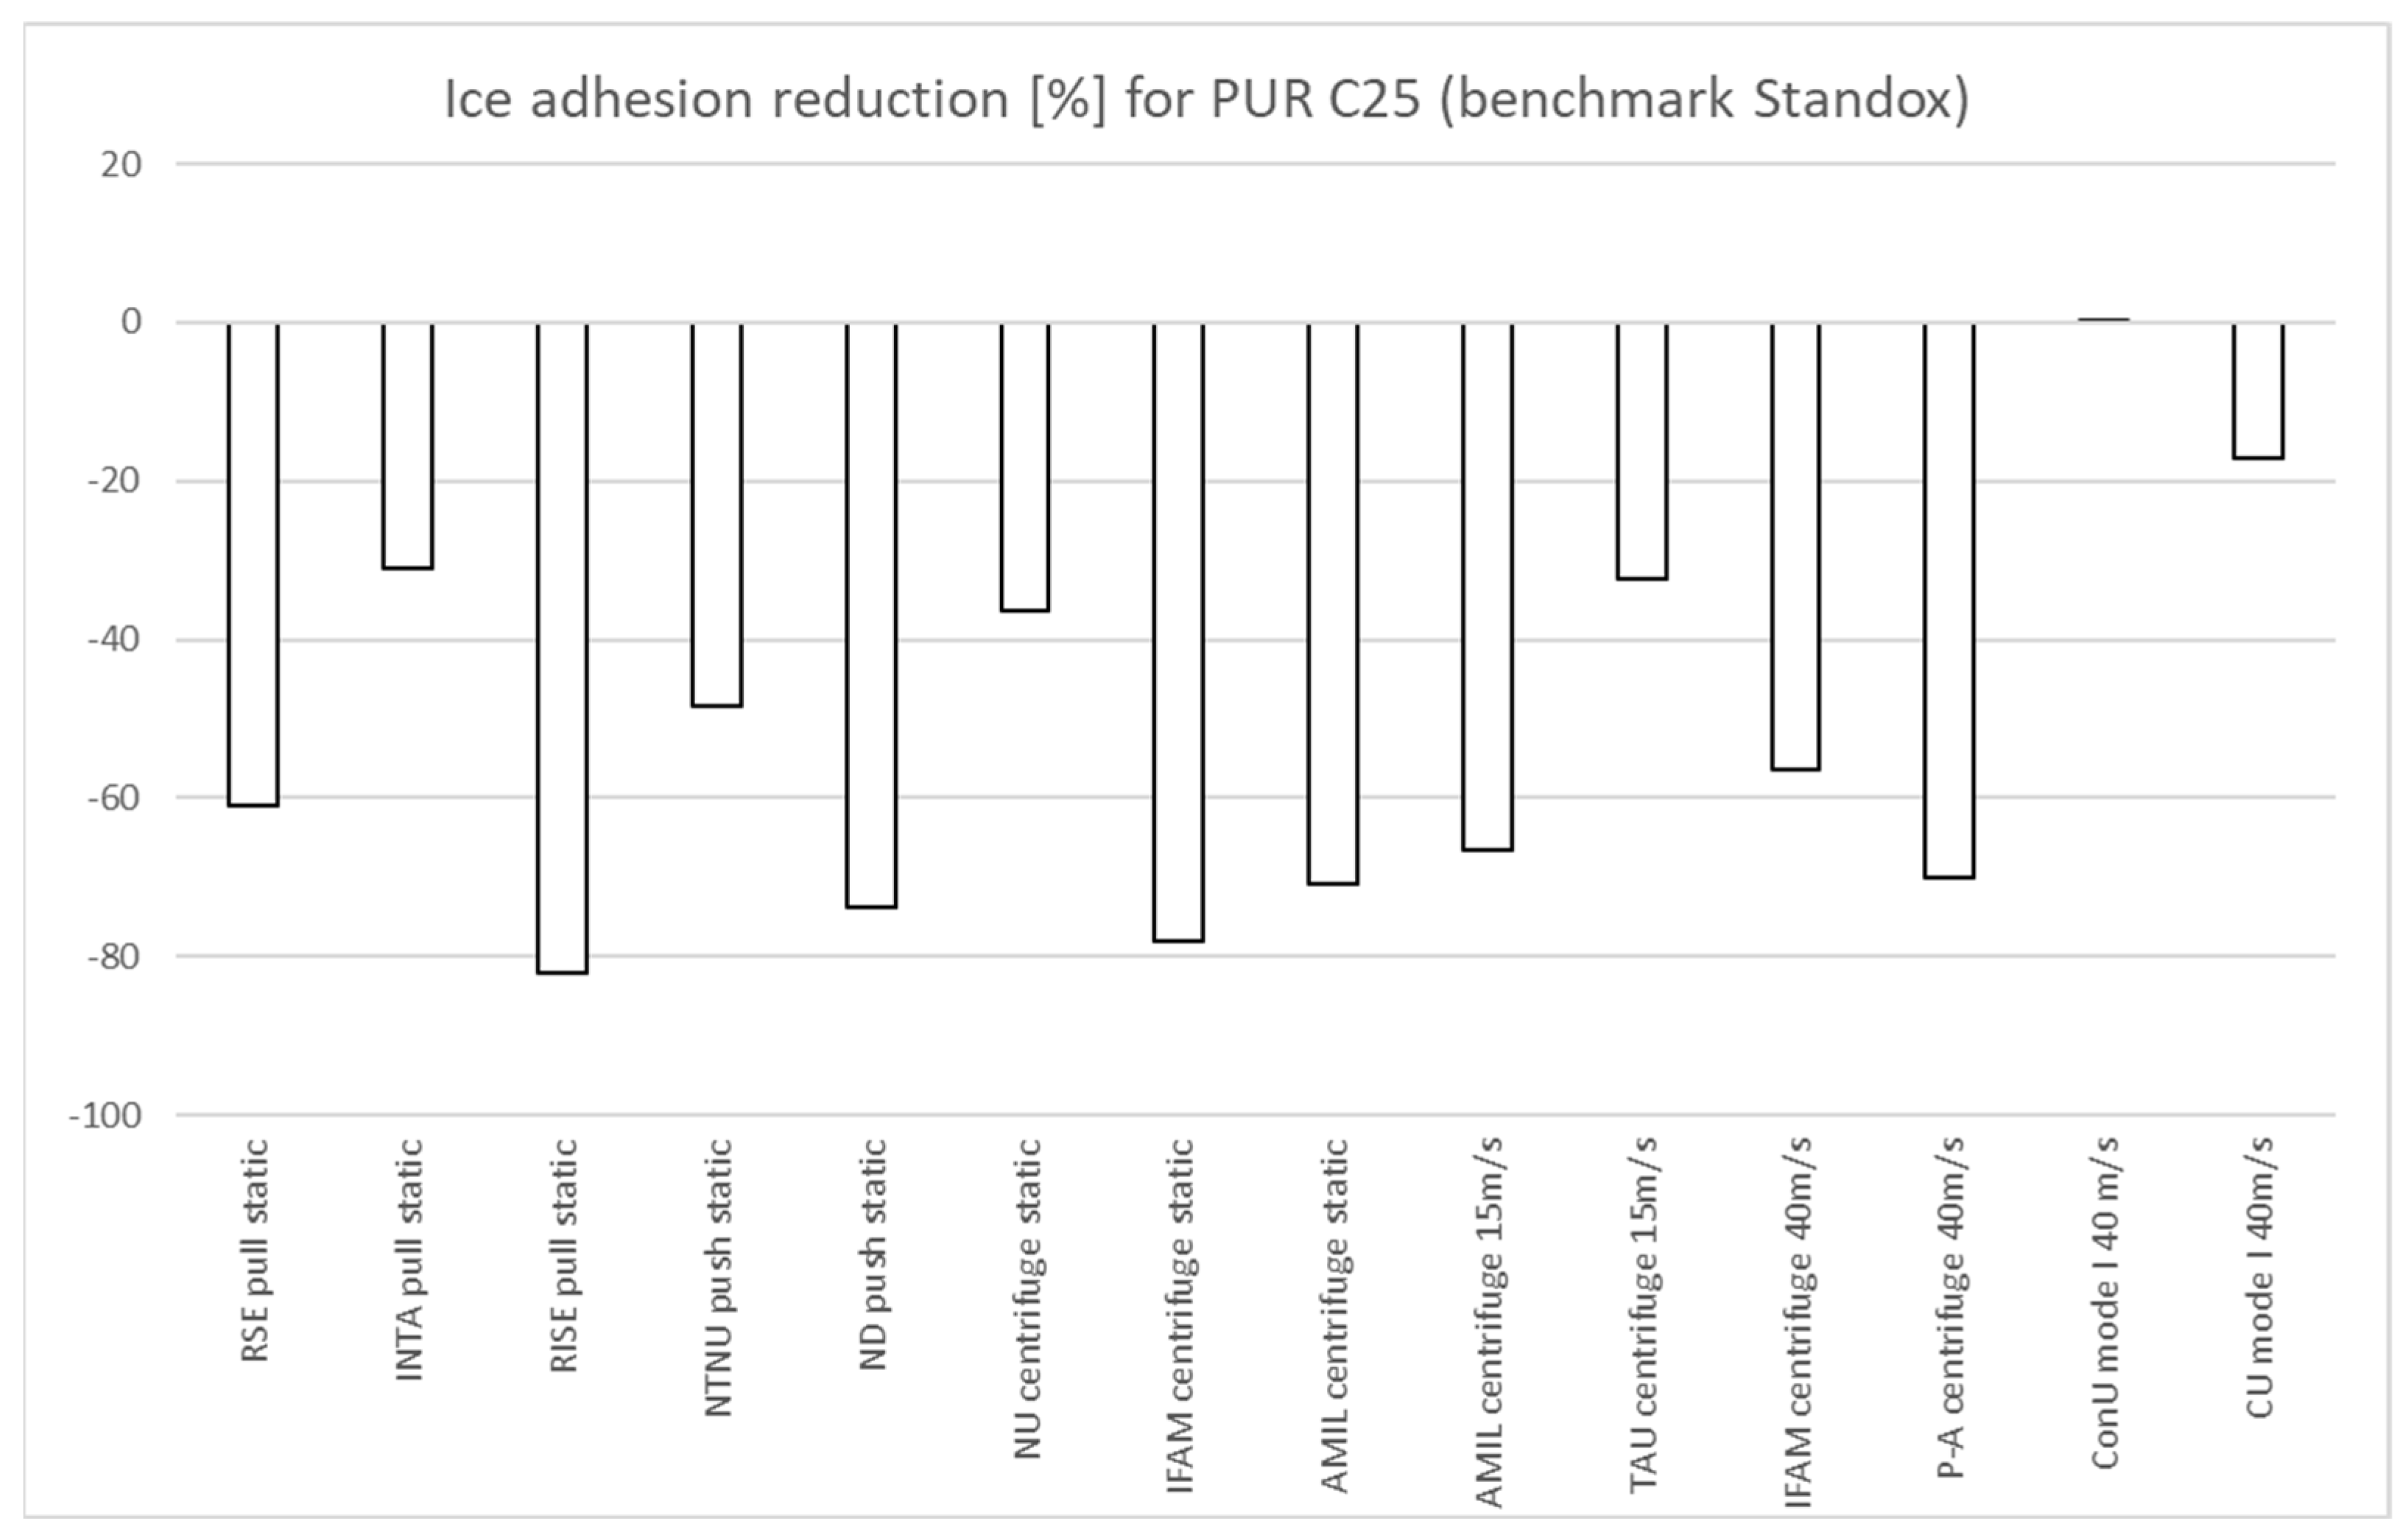
3.2. Centrifuge Tests (NU, IFAM, AMIL, TAU, and P-A)
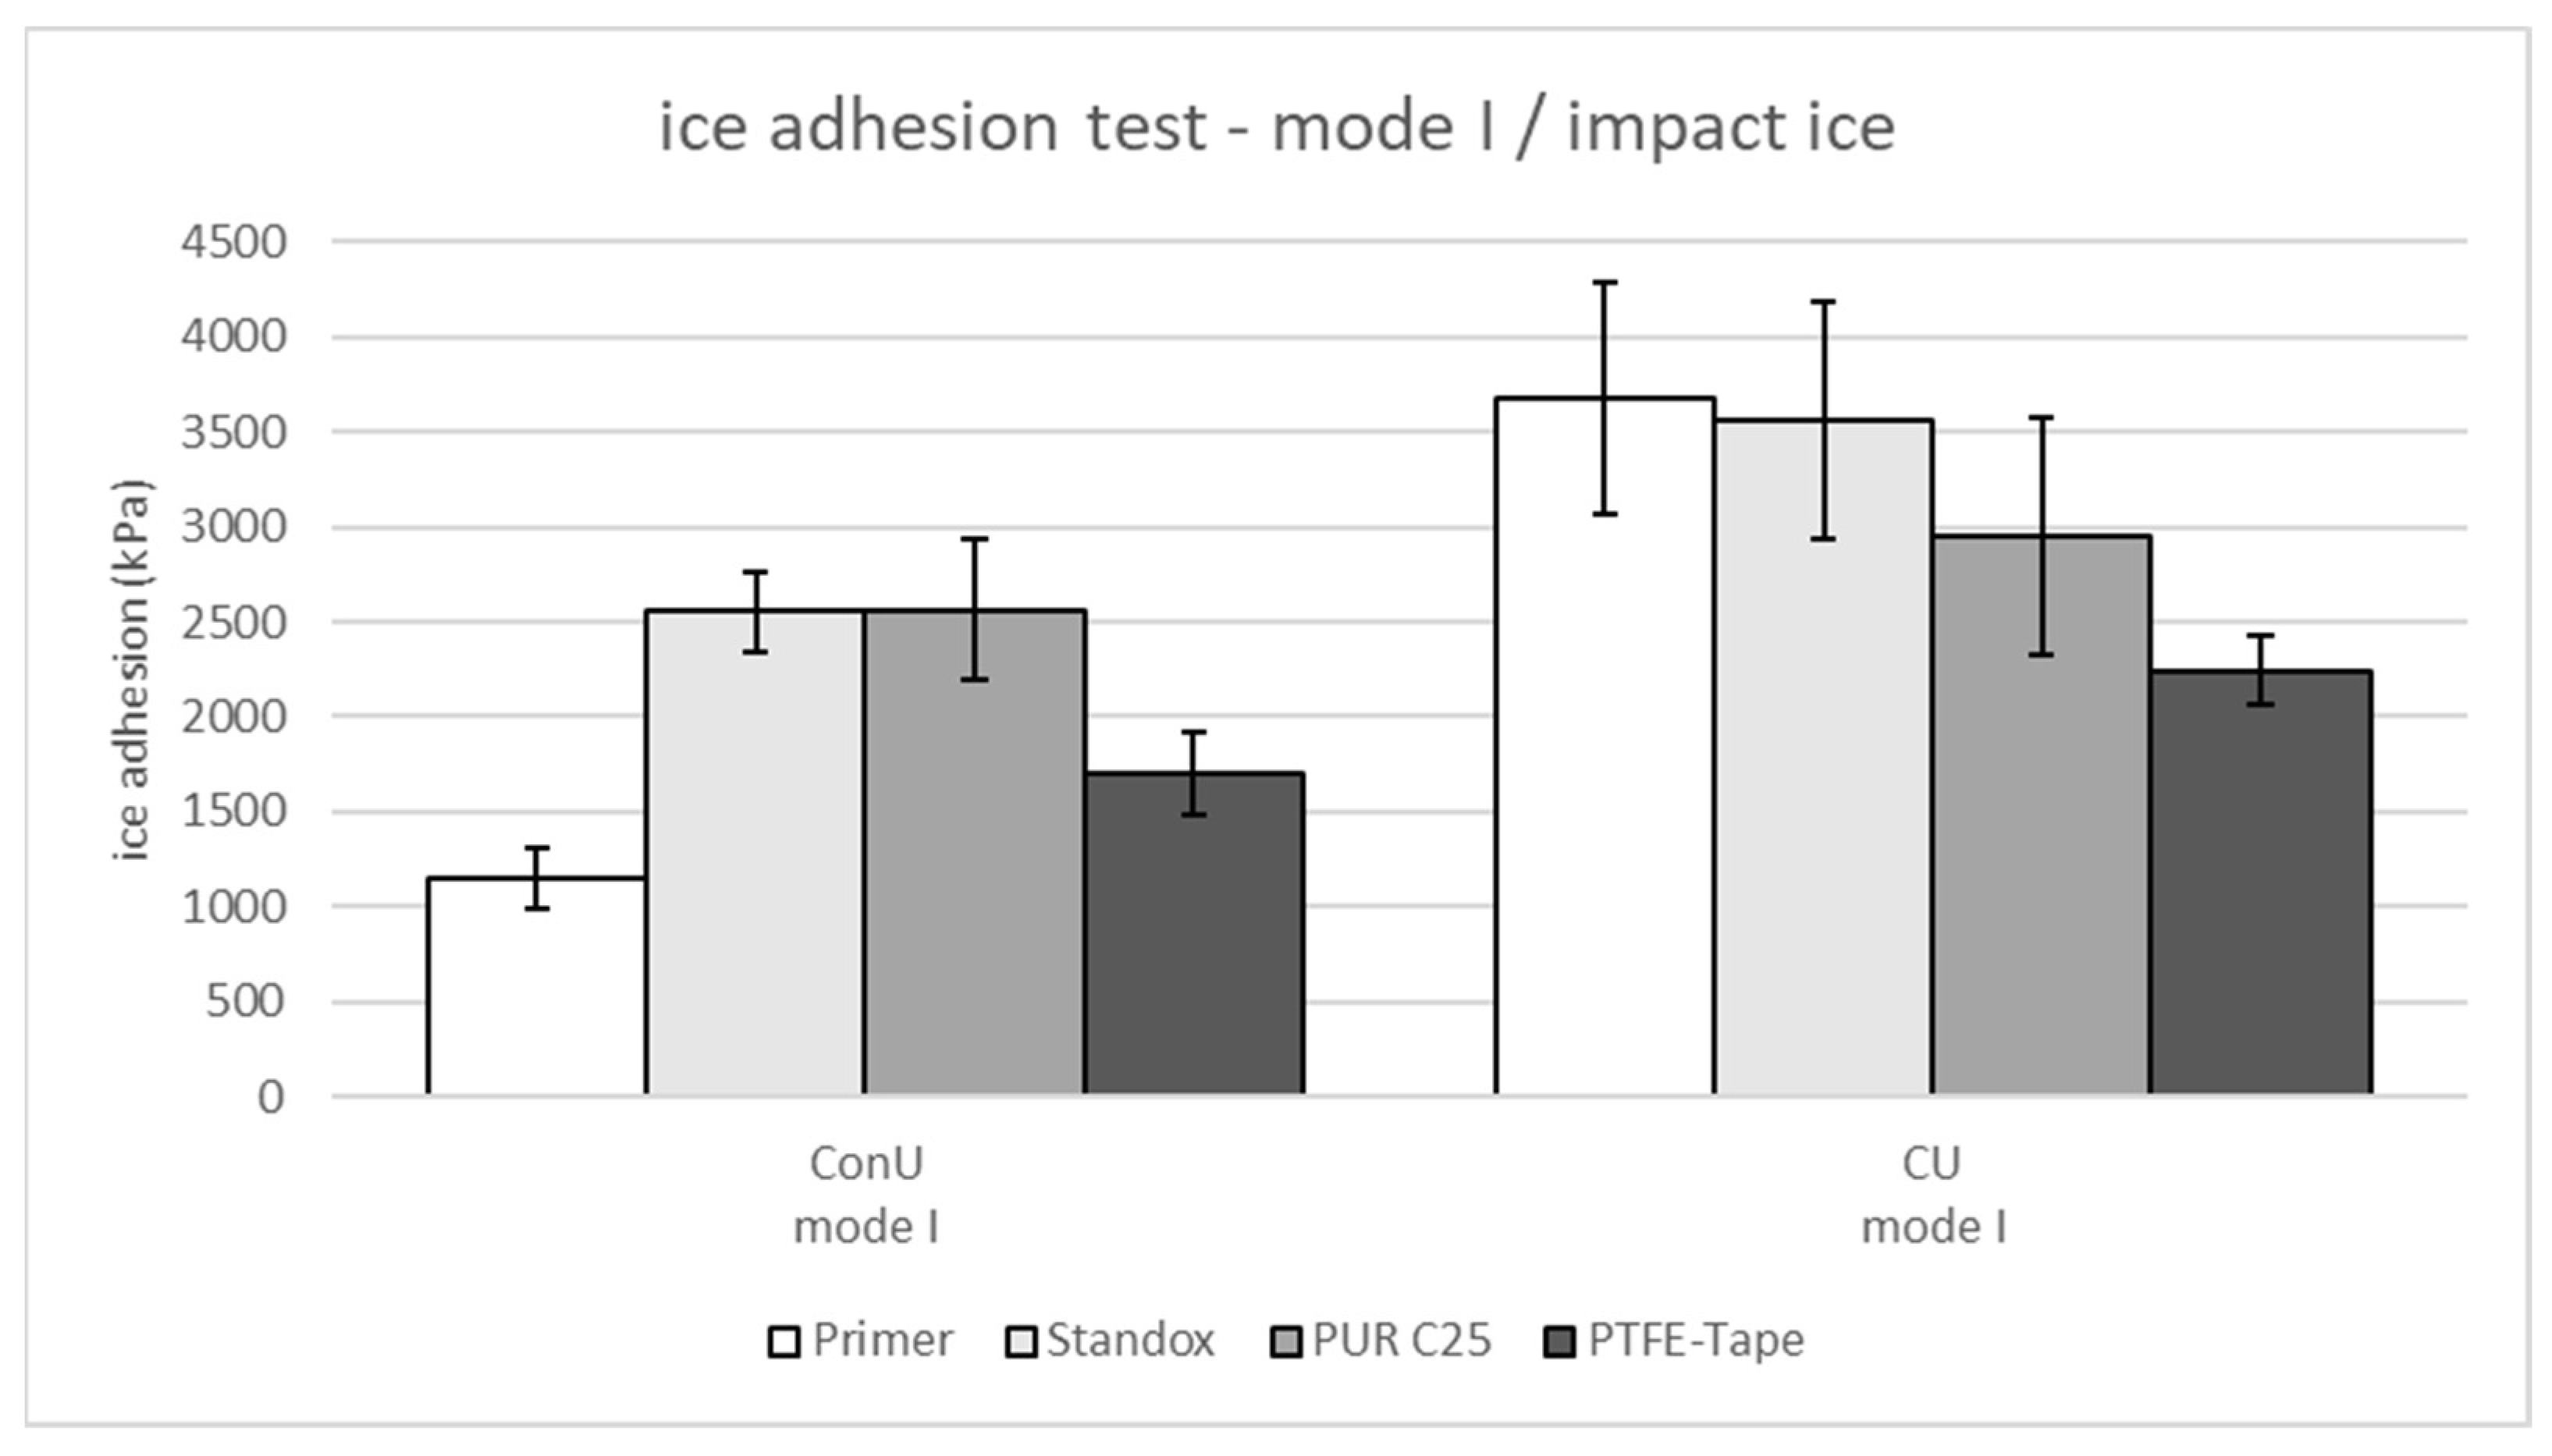
3.3. Mode I Tests (CU, ConU)
4. Discussion
Author Contributions
Funding
Data Availability Statement
Acknowledgments
Conflicts of Interest
Appendix A

| Contributor | RSE | INTA | RISE | NTNU | NotreDame | CRREL | CRREL | |||||||||||||||||||||||||
|---|---|---|---|---|---|---|---|---|---|---|---|---|---|---|---|---|---|---|---|---|---|---|---|---|---|---|---|---|---|---|---|---|
| Test Type | Pull-Out/Static Temperature (Ice Formation −19 °C) | Pull/Static | Pull/Static | Push/Static | Push/Static | Push/Static | Tension/Static | |||||||||||||||||||||||||
| Material | # | Run 1 | # | Run 1 | Mean | Stdev | # | Run 1 | Run 2 | Run 3 | Mean | Stdev | # | Run 1 | Mean | Stdev | # | Run 1 | Mean | Stdev | # | Run 1 | Run 2 | Run 3 | Mean | Stdev | # | Mean | Stdev | # | Mean | Stdev |
| Primer | 1 | 586 | 11 | 577 | 1 | 621 | 579 | 426 | 1 | coh | 203 | 207 | 225 | 252 | ||||||||||||||||||
| 2 | 561 | 12 | 490 | 2 | 668 | 500 | 574 | 2 | coh | 204 | ||||||||||||||||||||||
| 3 | 510 | 13 | 624 | 3 | 705 | 495 | 584 | 3 | coh | 179 | ||||||||||||||||||||||
| 4 | 553 | 14 | 402 | 4 | 484 | 479 | 537 | 4 | coh | |||||||||||||||||||||||
| 5 | 489 | 15 | 532 | |||||||||||||||||||||||||||||
| 6 | 436 | 16 | 606 | |||||||||||||||||||||||||||||
| 7 | 594 | 17 | 677 | |||||||||||||||||||||||||||||
| 8 | 504 | 18 | no data | |||||||||||||||||||||||||||||
| 9 | 593 | 19 | 600 | |||||||||||||||||||||||||||||
| 10 | 562 | 20 | 438 | 544 | 71 | 554 | 83 | coh | 195 | 14 | 228 | 23 | 133 | 9 | 26 | 2 | ||||||||||||||||
| Standox | 21 | 601 | 26 | 814 | 8 | 148 | 447 | 589 | 8 | 301 | 308 | 288 | 292 | 310 | ||||||||||||||||||
| 22 | no data | 27 | 663 | 9 | 163 | 437 | 647 | 9 | 343 | 232 | ||||||||||||||||||||||
| 23 | 688 | 28 | 667 | 10 | 300 | 568 | 768 | # | 369 | 282 | ||||||||||||||||||||||
| 24 | 693 | 29 | 678 | 11 | 395 | 647 | 553 | # | 390 | |||||||||||||||||||||||
| 25 | 751 | 30 | 747 | 700 | 62 | 472 | 195 | 351 | 39 | 274 | 39 | 297 | 12 | 117 | 7 | 19 | 1 | |||||||||||||||
| PUR C25 | 31 | 158 | 36 | 401 | 12 | 258 | 442 | 442 | # | 86 | 171 | 72 | 79 | 83 | ||||||||||||||||||
| 32 | 270 | 37 | 100 | 13 | 268 | 332 | 453 | # | 42 | 114 | ||||||||||||||||||||||
| 33 | 291 | 38 | 290 | 14 | 211 | 305 | 321 | # | 71 | 139 | ||||||||||||||||||||||
| 34 | 194 | 39 | 301 | 15 | 142 | 321 | 416 | # | 52 | |||||||||||||||||||||||
| 35 | 317 | 40 | 415 | 274 | 100 | 326 | 99 | 63 | 19 | 141 | 28 | 78 | 6 | no data | no data | no data | no data | |||||||||||||||
| PTFE-Tape | no data | 5 | 337 | 326 | 384 | 5 | 81 | 154 | 155 | 148 | 171 | |||||||||||||||||||||
| 6 | 311 | 232 | 353 | 6 | 109 | 170 | ||||||||||||||||||||||||||
| no data | no data | 7 | 258 | 321 | 384 | 323 | 51 | 7 | 23 | 71 | 44 | 242 | 189 | 47 | 158 | 12 | 102 | 8 | 32 | 1 | ||||||||||||
| Q-test analysis with aberrant 99% | coh = cohesive failure | |||||||||||||||||||||||||||||||
| Contributor | Nottingham University | IFAM | AMIL | AMIL | TAU | IFAM | P-A | |||||||||||||||||||||||||||||||||||||||||
|---|---|---|---|---|---|---|---|---|---|---|---|---|---|---|---|---|---|---|---|---|---|---|---|---|---|---|---|---|---|---|---|---|---|---|---|---|---|---|---|---|---|---|---|---|---|---|---|---|
| Test Type | Centrifuge/Static | Centrifuge/Static | Centrifuge/Static | Centrifuge/15 m/s | Centrifuge/15 m/s | Centrifuge/40 m/s | Centrifuge/40 m/s A = Aluminum; C = Composite | |||||||||||||||||||||||||||||||||||||||||
| Material | # | Run 1 | Run 2 | Mean | Stdev | # | Run 1 | Run 2 | Run 3 | Run 4 | Run 5 | Run 6 | Run 7 | Mean | Stdev | # | Run 1 | Run 2 | Run 3 | Mean | Stdev | # | Run 1 | Run 2 | Run 3 | Mean | Stdev | # | Run 1 | Mean | Stdev | # | Run 1 | Run 2 | Run 3 | Run 4 | Run 5 | Run 6 | Run 7 | Run 8 | Mean | Stdev | # | Run 1 | Run 2 | Run 3 | Mean | Stdev |
| Primer | 1 | 397 | 378 | Z1 | coh | coh | coh | AMIL1 | 236 | 234 | 274 | AMIL1 | 411 | 499 | 525 | 1 | 76 | Z1 | coh | coh | coh | A3 | 358 | no data | 290 | A: | ||||||||||||||||||||||
| 2 | 469 | 410 | Z2 | coh | coh | coh | AMIL2 | 225 | 284 | 196 | AMIL2 | 434 | 386 | 421 | 2 | 56 | Z2 | coh | coh | coh | A4 | 287 | 396 | 256 | 317 | 58 | ||||||||||||||||||||||
| 3 | 397 | 372 | Z3 | coh | coh | coh | 3 | 110 | Z3 | coh | coh | coh | C2 | 411 | 299 | 237 | ||||||||||||||||||||||||||||||||
| 4 | 416 | 345 | 4 | 49 | C3 | 366 | 438 | no data | C: | |||||||||||||||||||||||||||||||||||||||
| 5 | 410 | 416 | C10 | 290 | 480 | 425 | 368 | 85 | ||||||||||||||||||||||||||||||||||||||||
| 6 | 384 | 497 | ||||||||||||||||||||||||||||||||||||||||||||||
| 7 | 410 | 429 | 409 | 38 | coh | 242 | 33 | 446 | 54 | 73 | 27 | coh | A+C: | 349 | 77 | |||||||||||||||||||||||||||||||||
| Standox | 13 | 106 | 148 | Z9 | 218 | AMIL3 | 303 | 397 | 551 | AMIL3 | 298 | 327 | 363 | 8 | 117 | Z11 | 111 | 157 | C6 | 76 | 205 | no data | ||||||||||||||||||||||||||
| 14 | 70 | 106 | Z10 | 148 | AMIL4 | 472 | 220 | 440 | AMIL4 | 343 | 341 | 360 | 9 | 85 | Z13 | 181 | 116 | 64 | 118 | C7 | 197 | 335 | 475 | |||||||||||||||||||||||||
| 15 | 119 | 109 | Z11 | 204 | 165 | 11 | 109 | A1 | 64 | 144 | C11 | 194 | 475 | 447 | ||||||||||||||||||||||||||||||||||
| 16 | 96 | 133 | Z13 | 165 | 203 | A3 | 100 | 128 | ||||||||||||||||||||||||||||||||||||||||
| 17 | 102 | 106 | A1 | 189 | ||||||||||||||||||||||||||||||||||||||||||||
| 109 | 21 | A2 | 191 | 185 | 24 | 397 | 119 | 339 | 24 | 104 | 17 | 118 | 37 | 301 | 154 | |||||||||||||||||||||||||||||||||
| PUR C25 | 18 | 55 | 58 | Z14 | 28 | 29 | 59 | AMIL5 | 132 | 131 | 107 | AMIL5 | 122 | 104 | 122 | 12 | 82 | Z14 | 50 | 54 | 58 | 32 | 43 | A1 | 114 | 129 | 161 | A: | ||||||||||||||||||||
| 19 | 78 | 63 | Z15 | 29 | AMIL6 | 131 | 110 | 82 | AMIL6 | 107 | 109 | 115 | 13 | 61 | Z15 | 51 | 82 | 48 | A2 | 36 | 94 | 128 | 110 | 43 | ||||||||||||||||||||||||
| 20 | 73 | 63 | Z17 | 24 | 32 | 72 | 45 | 39 | 37 | 14 | no data | Z18 | 39 | 58 | C1 | 117 | 79 | 74 | ||||||||||||||||||||||||||||||
| 21 | 70 | 78 | Z18 | 61 | 17 | 29 | 55 | 15 | 67 | C4 | 72 | 74 | 64 | C: | ||||||||||||||||||||||||||||||||||
| 22 | 73 | 87 | B2 | 52 | 40 | C5 | 54 | 85 | 75 | 77 | 17 | |||||||||||||||||||||||||||||||||||||
| 70 | 10 | 41 | 15 | 116 | 20 | 113 | 8 | 70 | 11 | 52 | 14 | A+C: | 90 | 33 | ||||||||||||||||||||||||||||||||||
| PTFE-Tape | 8 | 164 | 148 | Z5 | 160 | 123 | no data | no data | 5 | 38 | Z5 | 131 | 89 | C8 | no data | 278 | 258 | |||||||||||||||||||||||||||||||
| 9 | 168 | 181 | Z6 | 143 | 147 | 124 | 129 | 158 | 144 | 111 | 6 | 32 | Z6 | 133 | 122 | C9 | no data | 282 | 281 | |||||||||||||||||||||||||||||
| 10 | 119 | 189 | Z7 | 105 | 105 | 129 | 7 | 91 | Z8 | 94 | 110 | 141 | 103 | 95 | 80 | 121 | 128 | C12 | 104 | 281 | 215 | |||||||||||||||||||||||||||
| 11 | 144 | 207 | Z8 | 150 | 122 | 118 | ||||||||||||||||||||||||||||||||||||||||||
| 12 | 160 | 148 | 163 | 25 | 131 | 18 | no data | no data | 54 | 32 | 112 | 20 | 243 | 66 | ||||||||||||||||||||||||||||||||||
| Ice shed may have been caused by impact of ice from adjacent sample | ||||||||||||||||||||||||||||||||||||||||||||||||
| Contributor | Concordia University | Cranfield Univ. | ||||||||||||
|---|---|---|---|---|---|---|---|---|---|---|---|---|---|---|
| Test Type | Mode I/Impact 40 m/s | Mode I/Impact 40 m/s | ||||||||||||
| Material | # | Run 1 | Run 2 | Run 3 | Mean | Stdev | # | Run 1 | Run 2 | Run 3 | Run 4 | Run 5 | Mean | Stdev |
| Primer | 1 | 1037 | 1358 | 1124 | 1 | coh | 2740 | 3770 | 3500 | 3880 | ||||
| 2 | 1142 | 961 | 1427 | 2 | coh | 3530 | 4630 | coh | coh | |||||
| 3 | 1236 | 1064 | 1034 | 1154 | 157 | 3675 | 615 | |||||||
| PTFE-Tape | 4 | 1700 | 1558 | 1635 | 4 | 1990 | 2080 | 2240 | 2500 | 2320 | ||||
| 5 | 1874 | 1765 | 1422 | 5 | 2320 | |||||||||
| 6 | 1524 | 1678 | 2153 | 1701 | 216 | 2242 | 184 | |||||||
| Standox | 7 | 2336 | 2829 | 2193 | 7 | 3430 | 3120 | 4130 | 2780 | 3530 | ||||
| 8 | 2682 | 2500 | 2524 | 8 | 5000 | 3170 | 3670 | 3560 | 3250 | |||||
| 9 | 2831 | 2524 | 2575 | 2555 | 210 | 3564 | 622 | |||||||
| PUR C25 | 10 | 2071 | 2794 | 2427 | 10 | 3960 | 2280 | 2310 | 2630 | 2380 | ||||
| 11 | 2211 | 2739 | 2689 | 11 | 3630 | 2880 | 2640 | 3100 | 3740 | |||||
| 12 | 2818 | 3192 | 2137 | 2564 | 375 | 2955 | 625 | |||||||
References
- Antonini, C.; Innocenti, M.; Horn, T.; Marengo, M.; Amirfazli, A. Understanding the Effect of Superhydrophobic Coatings on Energy Reduction in Anti-Icing Systems. Cold Reg. Sci. Technol. 2011, 67, 58–67. [Google Scholar] [CrossRef]
- Kulinich, S.A.; Farhadi, S.; Nose, K.; Du, X.W. Superhydrophobic Surfaces: Are They Really Ice-Repellent? Langmuir 2011, 27, 25–29. [Google Scholar] [CrossRef] [PubMed]
- Kreder, M.J.; Alvarenga, J.; Kim, P.; Aizenberg, J. Design of Anti-Icing Surfaces: Smooth, Textured or Slippery? Nat. Rev. Mater. 2016, 1, 15003. [Google Scholar] [CrossRef]
- Golovin, K.; Kobaku, S.P.R.; Lee, D.H.; Di Loreto, E.T.; Mabry, J.M.; Tuteja, A. Designing Durable Icephobic Sur-faces. Sci. Adv. 2016, 2, e1501496. [Google Scholar] [CrossRef] [PubMed]
- Wohl, C.J.; Berry, D.H. Contamination Mitigating Polymeric Coatings for Extreme Environments; Wohl, C.J., Berry, D.H., Eds.; Part II: Ice Contamination-Mitigating Coatings; Advances in Polymer Science 284; Springer Nature: Cham, Switzerland, 2019; pp. 52–214. [Google Scholar]
- Asadollahi, S.; Farzaneh, M.; Stafford, L. On the icephobic behavior of organosilicon-based surface structures de-veloped through atmospheric pressure plasma deposition in nitrogen plasma. Coatings 2019, 9, 679. [Google Scholar] [CrossRef]
- Huang, X.; Tepylo, N.; Pommier-Budinger, V.; Budinger, M.; Bonaccurso, E.; Villedieu, P.; Bennani, L. A survey of icephobic coatings and their potential use in a hybrid coating/active ice protection system for aerospace applications. Prog. Aerosp. Sci. 2019, 105, 74–97. [Google Scholar] [CrossRef]
- Liu, G.; Yuan, Y.; Liao, R.; Wang, L.; Gao, X. Fabrication of a porous slippery icephobic surface and effect of lubri-cant viscosity on anti-icing properties and durability. Coatings 2020, 10, 896. [Google Scholar] [CrossRef]
- Esmeryan, K.D. From ExtremelyWater-Repellent Coatings to Passive Icing Protection—Principles, Limitations and Innovative Application Aspects. Coatings 2020, 10, 66. [Google Scholar] [CrossRef]
- Milles, S.; Vercillo, V.; Alamri, S.; Aguilar-Morales, A.I.; Kunze, T.; Bonaccurso, E.; Lasagni, A.F. Icephobic per-formance of multi-scale laser-textured aluminum surfaces for aeronautic applications. Nanomaterials 2021, 11, 135. [Google Scholar] [CrossRef]
- Parent, O.; Ilinca, A. Anti-icing and De-icing Techniques for Wind Turbines: Creitical Review. Cold Reg. Sci. Technol. 2021, 65, 88–96. [Google Scholar] [CrossRef]
- Mora, J.; García, P.; Carreño, F.; González, M.; Gutiérrez, M.; Montes, L.; Agüero, A. Setting a comprehen-sive strategy to face the runback icing phenomena. Surf. Coat. Technol. 2023, 465, 129585. [Google Scholar] [CrossRef]
- Laforte, C.; Beisswenger, A. Icephobic Material Centrifuge Adhesion Test. In Proceedings of the IWAIS 2005, Montréal, QC, Canada, 12–16 June 2005. [Google Scholar]
- Arianpoura, F.; Farzaneh, M.; Kulinich, S.A. Hydrophobic and ice-retarding properties of doped silicone rubber coatings. Appl. Surf. Sci. 2013, 265, 546–552. [Google Scholar] [CrossRef]
- Soltis, J.; Palacios, J.; Eden, T.; Wolfe, D. Evaluation of Ice-Adhesion Strength on Erosion-Resistant Materials. AI-AA J. 2015, 53, 1825–1835. [Google Scholar] [CrossRef]
- Janjua, Z.A.; Turnbull, B.; Choy, K.-L.; Pandis, C.; Liu, J.; Hou, X.; Choia, K.-S. Performance and Durability Tests of Smart Icephobic Coatings to Reduce Ice Adhesion. Appl. Surf. Sci. 2017, 407, 555–564. [Google Scholar] [CrossRef]
- Orchard, D.; Clark, C.; Chevrette, G. Reducing Aviation Icing Risk: Ice Adhesion Measurement in the NRC’s Altitude Icing Wind Tunnel. In Proceedings of the SAE AeroTech Conference, FortWorth, TX, USA, 26–28 September 2017. [Google Scholar]
- Rønneberg, S.; Laforte, C.; Volat, C.; He, J.; Zhang, Z. The effect of ice type on ice adhesion. AIP Adv. 2019, 9, 055304. [Google Scholar] [CrossRef]
- Brassard, J.D.; Laforte, C.; Guerin, F.; Blackburn, C. Icephobicity: Definition and Measurement Regarding Atmos-pheric Icing. In Contamination Mitigating Polymeric Coatings for Extreme Environments; Wohl, C.J., Berry, D.H., Eds.; Springer International Publishing: Cham, Switzerland, 2019; pp. 123–144. [Google Scholar] [CrossRef]
- Tetteh, E.; Loth, E. Reducing Static and Impact Ice Adhesion with a Self-Lubricating Icephobic Coating (SLIC). Coatings 2020, 10, 262. [Google Scholar] [CrossRef]
- Schulz, M.; Sinapius, M. Evaluation of Different Ice Adhesion Tests for Mechanical Deicing Systems; SAE Technical Paper 2015-01-2135; SAE International in United States: Warrendale, PA, USA, 2015. [Google Scholar] [CrossRef]
- Work, A.; Lian, Y. A Critical Review of the Measurement of Ice Adhesion to Solid Substrates. Prog. Aerosp. Sci. 2018, 98, 1–26. [Google Scholar] [CrossRef]
- Rønneberg, S.; He, J.; Zhang, Z. The need for standards in low ice adhesion surface research: A critical review. J. Adhes. Sci. Technol. 2020, 34, 319–347. [Google Scholar] [CrossRef]
- Emelyanenko, K.A.; Emelyanenko, A.M.; Boinovich, L.B. Water and ice adhesion to solid surfaces: Common and specific, the impact of temperature and surface wettability. Coatings 2020, 10, 648. [Google Scholar] [CrossRef]
- Nazifi, S.; Firuznia, R.; Huang, Z.; Jahanbakhsh, A.; Ghasemi, H. Predicitve model of ice adhesion on non-elastomeric materials. J. Colloid Interface Sci. 2023, 648, 481–487. [Google Scholar] [CrossRef] [PubMed]
- Stendardo, L.; Gastaldo, G.; Budinger, M.; Pommier-Budinger, V.; Tagliaro, I.; Ibánez-Ibánez, P.F.; Antonini, C. Reframing ice adhesion mechanisms on a solid surface. Appl. Surf. Sci. 2023, 641, 158462. [Google Scholar] [CrossRef]
- Nistal, A.; Sierra-Martín, B.; Fernández-Barbero, A. On the Durability of Icephobic Coatings: A Review. Materials 2024, 17, 235. [Google Scholar] [CrossRef] [PubMed]
- Hejazi, V.; Sobolev, K.; Nosonovsky, M. From superhydrophobicity to icephobicity: Forces and interaction analysis. Sci. Rep. 2013, 3, 2194. [Google Scholar] [CrossRef] [PubMed]
- Dou, R.; Chen, J.; Zhang, Y.; Wang, X.; Cui, D.; Song, Y.; Jiang, L.; Wang, J. Anti-icing coating with an aqueous lubri-cating layer. ACS Appl. Mater. Interfaces 2014, 6, 6998–7003. [Google Scholar] [CrossRef]
- Makkonen, L. Ice Adhesion—Theory, Measurements and Countermeasures. J. Adhes. Sci. Technol. 2012, 26, 413–445. [Google Scholar] [CrossRef]
- Rehfeld, N.; Speckmann, B.; Stenzel, V. Parameter Study for the Ice Adhesion Centrifuge Test. Appl. Sci. 2022, 12, 1583. [Google Scholar] [CrossRef]
- DIN EN ISO 2808:2019; Beschichtungsstoffe—Bestimmung der Schichtdicke. Beuth Verlag GmbH: Berlin, Germany, 2019.
- Rehfeld, N.; Speckmann, B.; Schreiner, C.; Stenzel, V. Assessment of Icephobic Coatings—How Can We Monitor Performance Durability? Coatings 2021, 11, 614. [Google Scholar] [CrossRef]
- DIN EN ISO 19403-2; Beschichtungsstoffe—Benetzbarkeit—Teil 2: Bestimmung der freien Oberflächenenergie fester Ober-flächen durch Messung des Kontaktwinkels. Beuth Verlag GmbH: Berlin, Germany, 2020.
- DIN EN ISO 19403-7; Beschichtungsstoffe—Benetzbarkeit—Teil 7: Messung des Kontaktwinkels bei Neigetisch-Experimenten (Abrollwinkel). Beuth Verlag GmbH: Berlin, Germany, 2020.
- Balordi, M.; Cammi, A.; Santucci de Magistris, G.; Chemelli, C. Role of micrometric roughness on anti-ice proper-ties and durability of hierarchical super-hydrophobic aluminum surfaces. Surf. Coat. Technol. 2019, 374, 549–556. [Google Scholar] [CrossRef]
- Ferrick, M.G.; Mulherin, N.D.; Haehnel, R.B.; Coutermarsh, B.A.; Durell, G.D.; Tantillo, T.J.; Welser, E.S.; Cano, R.J.; Smith, R.J.; Martinez, E.C. Double Lap Shear Testing of Coating Modified Ice Adhesion to Liquid Oxygen Food Line Bracket, Space Shuttle External Tank; No. ERDC/CRREL-TR-06-11; Engineering Research and Development Center Hanover nh Cold Regions Research and Engineering Lab: Hanover, NH, USA, 2006. [Google Scholar]
- Chernyy, S.; Järn, M.; Shimizu, K.; Swerin, A.; Pedersen, S.U.; Daasbjerg, K.; Makkonen, L.; Claesson, P.; Irutha-yaraj, J. Superhydrophilic Polyelectrolyte Brush Layers with Imparted Anti-Icing Properties: Effect of Counter ions. ACS Appl. Mater. Interfaces 2014, 6, 6487–6496. [Google Scholar] [CrossRef]
- Asenath-Smith, E.; Hoch, G.R.; Erb, C.T. Adhesion of freshwater columnar ice to material surfaces by crystallization from the melt. J. Cryst. Growth 2020, 535, 125563. [Google Scholar] [CrossRef]
- Lovell, A.R.; Hoch, G.R.; Donnelly, C.J.; Hodge, J.M.; Haehnel, R.B.; Asenath-Smith, E. Shear and Tensile Delamination of Ice From Surface: The Ice Ahdesion Peel Test (IAPT). ERDC/CRREL Tech. Note, TN-21-1; U.S. Army Engineer Research and Development Center, Cold Regions Research and Engineering Laboratory, USA. 2021. Available online: https://apps.dtic.mil/sti/trecms/pdf/AD1147237.pdf (accessed on 13 January 2024).
- ISO/TS 19392-6:2023 (E); Paints and Varnishes—Coating Systems for Wind-Turbine Rotor Blades—Part 6: Determination and Evaluation of Ice Adhesion Using Centrifuge. ISO: Geneva, Switzerland, 2023.
- Memon, H.; De Focatiis, D.S.A.; Choi, K.-S.; Hou, X. Durability enhancement of low ice adhesion polymeric coat-ings. Prog. Org. Coat. 2021, 151, 106033. [Google Scholar] [CrossRef]
- Koivuluoto, H.; Hartikainen, E.; Niemelä-Anttonen, H. Thermally Sprayed Coatings: Novel Surface Engineering Strategy towards Icephobic Solutions. Materials 2020, 13, 1434. [Google Scholar] [CrossRef] [PubMed]
- Niemelä-Anttonen, H.; Kiilakoski, J.; Vuoristo, P.; Koivuluoto, H. Icephobic Performance of Different Surface Designs and Materials. In Proceedings of the International Workshop on Atmospheric Icing of Structures, IWAIS2019, Reykjavik, Iceland, 23–28 June 2019; p. 5. [Google Scholar]
- Hammond, D.; Luxford, G.; Ivey, P. The Cranfield University Icing Tunnel. In Proceedings of the 41st Aerospace Sciences Meeting and Exhibit, Reno, NV, USA, 6–9 January 2003; AIAA 2003-901. Available online: https://arc.aiaa.org/doi/pdf/10.2514/6.2003-901 (accessed on 13 January 2024).
- Grasso, M.J. Development of a Mode I Test Rig for Quantitative Measurements of Ice Adhesion Using Tensile Stress. Master’s Thesis, Concordia University, Montreal, QC, Canada, 2019. [Google Scholar]
- Andrews, E.H.; Stevenson, A. Fracture energy of epoxy resin under plane strain conditions. J. Mater. Sci. 1978, 13, 1680–1688. [Google Scholar] [CrossRef]
- Andrews, E.H.; Lockington, N.A. The cohesive and adhesive strength of ice. J. Mater. Sci. 1983, 18, 1455–1465. [Google Scholar] [CrossRef]
- Pervier, M.L.A.; Hammond, D. Measurement of the fracture energy in mode I of atmospheric ice accreted on different materials using a blister test. Eng. Fract. Mech. 2014, 1, 223–232. [Google Scholar] [CrossRef]
- Rønneberg, S.; Zhuo, Y.; Laforte, C.; He, J.; Zhang, Z. Interlaboratory Study of Ice Adhesion Using Different Tech-niques. Coatings 2019, 9, 678. [Google Scholar] [CrossRef]


| Institution | Used Abbreviation | Country | Ice Type | Test Type |
|---|---|---|---|---|
| Power Generation Technologies and Materials Department | RSE | Italy | Static | Shear: pull |
| Instituto Nacional de Técnica Aeroespacial | INTA | Spain | Static | Shear: pull |
| RISE Research Institutes of Sweden | RISE | Sweden | Static | Shear: pull |
| Norwegian University of Science and Technology | NTNU | Norway | Static | Shear: push |
| University of Notre Dame | ND | USA | Static | Shear: push |
| Cold Regions Research & Engineering Laboratory | CRREL | USA | Static | Shear push and tensile peel |
| Université du Québec à Chicoutimi | AMIL | Canada | Static + impact | Centrifuge |
| Fraunhofer IFAM | IFAM | Germany | Static + impact | Centrifuge |
| University of Nottingham | NU | UK | Static | Centrifuge |
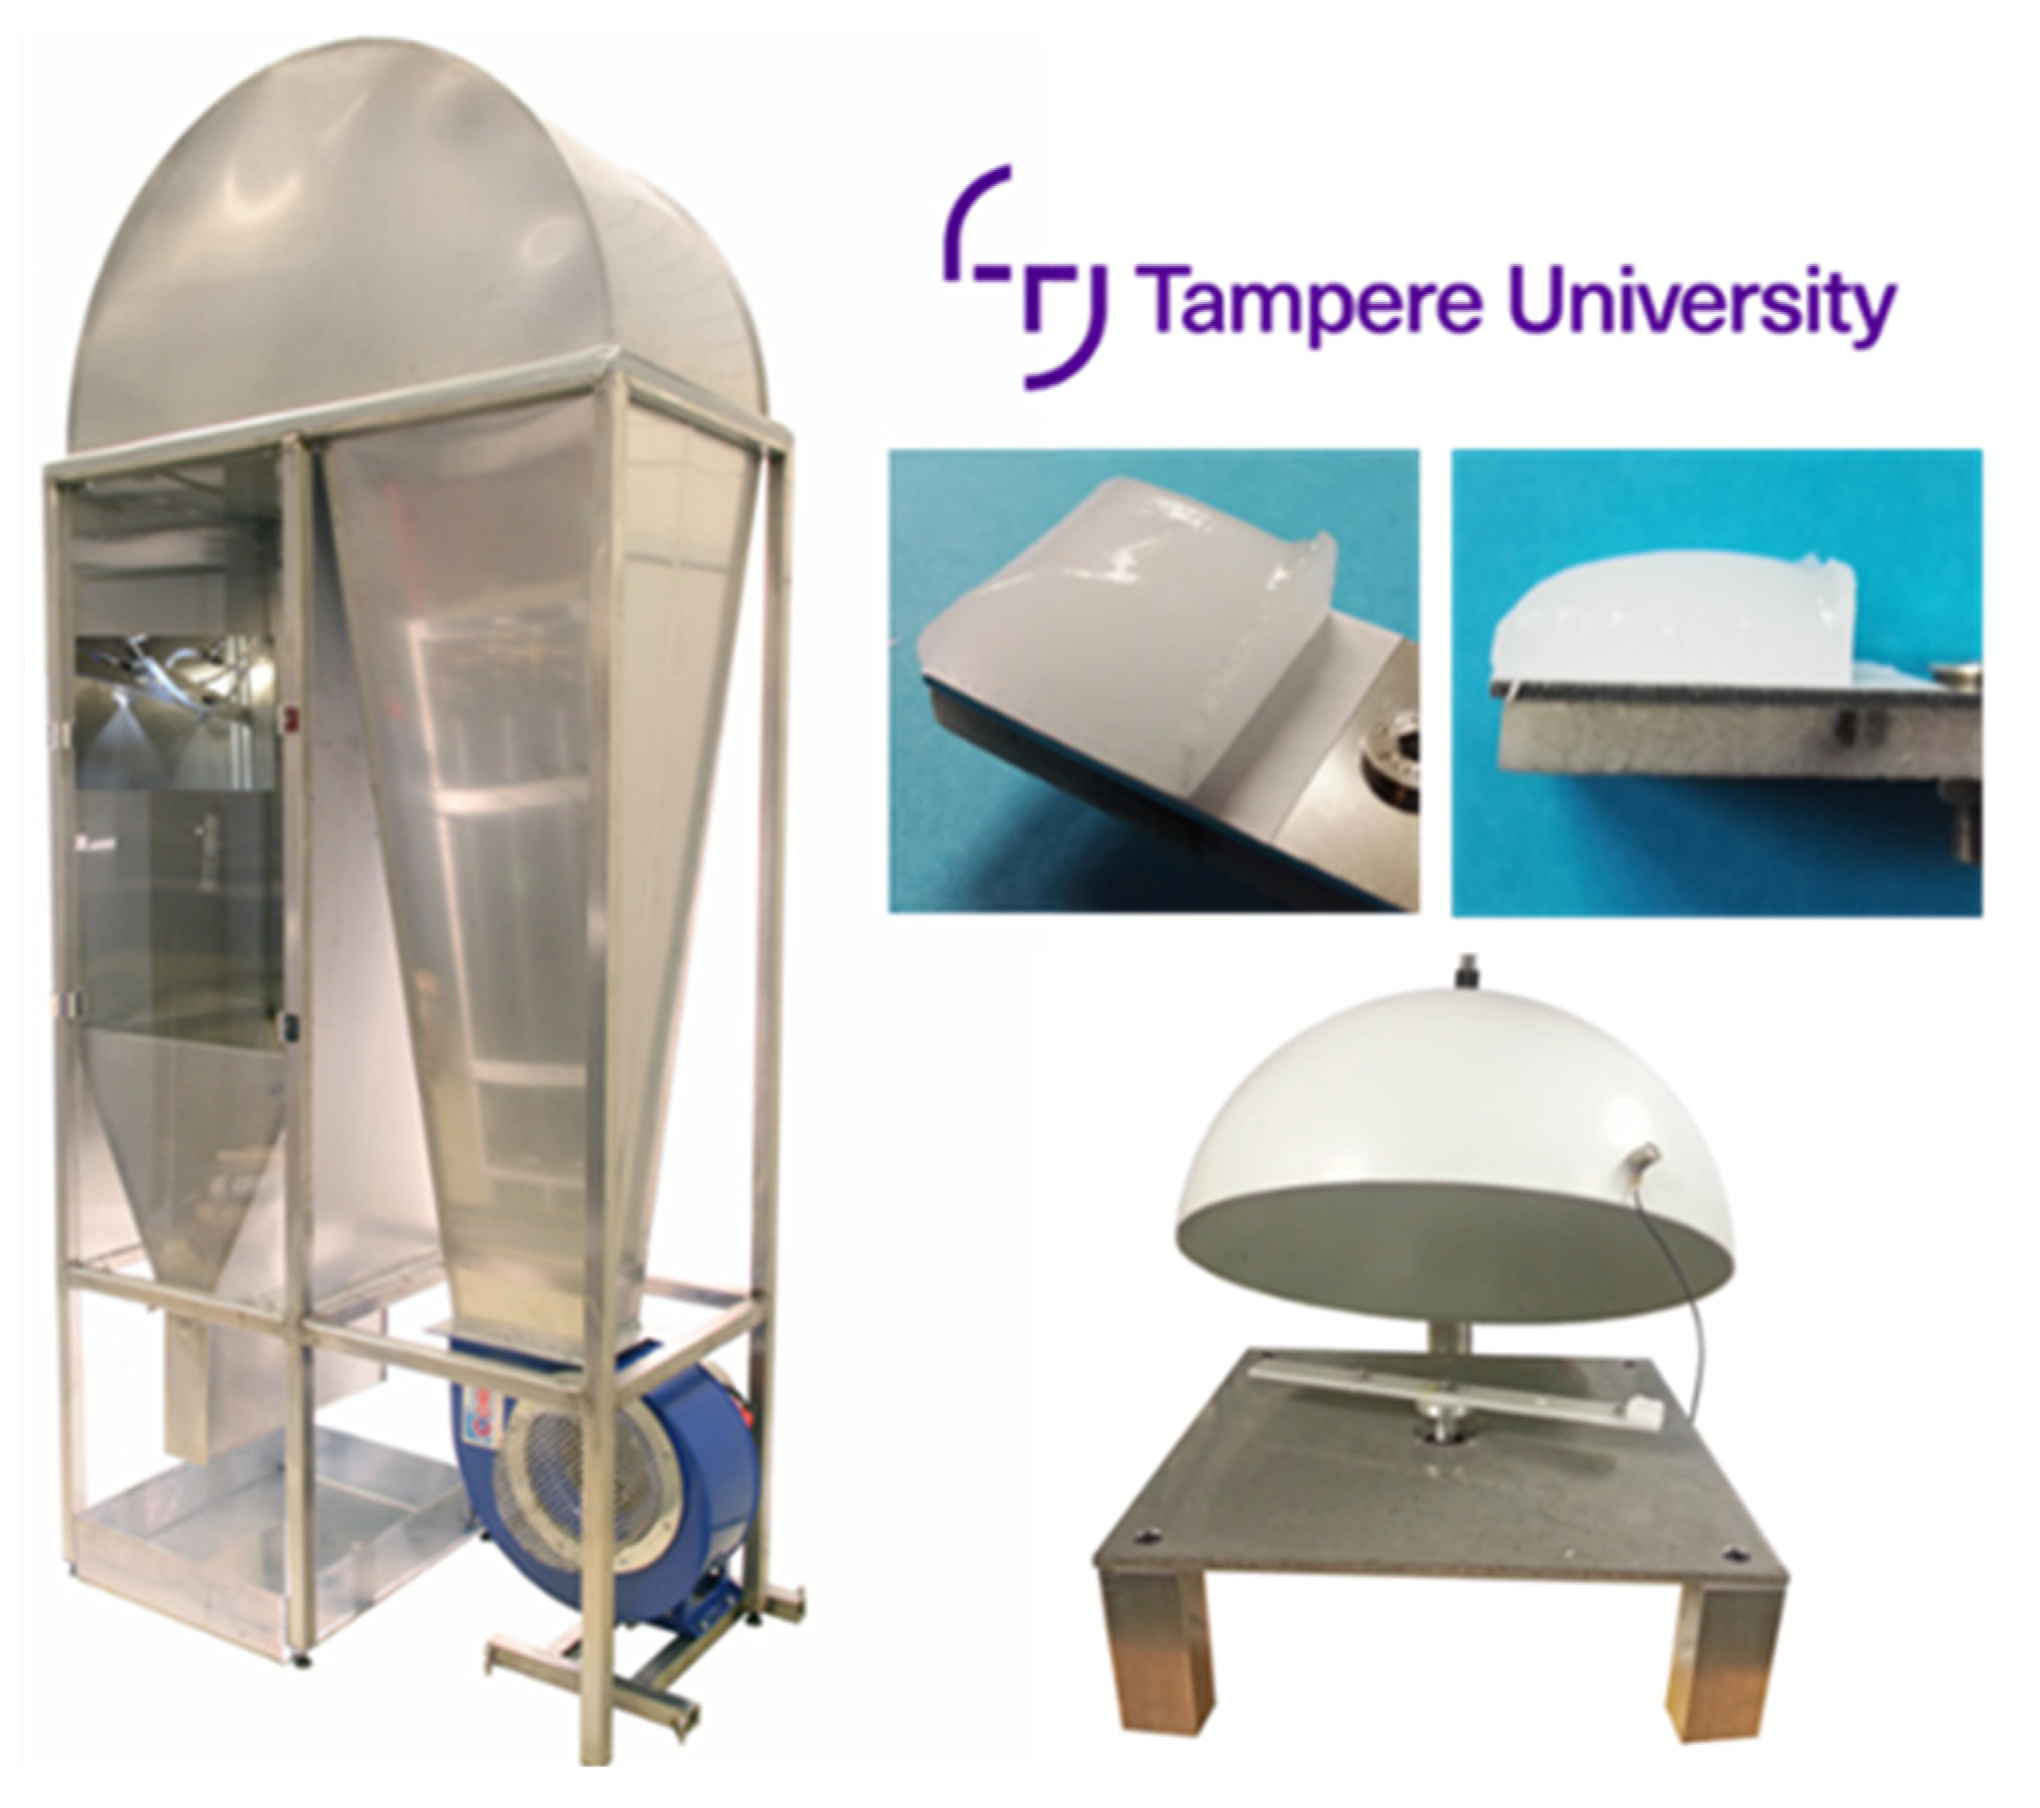
| Tampere University | TAU | Finland | Impact | Centrifuge |
| Partner-A | P-A | --- | Impact | Centrifuge |
| Concordia University | ConU | Canada | Impact | Mode I |
| Cranfield University | CU | UK | Impact | Mode I |
| Primer | Standox | PUR C25 | PTFE Tape | |
|---|---|---|---|---|
| SFE (mN/m) | 38.5 (±0.3) | 36.0 (±1.0) | 18.0 (±0.8) | 15.1 (±0.4) |
| WCA (°) | 83 (±1) | 86 (±1) | 100 (±1) | 110 (±2) |
| WSA (°) | >90 | 67 (±4.7) | 41 (±2.8) | 29 (±3.4) |
| CAH (°) | 40 (±2.3) | 36 (±3.1) | 26 (±1.8) | 22 (±2.1) |
| Ra (µm) | 1.5 (±0.07) | 0.07 (±0.007) | 0.05 (±0.010) | 0.11 (±0.015) |
| Rz (µm) | 8.3 (±0.26) | 0.38 (±0.035) | 0.29 (±0.038) | 0.68 (±0.088) |
| Description: | Hydrophilic roughness: high | Hydrophilic roughness: low | Hydrophobic roughness: low | Hydrophobic roughness: moderate |
| Primer | Standox | PTFE Tape | |
|---|---|---|---|
| WCA (°) | 87 (±4.7) | 88 (±4.1) | 95 (±1.5) |
| WSA (°) | 88 (±4.6) | 57 (±7.5) | 35 (±2.5) |
| CAH (°) | 30 (±16.0) | 35 (±5.4) | 20 (±1.9) |
| Ra (µm) | 0.49 (±0.02) | 0.67 (±0.21) | 0.09 (±<0.01) |
| Rz (µm) | 2.36 (±0.07) | 6.92 (±1.38) | 0.53 (±0.03) |
| Comparison with IFAM preparation: | Wettability: comparable, roughness: lower | Wettability: comparable, roughness: higher | Wettability: lower, roughness: comparable |
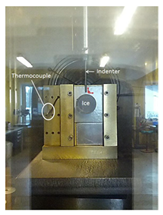
| RSE pull test device | |
 | 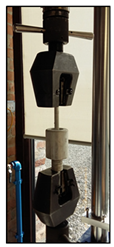 |
| INTA double-lap shear test | |
 |  |
| RISE modified slip/peel method | |
 |  |
| NTNU vertical shear test | |
 |  |
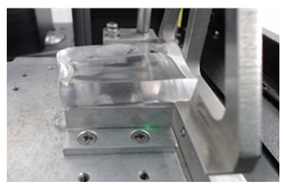
| Notre Dame (ND) push test device | |
 | 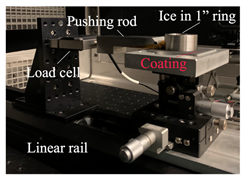 |
| CRREL ice adhesion peel test– shear test method | |
 |  |
| CRREL ice adhesion peel test– tensile test method | |
 |  |
| Test Facility | Test Name | Sample Geometry | Iced Area [cm2] | Freezing from… | Ice Characterization | Temp. [°C} | Icing Time [min] | De-Ionized Water | Handling of Iced Samples | Conditioning Time after Sample Handling: X min | Test Temp. [°C] | Test Specific Information | |
|---|---|---|---|---|---|---|---|---|---|---|---|---|---|
| PULL | RSE | shear: pull | cylindrical | 17.02 | Aluminum molds | clear ice: mass 50 g | −8 | overnight | ✓ | Y | 5 | −8 | Ice formation −19 °C; displacement speed: 0.3 mm/s |
| INTA | Double lap shear | flat | 17.5 | bulk water, sealed mold sides | clear ice, mass 3.5 g | overnight | ✓ | Y | 5 | displacement speed: 0.3 mm/s | |||
| RISE | shear: pull | flat | 1 | bulk waterplastic cuvette | clear ice mass: 0.9 g/sample | 180 | ✓ | Y | 2–5 | displacement speed: 0.3 mm/s | |||
| PUSH | NTNU | ice shear test | flat | 6.15 | bulk water, poly-propylene molds sealed by silicone | clear ice | −8 | 120 | ✓ | Y | 5 | −8 | displacement speed: 0.3 mm/s |
| ND | shear: push | flat | 5.07 | water in steel ring (Ø 1 inch) | clear ice | 180 | ✓ (distilled) | Y | 5 | displacement speed: 0.3 mm/s | |||
| CRREL | peel test (shear) | flat | 12 | Mold free crystallization from the melt | clear ice, columnar | 90 | ✓ | N | 5 | displacement speed: 0.01 mm/s | |||
| TENSION | CRREL | peel test (tension) | flat | 12 | Mold free crystallization from the melt | clear ice, columnar | −8 | 90 | ✓ | N | 5 | −8 | displacement speed: 0.01 mm/s |
| CENTRIFUGE | AMIL | centrifuge | flat | 11.2 | bulk water silicone moulds | clear ice, about 7 g | −8 | 35 | ✓ | Y | 20 | −8 | Radius 17 cm; acceleration 300 rpm/s |
| IFAM | centrifuge | flat | 9 | bulk water silicone moulds | clear ice, mass 3 g | 90 | ✓ | Y | 15 | Radius 11 cm; accelaration 200 rpm/s | |||
| NU | centrifuge | flat | 1.38 | bulk water silicone moulds | glaze ice, mass 1.31 g | 180 | ✓ | Y | 5 | Radius 16.75 cm; acceleration 30 rpm/s |
| Test Facility | Test Name | Sample Geometry | Iced Area [cm2] | Freezing from… | Ice Characterization | Temp. [°C] | Velocity [m/s] | LWC [g/m3] | MVD [µm] | De-Ionized Water | Handling of Iced samples | Conditioning Time after Sample Handling: X min | Test Temp. [°C] | Test Specific Information | |
|---|---|---|---|---|---|---|---|---|---|---|---|---|---|---|---|
| CENTRIFUGE | AMIL | centrifuge | flat | 11.2 | supercooled droplets | 8 mm (±2 mm) thick | −8 | 15 | 0.8 | 27 | ✓ | Y | 10 | −8 | Radius 17 cm; acceleration 300 rpm/s |
| TAU | centrifuge | flat | 9 | supercooled droplets | ~9.5 mm thick; ice mass~8 g | 15 | 0.8 | 20 | ✓ | Y | 17 h | Radius 17 cm; acceleration 200 rpm/s | |||
| IFAM | centrifuge | flat | 9 | supercooled dorplets | ~4 mm thick; ice mass~3 g | 40 | 1.3 | 20 | ✓ | Y | 15 | Radius 11 cm; acceleration 200 rpm/s | |||
| P-A | centrifuge | not specified | 10 | supercooled droplets | ice mass 9–10 g | 40 | 0.5 | 20 | ✓ (distilled) | N | not specified | Radius 18.5 cm, acceleration 150 m/s | |||
| MODE I | ConU | Mode I | cylinder end | 12.6 | ice wind tunnel | 10 mm thick | −8 | 40 | 0.5 | 20 | ✓ | N | “spray on” during testing | −8 | pressure rise 10 bar/s |
| CU | Mode I | cylinder end | 7.07 | 15 mm thick | 40 | 0.5 | 20 | ✓ | N |
| TYPE | Test Facility | Test Name | Sample Geometry | Ice Type | Ice Adhesion [kPa] Mean (stdev) | Difference from General Test Program | |||
|---|---|---|---|---|---|---|---|---|---|
| Primer | Standox | PUR C25 | PTFE Tape | ||||||
| PULL | RSE | Shear: pull | Cylindrical | Static | 544 (71) | 700 (62) | 274 (100) | No data | Ice formation at −19 °C overnight |
| INTA | Double-lap shear | Flat | Static | 554 (83) | 472 (195) | 326 (99) | 323 (51) | Overnight | |
| PUSH | NTNU | Ice shear test | Flat | Static | 195 (14) | 274 (39) | 141 (28) | 189 (47) | |
| RISE | Shear: push | Flat | Static | cohesive | 351 (39) | 63 (19) | 71 (44) | ||
| ND | Shear: push | Flat | Static | 228 (23) | 297 (12) | 78 (6) | 158 (12) | ||
| CRREL | Peel test (shear) | Flat | Static | 133 (9) | 117 (7) | No data | 102 (8) | Sample preparation at CRREL | |
| TENSION | CRREL | Peel test (tension) | Flat | Static | 26 (2) | 19 (1) | No data | 32 (1) | |
| CENTRIFUGE | AMIL | Centrifuge | Flat | Static | 242 (33) | 397 (119) | 116 (20) | No data | |
| IFAM | Centrifuge | Flat | Static | cohesive | 185 (24) | 41 (15) | 131 (18) | ||
| NU | Centrifuge | Flat | Static | 409 (38) | 109 (21) | 70 (10) | 163 (25) | ||
| CENTRIFUGE | AMIL | Centrifuge | Flat | Impact 15 m/s | 446 (54) | 339 (24) | 113 (8) | No data | |
| TAU | Centrifuge | Flat | Impact 15 m/s | 73 (27) | 104 (17) | 98 (56) | 54 (32) | ||
| IFAM | Centrifuge | Flat | Impact 40 m/s | cohesive | 118 (37) | 52 (14) | 112 (20) | ||
| Partner P-A | Centrifuge | Cylindrical | Impact 40 m/s | 349 (77) | 301 (154) | 90 (33) | 243 (66) | ||
| MODE I | ConU | Mode I | Cylinder end | Impact 40 m/s | 1154 (157) | 2555 (210) | 2564 (375) | 1701 (216) | |
| CU | Mode I | Cylinder end | Impact 40 m/s | 3675 (615) | 3563 (622) | 2955 (625) | 2242 (184) | ||
Disclaimer/Publisher’s Note: The statements, opinions and data contained in all publications are solely those of the individual author(s) and contributor(s) and not of MDPI and/or the editor(s). MDPI and/or the editor(s) disclaim responsibility for any injury to people or property resulting from any ideas, methods, instructions or products referred to in the content. |
© 2024 by the authors. Licensee MDPI, Basel, Switzerland. This article is an open access article distributed under the terms and conditions of the Creative Commons Attribution (CC BY) license (https://creativecommons.org/licenses/by/4.0/).
Share and Cite
Rehfeld, N.; Brassard, J.-D.; Yamazaki, M.; Sakaue, H.; Balordi, M.; Koivuluoto, H.; Mora, J.; He, J.; Pervier, M.-L.; Dolatabadi, A.; et al. Round-Robin Study for Ice Adhesion Tests. Aerospace 2024, 11, 106. https://doi.org/10.3390/aerospace11020106
Rehfeld N, Brassard J-D, Yamazaki M, Sakaue H, Balordi M, Koivuluoto H, Mora J, He J, Pervier M-L, Dolatabadi A, et al. Round-Robin Study for Ice Adhesion Tests. Aerospace. 2024; 11(2):106. https://doi.org/10.3390/aerospace11020106
Chicago/Turabian StyleRehfeld, Nadine, Jean-Denis Brassard, Masafumi Yamazaki, Hirotaka Sakaue, Marcella Balordi, Heli Koivuluoto, Julio Mora, Jianying He, Marie-Laure Pervier, Ali Dolatabadi, and et al. 2024. "Round-Robin Study for Ice Adhesion Tests" Aerospace 11, no. 2: 106. https://doi.org/10.3390/aerospace11020106
APA StyleRehfeld, N., Brassard, J.-D., Yamazaki, M., Sakaue, H., Balordi, M., Koivuluoto, H., Mora, J., He, J., Pervier, M.-L., Dolatabadi, A., Asenath-Smith, E., Järn, M., Hou, X., & Stenzel, V. (2024). Round-Robin Study for Ice Adhesion Tests. Aerospace, 11(2), 106. https://doi.org/10.3390/aerospace11020106