
Air and Structural Loads Analysis of a 5-Ton Class Rotorcraft in a Pull-Up Maneuver Using CFD/CSD Coupled Approach


Abstract
1. Introduction
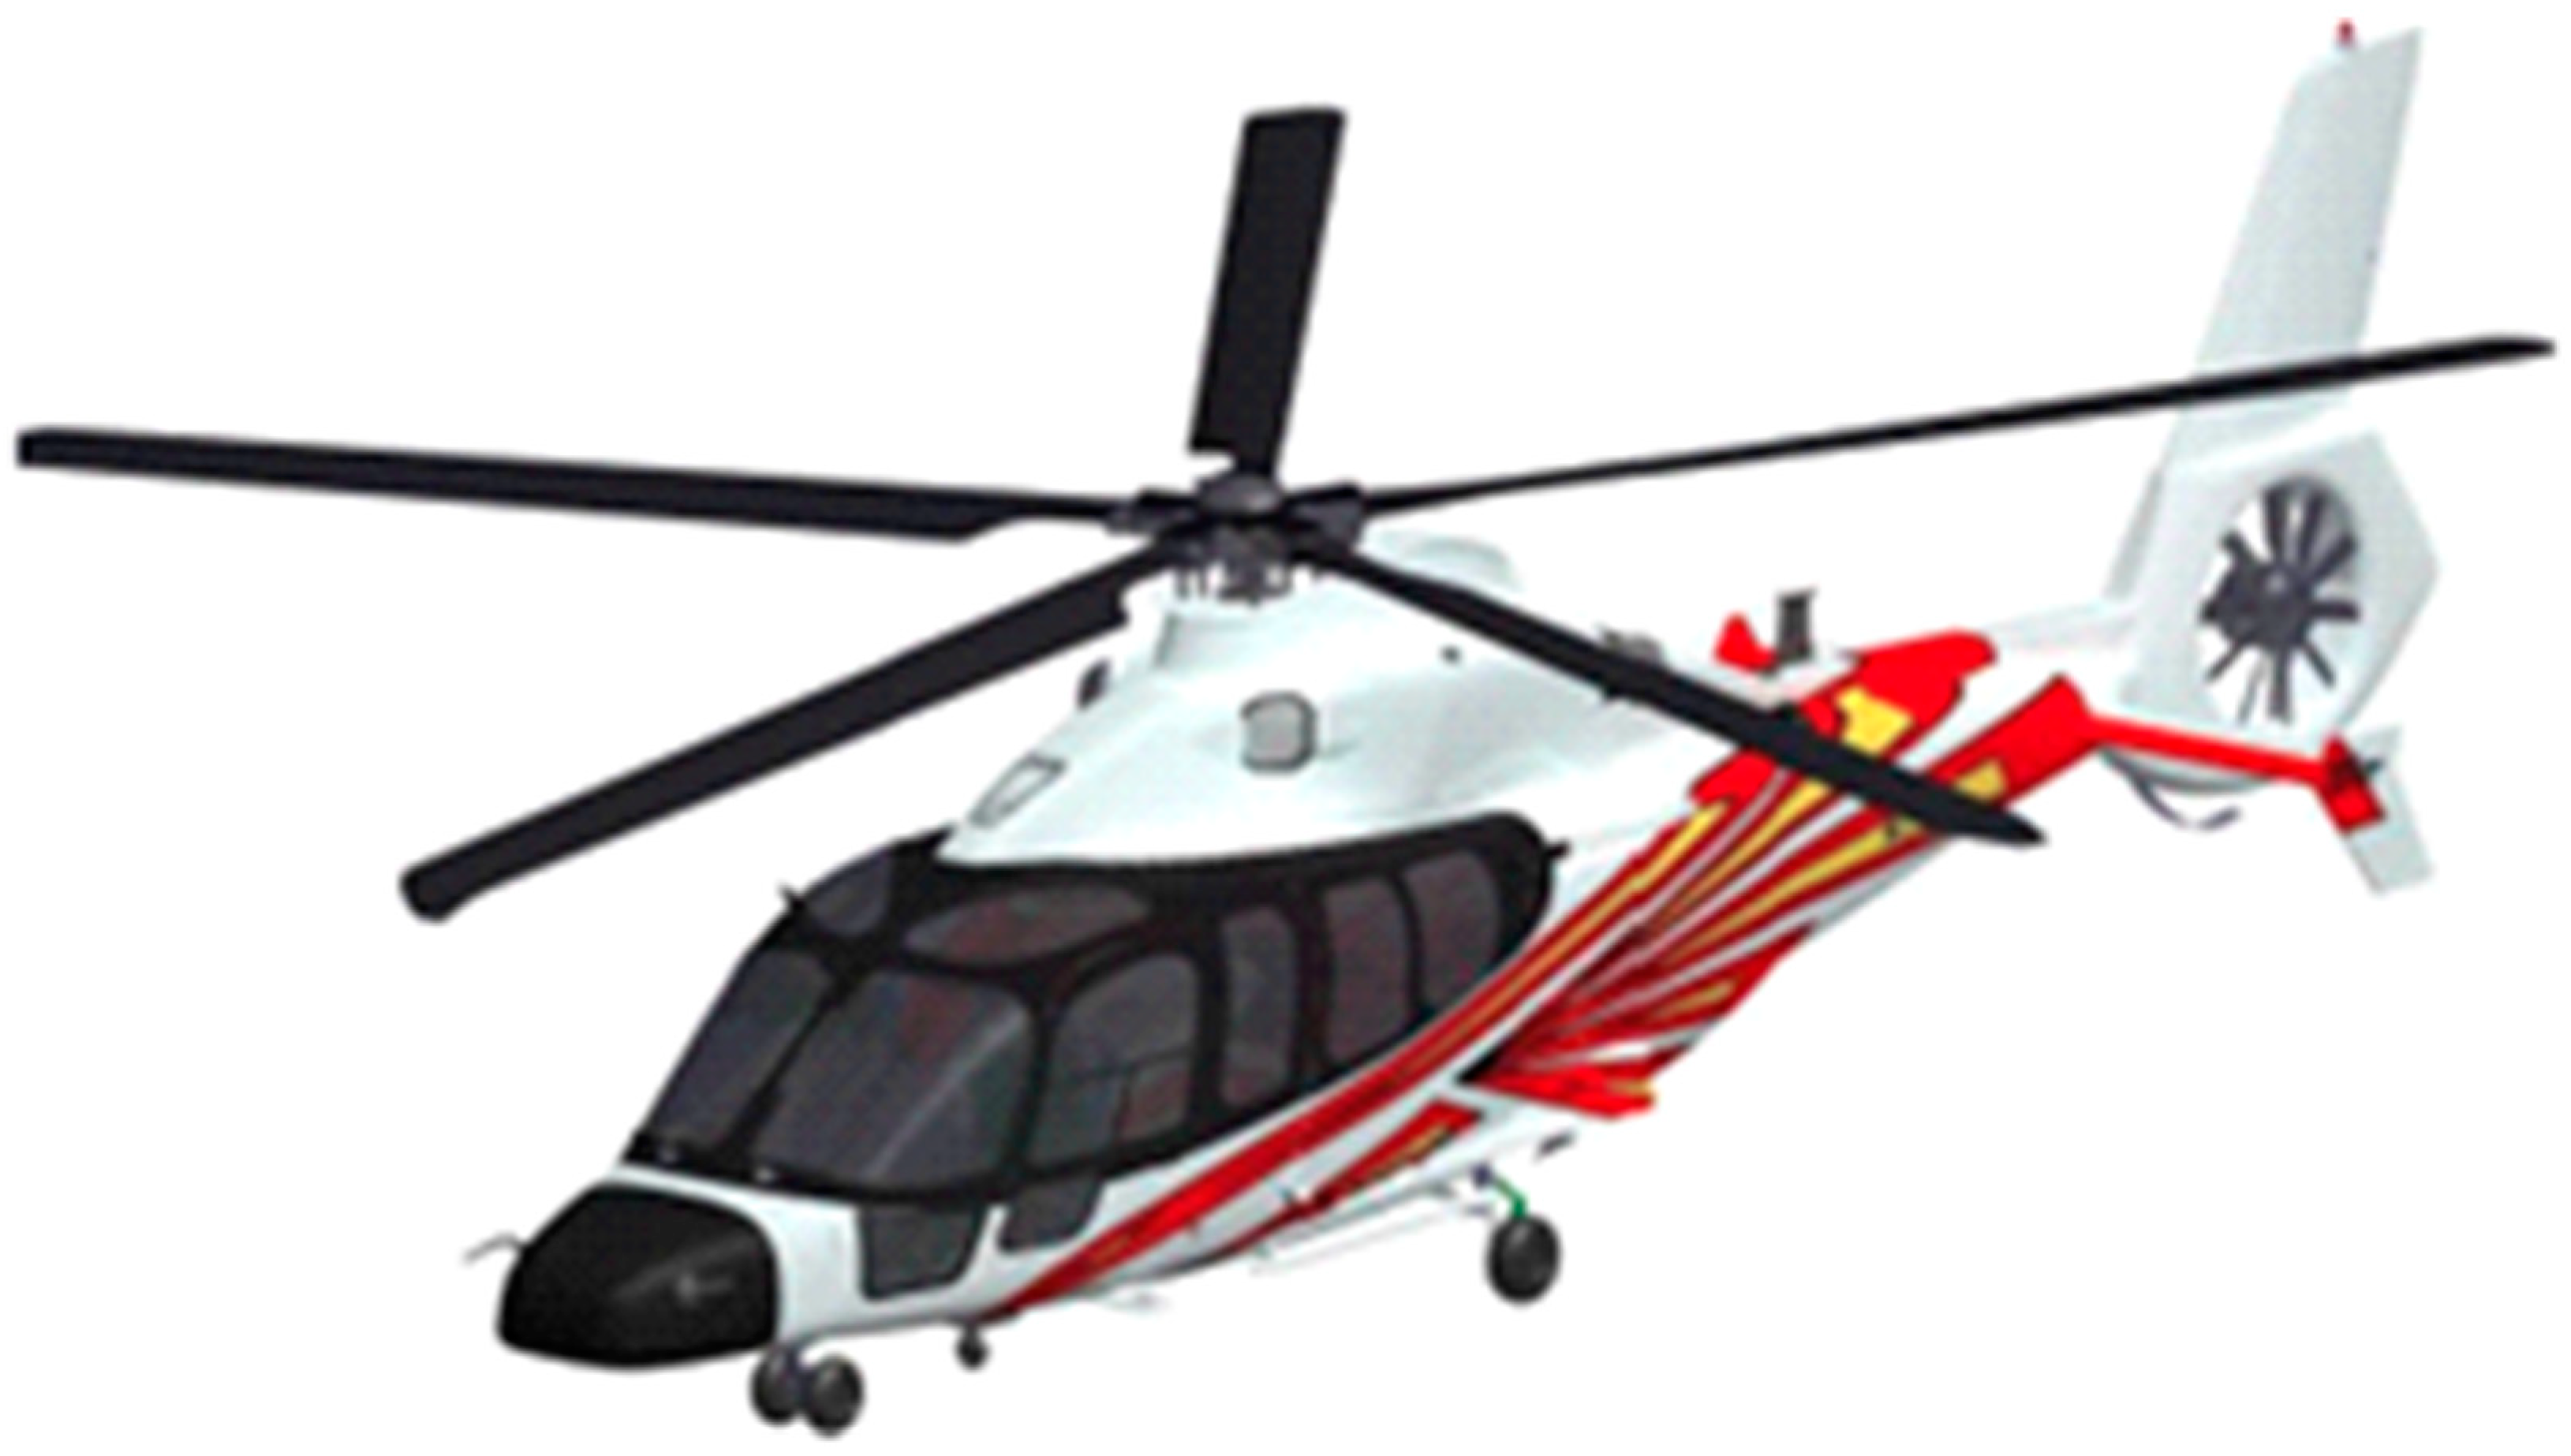
2. LH Rotor Model
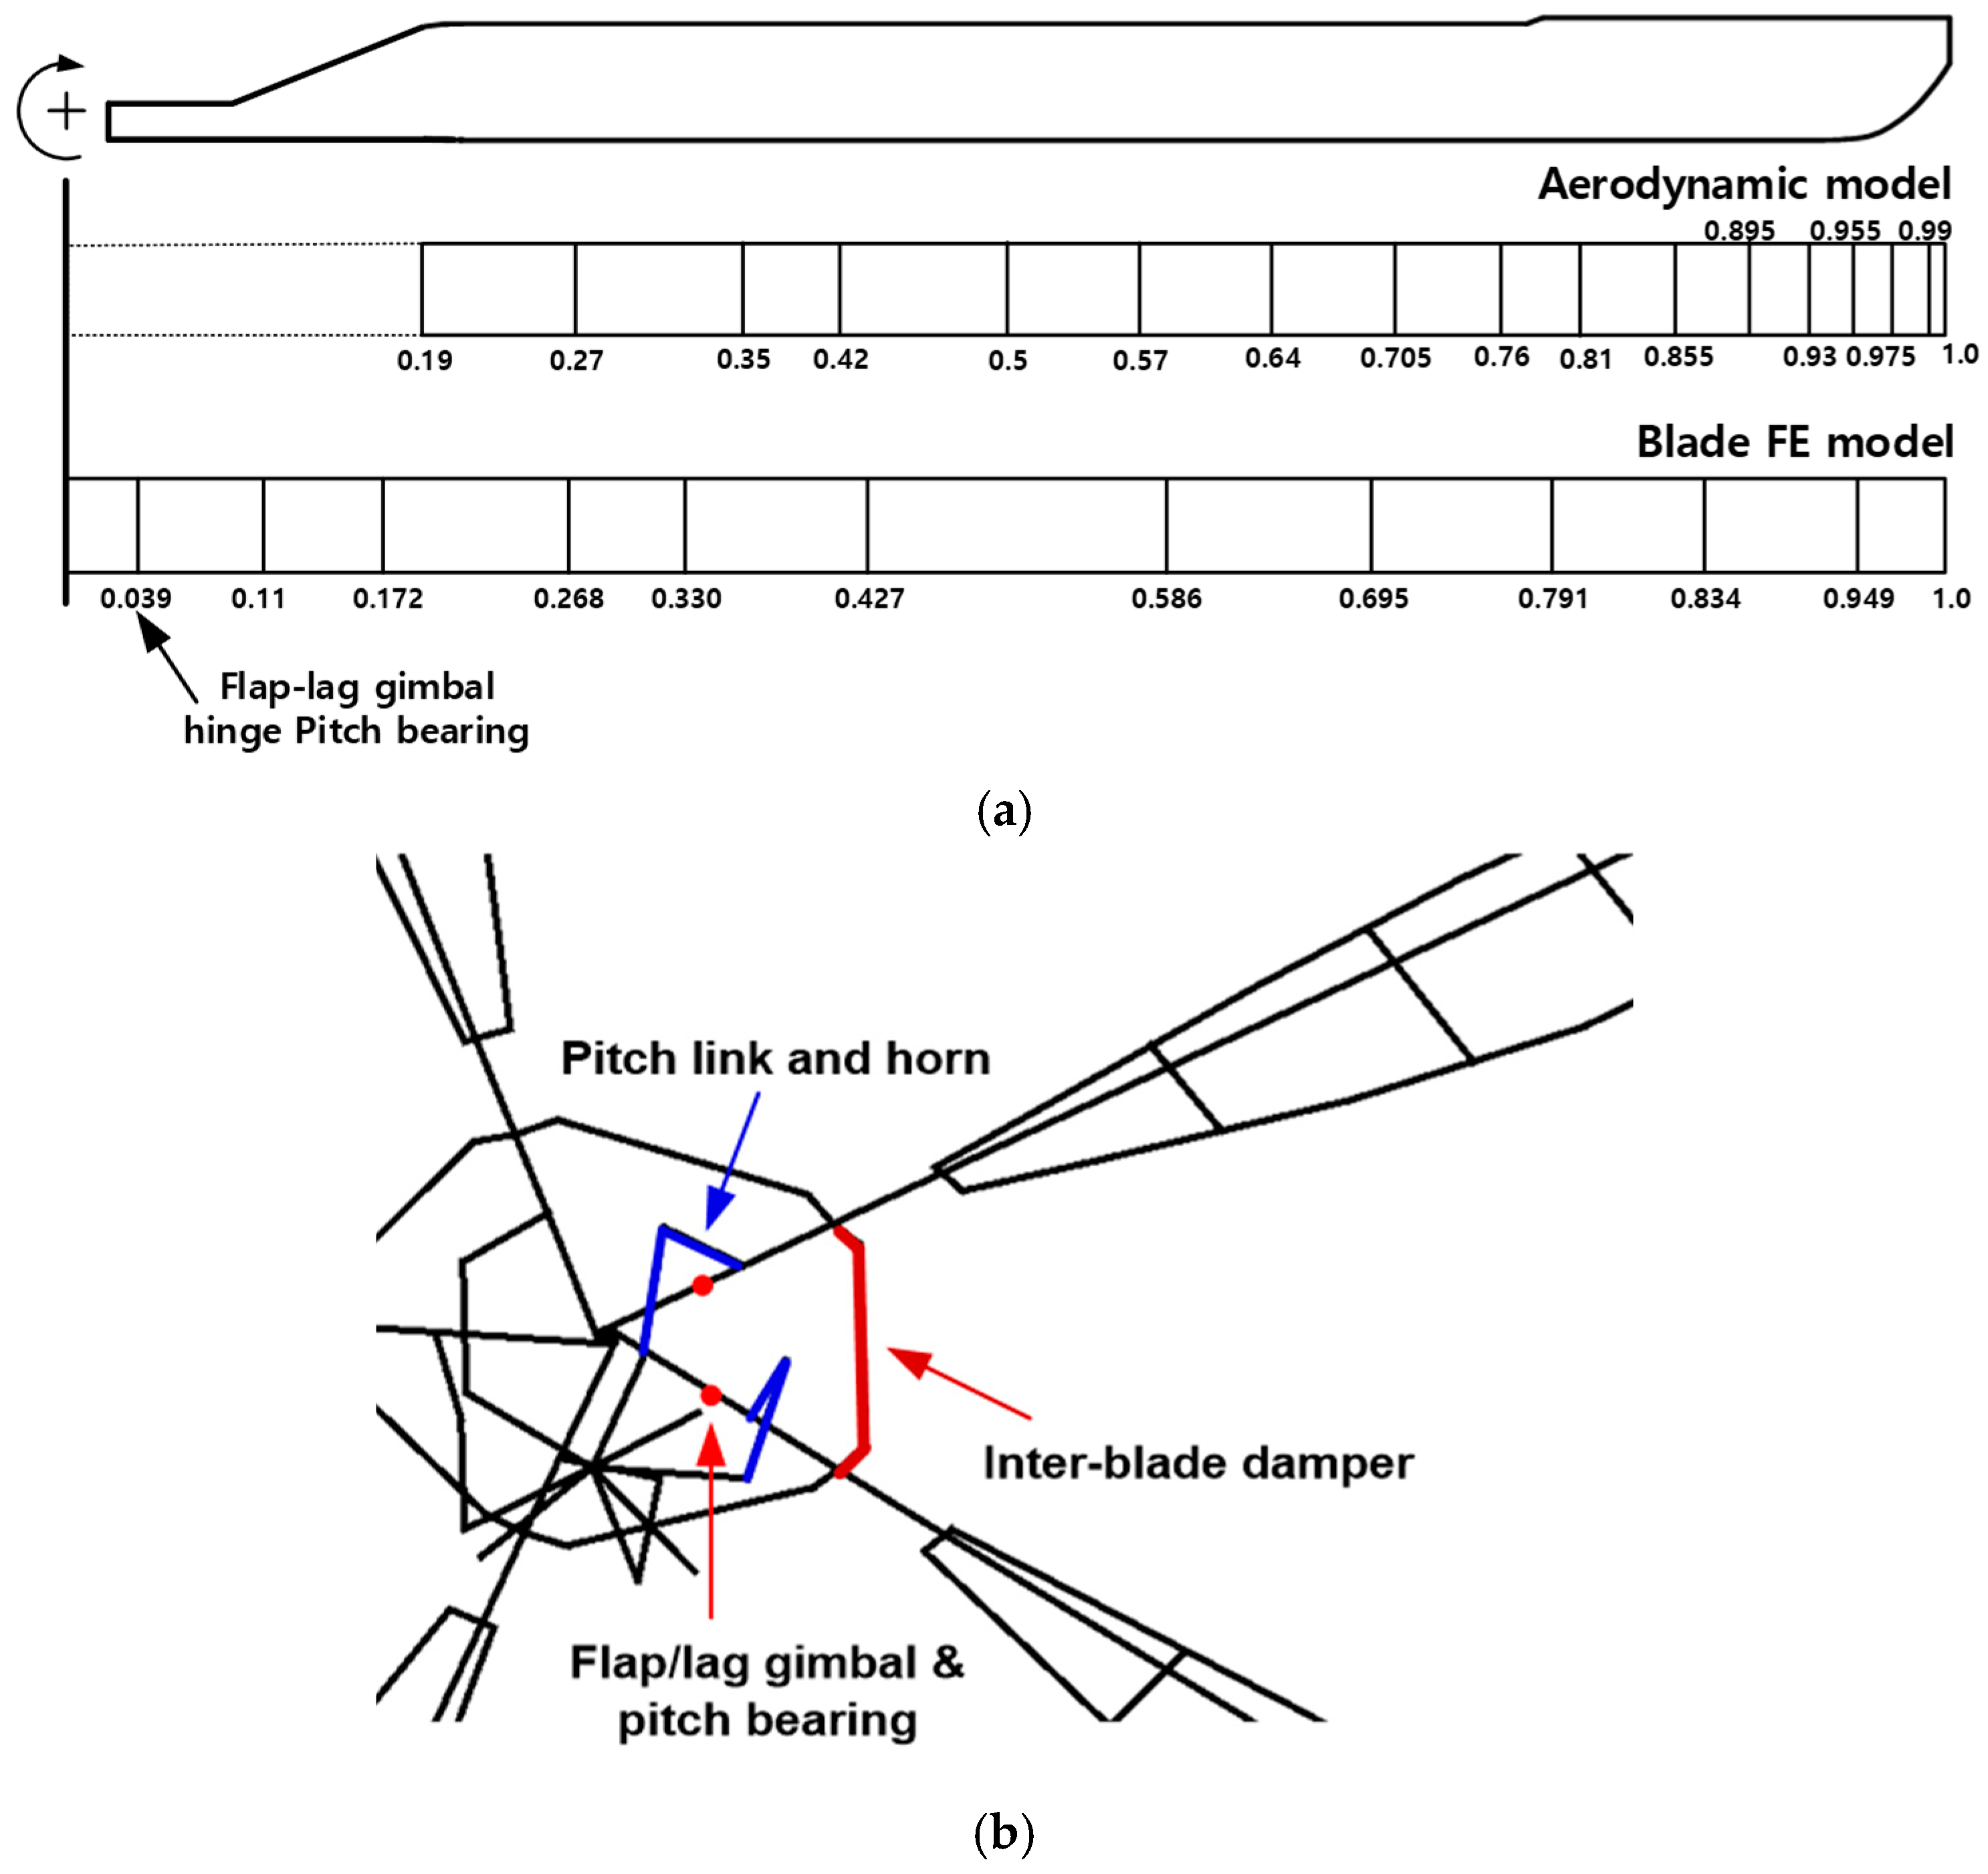
2.1. CSD Model
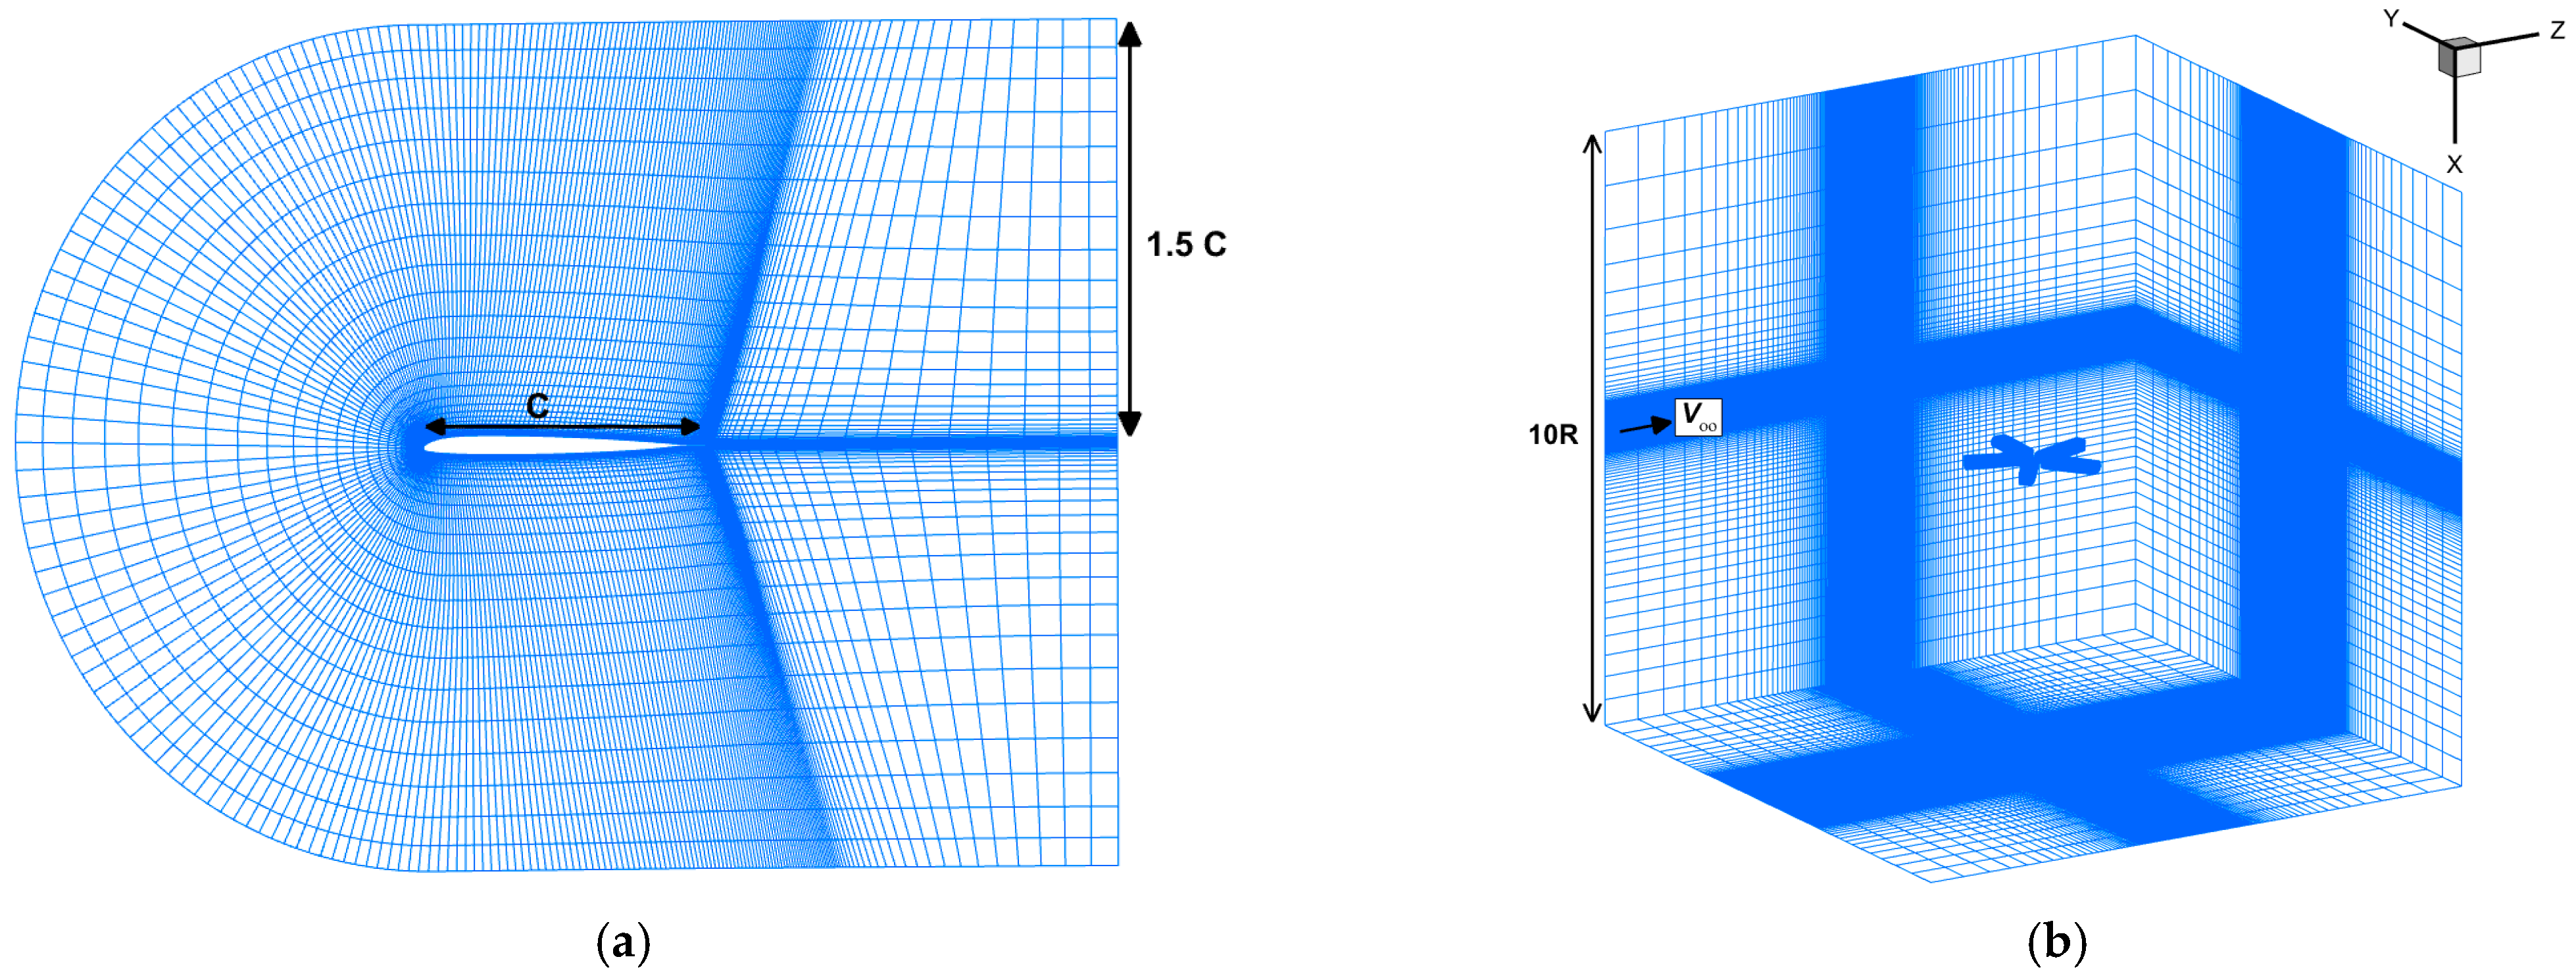
2.2. CFD Model
3. Maneuver Analysis
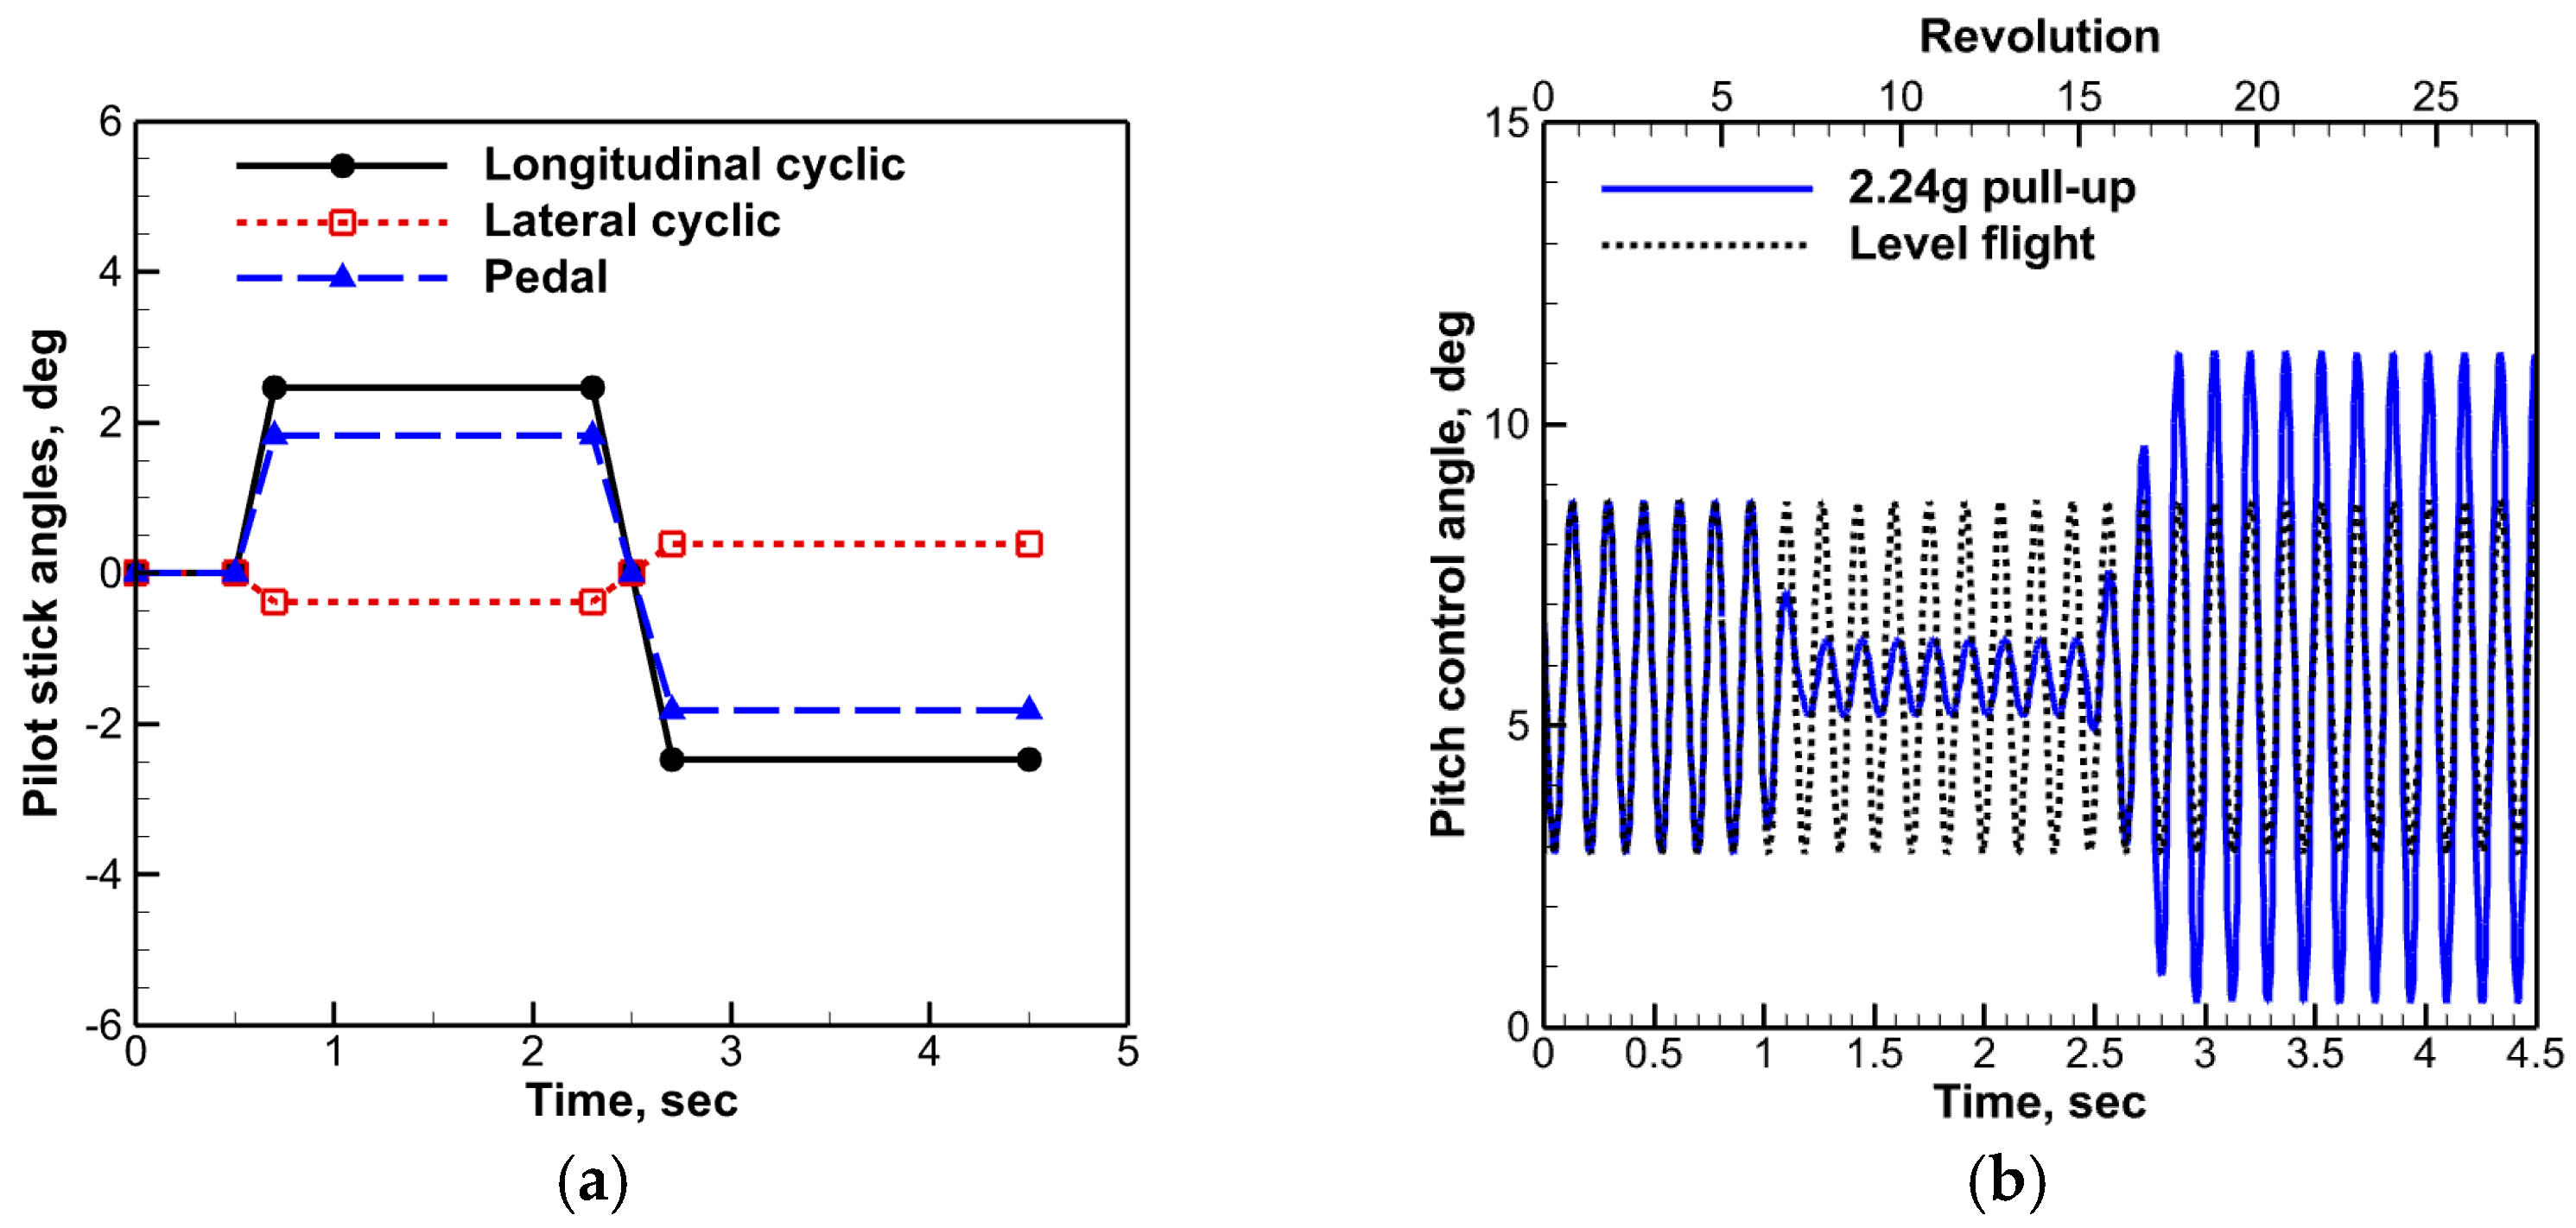
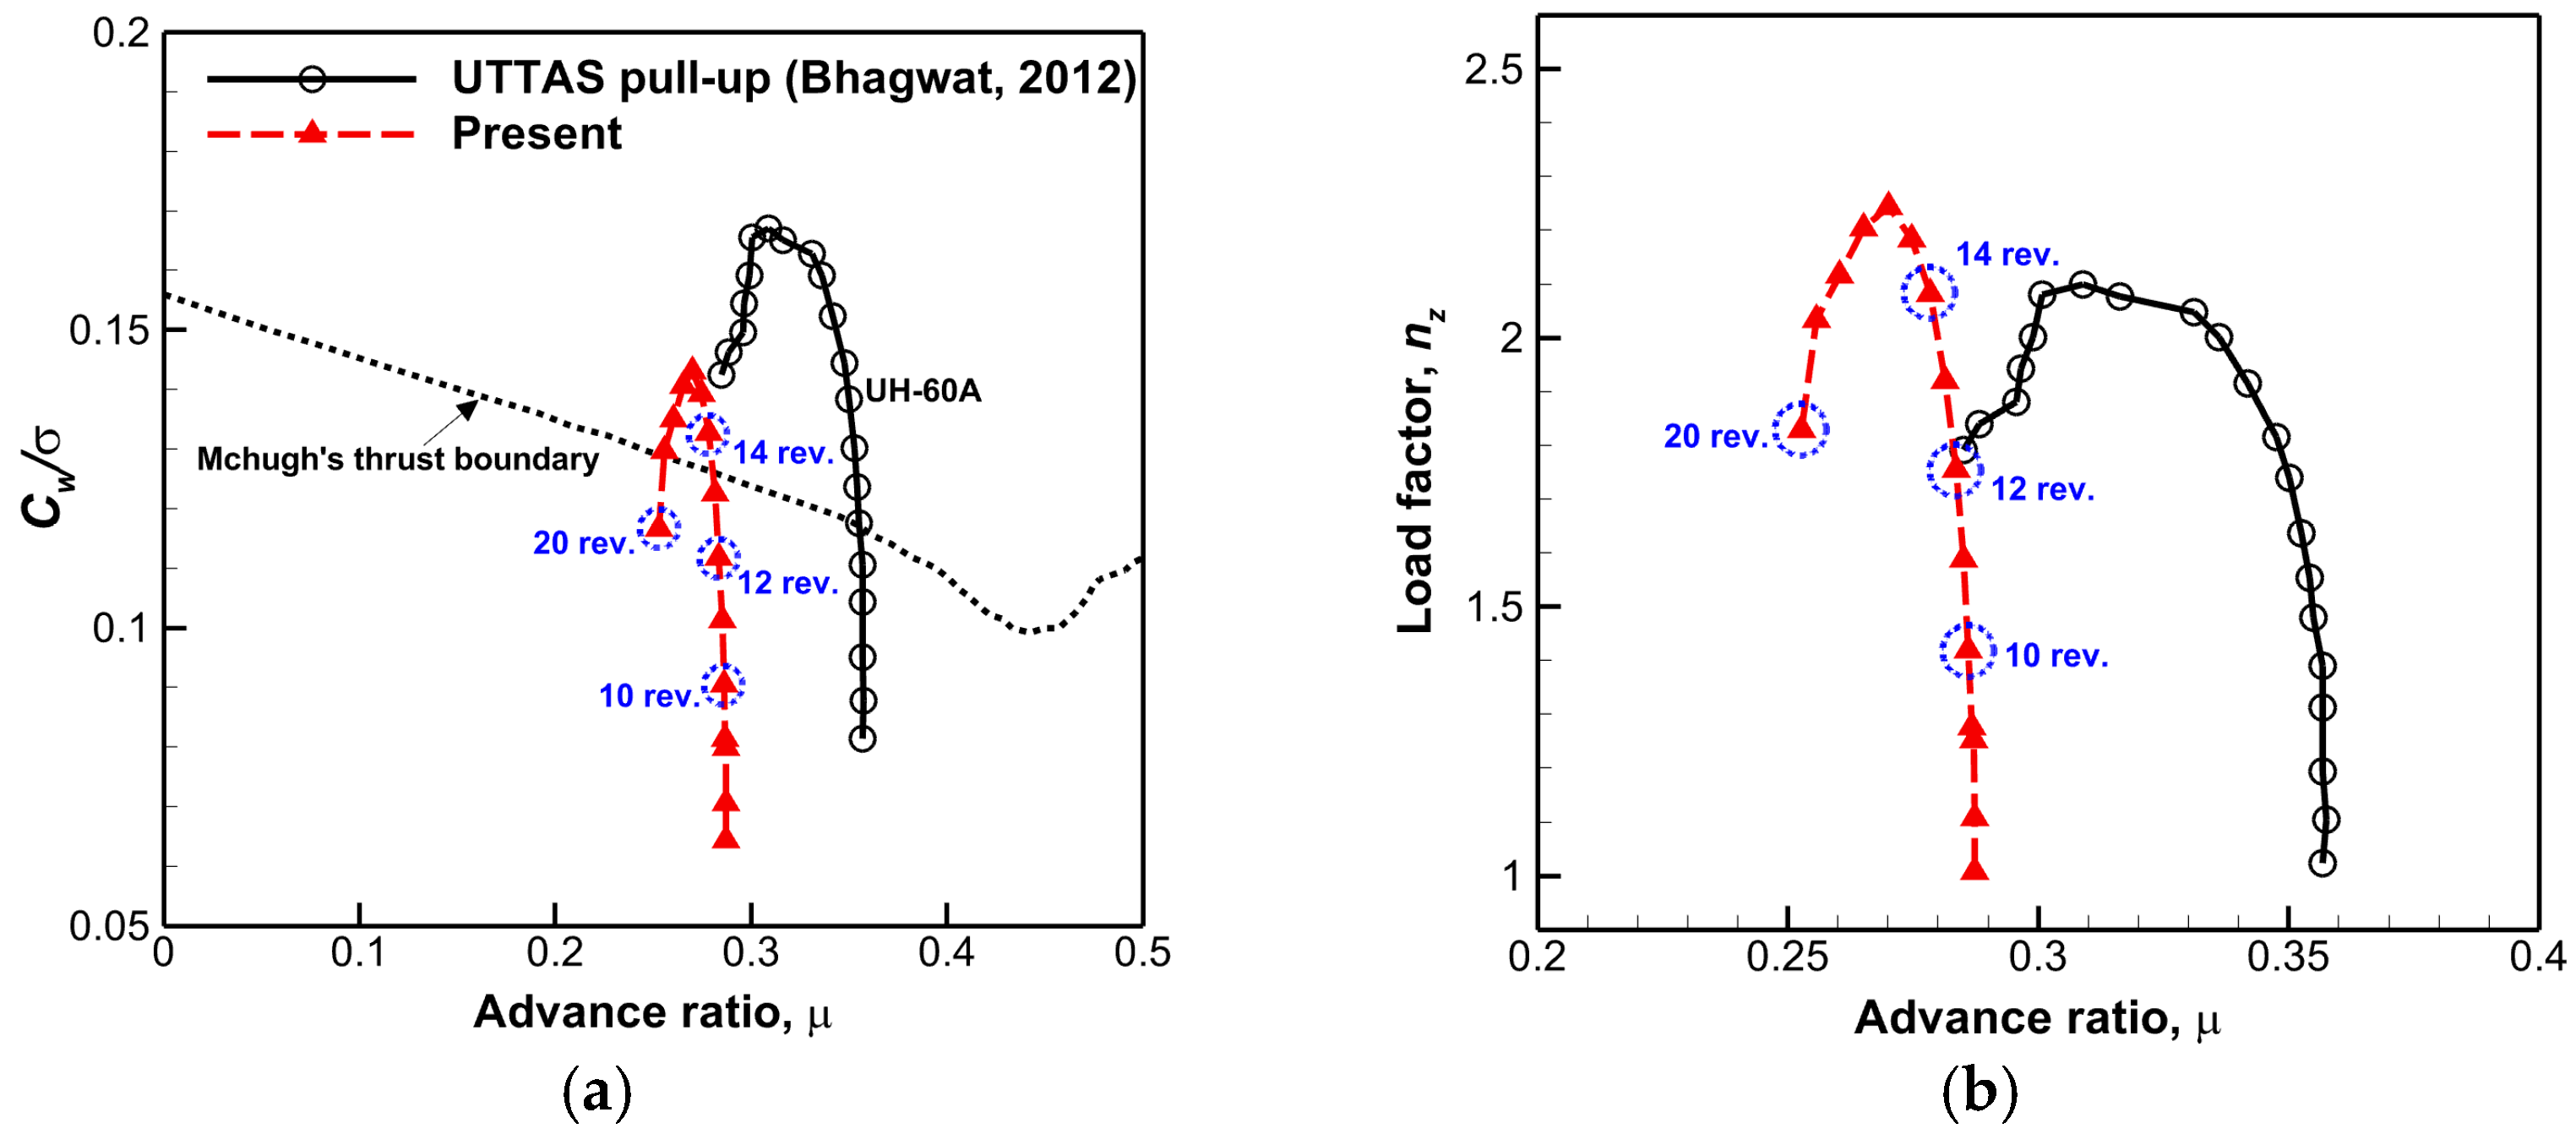
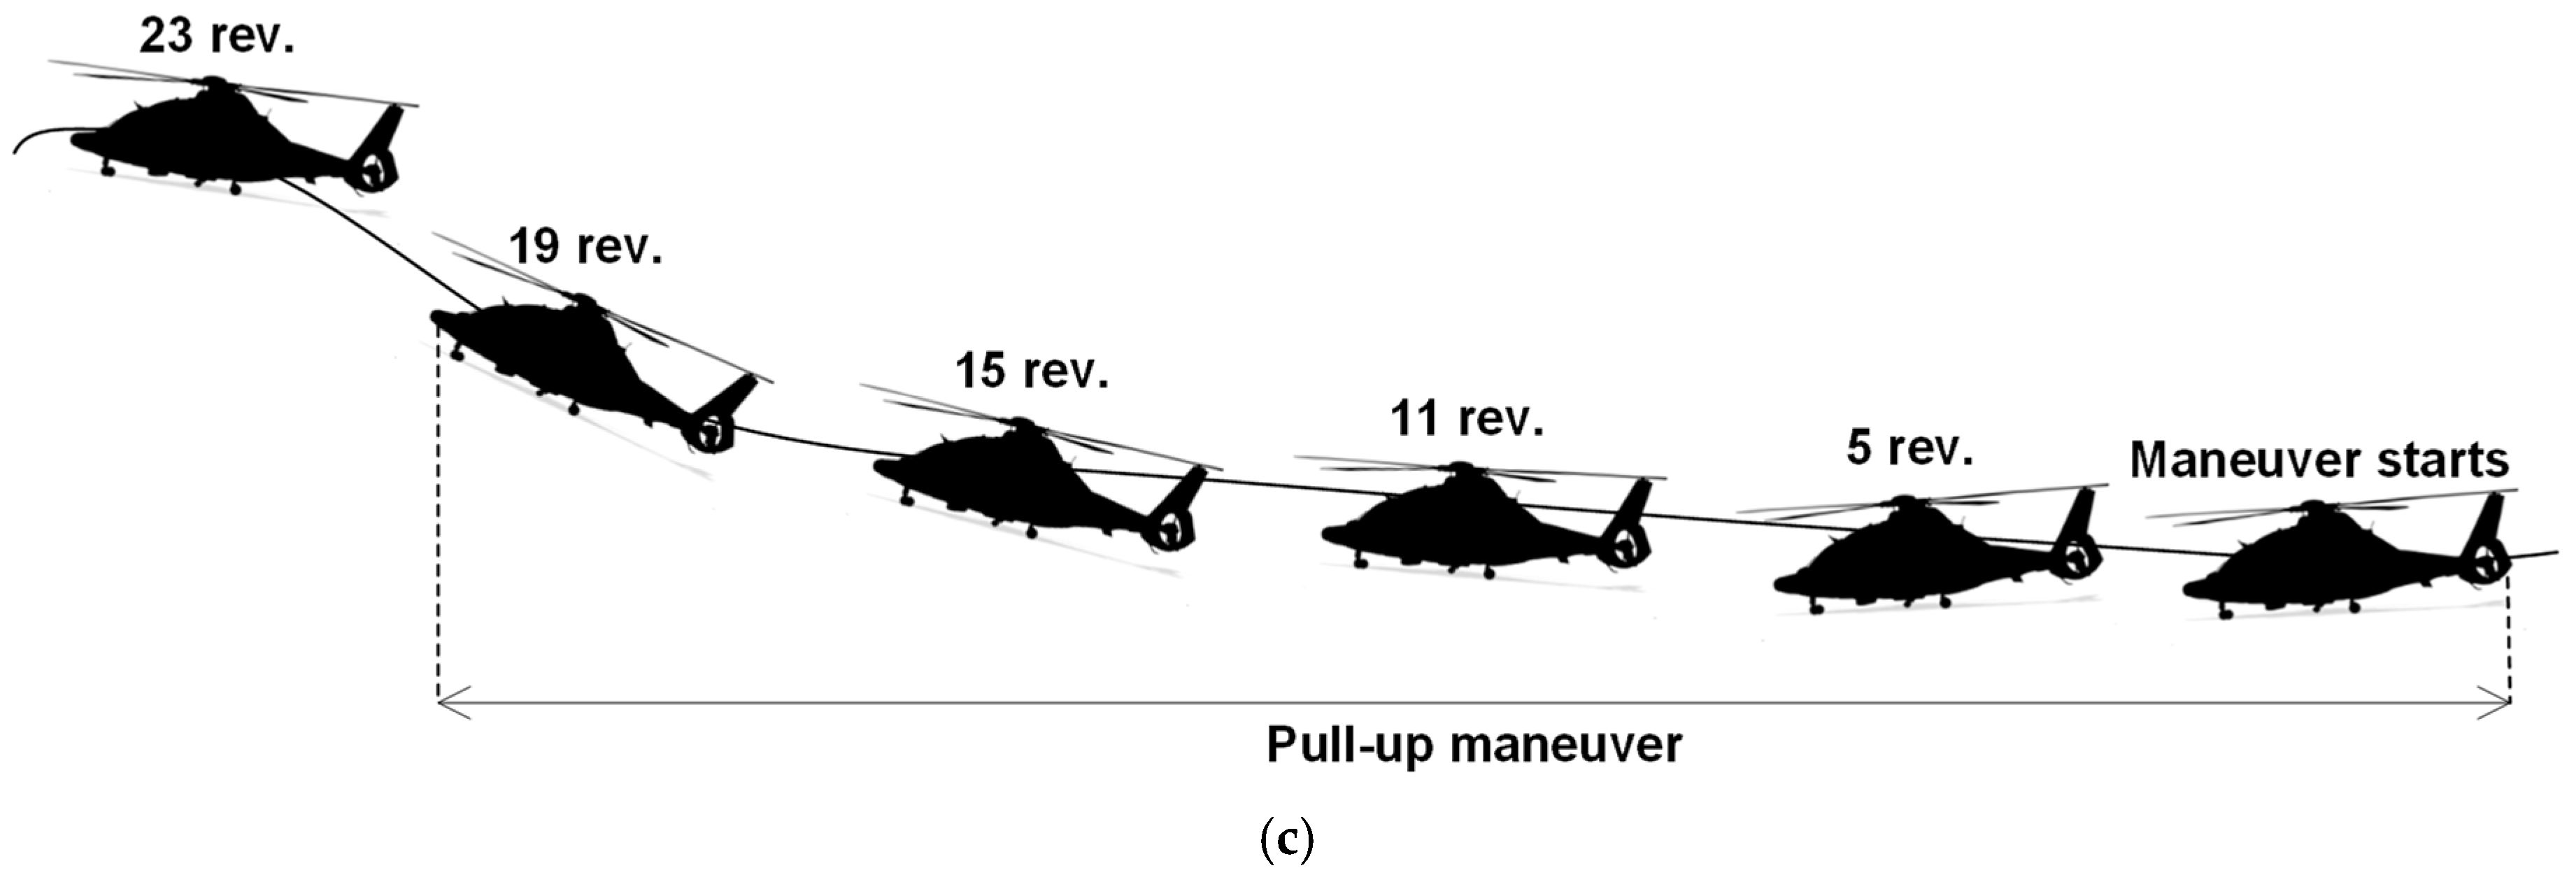
3.1. Pull-Up Maneuver
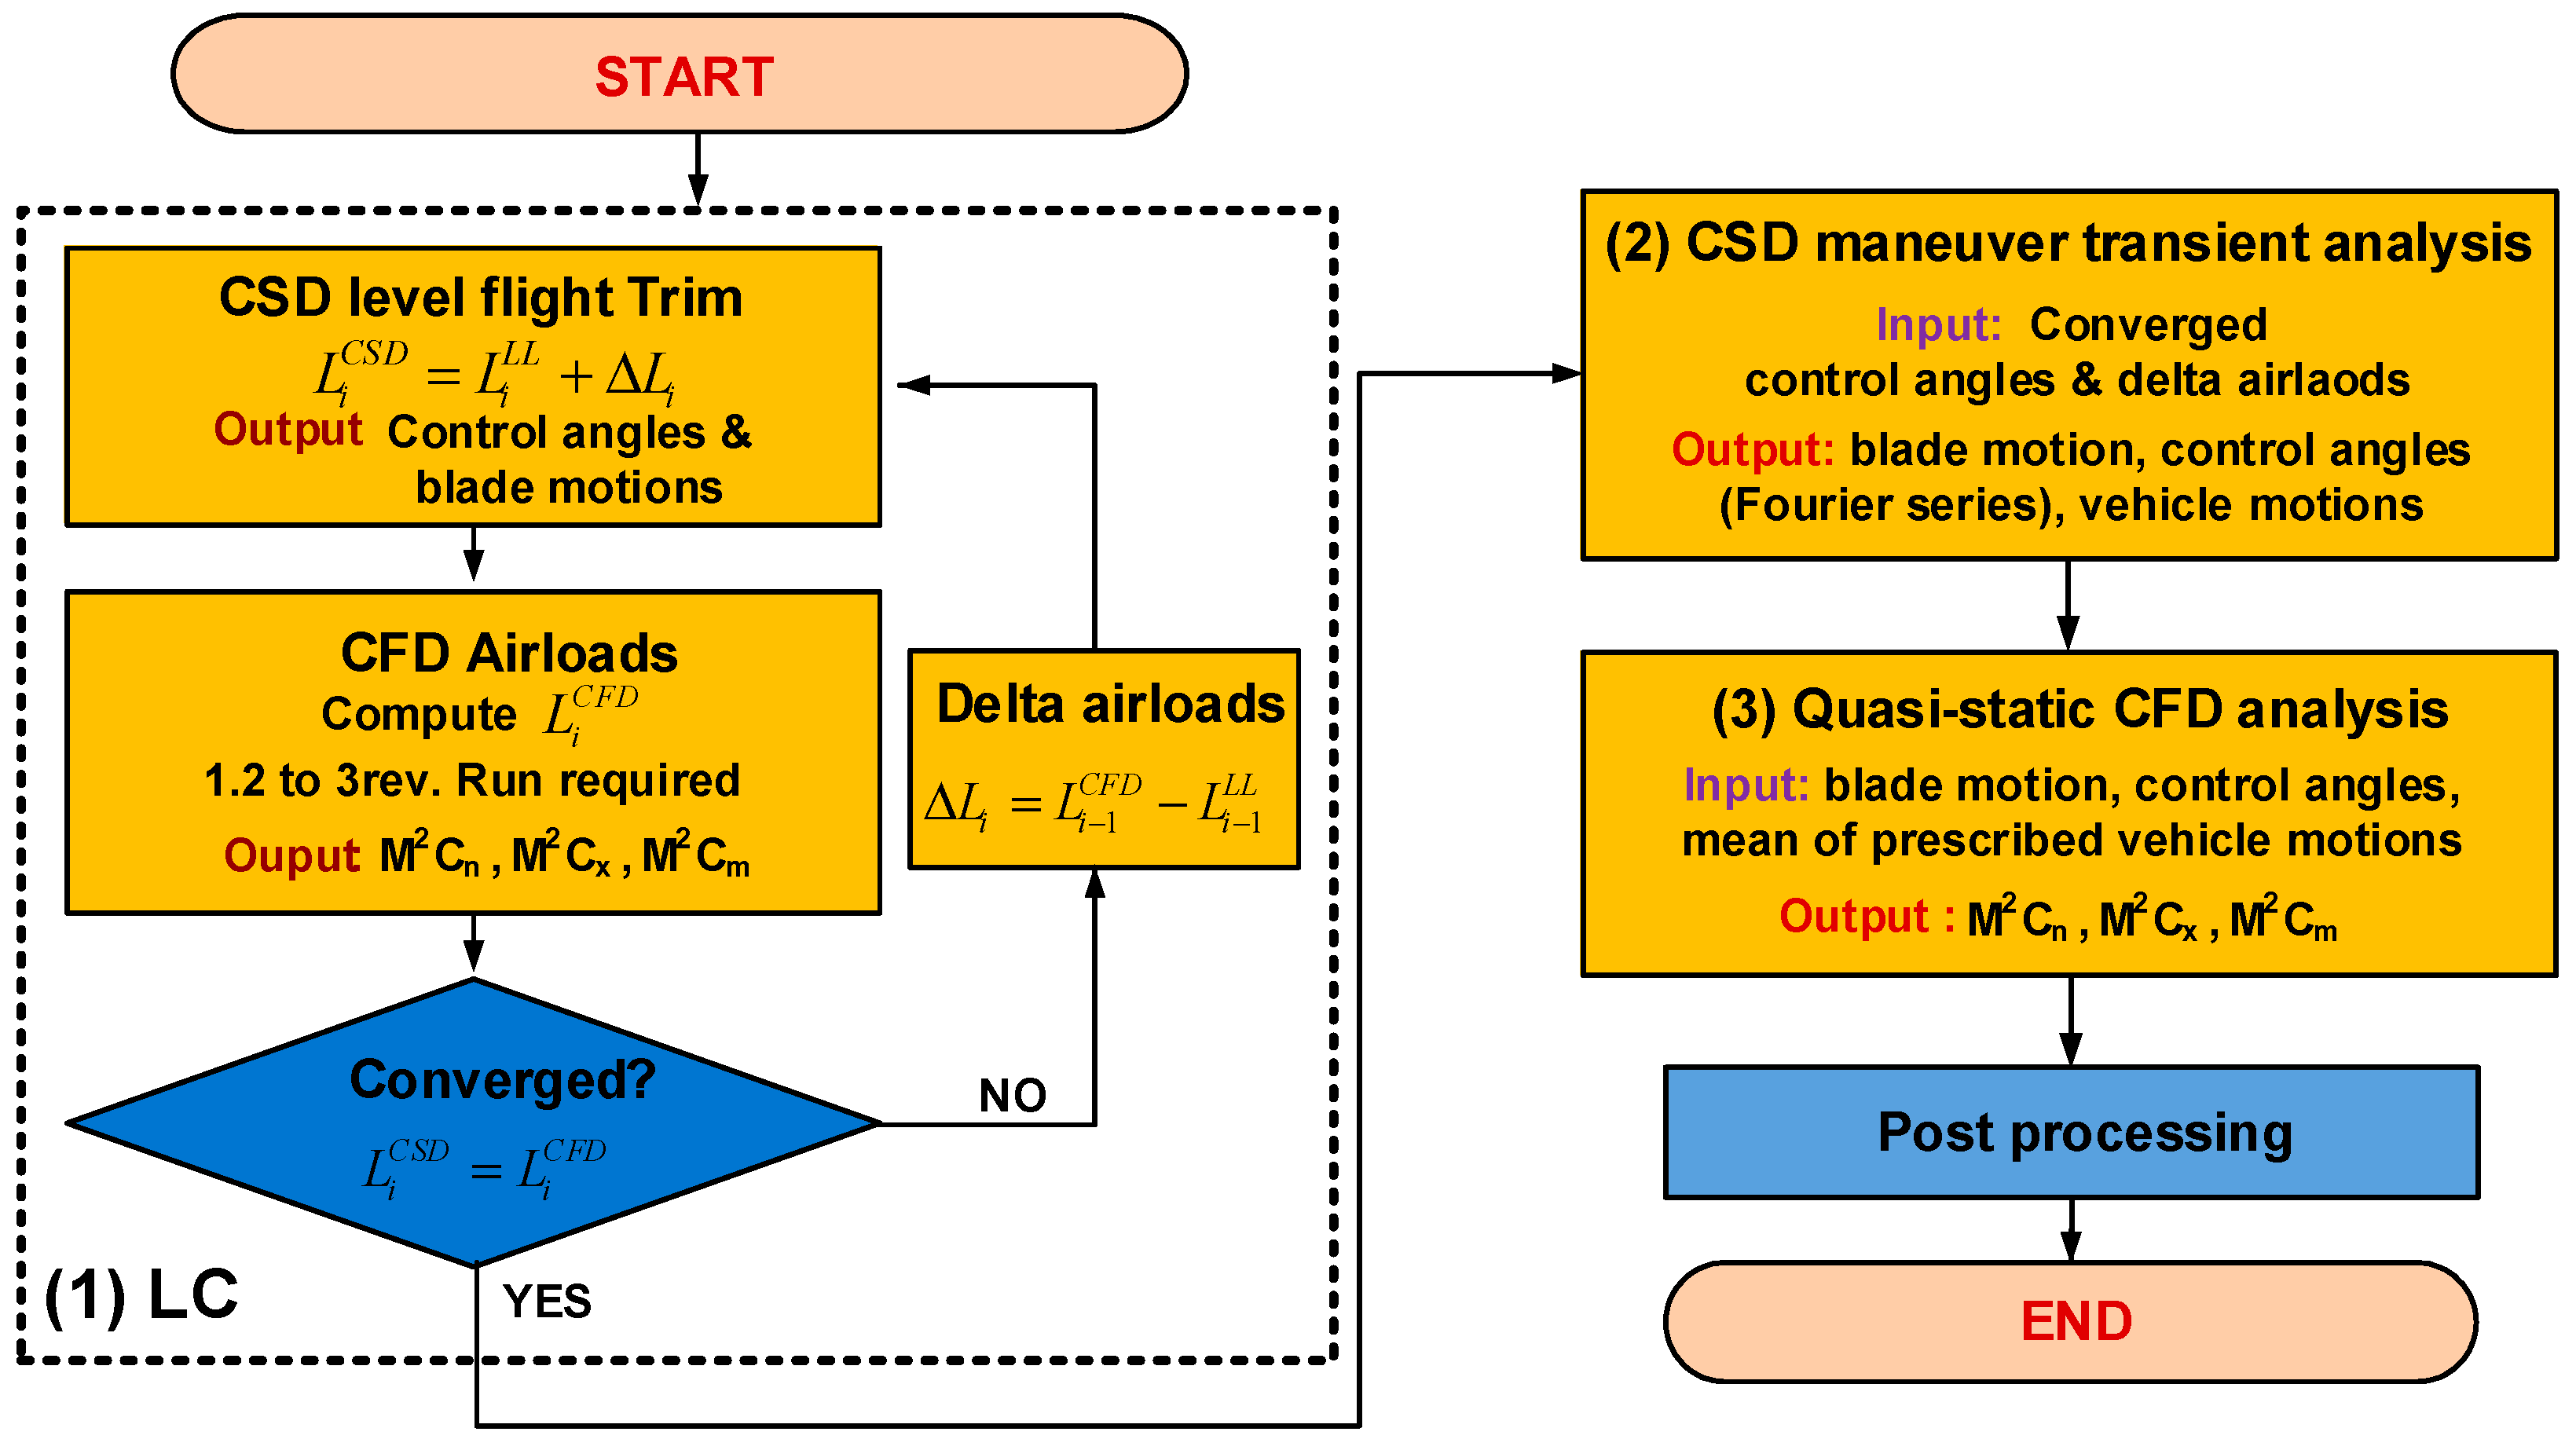
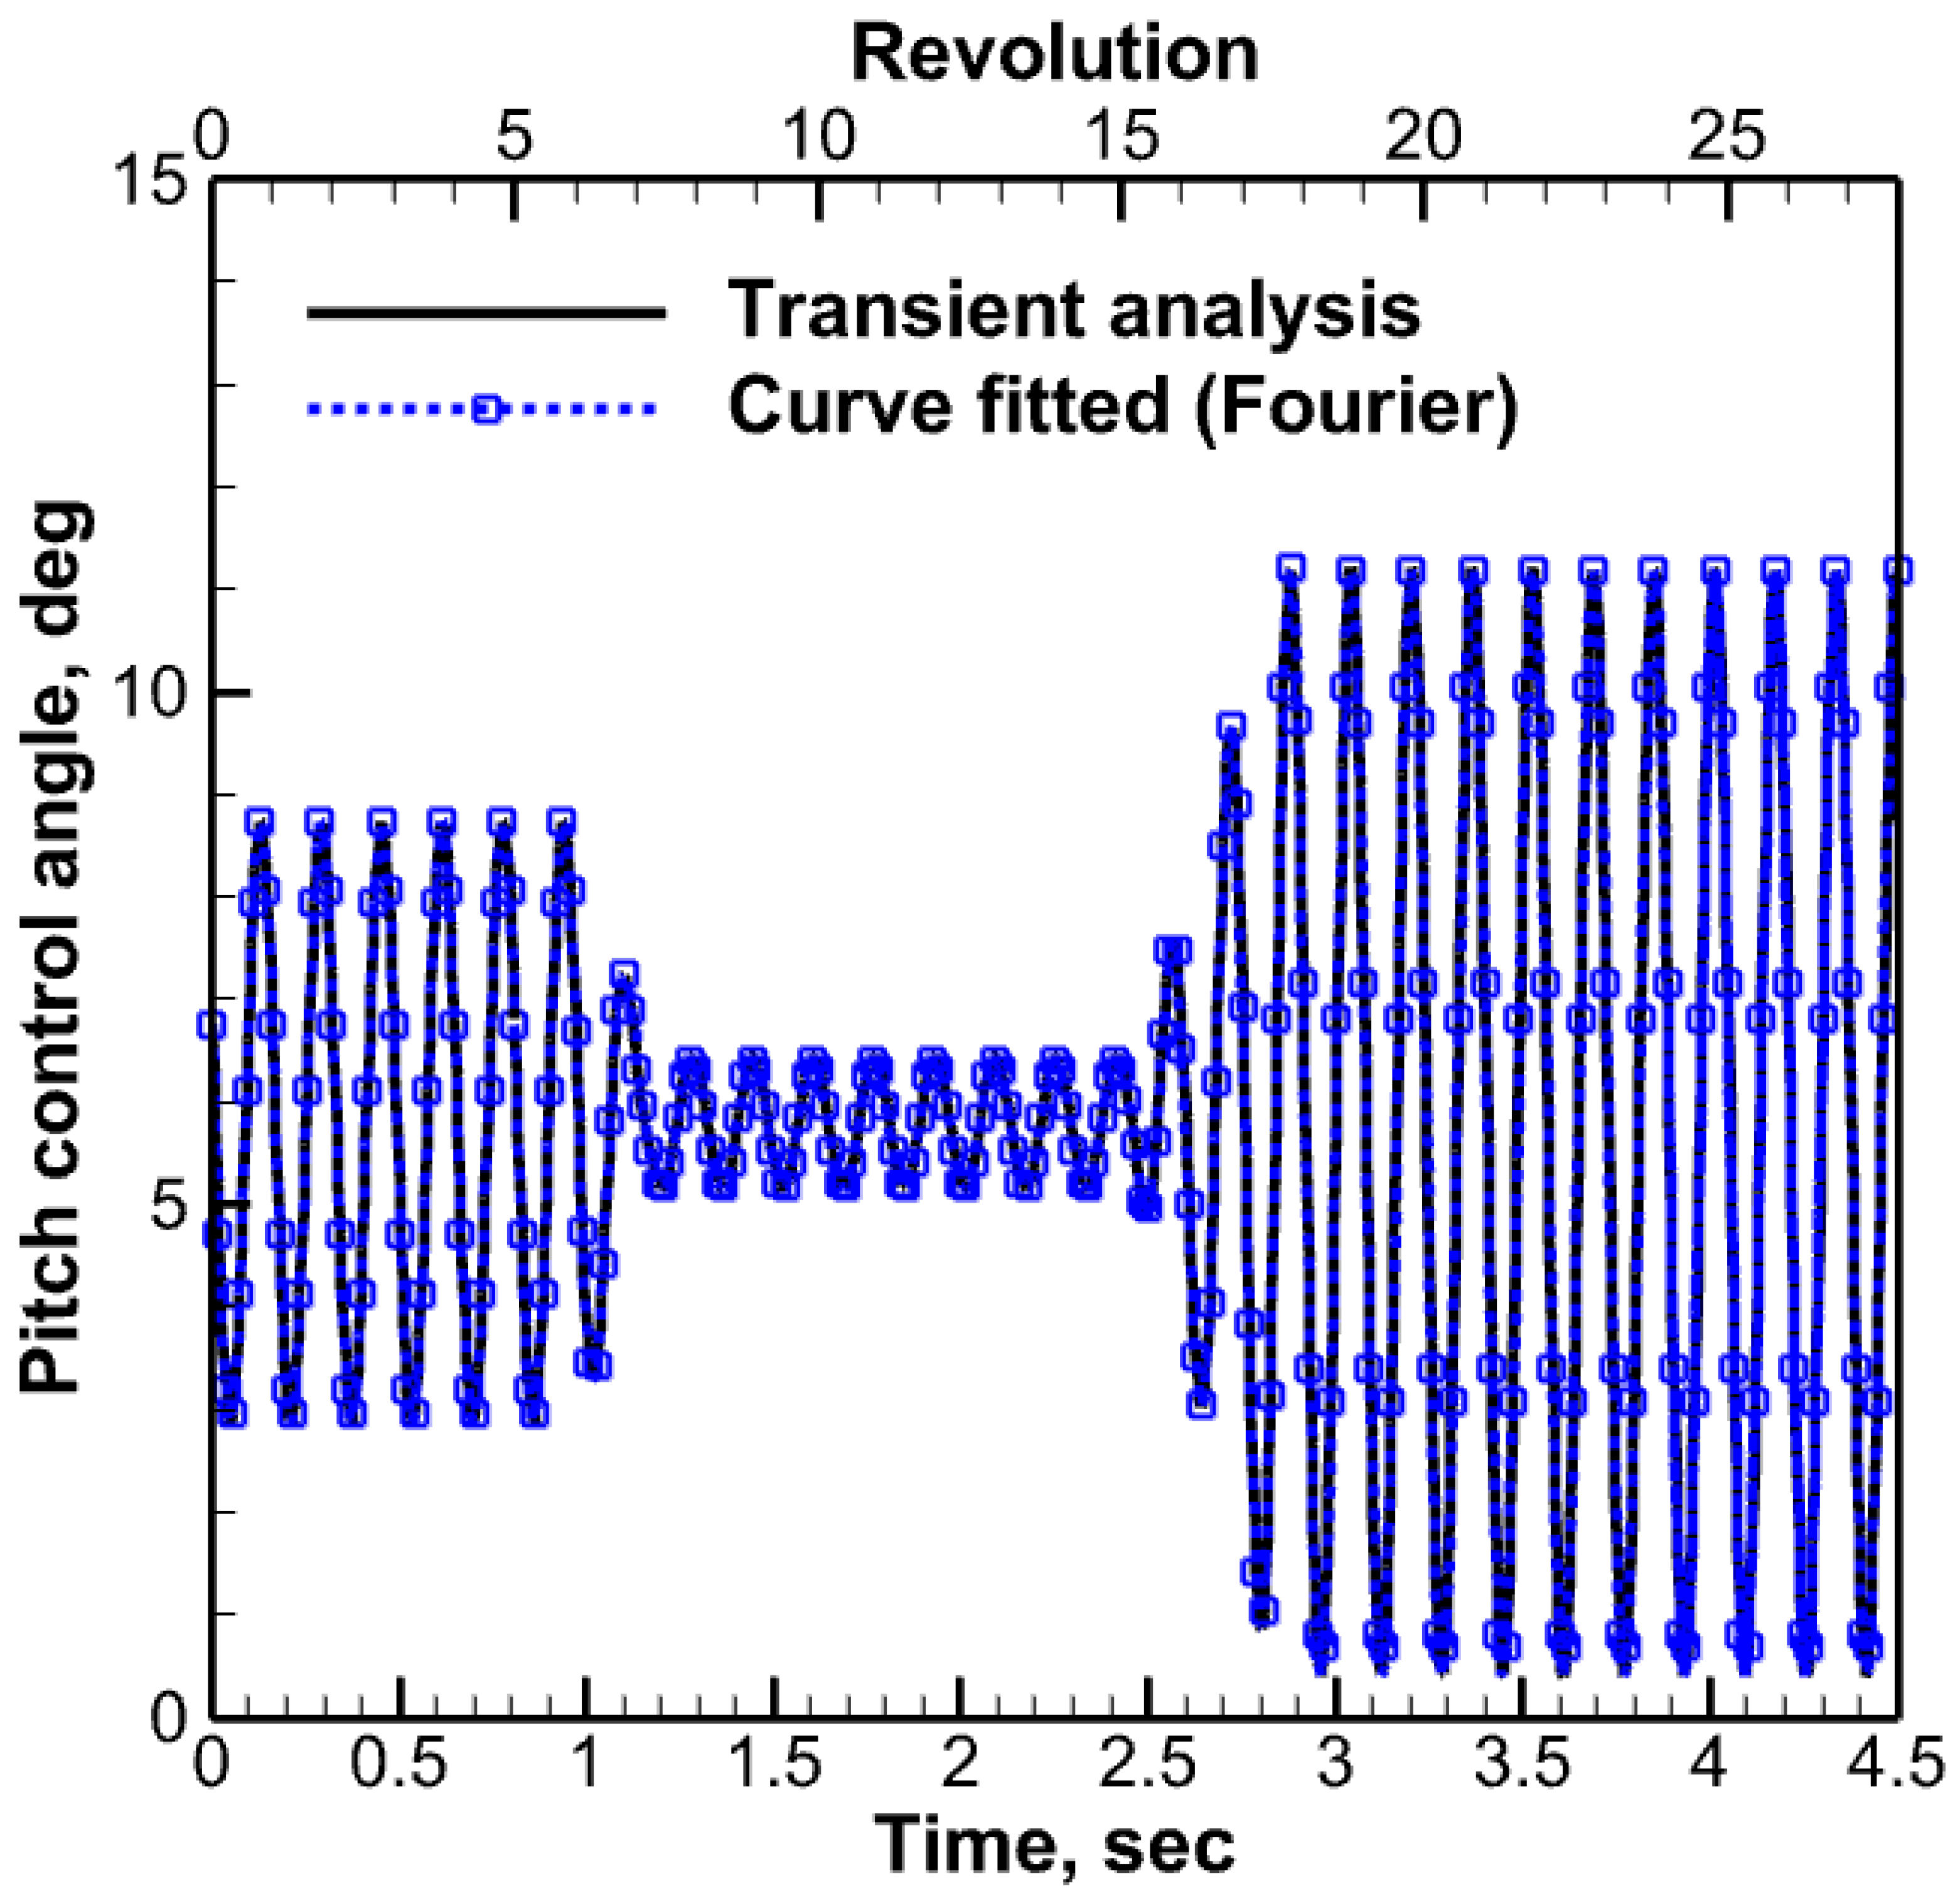
3.2. Maneuver Analysis Methodology
4. Results and Discussion
4.1. CFD QS Analysis
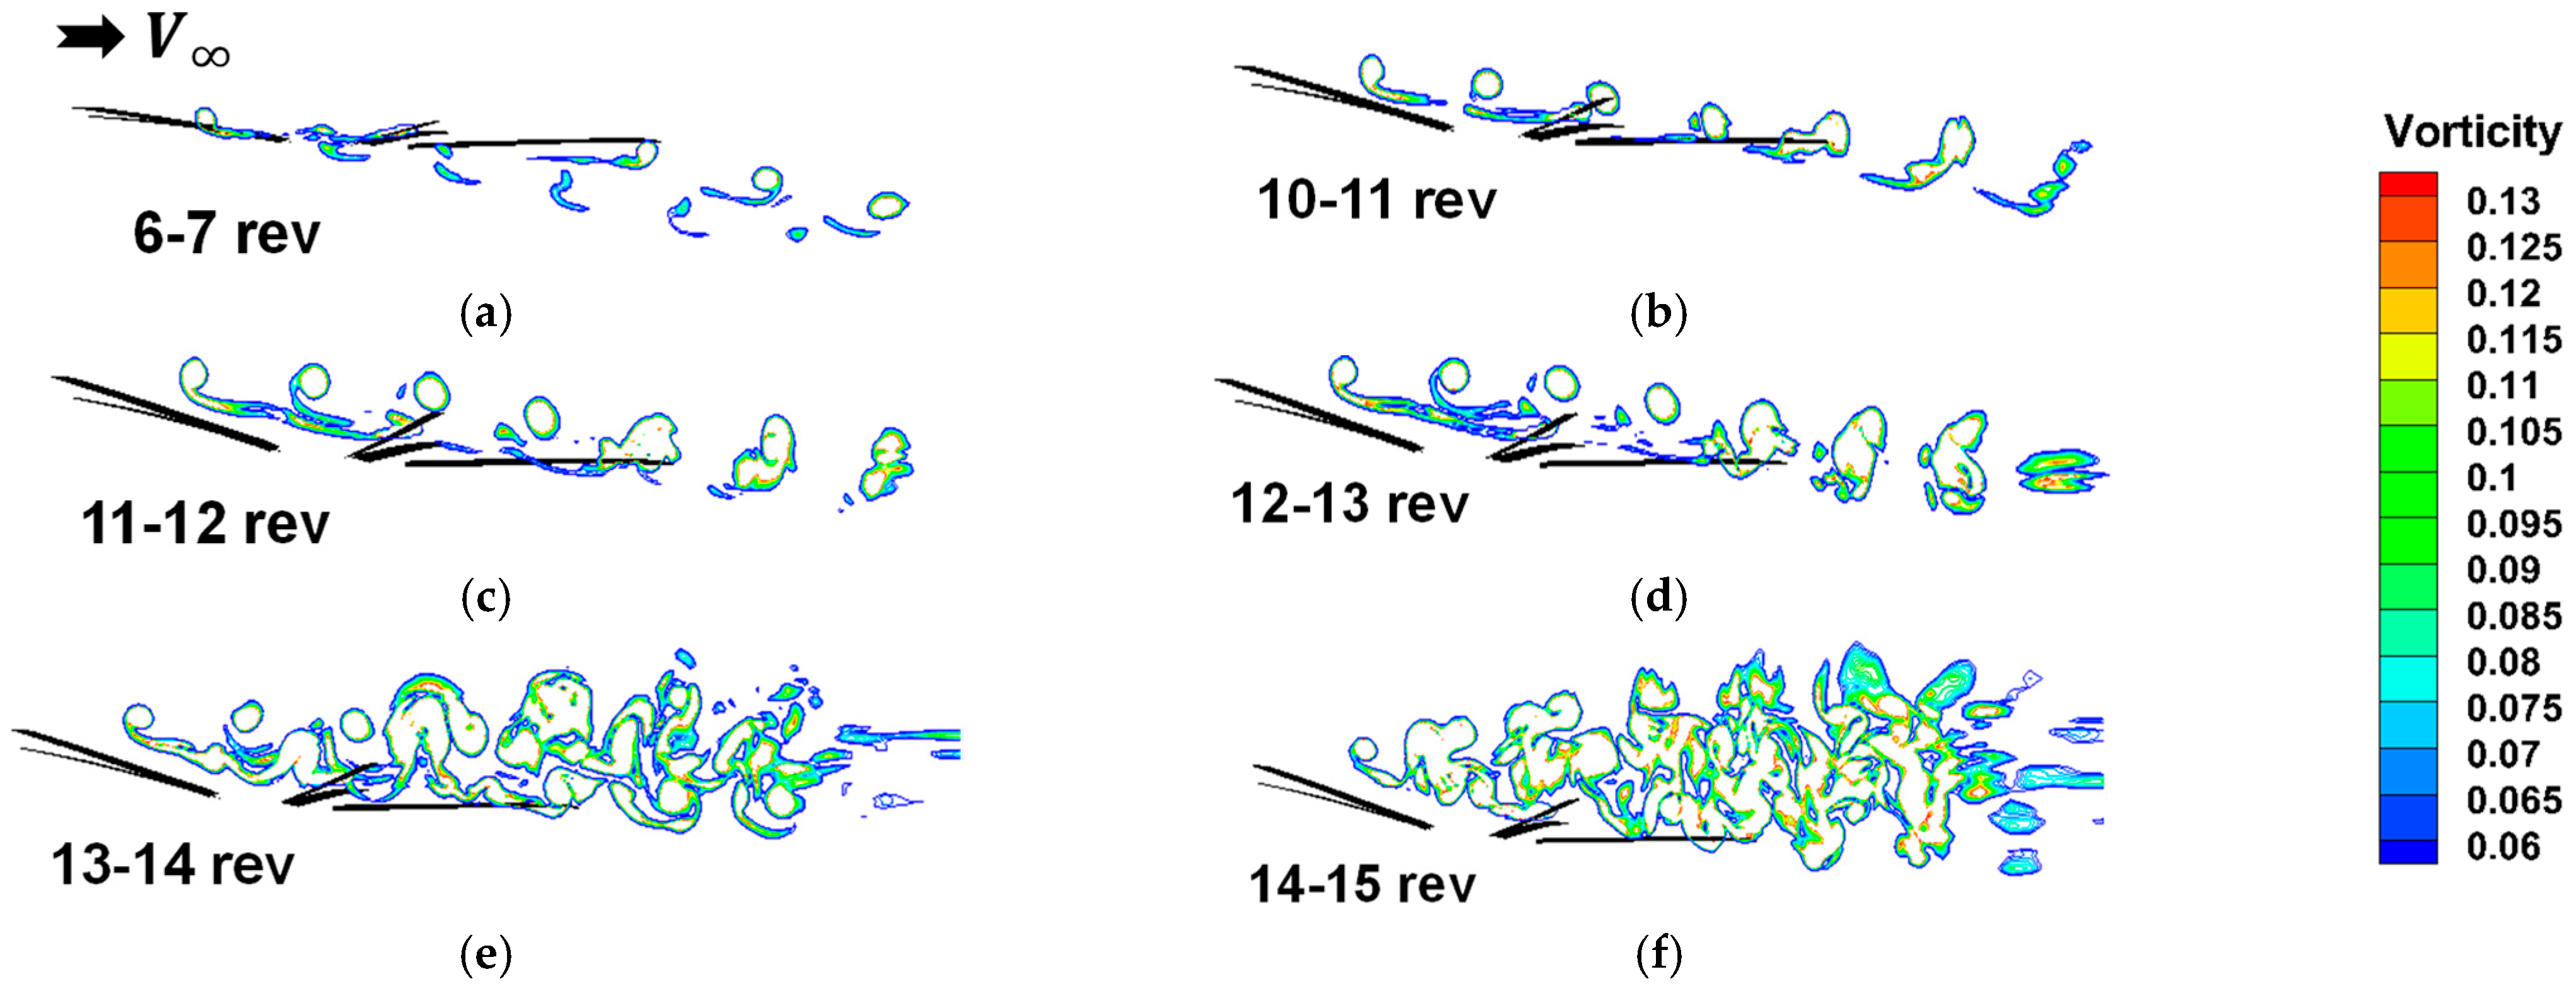
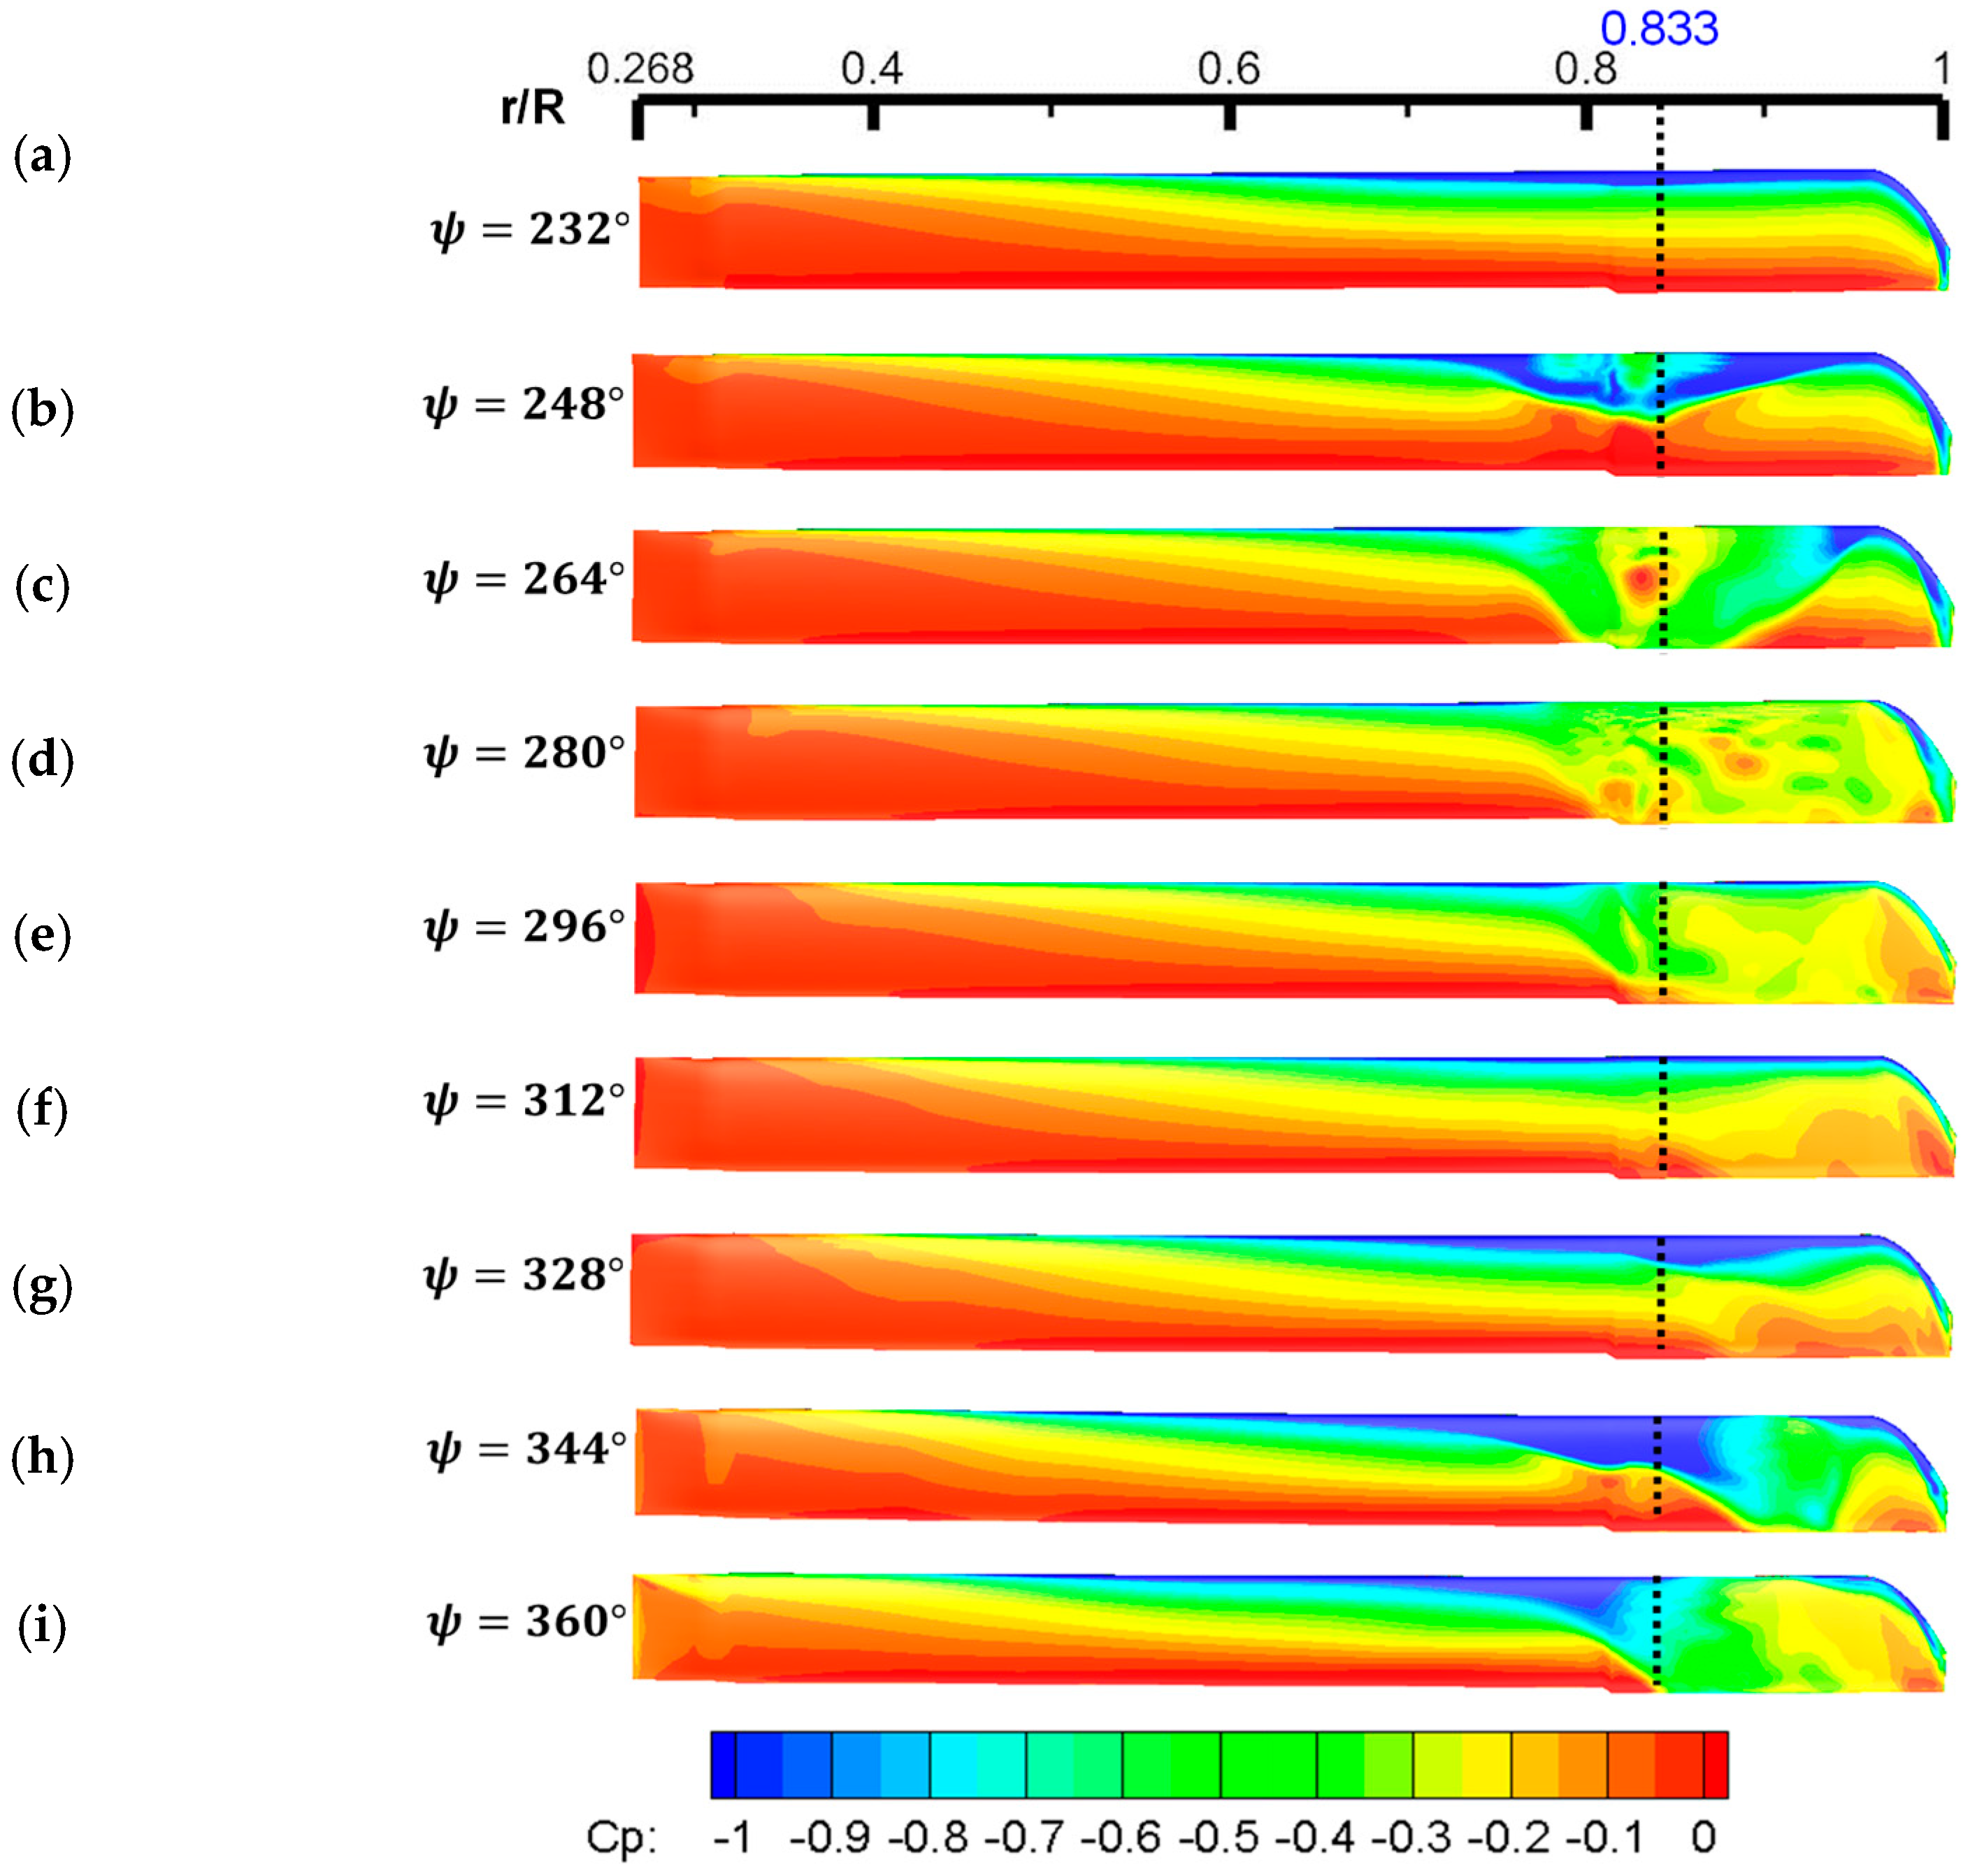
4.2. Vortex Trajectories and Pressure Distributions
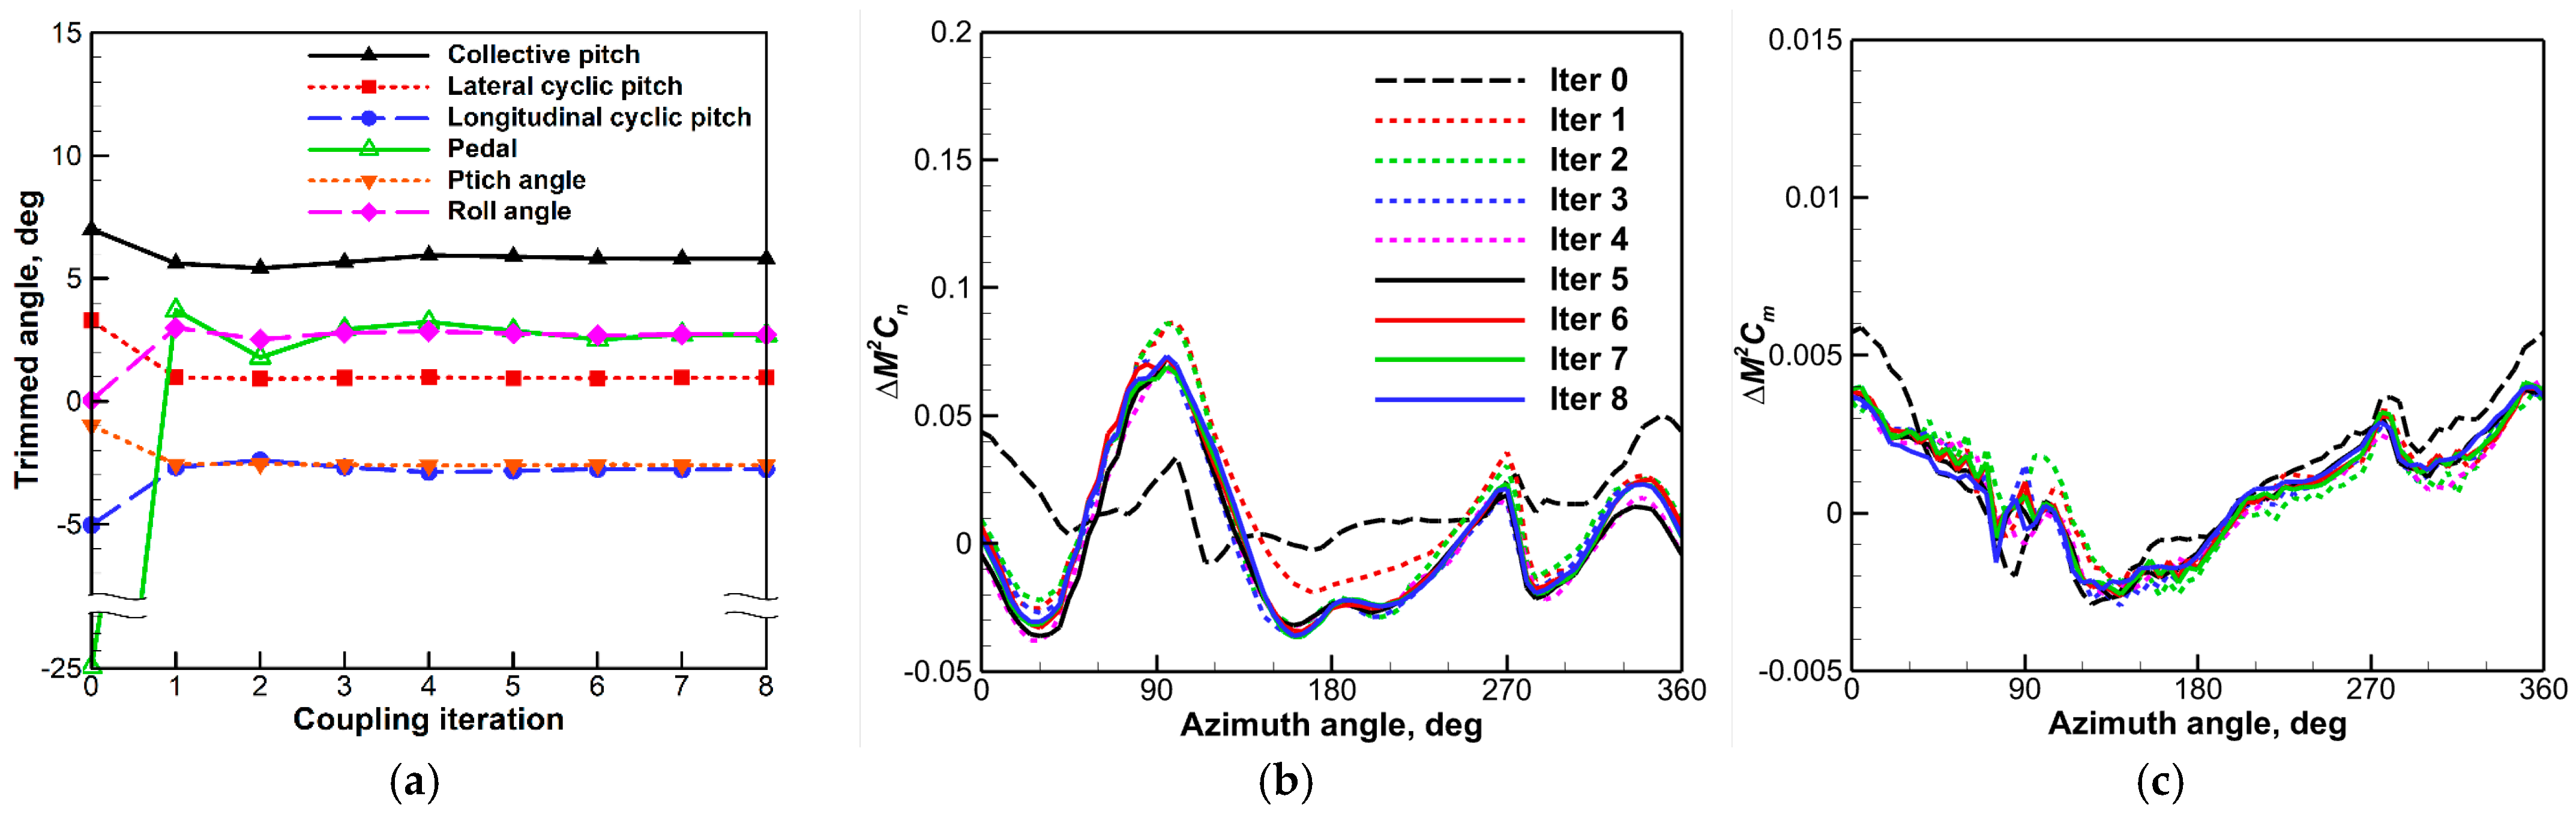
4.3. CFD/CSD LC Approach
5. Conclusions
- (1)
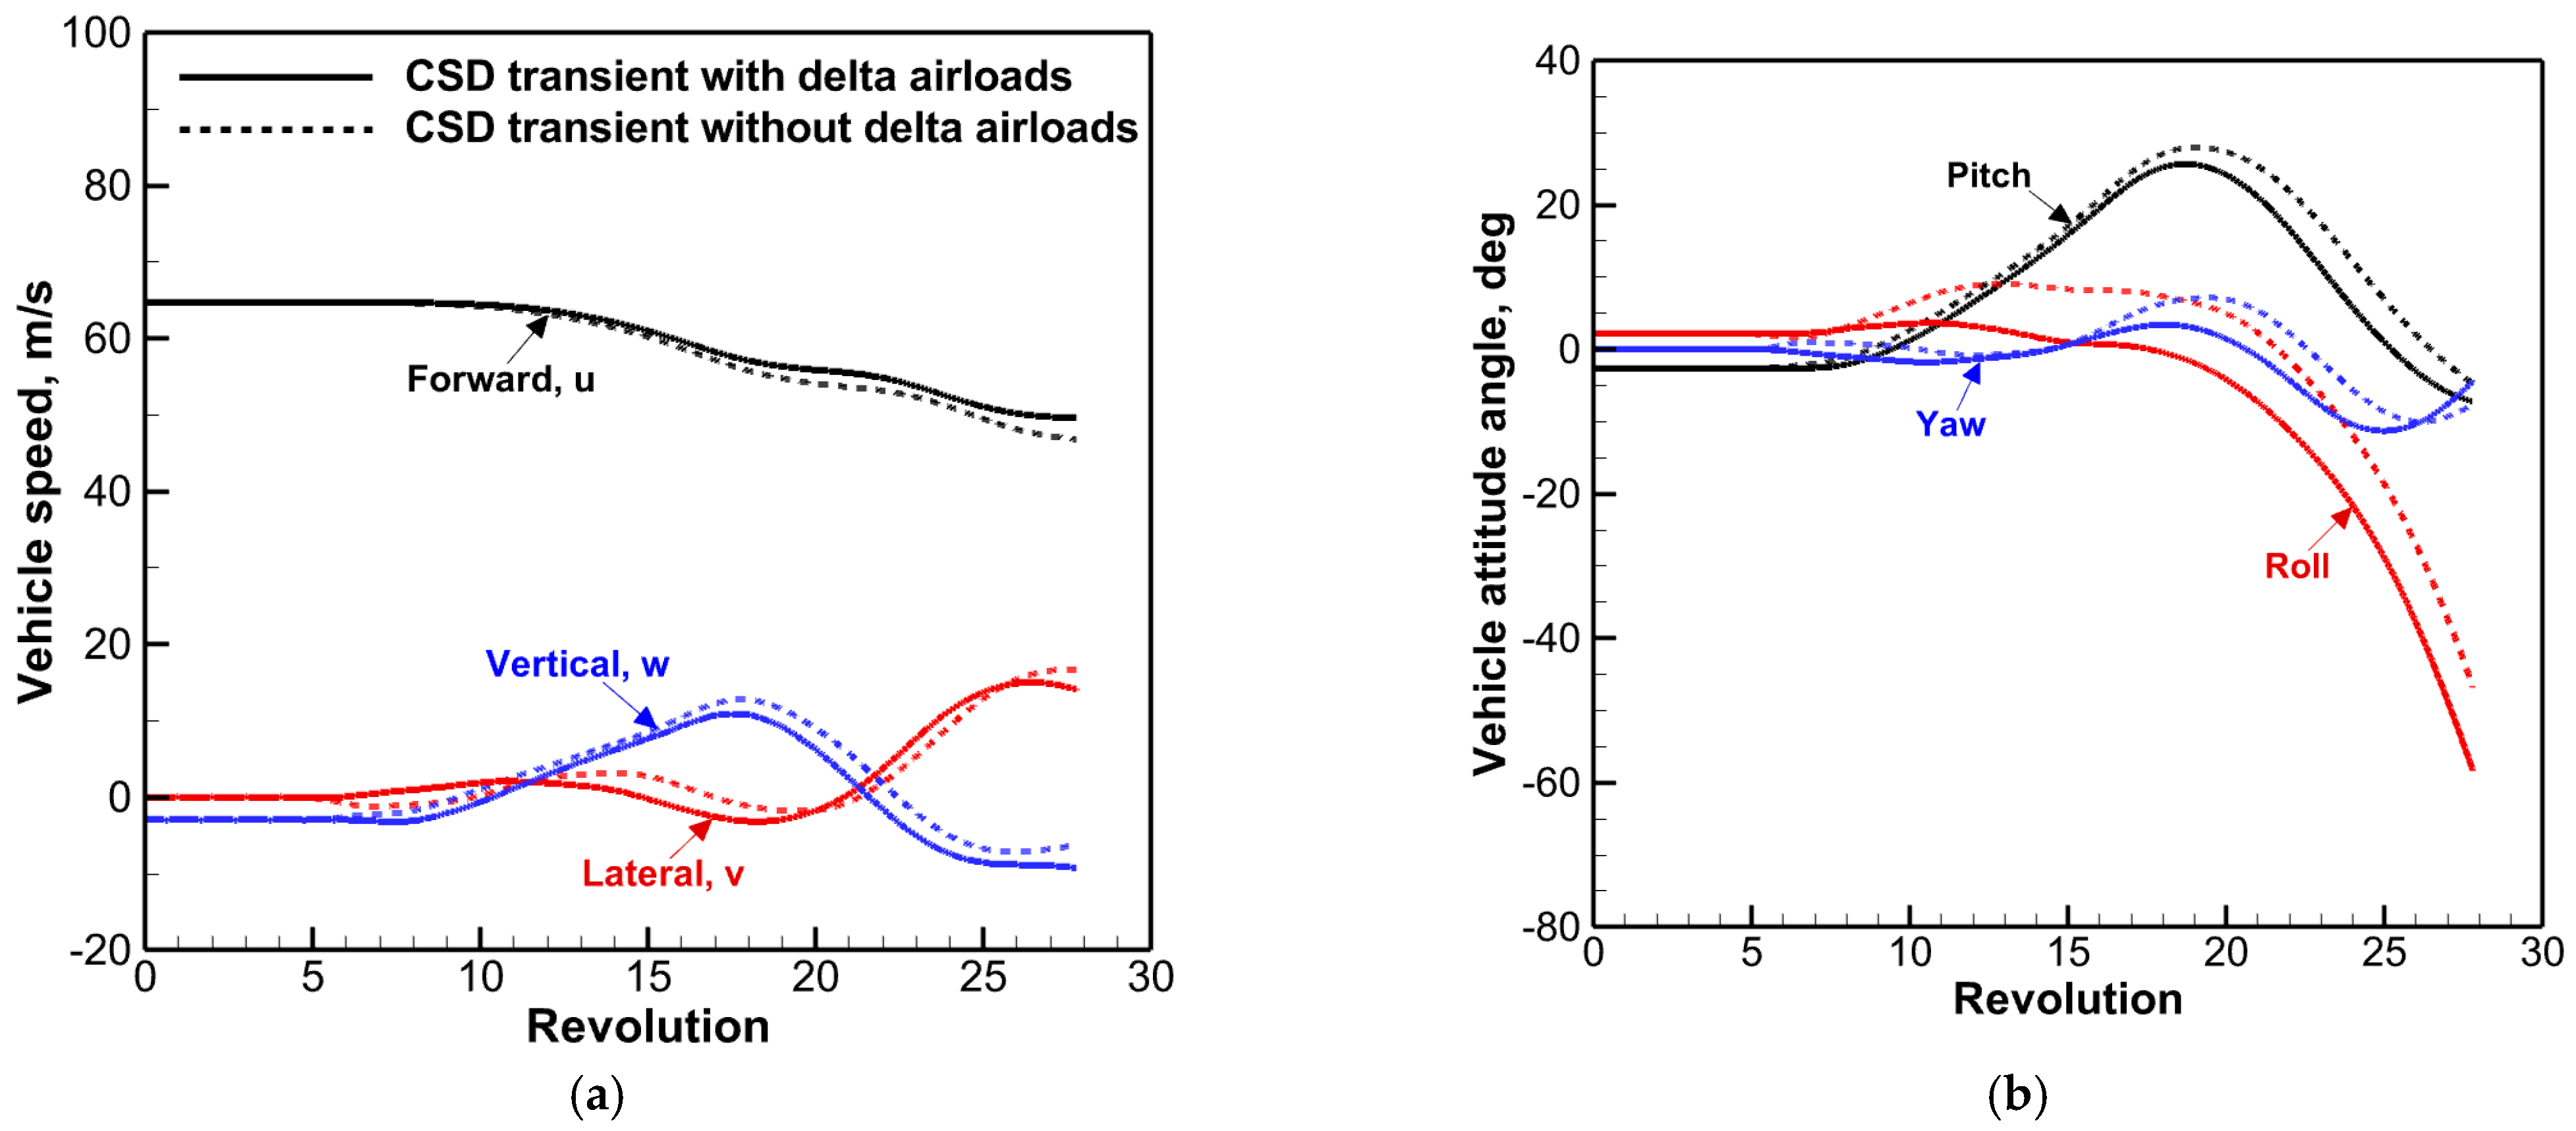
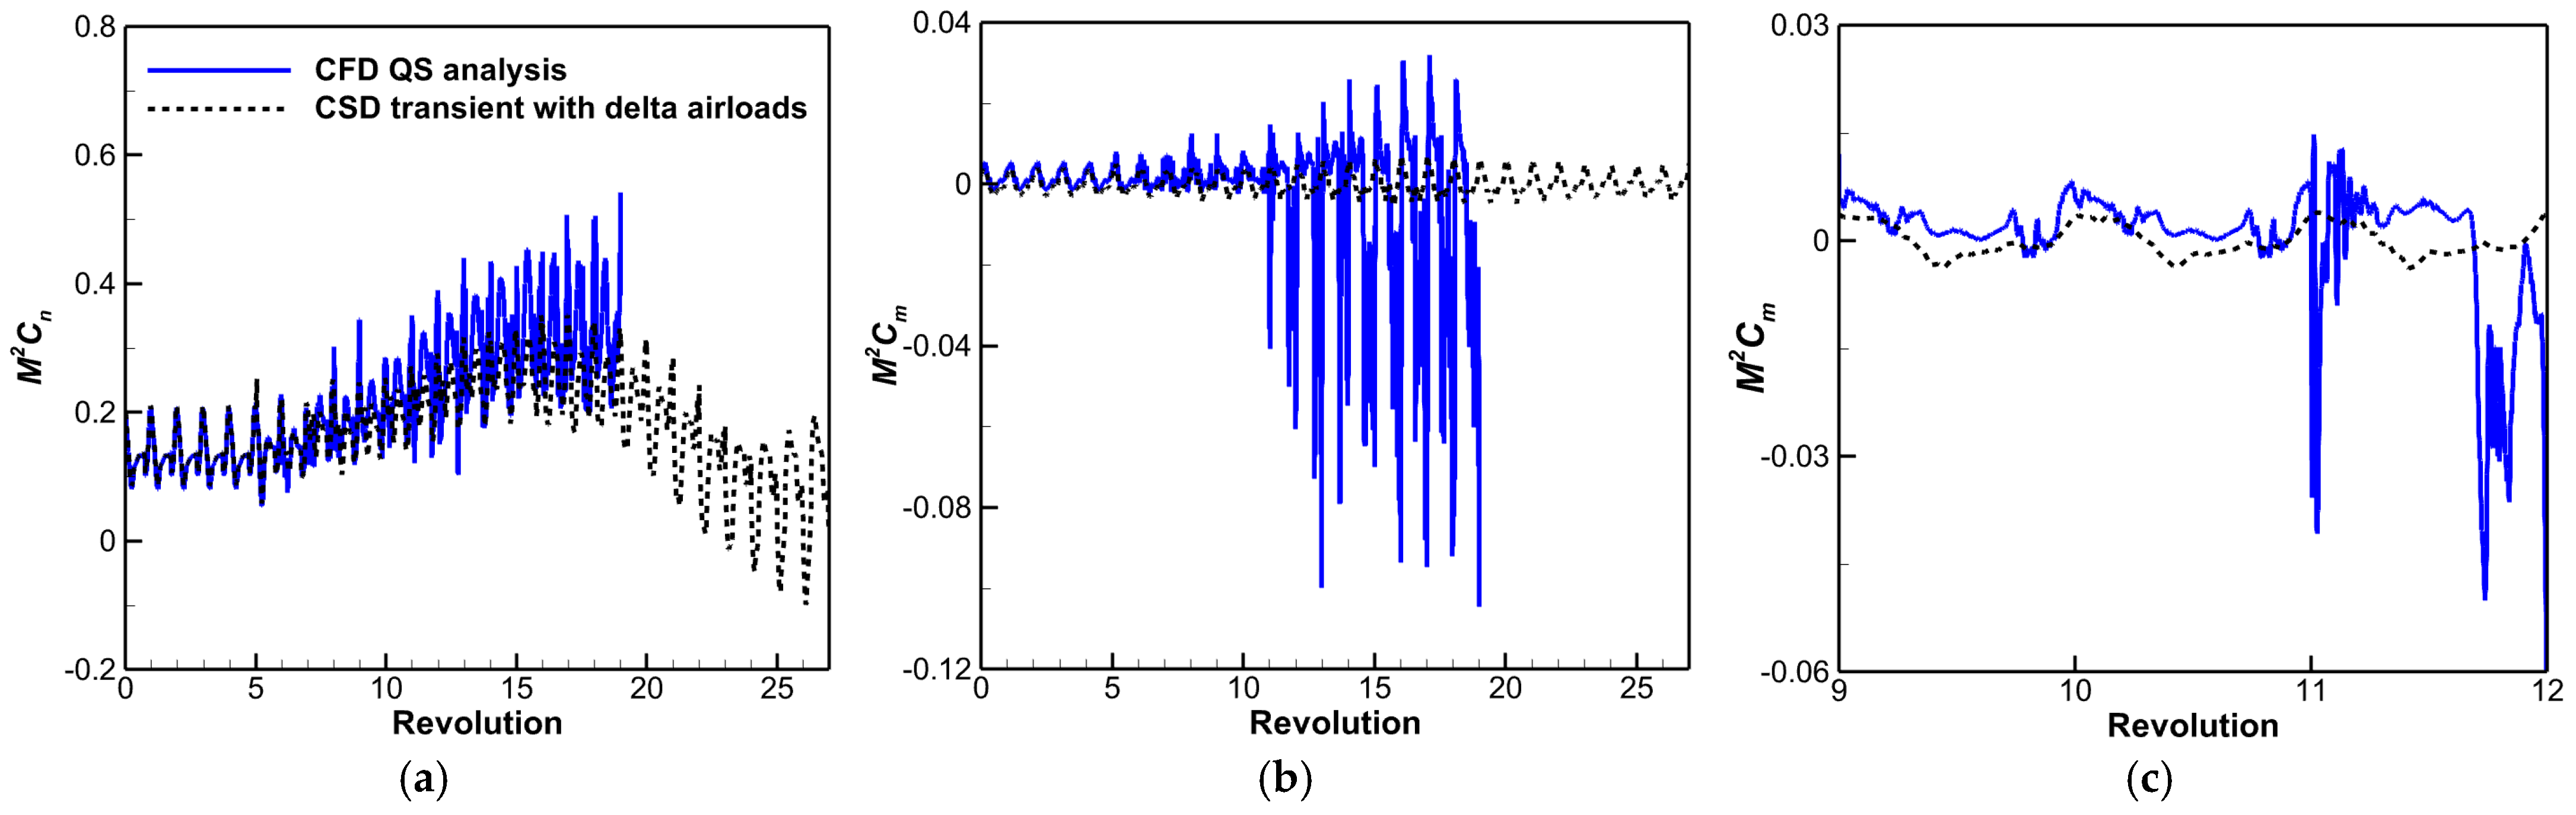
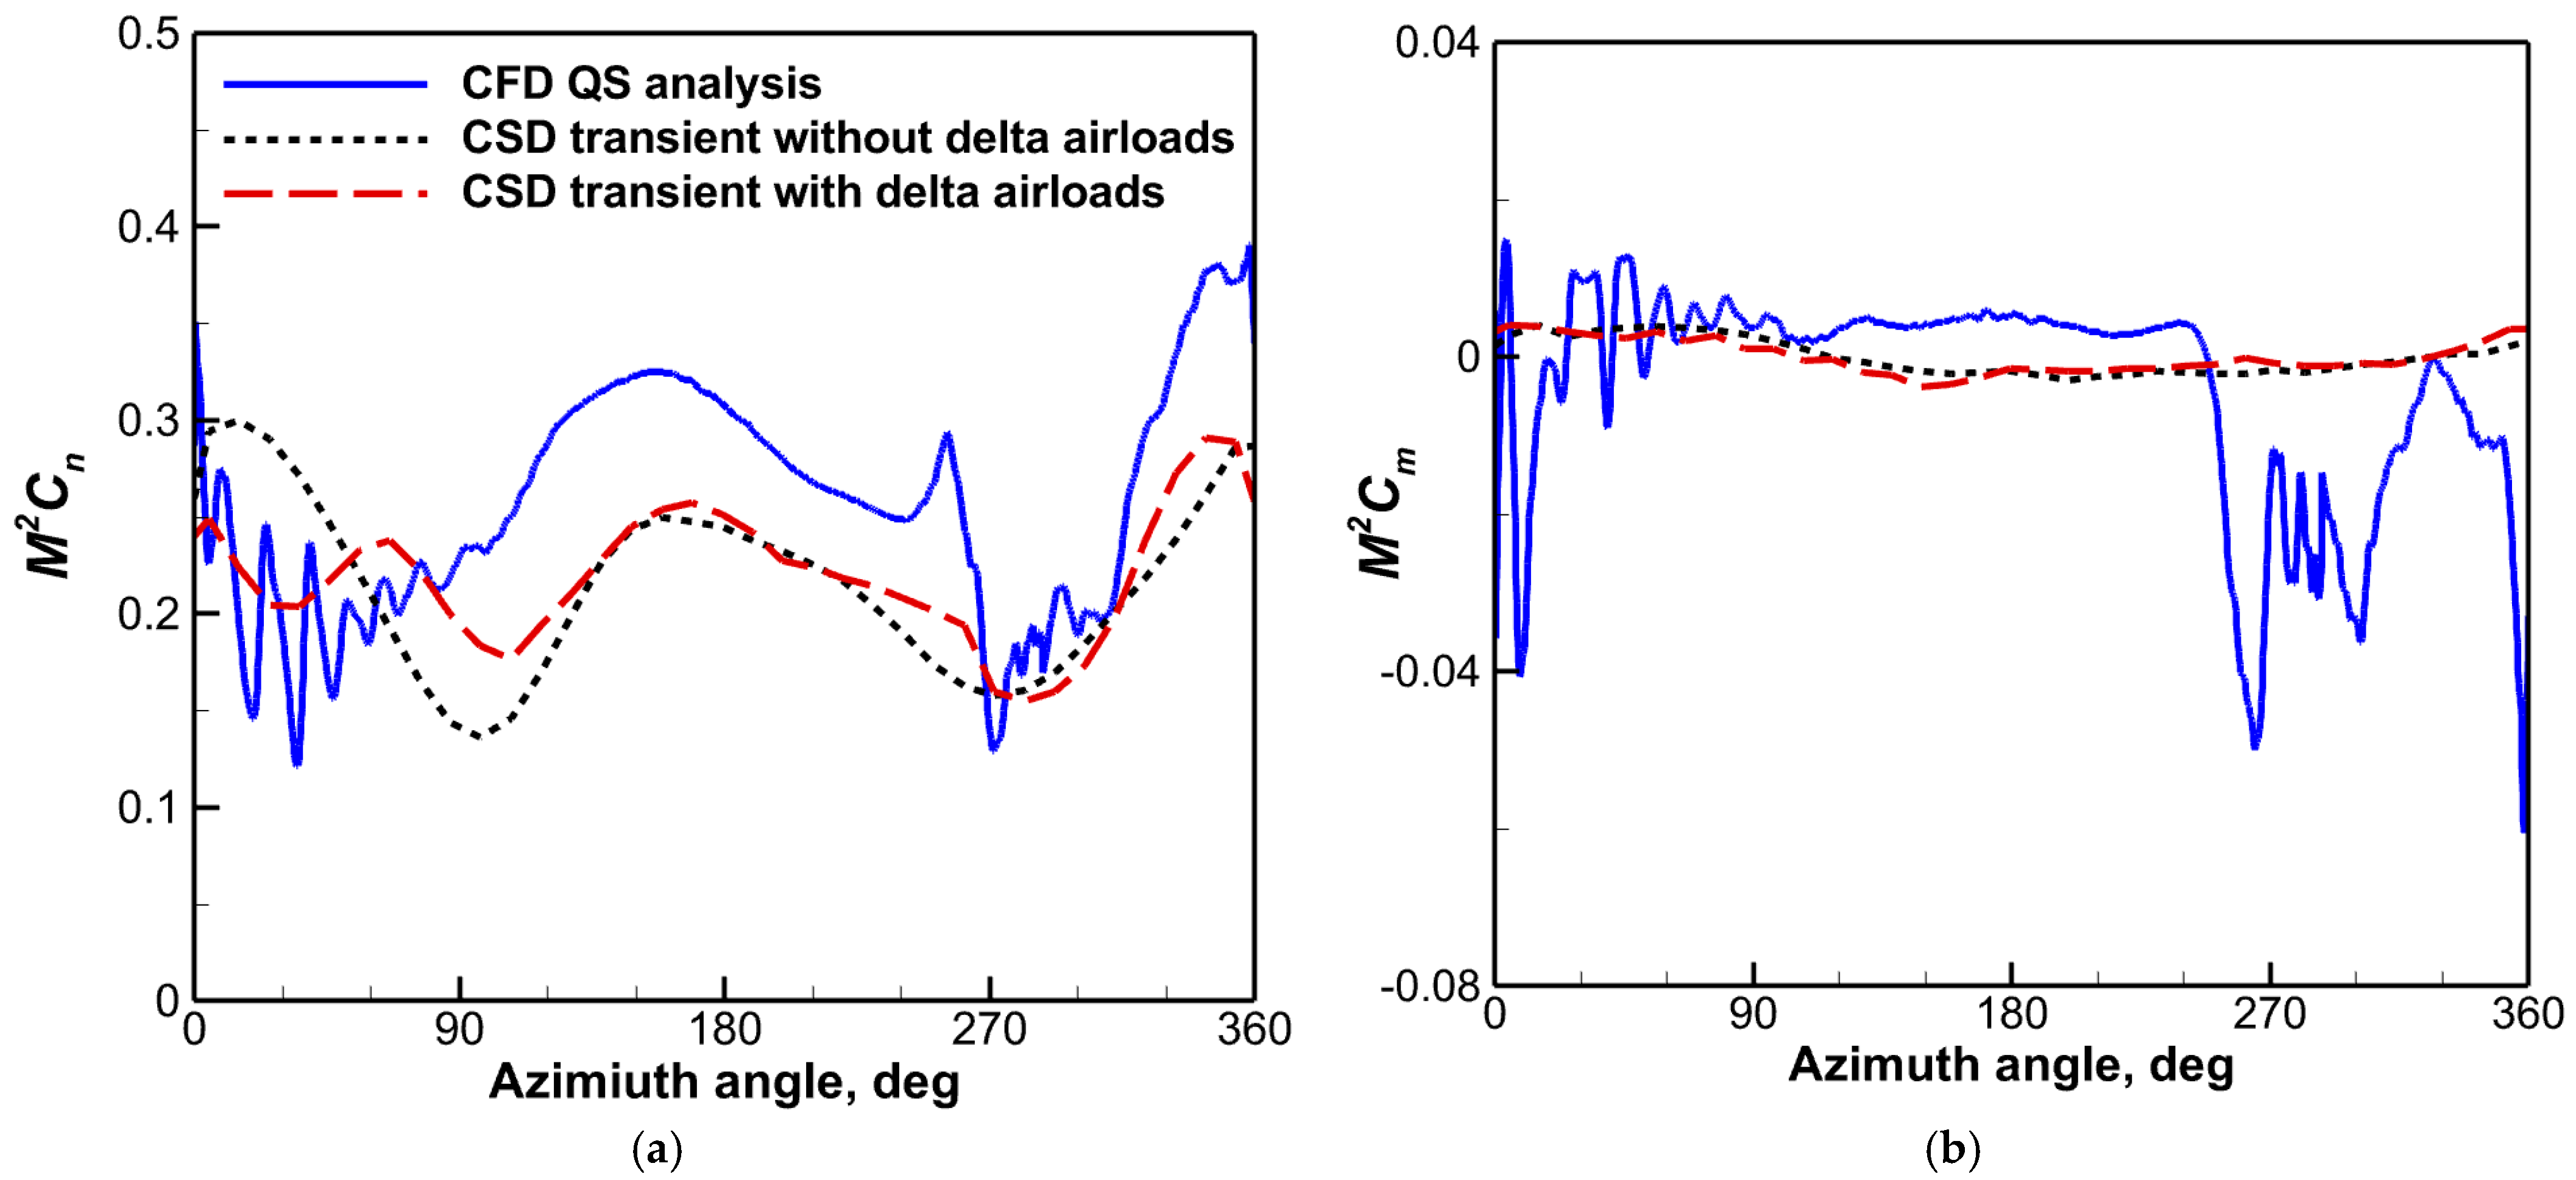
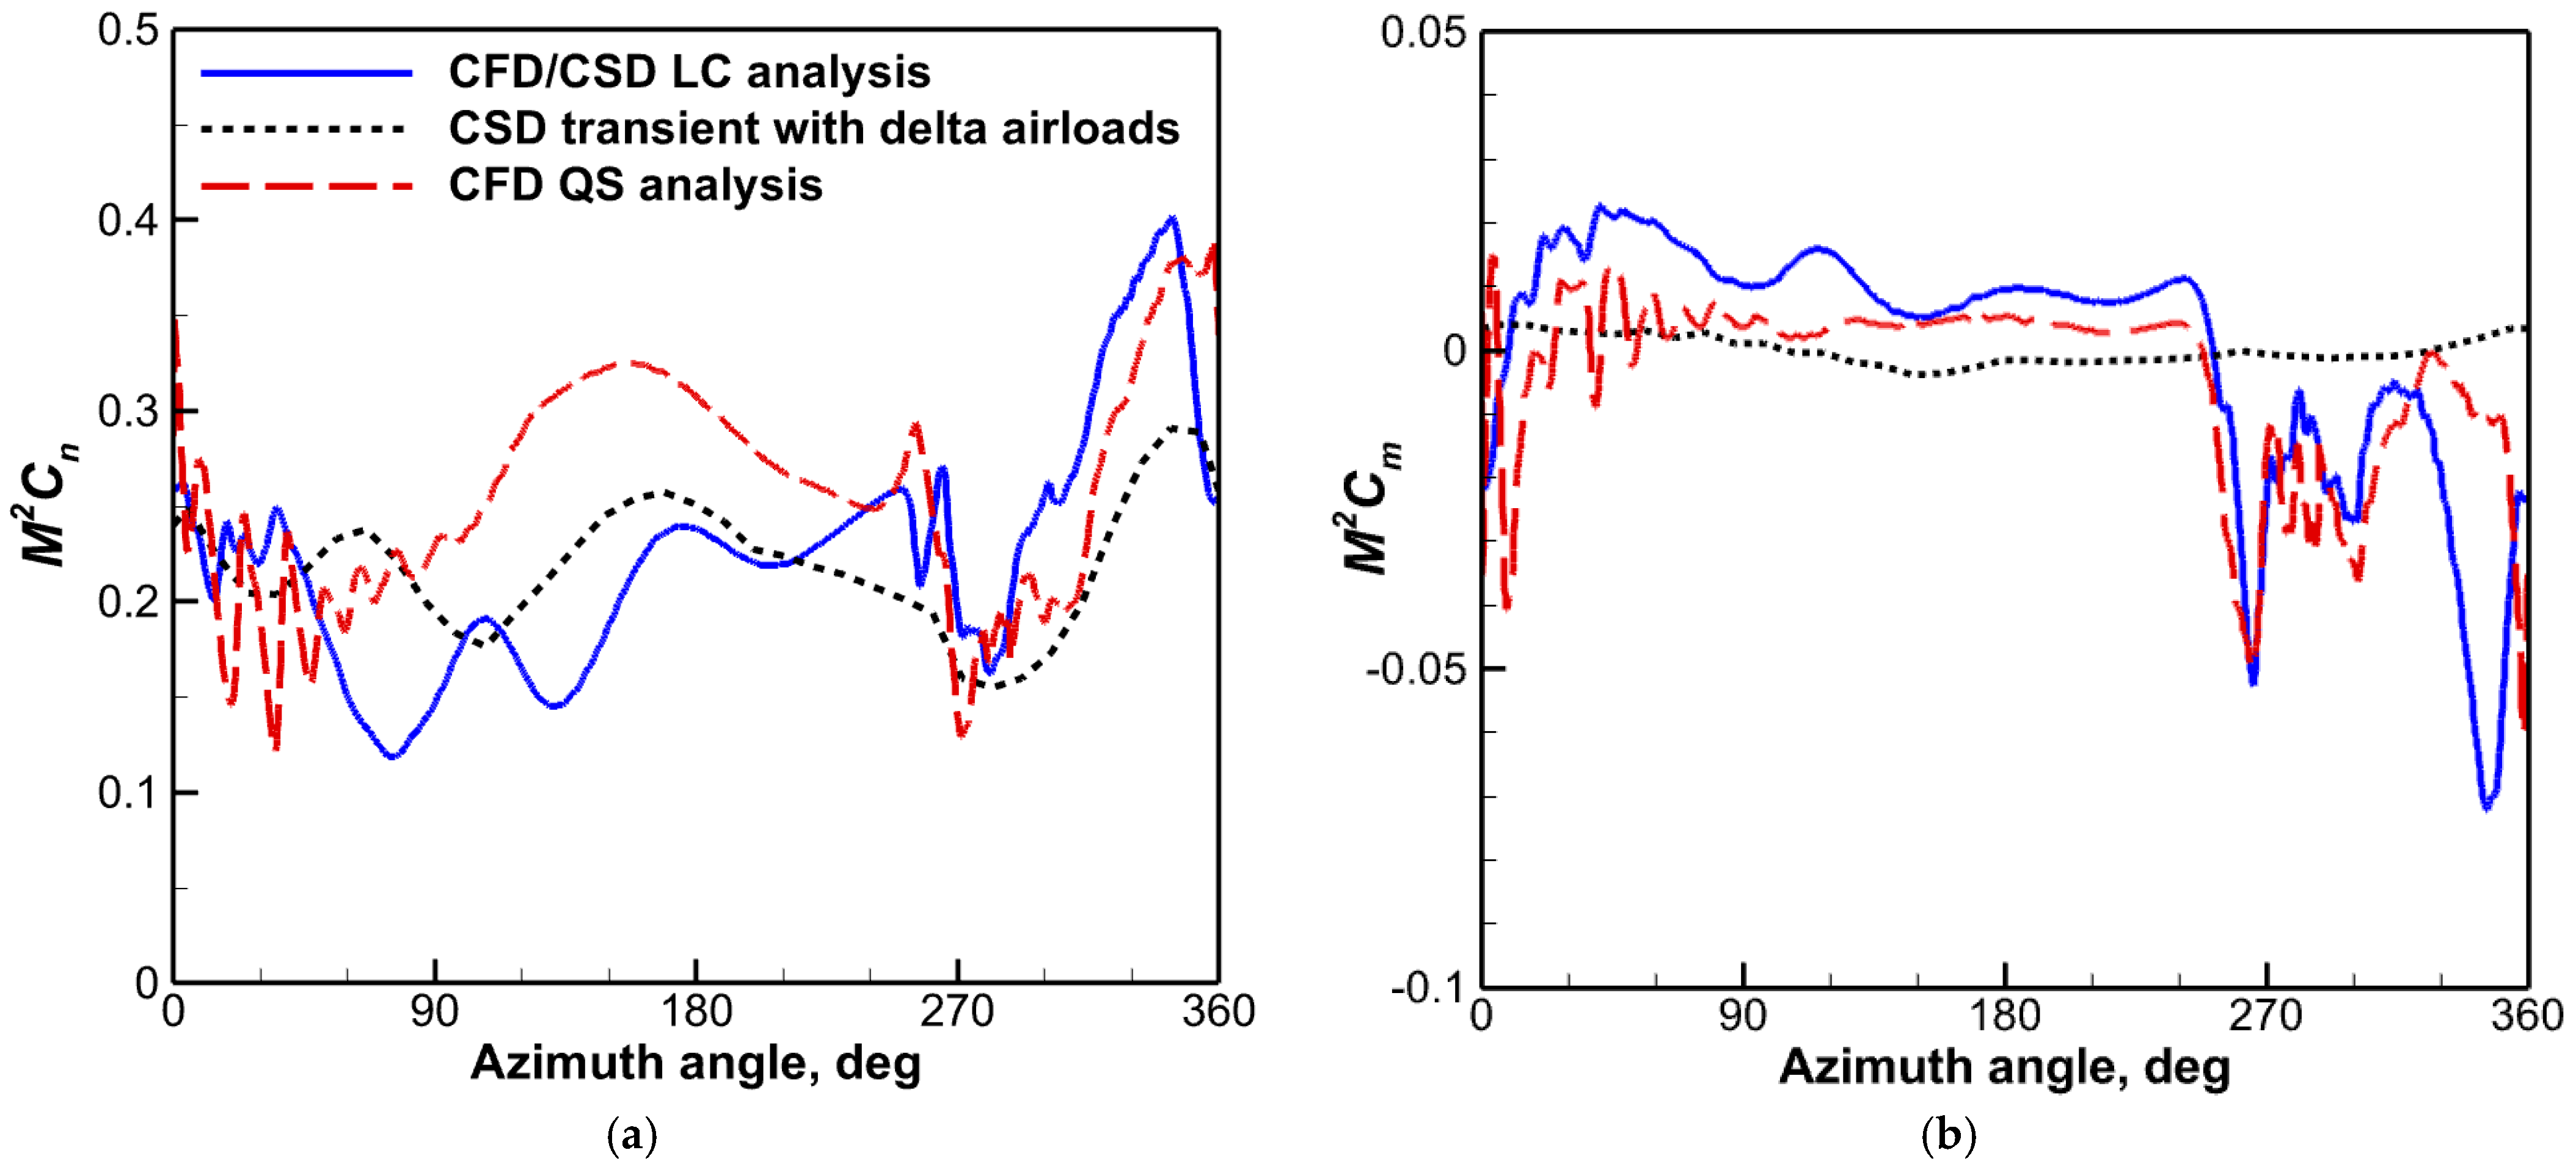
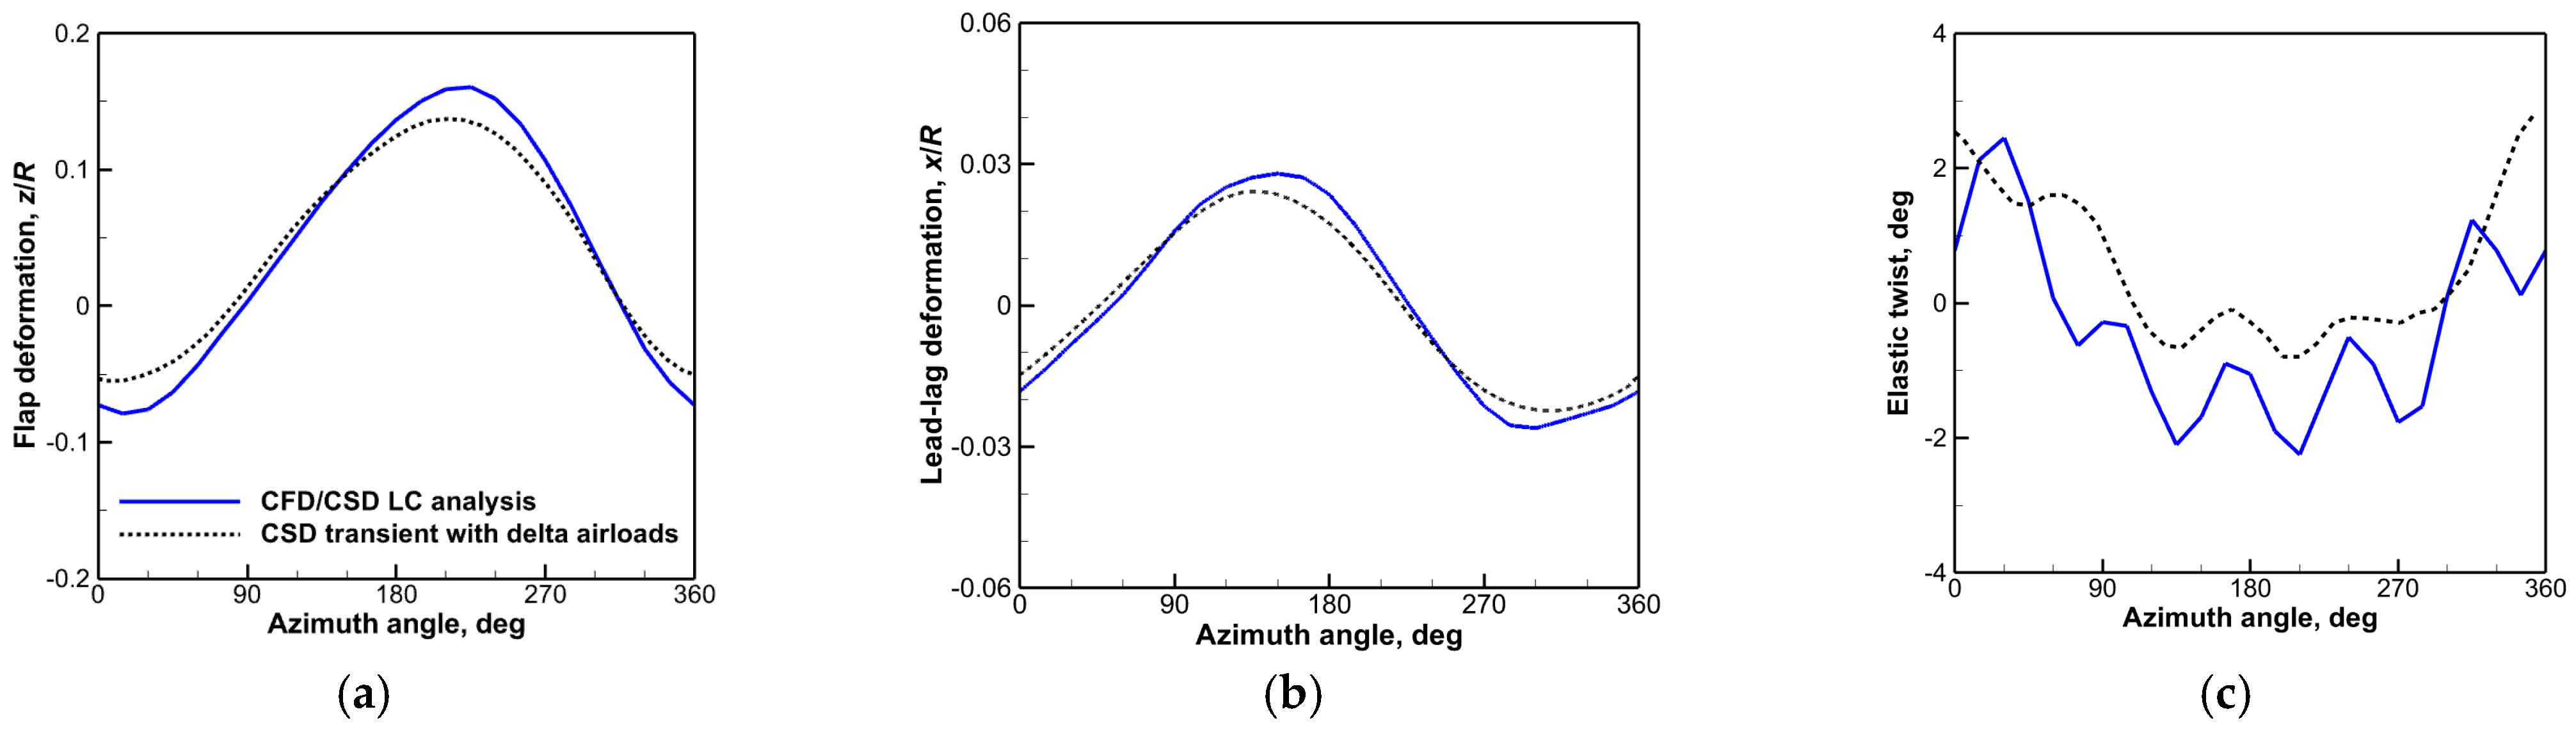
- The predicted results by the QS CFD or CFD/CSD LC approach were correlated with the CSD predictions with and without the contribution of delta airloads. Both CFD-based methods were demonstrated to capture the important flow characteristics such as BVI-induced oscillations in the advancing side and the negative DS peaks of the rotor in a pull-up maneuver. The CSD transient results with delta airloads indicated some improvements in the section normal force predictions by picking up more harmonics in the advancing side with a negligible influence on the section pitching moments.
- (2)
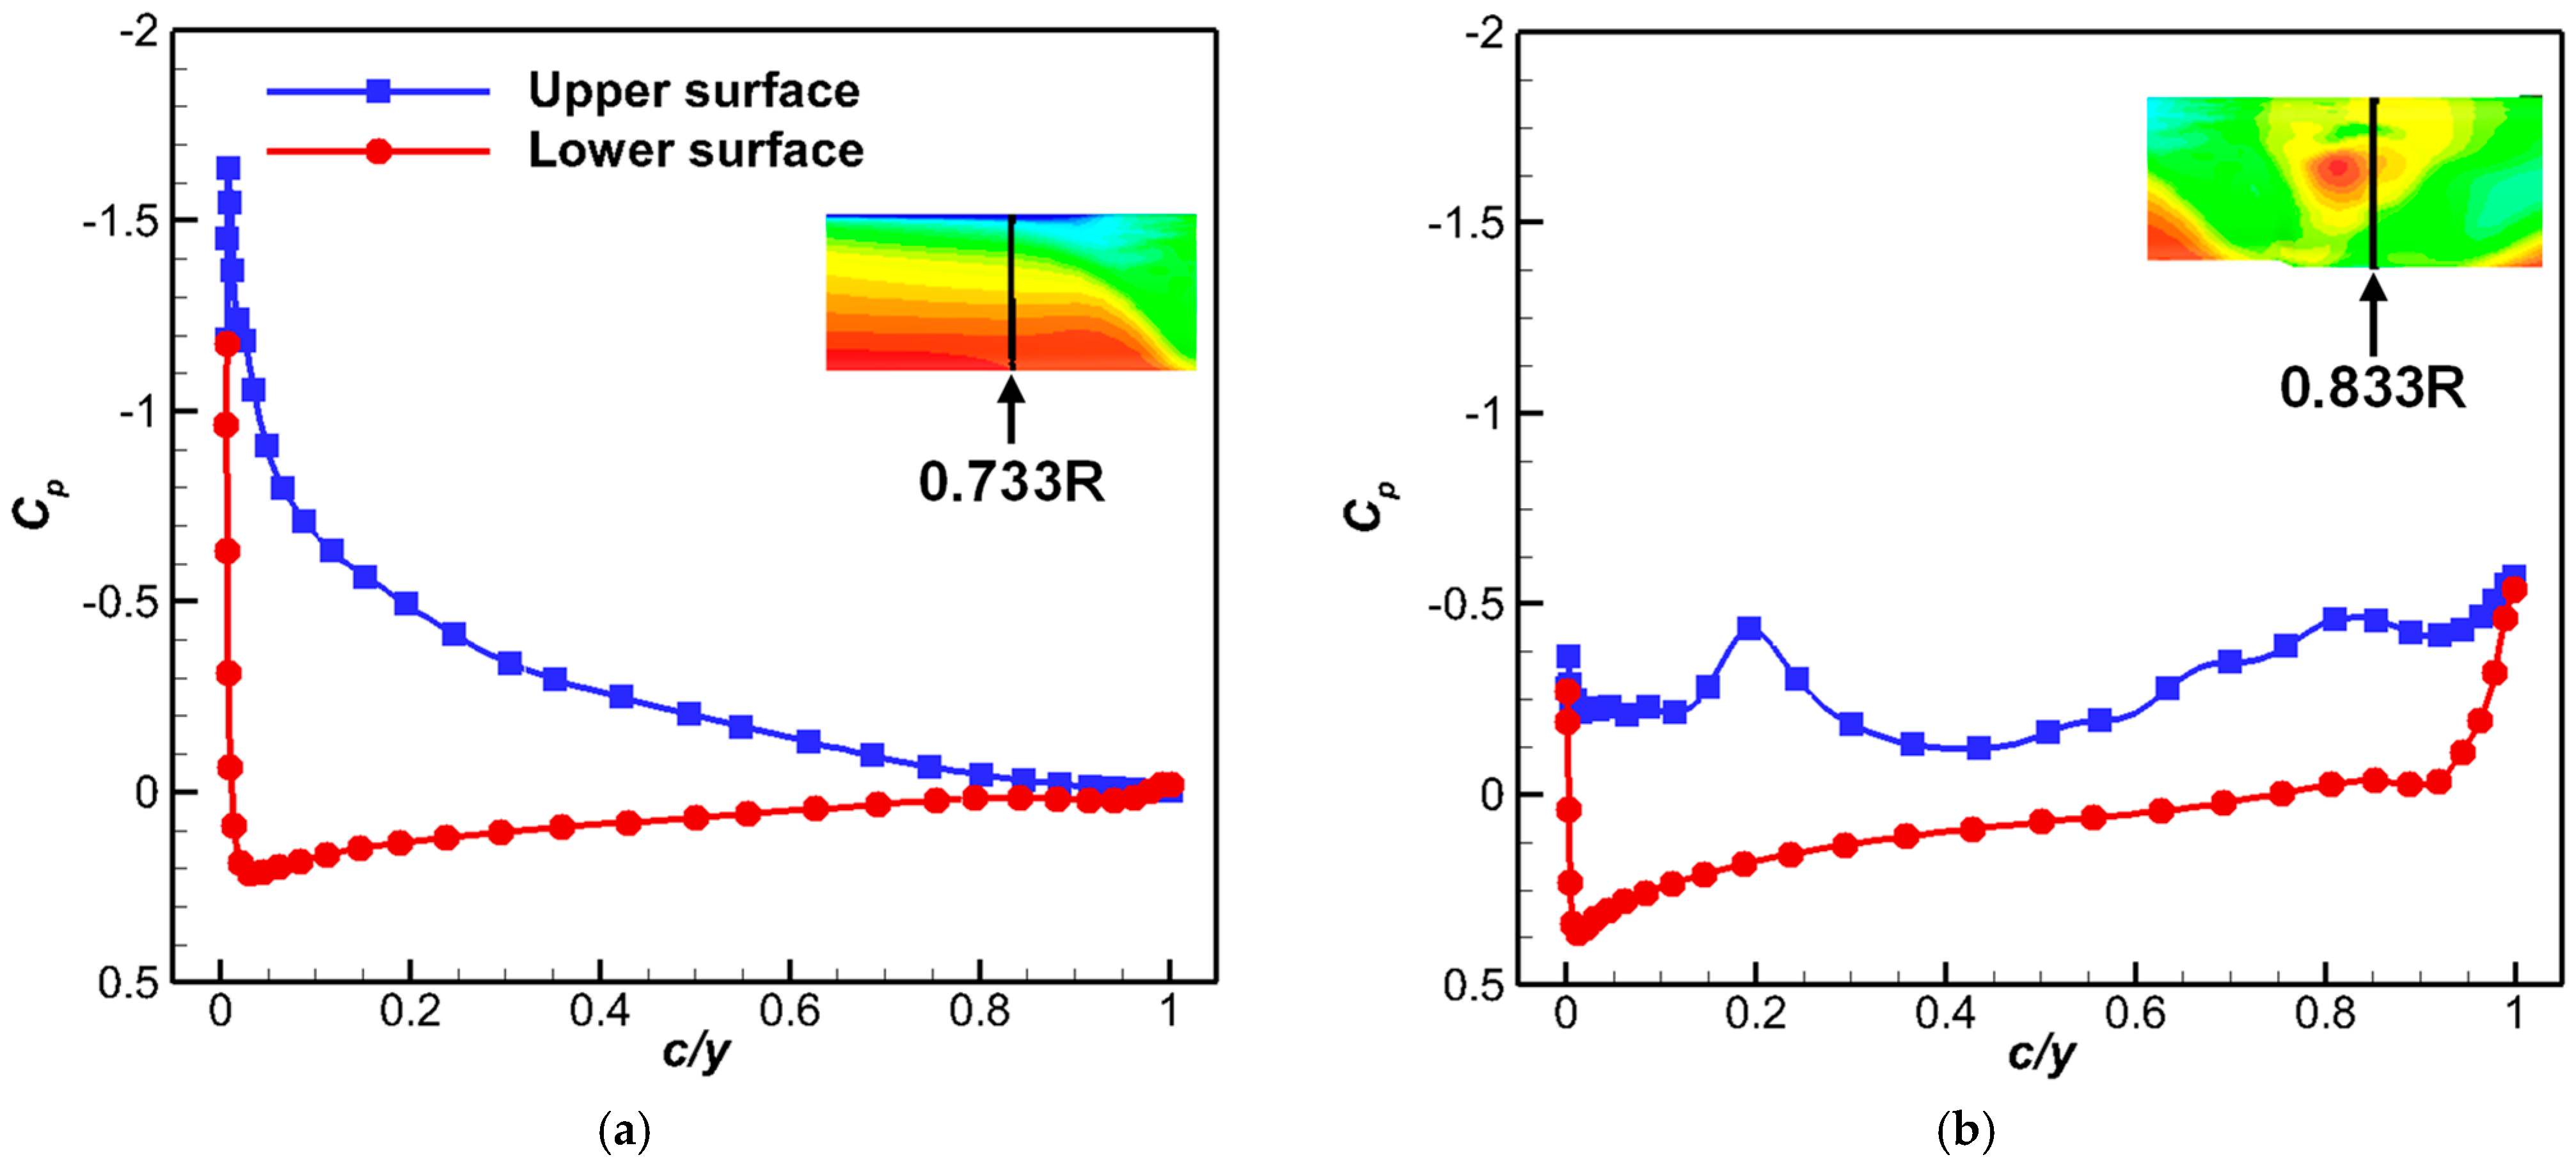
- The sources of violent pitching moment spikes encountered during the DS events in maneuvering flight were identified considering the spanwise surface pressure contours and the chordwise distribution of the pressure coefficients at specified radial stations. The results indicated large pressure fluctuations in both chord and span directions with an adverse pressure gradient over the upper surface induced due to the DS vortex system.
- (3)
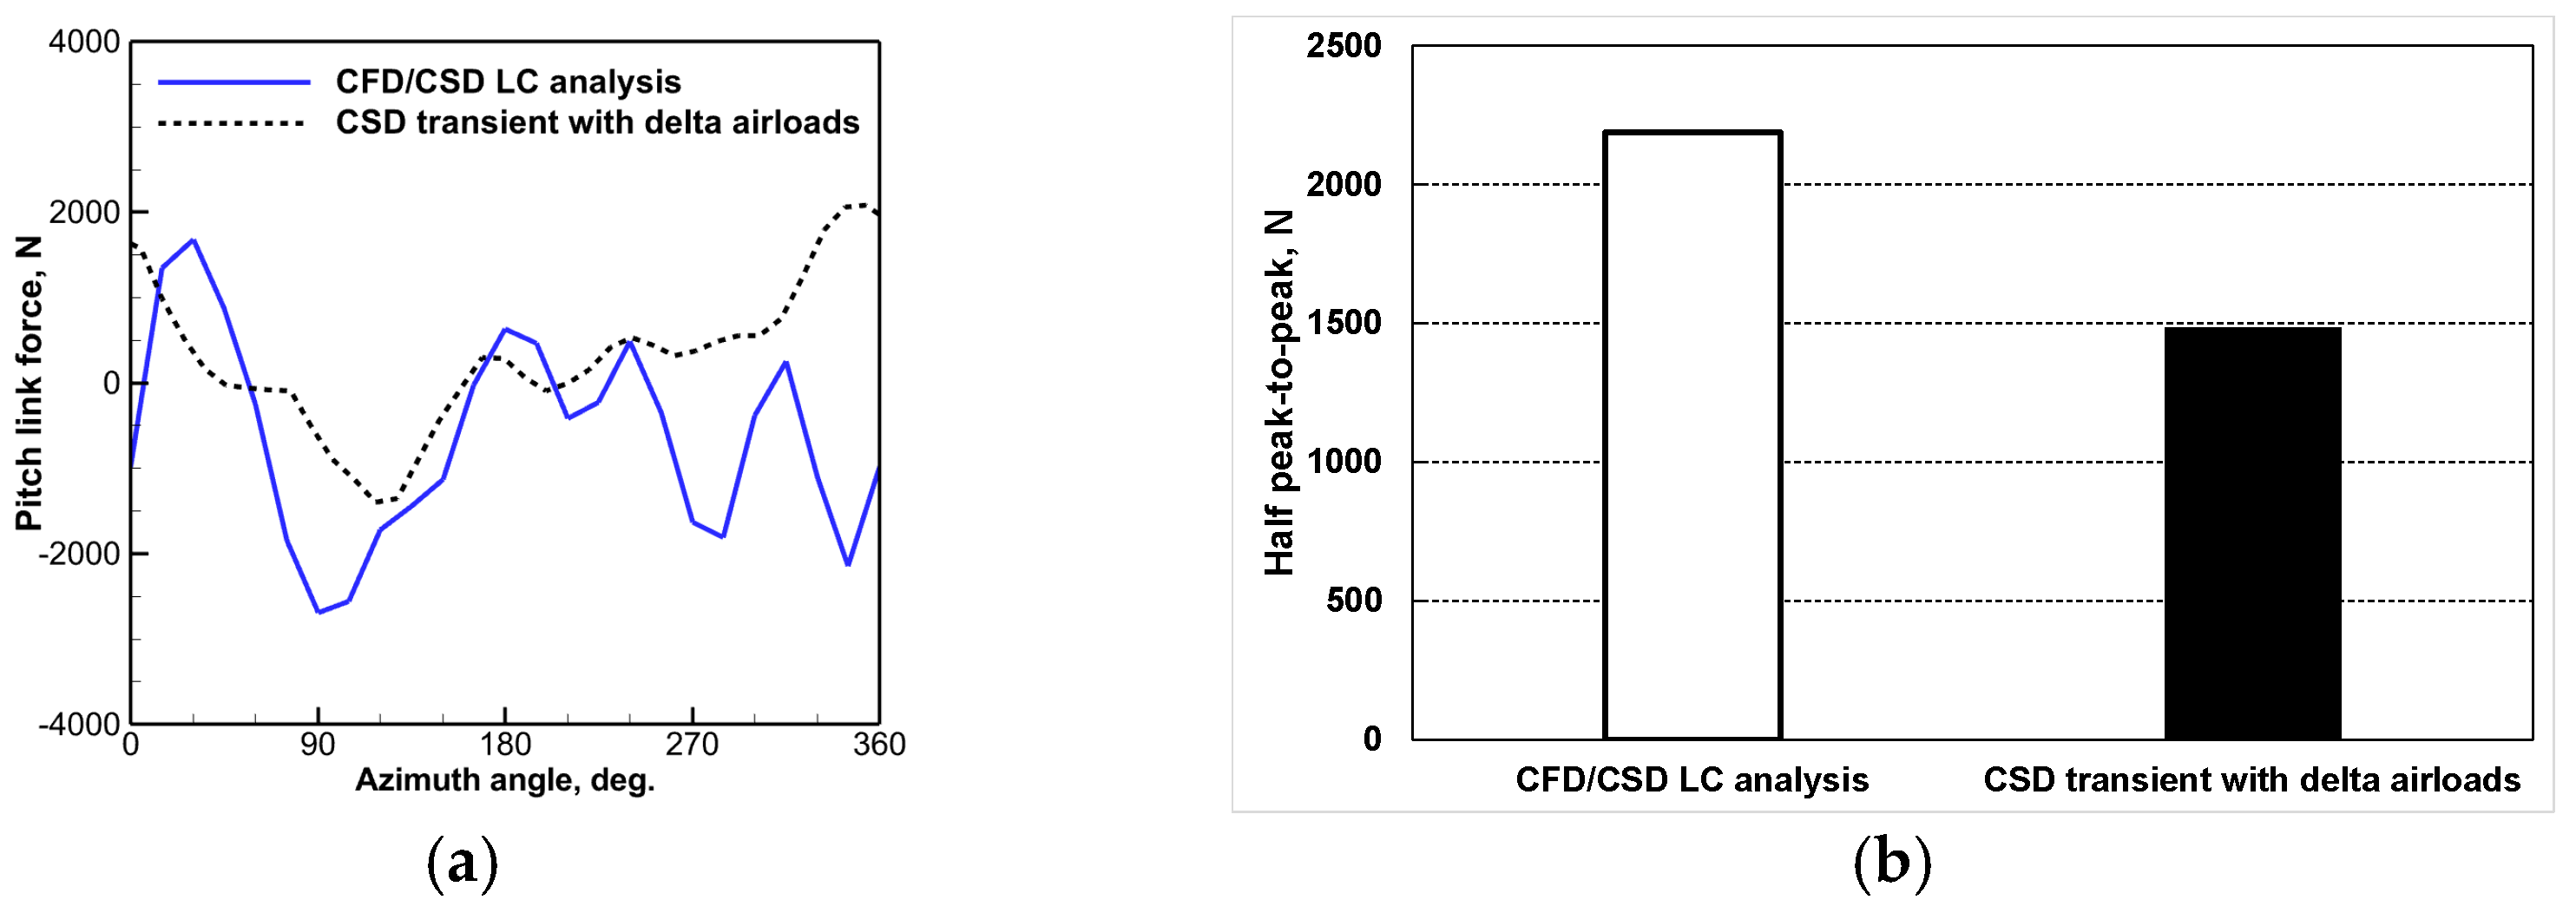
- The combined QS CFD analysis and CFD/CSD LC approach was shown to be effective in performing a detailed maneuver load study. The CFD-based predictions indicated reasonable agreement with the CSD-based results. The dominant 5P responses of elastic twist motions, structural moments, and pitch link loads were captured more clearly by the CFD/CSD LC method. It is suggested to conduct a series of flight tests in the future to confirm and verify the present findings.
Author Contributions
Funding
Data Availability Statement
Conflicts of Interest
References
- Lee, J.B.; Kang, S.N.; Lee, S.K.; Im, D.K.; Kang, H.J.; Lee, D.J. Development of improved rotor blade tip shape using multidisciplinary design analysis and optimization. In Proceedings of the 44th European Rotorcraft Forum, Delft, The Netherlands, 19–20 September 2018. [Google Scholar]
- Chen, R.T.N. Flight dynamics of rotorcraft in steep high-g turns. J. Aircr. 1984, 21, 14–22. [Google Scholar] [CrossRef]
- Le Bouar, G.; Costes, M.; Leroy-Chesneau, A.; Devinant, P. Numerical simulations of unsteady aerodynamics of helicopter rotor in maneuvering flight conditions. Aerosp. Sci. Technol. 2004, 8, 11–25. [Google Scholar] [CrossRef]
- Abhishek, A.; Datta, A.; Anathan, S.; Chopra, I. Prediction and analysis of main rotor loads in a prescribed pull-up maneuver. J. Aircr. 2010, 47, 1197–1215. [Google Scholar] [CrossRef]
- Zhang, H.; Liu, W.; Wang, E.; Chu, W.; Ding, K.; Yan, S. Effect of inverse blade angle slots on a transonic rotor performance and stability. Aerosp. Sci. Technol. 2020, 96, 105596. [Google Scholar] [CrossRef]
- Righi, M.; Pachidis, V.; Könözsy, L. On the prediction of the reverse flow and rotating stall characteristics of high-speed axial compressors using a three-dimensional through-flow code. Aerosp. Sci. Technol. 2020, 99, 105578. [Google Scholar] [CrossRef]
- Geissler, W.; Haselmeyer, H. Investigation of dynamic stall onset. Aerosp. Sci. Technol. 2006, 10, 590–600. [Google Scholar] [CrossRef]
- Romani, G.; Casalino, D. Rotorcraft blade-vortex interaction noise prediction using the Lattice-Boltzmann method. Aerosp. Sci. Technol. 2019, 88, 147–157. [Google Scholar] [CrossRef]
- Tung, C.; Caradonna, F.X.; Johnson, W. The prediction of transonic flows on an advancing rotor. J. Am. Helicopter Soc. 1986, 31, 4–9. [Google Scholar] [CrossRef]
- Bousman, W.G. Putting the aero back into aeroelasticity. In Proceedings of the Eighty ARO Workshop on Aeroelasticity of Rotorcraft Systems, State College, PA, USA, 18–20 October 1999. [Google Scholar]
- Kufeld, R.; Bousman, W. UH-60A helicopter rotor airloads measured in flight. Aeronaut. J. 1997, 101, 217–227. [Google Scholar] [CrossRef]
- Potsdam, M.; Yeo, H.; Johnson, W. Rotor airloads prediction using loose aerodynamic/structural coupling. J. Aircr. 2006, 43, 732–742. [Google Scholar] [CrossRef]
- Ortun, B.; Potsdom, M.; Yeo, H.; Truong, K.V. Rotor loads prediction on the ONERA 7A rotor using loose fluid/structure coupling. In Proceedings of the 72nd Annual Forum of the American Helicopter Society, West Palm Beach, FL, USA, 17–19 May 2016. [Google Scholar]
- Datta, A.; Sitaraman, J.; Chopra, I.; Baeder, J.D. CFD/CSD prediction of rotor vibratory loads in high-speed flight. J. Aircr. 2006, 43, 1698–1709. [Google Scholar] [CrossRef]
- Jung, S.N.; Sa, J.H.; You, Y.H.; Park, J.S.; Park, S.H. Loose fluid-structure coupled approach for a rotor in descent incorporating fuselage effects. J. Aircr. 2013, 50, 1016–1026. [Google Scholar] [CrossRef]
- You, Y.H.; Na, D.H.; Jung, S.N. Improved rotor aeromechanics predictions using a fluid structure interaction approach. Aerosp. Sci. Technol. 2018, 73, 118–128. [Google Scholar] [CrossRef]
- Richez, F. Analysis of dynamic stall mechanisms in helicopter rotor environment. J. Am. Helicopter Soc. 2018, 63, 1–11. [Google Scholar] [CrossRef]
- Altmikus, A.R.M.; Wanger, S.; Beaumier, P. On the timewise accuracy of staggered aeroelasticity simulations of rotary wings. In Proceedings of the American Helicopter Society Aerodynamics, Acoustics and Test and Evaluation Technical Specialists Meeting, San Francisco, CA, USA, 23–25 January 2002. [Google Scholar]
- Beaumier, P.; Costes, M.; Rodrigues, B.; Poinot, M.; Cantaloube, B. Weak and strong coupling between the elsA CFD solver and the HOST helicopter comprehensive analysis. In Proceedings of the 31st European Rotorcraft Forum, Florence, Italy, 13–15 September 2005. [Google Scholar]
- Nygaard, T.A.; Saberi, H.; Ormiston, R.A.; Strawn, R.C.; Potsdam, M. CFD and CSD algorithms and fluid structure interface for rotorcraft aeromechanics in steady and transient flight conditions. In Proceedings of the 62nd Annual Forum of the American Helicopter Society, Phoenix, Arizona, 9–11 May 2006. [Google Scholar]
- Reveles, N.; Simth, M.J.; Zaki, A.; Bauchau, O.A. A kriging-based trim algorithm for rotor aeroelasticity. In Proceedings of the 37th European Rotorcraft Forum, Gallarate, Italy, 13–15 September 2011. [Google Scholar]
- Bhagwat, M.J.; Ormiston, R.A.; Saberi, H.A.; Xin, H. Application of computational fluid dynamics/computational structural dynamics coupling for analysis of rotorcraft airloads and blade loads in maneuvering flight. J. Am. Helicopter Soc. 2012, 57, 1–21. [Google Scholar] [CrossRef]
- Rajmohan, N.; Manivannan, V.; Sanker, L.; Costello, M. Development of a methodology for coupling rotorcraft aeromechanics and vehicle dynamics to study helicopters in maneuver flight. In Proceedings of the 65th Annual Forum of the American Helicopter Society, Grapevine, Texas, 27–29 May 2009. [Google Scholar]
- Battey, L.S.; Sankar, L.N. A hybrid Navier-Stokes/viscous vortex particle wake methodology for modeling maneuver loads. In Proceedings of the 44th European Rotorcraft Forum, Delft, The Netherlands, 19–20 September 2018. [Google Scholar]
- Johnson, W. CAMRAD II: Comprehensive Analytical Model of Rotorcraft Aerodynamics and Dynamics; Johnson Aeronautics: Palo Alto, CA, USA, 1992. [Google Scholar]
- Kim, J.W.; Park, S.H.; Yu, Y.H. Euler and Navier-Stokes simulations of helicopter rotor blade in forward flight using an overlapped grid solver. In Proceedings of the 19th AIAA CFD Conference, San Antonio, TX, USA, 22–25 June 2009. [Google Scholar]
- Smith, M.J.; Lim, J.W.; van der Wall, B.G.; Baeder, J.D.; Biedron, R.T.; Boyd, D.D., Jr.; Jayaraman, B.; Jung, S.N.; Min, B.Y. The HART II international workshop: An assessment of the state of the art in CFD/CSD Prediction. CEAS Aeronaut. J. 2013, 4, 345–372. [Google Scholar] [CrossRef]
- Jung, S.N.; You, Y.H.; Kim, J.W.; Sa, J.H.; Park, J.S.; Park, S.H. Correlation of aeroelastic responses and structural loads for a rotor in descending flight. J. Aircr. 2012, 49, 398–406. [Google Scholar] [CrossRef]
- Yeo, H. Design and aeromechanics investigation of compound helicopters. Aerosp. Sci. Technol. 2015, 47, 216–237. [Google Scholar] [CrossRef]
- McHugh, F.J.; Clark, R.; Solomon, M. Wind Tunnel Investigation of Rotor Lift and Propulsive Force at High Speed—Data Analysis; NASA CR 1527-1; NASA: Washington, DC, USA, 1997.
- Nichols, R.H.; Tramel, R.W.; Buning, P.G. Evaluation of two high-order weighted essentially nonoscillatory schemes. AIAA J. 2008, 46, 3090–3102. [Google Scholar] [CrossRef]
- Wilcox, D.C. Comparison of two-equation turbulence models for boundary layers with pressure gradient. AIAA J. 1993, 31, 1414–1421. [Google Scholar] [CrossRef]
- Kan, X.; Wang, S.; Yang, L.; Zhong, J. Vortex dynamic mechanism of curved blade affecting flow loss in compressor cascade during corner stall process. Aerosp. Sci. Technol. 2019, 85, 443–452. [Google Scholar] [CrossRef]
- Roget, B.; Sitaraman, J.; Wissink, A.M.; Saberi, H.; Chen, W. Maneuvering rotorcraft simulations using CREATE A/VTM Helios. In Proceedings of the 54th AIAA Aerospace Sciences Meeting, San Diego, CA, USA, 4–8 January 2016; p. 1057. [Google Scholar]


| Properties | Value |
|---|---|
| Number of blades | 5 |
| Radius, R | 6.3 m |
| Mean chord length, c | 0.385 m |
| Solidity, | 0.0972 |
| Lock number, | 7.432 |
| Rotational speed, | 350 rpm |
Disclaimer/Publisher’s Note: The statements, opinions and data contained in all publications are solely those of the individual author(s) and contributor(s) and not of MDPI and/or the editor(s). MDPI and/or the editor(s) disclaim responsibility for any injury to people or property resulting from any ideas, methods, instructions or products referred to in the content. |
© 2024 by the authors. Licensee MDPI, Basel, Switzerland. This article is an open access article distributed under the terms and conditions of the Creative Commons Attribution (CC BY) license (https://creativecommons.org/licenses/by/4.0/).
Share and Cite
Hong, S.H.; Kim, Y.J.; Park, S.H.; Jung, S.N.; Kim, K.R. Air and Structural Loads Analysis of a 5-Ton Class Rotorcraft in a Pull-Up Maneuver Using CFD/CSD Coupled Approach. Aerospace 2024, 11, 102. https://doi.org/10.3390/aerospace11020102
Hong SH, Kim YJ, Park SH, Jung SN, Kim KR. Air and Structural Loads Analysis of a 5-Ton Class Rotorcraft in a Pull-Up Maneuver Using CFD/CSD Coupled Approach. Aerospace. 2024; 11(2):102. https://doi.org/10.3390/aerospace11020102
Chicago/Turabian StyleHong, Seong Hyun, Young Jin Kim, Soo Hyung Park, Sung Nam Jung, and Ki Ro Kim. 2024. "Air and Structural Loads Analysis of a 5-Ton Class Rotorcraft in a Pull-Up Maneuver Using CFD/CSD Coupled Approach" Aerospace 11, no. 2: 102. https://doi.org/10.3390/aerospace11020102
APA StyleHong, S. H., Kim, Y. J., Park, S. H., Jung, S. N., & Kim, K. R. (2024). Air and Structural Loads Analysis of a 5-Ton Class Rotorcraft in a Pull-Up Maneuver Using CFD/CSD Coupled Approach. Aerospace, 11(2), 102. https://doi.org/10.3390/aerospace11020102