Article

Four-Dimensional Generalized AMS Optimization Considering Critical Engine Inoperative for an eVTOL

by
Jiannan Zhang
1,
Max Söpper
1,
Florian Holzapfel
1 and
Shuguang Zhang
2,*
1
Institute of Flight System Dynamic, Technical University of Munich, 85748 Garching bei München, Germany
2
School of Transportation Science and Engineering, Beihang University, Beijing 100191, China
*
Author to whom correspondence should be addressed.
Aerospace 2024, 11(12), 990; https://doi.org/10.3390/aerospace11120990
Submission received: 31 October 2024 / Revised: 22 November 2024 / Accepted: 23 November 2024 / Published: 29 November 2024

Abstract

:
In this paper, we present a method to optimize the attainable moment set (AMS) to increase the control authority for electrical vertical take-off and landing vehicles (eVTOLs). As opposed to 3D AMSs for conventional airplanes, the hover control of eVTOLs requires vertical thrust produced by the powered lift system in addition to three moments. The limits of the moments and vertical thrust are coupled due to input saturation, and, as a result, the concept of the traditional AMS is extended to the 4D generalized moment set to account for this coupling effect. Given a required moment set (RMS) derived from system requirements, the optimization is formulated as a 4D convex polytope coverage problem, i.e., the AMS coverage over the RMS, such that the system’s available control authority is maximized to fulfill the prescribed requirements. The optimization accounts for not only nominal flight, but also for one critical engine inoperative situation. To test the method, it is applied to an eVTOL with eight rotors to optimize for the rotors’ orientation with respect to the body axis. The results indicate highly improved coverage of the RMS for both failure-free and one-engine-inoperative situations. Closed-loop simulation tests are performed for both optimal and non-optimal configurations to further validate the results.
Keywords:
eVTOL; AMS; optimization; OEI

1. Introduction

1.1. Background

The attainable moment set (AMS), initially proposed in Refs. [1,2], is an important concept for an aircraft’s control authority. Given the limits of the actuators, the AMS is a moment set producible by the effectors’ joint effort [3]. Consider an LTI system: its AMS is a convex set described by [4]:
A M = { m | m = B u , u _ u u ¯ } ,
where m R k is the vector of k-dimensional generalized moments; u R m is the vector of m-dimensional inputs; B R k × m is the effectiveness matrix; and u _ and u ¯ are the inputs’ lower and upper limits. The term “generalized moment” refers to all quantities that have an arithmetic relationship with the inputs, such as moments, forces, rotational and translational accelerations, or load factors [5].
For conventional airplanes, usually k = m = 3 , with a one-to-one mapping between three moments and three inputs. However, modern designs such as electrical vertical take-off and landing vehicles (eVTOLs) pose a difference due to the utilization of distributed electric propulsion (DEP) to provide VTOL ability [6,7,8,9]. During VTOL flight, the powered-lift DEP provides both rotational and vertical translational trim and maneuver. As a result, the maximum rotational and vertical translational maneuverability is also coupled due to the limits of the rotors. To fully understand the control authority of eVTOLs, the conventional AMS in R 3 described in [2] should be naturally extended to R 4 , adding the vertical force on top of the three moments. Accordingly, the term “attainable moment set” should be generalized to “attainable generalized moment set” to differentiate from the conventional definition. For ease of description, the term “AMS” is kept in this article, but is used to indicate the generalized concept.
The AMS has a substantial significance for an eVTOL’s control performance since it directly confines the maximum amplitude of achievable states’ time derivatives, e.g., angular/translational accelerations, consequentially constraining its agility, disturbance rejection capability, flight envelope, and, eventually, the mission profile. An inadequate generalized AMS indicates hazard in off-nominal circumstances such as input failures. Consequently, a larger margin of AMS with respect to the operation boundary means a better safety margin against critical situations.
The AMS is a system’s inherent attribute, given its control effectors’ parameters, such as size, position, orientation, and available power. For conventional aircraft, the design freedom for the AMS is rather restricted under the constraint of preliminary parameters such as stability and endurance. For novel configurations like eVTOLs, the situation is the opposite given their high input redundancy: the number of inputs onboard an eVTOL ranges from a dozen to as much as 30 plus [6,10,11,12,13,14,15], e.g., the Lilium Jet, as described in [6]. The level of redundancy allows for designers to exploit optimized control authority given the limits in available design resources, such as mass and power penalty, without violating preliminary design parameters, meanwhile increasing the system’s safety according to certification standards, such as the single failure requirement for enhanced category eVTOLs prescribed in EASA SC-VTOL [16,17]. For example, orientations of powered lift rotors could have a minor influence on the overall weight and stability of the airplane, while it exhibits a major impact on the moments’ production capability during VTOL flight. Owing to the large design space, the only viable means to find the most advantageous combination of all design parameters is to calculate via optimization.

1.2. Literature Review

Several studies have already adopted optimization to design the effector-related parameters for optimal AMS. In Ref. [18], a trim analysis is performed for a conventional aircraft enhanced with DEP over its wingspan, showing that the size of the vertical tail can be reduced by 45% by exploiting differential thrust without adversely affecting directional stability. The idea is further explored in Ref. [19] together with a H control methodology in a sequential optimization process, resulting in the reduction of the vertical tail area by 60% and lowering the required actuator bandwidth, while maintaining the overall control loop bandwidth. In Ref. [20], propeller optimization is applied to a DEP-enhanced airplane configuration to determine the optimal propeller diameter, which shows a reduction in take-off distance of up to 80% compared to the two-propeller conventional counterpart. As for AMS optimization, a generic AMS framework is proposed in Ref. [21] to aid in visualizing the AMSs of complex systems during the design phase, which is then conceptually applied to the Max Launch Abort System escape vehicle to help decide the optimal orientation of the thrust nozzles. In Ref. [22], a trim routine is developed for an unconventional box-wing configuration to maximize local AMS at operation points. Although it does not directly relate to the effector configuration of the system, it implements an optimization framework to exploit the best control capability given the system redundancy.

1.3. Motivation and Objective

AMS optimization from a design perspective has been extensively discussed; however, seldom previous works have linked the goal of such optimizations directly with design requirements. In Ref. [23], a concept named “required moment set” (RMS) is developed to relate flight performance requirements with the moments that are generated to fulfill these requirements. As the name suggests, the RMS is the set of generalized moments that are defined according to aircraft requirements, specifying generalized moments that are required to achieve, e.g., required bandwidth of transient maneuvers, required ability to reject disturbances, or flying according to a required mission profile. Like the AMS, the RMS is an inherent property of the system. The goal of optimizing the AMS is, therefore, to ensure its enclosing of the RMS to a maximum degree. In Ref. [24], a framework is proposed to optimize the coverage of the AMS over a given RMS. However, the work only considers 3D AMS during failure-free operation, meaning that for eVTOLs, one dimension in the control space is compromised, and the results do not hold under failure situations, which involve more critical situations compared to normal operations, especially for certifiable applications. In Ref. [25], Lu et al. proposed an approach to evaluate and quantify the controllability of an eVTOL lift–cruise configuration, which considers the 4D AMS. The focus of this paper is to provide a unified framework to evaluate controllability, especially addressing the issue of one-engine-inoperative, of this type of eVTOL for all flight phases including hover, transition, and wing-borne flight. The outcome provides valuable insights for the design of eVTOLs from a controllability perspective, yet it does not directly relate the results to the configurational or parametric design of such a type of aircraft.
In this paper, we extend the framework developed in Ref. [24] to optimize the AMS in R 4 space, and additionally account for the critical situation of one-engine-inoperative (OEI). In other words, the optimization maximizes the coverage of the AMS polytope over the RMS polytope in R 4 under a critical engine failure. The goal is to largely improve the system’s reliability by increasing its controllability and, hence, its safety margin after the failure of the critical engine. To intuitively address the polytope coverage issue, the geometric problem in the 4D space is mathematically abstracted as distances between the vertices of the inner polytope to the boundary of the outer polytope, and the cost function is designed to punish the distances of a small margin. To test the proposed approach, it is implemented for an eight-rotor lift–cruise eVTOL to optimize its rotors’ installation orientations; in total, four different groups of optimizations are performed to present the performance of the approach step-by-step by directly illustrating the resultant AMSs and each corresponding margin metrics. It is worth noting that the considered airframe is the same as the one analyzed in Ref. [25]. Then, to further validate the optimization results, the optimized configurations are validated in a model-in-the-loop (MIL) closed-loop simulation by comparing the command-tracking performances of the initial design and the optimized configurations under the prescribed critical failure condition.
The following parts of this paper are arranged as follows. Section 2 introduces the preliminaries and definitions to the problem under discussion. Section 3 describes the optimization setup, including the mathematical formulation of the geometric polytope coverage problem, the cost function, and the solution to evaluate the margins between the polytopes. Section 4 introduces the airframe to be optimized, as well as the different groups of tests to be implemented and their corresponding assumptions. Section 5 discusses the optimization results by the direct illustration, quantification, and comparison of the AMSs between the different test groups mentioned in Section 4. Section 6 elaborates the MIL simulation and control performances of each optimized configuration. Section 7 briefly concludes this paper and provides some prospects to further this study.

2. Preliminaries and Definitions

The concepts of AMS and RMS are elaborated in Refs. [1,2,23]. We briefly recall them here and extend the definitions to the generalized moment space.
Admissible control set ( A C ): A set in the control space, which is a Cartesian system in R m with m as the number of effectors. A C consists of all possible combinations of effector positions constrained by their respective limits. Since each effector is independently actuated, it is a convex set resembling a cuboid or hyper-cuboid in the control space.
Attainable (generalized) moment set ( A M ): A set in the generalized moment space, which is a Cartesian system in R k with k as the number of generalized moments. For traditional aircraft, k equals 3 with roll, pitch and yaw moments. For eVTOLs, k equals 4 by adding the vertical acceleration as another “generalized” moment. A M consists of all possible combinations of generalized moments that can be produced by elements in A C . In this paper, we consider a linear mapping B R k × m : A C A M , also known as the effectiveness matrix. Given the convexity of A C , A G M is also convex due to the linear mapping of B [5]. As a result, A M is a convex polytope in R k . B is principally determined by the effector configuration.
Required (generalized) moment set ( R M ): A set in the generalized moment space, which contains all generalized moments that the system must produce to fulfill its requirements. R M is determined by the requirements such as disturbance rejection capability, as well as preliminary parameters of the system such as mass and moment of inertia. R M is considered fixed after the preliminary design phase once the concepts of operations and requirements are frozen.

3. Optimization Setup

3.1. Problem Definition

The problem is defined as below:
given a fixed RMS R M R 4 , search for an optimal set of effector-related parameters p within their constraint limits, to maximize the margin between A M R 4 and R M .
Geometrically, the polytope of the generalized AMS is shaped and sized such that it maximally encloses the polytope of the RMS. Note that the RMS is fixed once the system’s requirements are validated and, hence, will not change according to p. To reduce the dimension and complexity of the optimization, it is assumed that parameters p must be chosen to make a major impact on the size and shape of the AMS, while only affecting other design requirements with negligible consequences.
Since the AMS and the RMS are convex polytopes, the margin from the RMS to the AMS can be checked by the distance of the RMS vertices towards the AMS boundary. The concept can be illustrated by a 2D example, as in Figure 1.
If a certain RMS vertex draws too near to the AMS boundary or, in a worse case, exceeds it, then the system would be limited or unable to fulfill the requirements in this direction. Given this intuition, the task could be summarized as follows: search for an optimal set of effector-related parameters p o p t , such that the resultant A M has its boundary farthest away from the R M vertices. As mentioned earlier, p should be chosen and constrained in a way to mainly affect the system’s control authority instead of other preliminary design parameters. For eVTOLs, one such parameter could be orientations of the powered-lift rotors, which presents inconsequential effects on mass and CG but can largely change the moment generation due to forces, i.e., the AMS.

3.2. Optimization Formulation

The distance between AMS and RMS can be represented by a positive margin factor, λ , as shown in Figure 1. To punish RMS vertices that are close to, or even exceed the AMS boundary, that is, when λ is close to 1 or smaller than 1, the optimization is formulated as [24]:
min p J = i = 1 n V , R M S 1 λ i ,   subject   to ,   p _ p p ¯ c p c ¯ ,
where
  • n V , R M S is the total number of vertices on RMS;
  • λ i is the margin factor of the i t h RMS vertex;
  • p is the vector of variables to optimize, with p _ and p ¯ its lower and upper limits;
  • c is the vector of additional constraints, e.g., structural or spatial restriction;
  • c ¯ is the upper limits of c .
The selection of variables p presents a major influence on the effectors’ effectiveness. Typical parameters can be, e.g., the orientation angles and rotational direction of the rotors, or they can also be the dimensions and positions of the rotors or other dominant control surfaces. The limits to p guarantee that changes in p do not lead to major coupling effects to other preliminary design parameters.

3.3. Optimization to Account for Critical Engine Failure

Equation (2) describes, in general, the coverage problem between two polytopes. For a system operating under nominal conditions, it is straightforward to simply apply Equation (2) for the optimization. However, failure cases would drastically degrade the AMS, and each single failure or combination of different failures would result in a different AMS. According to Refs. [16,17], a manned eVTOL in the enhanced category will be able to continue safe flight and landing after any single failure, with minor influence on the handling quality. This means that the control authority still presents enough margin for the prescribed performance after the loss of an effector. To account for this requirement, the cost function includes failure conditions and aims to optimize the case of the most critical single failure.
To achieve the goal of critical failure optimization, Equation (2) is extended for all single failure cases in each optimization step, and then among all failure cases, the worst-case cost function value (i.e., the highest one) among all is taken as the critical case to optimize with, leading to the following argument:
min p J = max j i = 1 n V , R M S 1 λ i j ,   subject   to ,   p _ p p ¯ c p c ¯ j = 1,2 , , m
where
  • m is the total number of inputs;
  • λ i j is the margin factor of the RMS vertex of index i to the AMS given the failure of the input of index j.

3.4. Solving for λ

The key to the problem in Equation (3) is to calculate λ for each RMS vertex r i . Consider the 2D example in Figure 1: the relationship between v 1 , v 2 , and r i is:
a i = λ i r i = α v 1 + 1 α v 2 ,
Equation (4) is a linear system with two equations and two unknowns. Since the AMS is convex, there is only one intersection between the direction of r i and the AMS boundary, which occurs on one boundary cell of the AMS among others. For a 2D AMS, its boundary cell is a line segment, while the counterpart for a 3D AMS is a facet, and for 4D is a tetrahedron. Given the cell of intersection, the solution will automatically guarantee that 0 α 1 .
The concept could be generalized to 4D. The smallest boundary cell of a 4D polyhedron is a tetrahedron with four vertices. Assume the query direction r i intersects with a cell of vertices v 1 , v 2 , v 3 , v 4 ; then, the relationship between v 1 , v 2 , v 3 , v 4 , and r i is:
α 1 v 1 + α 2 v 2 + α 3 v 3 + α 4 v 4 = λ r i α 1 + α 2 + α 3 + α 4 = 1 ,
with five equations and five variables to solve for. To find the right λ for r i , one way is to solve this equation for all of the boundary tetrahedral of the AMS, and the only valid solution is found when 0 α 1,2 , 3,4 1 is satisfied.

3.5. Solving the Optimization

The formulation in Equation (3) is highly nonlinear and might be subject to multiple local minimums. To robustly solve the optimization, a global optimization tool should be considered. For our application in this paper, we used “surrogateopt” provided by the MATLAB global optimization toolbox [26].

4. Test Implementation

4.1. Airframe Under Consideration

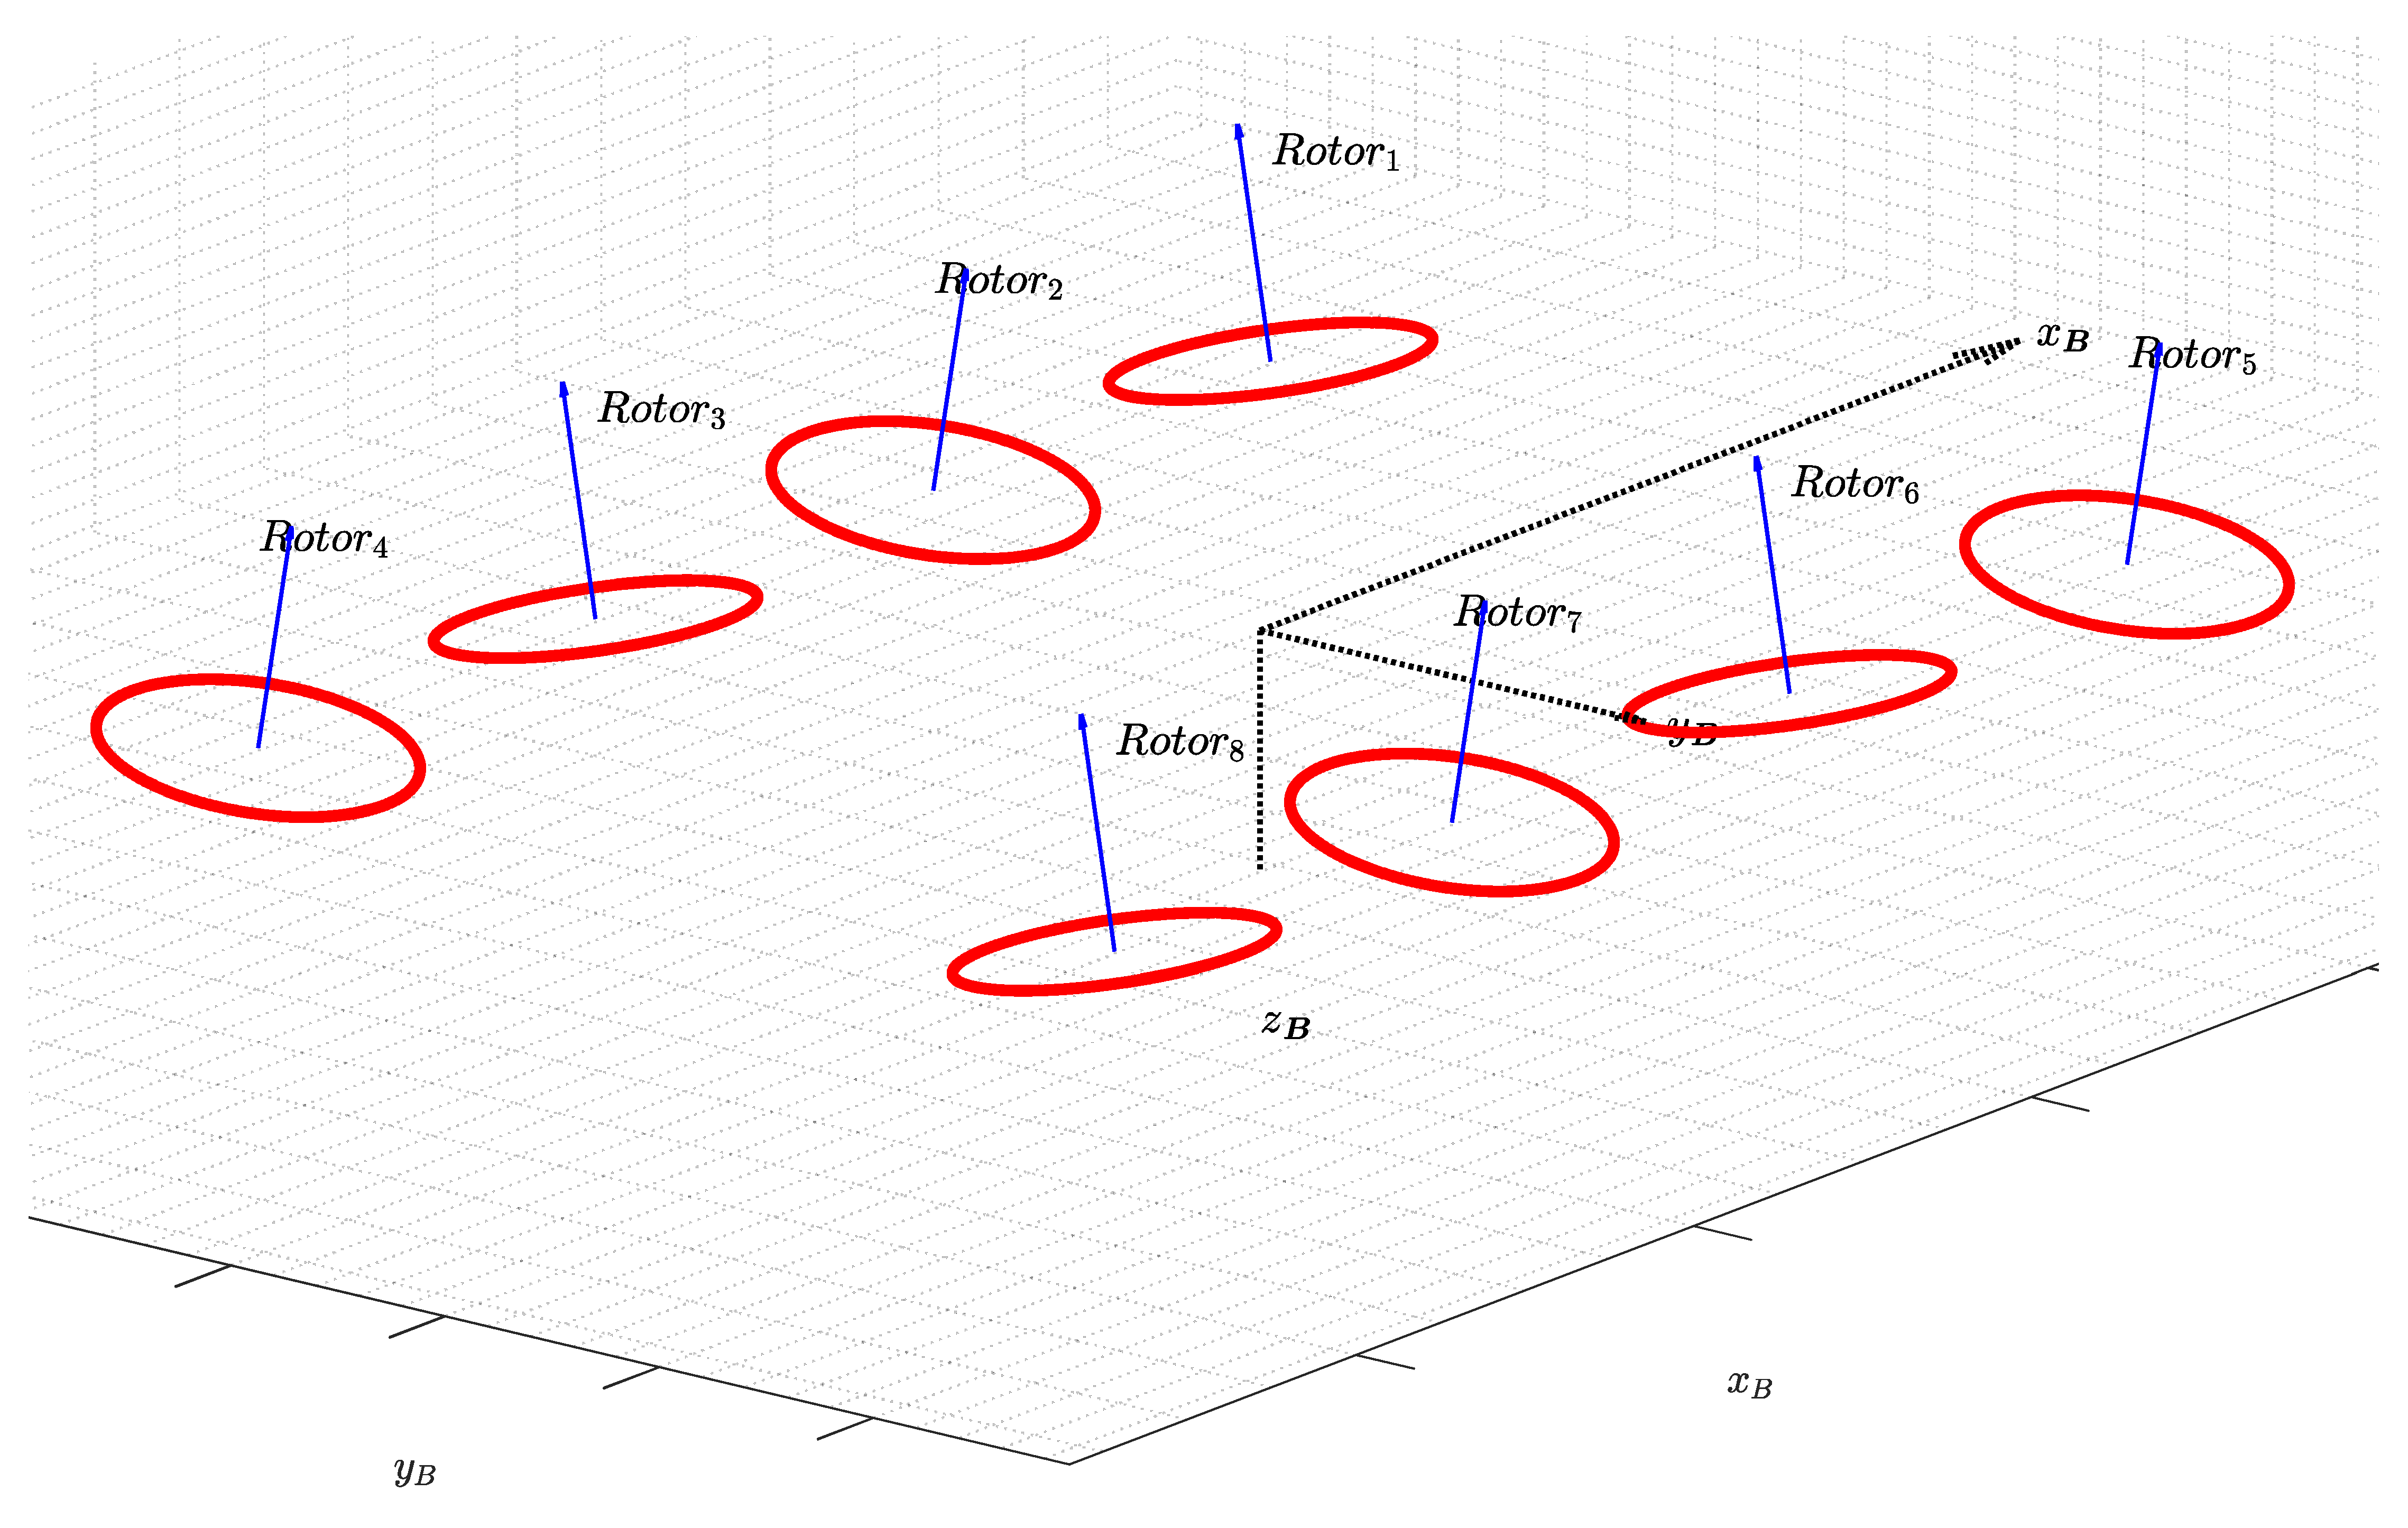
The airframe considered in this paper is a lift–cruise type eVTOL with eight non-tiltable, fixed-pitch rotors for hover lift and control, and a wing to provide aerodynamic lift for cruise. Its approximate preliminary design parameters are listed in Table 1. The conceptual prototype and its layout of the rotors and the wing is presented in Figure 2. Given the large wingspan, the aircraft exhibits a considerably large moment of inertia in the yaw axis, which is a common characteristic of eVTOLs compared to normal multi-copters. Owing to this property, eVTOLs of this category often show limited yaw control authority. For the system under discussion, the rotors are fixed on two booms parallel to the fuselage, leading to the design freedom of installation orientation around the body longitudinal axis. Hence, improvements to the yaw control authority can be addressed by adjusting this design freedom of each rotor, i.e., changing the fixation orientation of the rotors around the body longitudinal axis. This allows the rotors to produce larger lateral forces and, consequently, a larger yaw moment due to the lever arms, with a certain level of sacrifice to the lift, pitch, and roll capability.
The forces and torques of rotors in steady-state hover flight can be assumed to be linearly dependent on the squared rotational speed of the rotors [27,28]. Since the generalized moments directly show an arithmetic relationship with the rotor forces and torques [29], the AMS of this system is defined by:
A M = { m | m = B ϕ P ω 2 , 0 ω ω m a x } ,
where
  • ϕ P are the orientations of rotors around the longitudinal axis, positive is defined by the right-hand rule;
  • m = p ˙ ; q ˙ ; r ˙ ; n z B is the generalized moments vector of rotational accelerations and vertical load factor in the body-fixed axis;
  • B is the effectiveness matrix [29], as a function of ϕ P ;
  • ω and ω m a x are the rotational speed of the propellers and their upper limit.
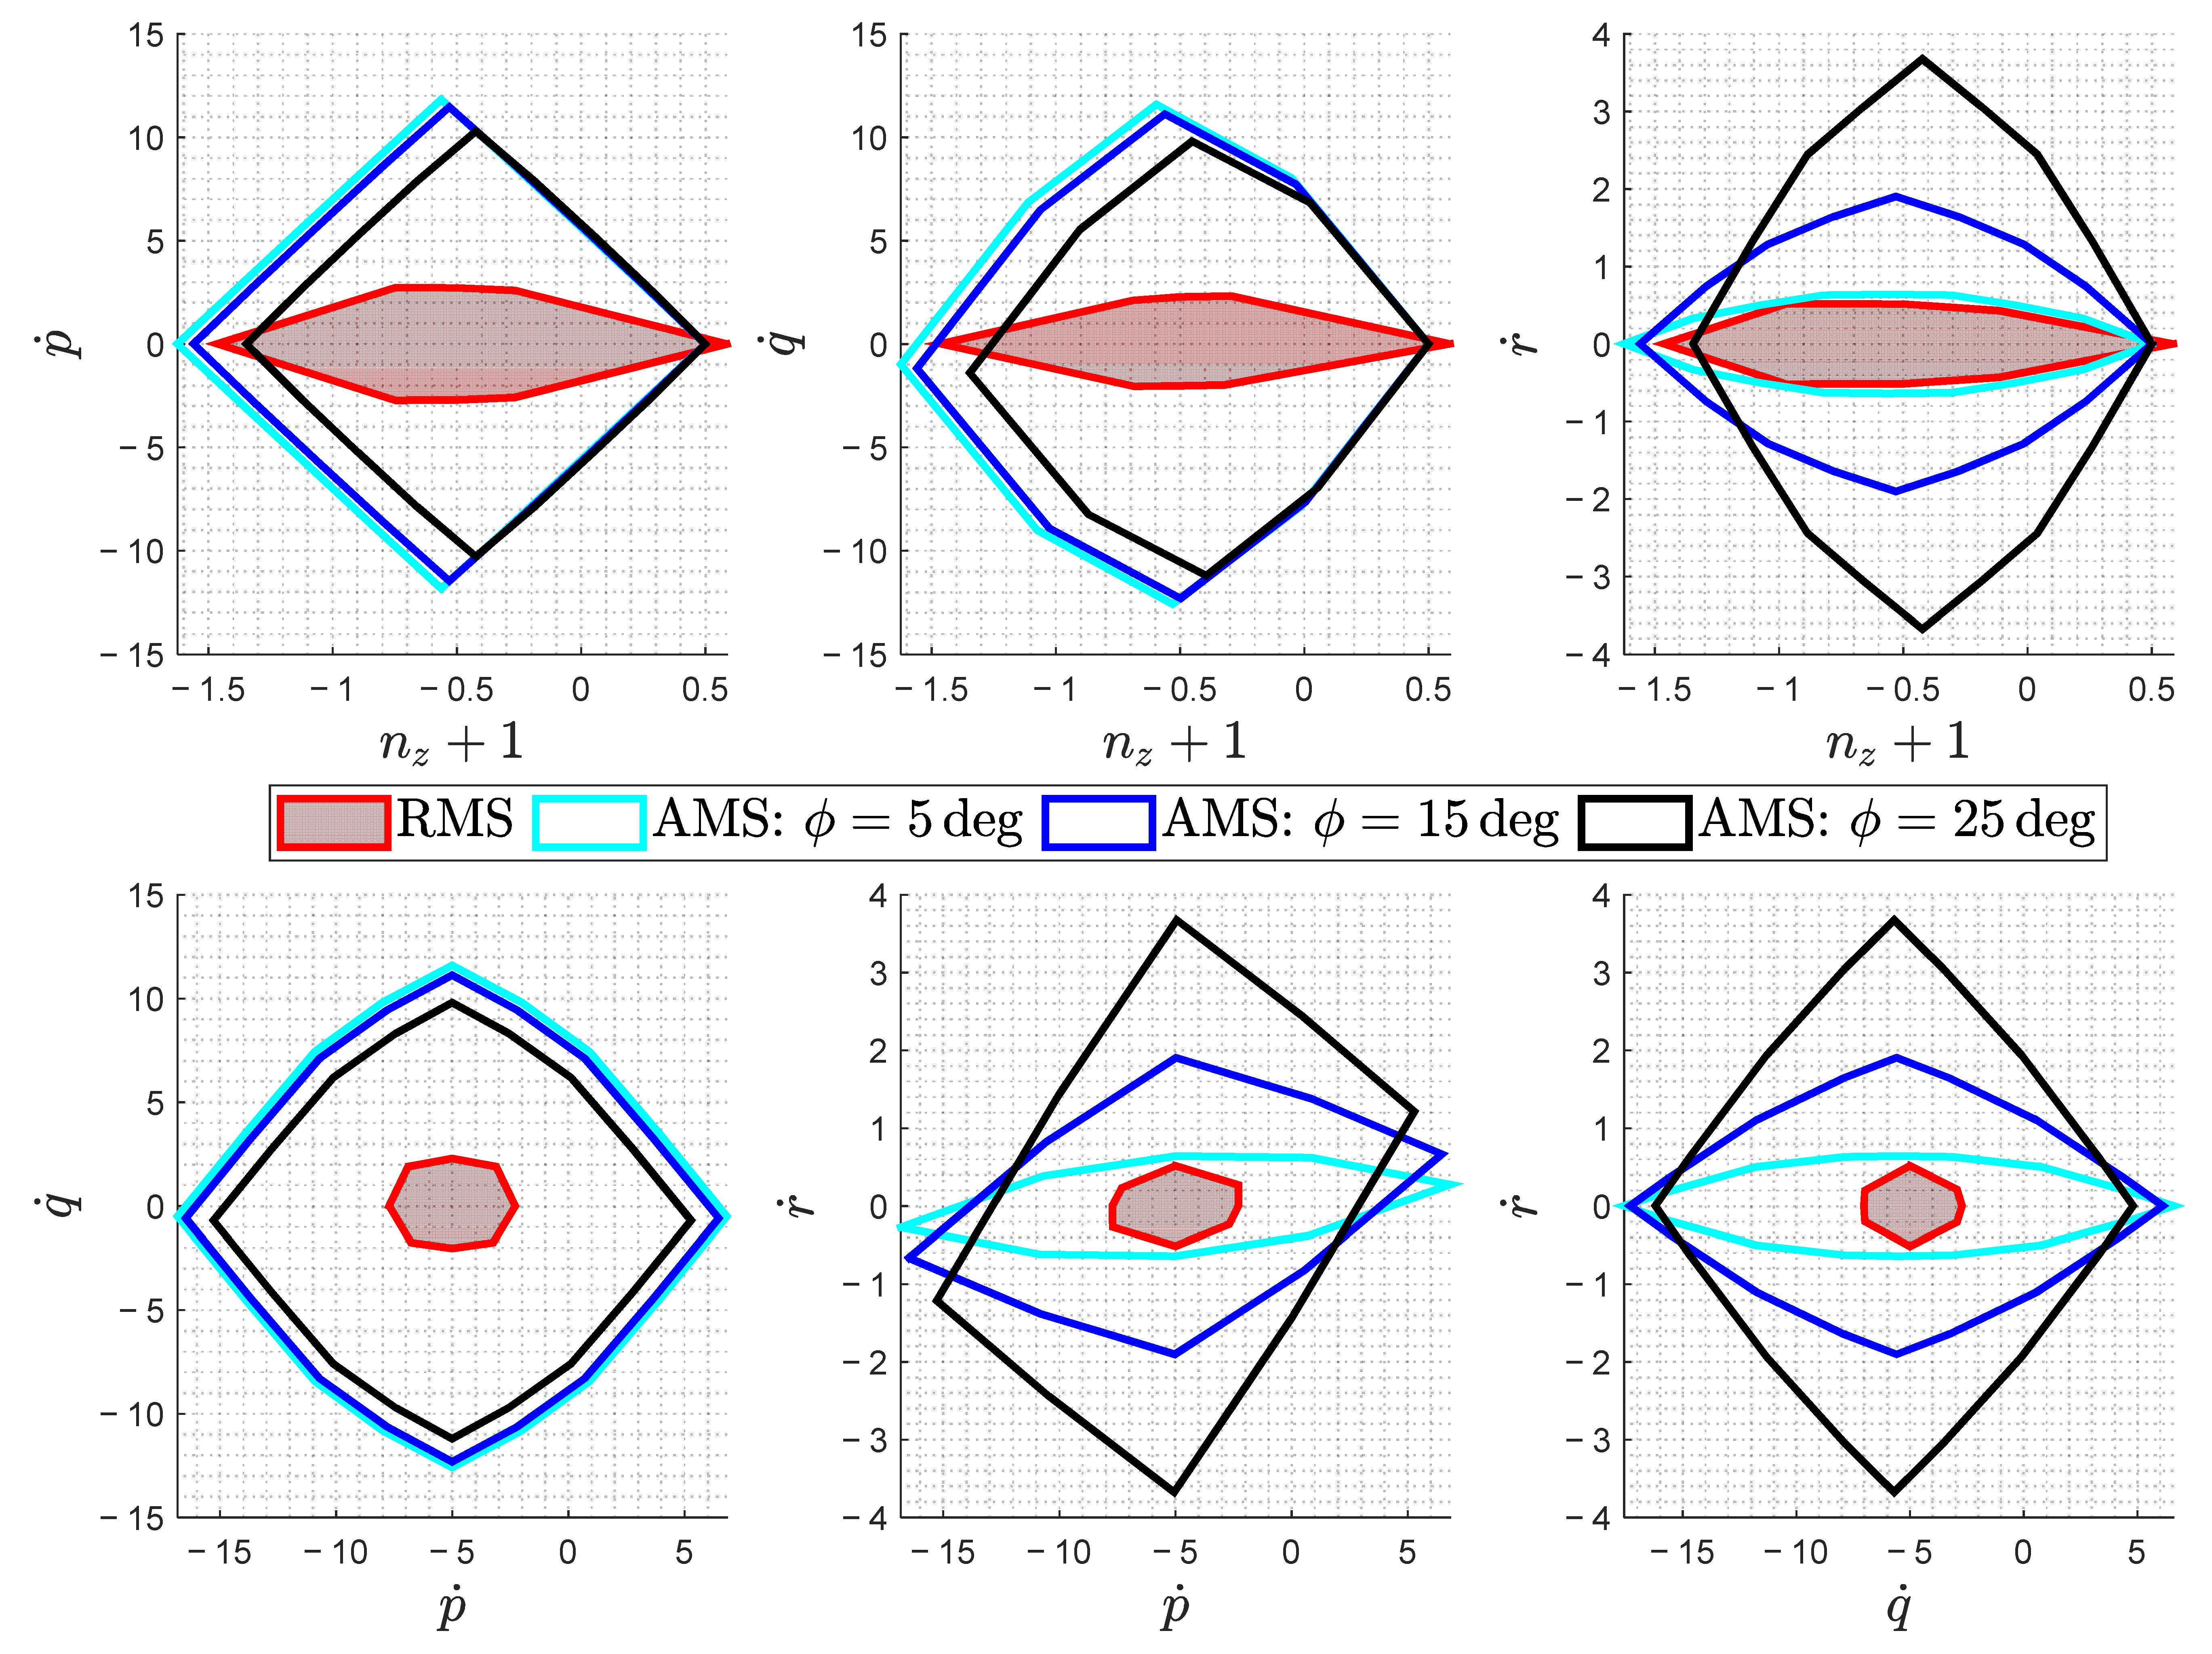
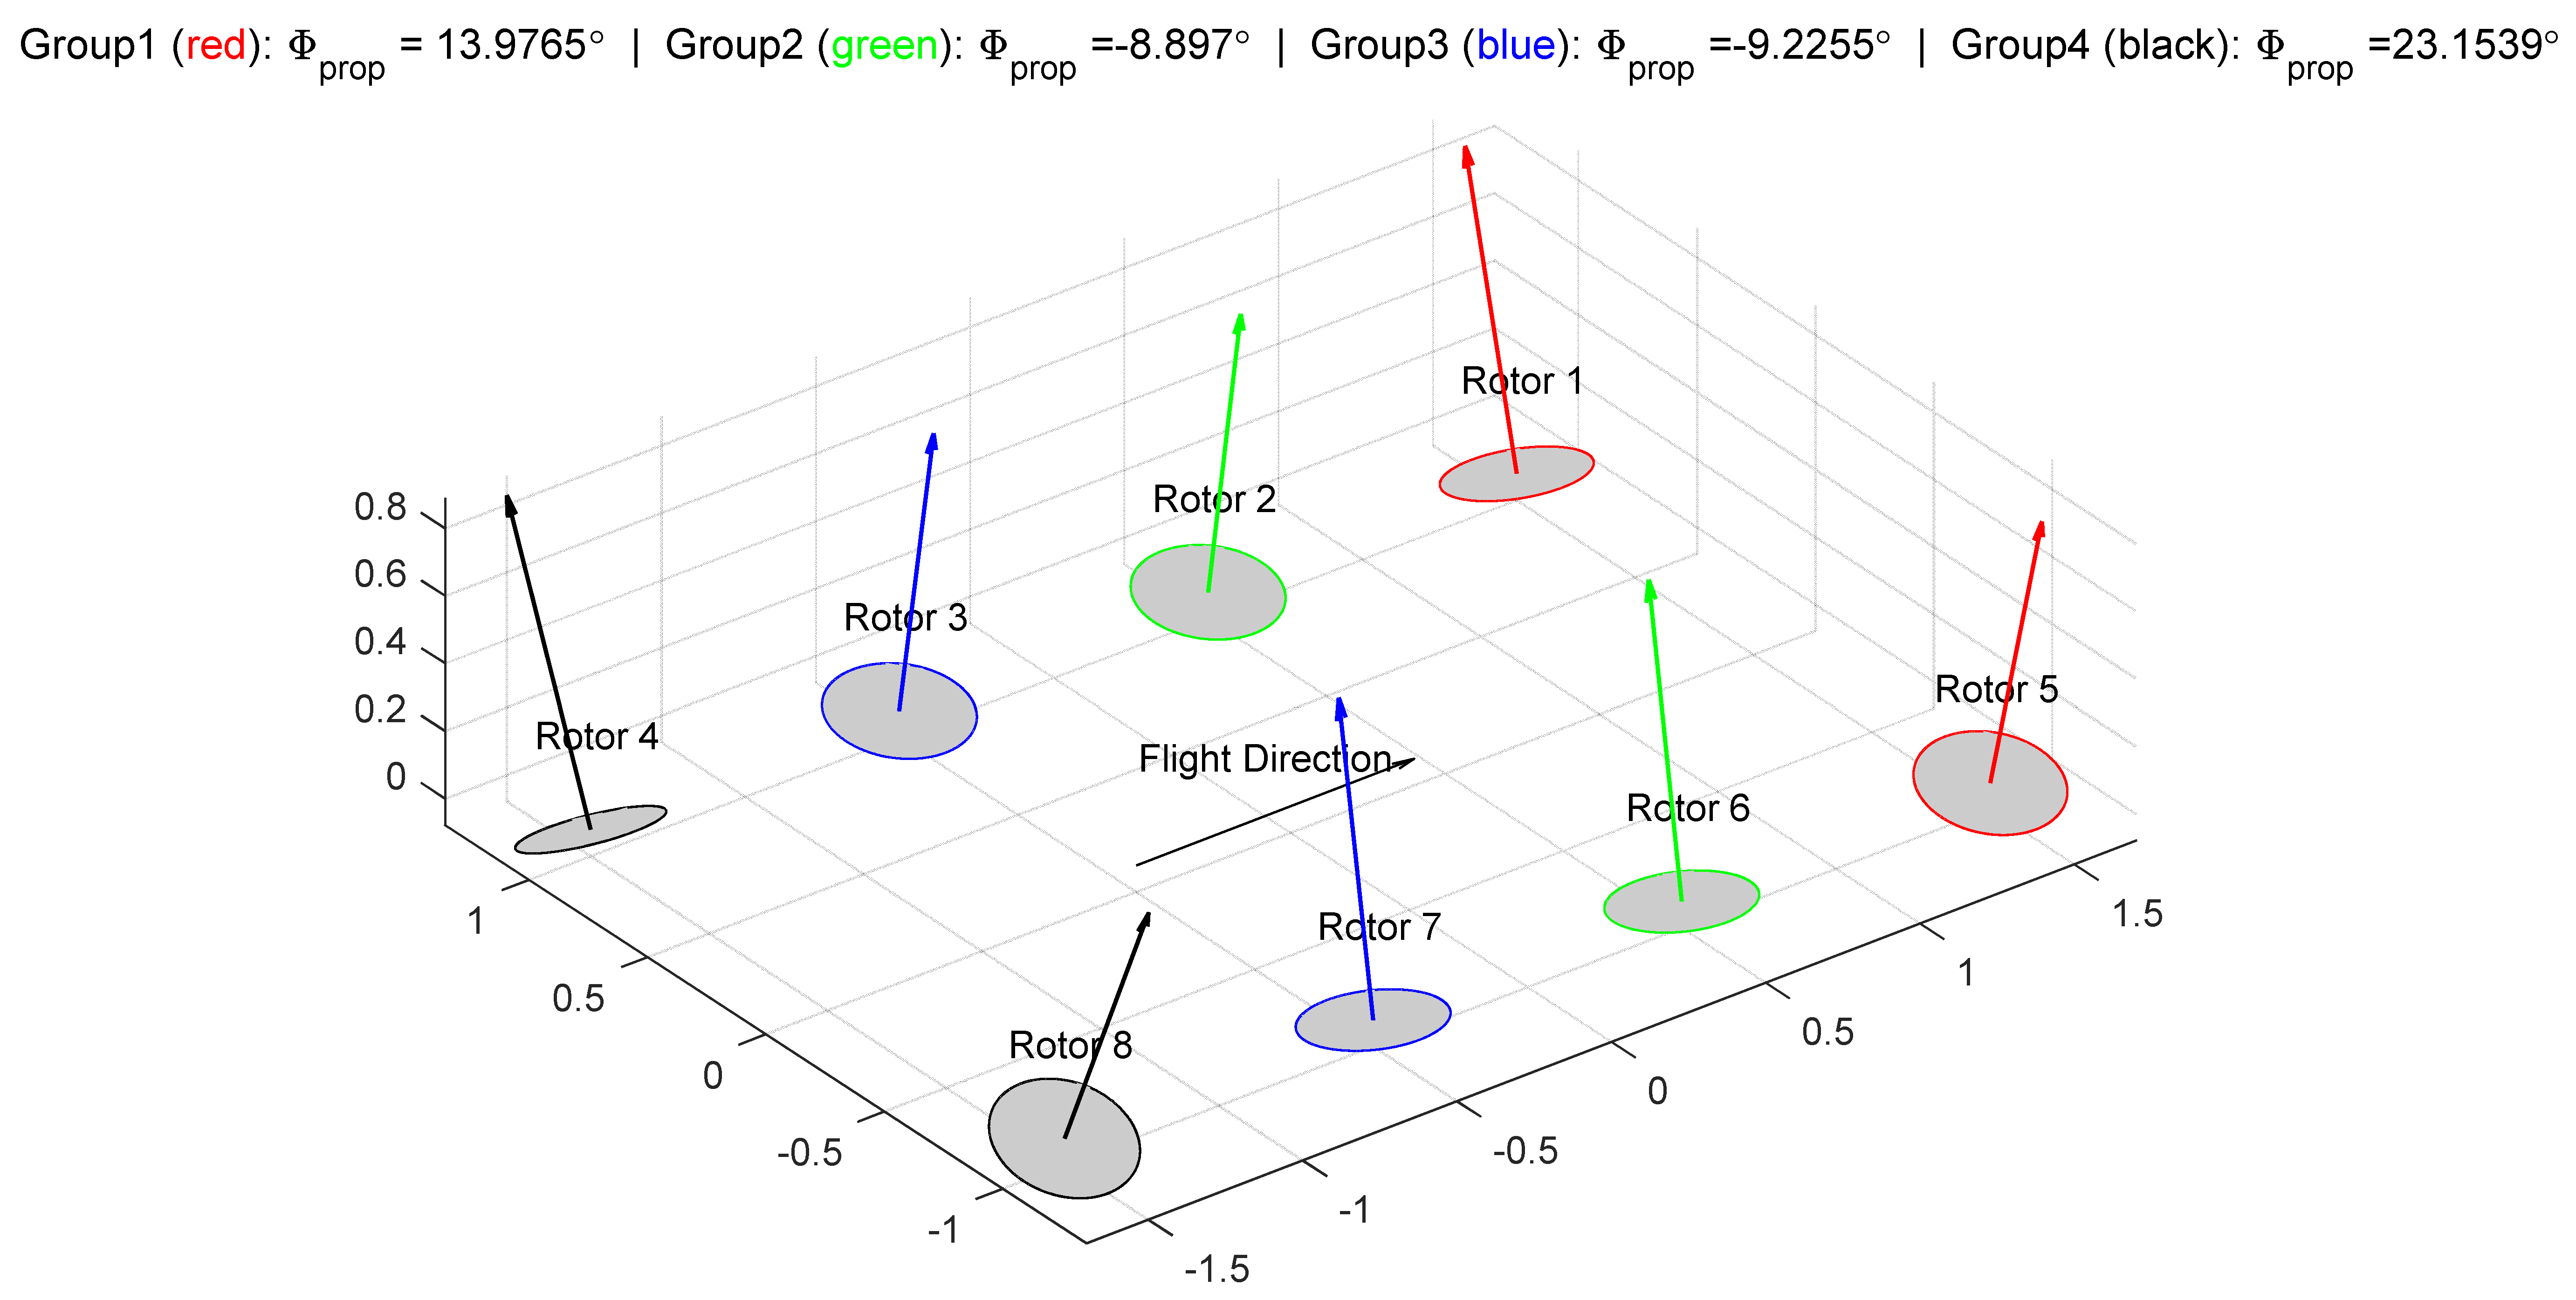
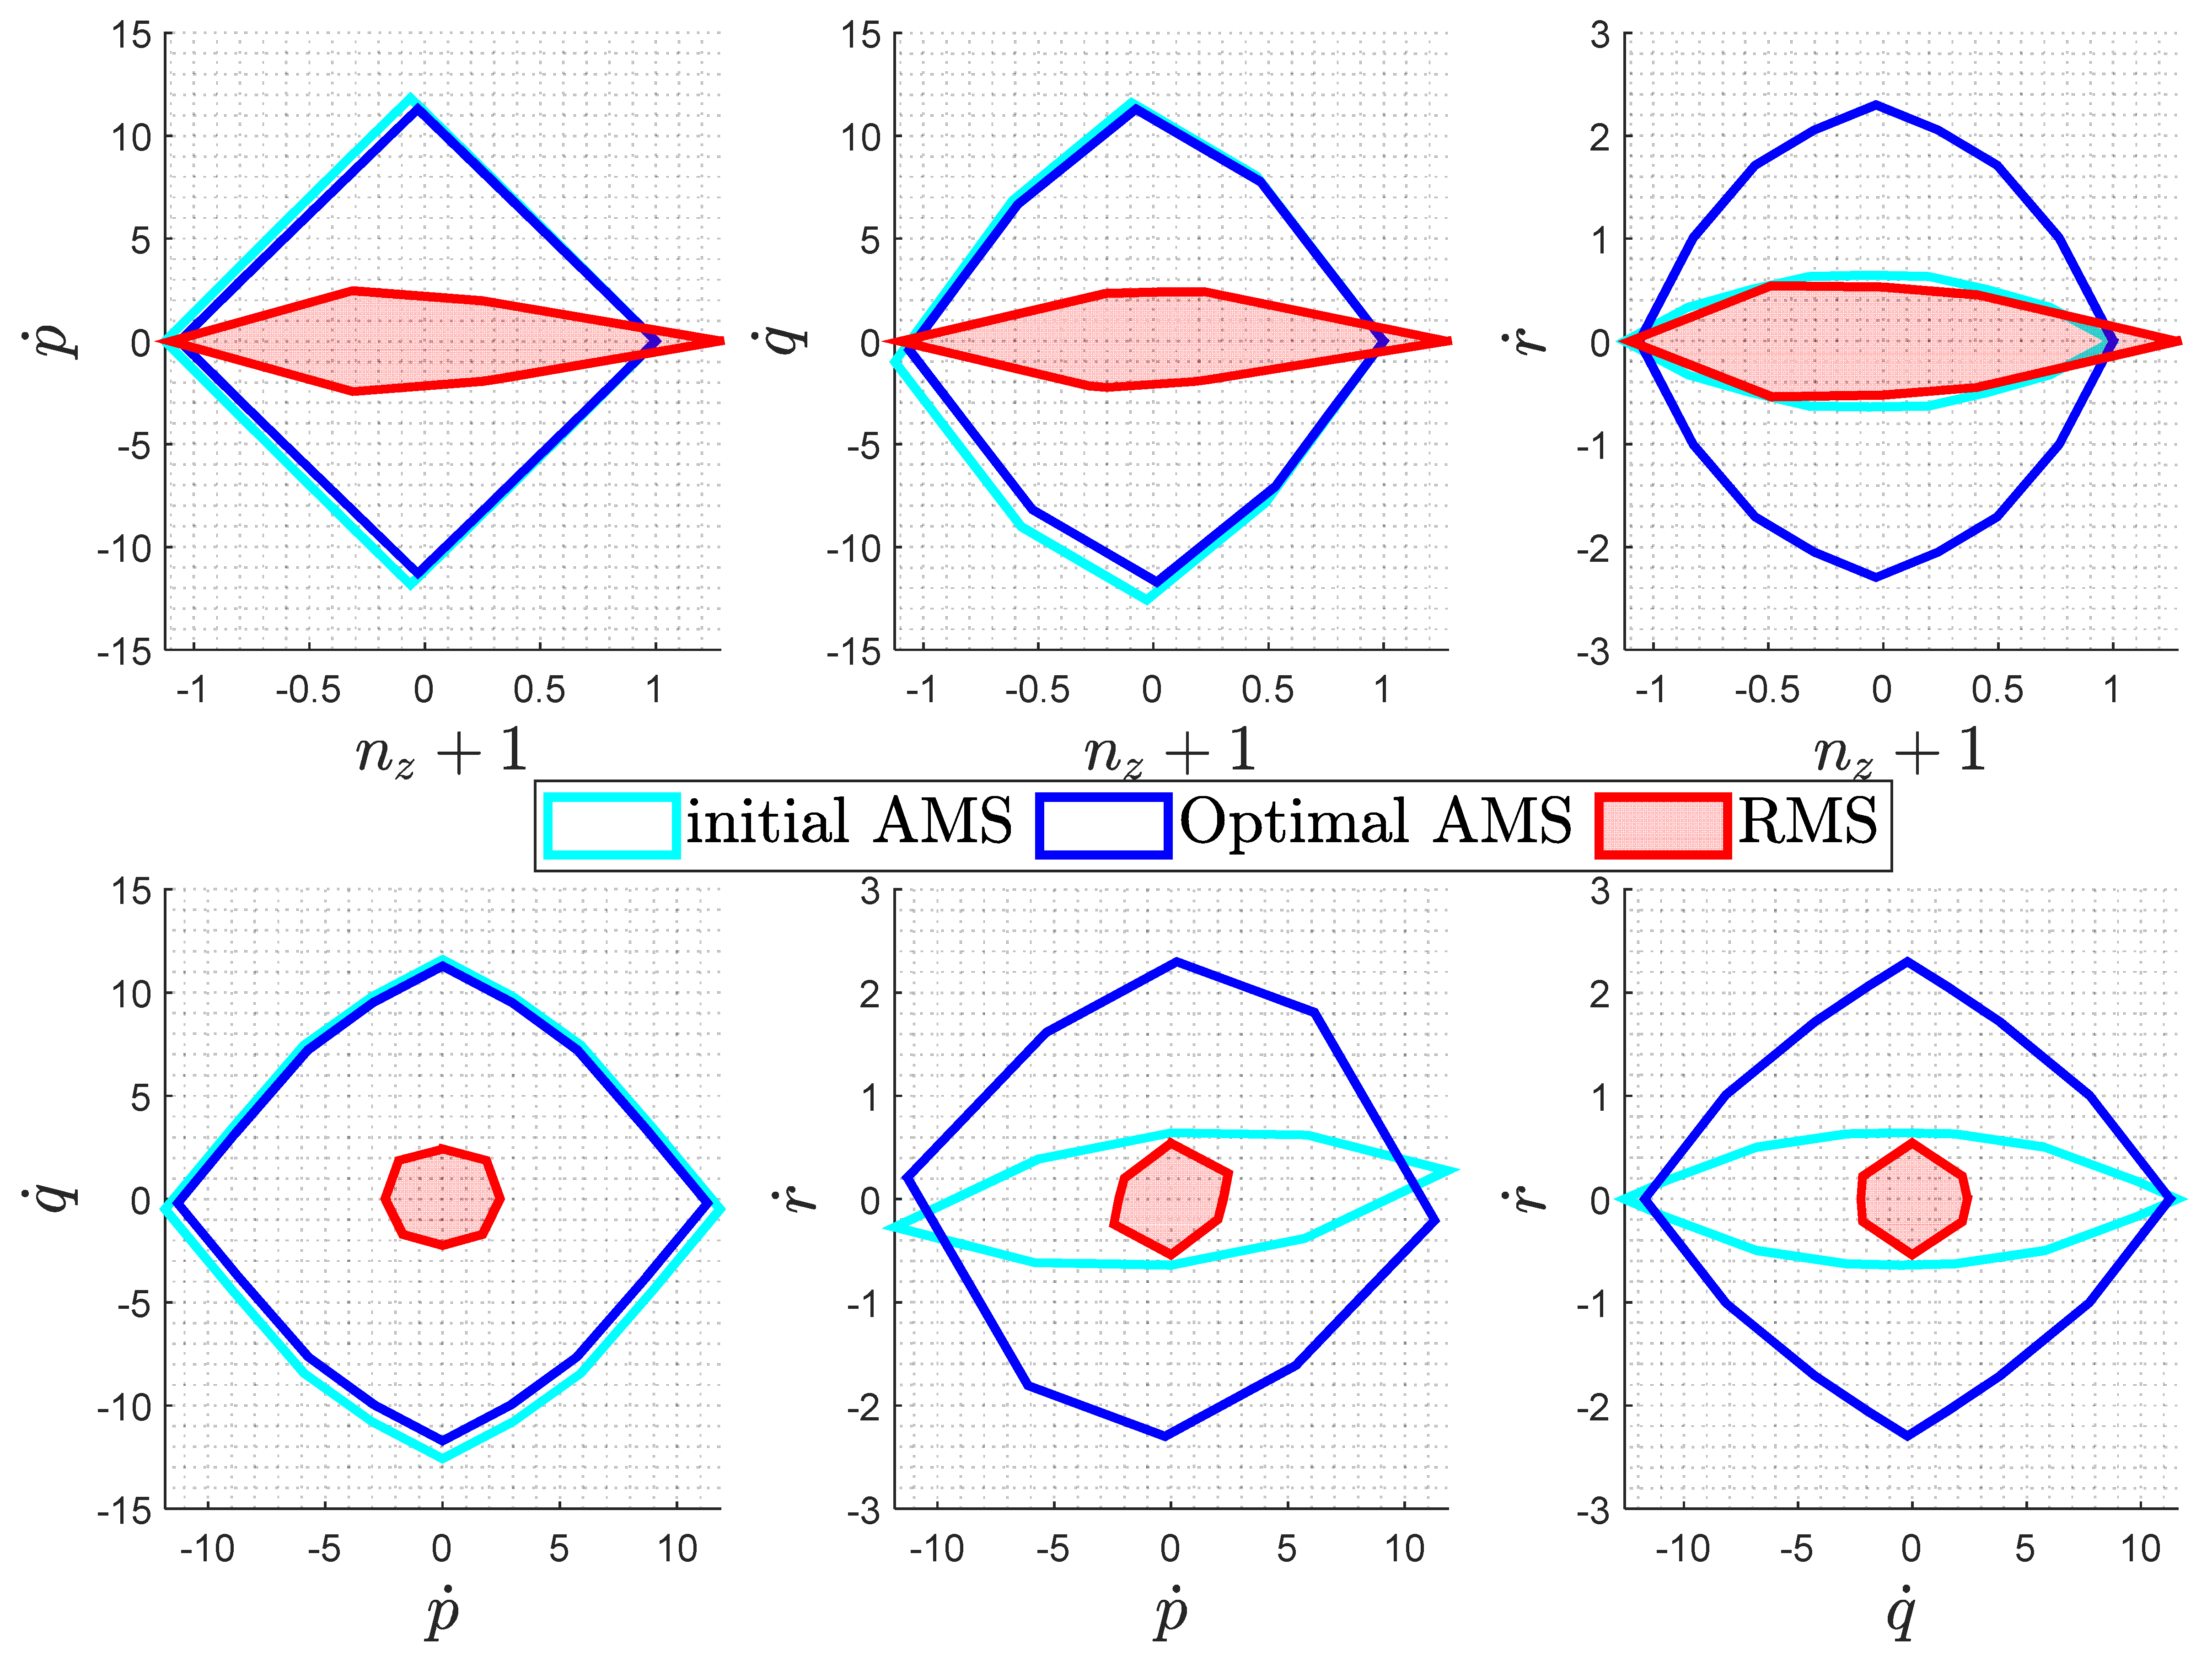
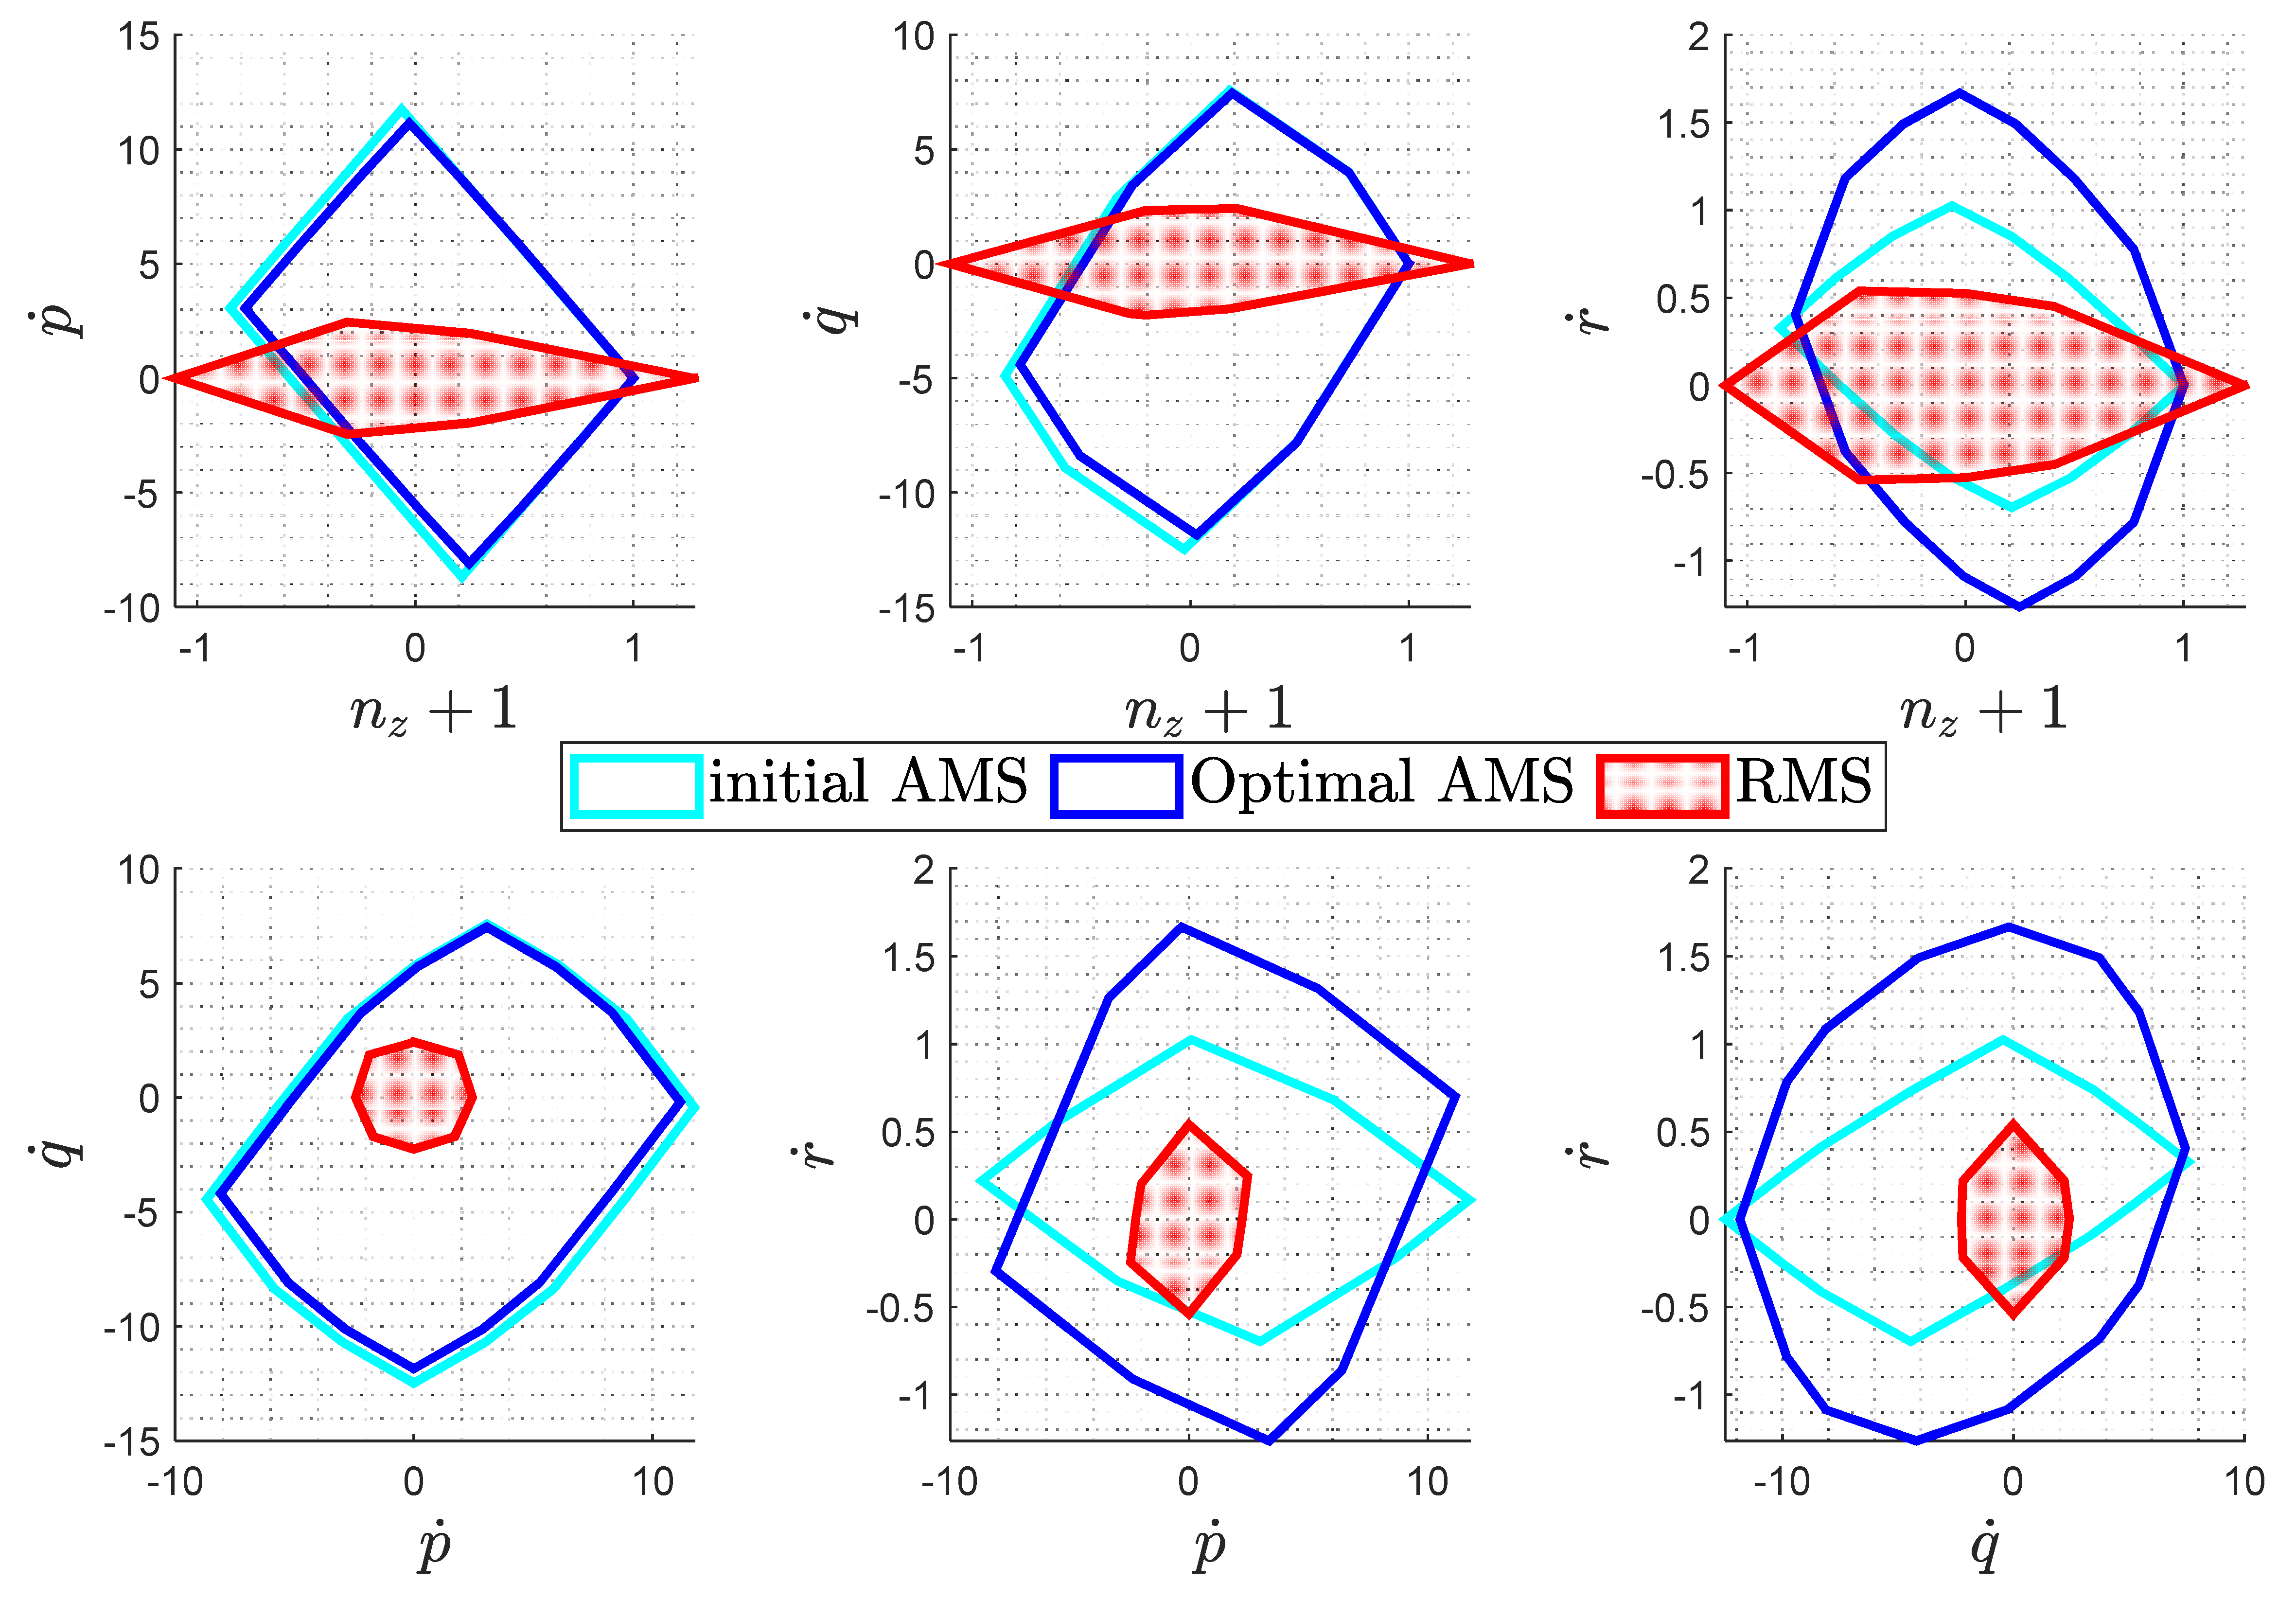
By this definition, we can compute, change, and optimize the AMS by changing ϕ P . A detailed derivation of the AMS by this definition can be found in Ref. [24]. Figure 3 shows the initial design of the rotors and their corresponding tilt orientations in a simplified sketch (where the sizing and positioning of the rotors are not precise). The rotors are each numbered Rotor 1–8, starting from the left column forward to backward to the right column forward to backward. The initial number of ϕ P is designed by engineering tinkering based on simulation and flight experiences, which takes symmetrical value in the degree of ϕ P = 5 , 5 , 5,5 , 5 , 5,5 , 5 T , where positive is defined by the right-hand rule around the positive x B axis. For our test, the RMS of this A/C is derived from [23], which considers maneuverability and disturbance rejection requirements. It is directly used as a priori information. Figure 4 shows how the AMS changes when the magnitude of values in ϕ P changes from 5 ° to 15 ° and 25 ° , respectively, and their comparison with the a priori RMS. Since the problem is inherently 4D, the 4D objects are projected into the 2D plane for presentation, resulting in six 2D figures. It can be seen that the initial design largely fulfills the RMS requirement (by a large percentage of coverage), but with a trivial margin for the yaw control authority. Simply increasing the tilt angles to 25 ° already leads to well-improved yaw control authority with slightly degraded pitch and roll effectiveness, yet also leads to noticeable loss in the available vertical thrust (vertical load factor). To exploit the optimal solution, especially for the critical OEI circumstances, manual tinkering is replaced by rigorous optimization procedures.

4.2. Assumptions

Often in the process of aircraft design, decisions on the control authority are made along with other preliminary parameters such as MTOW, lift-to-weight ratio, and power consumption required. With the proposed method described in Section 3, we can integrate the limits of other preliminary parameters in the constraints c and guarantee that the changes in the controls will not violate the design decisions on other preliminary parameters. To do this, a relatively high-fidelity model is used that accounts for other design domains, such as structural, motor, and battery models. However, in this paper, as a proof of concept, such constraints are not directly accounted for, and it is assumed that the change in tilt angles will not lead to major changes in the preliminary design parameters such as weight and power consumption. It is a valid assumption, since the range of change in tilt angles is confined and leads to negligible lift and power penalty and requires little structural or mass adaptation. In Section 5, an analysis of lift and power penalty are addressed to validate this assumption. Nevertheless, it should be noted that, in a real application, considering other preliminary design parameters in the constraints can result in more realistic outcomes.

4.3. Test Setup

Due to the symmetry of the system considered, the design degree of freedom is 4. Here we start with two-variable optimization by ganging corner rotors in one group and central rotors in another group. This allows us to visually check whether the optimizer has reached the global optimum. In total, four sets of tests are set up and the results are given in the next section. Recalling that we use p as tunable parameters in Equations (2) and (3), and the four tests are defined as:
  • Two-variable failure-free test as Equation (2), with
    p 1 = ϕ 1 = ϕ 4 = ϕ 5 = ϕ 8 ,   p 2 = ϕ 2 = ϕ 3 = ϕ 6 = ϕ 7 ,
  • Two-variable failure-free test as Equation (2), with
    p 1 = ϕ 1 = ϕ 5 ,   p 2 = ϕ 2 = ϕ 6 ,   p 3 = ϕ 3 = ϕ 7 ,   p 4 = ϕ 4 = ϕ 8 ,
  • Same grouping as Test 1, including critical OEI according to Equation (3);
  • Same grouping as Test 2, including critical OEI according to Equation (3).
Limits on ϕ are chosen to be [ 30 ° ,   30 ° ] . For the assumptions elaborated in the previous part, no constraints as c , which appear in Equations (2) and (3), are included in the optimization.

5. Optimization Results

5.1. Optimization Results—Failure-Free Cases

In this part, two groups of results for the failure-free optimization according to Equation (2) are presented: one group for two-variable and the other for four-variable optimization.
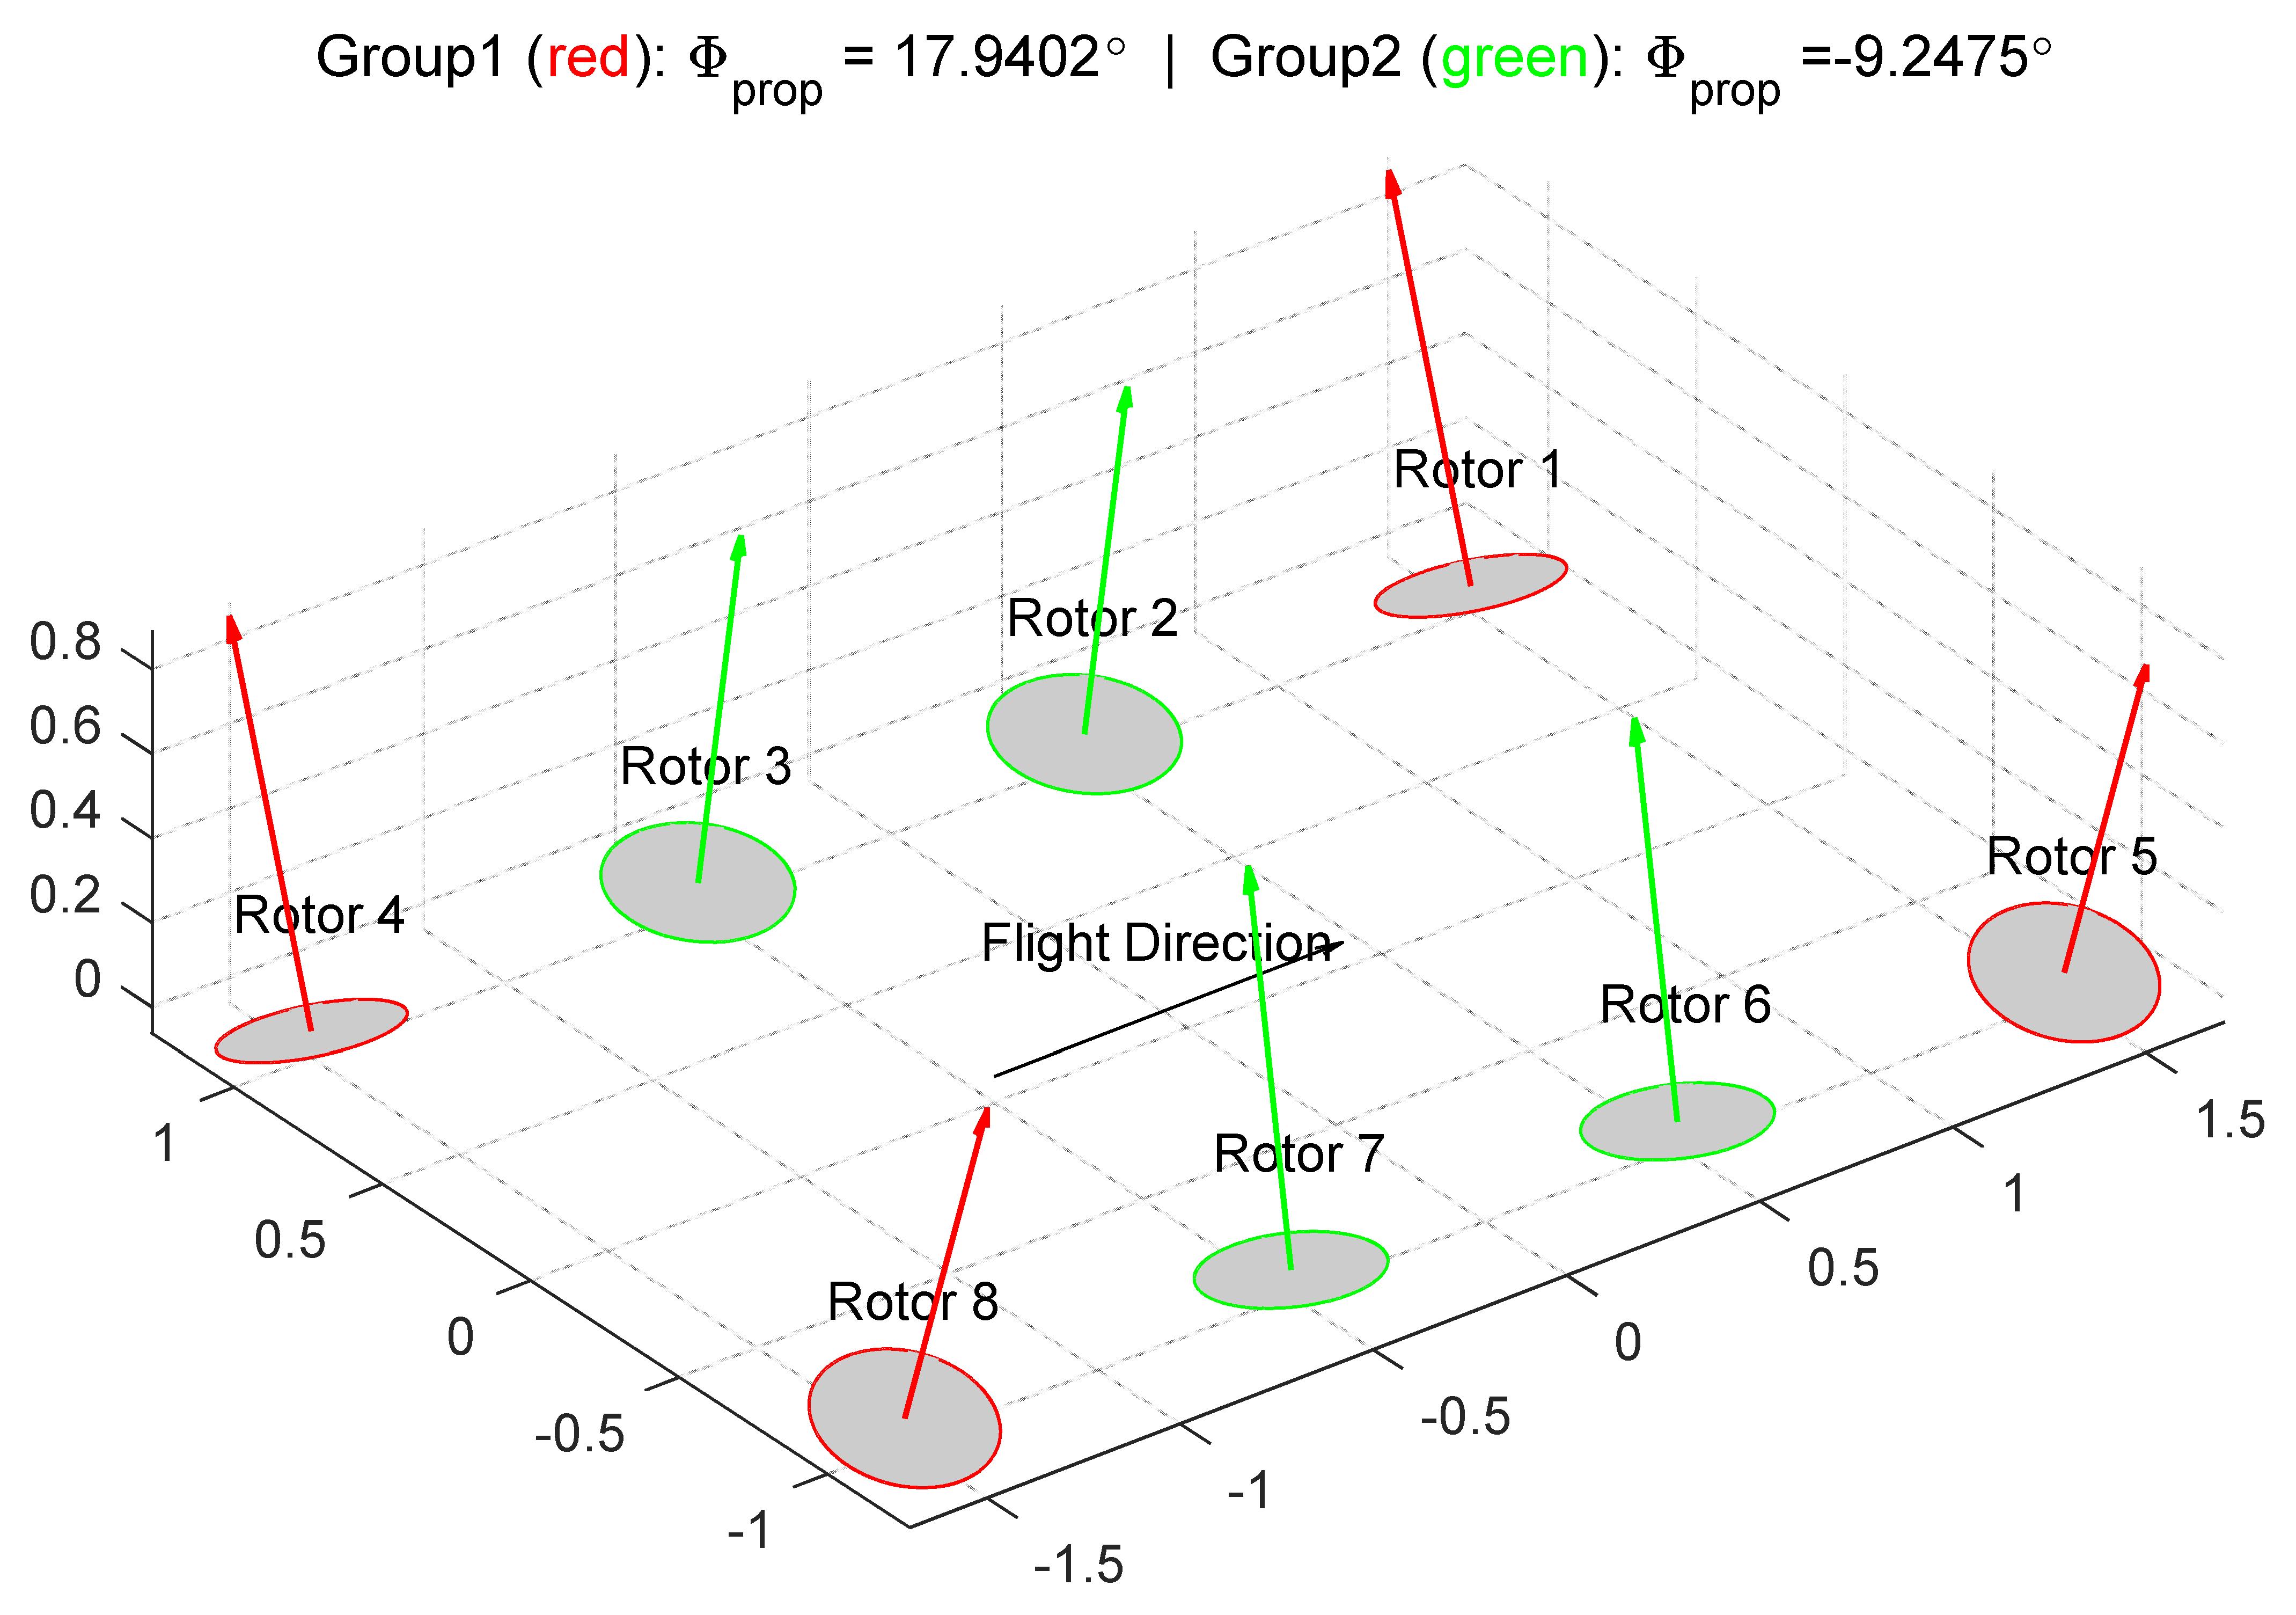
Test 1: Failure-free two-variable optimization, as described by Equation (7). The reason for this method of grouping is that the corner rotors have longer lever arms and can better produce moments, while the ability of the inner rotors produce moments is relatively weak. The intuition is, therefore, to use the corner rotors to produce larger moments and use the inner ones as major lift producers. This two-variable test enables us to check whether the optimization finds the actual global optimum by directly plotting the cost function over the two variables.
The optimization results for this test are shown in Figure 5, Figure 6, Figure 7 and Figure 8. Firstly, the rotor arrangement of the optimal solution is shown in Figure 5. The optimization result aligns well with the intuition behind the method of grouping, with the corner rotors more tilted for larger moments and the inner ones relatively vertical as a major vertical thrust producer.
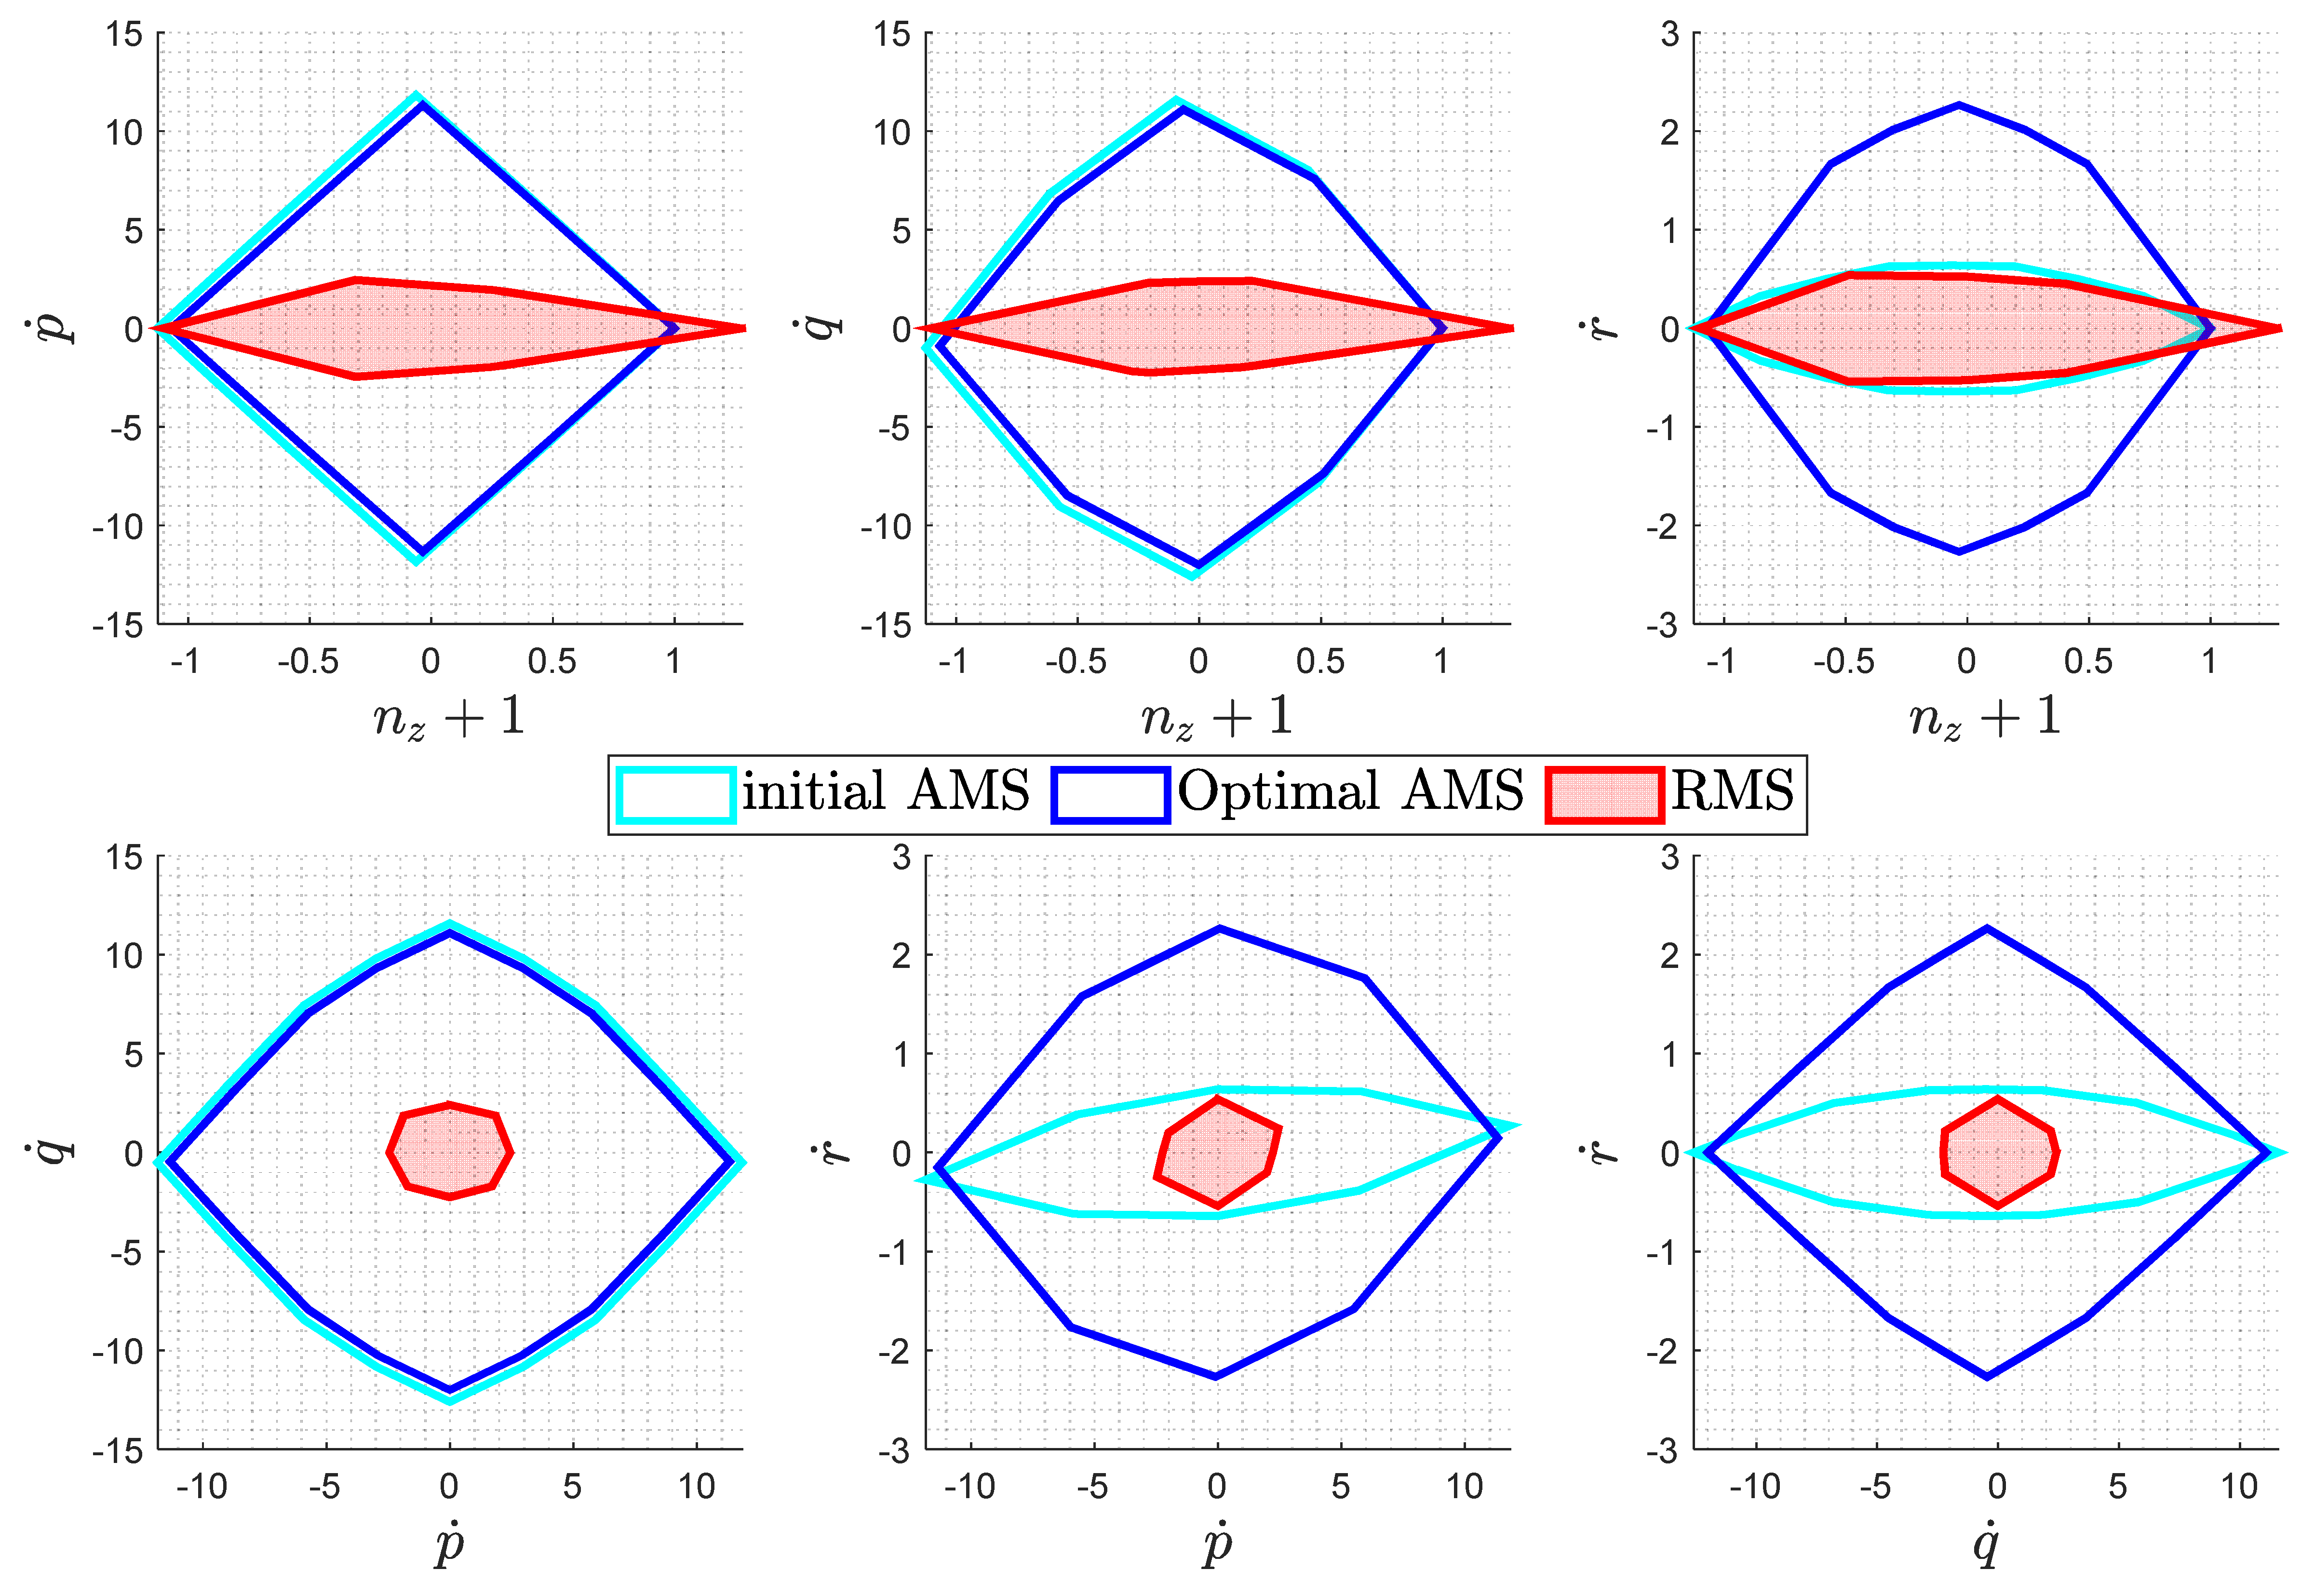
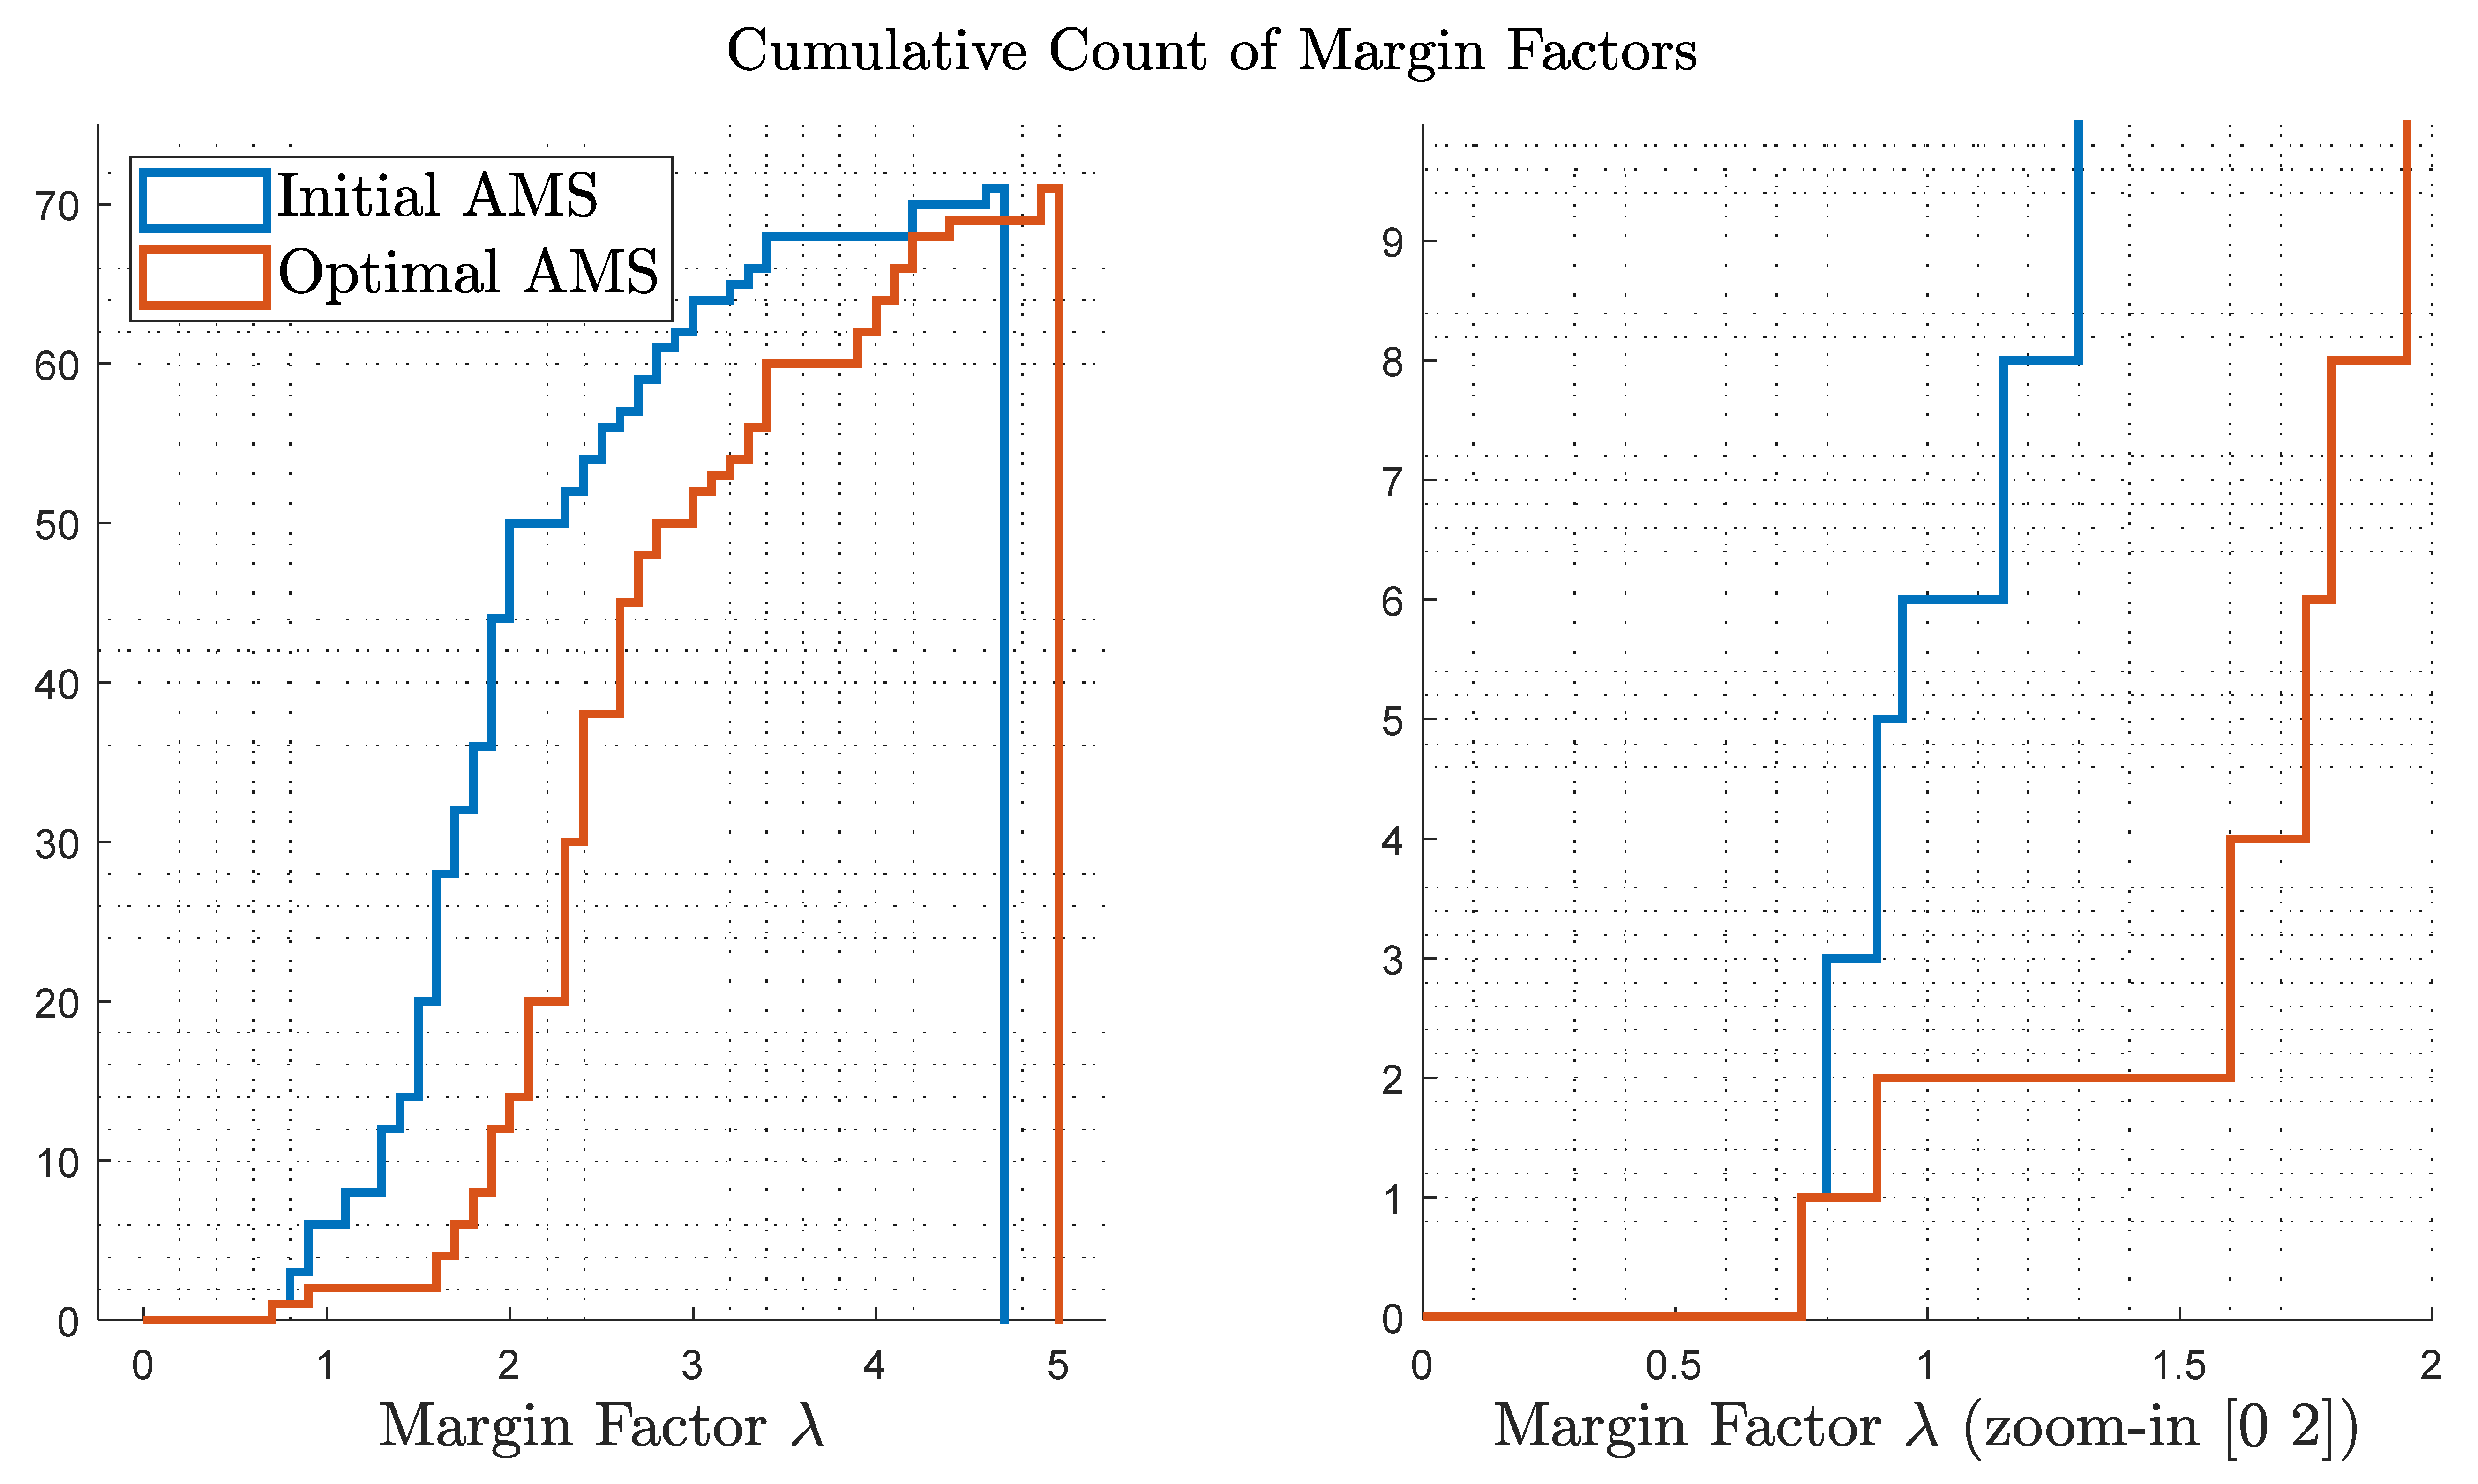
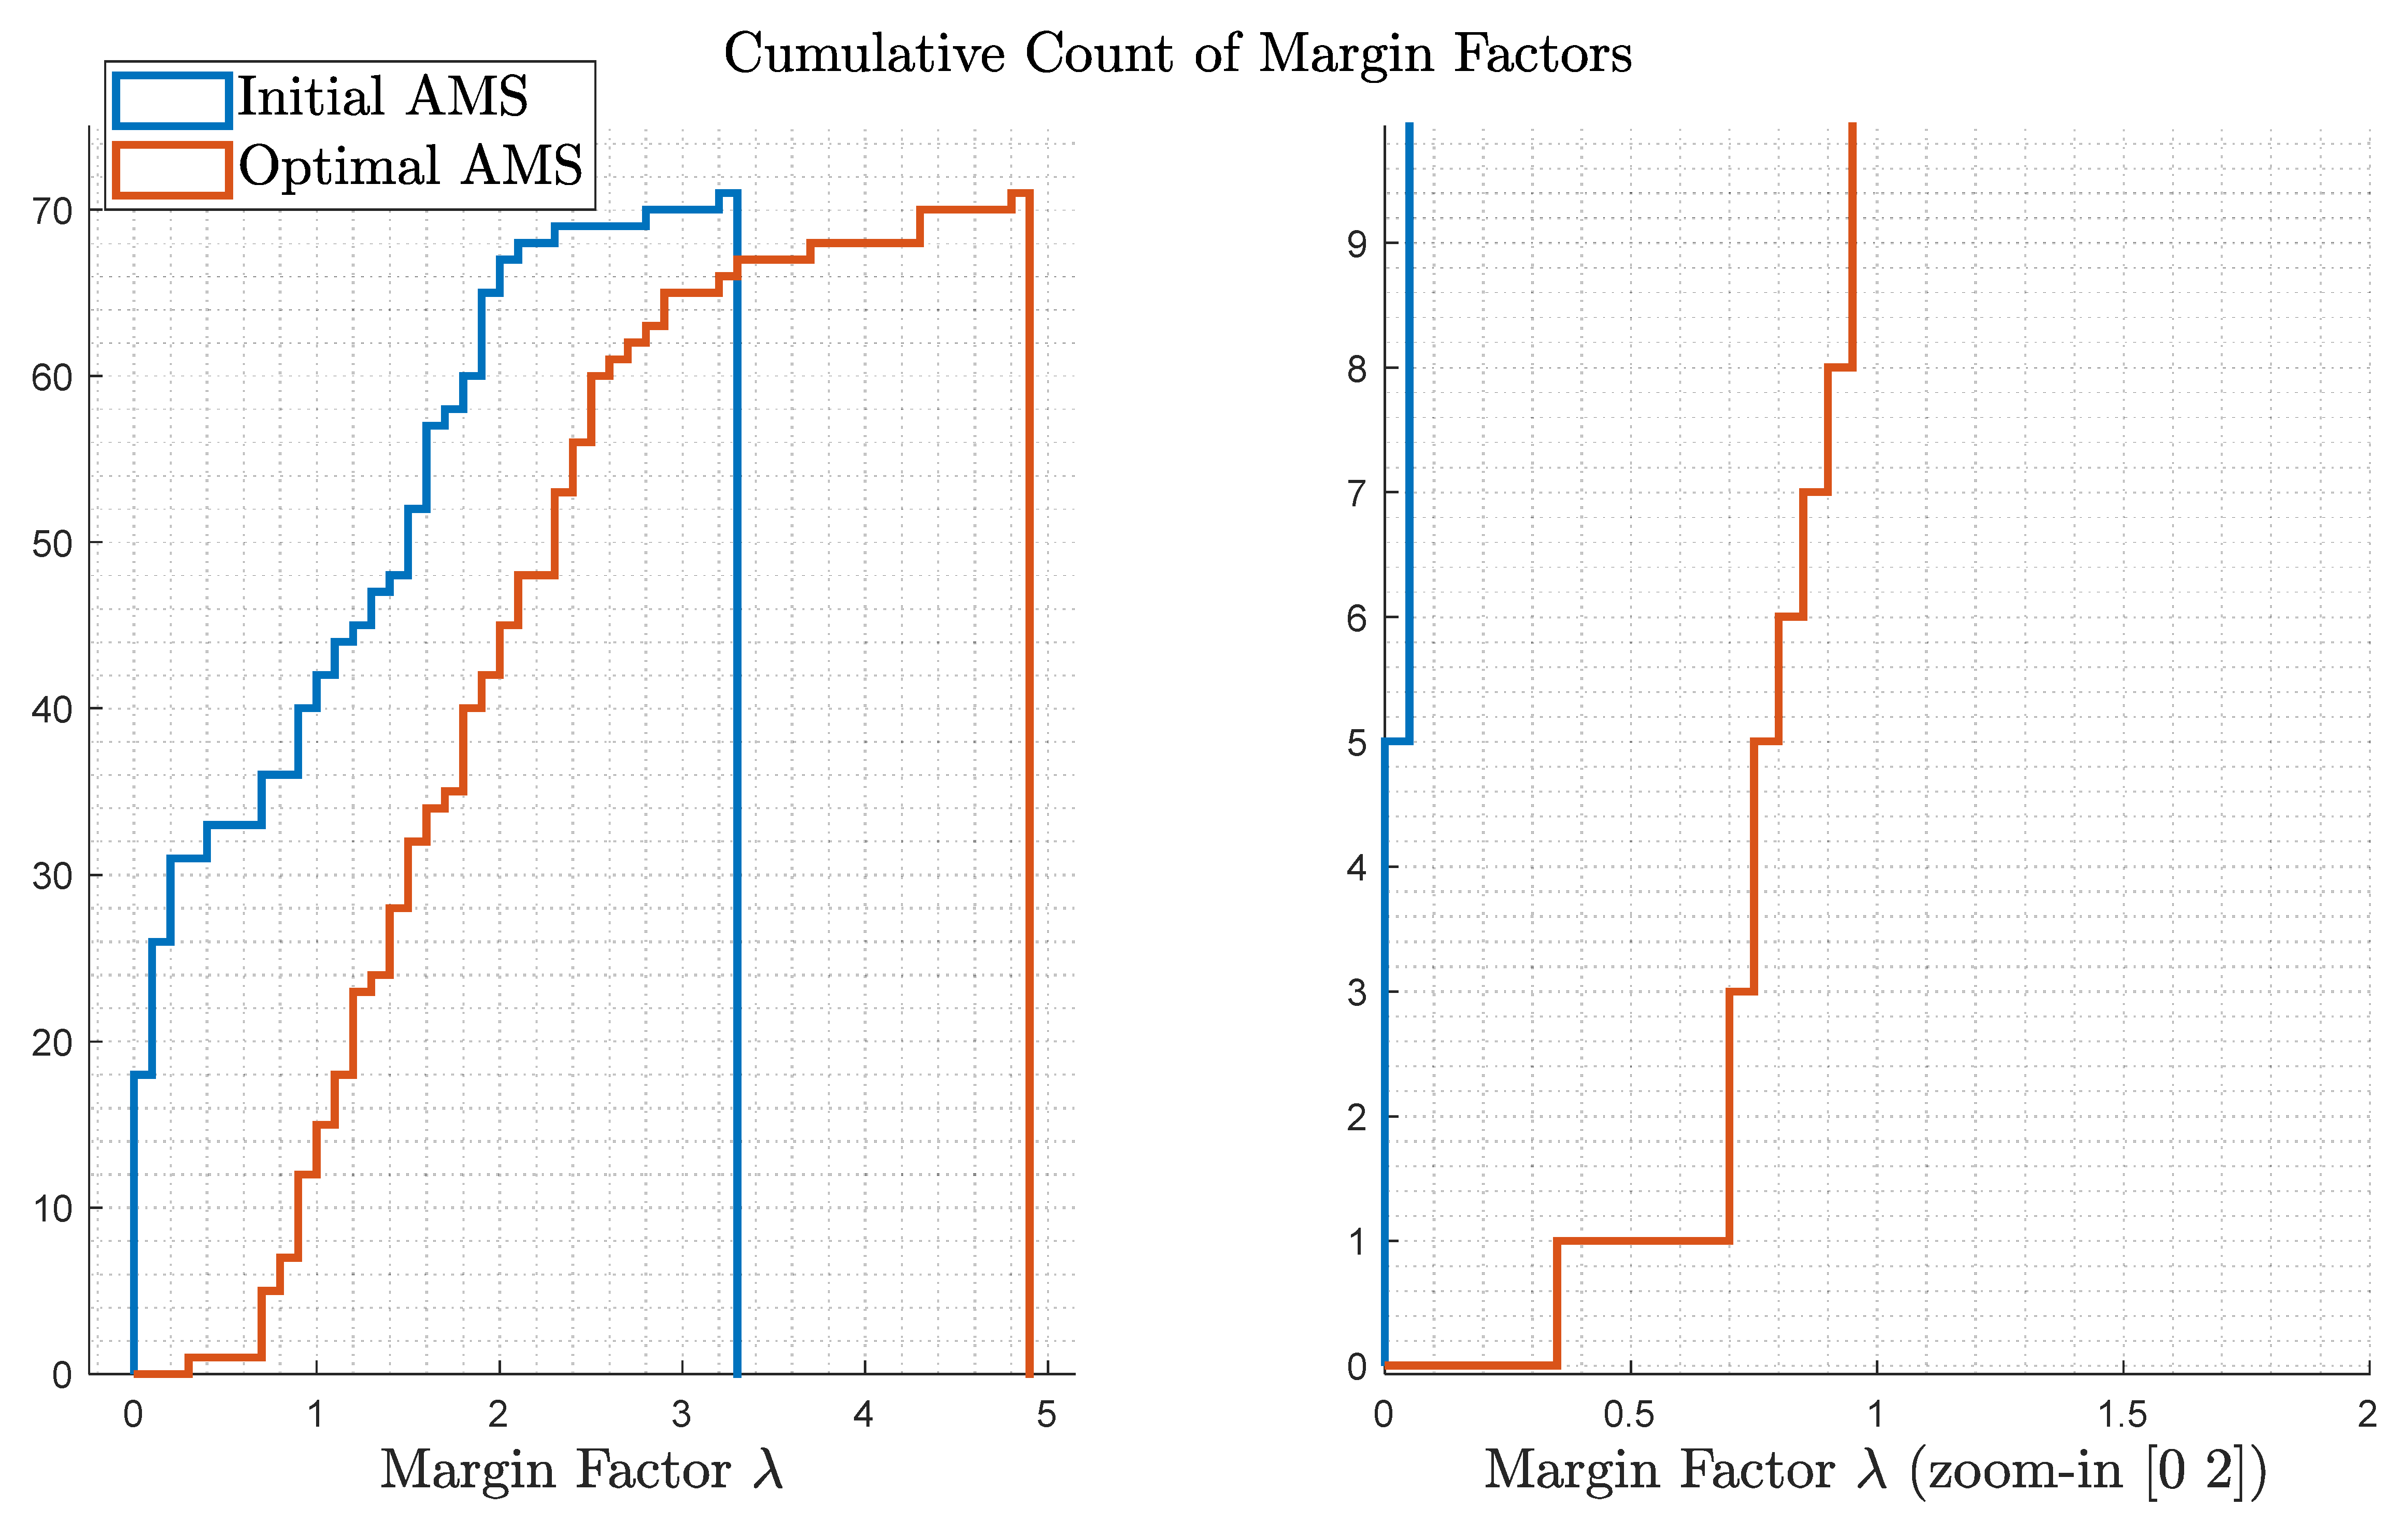
A direct comparison of the RMS and the initial and optimal AMS is depicted in Figure 6. The optimal configuration presents twice as much yaw authority as the initial design, with minor sacrifices in the other axes. Figure 7 shows the cumulative count of the margin factor λ , as defined in Equations (2) and (3). On the left, a comparison of λ for the initial and optimal AMS is provided; on the right, the figure is zoomed in to show the most critical cases, e.g., the points with the smallest margins. Considering that a margin of 1.5 is sufficient from an engineering rule of thumb, the optimal case only presents 2 points with its margin less than 1.5, while the initial design presents more than 10 cases.
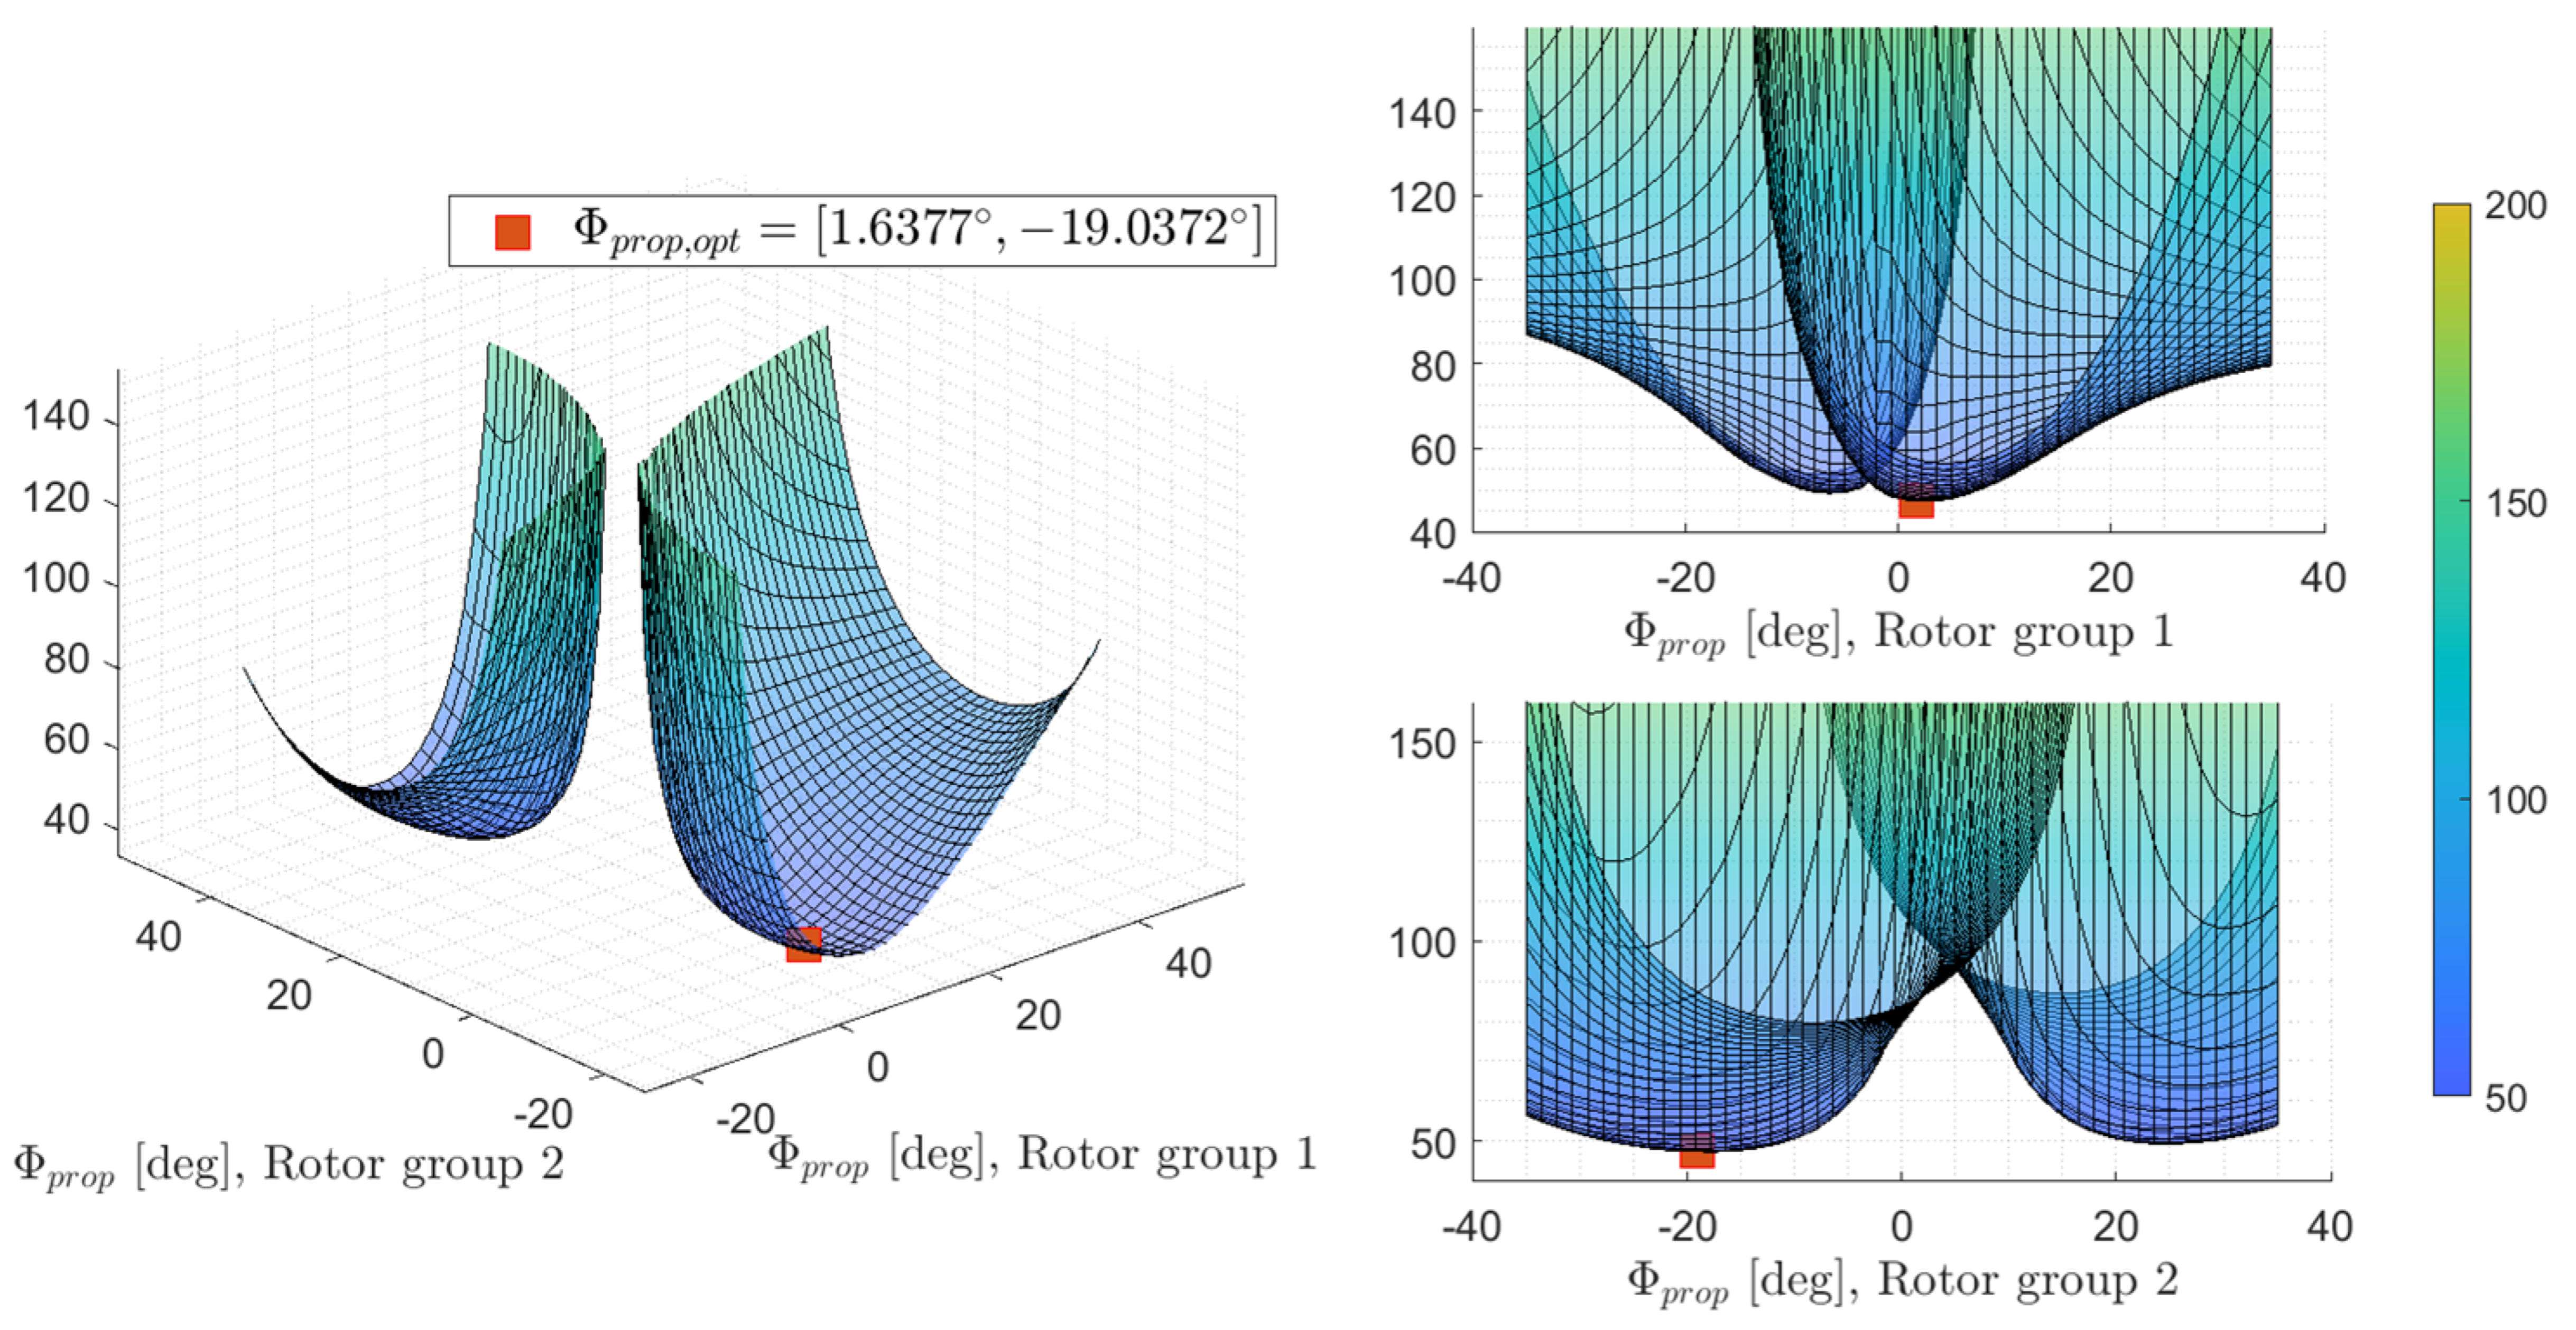
To show that the optimization converges to the global minimum, Figure 8 plots the cost function as a function of the two optimization variables. It can be clearly seen that the global optimum has been reached by optimization, as shown by the red marker. What is also obvious in Figure 8 is that, when both variables are 0, the system shows a singularity in the cost function, indicating a complete loss of control in at least one direction in the generalized moment space. For this failure-free case, good overall control authority can be achieved when both angles’ absolute values are between 5 ° and 30 ° .
Test 2: Failure-free four-variable optimization, as in Equation (8), in which the four variables represent the angles of the two symmetric rotors in each row. The results are given in Figure 9, Figure 10 and Figure 11. Similar outcomes can be drawn from the results produced by Test 1. It can be observed that the resultant rotor configuration is not symmetric with respect to the CG (otherwise four-variable optimization would be meaningless).

5.2. Optimization Results—Critical Failure Case

In this part, the results of the critical failure optimization according to Equation (2) are presented; one for two-dimensional and the other for four-dimensional optimization.
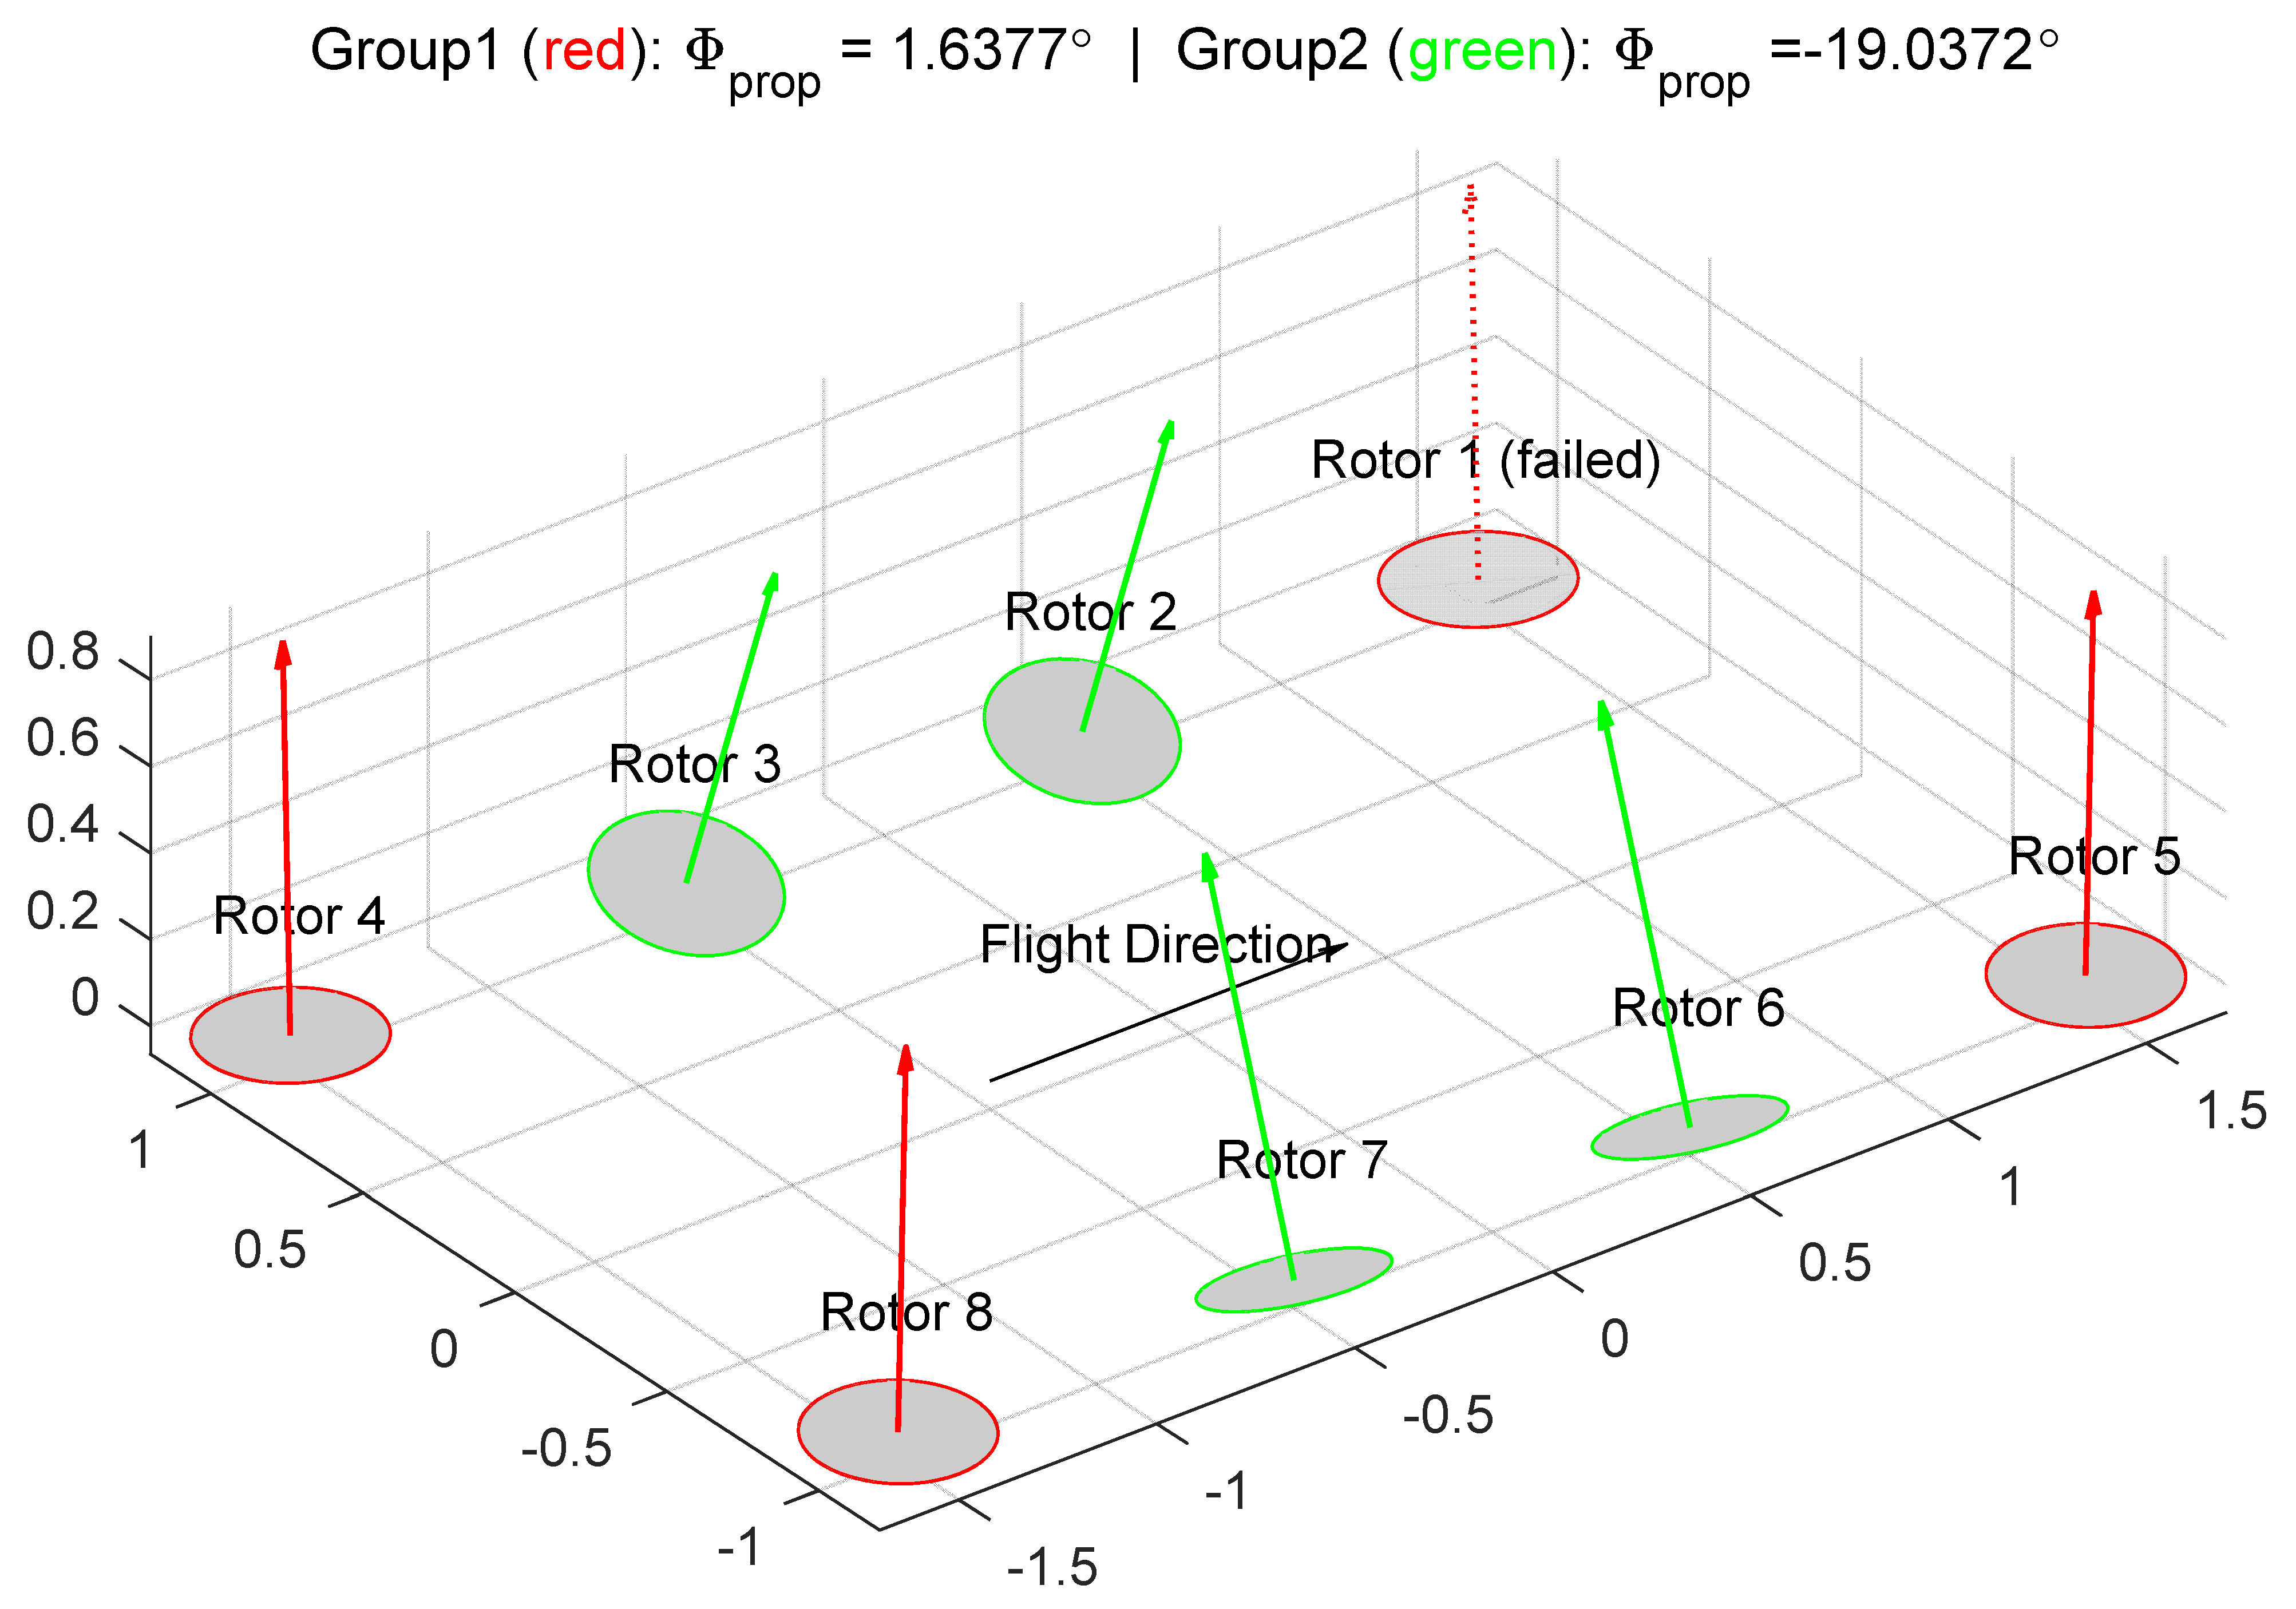
Test 3: A repeat grouping of Test 1, but considers a critical rotor failure according to Equation (3). The results are displayed in Figure 12, Figure 13, Figure 14 and Figure 15. Rotor 1 is found to be critical, which leads to the highest punishment in the cost function, and is therefore marked “Failed” with the dotted line in Figure 12. Major differences could be observed when compared to the failure-free case of Test 1. Firstly, the corner rotors, instead of being tilted more than the centric rotors, are positioned almost vertically with just a slight angle of 1.6 ° . The rationale behind this is that, as a critical rotor whose failure can lead to worst-case reduced control authority, it is essential to balance out the authority and avoid reliance on the critical rotor in all four axes; positioning the critical rotor vertically reduced its contribution on the yaw axis, which is a relatively “weak” axis. As a result, the yaw control authorities are all allocated to the inner ones, whose pitch and roll authorities are lower due to the shorter lever arms. In other words, this layout averages out the criticality of the corner rotors by allowing the center rotors to take over more yaw responsibility. Although, in this case, the system does not present optimal authority as compared to the failure-free Test 1 results (Test 1’s optimization delivers a lower value of the cost function according to Equation (2)), the optimized configuration in this test shows better controllability once a critical failure occurs.
Figure 13 compares the initial AMS, optimal AMS, and RMS for this test. The AMSs are different from those of Figure 10, since the critical rotor (Rotor 1) is removed from the control set, therefore leading to deteriorated AMSs compared to failure-free AMSs. While the initial configuration exhibits major degradation in the yaw moment with the critical failure, the optimized configuration largely compensates for this drawback, and the authorities in the other axes are preserved with minor differences.
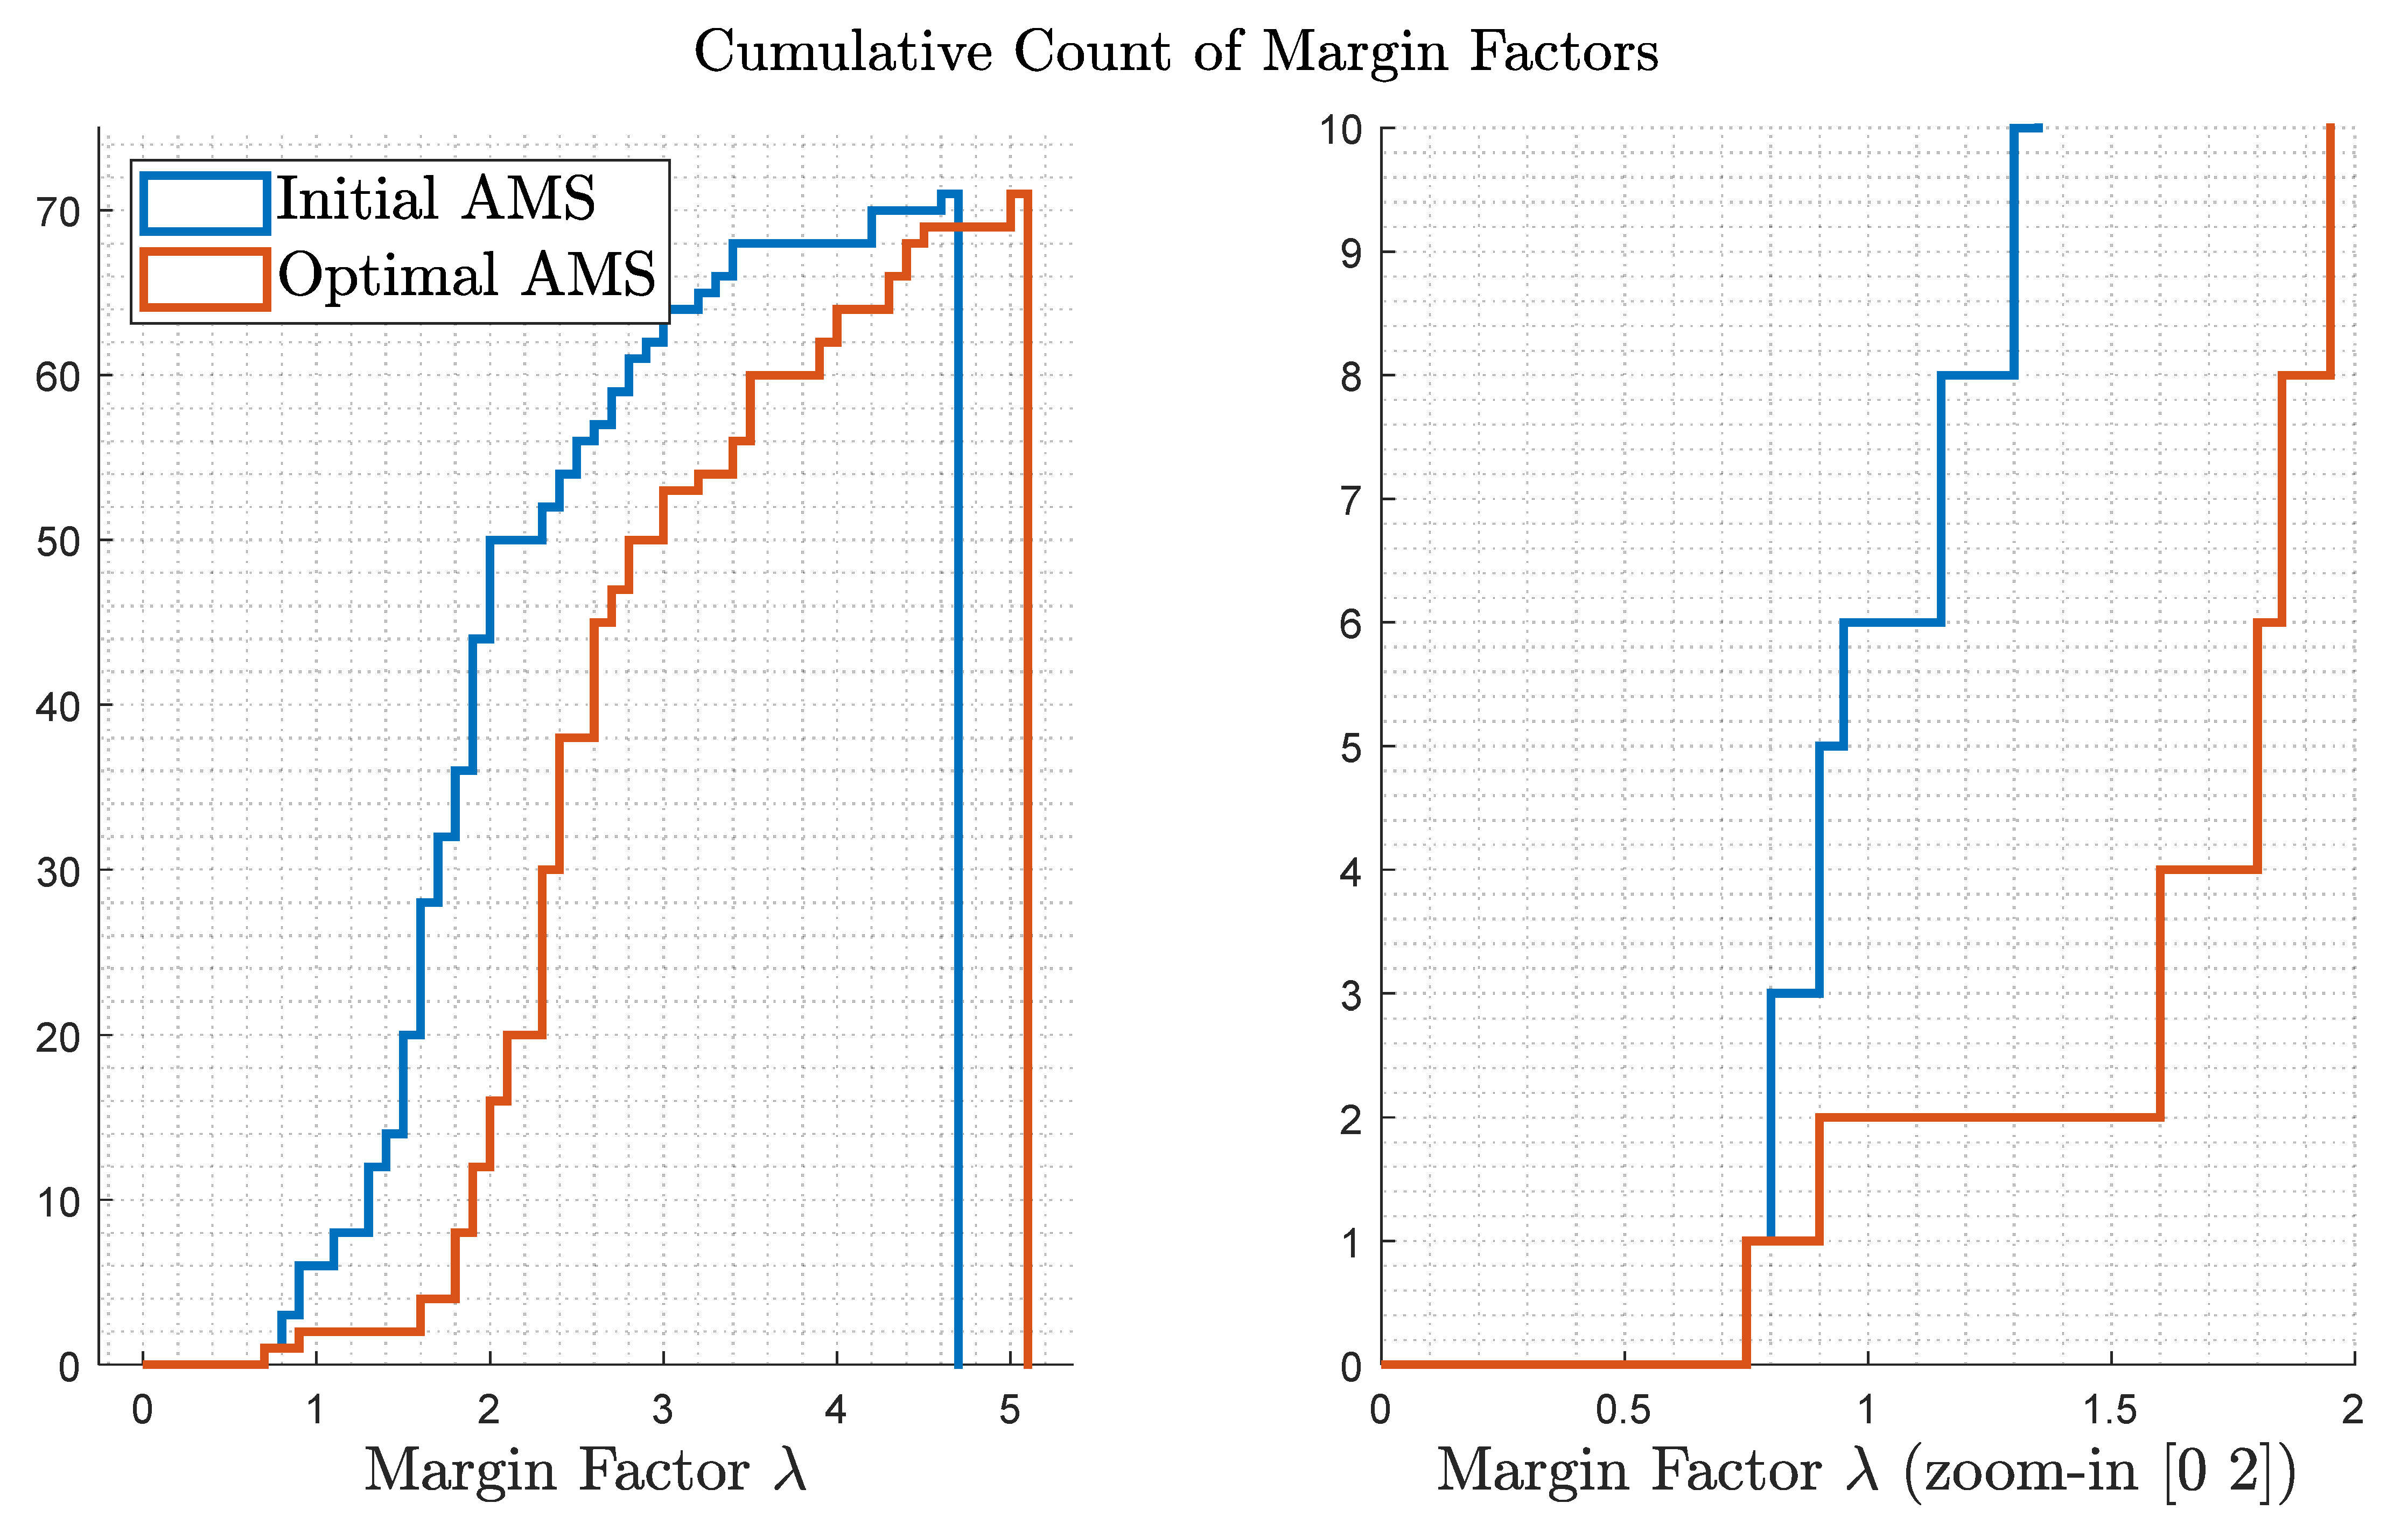
Figure 14 shows the cumulative count of the margin factors λ for this test. Due to a lack of consideration of a critical failure in the initial design, almost half of the margin factors are reduced to less than 1 after the same failure, leaving the system largely uncontrollable, while the optimized layout from Test 3 guarantees that 90% of the directions are still achievable, i.e., with their margins bigger than 1.
Figure 15 shows that the global minimum is achieved again. Compared to Figure 8, the singularities occur along the diagonal of the variable plane. Given the highly nonlinear property of the cost function, the optimal design would be very hard to achieve by using the “rule-of-thumb guesstimate” without the proposed optimization techniques.
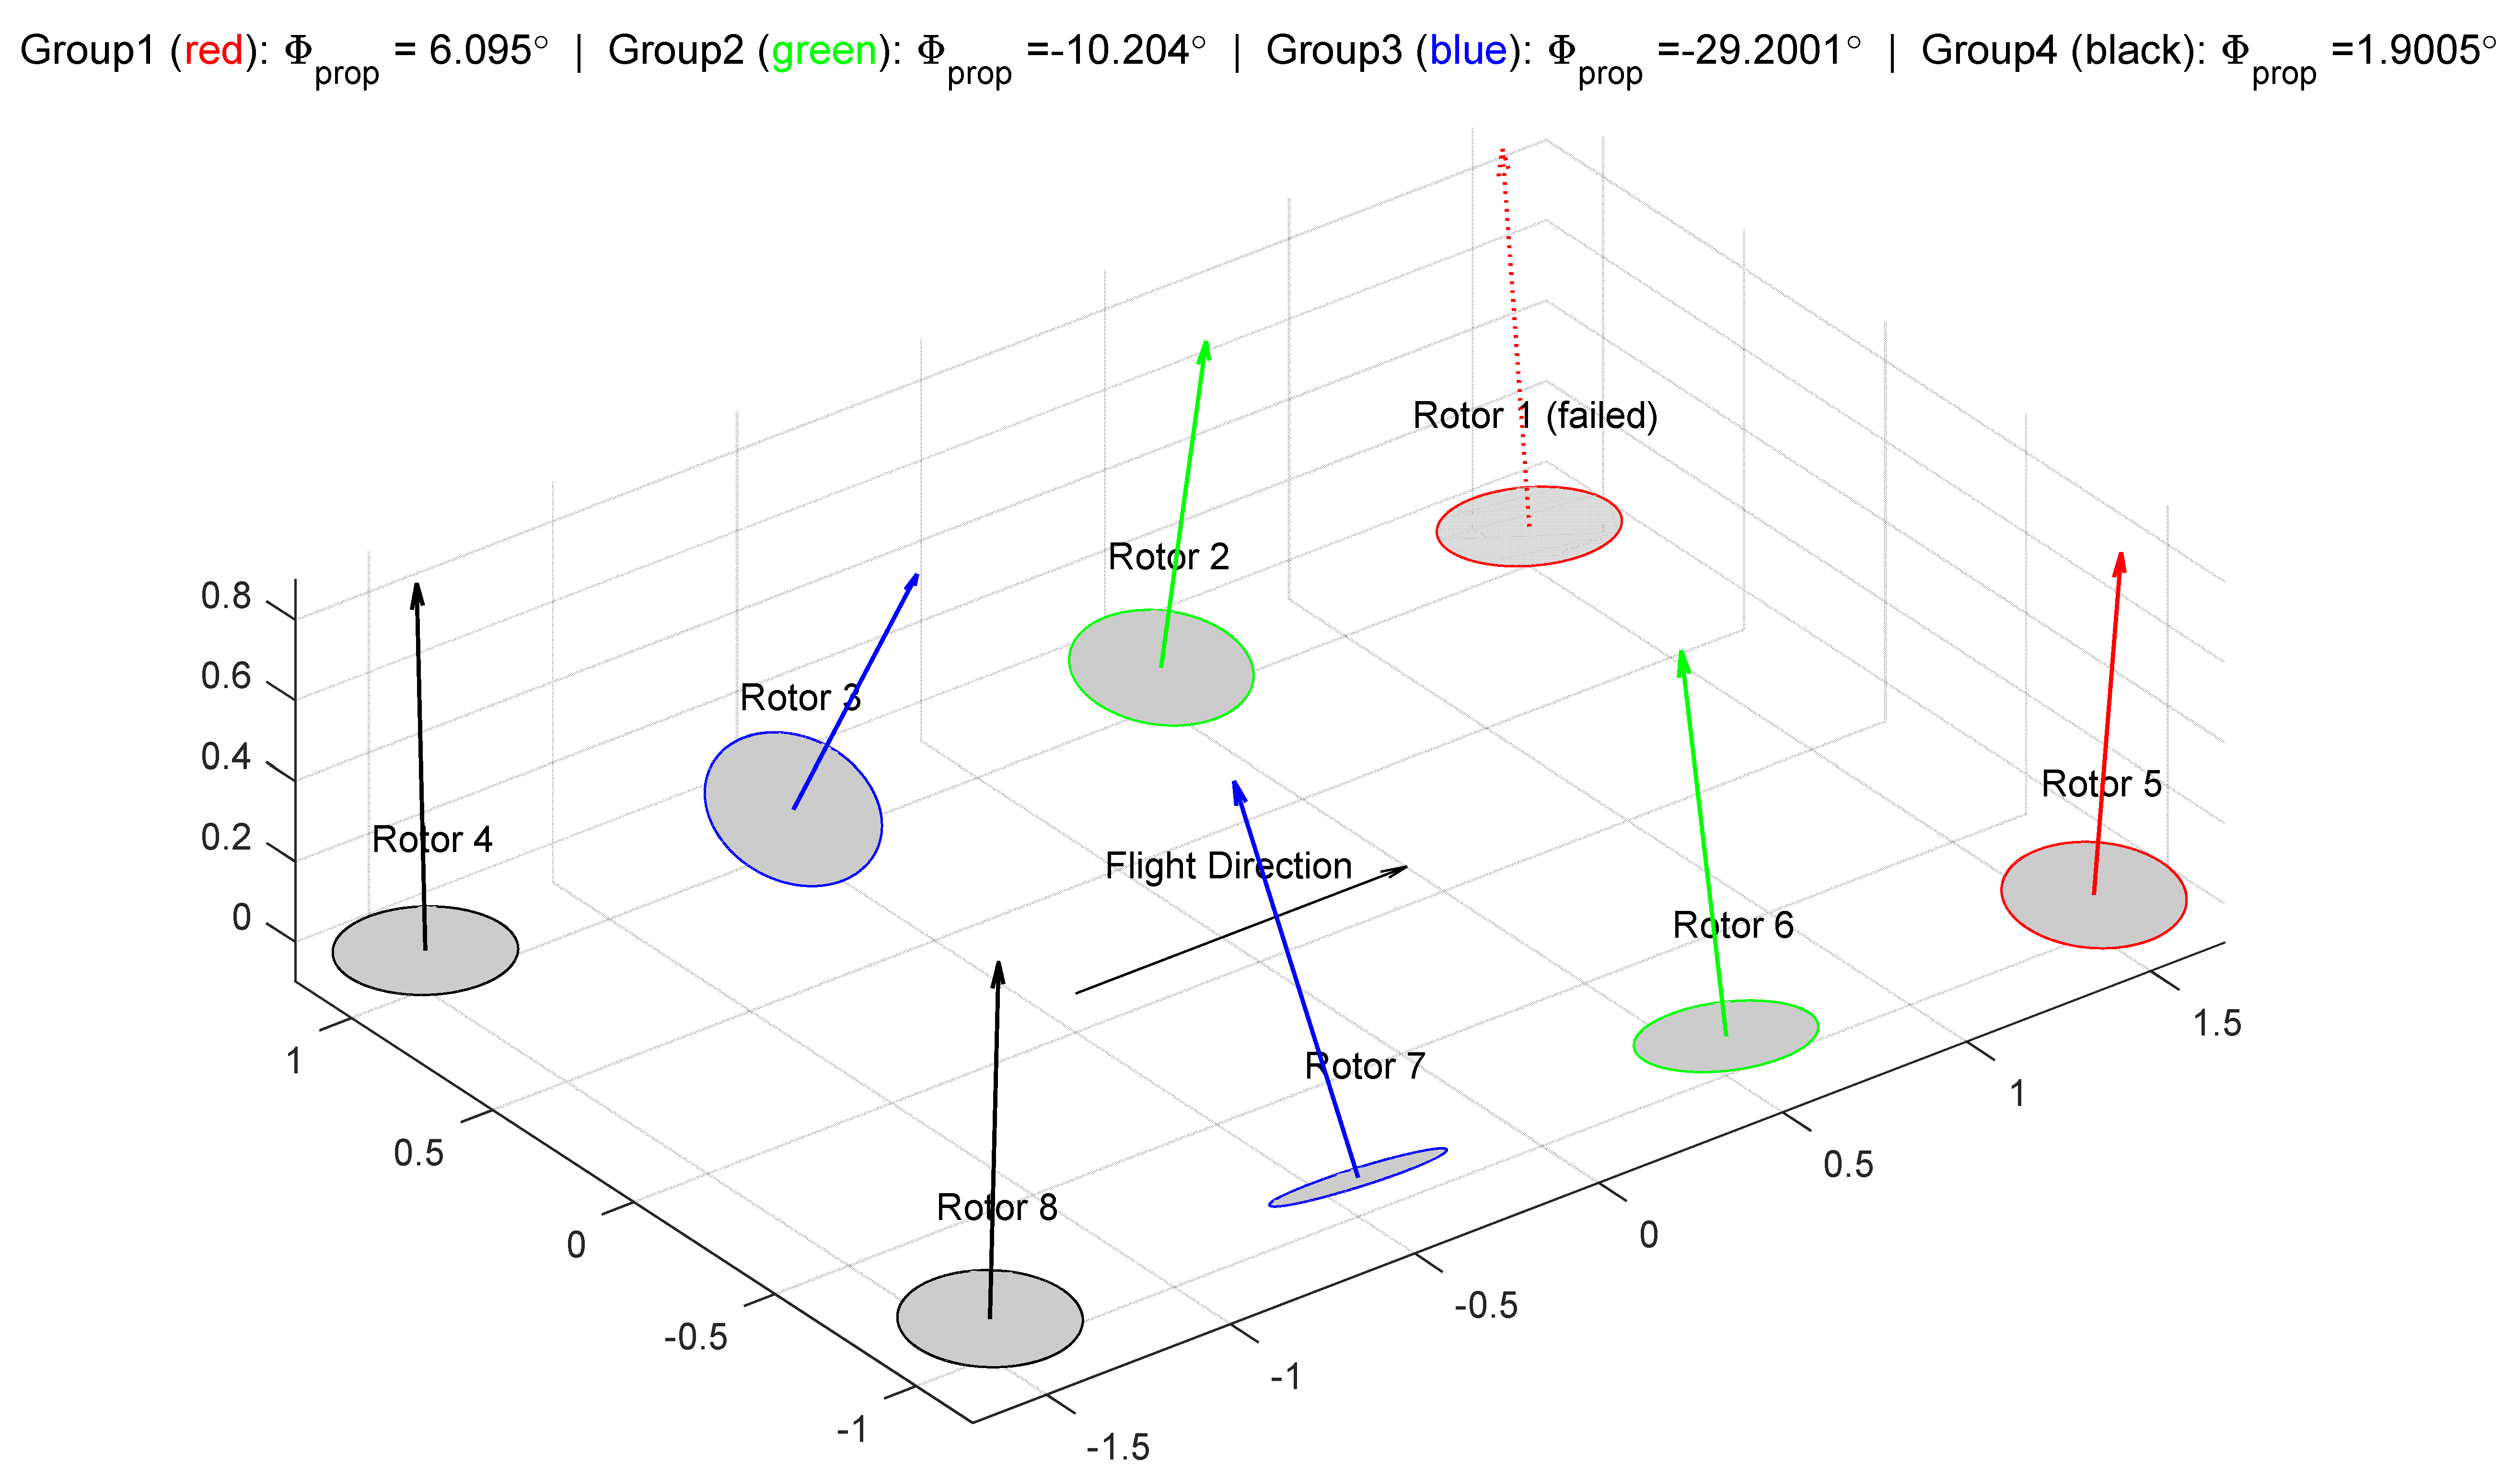
Test 4: Repeats the grouping of Test 2 and considers the critical failure. Again, the corner rotors are positioned almost vertically, while the center four rotors are more tilted. Detailed results are shown in Figure 16, Figure 17 and Figure 18. Similar intuitions and explanations to Test 3 can be drawn.

5.3. Validation and Comparison of Optimization Results

While the proposed approach aims to improve the control authority, the higher values in the rotor tilt angles will lead to inevitable losses of the total available vertical thrust, therefore leading to greater power consumption during the hover trim condition. Since these parameters are not chosen as constraints to the optimization, in this section, we check that the optimization does not induce major deterioration to these parameters, and therefore our assumptions in Section 4 would remain valid.
Considering the tilt angles of the rotors, the ratio between the total available vertical force and the total amount of thrust available from the rotors is defined by:
β = i = 1 8 c o s ( ϕ i ) 8 ,
β is a measurement of lift thrust penalties due to the tilt angles. To trim the A/C during the hover condition, an additional percentage of thrust that must be produced is consequently 1 β 1 . According to [22], the force of a rotor is linearly dependent on the square of its rotational rates, and the power produced by the rotor is linearly dependent on the third power of its rotational rates. As a result, power consumption is linearly dependent on the 3 2 power of the forces produced. Consequently, additional power consumption to account for the tilt angles can be represented by β as 1 β 3 2 1 .
To compare the results between the initial design and the resultant configurations from the optimizations, the rotor angles of each case, their cost function values according to Equations (2) and (3), and the lift thrust and power consumption penalties are compared in Table 2.
Firstly, regarding the control authority optimization, let us check the cost functions for each case. While the failure-free optimizations (Test 1 and 2) produce the lower failure-free cost functions, their performances are worse under the critical failure condition than Test 3 and 4. In particular, Test 1 turns out to be even worse than the initial design in this metric (marked red in Table 2). On the other hand, the critical failure optimizations (Test 3 and 4), although producing slightly worse results in the failure-free case, present major improvements in the cost function when the failure is considered. In this sense, the results from critical failure optimizations win over the failure-free optimal results.
Secondly, regarding the penalties, the losses in the vertical force due to optimization range between 3 and 4% and the losses in power compensation range between 4% and 6%. Among the four groups of results, Test 3, that is, the two-variable critical failure optimization, requires the least additional lift and power to compensate for the losses, which are 2.8% and 4.3%, respectively (marked by highlights). On the other hand, Test 4 presents the worst performance in these two metrics (marked red).
To summarize, Test 3 shows the best overall results, given its good performance in the control authority for both failure-free and critical failure conditions, as well as the minimum penalties on the available lift and power consumption. It is worth mentioning that there might also be weight penalties due to structural strengthening for the larger tilt angles according to the optimization results. However, the discussion in this paper, as a proof of concept for the proposed method, ignores such effects. Once again, towards real applications, such effects can be considered as additional constraints in the optimization, given a higher-fidelity aircraft model that includes the coupling effects between the effector parameters and their structural impacts.

6. Closed-Loop Verification

6.1. Closed-Loop Simulation Framework

To further test the performance of the optimized configurations, closed-loop model-in-the-loop simulations are carried out. The airframe under consideration is modeled as a 6-DoF rigid body with each propulsion system (motor and rotor together) modeled as a first-order linear system. A baseline incremental nonlinear dynamic inversion (INDI) attitude and vertical load factor controller is designed to perform the control task of the system. The performance of INDI controllers has been extensively discussed [30,31,32,33,34]. In Refs. [35,36,37], a unified INDI controller was implemented for a tilt-rotor transition aircraft and performed actual flight tests with a COTS BeagleBone Black development board at a 200 Hz sampling rate. The unified INDI is able to stabilize and provide control through the entire flight envelope (hover, transition, and wing-borne flight) without changing the inner loop structure. Further details can be found in Refs. [35,36,37].
The control design in this paper utilizes a similar baseline structure as in Refs. [35,36,37]. For the control allocation, the redistributed pseudo inverse (RPI) method [38] is used to handle redundancy and reallocate pseudo control commands once saturation occurs. RPI might fail to deliver the optimal input commands as compared to other optimization methods, such as weighted least square (WLS), as found in Refs. [3,34]; however, it is still chosen due to its simplicity and advantage in predictable and low worst-case execution time (WCET), which is important for a certifiable implementation. To handle the redundancy-related wind-up issues of incremental controllers, a null space technique is applied to always bring the inputs back to trim states once the system is in steady state [35]. In the performed simulations, the controller runs at a sampling rate of 50 Hz.
Both failure-free and critical-failure cases are simulated. In simulations with failures, Rotor 1 is injected with a complete loss of power, whose rotational rate decays to zero over time. In the simulation model, the FCC command to the failed motor is bypassed and replaced by 0, and the rotational rate of the corresponding rotor reduces according to a first-order behavior. Failure is assumed to be known to the flight control system one second after the failure takes place. Overall, four groups of simulations were carried out, and the results are elaborated in the following sections. For the controller design, the only difference between the simulations is the effectiveness matrix B , which is calculated according to configurational parameters (rotor angles according to initial design or optimization results).

6.2. Initial Configuration: Failure-Free Simulation

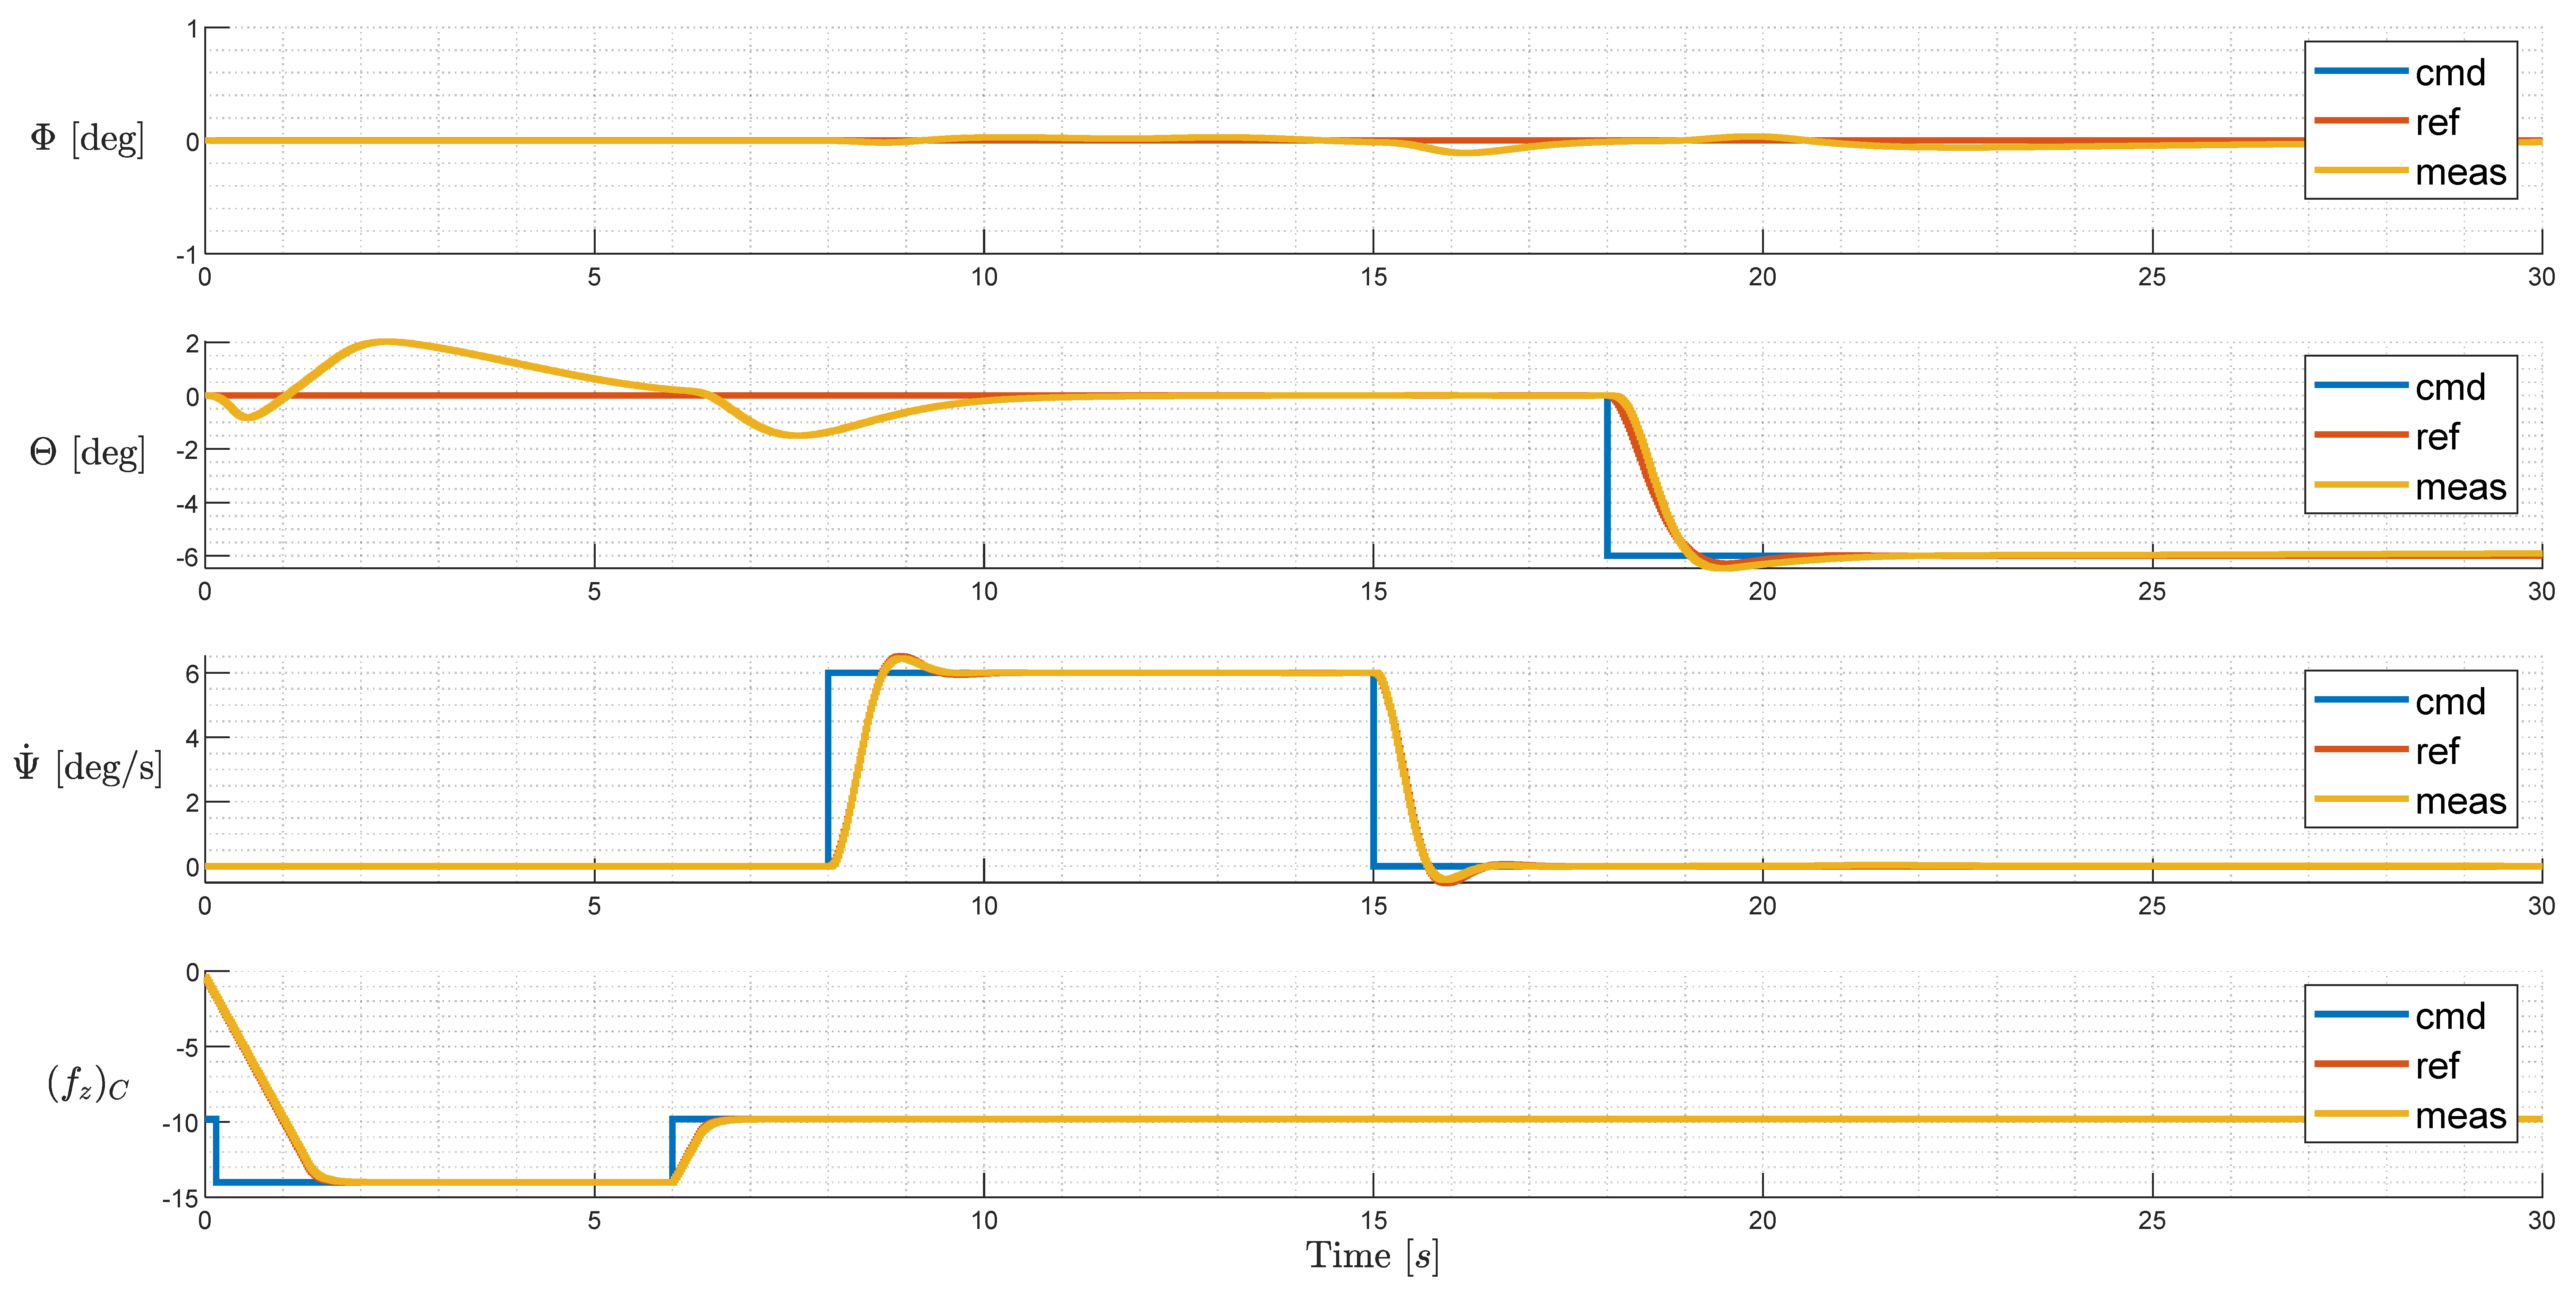
Firstly, the initial configuration was tested to produce baseline results, with all the rotors in their nominal, non-failed states (no failures injected). The commands are designed to simulate a typical take-off process, composed of vertical climb, yaw towards a specified direction ( Ψ ˙ command), and then acceleration by nose-down pitch ( Θ command). The tracking performance is shown in Figure 19 for the controlled variables, where Φ is the bank angle, Θ is the pitch angle, Ψ ˙ is the yaw rate, and f Z C is the vertical specific force. Small cross-axis transient errors can be seen, but steady-state errors are minor. Figure 20 shows the control efforts for this maneuver, in which the rotational speeds are well bounded within the rotors’ saturation limits. To facilitate understanding, Rotors 1–8 are marked in Figure 20 as L01–L04 and R01–R04.

6.3. Initial Configuration: Simulation with Injected Failure

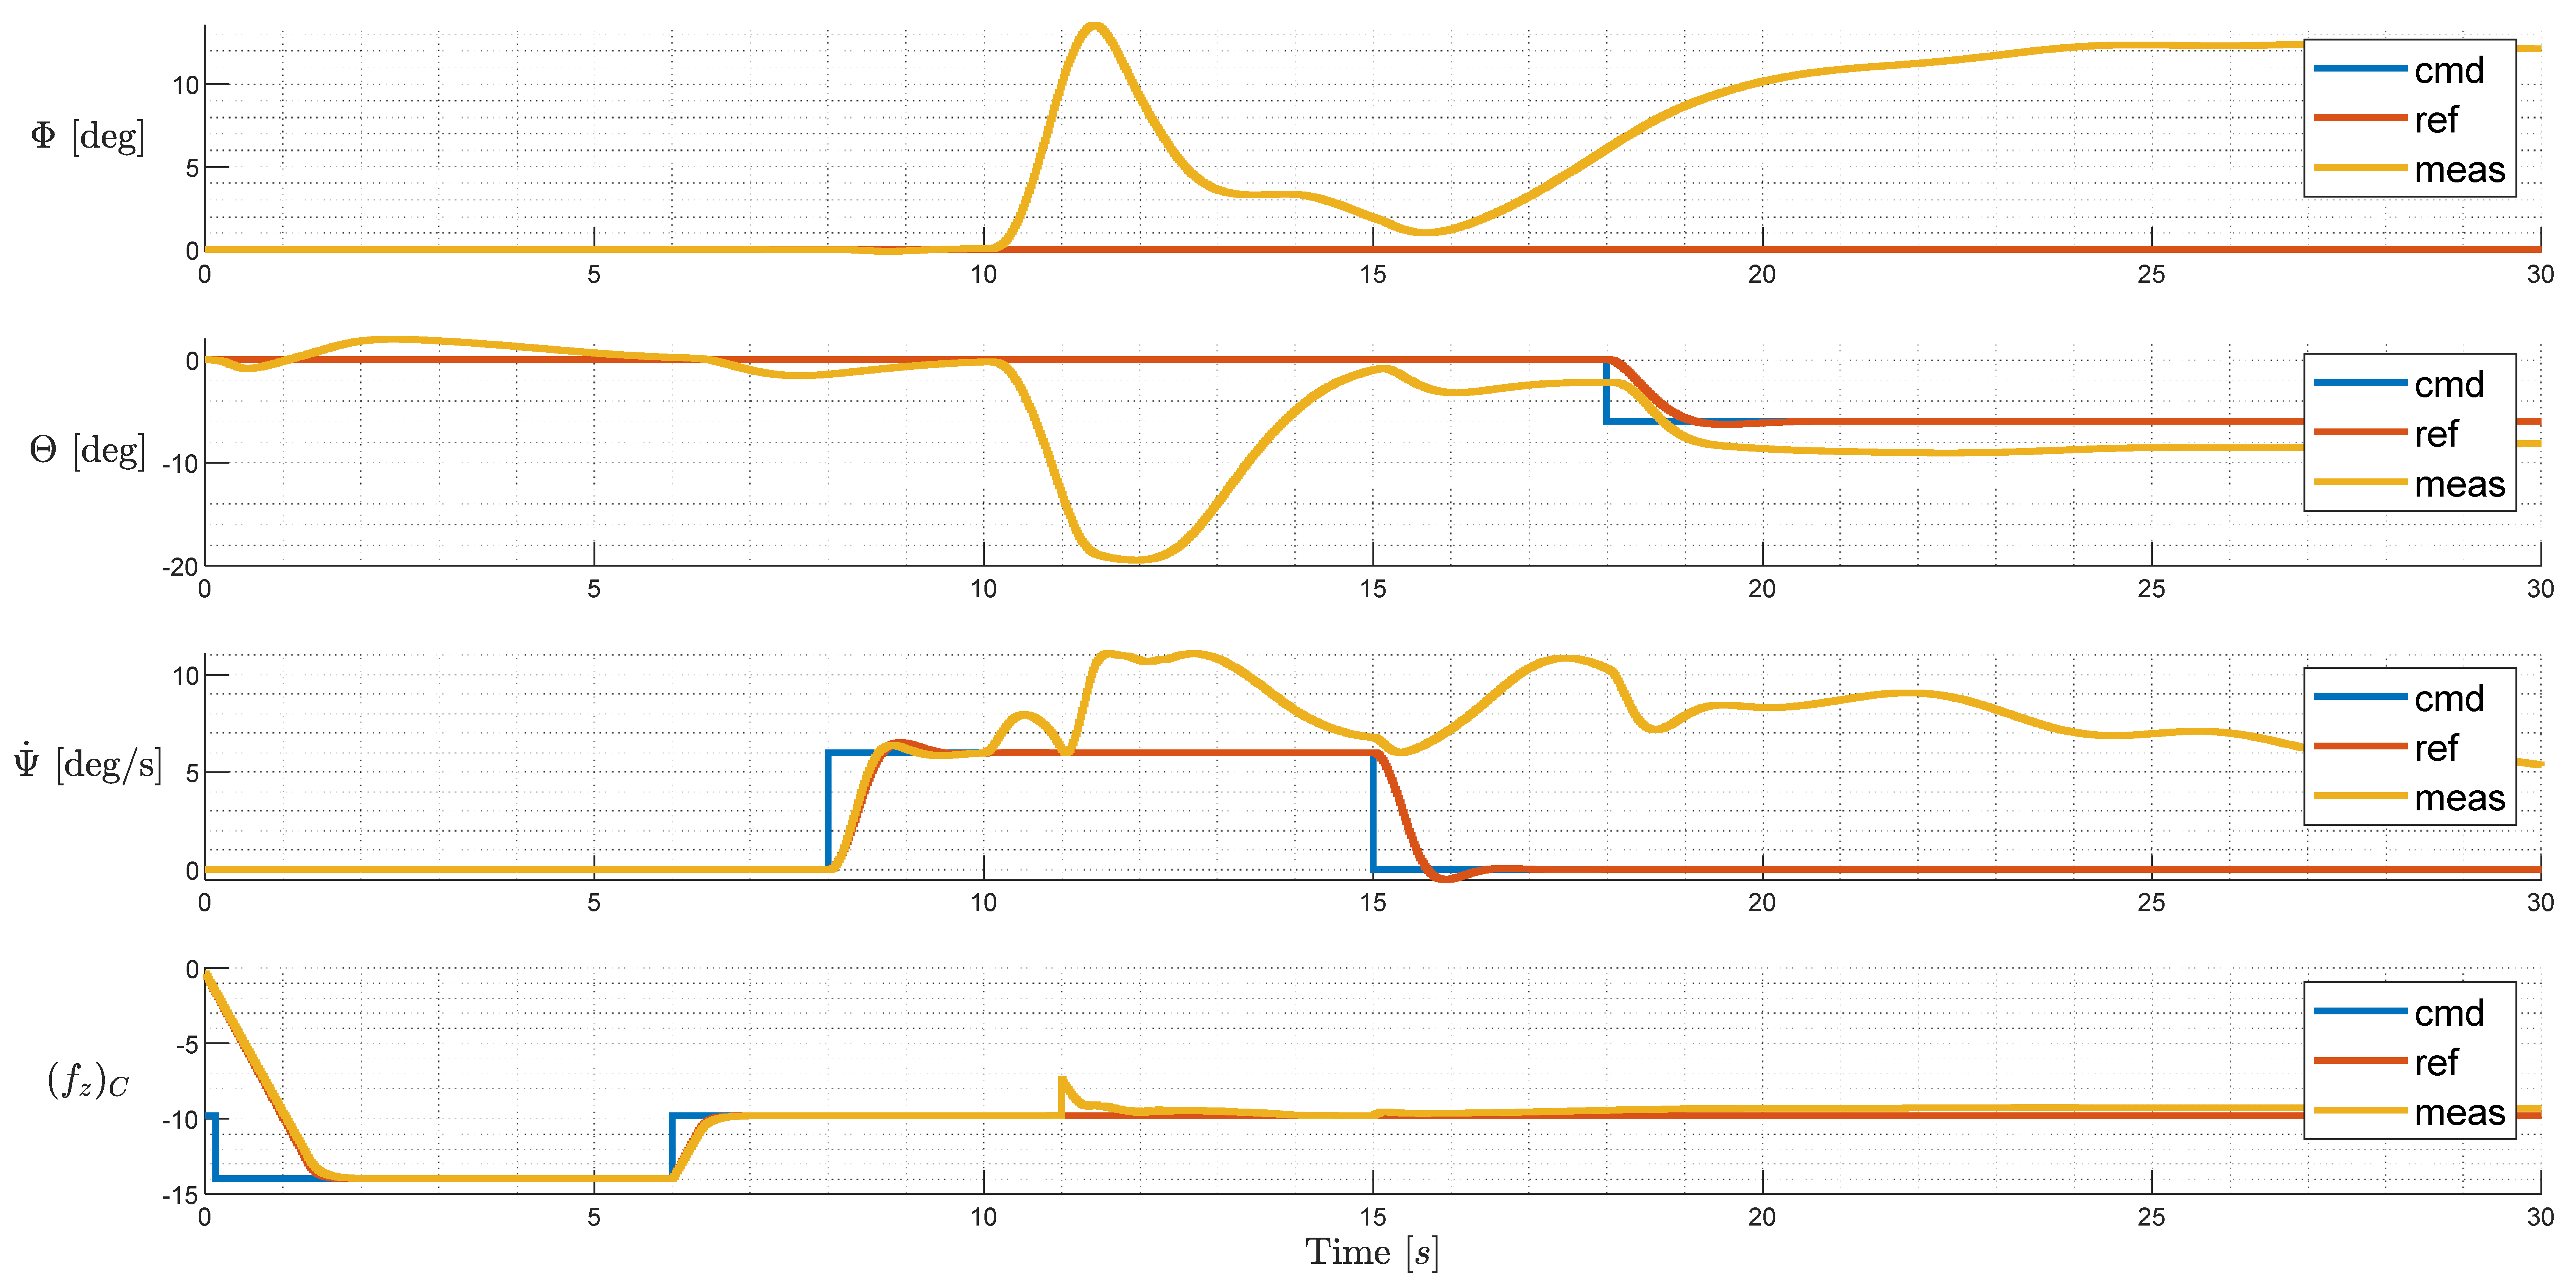
To test the control performance under failure, another test was carried out for the initial configuration with the injected failure of Rotor L01 at t = 10 s. The command tracking is shown in Figure 21. When the failure takes place at t = 10 s, the system starts to diverge in pitch and roll attitude. Given the knowledge of failure at t = 11 s, the system undergoes a transient phase of around 10 s and stabilizes at t = 20 s with a large steady-state error in the bank angle. Steady-state errors in the pitch and yaw rate are also observed. It can be reasonably assumed that it is unsafe to continue the mission, and any further maneuvers can introduce hazardous or catastrophic outcomes to the aircraft.
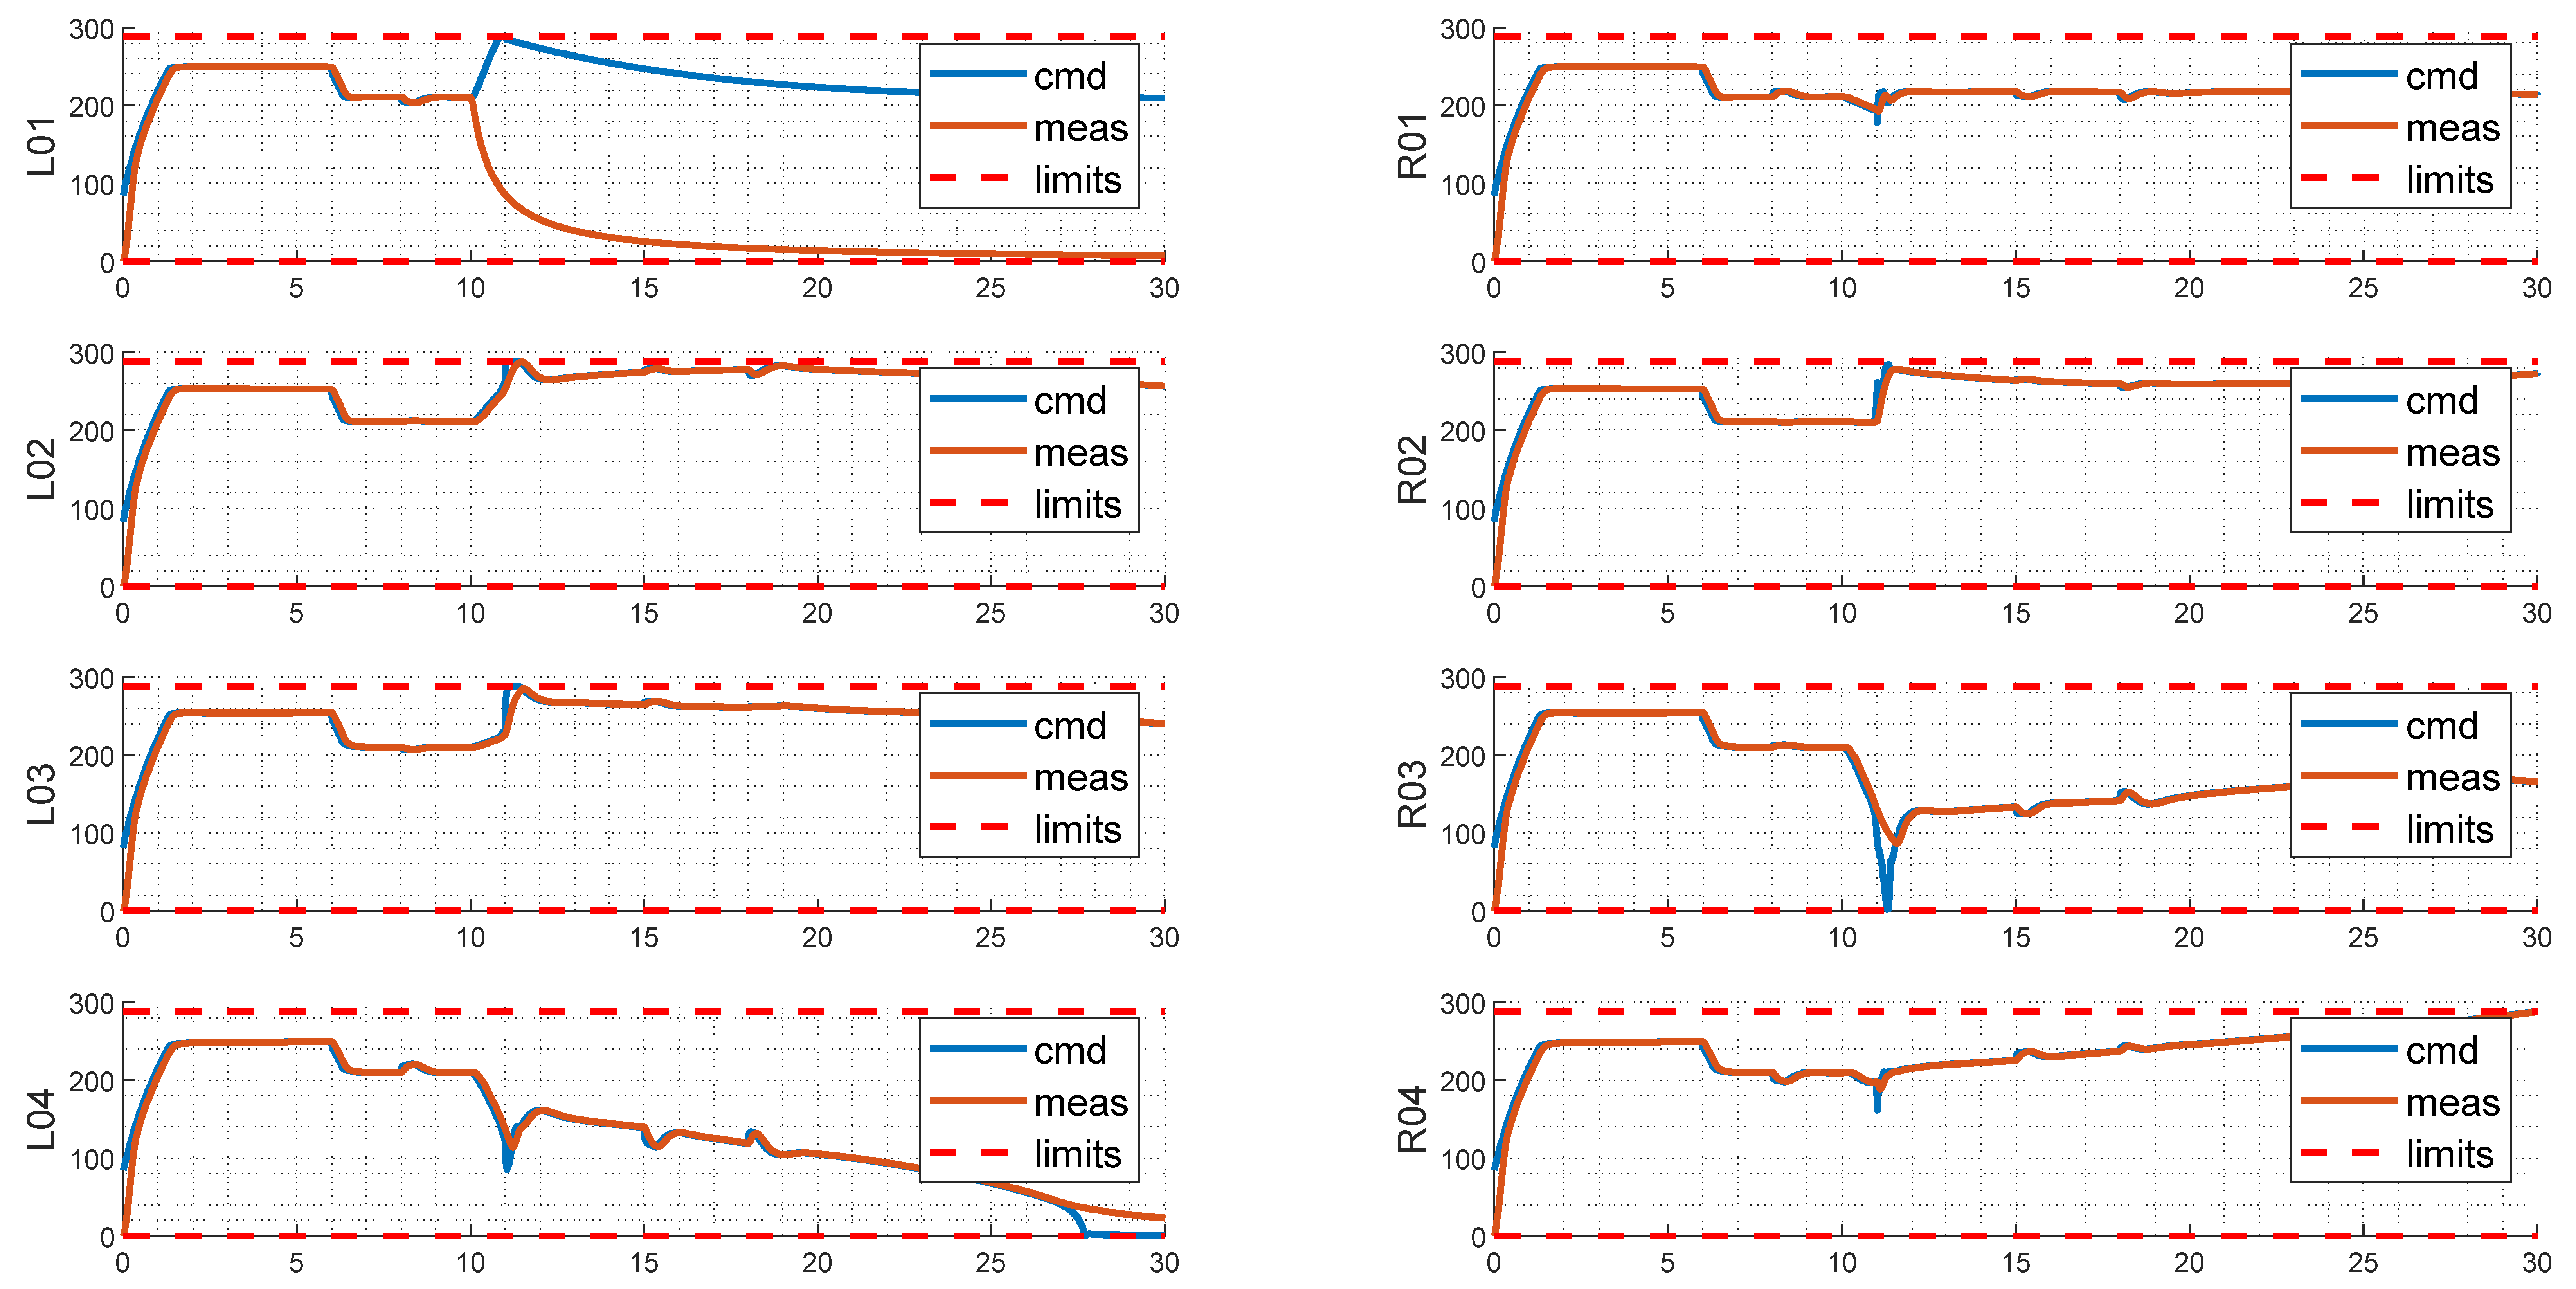
The control efforts for this simulation are presented in Figure 22. The failure of L01 is injected at t = 10 s. From then on, L01 starts to ramp down slowly towards 0 rad/s with its own dynamics, and the commands to L01 are no longer followed. At t = 11 s, the flight control system is aware of the failure and starts to redistribute the controls. Shortly after the failure, Rotors L02, R02, and L04 are commanded to their respective upper saturation limit, while Rotor R04 is drawn to the lower limit. This is because L01 and R04 are installed in opposite positions with respect to the CG, and therefore produce opposing moments. Given the loss of L01, the control efforts undertaken by R04 are also unloaded in order to keep the aircraft balanced and trimmed. This leads to the loss of control effectiveness of two rotors despite the failure of only one actual rotor. As a result, the remaining rotors must take over all of the control efforts, and both the maximum available lift and control margin are highly degraded. Hence, the system cannot maintain stable flights and safe landing.

6.4. Failure-Free Optimized Configuration: Simulation with Injected Failure

In this case, the optimized configuration of Test 2 in Section 4, namely, the four-variable failure-free optimization, was simulated using an injected failure @ t = 10 s. This test allowed us to check whether the failure-free optimization improves overall performance compared to the baseline layout under failure scenarios. In Figure 23, a large transient error is observed after failure injection; however, given the failure knowledge @ t = 11 s, the system recovers to a controlled safe state, with small steady-state errors compared to the failure-injected baseline simulation described in Section 6.3.
The control efforts are shown in Figure 24. The redistributed control efforts after failure are very different from that of Figure 22. Instead of R04, L04 reaches its lower limit, and only R04 reaches the upper limit. This means that the loss of L01 also leads to the equivalent degradation of two rotors (L01 and L04), but the remaining control margin after failure is better than the initial configuration (with less saturated controls).

6.5. Critical-Failure-Optimized Layout Simulation with Injected Failure

Finally, the four-variable critical-failure-optimized configuration (optimal result as of Test 4) was simulated. The tracking performance is shown in Figure 25. Compared to Figure 23, the failure-free optimal configuration tracking performance, the system responses after failure in Figure 25 exhibit fewer transient dynamics, especially for the yaw axis. The maximum pitch angle during the transient reduces to −12° compared to −15° as in Figure 23. The steady-state error in Φ is also reduced. After 5 s, the system restores a controlled steady state, enabling the system to continue safe flight after a critical rotor failure.
Major improvements in control efforts can be seen in Figure 26. Compared to Figure 24 and all previous results, the variance between the remaining rotors’ RPMs is much smaller, with no saturations encountered in both upper and lower limits. In particular, apart from the failed rotor L01, no other rotors are driven down to the lower limit to balance the failed rotor. This preserves the lift generation and the control margin, and consequently allows the system to perform continued safety flight.

6.6. Summary of Simulation Results

The simulation results are briefly summarized and compared in this section. For the initial, unoptimized configuration, when testing without failures (Figure 19), the system smoothly tracks the commanded values with rotors well bounded in the limits (Figure 20). When testing with injected failures (Figure 21), the system shows clear departure and large steady-state errors compared to the commands, with three rotors commanded to their upper limit (Figure 22), indicating a lack of enough of a control margin to stabilize the system after failure. For the optimized configuration without considering critical failure (Figure 23), the system can recover to steady state after a noticeable transient, but Rotors L02, R02, and R04 in steady state after recovery are still close to the upper limits, and L04 reaches the lower limit (Figure 24), indicating that the system does not have sufficient controllability to perform further maneuvers and reject disturbances after the failure. For the last configuration, which is optimized by taking into account critical failure (Figure 25), the transient at the time of failure is improved, with the maximum attitude smaller than that shown in Figure 23, and much smaller yaw disturbances are observed. In Figure 26, the control efforts among the rotors are utilized in a more balanced manner, with no rotor operating at their hard limits, indicating much larger control margins to stabilize and maneuver the aircraft, which enables the aircraft to continue safe flight.
It is worth noting again that the only difference between the simulations is the rotor angles according to the initial design and optimization results. The control performances with injected failures for different configurations are compared and quantified in Table 3 below.

7. Conclusions

In this paper, a method to optimize the generalized AMS in 4D space is proposed, which maximizes eVTOL’s control authority over a prescribed RMS from performance requirements. In particular, the failure of a critical rotor is considered. Closed-loop model-in-the-loop simulations are designed to compare the performances of the baseline configuration and optimized configurations. Major improvements can be observed for the optimized configurations, especially the two optimized with critical failure criteria, with respect to the margin factors as well as closed-loop tracking performance after failure. While the baseline configuration exhibits large attitude deviations from commands after the critical failure, the optimized configurations present the ability to perform continued safe flight, which fulfills the single point of failure criteria according to EASA SC-VTOL. Although the optimization does not directly account for the loss in total lift or power consumption, a validation analysis shows that only slight penalties are found regarding these two aspects. Further work could focus on integrating the philosophy into a multi-objective optimization framework, given sufficient modeling fidelity, to directly address constraints such as structural strength penalties, aerodynamic properties, weight penalties, and power consumption penalties. Additionally, other failure modes might be considered, such as the loss of a battery pack or cascaded rotor failures due to rotor plane intersections, which might introduce the simultaneous loss of more than one propulsion system.

Author Contributions

Conceptualization, J.Z.; methodology, J.Z.; software, J.Z. and M.S.; validation, J.Z. and M.S.; investigation, J.Z.; writing—original draft preparation, J.Z.; writing—review and editing, M.S., F.H. and S.Z.; visualization, J.Z.; supervision, F.H. and S.Z.; project administration, F.H.; funding acquisition, F.H. All authors have read and agreed to the published version of the manuscript.

Funding

This research received no external funding.

Data Availability Statement

The original contributions presented in this study are included in the article. Further inquiries can be directed to the corresponding author.

Conflicts of Interest

The authors declare no conflicts of interest.

References

  1. Durham, W.C. Constrained control allocation. J. Guid. Control Dyn. 1993, 16, 717–725. [Google Scholar] [CrossRef]
  2. Durham, W.C. Constrained control allocation—Three-moment problem. J. Guid. Control Dyn. 1994, 17, 330–336. [Google Scholar] [CrossRef]
  3. Johansen, T.A.; Fossen, T.I. Control allocation—A Survey. Automatica 2013, 49, 1087–1103. [Google Scholar] [CrossRef]
  4. Durham, W.C. Attainable moments for the constrained control allocation problem. J. Guid. Control Dyn. 1994, 17, 1371–1373. [Google Scholar] [CrossRef]
  5. Varriale, C.; Voskuijl, M.; Veldhuis, L.L. Trim for Maximum Control Authority using the Attainable Moment Set. In Proceedings of the AIAA Scitech 2020 Forum, Orlando, FL, USA, 6–10 January 2020; American Institute of Aeronautics and Astronautics: Reston, VA, USA, 2020. ISBN 9781624105951. [Google Scholar]
  6. Ma, T.; Wang, X.; Qiao, N.; Zhang, Z.; Fu, J.; Bao, M. A Conceptual Design and Optimization Approach for Distributed Electric Propulsion eVTOL Aircraft Based on Ducted-Fan Wing Unit. Aerospace 2022, 9, 690. [Google Scholar] [CrossRef]
  7. Suiçmez, E.C. Full Envelope Nonlinear Controller Design for a Novel Electric VTOL(eVTOL) Air-taxi via INDI Approach Combined with CA. Ph.D. Thesis, Middle East Technical University, Ankara, Turkey, 2021. [Google Scholar]
  8. Moore, K.R.; Ning, A. Distributed Electric Propulsion Effects on Existing Aircraft Through Multidisciplinary Optimization. In Proceedings of the 2018 AIAA/ASCE/AHS/ASC Structures, Structural Dynamics, and Materials Conference, Kissimmee, FL, USA, 8–12 January 2018; American Institute of Aeronautics and Astronautics: Reston, VA, USA, 2018; ISBN 978-1-62410-532-6. [Google Scholar]
  9. Fard, M.T.; He, J.; Huang, H.; Cao, Y. Aircraft Distributed Electric Propulsion Technologies—A Review. IEEE Trans. Transp. Electrific. 2022, 8, 4067–4090. [Google Scholar] [CrossRef]
  10. Bacchini, A.; Cestino, E. Electric VTOL Configurations Comparison. Aerospace 2019, 6, 26. [Google Scholar] [CrossRef]
  11. Akash, A.; Raj, V.S.J.; Sushmitha, R.; Prateek, B.; Aditya, S.; Sreehari, V.M. Design and Analysis of VTOL Operated Intercity Electrical Vehicle for Urban Air Mobility. Electronics 2022, 11, 20. [Google Scholar] [CrossRef]
  12. Piccinini, R.; Tugnoli, M.; Zanotti, A. Numerical Investigation of the Rotor-Rotor Aerodynamic Interaction for eVTOL Aircraft Configurations. Energies 2020, 13, 5995. [Google Scholar] [CrossRef]
  13. Tumuluru Ramesh, N.; Pandurangi, P.V. A Flight Performance Based Optimization Model for eVTOL Vehicles. Eng. Arch. 2022, preprint. [Google Scholar]
  14. Cook, J. A Strip Theory Approach to Dynamic Modeling of eVTOL Aircraft. In Proceedings of the AIAA Scitech 2021 Forum, Virtual, 11–21 January 2021; American Institute of Aeronautics and Astronautics: Reston, VA, USA, 2021. [Google Scholar]
  15. Stokkermans, T.C.A.; Usai, D.; Sinnige, T.; Veldhuis, L.L.M. Aerodynamic Interaction Effects Between Propellers in Typical eVTOL Vehicle Configurations. J. Aircr. 2021, 58, 815–833. [Google Scholar] [CrossRef]
  16. EASA. Special Condition for Small-Category VTOL-Capable Aircraft. Available online: https://www.easa.europa.eu/en/downloads/139946/en (accessed on 28 October 2024).
  17. EASA. Means of Compliance with the Special Condition VTOL—MOC SC-VTOL Issue 2. Available online: https://www.easa.europa.eu/en/downloads/127717/en (accessed on 28 October 2024).
  18. Eric, N.V.; Pierre, T.; Joël, J.; Daniel, A.; Philippe, P.; Carsten, D. Reduction of Vertical Tail Using Differential Thrust: Influence on Flight Control and Certification. In Proceedings of the Advanced Aircraft Efficiency in a Global Air Transport System (AEGATS’18), Toulouse, France, 23–25 October 2018; pp. 1–8. [Google Scholar]
  19. Van, E.N.; Alazard, D.; Döll, C.; Pastor, P. Co-design of aircraft vertical tail and control laws using distributed electric propulsion. IFAC-PapersOnLine 2019, 52, 514–519. [Google Scholar] [CrossRef]
  20. Moore, K.R.; Ning, A. Takeoff and Performance Trade-Offs of Retrofit Distributed Electric Propulsion for Urban Transport. J. Aircr. 2019, 56, 1880–1892. [Google Scholar] [CrossRef]
  21. Pei, J.; Bassett, G.; Grisham, J.; Finch, P.; Toniolo, M.; Miller, L.; Bandu, P. Generic Control Allocation Toolbox for Preliminary Vehicle Design. In Proceedings of the 2018 Modeling and Simulation Technologies Conference, Reston, VA, USA, 25–29 June 2018; American Institute of Aeronautics and Astronautics: Reston, VA, USA, 2018. ISBN 9781624105517. [Google Scholar]
  22. Varriale, C.; Voskuijl, M. A trim problem formulation for maximum control authority using the Attainable Moment Set geometry. CEAS Aeronaut J. 2022, 13, 251–266. [Google Scholar] [CrossRef]
  23. Söpper, M.; Zhang, J.; Holzapfel, F. Required Moment Sets: Enhanced Controllability Analysis for Nonlinear Aircraft Models. (submitted). Appl. Sci. 2021, 11, 3456. [Google Scholar] [CrossRef]
  24. Zhang, J.; Söpper, M.; Holzapfel, F. Attainable Moment Set Optimization to Support Configuration Design: A Required Moment Set Based Approach. Appl. Sci. 2021, 11, 3685. [Google Scholar] [CrossRef]
  25. Lu, Z.; Hong, H.; Schweighofer, F.; Holzapfel, F. Controllability Evaluation for VTOL Aircraft in Velocity Envelope: A Distance-Based Metric. J. Guid. Control Dyn. 2024, 47, 1–14. [Google Scholar] [CrossRef]
  26. MathWorks. MATLAB Version: 9.8.0.1451342 (R2021a); MathWorks: Natick, MA, USA, 2021. [Google Scholar]
  27. Gupta, G.; Abdallah, S. Propeller Force-Constant Modeling for Multirotor UAVs from Experimental Estimation of Inflow Velocity. Int. J. Aerosp. Eng. 2018, 2018, 1–10. [Google Scholar] [CrossRef]
  28. MIT. Performance of Propellers. Available online: https://web.mit.edu/16.unified/www/FALL/thermodynamics/notes/node86.html (accessed on 28 October 2024).
  29. Du, G.-X.; Quan, Q.; Yang, B.; Cai, K.-Y. Controllability Analysis for Multirotor Helicopter Rotor Degradation and Failure. J. Guid. Control Dyn. 2015, 38, 978–985. [Google Scholar] [CrossRef]
  30. Di Francesco, G.; Mattei, M. Modeling and Incremental Nonlinear Dynamic Inversion Control of a Novel Unmanned Tiltrotor. J. Aircr. 2016, 53, 73–86. [Google Scholar] [CrossRef]
  31. Wang, X.; van Kampen, E.-J.; Chu, Q.; Lu, P. Stability Analysis for Incremental Nonlinear Dynamic Inversion Control. J. Guid. Control Dyn. 2019, 42, 1116–1129. [Google Scholar] [CrossRef]
  32. Lu, P.; van Kampen, E.-J.; Visser, C.d.; Chu, Q. Aircraft fault-tolerant trajectory control using Incremental Nonlinear Dynamic Inversion. Control Eng. Pract. 2016, 57, 126–141. [Google Scholar] [CrossRef]
  33. Smeur, E.J.J.; Chu, Q.; Croon, G.C.H.E.d. Adaptive Incremental Nonlinear Dynamic Inversion for Attitude Control of Micro Air Vehicles. J. Guid. Control Dyn. 2016, 39, 450–461. [Google Scholar] [CrossRef]
  34. Bodson, M. Evaluation of Optimization Methods for Control Allocation. J. Guid. Control Dyn. 2002, 25, 703–711. [Google Scholar] [CrossRef]
  35. Zhang, J.; Bhardwaj, P.; Raab, S.A.; Saboo, S.; Holzapfel, F. Control Allocation Framework for a Tilt-rotor Vertical Take-off and Landing Transition Aircraft Configuration. In Proceedings of the 2018 Applied Aerodynamics Conference, Atlanta, GA, USA, 25–29 June 2018; American Institute of Aeronautics and Astronautics: Reston, VA, USA, 2018. ISBN 978-1-62410-559-3. [Google Scholar]
  36. Raab, S.A.; Zhang, J.; Bhardwaj, P.; Holzapfel, F. Proposal of a Unified Control Strategy for Vertical Take-off and Landing Transition Aircraft Configurations. In Proceedings of the 2018 Applied Aerodynamics Conference, Atlanta, GA, USA, 25–29 June 2018; American Institute of Aeronautics and Astronautics: Reston, VA, USA, 2018. ISBN 978-1-62410-559-3. [Google Scholar]
  37. Bhardwaj, P.; Raab, S.A.; Zhang, J.; Holzapfel, F. Integrated Reference Model for a Tilt-rotor Vertical Take-off and Landing Transition UAV. In Proceedings of the 2018 Applied Aerodynamics Conference, Atlanta, GA, USA, 25–29 June 2018; American Institute of Aeronautics and Astronautics: Reston, VA, USA, 2018. [Google Scholar]
  38. Sieberling, S.; Chu, Q.P.; Mulder, J.A. Robust Flight Control Using Incremental Nonlinear Dynamic Inversion and Angular Acceleration Prediction. J. Guid. Control Dyn. 2010, 33, 1732–1742. [Google Scholar] [CrossRef]
Figure 1. Two-dimensional example of AMS, RMS, and the margin in between.
Aerospace 11 00990 g001
Figure 2. (a) Model of the airframe under discussion. The figure directly refers to Figure 1 in Ref. [25]; (b) top view of the airframe under discussion.
Aerospace 11 00990 g002
Figure 3. Rotor tilt layout according to initial design parameters.
Aerospace 11 00990 g003
Figure 4. Comparison of AMS with different rotor tilt angles and the RMS.
Aerospace 11 00990 g004
Figure 5. Test 1 optimized rotor layout.
Aerospace 11 00990 g005
Figure 6. Test 1 comparison: Optimized AMS, initial AMS, and RMS.
Aerospace 11 00990 g006
Figure 7. Test 1 comparison: Cumulative count of margin factors.
Aerospace 11 00990 g007
Figure 8. Test 1 cost function over optimization variables.
Aerospace 11 00990 g008
Figure 9. Test 2 optimized rotor layout.
Aerospace 11 00990 g009
Figure 10. Test 2 comparison: Optimized AMS, initial AMS, and RMS.
Aerospace 11 00990 g010
Figure 11. Test 2 comparison: Cumulative count of margin factors.
Aerospace 11 00990 g011
Figure 12. Test 3 optimized rotor layout.
Aerospace 11 00990 g012
Figure 13. Test 3 comparison: Optimized AMS, initial AMS, and RMS. The AMSs are degraded by removing the critical rotor from the control set.
Aerospace 11 00990 g013
Figure 14. Test 3 comparison: Cumulative count of margin factors.
Aerospace 11 00990 g014
Figure 15. Test 3 cost function over optimization variables.
Aerospace 11 00990 g015
Figure 16. Test 4 optimized rotor layout.
Aerospace 11 00990 g016
Figure 17. Test 4 comparison: Optimized AMS, initial AMS, and RMS. The AMSs are degraded by removing the critical rotor from the control set.
Aerospace 11 00990 g017
Figure 18. Test 4 comparison: Cumulative count of margin factors.
Aerospace 11 00990 g018
Figure 19. Tracking performance for the initial configuration.
Aerospace 11 00990 g019
Figure 20. Control efforts (as rotor speeds in rad/s) of the initial configuration.
Aerospace 11 00990 g020
Figure 21. Tracking performance of the initial configuration. Failure injected @ t = 10 s; failure known to the flight control system @ t = 11 s.
Aerospace 11 00990 g021
Figure 22. Control efforts (as rotor speeds in rad/s) of the initial configuration. Failure to L01 injected @ t = 10 s; failure known to the flight control system @ t = 11 s.
Aerospace 11 00990 g022
Figure 23. Tracking performance of the non-failure-optimized configuration. Failure injected @ t = 10 s; failure known to the flight control system @ t = 11 s.
Aerospace 11 00990 g023
Figure 24. Control efforts (as rotor speeds in rad/s) of the non-failure-optimized configuration. Failure to L01 injected @ t = 10 s; failure known to the flight control system @ t = 11 s.
Aerospace 11 00990 g024
Figure 25. Tracking performance of the critical-failure-optimized configuration. Failure injected @ t = 10 s; failure known to the flight control system @ t = 11 s.
Aerospace 11 00990 g025
Figure 26. Control efforts (as rotor speeds in rad/s) of the critical-failure-optimized configuration. Failure to L01 injected @ t = 10 s; failure known to the flight control system @ t = 11 s.
Aerospace 11 00990 g026
Table 1. Approximate preliminary design parameters.
Preliminary Design ParametersValues
Take-off Weight250 kg
Wingspan10 m
Motor Diameter1–2 m
Moment   of   Inertia   I x x Approx .   250   k g m 2
Moment   of   Inertia   I y y Approx .   300   k g m 2
Moment   of   Inertia   I z z Approx .   550   k g m 2
Table 2. Comparison between different configurations.
Initial ValueTest 1Test 2Test 3Test 4
P1 tilt angle ( ° )−5−17.94−13.98−1.64−6.09
P2 tilt angle ( ° )59.258.9019.0410.20
P3 tilt angle ( ° )−59.259.2319.0429.20
P4 tilt angle ( ° )5−17.94−23.15−1.64−1.90
Failure-free cost function: J = i = 1 n V , R M S 1 λ i 33.0629.2229.1230.2930.28
Critical failure cost function: J = i = 1 n V , R M S 1 λ i 1 61.3167.8559.5847.3945.6667
Total force available in the vertical direction (%): β = i = 1 8 ϕ i 8 99.6%96.92%96.62%97.24%96.27%
Additional force to trim (%): 1 β 1 0.40%3.18%3.50%2.84%3.87%
Additional power to trim (%): 1 β 3 1 0.6%4.8%5.3%4.3%5.9%
Table 3. Comparison and quantification of control performances for different configurations.
Initial Unoptimized Config. (Figure 21 and Figure 22)Non-Failure-Optimized Config. (Figure 23 and Figure 24; Figure 23; Figure 24)Critical-Failure-Optimized Config. (Figure 23 and Figure 24)
Continued Safe Flight after Failure (Y/N)NYY
Max. Attitude Transient after Failure (Degrees)201512
Number of Saturated Rotors (Non-Failed) @t = 30 s4 (L02, R02, L04, R04)2 (L04, R04)0
Difference between Max. and Min. Rotational Speed (Non-Failed) @t = 30 s (Rad/s)288 (btw. L04 & R04)288 (btw. L04 & R04)158 (btw. L03 & R03)
Disclaimer/Publisher’s Note: The statements, opinions and data contained in all publications are solely those of the individual author(s) and contributor(s) and not of MDPI and/or the editor(s). MDPI and/or the editor(s) disclaim responsibility for any injury to people or property resulting from any ideas, methods, instructions or products referred to in the content.