1. Introduction
The scientific experiments in the Chinese space station (CSS) are based on the scientific experiment rack (ER) platform and are assembled in the form of standard payload units (SPUs). Continuous experiments are carried out through uploaded SPUs or supplementary test materials [
1,
2]. The payloads will involve maintenance, reconstruction, assembly, cleaning, and other operations to extend the life of cargo spacecraft or manned spacecraft. Therefore, a clean environment is required for operation on orbit [
3].
The on-orbit maintenance and manipulation workbench experiment rack (MMW) on the CSS provides on-orbit installation, adjustment, and maintenance operations [
4,
5,
6]. Compared with the microgravity science glovebox (MSG) experimental rack on the international space station (ISS) [
7,
8,
9], the MMW has a larger operating space and provides an integrated gas system (IGS), including exhaust gas, nitrogen supply, and air supply, to provide a clean environment for the experiment payloads. It is used for gas replacement and purification in the operating box on the MMW.
During the development, the IGS had direct connection interfaces with other external products or systems [
10]. The IGS and the external systems have different research teams and locations, which makes it very difficult to achieve full functioning and testing before the whole cabin is integrated.
In the development process of common aerospace products, there are generally three stages: project design, engineering product, and real product [
11,
12]. For systems that are developed at the same time and have interface relationships, combined testing is generally required to obtain performance data. However, during the development of the gas supply system in this paper, it was impossible to conduct combined testing before the final product. This paper subdivides the test methods in the development stage. Therefore, this paper designed and implemented a variety of methods, including theoretical modeling simulation, component test, semi-physical simulation, interface simulation, and external system test, to comprehensively simulate the performance of the IGS before the final ground test. The performance test methods and optimization steps achieved good prediction results.
The IGS on the MMW is shown in
Figure 1. The exhaust system (ES) includes an MMW exhaust system (MMW-ES) and a cabin exhaust system (Cabin-ES). The Cabin-ES contains components such as pipes, valves, filters, bends, and tees, but the flow resistance is unknown during most of the development time.
The nitrogen system (NS) includes the nitrogen system inside the MMW (MMW-NS) and the application nitrogen system in the cabin (Cabin-NS). The Cabin-NS includes multiple components such as gas source, pressure reduction, pipelines, valves, tees, and bends. The pipe from the gas source outlet to the MMW inlet forms a complex three-dimensional structure that follows the cabin, which is difficult to calculate. It is hard to build perfectly consistent test models on the ground, and the flow resistance is unknown.
The air supply system (AS) is relatively simple, and all flow components are inside the MMW and can be measured on the ground.
The IGS needs to be operated several times during the operation of the MMW to achieve gas replacement in the operation box. Nitrogen enters through the Cabin-NS and the MMW-NS, and the internal gas is discharged through the MMW-ES and the Cabin-ES. When air is needed, the AS is used. The operation box, MMW-NS, MMW-ES, AS, and controller together constitute the IGS, while the Cabin-NS and the Cabin-ES are controlled by external independent systems, respectively. Therefore, the IGS should be designed in combination with the Cabin-NS and Cabin-ES systems during the development process.
All the pipeline internal ports of the exhaust system, nitrogen system, and air system are collected in the operation box of the MMW, and the external ports are, respectively, the vacuum environment outside the cabin, the high-pressure nitrogen source, and the environment inside the cabin.
2. Key Parameter Calculation and Multi-Stage Design
2.1. Pressure Bearing Capacity Calculation
The ideal IGS system has an operation box that can be used in positive pressure and in vacuum, so it does not require a pressure control or a flow rate test. Due to the weight reduction and cost of aerospace products, the actual operation box has limited pressure resistance. Therefore, this paper measures various flow rates to ensure product safety.
The pressure bearing capacity of the operation box directly determines the pressure difference control parameter during the gas inflation and exhaust process. The pressure difference should be determined first for the control strategy. The pressure bearing capacity is obtained through simulation calculation. The main materials used in the operation box are as follows: aluminum alloy as the box material has a strength of 455 MPa, while polycarbonate as the door material has a strength of 64 MPa.
The maximum pressure difference that the operating box can withstand is given by Equation (1) as follows:
where Δ
P is the pressure difference, AL is the aluminum alloy, and PC is the polycarbonate.
The simulation process of the operation box is shown as
Figure 2. Through simulation calculation, the operation box reaches the yield strength when the pressure difference is 90 kPa. Considering that there may be certain errors in the simulation, more than four times redundancy is reserved for the operation box to ensure safety. Therefore, the maximum allowable pressure difference of the operating box is 20 kPa.
2.2. Key Parameter in Gas Charging and Exhausting Strategies
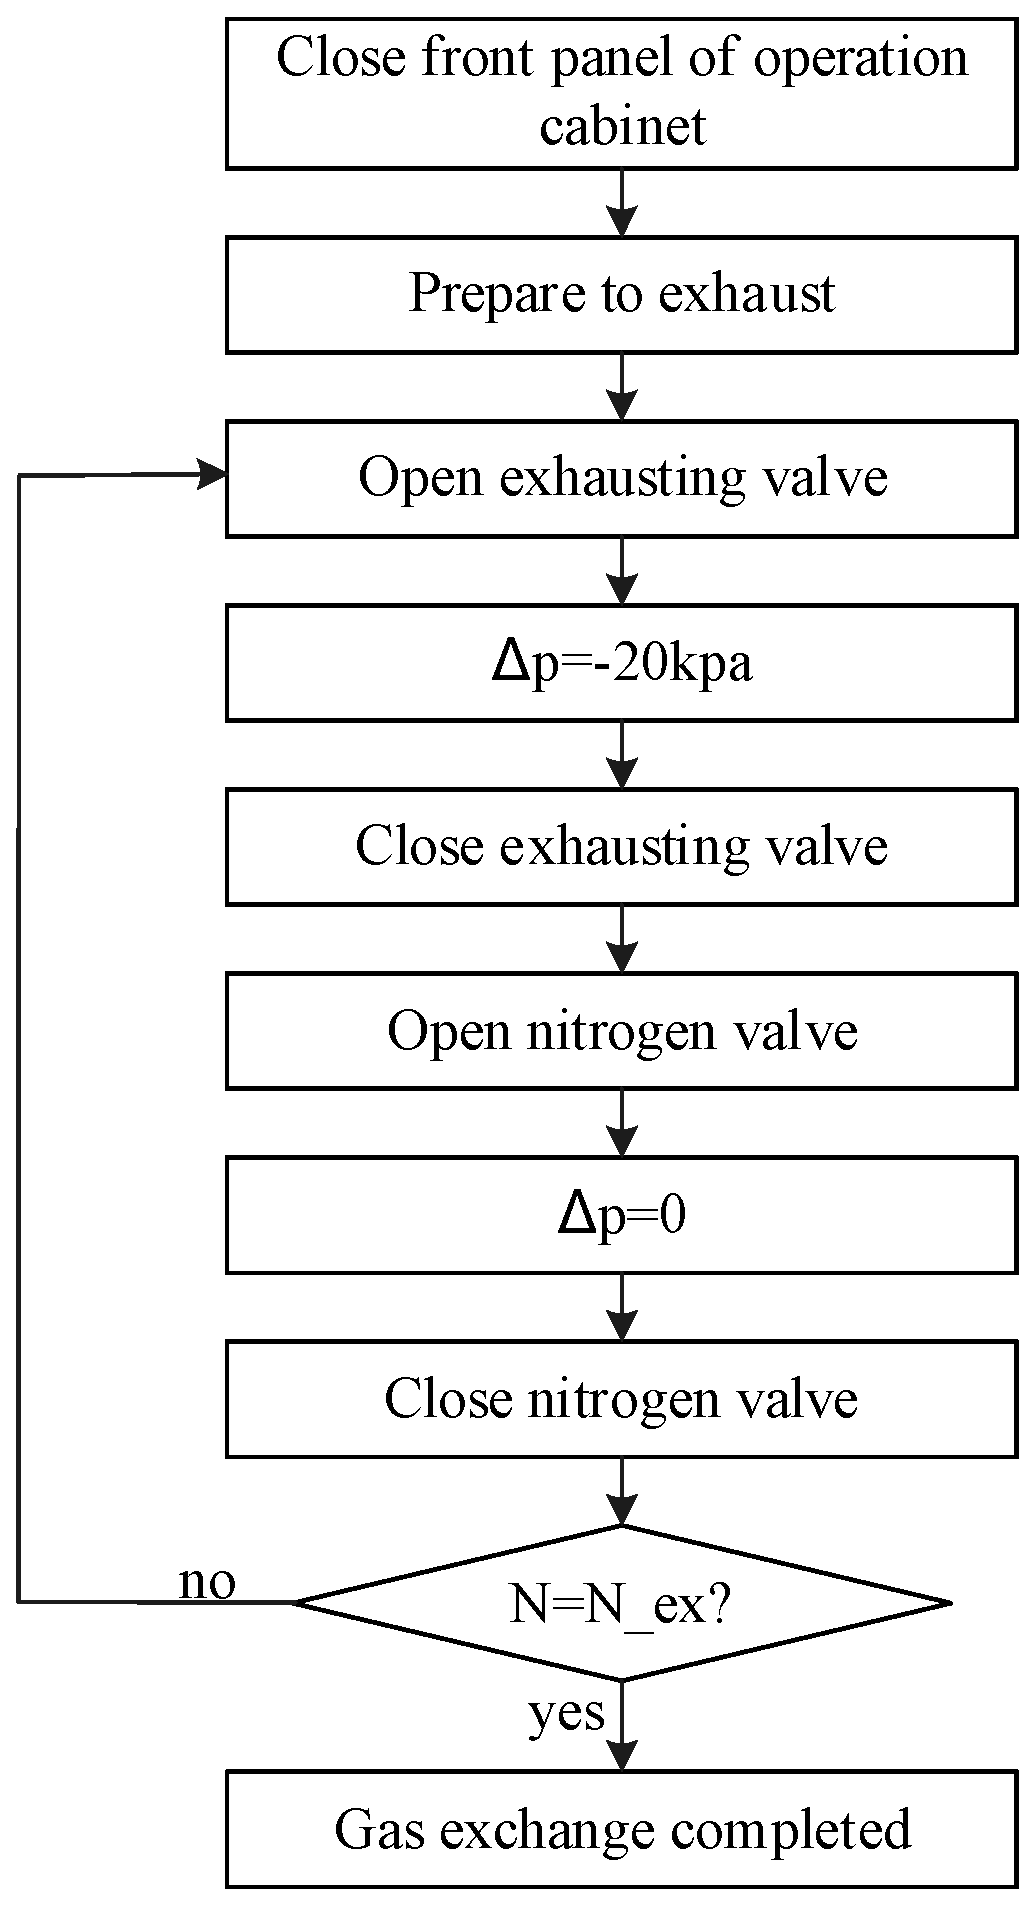
In order to prevent air leakage in the cabin, the operating box is used in a negative pressure environment for a long time. According to the control value of 20 kPa, its operating pressure is 0~−20 kPa gauge pressure. The corresponding control strategy is shown in
Figure 3 and
Figure 4. When gas replacement is required, the exhaust gas is discharged first through the ES, and then nitrogen or fresh air is filled in through the NS or the AS.
The control process depends on the pressure difference between the MMW operation box and the cabin environment, which is shown as
Figure 5. These data can be directly collected and controlled by a pressure sensor.
The change rate of the pressure difference can also be used as a criterion for whether the valve is open. Therefore, during the design and testing process, the change in the pressure difference in the operating box during charging and exhausting is a key parameter.
2.3. Lumped-Parameter Method
During the gas supply and exhaust process, the relationship between pressure and flow rate can be expressed by the following formula.
Assuming the flow resistance coefficient is fixed, we can obtain the following:
where
P is the pressure in the gas container,
Pout is the pressure out of the cabin,
k is the flow resistance coefficient, and
mf is the flow rate.
In the operation box, the state equation is as follows:
It can be seen that, when the external pressure conditions are determined, ignoring the temperature changes and gas constant changes, the system flow resistance determines the pressure change rate of the operation box.
For the terminal environment and operation box, the lumped-parameter network method can be considered to calculate the flow parameters. For example, the operation box could be considered to be at a uniform pressure and volume (
P,
V), which is convenient for system simulation and testing. Considering the large number of components, the components of the lumped-parameter network were categorized according to whether they are inside or outside the MMW, which is shown in
Figure 6.
During the design process, especially in the planning stage, the problem of unclear flow resistance of some gas paths will be faced. The control strategy of the MMW is to use pressure as the control target and time as the safety judgment. There is a direct relationship between the gas supply time and the flow rate and flow resistance. Therefore, the prediction of flow rate and flow resistance is very important in the design and testing of the gas system of the MMW. The method of fixed flow resistance coefficient was used for simulation and testing, and the IGS was simplified into an equation with the pressure difference ΔP, flow rate m, and flow resistance coefficient k.
In order to calculate, test, and analyze the flow resistance, pressure, and other parameters in the IGS design process, this paper adopts a multi-stage design method. The five-year development cycle is divided into seven major stages, and different methods are used in each stage to predict and analyze the flow parameters.
- (1)
Theoretical modeling simulation stage: At the early stage of development, the system parameters are predicted by theoretical formulas or models in simulation software.
- (2)
Semi-physical simulation stage: There are already physical components for actual measurement to determine the flow resistance coefficient and conduct refined simulations. The IGS is simulated and tested according to the model, and the flow resistance, flow rate, etc., are preliminarily evaluated to determine whether the gas supply strategy is appropriate.
- (3)
Gas supply strategy verification stage: By approaching the real operating box, the air supply strategy and air supply algorithm are verified.
- (4)
Obtaining external system parameters stage: According to the development progress of the entire cabin, the method of replacing components/products can be used to conduct actual measurements of the Cabin-NS and the Cabin-ES. This stage mainly has two methods: replacing the Cabin-NS pipeline with the same length pipeline to simulate the nitrogen supply and replacing the operation box with a sealed container to exhaust using the Cabin-ES pipeline. Through the test, further accurate test data can be obtained.
- (5)
Product refinement test stage: After obtaining accurate external parameters, further comprehensive tests simulating the real environment are carried out.
- (6)
The whole cabin is in the ground test stage: IGS is accompanied by the cabin to conduct ground tests close to the real environment.
- (7)
On-orbit test stage: After launch, IGS is tested for air supply and exhaust in real space environments to determine the safety control parameters of the real gas supply.
3. Simulation and Verification
After determining the system design and control strategy, the following test matrix was considered based on the seven development stages of the IGS. This design and test method comprehensively considers the development progress and interface relationship of different systems.
The meaning of the characters in
Table 1 is shown below.
- (a)
S is the simulation model.
- (b)
SE is the experimental simulation model, which is closer to reality than the simulation model.
- (c)
E is the engineering test product, which has some differences from the real product.
- (d)
A is the alternate product (or environment), which is a product used to simulate some parameters of the real product.
- (e)
R is the real product (or environment).
Table 1.
Design and test matrix.
Table 1.
Design and test matrix.
| Development Stage | System or Interface |
|---|
| Operation Box | MMW-ES | MMW-NS | AS | Cabin-ES | Cabin-NS | Vacuum Environment Outside | Nitrogen Supply Container | Cabin Environment |
|---|
| 1: Theoretical modeling and simulation | S (a) | S | S | S | S | S | S | S | S |
| 2: Semi-physical simulation | SE (b) | S | SE | SE | S | S | S | S | S |
| 3: Gas supply strategy test | E (c) | E | E | E | A | A | A | A | R |
| 4: External system test | A (d) | A | A | / | R | E | A | R | / |
| 5: Detailed product test | R (e) | R | R | R | A | A | A | A | R |
| 6: Final ground test | R | R | R | R | R | R | A | R | R |
| 7: On-orbit test | R | R | R | R | R | R | R | R | R |
It can be seen that, during the testing process, we used simulation models, experimental simulation models, engineering test products, alternate products, and real products throughout the entire development process.
Among them, the simulation model is used to make an early estimate of the product’s performance during the scheme design and prototype design processes.
The test simulation model is used after the components have been selected or finalized. When there are ground components with similar specifications, the existing test data are used to iterate into the simulation model to predict the performance again.
Engineering test products are engineering parts and prototypes that are similar to real products. Their structure and performance are basically equal to those of real products, so they can be tested to predict the real performance.
Alternative products have similar structure or parameters and participate in system testing through substitution and calculation.
In the development process of common aerospace products, there are generally three stages: project design, engineering product, and real product. The theoretical modeling and simulation described in this paper are in the project design stage; the strategy test is in the engineering product stage; and the last two stages belong to the real product stage.
3.1. Theoretical Modeling and Simulation
Simulation is important for the design of fluid systems and the finalization of components. Some mature commercial software comes with some general models that can be used for gas supply systems. Chen used DYNSIM to implement a dynamic simulation system for air separation and high-pressure nitrogen pipelines [
13]. Zhang used Flomaster to simulate the gas exhaust duct network [
14]. Gray used Flomaster to simulate an active flow control system [
15]. Sathiyaseelan and Feng used AMESim to simulate the environmental control system and the fuel supply system of aircraft [
16,
17]. Dong et al. used EASY5 to simulate the refrigeration fluid system [
18].
These simulation software have built-in component models to achieve good simulation results.
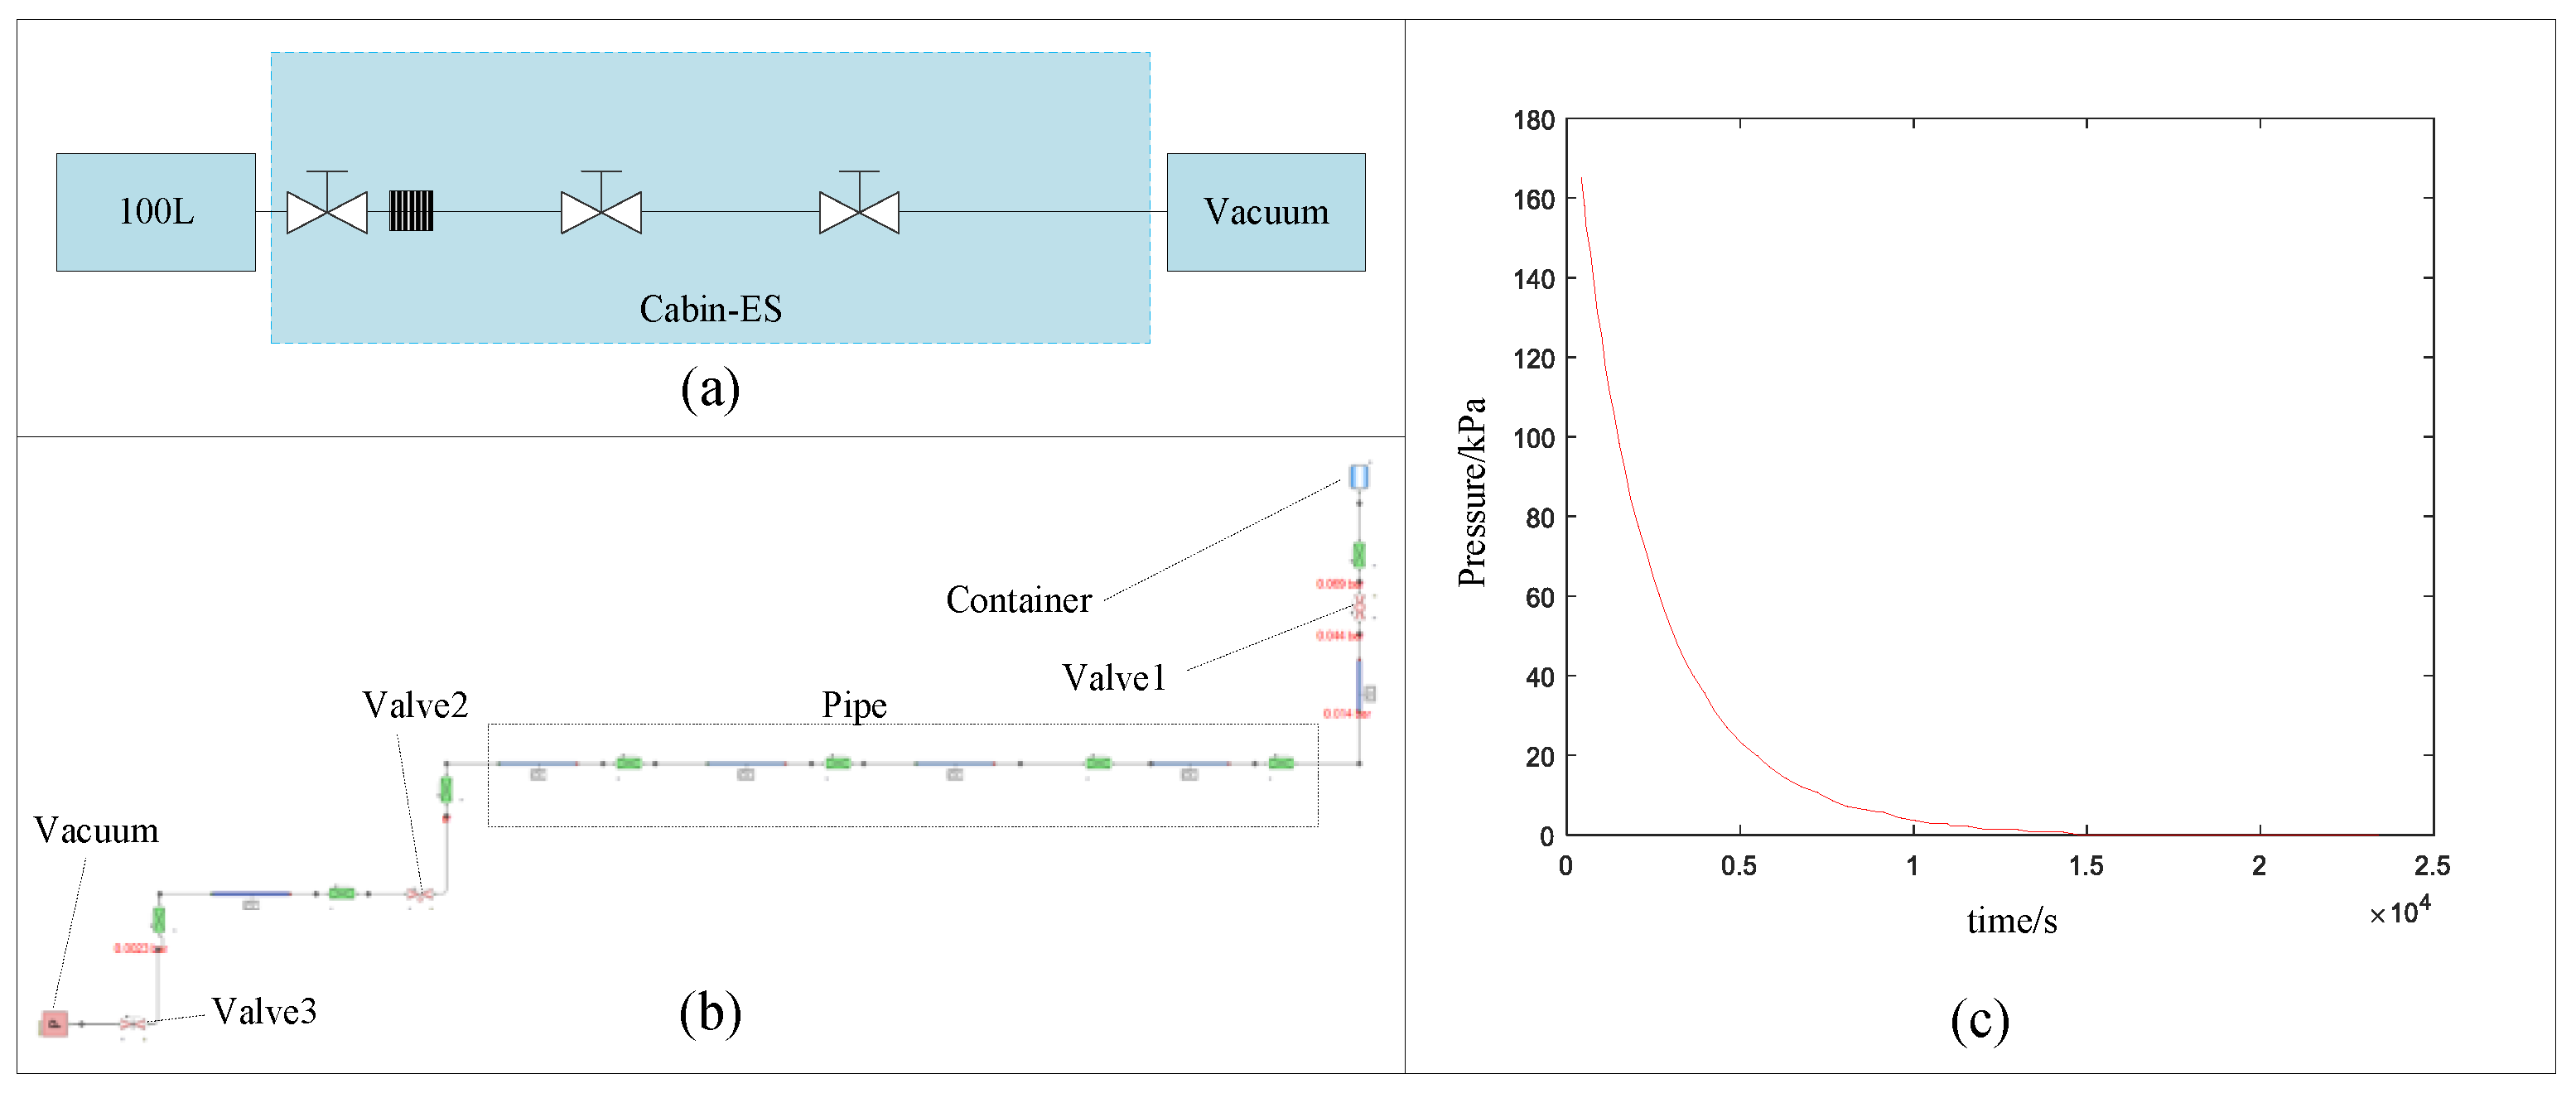
In the early stage of development, Flomaster (version 8.0) was used to theoretically model the system of pipes, valves, and filters. The model of the MMW-ES and the curves of pressure and mass change in the operation box during exhaust are shown in
Figure 7.
The flow resistance of the MMW-ES was unknown at this stage, and the flow resistance of the Cabin-ES could only be estimated from the data given by other teams. The exhaust capacity of the Cabin-ES was estimated. Based on the data from the Cabin-ES team, we obtained the curve for the Cabin-ES: in 4 h, the pressure of a 100 kPa, 100 L container can be reduced to less than 100 Pa. The curve is shown in
Figure 7c.
The internal volume of the operating box was approximately 380 L. The pressure curve of the operating box is shown in
Figure 8. The initial pressure was 100 kPa. After about 0.5 h, the pressure inside the operation box dropped to 80 kPa (−20 kPa pressure difference). A pressure difference of −20 kPa is the safety threshold, so the corresponding safety time was 0.5 h.
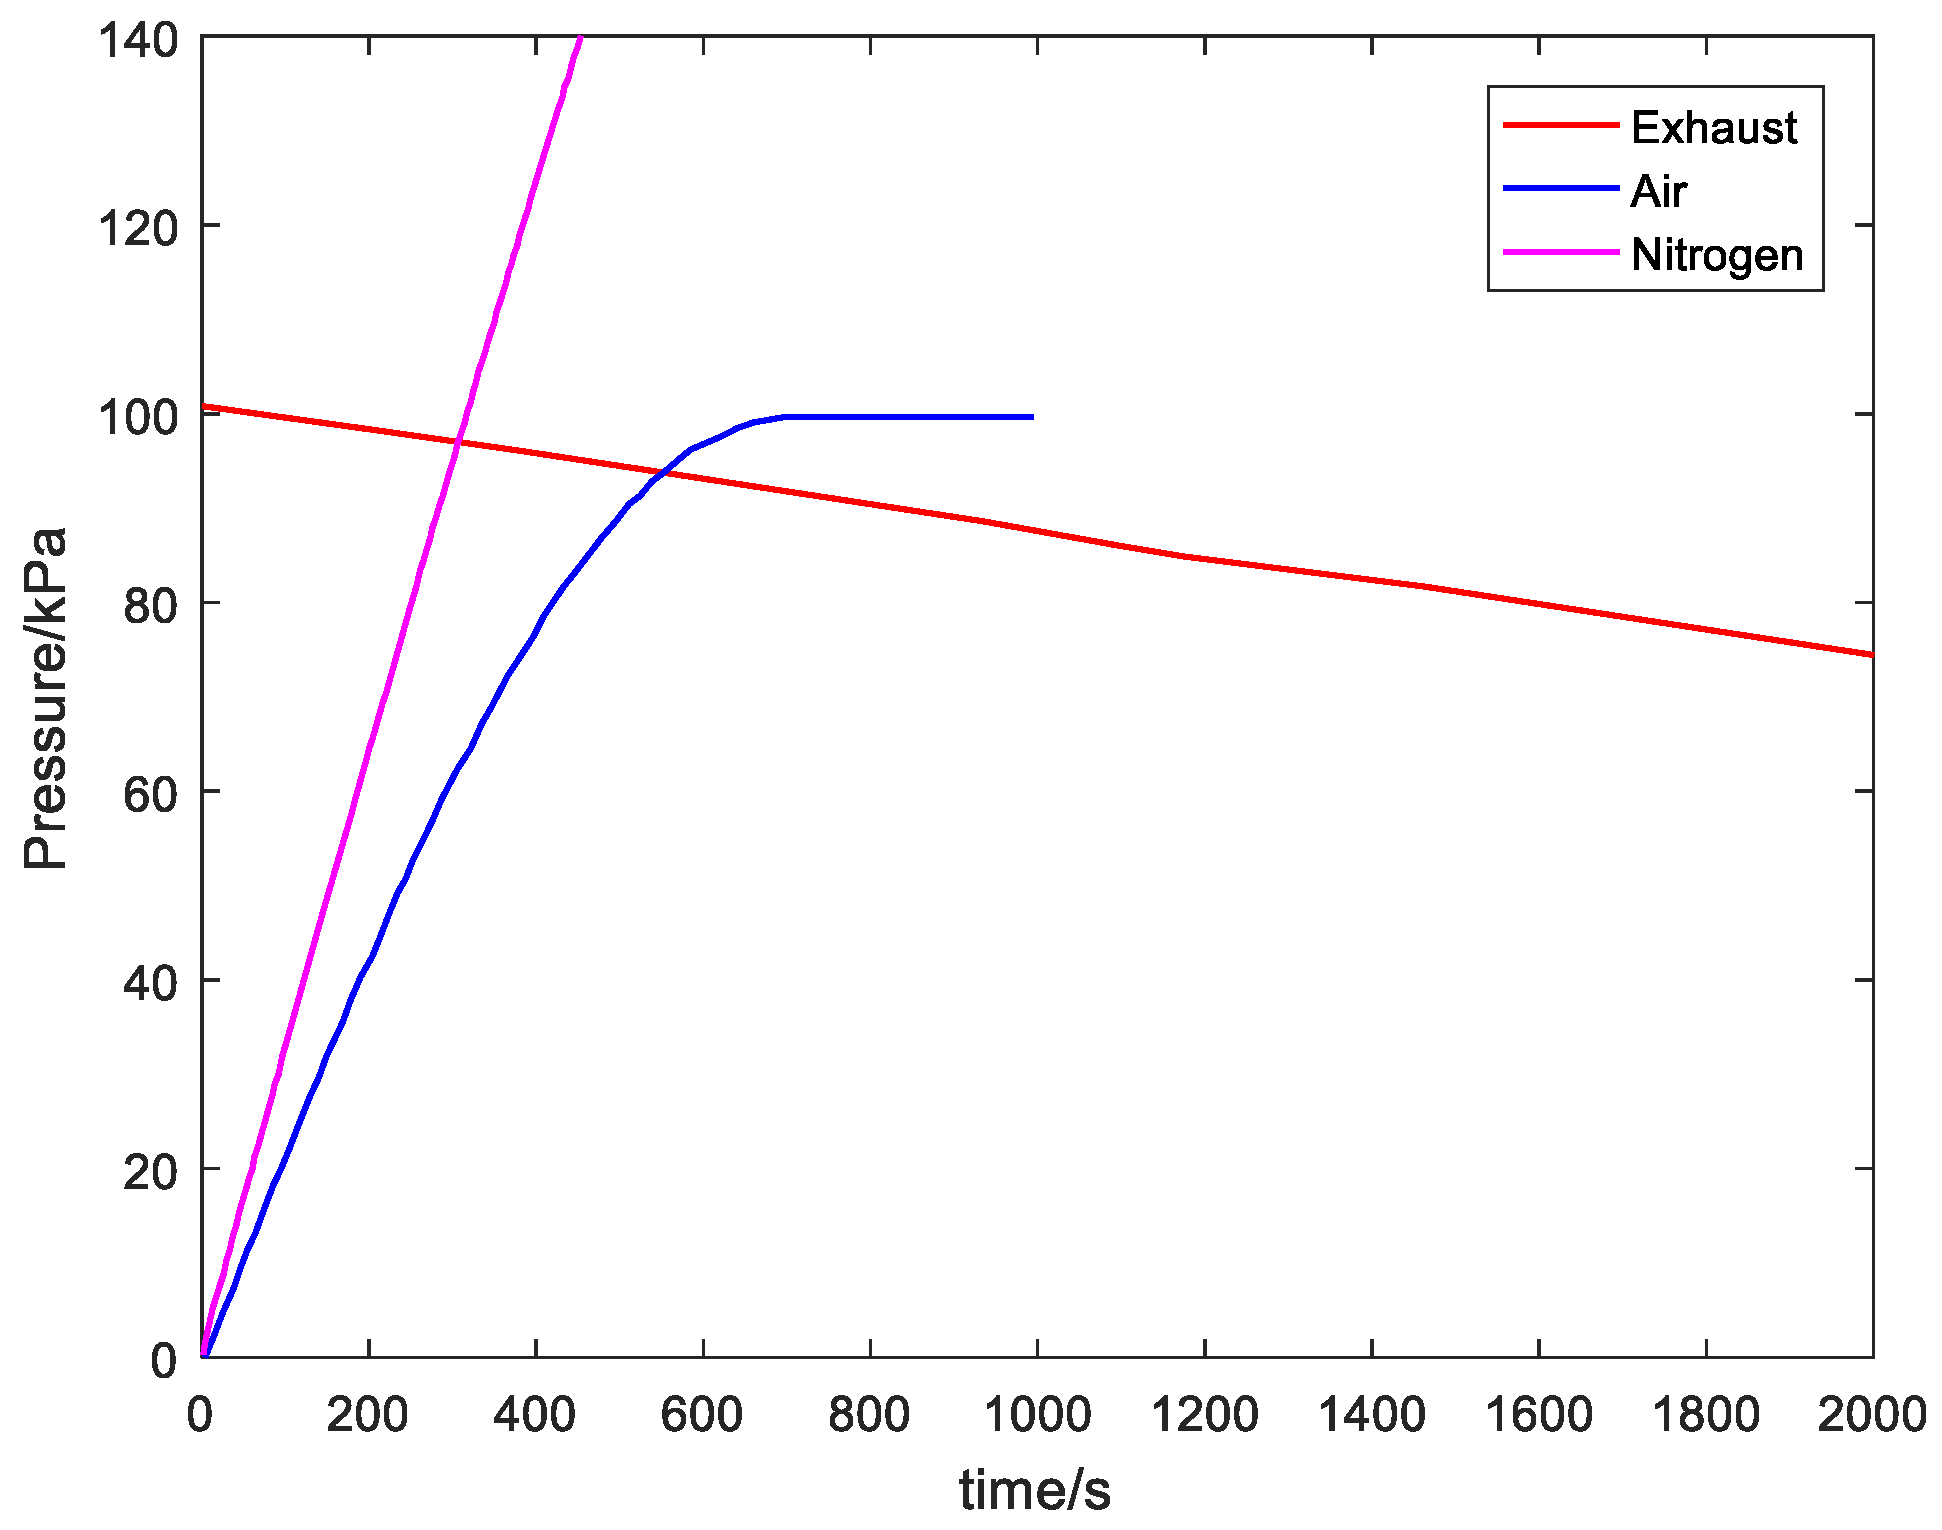
The pressure change rates of the ES, NS, and AS can be obtained from
Figure 8. The pressure difference change of the operating box caused by ES(Δ
Pes) was −14 Pa/s. The pressure difference change of the operating box caused by NS(Δ
Pns) was 304 Pa/s. The pressure difference caused by AS(Δ
Pas) was about 56 Pa/s. These parameters were obtained by simulation calculation and used to predict the system performance, but there was a certain gap between the simulation and the actual testing parameters.
3.2. Semi-Physical Simulation
At this stage, some components and systems already have physical objects. Pipes and valves with similar specifications were used to test the MMW-NS and AS. Filters and quick disconnects were applied in the operation box to test the nitrogen charging and air charging. The test site is shown in
Figure 9.
The flow resistance of the AS and the MMW-ES could be measured, and the NS could be simulated after correction, as shown in
Figure 10.
The rates of nitrogen, exhaust gas, and air were obtained by semi-physical simulation and are presented in
Table 2. The corresponding time control threshold and rate could be applied to the control simulation of the IGS.
The nitrogen replacement curve and the air replacement curve are shown in
Figure 11. When nitrogen form the nitrogen supply system was used to supplement the exhaust gas, it took about 6.5 h to reach a 90% replacement effect and about 8.5 h to reach a 95% replacement effect. In total, 14 working cycles of the exhaust valve and the nitrogen valve were required. During the entire nitrogen replacement process, a total of 1109 L of nitrogen was required. When air from the cabin was used to supplement the exhaust gas, it took about 7.3 h to reach a 90% replacement effect and about 9.5 h to reach a 95% replacement effect. The number of nitrogen or air replacement cycles could be modified by sending commands on orbit as needed.
Through theoretical simulation and semi-physical simulation of the IGS, the feasibility of the replacement strategy was theoretically verified. The nitrogen supply had an advantage on time, so it is the preferred method for gas replacement in the operation box.
3.3. Gas Supply Strategy Test
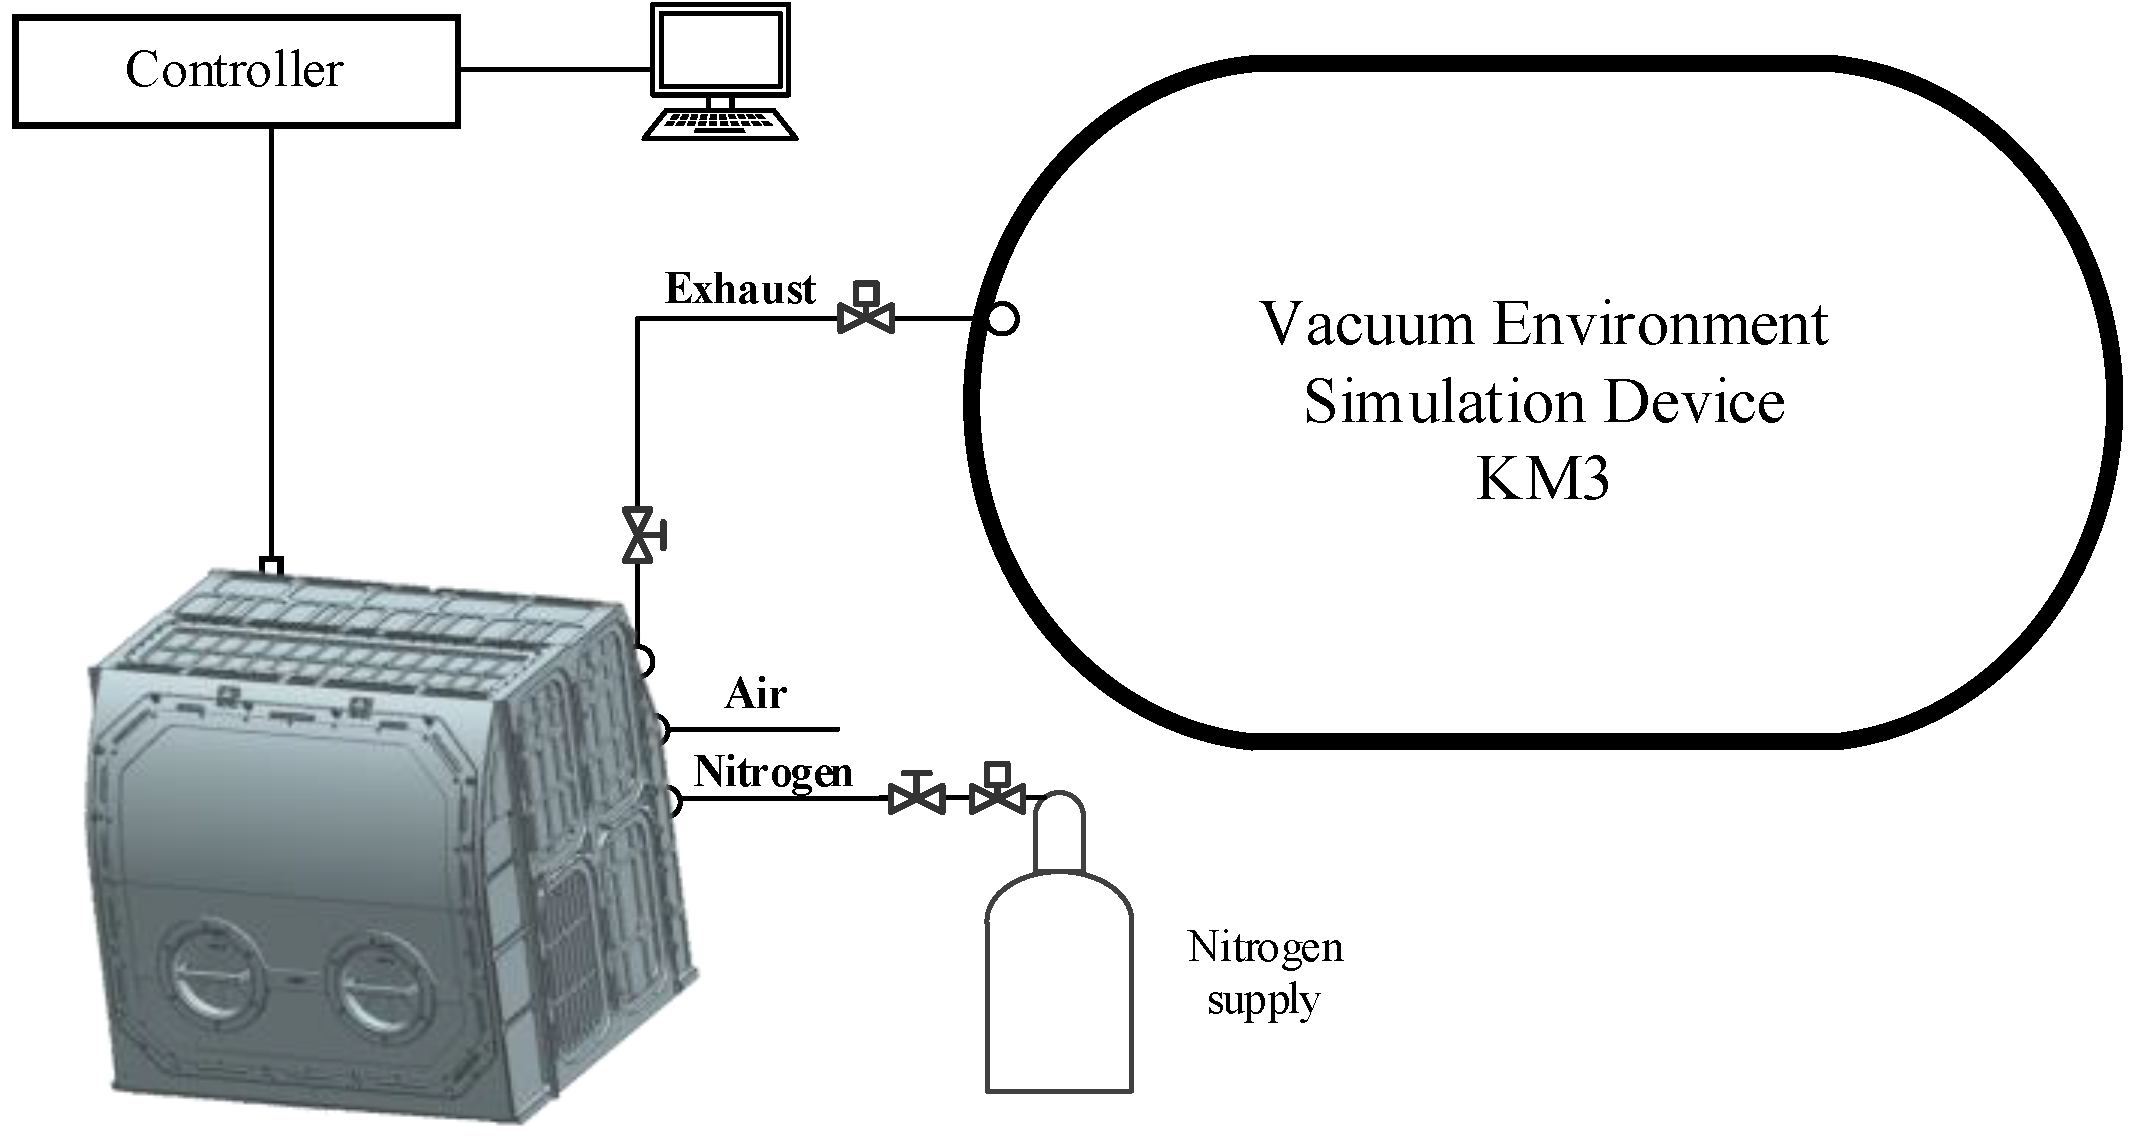
After completing the engineering prototype of the MMW, an IGS test system was built to verify and test the strategy, which is seen in
Figure 12.
The engineering prototype is basically consistent with the final MMW. The MMW-ES, MMW-NS, AS, and the volume of the operation box are close to the final IGS. At this stage, there is no progress in the development of external interfaces including the Cabin-ES and the Cabin-NS, so we can only simulate them, respectively, using valves to adjust the flow resistance.
The cabin environment can be replaced by the atmospheric environment, which is basically the same. The real extra-cabin environment is a vacuum environment with infinite volume. The KM3 vacuum simulator was used, which has a volume of 70 m
3 [
19]. It is much larger than the volume of the operation box and can be considered close to the real vacuum environment. The nitrogen supply was simulated using a nitrogen bottle with a pressure regulating valve. The test equipment are listed in
Table 3.
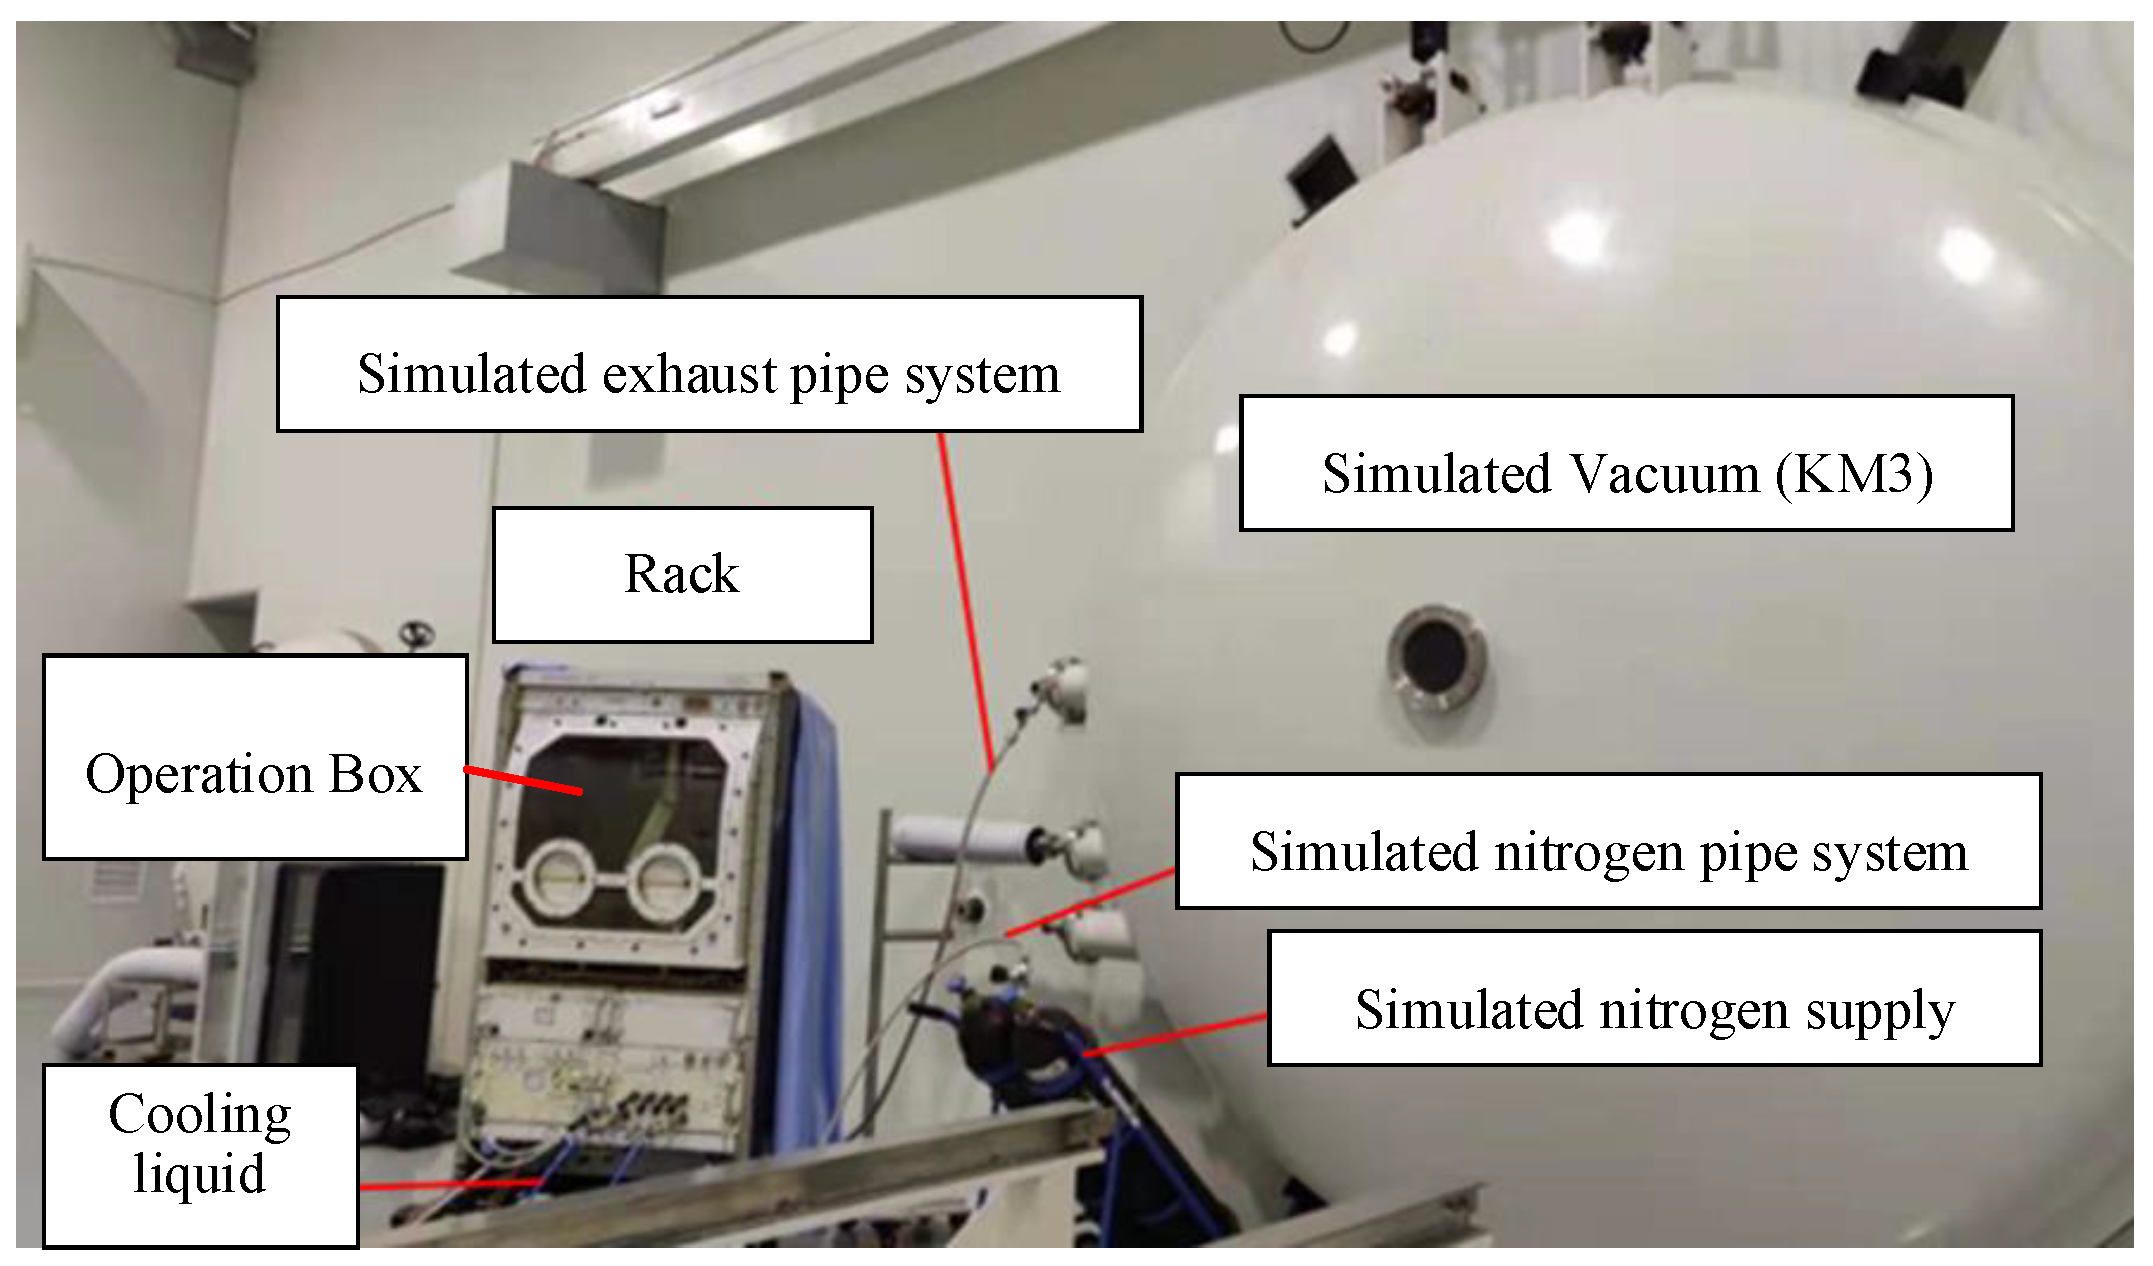
The test environment and system are shown in
Figure 13.
Through the testing of the MMW rack with the external systems, we fully verified the control strategy. The results are shown in
Table 4.
During the strategy test, the Cabin-ES was simulated using the previous simulation results. The Cabin-NS used a manual valve to simulate the flow resistance of pipe systems, and the flow rate was greatly reduced. The hardware and software related to the control strategy were not complete during this stage. If the nitrogen flow rate is too large, it may not be controlled in time, causing damage to the product. For safety reasons, the nitrogen flow rate was controlled to be close to the exhaust gas flow, and this was used as the threshold to verify the control strategy. The control algorithm and control threshold were all in line with expectations. In addition, the charging and exhausting time were further calibrated in a more realistic KM3 environment.
3.4. External System Test
3.4.1. Exhaust System Test
The Cabin-ES system is independent of the MMW system, with different development teams, locations, and schedules. However, the performance of the IGS depends on both the MMW-ES and the Cabin-ES, so a special method needs to be designed to obtain the flow parameters of the Cabin-ES. The schematic diagram of the Cabin-ES interface verification and test is shown in
Figure 14.
The Cabin-ES has real pipes and valves, but there was no operation box in the cabin and no external vacuum condition outside it. Therefore, a simulation system was used to simulate the external environment and the operation box, which is detailed in
Table 5.
From Equations (2) and (3), we can obtain the relationship between pressure change and time, as shown in Equation (4):
where
V is the volume of cylinder,
R is the gas constant, and
T is the temperature.
Through the above calculation method, the flow resistance coefficient can be obtained from the exhaust interface test with the Cabin-ES and the simulation system. This method no longer relies on real products and real vacuum environments, which greatly reduces the difficulty of testing.
The test process was divided into two steps:
First, the gas container was installed on the cabin and charged through the nitrogen supply system outside. After gas charging was completed, the charging valve was closed, and the gas container was allowed to cool down for a period of time to the initial temperature. Then, the exhaust valve was opened and the exhaust test from the container to the Cabin-ES was initiated.
3.4.2. Nitrogen System Test
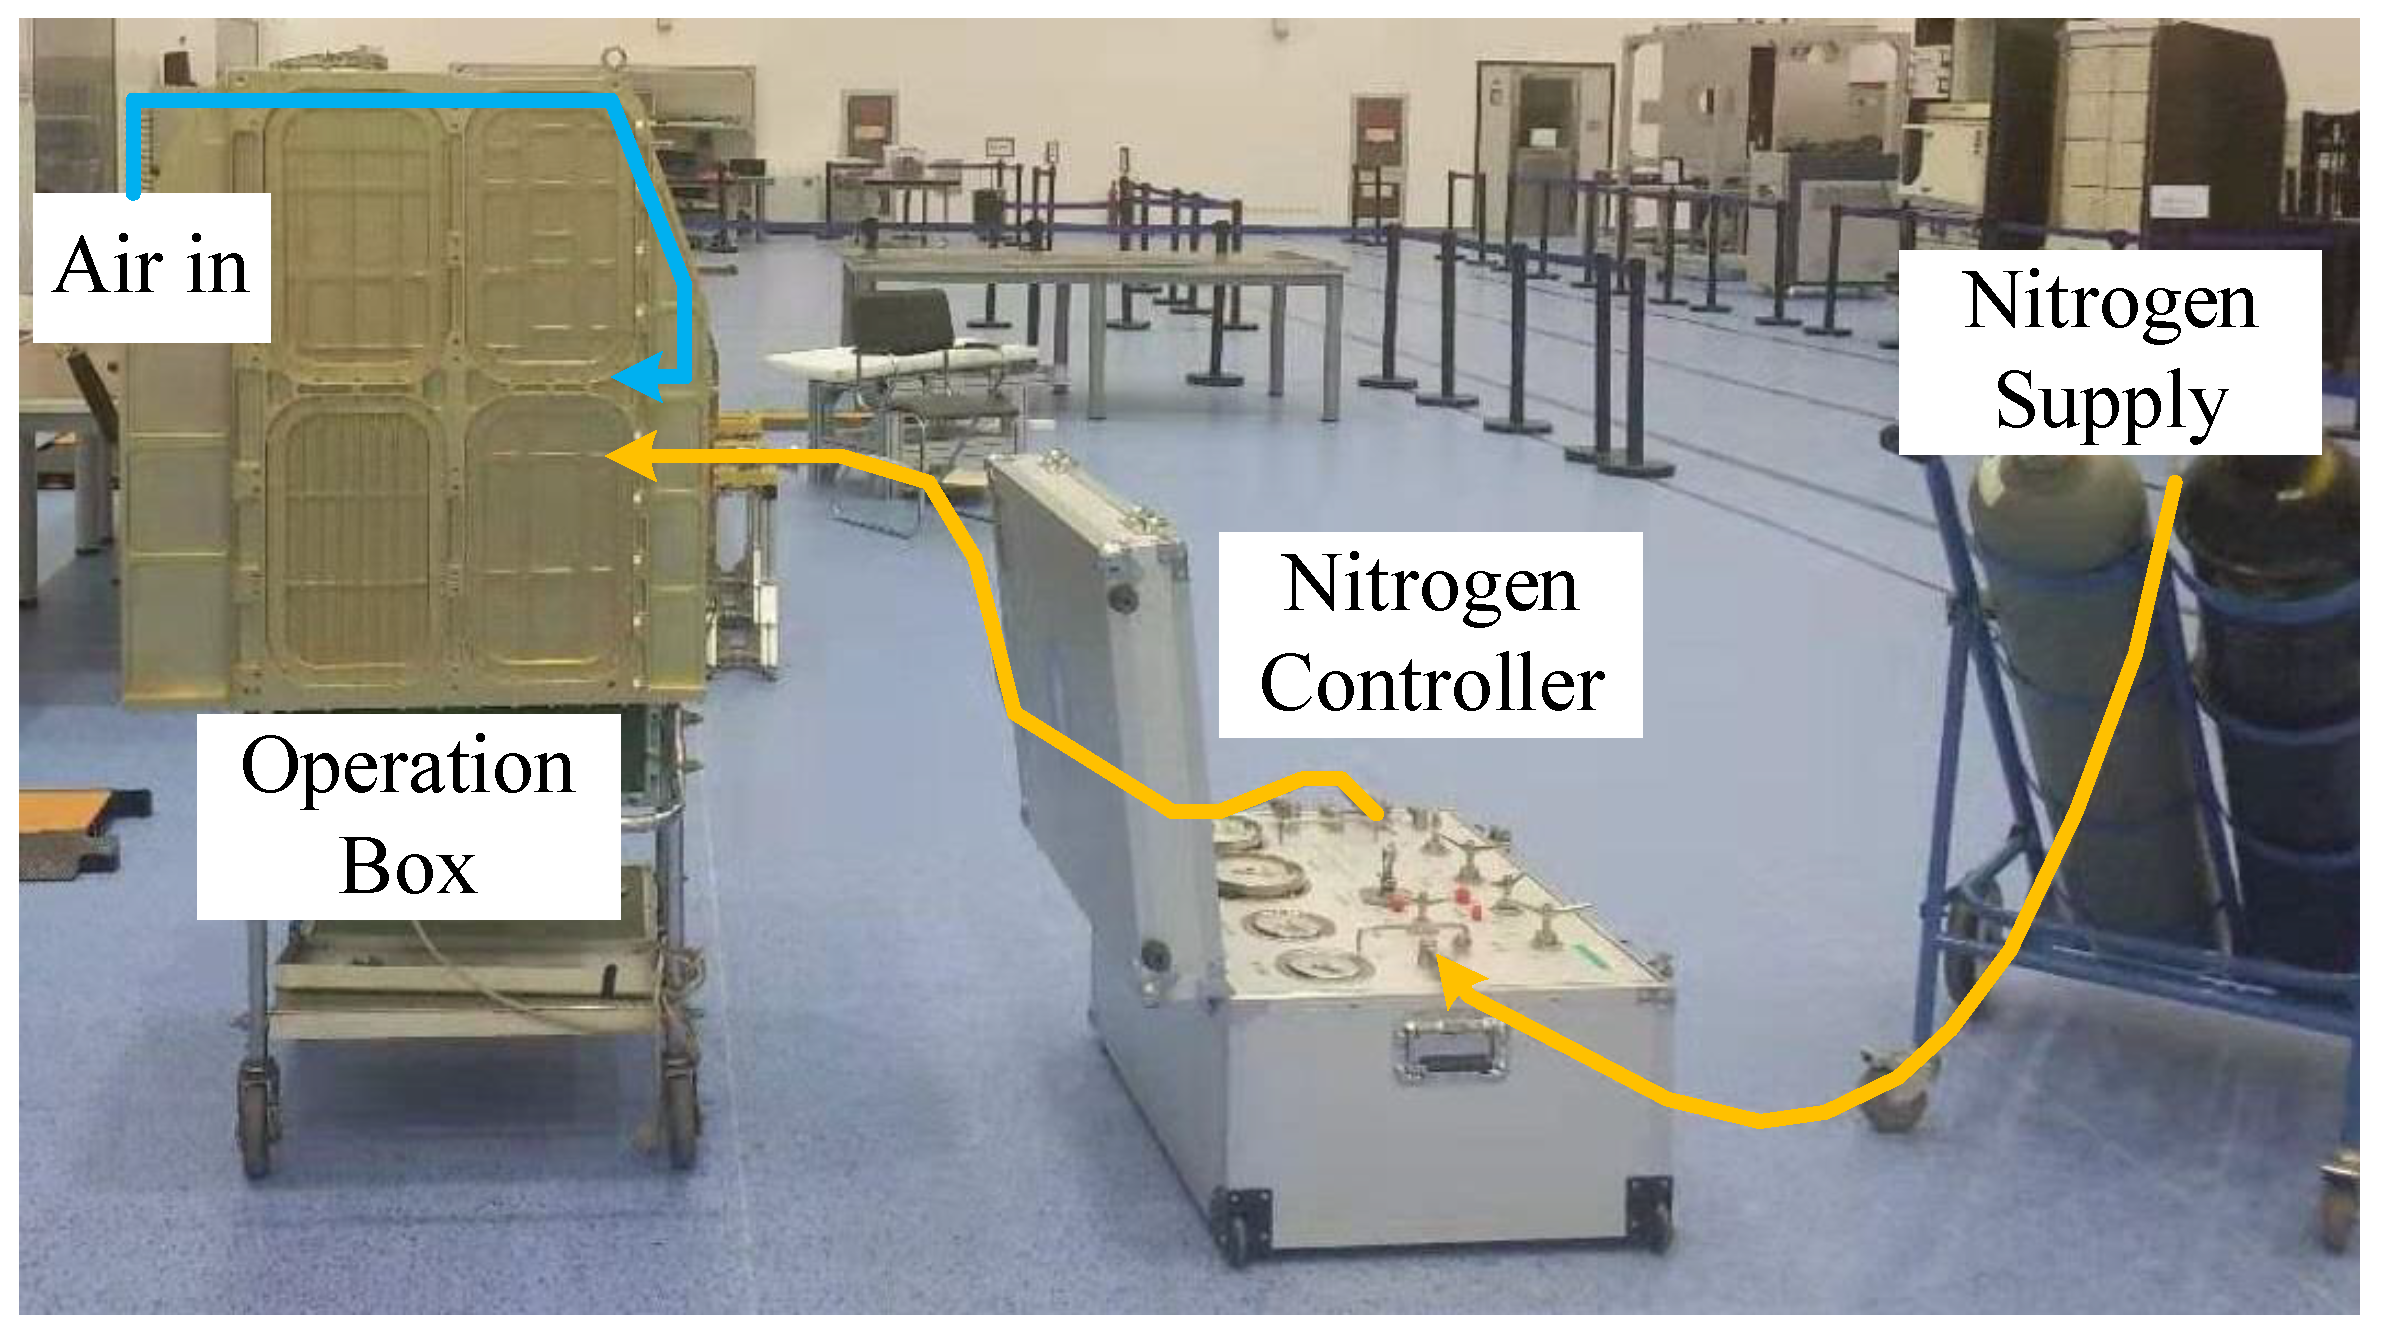
The Cabin-NS has different development teams, locations, and schedules like the Cabin-ES. A special method was designed to obtain the flow parameters of the Cabin-NS.
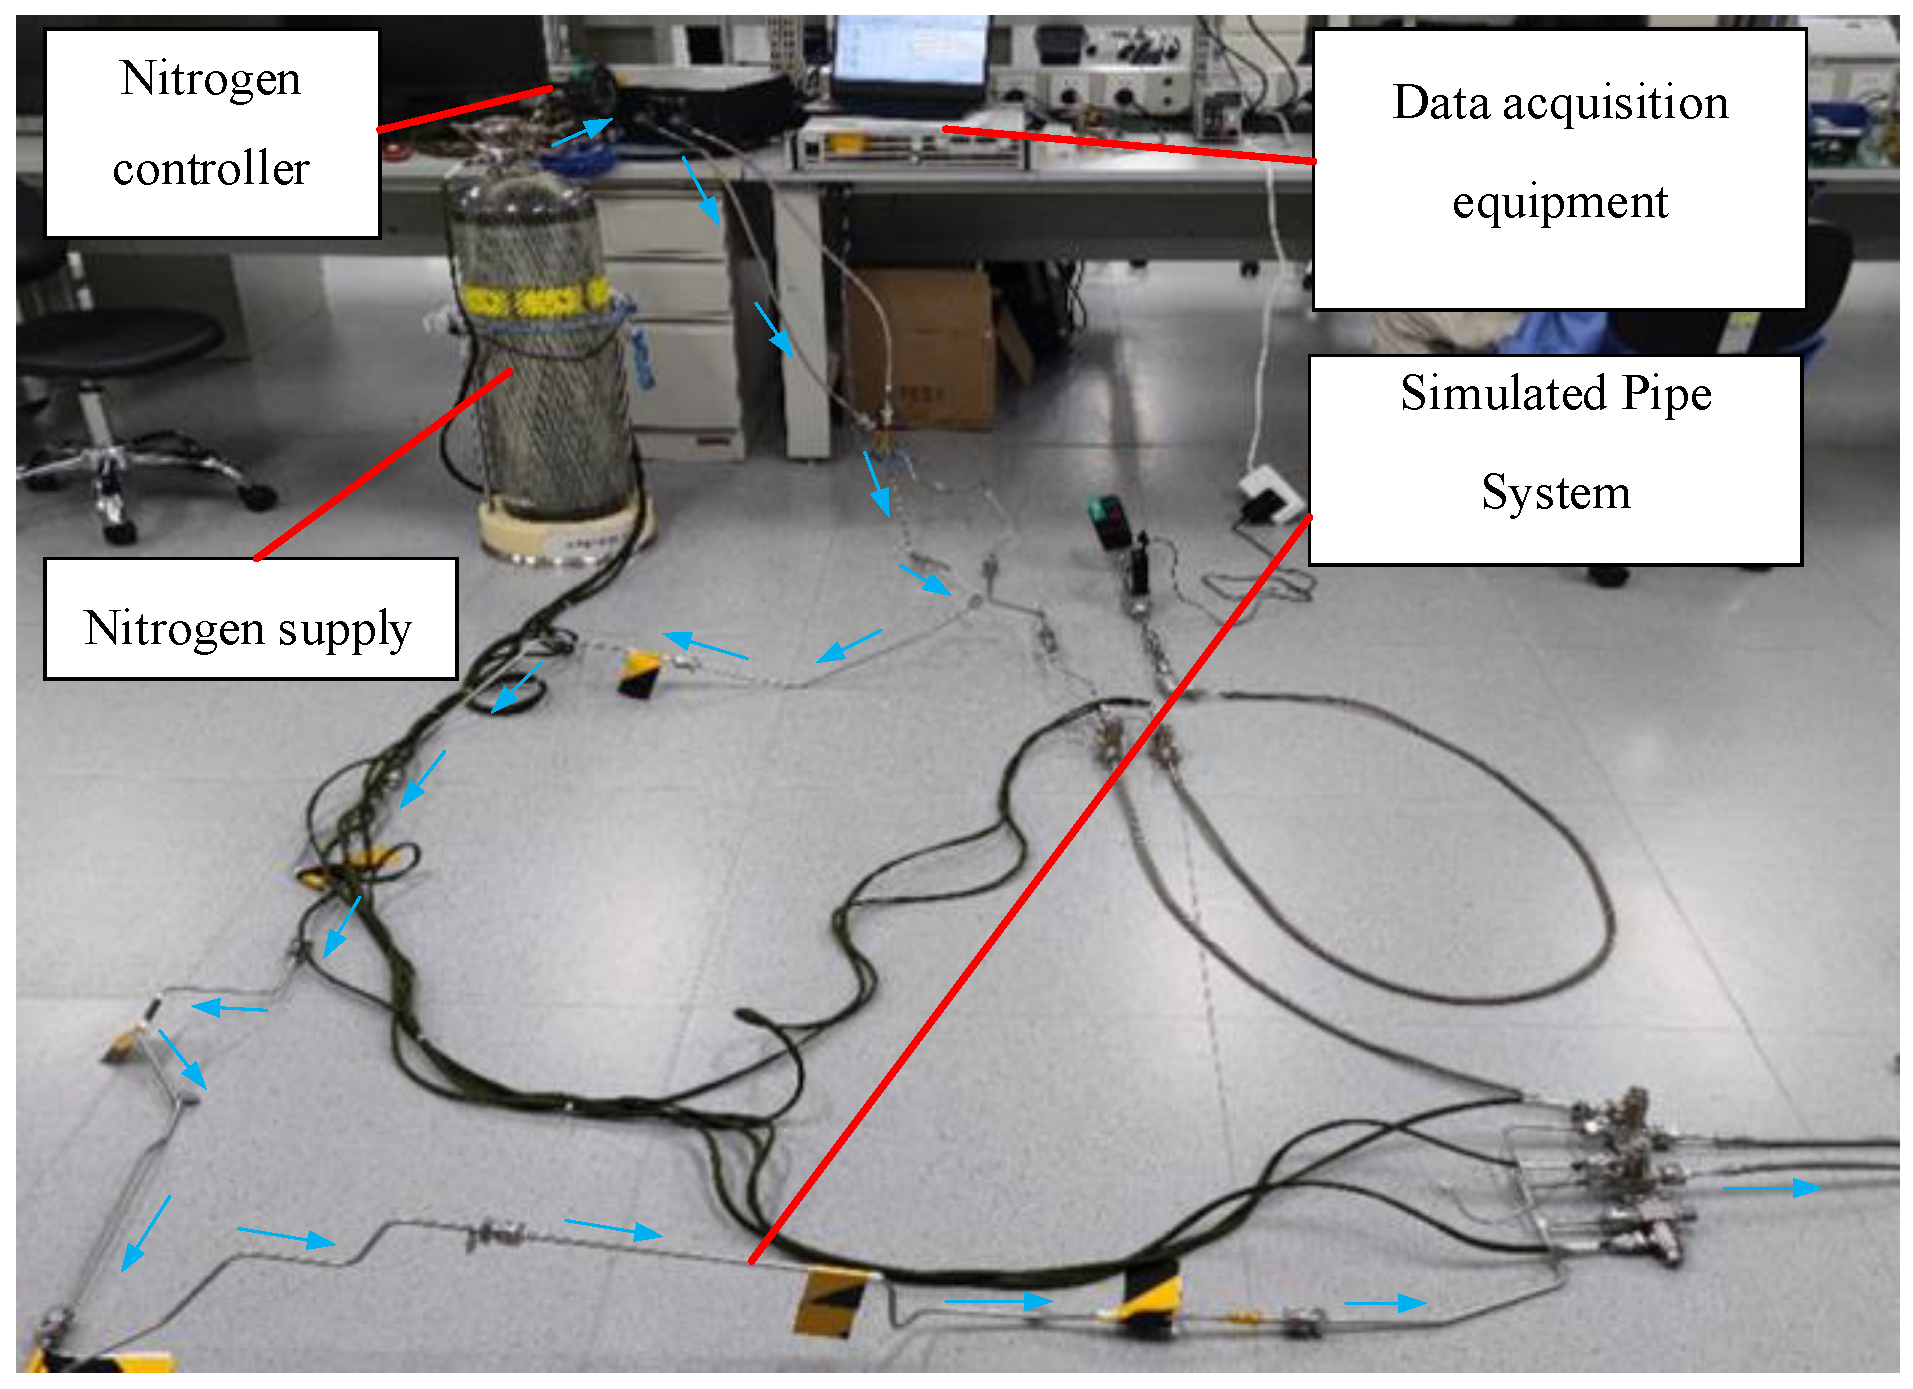
The Cabin-NS consists of gas cylinder components, controllers, complex pipe network systems, valves, etc. In the development process, during which the MMW cabin could not be connected, a virtual ground pipeline was built for testing, which is seen in
Figure 16.
The constructed test system is shown in
Figure 17. At this stage, the nitrogen cylinder assembly, controller, and cabin are in the same state. The test pipeline is developed according to the pipeline model of the cabin, and the length, bend, diameter, and other dimensions are basically the same as those of the final product. The test can obtain more realistic data.
The test results are shown in
Figure 18. By testing the curve and using the calculation method used for the Cabin-ES, the flow parameters of the Cabin-NS can be obtained.
3.4.3. External Interface Data Summary
After testing the simulation interface of the Cabin-ES and the Cabin-NS, the calculation method in this paper can obtain more accurate flow resistance for the Cabin-ES and Cabin-NS. Putting the flow resistance parameters into the entire IGS system, combined with the accurate flow resistance of the MMW-ES and the MMW-NS, a more accurate exhaust gas rate and nitrogen charging rate can be predicted. The results are shown in
Table 6.
3.5. Detailed Product Test
In the previous stage, the engineering prototype of the MMW rack was tested. And, through the simulation interface method, the Cabin-ES and Cabin-NS were tested and accurate data were obtained.
At this stage, the MMW rack was developed to obtain a physical object that is exactly the same as the final product. A test system based on the test data and the real product was built, which is shown in
Figure 19. The KM3 vacuum simulator was again used to simulate the vacuum environment. Hand valves were used to simulate the flow resistance of the Cabin-ES and the Cabin-NS.
During the detailed test, the following pressure change rates could be obtained and used as key parameters of the control process. These parameters were written into the product controller, as shown in
Table 7.
3.6. Final Ground Test
Before the launch of the cabin, the MMW rack was given the opportunity to connect and test with the real external system. At this stage, the Cabin-NS and Cabin-ES were both real products. The entire IGS was tested for nitrogen charging and gas exhaust, and the control strategy was finally verified. The test schematic diagram of the IGS is shown in
Figure 20.
In this test, the cabin environment, the MMW rack, and the nitrogen and exhaust systems were completely consistent with the final on-orbit state. The only thing that needed to be simulated was the vacuum environment outside the cabin. This test used the KM8 vacuum simulation equipment [
20], which has a volume of 6000 m
3. The exhaust gas has basically no effect on it, and it is closer to the real vacuum environment than the KM3.
The pressure changing curve and data obtained through the final ground test are shown in
Figure 21 and
Table 8. It can be seen that the pressure change rate of the operation box was basically close to the prediction of the detailed product test shown in
Table 7, indicating that the simulation method designed in this paper is effective.
3.7. On-Orbit Test
After the CSS is launched into orbit, the MMW is started at an appropriate time. The performance of the nitrogen charging, gas exhaust, and air charging is tested on orbit. The results are shown in
Table 9.
It can be seen that the on-orbit test results are basically consistent with those for the final ground test. The prediction method of the key parameters of the IGS in this paper is reasonable and effective.
3.8. Summary of Gas Supply Parameters at Different Stages
The simulated or tested values of the nitrogen charging, gas exhaust, and air charging rates at each stage are summarized in
Figure 22.
It can be seen that the AS is relatively controllable as a standalone system in the MMW. The interface of the AS is limited to the operation box and the cabin environment. Therefore, the simulation and testing of the AS does not require the combination of multiple systems, so the error is small from simulation to final confirmation.
The rate of nitrogen filling changes significantly throughout the development process. The biggest change is in the gas supply strategy test stage due to safety reasons. In order to ensure the safety of gas use, the nitrogen flow rate is controlled close to the exhaust flow rate.
By comparing with the data from on-orbit tests, the error rates between the previous stages were calculated, as shown in
Figure 23. The process in which the exhaust gas rate changes the most is at the external system test stage. Before this stage, the data of the Cabin-ES provided to the IGS were only predicted and simulated. The flow parameters were corrected after external system testing, and the error rate decreased from 85% to 12%, which is shown in
Figure 23. The flow parameter basically remained at the same level during the subsequent detailed product test, final ground test, and on-orbit test. The error rate of the AS is basically very small during the strategy testing stage as it is relatively independent. The difference from the detailed product testing is mainly due to the design differences between the engineering products and the real products. The flow rate of the NS was not accurately calculated until the final ground test stage. At the detailed product stage, the error was still 20%. This was due to the difference between the Cabin-NS and the ground simulation. The error tended to decrease at each stage, indicating that the optimization iterations at different stages of this design were effective.
If the development is carried out traditionally, the MMW system needs to be tested and connected with the Cabin-NS and Cabin-ES systems, respectively, which will consume a lot of time for transportation, assembly, debugging, and disassembly. The test method proposed in this paper could reduce consumption by using a simulated load and other methods. The comparison between the traditional test method and the multi-stage method proposed in this paper is shown in
Table 10 and
Table 11.
It can be seen that the multi-stage testing method proposed in this paper saves about 64% of the testing cost and 50% of the testing time and labor in the testing process. The above results assume that different systems are developed synchronously. In the actual process, there is a time gap in the development progress of different systems. The benefits of using the method described in this paper will be greater.
4. Conclusions
The multi-stage design and test method in this paper could be effectively used in the development of similar complex pipe network systems.
For air systems with clear interfaces, the accuracy of the semi-physical simulation model is already high, basically close to the final performance. For similar internal fluid systems in the rack or the spacecraft, theoretical simulation and semi-physical simulation methods have good practicality to save development time.
The nitrogen system and the exhaust system have strong correlation characteristics with the external systems, and the results in the semi-physical simulation stage are poor. It is necessary to test the external system and combine the product self-test data to obtain better flow parameters. In the process of external system testing, the virtual product replacement method and calculation formula designed in this paper are effective.
The development of spacecraft products is complex system engineering, which is very difficult in terms of performance testing and prediction. The multi-stage design method in this paper could provide guidance for the development and testing of such long-term complex fluid systems to predict performance and accelerate product development. The control strategy and prediction method of charging and exhausting used in this paper can be used in the design of nitrogen, air systems, and other gas systems or payloads of spacecraft, such as CO2 or CH4. It provides effective reference for the safety strategies, test planning, and performance prediction of these similar products from design to launch into orbit.
The multi-stage test designed in this paper can save a lot of time, cost, and labor while ensuring good system performance prediction results. It has great significance in performance prediction and cost reduction for subsequent aerospace systems or similar synchronous-development products.


