Article

Comparison Between Numerical and Experimental Methodologies for Total Enthalpy Determination in Scirocco PWT

by
Antonio Smoraldi
* and
Luigi Cutrone
*
CIRA—Italian Aerospace Research Centre, Via Maiorise, 81043 Capua, Italy
*
Authors to whom correspondence should be addressed.
Aerospace 2024, 11(12), 1023; https://doi.org/10.3390/aerospace11121023
Submission received: 21 November 2024 / Revised: 10 December 2024 / Accepted: 11 December 2024 / Published: 14 December 2024
(This article belongs to the Special Issue Thermal Protection System Design of Space Vehicles)

Abstract

:
Arc-jet facility tests are critical for replicating the extreme thermal conditions encountered during high-speed planetary entry, where the precise determination of flow enthalpy is essential. Despite its importance, a systematic comparison of methods for determining enthalpy in the Scirocco Plasma Wind Tunnel had not yet been conducted. This study evaluates three experimental techniques—the sonic throat method, the heat balance method, and the heat transfer method—under various operating conditions in the Scirocco facility, employing a nozzle C configuration (10° half-angle conical nozzle with a 90 cm exit diameter). These methods are compared with computational fluid dynamics (CFDs) simulations to address discrepancies between experimental and predicted enthalpy and heat flux values. Significant deviations between measured and simulated results prompted a reassessment of the numerical and experimental models. Initially, the Navier–Stokes model, which assumes chemically reacting, non-equilibrium flows and fully catalytic copper walls, underestimated the heat flux. By incorporating partial catalytic behavior for the copper probe surface, the CFD results showed better agreement with the experimental data, providing a more accurate representation of heat flux and flow enthalpy within the test environment.

1. Introduction

A crucial condition to replicate during tests at the arc-jet facility is the flow enthalpy, along with stagnation pressure, velocity gradients, and the chemical composition of the flow. These parameters are essential for accurately simulating the actual re-entry environment. In the test section, the enthalpy peaks along the centerline gradually decrease toward the inner region and sharply drop near the walls. Tests are primarily conducted in the core region, where flow properties change more slowly [1]. The enthalpy in this region, often referred to as centerline or core enthalpy, should match flight conditions. Conversely, mass-averaged enthalpy accounts for the enthalpy of the entire stream, including the cooler regions near the water-cooled walls. Given the proportional relationship between enthalpy and heat transfer, any variations in enthalpy will affect the performance of the tested heat shield materials. Two experimental techniques are commonly used to measure mass-averaged enthalpy: the heat balance method [2,3], which divides net power input by mass flow rate, and the sonic throat method [4], which relates enthalpy to flow rate and reservoir pressure. For centerline enthalpy determination, the heat transfer method is the standard, measuring heat transfer at the stagnation point of a calibration probe. Of course, the heat transfer-based methods are highly dependent on the type of probe used [5,6,7]. Probes with identical dimensions and material, like oxygen-free high conductivity copper, but equipped with different sensing elements can yield varying heat flux measurements [8]. Flow-ingestion probes have often been proposed for measuring the enthalpy of the flow and can be considered a valid alternative to flow-impact probes. These provide a more direct measurement of the enthalpy of the acquired gas sample, achieved through a dual energy balance. However, such probes require a specific calibration process, which depends heavily on the specific operating conditions [9]. Particularly, in low-pressure conditions, uncertainties become significant due to the difficulty in sampling a substantial amount of gas [10,11,12,13].
Alternative techniques, such as optical spectrometry or laser-induced fluorescence [14,15,16], are very valuable non-invasive methods but are very challenging to implement, and LIF is not yet available for Scirocco, the 70 MW Plasma Wind Tunnel at the Italian Aerospace Research Center. Recent advancements in computational fluid dynamics (CFDs) may allow for precise reconstructions of test conditions [17,18,19,20], including enthalpy and thermal loads, but the most significant limitation is the lack of accurate knowledge of the catalytic recombination coefficient, γ [21,22,23]. Various experimental estimates for the catalytic efficiency of copper and copper oxide, for both nitrogen and molecular oxygen, are reported in the literature. Unfortunately, these estimates differ by as much as an order of magnitude [24], which can lead to significantly different predictions of heat fluxes and, consequently, the total enthalpy of the flow.
The enthalpy characterization performed on Scirocco PWT in this work revealed significant discrepancies between experimental and numerical heat flux values, prompting a deeper investigation into the numerical models used up until now, particularly on the conservative assumption of fully catalytic walls.
Moreover, no systematic comparison between experimental and numerical enthalpy estimation methodologies has been conducted for Scirocco [25,26]. Park [15] was the first to propose a comparative analysis of enthalpy determination methods, conducting an in-depth study of various techniques for a single operating point on the IHF facility. This work draws inspiration from Park’s study and tries to replicate some of his findings on the Scirocco facility, with some significant differences, attributable to the varying facility performance. In this study, three currently feasible experimental methods were applied to the different operational conditions of the Scirocco arc-jet facility in nozzle C configuration: the sonic throat method, the heat balance method, and the heat transfer method. These methods were compared with computational fluid dynamics (CFDs) solutions, where the inclusion of an estimated partial catalytic effect on the copper probe surface enhanced the agreement between numerical and experimental enthalpy and heat flux predictions, providing a clearer understanding of the test environment. The comparison of the available methodologies was carried out over a broader range of stagnation heat flux and enthalpy levels.

2. Facility Operating Conditions

Efforts are focused on the Scirocco Plasma Wind Tunnel, specifically examining various operating conditions with the nozzle C configuration. This configuration features a conical nozzle with a half-angle of 10° and an exit diameter of 90 cm, resulting in a geometric area ratio of 144. For this configuration, both a robust set of experimental data and CFDs reconstructions are available, as shown in Table 1. Characterization involved gradually increasing the heat flux and total enthalpy over a relatively narrow stagnation pressure range of 2.79 to 6.20 kPa. The typical exposure time for these experiments is consistent across tests, approximately 4 to 6 s, and is measured after the steady-state heat flux of the oxidized surface is attained.
It is important to account for the chain uncertainty of all the devices involved. Each field instrument is connected to the Local Control Unit, which transmits the signal to the Data Acquisition System. The latter has a Type B measurement uncertainty equal to 0.1% of the full scale for each device. In this case, this uncertainty source can be considered negligible compared to the instrumental uncertainty, as it falls within the range of the instrumental error. The detailed methodologies for calculating enthalpy values and their associated uncertainties are presented below.

3. Enthalpy Measurement and Rebuilding

As previously mentioned, when discussing the enthalpy of the test flow, reference is generally made to two types of enthalpies: mass-averaged enthalpy and centerline (core) enthalpy. The mass-averaged enthalpy is estimated using the sonic throat method and the energy balance method, while the centerline total enthalpy is determined using the heat transfer method, which represents the standard characterization approach in Scirocco. Details regarding these methodologies and their associated uncertainty estimations are provided below.

3.1. Mass-Averaged Enthalpy Measurement

3.1.1. Sonic Throat Method

The sonic throat method is based on the relationship between the mass-averaged total enthalpy, the cross-sectional area of the throat (in m2), the total pressure in the arc heater (in Pa), and the air mass flow rate injected into the column (in kg/s). The method assumes isentropic expansion under thermodynamic equilibrium, which is explicitly considered in its formulation. A correction for frozen species is applied at high enthalpy levels, following the approach proposed by Winovich, over the enthalpy range of 1000 to 10,000 Btu/lbm (equivalently 2.3 to 23 MJ/kg). The equation is as follows:
H s t 0 = 0.293 A P 0 m ˙ 2.519
Despite these limitations, this method requires only simple state measurements. The instruments used include an absolute pressure transducer, an air flow meter, and an argon flow meter, along with other instruments used for measuring the data shown in Table 1. These are listed in Table 2, along with their respective uncertainties as specified by the manufacturers.
The total uncertainty of the entire measurement chain is calculated as a Type B uncertainty, U H 0 = ± 0.253 % . It is important to note that such models are designed to provide an approximate estimate of the mean enthalpy value; however, they are presented here for the sake of completeness.

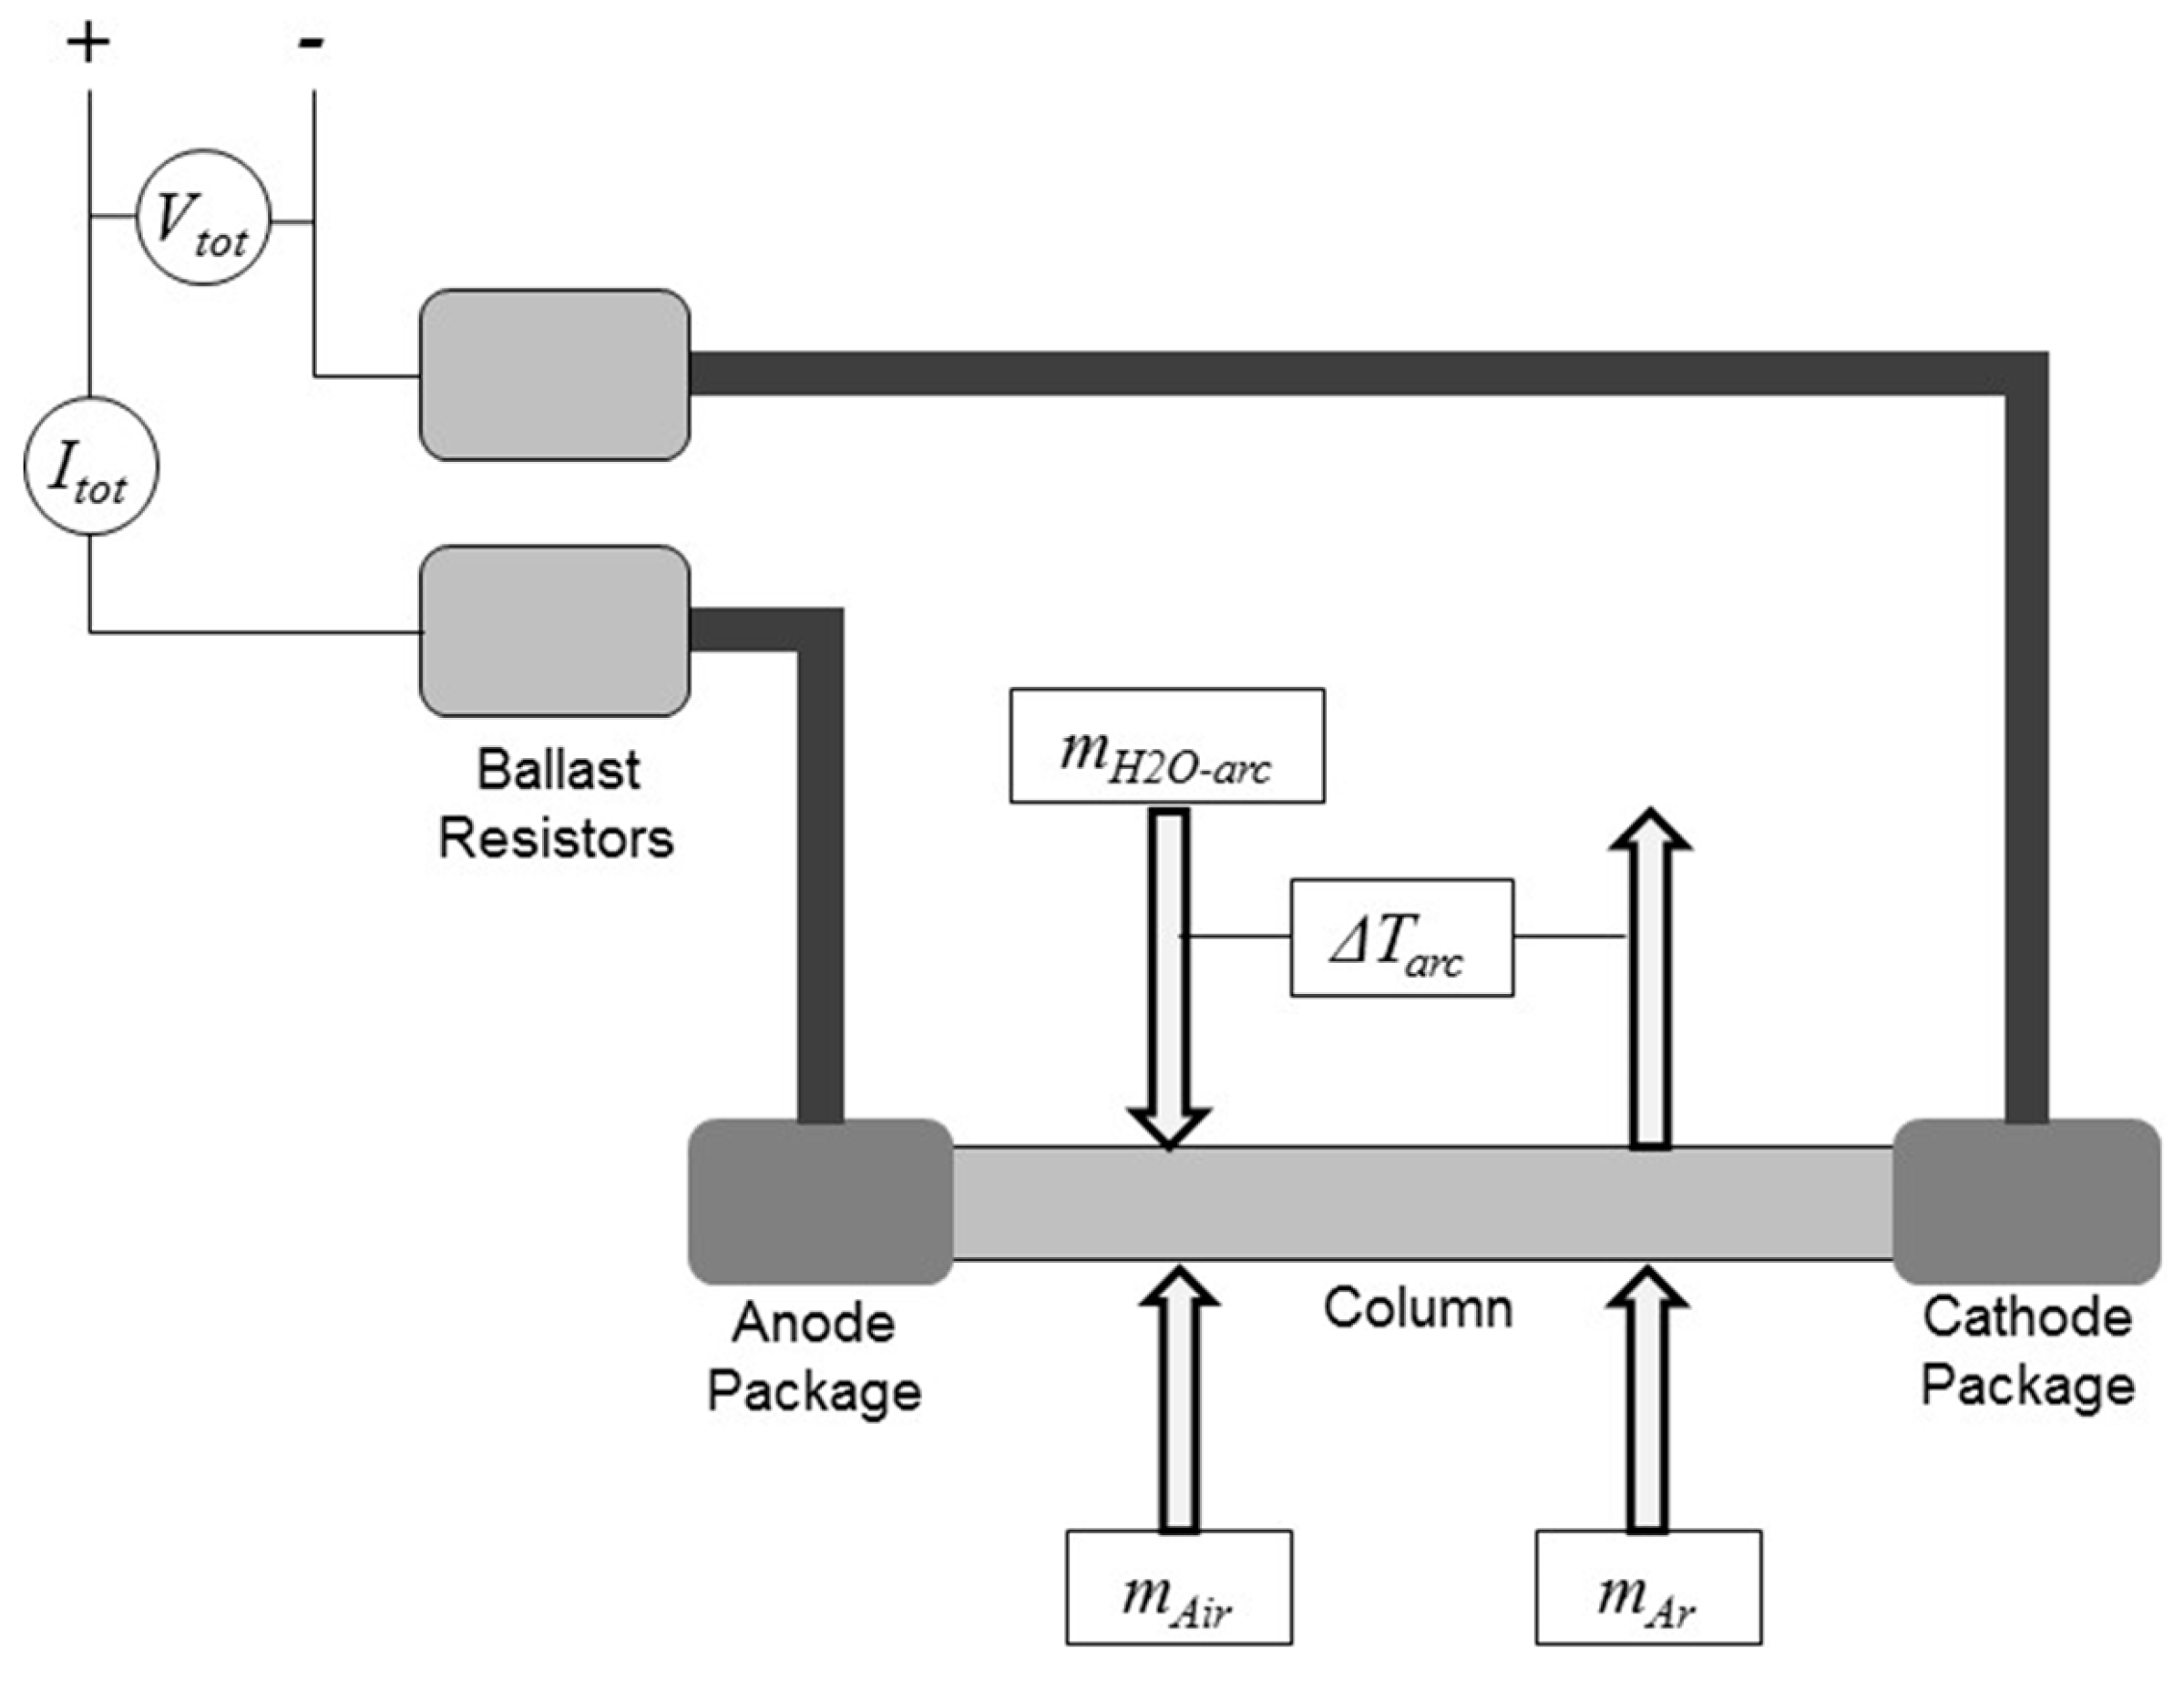
3.1.2. Energy Balance Method

The indirect measurement of the mass-averaged total enthalpy ( H e b 0 ) of the Scirocco plasma flow is performed through the energy balance method in a relatively simple way: by dividing the net power input by the mass flow rate in a so-called energy balance method [3]. In this case, the H 0   is measured by dividing the total power input into the flow by the total mass flow rate of the test gas. The total power input is the electrical power provided to the electrodes minus the power losses in the cooling circuits. The relation that explains this methodology is reported below:
H e b 0 = V I Δ T arc m ˙ H 2 O arc m ˙ air + m ˙ Ar
Below is a list of the quantities involved:
  • V is the voltage of the Power Supply System between the anode and cathode bar, V;
  • I is the electrical current of the Power Supply System of the anode bar, A;
  • m ˙ H 2 O arc   is the water flow rate of the arc heater cooling system, (m3/h);
  • Δ T arc is the delta temperature of the water flow of the arc heater cooling system, (K);
  • m ˙ air is the air mass-flow rate of the arc heater complex, (kg/s);
  • m ˙ Ar is the argon mass-flow rate of the arc heater complex, (kg/s).
Figure 1 is provided to clarify the measurement scheme:
The explicit formula for calculating the uncertainty via error propagation is omitted here for brevity. The overall uncertainty is approximately ±10.2% of the H0 value. The strong dependence on the temperature difference measured in the cooling water represents the main limitation of this methodology.

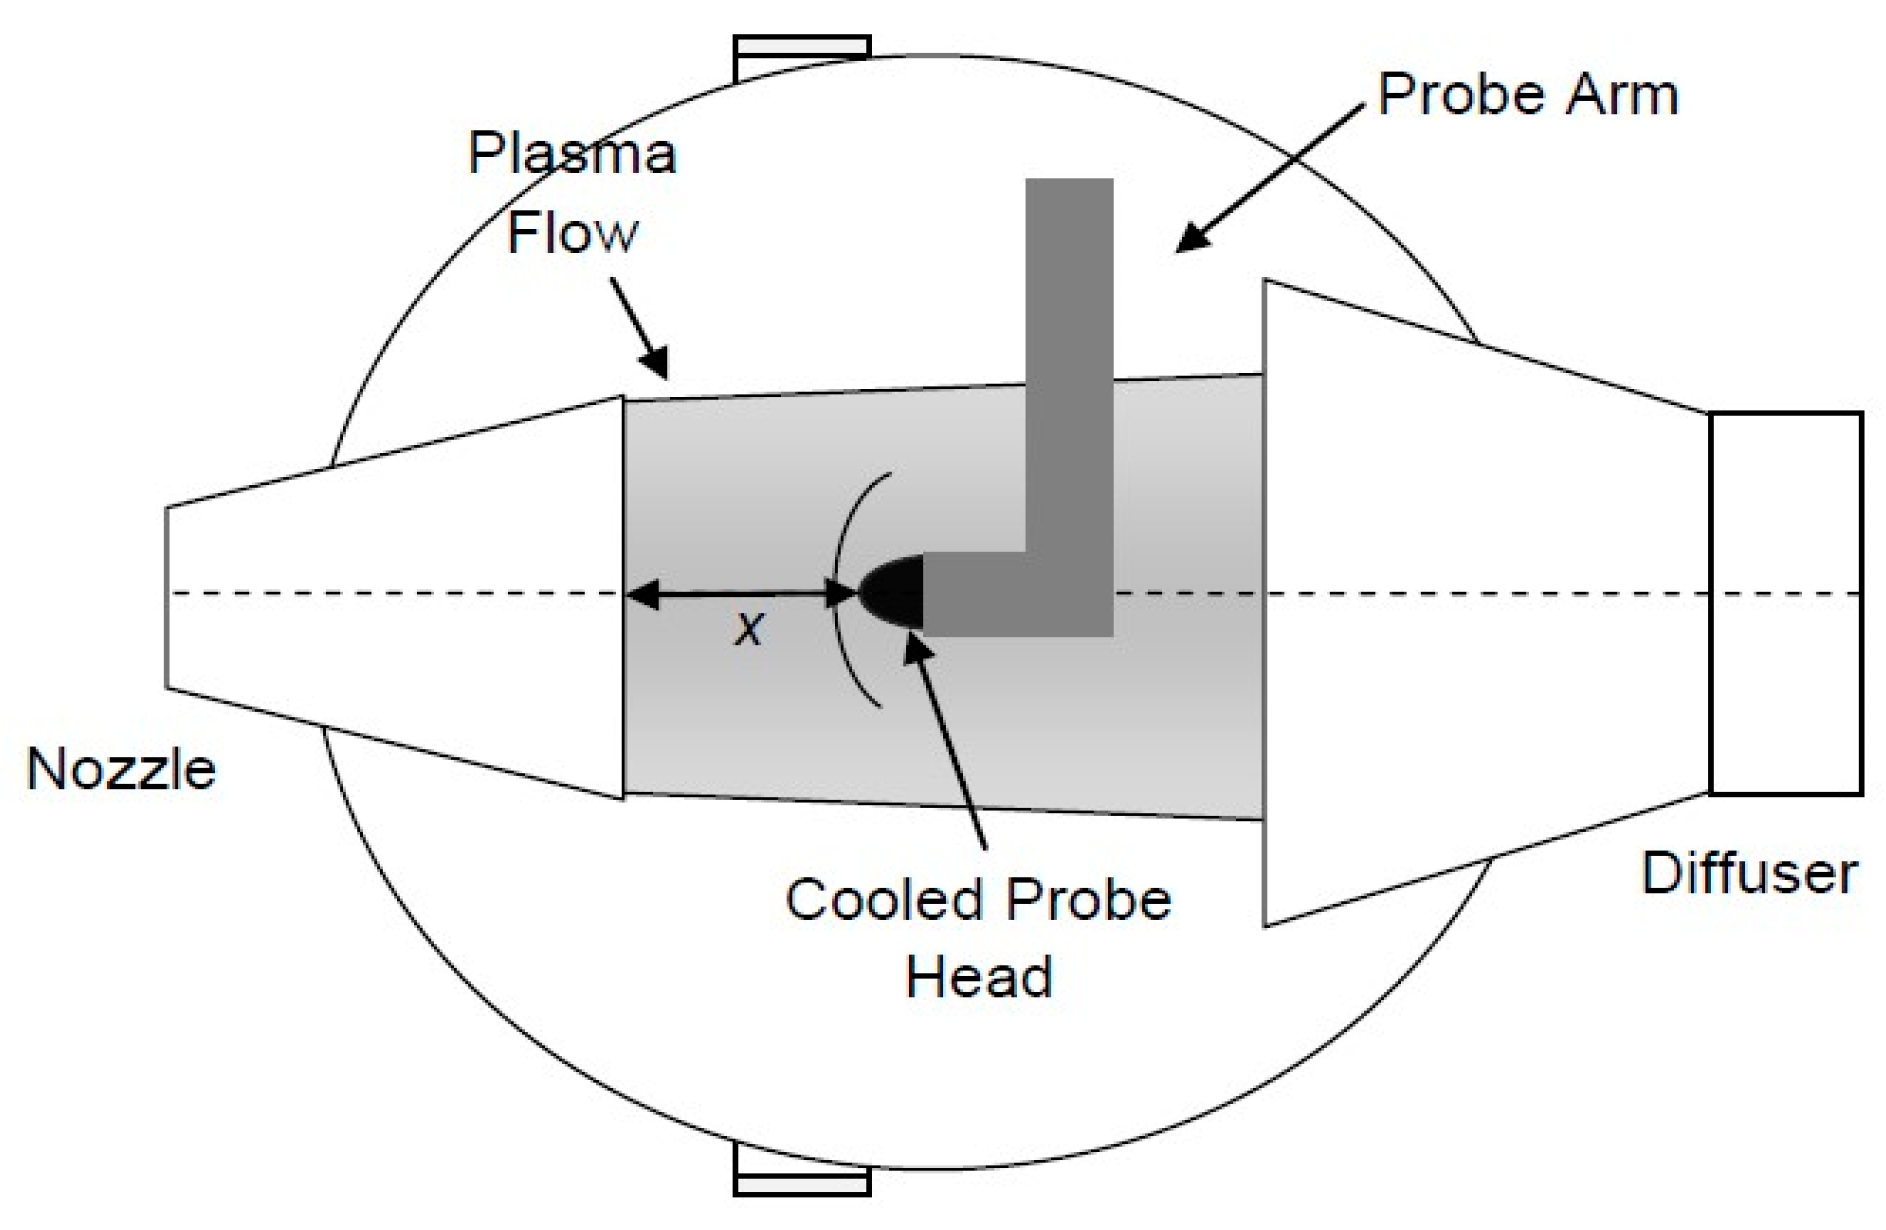
3.2. Centerline Enthalpy Measurement—Heat Transfer Method

In the Scirocco facility, the standard methodology for directly measuring enthalpy through thermal flux is the heat transfer method, which correlates the stagnation-point heat flux measured on the probe with the flow enthalpy.
The experimental setup is sketched in Figure 2. The distance from the nozzle throat to the probe position is x = 2.8 m.
The stagnation heat flux and pressure are measured using a water-cooled copper probe (Figure 3) with a diameter of D = 10 cm, positioned at a distance of x = 37.5 cm from the nozzle exit section along the jet centerline. In the case of the Scirocco system, the stagnation enthalpy at the centerline of the flow is measured using a Gardon gauge (Model GT-100-8-658/756A) from Medtherm (Huntsville, AL, USA) [27], which has an operating range of 0–3000 kW/m2 and an expanded uncertainty of ±3%. This gauge provides a “direct” measurement of the heat flux at the stagnation point, though it is significantly affected by possible copper surface catalytic recombination of oxygen and nitrogen atoms. The basic design of the Gardon gauge is based on a differential copper–constantan thermocouple. A thin constantan disk membrane is soldered to a copper body, with the copper part embedded in the copper probe and cooled through forced convection by high-pressure water.
The Gardon gauges are equipped with control thermocouples that measure their operating temperature, which typically averages around 370 K. This value will be used as a wall boundary condition in CFD calculations. The enthalpy is calculated from the cold wall heat flux using the Fay–Riddle formulation, in the semi-empirical and simplified form given by Zoby [28], for a mixture of air and argon (see Table 3):
H c 0 = q s m ˙ R P 0 m ˙ Ar K Ar + m ˙ air K air
In this formulation, the error is mainly driven by the uncertainty in the measurement of the stagnation heat flux q s , leading to a total uncertainty of approximately ±3.02% [27,28].
The Fay–Riddell model, as is well known, assumes either equilibrium or fully catalytic conditions, meaning that the gas composition near the surface adjusts to the local thermodynamic state or promotes complete recombination of dissociated species, thereby increasing the heat flux due to exothermic reactions. In contrast, Goulard [21] provides an alternative relationship between stagnation point heat flux and enthalpy, assuming frozen conditions, where the gas composition remains unchanged as it approaches the surface, with an assigned catalytic recombination coefficient γ, resulting in a lower heat flux. As demonstrated by Park [15], the two formulations converge for a γ value of 0.04 for pure copper and oxygen recombination, at which point both models yield the same result.

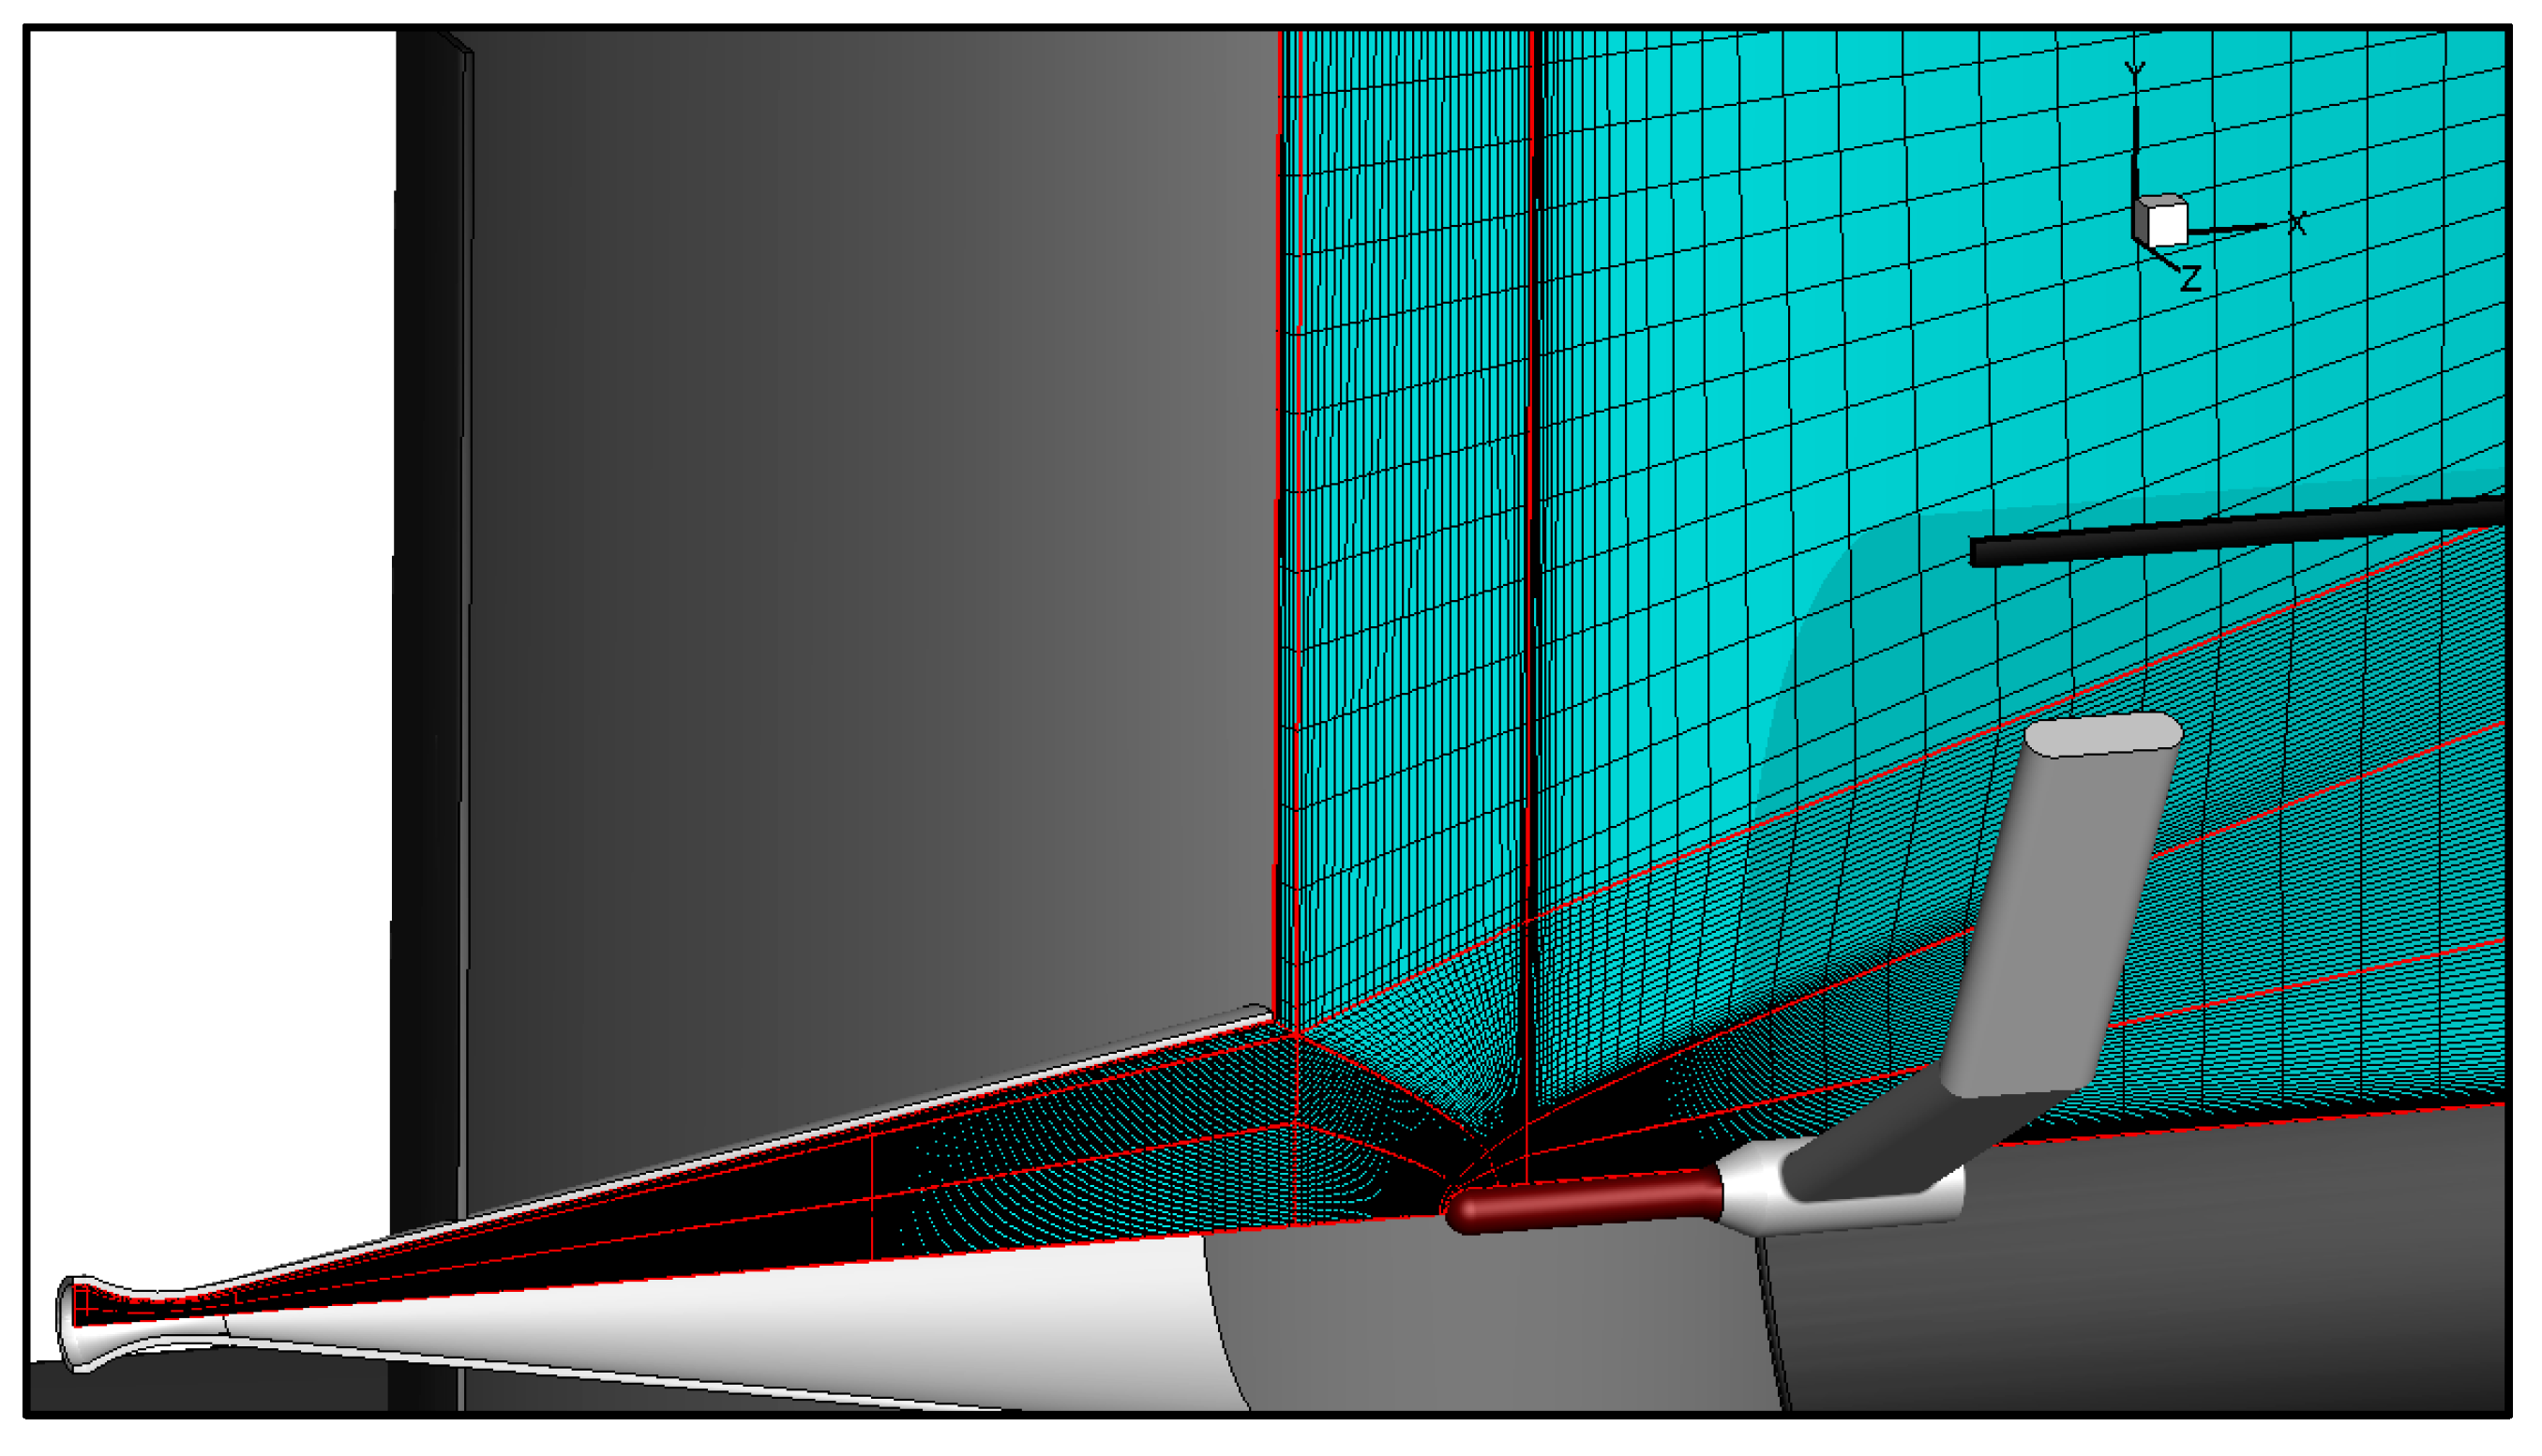
3.3. Centerline Enthalpy Measurement—CFD Rebuilding

The in-house-developed CFD solver, NExT, has been used to numerically simulate the Scirocco tests. This CFD tool solves the Reynolds Averaged Navier–Stokes (RANS) equations on a multi-block structured grid [29], adopting a density-based finite volume approach, with a cell-centered Flux Difference Splitting (FDS) upwind [30] scheme for the convective terms. A second order formulation is obtained by means of an Essentially Non-Oscillatory (ENO) reconstruction of interface values. Chemical non-equilibrium [31] is accounted for by solving the conservation equations for the mass fractions of gas species. Dissociating air is modeled with a 5-species gas mixture (including O, N, NO, O2, and N2) with chemical reaction rates provided by Park [20]. The translational and rotational energy of the gas mixture is governed by a single temperature, T ; the energy exchange between vibrational and translational modes (TV) is instead modeled with the classical Landau–Teller non-equilibrium equation, with average relaxation times taken from the Millikan–White [32], theory modified by Park [33]. Also, the Park high-temperature limit [18] is used to prevent the relaxation from becoming faster than the collision time. The viscosity of the single species is evaluated by a fit of collision integrals calculated by Yun and Mason [34], the thermal conductivity is calculated by means of Eucken’s law, and the viscosity and thermal conductivity of the gas mixture are then calculated by using the semi-empirical Wilke formulas. Finally, the diffusion of the multicomponent gas is computed through a sum rule of the binary diffusivity of each couple of species (from the tabulated collision integrals of Yun and Mason [34]). A short description of the Scirocco test rebuilding chain follows. The CFD rebuilding, as seen in Figure 4, of the selected Scirocco tests begins with the numerical evaluation of the reservoir conditions with equilibrium air calculations, imposing the total pressure and enthalpy ( P 0 , H 0 ) measured for each test: those give the inlet nozzle conditions. Starting from the inlet values as boundary conditions, an axis-symmetrical Navier–Stokes simulation of a convergent–divergent nozzle is conducted to obtain the test section. The simulations are iterated by refining the estimation of H 0 and P 0 , until the numerical evaluation of the p s and q s on the probe matches the experimental measurements. The probe stagnation centerline enthalpy, in turn, coincides with the core enthalpy used for the comparison of experimental values. The average enthalpy value is instead obtained by averaging the enthalpy across the nozzle exit section, once the stagnation conditions are matched.
The Scirocco rebuilding simulations have been performed by using the following main physical/numerical models:
  • The 2D-axi RANS approach (CIRA NExT solver);
  • The time marching to steady-state solution strategy;
  • The 2° order Upwind Flux Difference Splitting convective scheme;
  • The 5-species air in thermal and chemical non-equilibrium as a working gas model;
  • The fixed temperature (T = 370 K) nozzle wall boundary condition;
  • The fixed temperature (T = 370 K) fully catalytic wall boundary condition for the calibration probe.
A 2D-axisymmetric domain including the nozzle, the test chamber, and the calibration probe has been modeled and discretized by 34 blocks and about 110rm000 cells structured multi-block mesh (on the finer level), as depicted in Figure 4. The simulations were initially conducted on a coarse grid (approximately 7000 cells) and a medium grid (around 30,000 cells) to verify grid convergence of the solution, though the results are omitted here for brevity.
Of course, the dependence on the flow solution from the grid is not the only source of uncertainty. According to a previous study carried out by Cinquegrana [25], the choice of a specific transport and chemical–kinetic model is affected by an uncertainty, which can be estimated to be below 2% on the stagnation heat flux value. However, the level of uncertainty that allows the data to fit a linear curve is 5%. Another source of uncertainty is how the catalytic properties of the calibration probe are modeled, as it depends on the actual surface finish of the calibration probe’s material (copper), adding further uncertainties to the simulation. The initial assumption is a fully catalytic response, based on the premise of a mirror-polished probe surface, in this work cases with partial catalytic behavior will also be considered.
At this time, it is worth pointing out how the wall heat flux is calculated. Total heat flux is given by three terms, the convective one, q c , named ‘roto-translational’, since it is due to the roto-translational temperatures, the vibrational q v contribution, and the diffusive q d contribution, named as ‘chemical’, as reported in Equation (4):
q = q c + q v + q d
The ‘roto-translational’ wall heat flux contribution is reported in Equation (5):
q c = k T n
where k is the mixture’s thermal conductivity. The vibrational contribution to the total wall heat fluxes is valued as reported in Equation (6):
q v = i = 1 N vib k ν , i T ν ib , i n
where N vib is the number of chemical species with the vibrational energy mode, k v , i is the vibrational conductivity of bi-atomic species, and T vib , i is the vibrational temperature of the i-th vibrational species. Finally, the diffusive, or ‘chemical’ contribution is valued as explained in Equation (7):
q d = i = 1 N s h i   ρ D i Y i n
In the NEXT code, it is possible to model partial catalysis of a material by employing the recombination probability γ , defined as the ratio between the flux of atoms that recombine at the surface [35], M A , with the total flux of atoms impinging the surface, M A [36]. It can be shown that the expression for the mass flux of atoms impinging on the surface follows the kinetic theory, and after some elaborations and according to Scott [37], it can be used to derive the following:
γ = M A M A = M A Y A , w ρ w R A T w 2 π
In this case, the involved paths are two independent reactions, O + O O 2 and N + N N 2 , each with an associated efficiency γ O and γ N .
Under the very conservative assumption of a fully catalytic wall, it is possible to achieve the same wall heat flux with a lower total enthalpy. Conversely, if the wall is assumed to be partially catalytic, the match between experimental results and CFDs simulations is obtained at higher total enthalpy values. To align the enthalpy values estimated via CFDs with those determined through the inverse enthalpy estimation using the heat transfer method, a gamma value of 0.08 was applied. This value falls within the range suggested in the literature for slightly oxidized copper, as discussed in further detail below.

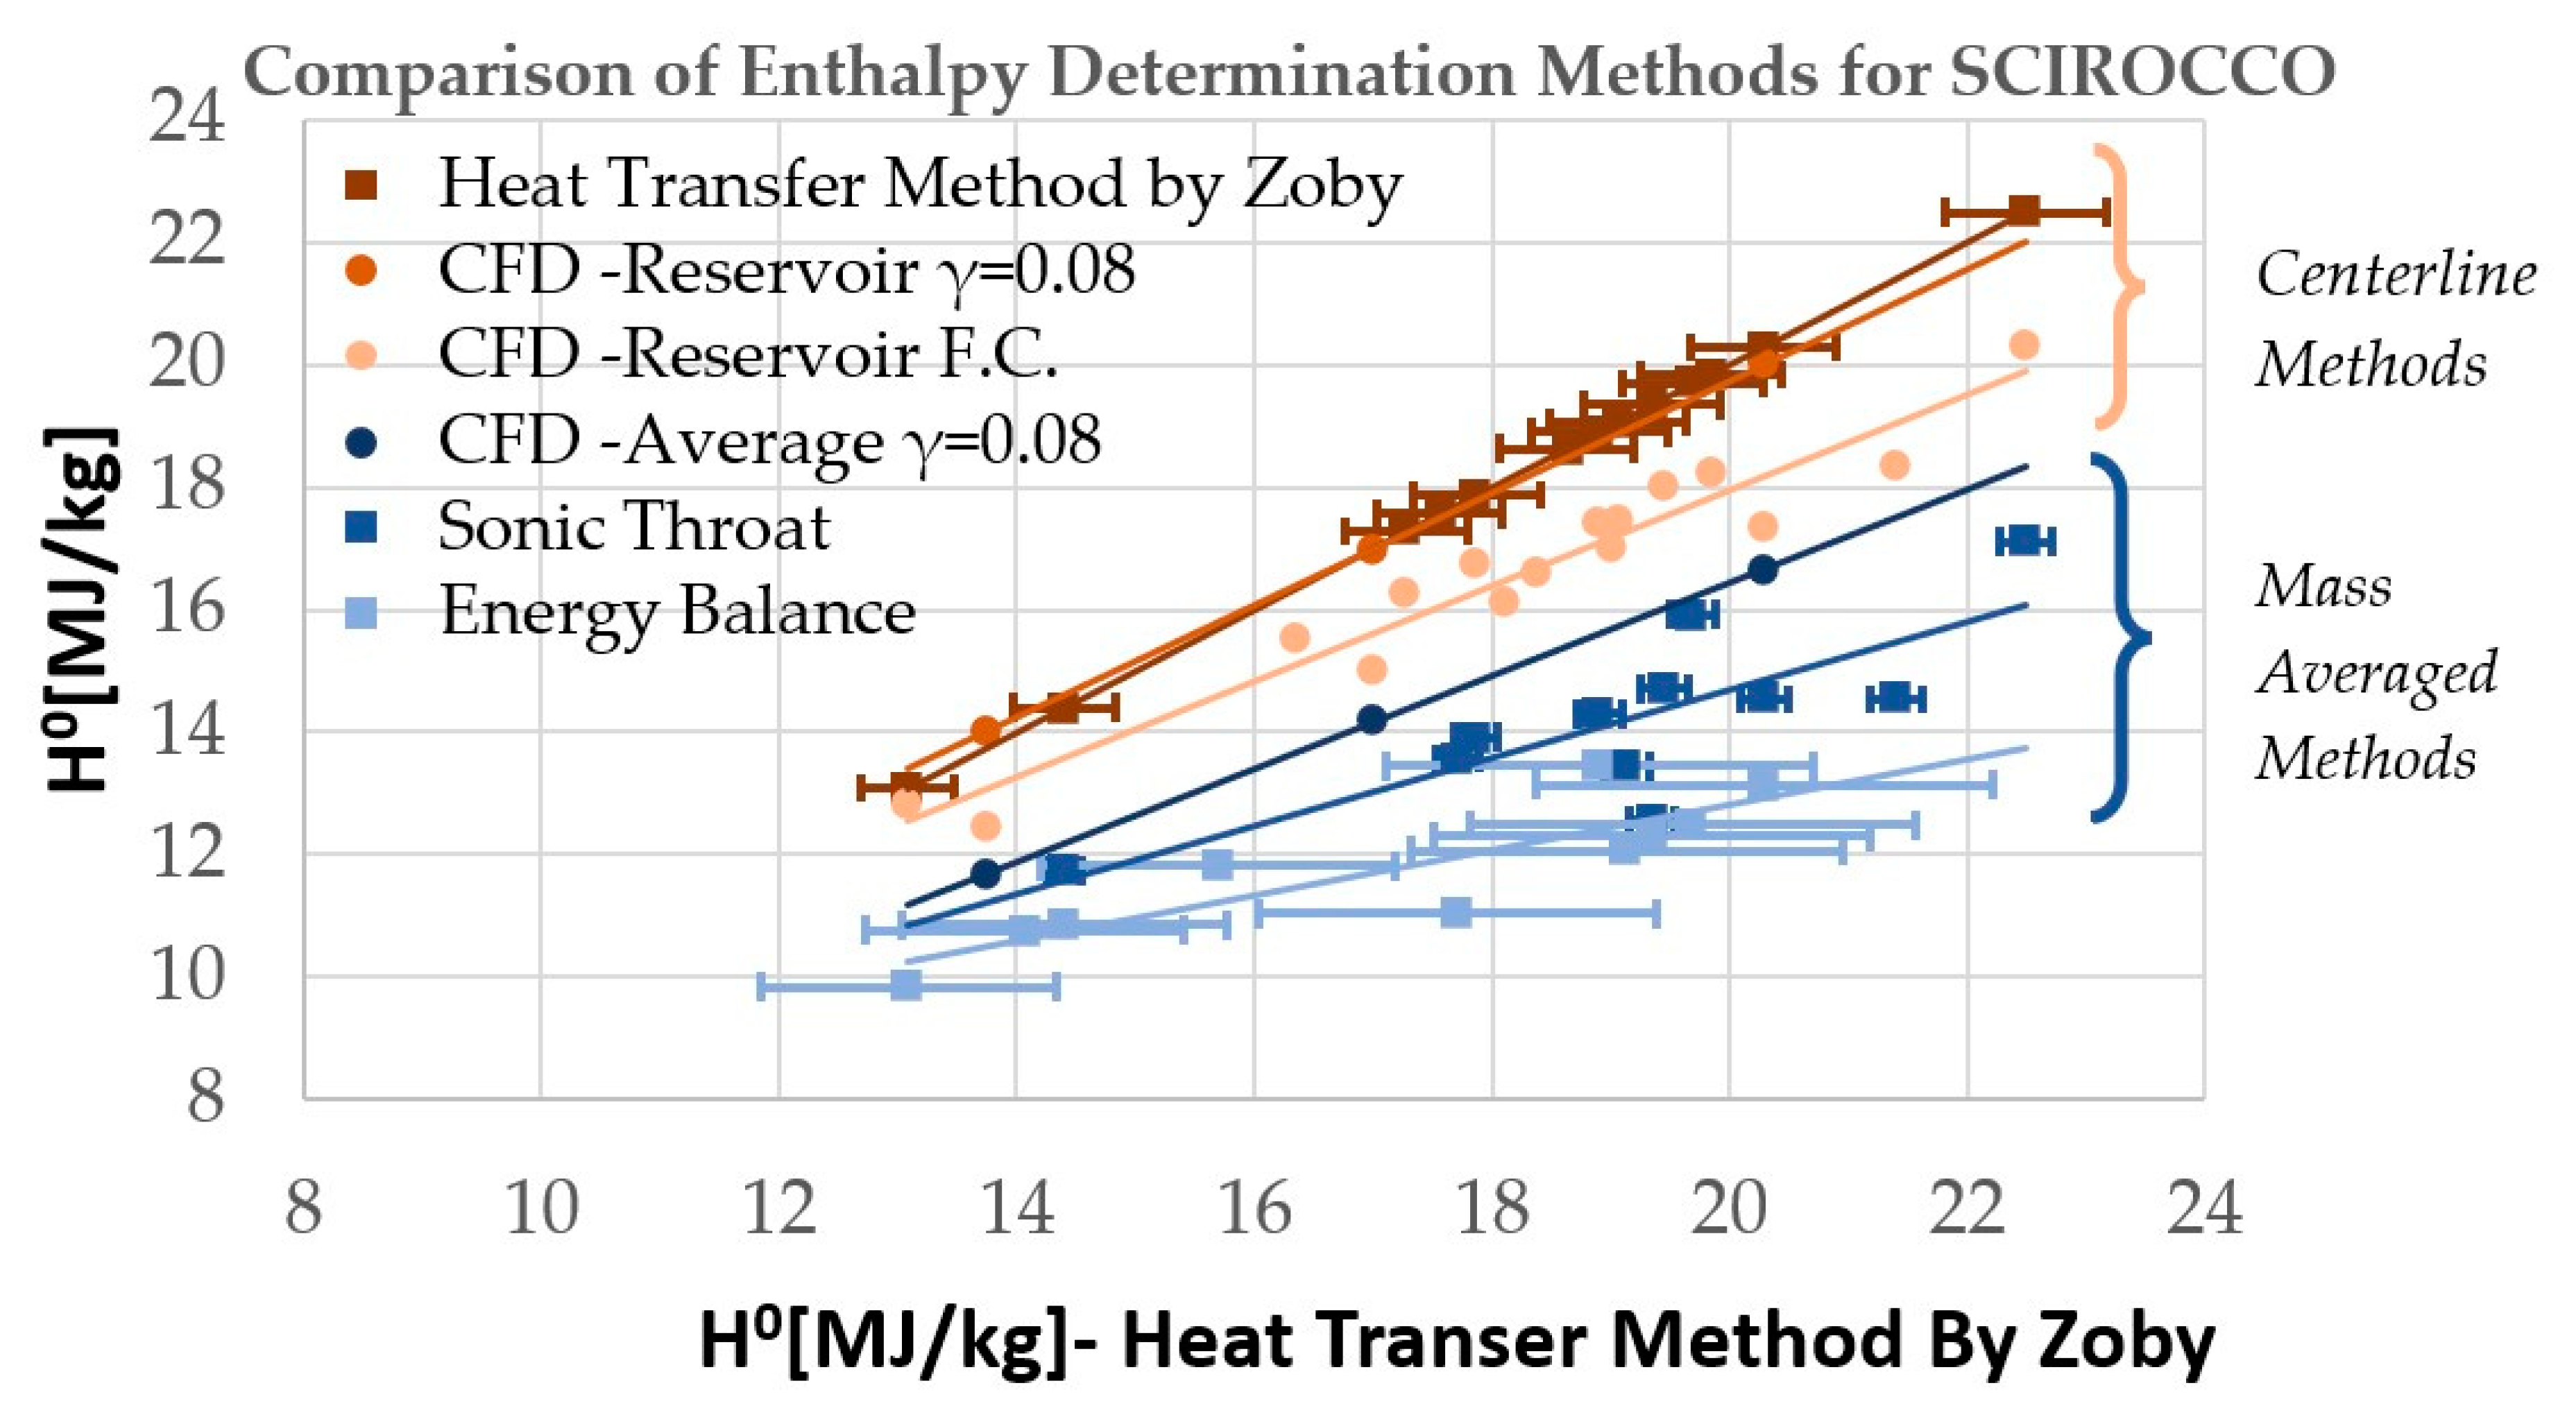
4. Results and Discussion

The total enthalpy was determined using several methodologies. Figure 5 illustrates the comparison of enthalpy values, using the enthalpy calculated from heat flux measurements via the Zoby formulation as the independent variable. This representation allows for a direct evaluation of the correlation between the Zoby-derived enthalpy and the values obtained from CFDs simulations and other measurement techniques. The CFDs simulations showed better agreement with the total enthalpy estimates obtained using the Zoby formula, suggesting that this approach is reliable for reconstructing the thermodynamic parameters in the Scirocco PWT. However, this is only true if a more realistic catalytic effect on the surface is taken into account, emphasizing the importance of considering probe oxidation and confirming the findings in the literature. In the case of complete catalytic activity of the copper surface, the enthalpy is, in fact, underestimated by approximately 10%.

4.1. Mass Averaged Enthalpy Measurement and Profile Uniformity Characterization

Regarding mass-averaged enthalpy methods, it was observed that both the Winow-ich formulas and the energy balance approach, when applied to the Scirocco facility, tend to underestimate the average flow enthalpy compared to values determined by CFDs under the hypothesis of finite-rate catalyticity. This discrepancy may be attributed to simplifying assumptions that fail to fully capture the complexity of the high-enthalpy flow generated, as well as the intrinsic limitations of the formulas themselves. These formulas are based on semi-empirical data tailored to the geometry of the NASA-Ames IHF, which features a more radially shaped flow [15,16] profile due to a differently shaped nozzle. Consequently, they could not directly apply to other similar facilities.
Based on spectroscopically determined centerline enthalpy, Park [15] defines the ratio of centerline-to-average enthalpies as the centerline enthalpy determined via the spectroscopic method divided by that obtained from the sonic throat method or energy balance method, yielding a ratio of 1.4 to 1.5. Due to the higher non-uniformity in the radial flow profile, based on the plasma core profile reconstruction, the author suggests that it is reasonable for the average enthalpy to be 40% to 50% lower than the centerline value in the IHF facility. In contrast, the Scirocco facility exhibits a more uniform flow, as confirmed by CFDs analysis (Figure 6) and spatially resolved probe measurements (Figure 7). Based on CFDs simulations, the ratio between the centerline enthalpy and the mass-averaged enthalpy along the radial profile of the flow at the nozzle exit section for the SCIROCCO facility was calculated to be 1.2. This implies that the average enthalpy is expected to be 20% lower than the centerline, as confirmed by experimental data. The data used in these calculations also take into account the effect of finite catalytic efficiency, determined as discussed in Section 3.3.
To further confirm jet uniformity, a high-speed CMOS camera (San Jose, CA, USA) (Phantom v4.0, B&W, 8-bit, 512 × 512 pixels) was employed, capturing 2000 frames at a sampling rate of 1071 Hz with an exposure time of 870 μs (Figure 8). The maximum error was ±5% of the full scale. It collects the radiation in the VIS and near-IR spectral range corresponding to the spectral range for which the plasma emission is significant since it is transparent in the infrared spectral range as indicated in [38]. Notice that the plasma jet presents a diameter of about one meter while the depth of field of the camera corresponds to a few centimeters. For this reason, no Abel inversion was needed as reported in [39,40]. In Figure 8, transversal pro-files extracted from the mean radiation distribution of the free-stream plasma flow are shown. The excellent uniformity of the flow at the exit section of the nozzle in the Scirocco Wind Tunnel is influenced by several factors, including the low half-angle and long length of the nozzle, which enable a very gradual expansion; a smooth, well-shaped nozzle throat, with profiles designed to maintain continuity with the linear section up to the second derivative; and a highly uniform and stable exit pressure, achieved through a unique and powerful vacuum system. The correlation between the data suggests that it would be possible to correct the systematic error by using Winovich’s formulation in a way that aligns more closely with CFDs calculations, even though the CFDs results remain within the uncertainty of the formulation. The determination of average enthalpy using the energy balance method presents several limitations, particularly due to its strong dependence on the accuracy of the cooling water temperature, as discussed in Section 3.1.2.
Moreover, the energy balance method presents a significant limitation in the difficulty of achieving a thermal steady-state in the facility. Terms associated with electrical power dissipation due to the Joule effect have much faster time constants, akin to the rise time of a first-order system, compared to those related to water cooling. This discrepancy can lead to inaccurate enthalpy estimates and prevent the application of this methodology in short-duration tests, where the thermal steady-state of the entire facility is not achieved. The energy balance method showed a discrepancy of up to 30% in underestimating the enthalpy value, while the sonic throat method provided a closer estimate of the CFD values, with a difference of 13% in underestimating.

4.2. Centerline Enthalpy Measurement and Surface–Catalytic Recombination Coefficient Estimation

In the characterization of arc-jet tunnels, the standard procedure used in Scirocco involves determining the centerline enthalpy using a copper calorimeter, which is recognized for its high catalytic efficiency, as documented in the literature. The local flow enthalpy is calculated through the Zoby heat transfer formula given by Park [15], utilizing the heat transfer rates measured from the calorimeter alongside the assumption of full catalytic efficiency conditions on the wall.
The catalytic phenomena on surfaces significantly affect heat transfer, particularly in the context of total enthalpy determination, as shown in Figure 9. It was found that the enthalpy exhibits the same trend observed by Park [15], showing high sensitivity to the chosen γ value within the relevant range.
A substantial amount of experimental data has been collected regarding the catalytic effects of oxygen and nitrogen for copper, primarily using arc-jet wind tunnels, along with side-arm reactors [41], diffusion tubes and arc-jets [42], and the Plasmatron [23]. This last device enables high chemical purity in plasma flows, providing highly valuable data for studying catalytic processes under such conditions. Various studies have measured the catalytic efficiency of copper oxide in different test facilities, as summarized by Cheung [24].
Cheung et al. [24] summarize the existing data on catalytic efficiency for copper (Cu) and copper oxide. Copper can be oxidized in two different types of copper oxide: cupric oxide (CuO) and cuprous oxide (Cu2O). The author reports values ranging from 0.01 to 0.17, 0.01 to 0.045, and 0.025 to 0.11 for different gas mixtures, enthalpy levels, wall temperature, and facilities. The efficiency of copper oxide has not been measured in a well-defined environment, where flow enthalpy is independently known, the material is unequivocally copper oxide, and the surface is smooth.
Viladegut and Chazot [23] present an experimental approach to develop a catalytic model for surfaces exposed to high-temperature, low-pressure plasma flow conditions. This technique, known as the Mini-Max method, is applied at the Plasmatron facility at VKI to determine the catalytic recombination coefficient on a copper-based calorimeter. Their findings reveal a notable decrease in the recombination coefficient at elevated pressures, while it remains relatively stable across the range of power levels tested. They indicate a range for γ gamma between 0.088 and 0.026 for a copper probe, with a stagnation pressure range between 1.5 and 5 kPa, in good agreement with the analyzed cases for Scirocco.
In the case analyzed in this study, matching the CFDs estimations with calorimetric measurements led to an estimation of γ = 0.08 for both nitrogen and oxygen recombination, as discussed in Section 3.2. This value agrees with Pope’s [43] estimation for copper and nitrogen (N2) recombination, measured at a cold wall temperature of 350 K in an arc-jet facility.

5. Conclusions and Future Work

A systematic analysis of methods for determining the flow enthalpy in the Scirocco Plasma Wind Tunnel was conducted. Three experimental approaches—the sonic throat method, the heat balance method, and the heat transfer method—were evaluated across various operating conditions. Significant discrepancies were observed between measured and predicted heat flux values, necessitating a reassessment of both experimental and numerical models. Initial simulations using a Navier–Stokes model with fully catalytic copper walls underestimated the flow enthalpy. As discussed by Nawaz et al. [44], a fully polished and catalytic surface is nearly impossible, as exposure to atmospheric air quickly forms a thin layer of copper oxide. This discrepancy has been mitigated by introducing partial catalytic behavior at the probe surface.
This adjustment improved the alignment between computational fluid dynamics (CFDs) simulations and experimental data, providing a more accurate representation of heat flux and flow enthalpy. Further evidence of enthalpy underestimation was provided by spectroscopic measurements, showing that the rotational temperature at the nozzle exit exceeded values derived from CFDs-based enthalpy calculations [39,40].
The analysis is of course subject to uncertainties related to simplifying assumptions, particularly regarding the copper surface oxidation state and surface roughness which further complicate measurements, as rougher surfaces generally exhibit higher effective catalytic efficiency. Prolonged exposure exacerbates these effects, making precise determination of the catalytic efficiency coefficient challenging [45,46,47]. Future studies will focus on exploring correlations between the catalytic efficiency coefficient and stagnation pressure, as observed by A. Viladegut and O. Chazot [23]. Additionally, further efforts should investigate a broader range of operating conditions of both the Scirocco and GHIBLI facilities to refine experimental and computational methods for high-enthalpy flow predictions.

Author Contributions

Conceptualization, A.S.; Methodology, A.S.; Simulations, L.C.; Investigation, A.S.; Data curation, A.S. and L.C.; Writing—original draft preparation, A.S.; Writing—review and editing, A.S. and L.C. All authors have read and agreed to the published version of the manuscript.

Funding

This research received no external funding.

Data Availability Statement

The original contributions presented in this study are included in the article. Further inquiries can be directed to the corresponding authors.

Acknowledgments

We thank C. Purpura for providing the materials that supported the data analysis.

Conflicts of Interest

The authors declare no conflicts of interest.

Abbreviations

airAir
ARCAmes Research Center
arcElectrical arc column
ar:Argon
CFDsComputational fluid dynamics
CuOCupric oxide (black copper oxide)
Cu2OCuprous oxide (red copper oxide)
DDiameter of standard probe
DiDiffusion coefficient of the i-th species
EBEnergy balance
FCFully catalytic
γCatalytic efficiency
γNCatalytic efficiency for the N + N → N2 reaction
γOCatalytic efficiency for the O + O → O2 reaction
H⁰Reservoir enthalpy
hiEnthalpy of the i-th species
IHFThe Interaction Heating Facility
kMixture thermal conductivity
kv,iVibrational conductivity of bi-atomic species
LIFLaser-Induced Fluorescence
Flow rate
NsNumber of chemical species
NvibNumber of chemical species with vibrational energy mode
P⁰Reservoir pressure
psProbe stagnation pressure
PWTPlasma Wind Tunnel
qTotal heat flux
qcConvective (roto-translational) heat flux
qdDiffusive (chemical) heat flux
qsProbe stagnation wall heat flux
qvVibrational heat flux
RASpecific gas constant for species A
ρDensity
ρwWall density
STSonic throat
TTemperature
Tw:Wall temperature
Tvib,iVibrational temperature of the i-th vibrational species
TPSThermal Protection Systems
UUncertainty
vVelocity
xDistance of probe from the nozzle exit section
YiMass fraction of the i-th species
YA,wMass fraction of species A at the wall
|MA|Total flux of atoms impinging the surface
|MA|Flux of atoms that recombine at the surface

References

  1. Guida, D.; Smoraldi, A.; Schettino, A. Design of a High Enthalpy Hypersonic Nozzle for ‘Ghibli’ Plasma Wind Tunnel. In Proceedings of the ICAS 2024 AIAA, Firenze, Italy, 9–13 September 2024. [Google Scholar]
  2. Fletcher, D.G. Measurement Requirements for Improved Modeling of Arcjet Facility Flows. In Proceedings of the RTO AVT Course on “Measurement Techniques for High Enthalpy and Plasma Flows”, Rhode-Saint-Genèse, Belgium, 25–29 October 1999. RTO EN-8. [Google Scholar]
  3. Hightower, T.M.; Balboni, J.A.; Donald, C.L.M.; Anderson, K.F.; Martinez, E.R. Enthalpy by Energy Balance for Aerodynamic Heating Facility at NASA Ames Research Center Arc Jet Complex. In Proceedings of the 48th International Instrumentation Symposium, ISA, San Diego, CA, USA, 5–9 May 2002. [Google Scholar]
  4. Winovich, W. On the Equilibrium Sonic-Flow Method for Evaluating Electric Arc Air-Heater Performances; NASA TN D-2132; National Aeronautics and Space Administration: Washington, DC, USA, 1964.
  5. Loehle, S. Comparison of Heat Flux Gages for High Enthalpy Flows—NASA Ames and IRS. In Proceedings of the 46th AIAA Thermophysics Conference, Washington, DC, USA, 13–17 June 2016. [Google Scholar] [CrossRef]
  6. Driver, D.; Philippidi, D.; Terrazas-Salinas, I. Uncertainty Analysis of Coaxial Thermocouple Calorimeters Used in Arc Jets; NASA Ames Research Center: Moffett Field, CA, USA, 2018; p. 94035.
  7. ASTM Standard E 457-08; Standard Test Method for Measuring Heat Transfer Rate Using a Thermal Capacitance (Slug) Calorimeter. ASTM: West Conshohocken, PA, USA, 2008.
  8. Terrazas-Salinas, I.; Carballo, J.; Driver, D.; Balboni, J. Comparison of Heat Transfer Measurement Devices in Arc Jet Flows with Shear; Session TP/HT-21: Entry, Descent, and Landing; American Institute of Aeronautics and Astronautics: Reston, VA, USA, 2012. [Google Scholar] [CrossRef]
  9. Anderson, L.A.; Sheldahl, R.E. Experiments with Two Flow-Swallowing Enthalpy Probes in High-Energy Supersonic Streams. AIAA J. 1971, 9, 1804–1810. [Google Scholar] [CrossRef]
  10. Baronets, P.N.; Bykove, N.G.; Gordeev, A.N.; Pershin, I.S.; Yakushin, M.I. Experimental characterization of induction plasmatron for simulation of entry into Martian atmosphere. In Aerothermodynamics for Space Vehicles; Harris, R.A., Ed.; ESA SP-426; European Space Agency (ESA): Paris, France, 1998; p. 421. [Google Scholar]
  11. Grey, J.; Jacobs, P.F.; Sherman, M.P. Calorimetric Probe for the Measurement of Extremely High Temperatures. Rev. Sci. Instrum. 1962, 33, 738–741. [Google Scholar] [CrossRef]
  12. Zhang, N.; Sun, F.; Zhu, L.; Planche, M.P.; Liao, H.; Dong, C.; Coddet, C. Measurement of Specific Enthalpy Under Very Low Pressure Plasma Spray Condition. J. Therm. Spray Technol. 2012, 21, 489–495. [Google Scholar] [CrossRef]
  13. Fasoulas, S.; Stockle, T.; Auweter-Kurtz, M. Measurement of Specific Enthalpy in Plasma Wind Tunnels Using a Mass Injection Probe. In Proceedings of the 32nd AIAA Thermophysics Conference, Atlanta, GA, USA, 23–25 June 1997. [Google Scholar]
  14. Laux, T.; Feigl, M.; Auweter-Kurtz, M.; Stockle, T. Estimation of the Surface Catalycity of PVD Coatings by Simultaneous Heat Flux and LIF Measurements in High Enthalpy Air Flows. In Proceedings of the 34th Thermophysics Conference, Denver, CO, USA, 19–22 June 2000. [Google Scholar]
  15. Park, C.; Raiche, G.A., II; Driver, D.M.; Olejniczak, J.; Terrazas-Salinas, I.; Hightower, T.M.; Saka, T. Comparison of Enthalpy Determination Methods for Arc-Jet Facility. J. Thermophys. Heat Transf. 2006, 20, 672–679. [Google Scholar] [CrossRef]
  16. Grinstead, J.H.; Driver, D.M.; Raiche, G.A., II. Radial Profiles of Arc-Jet Flow Properties Measured with Laser-Induced Fluorescence of Atomic Nitrogen. In Proceedings of the 41st Aerospace Sciences Meeting and Exhibit, AIAA Paper 2003-0400, Reno, NV, USA, 6–9 January 2003. [Google Scholar]
  17. Park, C. Stagnation-Point Radiation for Apollo 4. J. Thermophys. Heat Transf. 2004, 18, 349–357. [Google Scholar] [CrossRef]
  18. Grau, T.; Stöckle, T.; Fasoulas, S.; Messerschmid, E. Comparison of Numerical Results with Experimental Investigations Obtained by Newly Developed Probes in a Plasma Wind Tunnel. In Aerothermodynamics for Space Vehicles; Harris, R.A., Ed.; ESA SP-426; European Space Agency (ESA): Paris, France, 1999; p. 445. [Google Scholar]
  19. Park, C. Review of Chemical-Kinetic Problems of Future NASA Missions I—Earth Entries. J. Thermophys. Heat Transf. 1993, 7, 385–398. [Google Scholar] [CrossRef]
  20. Park, C.; Lee, S.-H. Validation of Multi-Temperature Nozzle Flow Code NOZNT. In Proceedings of the 28th Thermophysics Conference, AIAA 93-2862, Orlando, FL, USA, 6–9 July 1993. [Google Scholar]
  21. Goulard, R. On Catalytic Recombination Rates in Hypersonic Stagnation Heat Transfer. J. Jet Propuls. 1958, 28, 737–745. [Google Scholar] [CrossRef]
  22. Winkler, E.L.; Sheldahl, R.E. Influence of Calorimeter Surface Treatment on Heat-Transfer Measurements in Arc-Heated Test Streams. AIAA J. 1966, 4, 715–716. [Google Scholar]
  23. Viladegut, A.; Chazot, O. Empirical Modeling of Copper Catalysis for Enthalpy Determination in Plasma Facilities. AIAA J. 2019, 57, 2512–2520. [Google Scholar] [CrossRef]
  24. Cheung, T.M.; Park, G.; Schrijer, F.F.J. Oxygen and Nitrogen Surface Catalytic Recombination on Copper Oxide in Tertiary Gas Mixtures. In Proceedings of the 2015 World Congress on Aeronautics, N/Ao, Bio, Robotics and Energy, Incheon, Republic of Korea, 25–28 August 2015. [Google Scholar]
  25. Cinquegrana, D.; Votta, R.; Purpura, C.; Trifoni, E. Continuum breakdown and surface catalysis effects in NASA arc jet testing at SCIROCCO. Aerosp. Sci. Technol. 2019, 88, 258–272. [Google Scholar] [CrossRef]
  26. Purpura, C.; De Filippis, F.; Barrera, P.; Mandanici, D.D. Experimental characterization of the CIRA plasma wind tunnel SCIROCCO test section. Acta Astronaut. 2008, 62, 2–10. [Google Scholar] [CrossRef]
  27. Medtherm Corp. Coaxial Surface Thermocouple Probe, Bulletin 500; Medtherm Corp.: Huntsville, AL, USA, 2000. [Google Scholar]
  28. Zoby, E.V. Empirical Stagnation-Point Heat-Transfer Relation in Several Gas Mixtures at High Enthalpy Levels; NASA TN D-4799; NASA: Washington, DC, USA, 1968.
  29. Ranuzzi, G.; Cutrone, L. Numerical Simulation of LRE and HRE Reacting Flowfields. In Proceedings of the 67th International Astronautical Congress, Guadalajara, Mexico, 26–30 September 2016; p. 34544. [Google Scholar]
  30. Pandolfi, M.; Borrelli, S. An Upwind Formulation for Hypersonic Non-equilibrium Flows. In Modern Research Topics in Aerospace Propulsion; Springer: Berlin/Heidelberg, Germany, 1991. [Google Scholar]
  31. Flament, C. Chemical and Vibrational Nonequilibrium Nozzle Flow Calculation by an Implicit Upwind Method. In Proceedings of the 8th GAMM Conference on Numerical Methods in Fluid Mechanics, Delft, The Netherlands, 27–29 September 1989. [Google Scholar]
  32. Millikan, R.C.; White, D.R. Systematics of Vibrational Relaxation. J. Chem. Phys. 1963, 39, 3209–3213. [Google Scholar] [CrossRef]
  33. Park, C. Two-Temperature Interpretation of Dissociation Rate Data for N2 and O2. In Proceedings of the Aerospace Sciences Meetings, American Institute of Aeronautics and Astronautics, Reno, NV, USA, 11–14 January 1988. [Google Scholar] [CrossRef]
  34. Yun, K.; Mason, E. Collision Integrals for the Transport Properties of Dissociating Air at High Temperatures. Phys. Fluids 1962, 5, 380–386. [Google Scholar] [CrossRef]
  35. Cutrone, L.; Mastellone, A.; Ranuzzi, G.; Schettino, A.; Matrone, A. User Manual of CAST v 2.1. Tech. Rep. CIRA/CAST/DT-86: User’s Manual CAST V.2—REV.1; CIRA: Capua, Italy, 2009. [Google Scholar]
  36. Kang, S.-W.; Jones, W.L.; Dunn, M.G. Theoretical and Measured Electron-Density Distributions at High Altitudes. AIAA J. 1973, 11, 141–149. [Google Scholar] [CrossRef]
  37. Scott, C.D. Wall Boundary Equations with Slip and Catalysis for Multicomponent Nonequilibrium Gas Flows; NASA TM X-58111; NASA: Washington, DC, USA, 1973.
  38. Savino, L.; Martucci, A.; Del Vecchio, A.; De Cesare, M. A Novel Physics Methodology Based on Compact Emission Spectroscopy in the VNIR (0.4–0.9 μm) Ranges for Plasma Shock Layer and Material Temperature Determinations. Infrared Phys. Technol. 2020, 108, 103353. [Google Scholar] [CrossRef]
  39. Cipullo, A.; Savino, L.; Marenna, E.; De Filippis, F. Thermodynamic State Investigation of Hypersonic Air Plasma Flow Produced by an Arc-Jet Facility. Aerosp. Sci. Technol. 2012, 23, 358–362. [Google Scholar] [CrossRef]
  40. Savino, L.; Cinquegrana, D.; French, A.; De Cesare, M. Resolved Optical Emission Spectroscopy as Accurate Physics Methodology for Plasma Freestream Temperature Characterization. J. Quant. Spectrosc. Radiat. Transf. 2022, 291, 108323. [Google Scholar] [CrossRef]
  41. Driver, D.M.; Sepka, S. Side Arm Reactor Study of Copper Catalysis. In Proceedings of the 45th AIAA Thermophysics Conference, AIAA 2015-2666, Dallas, TX, USA, 22–26 June 2015. [Google Scholar] [CrossRef]
  42. Vasil’evskii, S.A.; Gordeev, A.N.; Kolesnikov, A.F.; Chaplygin, A.V. Thermal Effect of Surface Catalysis in Subsonic Dissociated-Air Jets. Fluid Dyn. 2020, 55, 708–720. [Google Scholar] [CrossRef]
  43. Pope, R.B. Stagnation-Point Convective Heat Transfer in Frozen Boundary Layers. In Proceedings of the 6th Aerospace Sciences Meeting, AIAA Paper No. 68-15, New York, NY, USA, 22–24 January1968. [Google Scholar]
  44. Nawaz, A.; Driver, D.; Terrazas-Salinas, I.; Sepka, S. Surface Catalysis and Oxidation on Stagnation Point Heat Flux Measurements in High Enthalpy Arc Jets. In Proceedings of the 44th AIAA Thermophysics Conference, AIAA, San Diego, CA, USA, 24–27 June 2013. [Google Scholar]
  45. Kidd, C.T. High Heat-Flux Measurements and Experimental Calibrations/Characterizations; NASA CP 3061; NASA Langley Research Center: Hampton, VA, USA, 1993; pp. 317–335.
  46. Kidd, C.T.; Nelson, C.G.; Scott, W.T. Extraneous Thermoelectric EMF Effects Resulting from the Press-Fit Installation of Coaxial Surface Thermocouples in Metal Models. In Proceedings of the 40th International Instrumentation Symposium, Baltimore, MD, USA, 1–5 May 1994; Instrument Society of America: Research Triangle Park, NC, USA, 1994; pp. 317–335. [Google Scholar]
  47. Brune, J.A.; Morrow, C.C. Uncertainty Analysis of Slug Calorimeters in the NASA Hy-METS Arc-Jet Facility. J. Thermophys. Heat Transf. 2024, 38, 232–249. [Google Scholar] [CrossRef]
Figure 1. Simplified scheme of the heat balance methodology for the determination of the mass-averaged total enthalpy, for the CIRA Scirocco facility.
Aerospace 11 01023 g001
Figure 2. Simplified scheme of the measurement setup for the stagnation heat flux and pressure. CIRA Scirocco facility.
Aerospace 11 01023 g002
Figure 3. Tip of standard 100 mm diameter hemispherical copper-cooled probe. Gardon gauge and pressure ports are highlighted.
Aerospace 11 01023 g003
Figure 4. Computational domain and mesh for Scirocco rebuilding test cases.
Aerospace 11 01023 g004
Figure 5. Final comparison of enthalpy determination methods: enthalpy values, computed using various methods, are plotted against the Zoby-derived enthalpy calculated from heat flux measurements. Linear interpolations of these data and error bars are also shown for each method.
Aerospace 11 01023 g005
Figure 6. Results of CFDs calculations at nozzle throat for Scirocco: (a) enthalpy and temperature and (b) velocity and density. Mean radiation distribution from the free-stream plasma flow at the nozzle exit (Test 13, Table 1).
Aerospace 11 01023 g006
Figure 7. Example of radial profile of (a) stagnation heat flux ( q s ) and (b) pressure ( p s ) of the free-stream plasma flow of the SICROCCO facility (Test 26, Table 1).
Aerospace 11 01023 g007
Figure 8. Mean radiation distribution from the free-stream plasma flow (a); transversal profiles extracted from the mean radiation distribution of the free-stream plasma flow for I t o t = 3681 A and m ˙ AIR = 0.74 kg/s (Test 4, Table 1) (b).
Aerospace 11 01023 g008
Figure 9. Dependence of deduced centerline enthalpy H c 0 on assumed catalytic efficiency γ for Scirocco (test 26–28, Table 1).
Aerospace 11 01023 g009
Table 1. Experimental dataset of the quantities measured on the facility for the analyzed test cases, including enthalpy estimates obtained through numerical and experimental techniques.
q s [kW/m2]V [kV] p s
[kPa]
m ˙ AIR
[kg/s]
m ˙ Ar [kg/s] I [A]Energy Balance [MJ/kg]Sonic Throat [MJ/kg]Heat Transfer [MJ/kg]Stagnation [MJ/kg]
Test CaseExperimentalCFD
Instrumentation DataMass AveragedCenterlineFull Cat.
114787.43.410.640.03228910.8511.7514.40N/A
222267.24.140.680.03404512.4815.9219.69N/A
326396.84.460.680.035135N/A18.3522.4920.30
420637.43.860.690.03368113.8314.2018.9017.43
521787.43.960.680.033970N/A14.71N/A18.00
621076.45.000.900.03348312.0713.45N/AN/A
721076.55.000.900.03348312.3012.56N/AN/A
814405.33.730.620.03213210.77N/AN/AN/A
919105.34.900.740.03301211.0313.57N/AN/A
1022706.66.200.960.03363613.1414.54N/AN/A
1124206.66.000.960.03406011.2414.54N/A18.34
1212276.62.790.480.0418369.84N/A13.0812.81
1314116.63.000.480.042224N/AN/AN/A14.00
1417526.23.240.480.04303211.82N/AN/AN/A
1518787.13.780.600.043204N/AN/A17.2816.28
1619207.13.700.620.043340N/A13.9217.8716.74
1717436.84.040.620.042790N/AN/AN/AN/A
1818506.84.100.620.043047N/AN/AN/A15.55
1919406.74.140.620.043268N/AN/AN/A16.12
2020126.74.150.620.043453N/AN/AN/A16.59
2120726.64.180.620.043607N/AN/AN/A17.04
2221646.64.130.620.043873N/AN/A19.0617.46
23218173.870.610.044009N/AN/A19.8418.24
2422326.93.880.610.044152N/AN/A20.28N/A
25 14146.83.980.840.043793N/AN/AN/A12.46
26 18606.84.500.840.042601N/AN/AN/A14.99
27 23006.74.900.840.041802N/AN/AN/A17.33
Table 2. List of instruments used in the calculation of enthalpy via sonic throat method and energy balance method, along with their associated uncertainties.
QuantitySensorMaker/ModelUncertainRange unit
VoltageVoltage Divider N/A±1.20% rdg 0–30,000V
Electrical currentHall Effect Sensor CTL-10000Y03/CTA212H-24, Ohio Semitronics, Hilliard, OH, USA±0.10% FS 0–10,000A
Air mass flow rateCoriolis Force Sensor CMF200, Micromotion, St. Louis, MO, USA±0.10% rdg 0–12.1kg/s
Argon mass flow rateCoriolis Force Sensor CMF205, Micromotion, St. Louis, MO, USA±0.18% rdg 0.001–0.1kg/s
Water flow rate (arc heater)Orifice Plate Venturi tube
+ABB 600T, ABB, Zurich, Switzerland
±0.035% FS 0–2500m3/h
Differential temperature (arc heater)Thermopile ROSEMOUNT model 3144
D111Q4 Emerson Rosemount, Chanhassen, MN, USA
±0.318 °C 0–20°C
Stagnation pressureAbsolute Pressure TransducerValidyne P55A, Validyne Engineering Corp, Northridge, CA, USA±0.25% rdg0–106Pa
Table 3. Heat transfer constant for gases mixture [22].
Gas K i
lbm g
Air0.04610.1235
Argon0.06510.1744
Disclaimer/Publisher’s Note: The statements, opinions and data contained in all publications are solely those of the individual author(s) and contributor(s) and not of MDPI and/or the editor(s). MDPI and/or the editor(s) disclaim responsibility for any injury to people or property resulting from any ideas, methods, instructions or products referred to in the content.

