Article

Identification of Critical Nodes for Delay Propagation in Susceptible-Exposed-Infected-Recovered (SEIR) and Genetic Algorithm (GA) Route Networks

Air Traffic Control and Navigation College, Air Force Engineering University, Xi’an 710051, China
*
Author to whom correspondence should be addressed.
Aerospace 2024, 11(11), 878; https://doi.org/10.3390/aerospace11110878
Submission received: 23 August 2024 / Revised: 15 October 2024 / Accepted: 22 October 2024 / Published: 25 October 2024
(This article belongs to the Section Air Traffic and Transportation)

Abstract

:
In response to the challenges associated with forecasting the trajectory of flight delay propagation, pinpointing pivotal nodes within the route network, and the substantial costs involved in enhancing operational efficiency, this study introduces an innovative approach to identifying critical nodes that influence delay propagation across route networks. The methodology commences by establishing a route network model for East China, leveraging the principles of complex network theory. It then incorporates the SEIR (Susceptible-Exposed-Infected-Recovered) model, typically used for analyzing the dynamics of infectious disease spread, to examine the propagation of delays between routes. Subsequently, the approach employs a GA to identify key nodes, which are then compared against those identified by network topology indices. The simulation outcomes demonstrate that the GA’s identification of key nodes offers superior insights into the overall network’s susceptibility to infection, thereby presenting operational managers with novel perspectives for analyzing the spread of flight delays.

1. Introduction

Flight delays pose a significant and intricate challenge to the aviation industry [1], influenced by an array of factors that are challenging to eradicate entirely. These delays have a profound impact not only on the economic well-being of passengers and airlines but also on the broader aviation ecosystem and associated industries. A single airport’s operational efficiency can be compromised by delays, leading to a cascade of negative consequences such as flight postponements and cancellations. The financial toll of flight delays on the air transportation sector is staggering, with billions of dollars lost annually due to a confluence of factors, including weather conditions. The inevitability of delays is further compounded by the expanding route networks, the tension between limited airspace resources, and the increasing demands of flight scheduling, military aviation activities, and other contributing factors [2].
When a flight is delayed, it sets off a chain reaction that affects subsequent flights, creating a ripple effect that can overwhelm large airports and lead to further delays [3]. This oversaturation of airport resources can exacerbate the situation, causing delays to spread throughout the entire route network. The interconnectedness of airports and navigation points within the network means that a disruption in one link can have far-reaching effects, propagating delays throughout the system [4].
Understanding the underlying mechanisms of delay propagation is crucial for grasping the essence of flight delays. By delving into the core attributes that contribute to these delays, we can develop more effective strategies to mitigate their impact. Consequently, the analysis of flight delays has become a focal point of current research, with the potential to significantly enhance the resilience and efficiency of the aviation industry.
To address the adverse effects of cascading flight delays, a multidisciplinary approach has been adopted by professionals and academics. They have delved into the realms of flight scheduling optimization [5], weather forecasting and response [6] mechanisms, air traffic management [7], and collaborative decision-making [8] within airports. While these efforts have yielded some success, they often face challenges such as lengthy development cycles and narrow applicability of findings.
In this paper, we propose a novel methodology that leverages the intricacies of the actual flight route network. By simulating the spread of infectious diseases as a metaphor for flight delays, we are able to model and predict the propagation of delays throughout the network. Our approach involves identifying key nodes within the network that, when prioritized and protected, can significantly reduce the impact of flight delays.
To enhance our understanding of flight delays, we utilize route network models as a tool for conducting detailed studies. This allows us to analyze the complex interdependencies within the aviation system and develop strategies that are both effective and scalable. By focusing on the protection of critical nodes, we aim to create a more resilient flight network that can better withstand and recover from operational disruptions.
In the realm of route network model selection, various scholars have contributed distinct perspectives. Xiangni He and colleagues [9] introduced the dual-hub route network model, which aims to enhance route overlap optimization. However, the applicability of this model is somewhat limited, as it is primarily designed for route optimization between two specific airports.
Yang Wendong and his team [10] have ventured into the realm of complex network theory to develop an airline-level route network model. They have focused on data from the period of 2010 to 2019 for their model’s construction. While this approach offers valuable insights, it may not be the most effective solution for addressing the delay propagation issues that are central to the focus of this paper.
Du Tencheng and associates [11] have crafted a dynamic ripple delay propagation model that takes into account the variability in weather conditions and geographical disparities. This model excels at depicting the propagation of flight delays under the strain of adverse weather, providing a more nuanced understanding of the complexities involved.
Building upon the cumulative research of these scholars, this paper integrates their findings and introduces a novel approach. It utilizes operational index data from major airports, navigation points, and routes in East China as the basis for network edge weights. By establishing a weighted route network model, we employ the analytical methods of complex network theory to delve into the structural characteristics and performance of the East China route network. This comprehensive analysis aims to provide a more robust framework for understanding and mitigating flight delays within the region.
Having delved into the intricacies of constructing a route network model, we now shift our focus to a closely intertwined concern: the selection of an appropriate propagation dynamics model. The route network model lays the groundwork by mapping the interconnections among nodes, represented by airports. However, it is the propagation dynamics model that delves deeper into the heart of the matter, clarifying the underlying principles that govern the spread of flight delays.
Choosing the right dynamics model is paramount for achieving an accurate representation and forecast of flight delays. It is this model that captures the nuances of how delays ripple through the network, affecting various nodes in a cascading manner. The selection process must consider the model’s ability to reflect the complexity of real-world flight operations, including the impact of external factors such as weather conditions, mechanical issues, and air traffic congestion.
In essence, the propagation dynamics model serves as the linchpin that translates the structural insights gained from the route network model into actionable predictions. It is through this model that we can simulate various scenarios, assess the vulnerability of different nodes, and devise strategies to mitigate the propagation of delays. The accuracy and reliability of this model are therefore critical to the effectiveness of any intervention aimed at enhancing the resilience and efficiency of the aviation network.
In the quest to understand the complexities of airline route networks, Cheng and colleagues [12] have focused on developing a route time series network model. This innovative model is designed to analyze and predict time series data, offering a dynamic perspective on the evolution and patterns of flight data over time. By capturing the temporal fluctuations, this model enhances our ability to assess the robustness of the network against disruptions.
Cao and team [13] have introduced a multilayer network model with active nodes, a significant advancement in the field of complex network theory. This model adeptly describes intricate systems that consist of multiple layers of interconnected networks. The incorporation of active nodes endows the multilayer network with time-varying characteristics, effectively simulating real-world scenarios that include latency periods and the intriguing phenomenon of nodes becoming susceptible again after recovery, thus providing a more realistic representation of network dynamics.
Liu and associates [14] have proposed a coupled diffusion model that is instrumental in examining the propagation of information or states through both inter-layer and intra-layer connections within multilayer networks. Their research delves into the competitive dynamics between accurate and inaccurate messages and how this competition influences the spread of infections, offering valuable insights into the control of misinformation in networked systems.
Zhu and co-researchers [15] have constructed a symbiotic evolution model, building upon the well-established SIR (Susceptible-Infected-Recovered) model. This theoretical model is employed to analyze the development and changes in various subjects engaged in interdependent interactions. By enhancing the SIR model, they aim to improve our understanding of how different factors can influence the spread and control of infections within a network, thereby contributing to a more nuanced approach to managing network health and resilience.
Traditional models of infectious disease transmission dynamics, such as the SIR, SIS (Susceptible-Infected-Susceptible), and SEIR models, provide a foundational framework for understanding the spread of diseases. However, when applying these models to the context of delay propagation within airline networks, certain limitations become apparent.
The SIR [16] model, which tracks the transition of individuals from being susceptible to being infected and then recovering, does not account for a latency period. This makes it less suitable for modeling the delay propagation process in airline networks, where delays often accumulate over time.
The SIS [17] model, on the other hand, assumes that flights immediately return to a susceptible state after recovery from a delay. This oversimplification neglects the impact of the accumulated delay, which can have significant repercussions on the network’s performance.
The SEIR [18] model, which introduces an additional latency phase (the E phase), offers a more nuanced and accurate depiction of the delay propagation process. By incorporating the E phase, the SEIR model can meticulously simulate the complexities of flight delay propagation, taking into account the latency period and the accumulation of delays.
Given these considerations, this paper adopts the SEIR infectious disease model as the kinetic model for analyzing delay propagation in the airline route network. The SEIR model’s ability to capture the nuances of the delay accumulation and propagation process makes it a valuable tool for understanding and potentially mitigating the spread of flight delays within the network.
Once the propagation dynamics model for the route network has been established, the next critical step is to pinpoint the key nodes within the network that play a pivotal role in delay propagation. Identifying these nodes is of paramount importance, as they are typically highly connected and influential airports that can dramatically influence the velocity and extent of delay propagation throughout the network.
These key nodes, often functioning as hub airports, handle a substantial volume of flight arrivals, departures, and transfers. A delay at any of these nodes can rapidly spread to other parts of the network, triggering a domino effect that escalates the risk of widespread delays across the entire route network.
Zhu and colleagues [19] have employed hyper-degree to quantify the local significance of nodes, providing a method to accurately and efficiently identify nodes of importance. Luo and team [20] have utilized the Social Network Analysis (SNA) model, an interdisciplinary approach that leverages graph theory and mathematical models to examine the relationships between social entities and to analyze the centrality and accessibility of network factors within the wind network domain. Li and co-researchers [21] have integrated structural equilibrium theory to enhance the accuracy of network link predictions.
However, these identification methods, while valuable, may not offer a comprehensive enough view to encompass the entire route network, relying primarily on topological indicators. In this paper, we propose a novel approach to key node identification by employing a GA following the simulation of delay propagation within the route network. This method allows for the optimization of key nodes, thereby enhancing the operational efficiency, route utilization, and on-time flight performance of the entire network.
By leveraging the GA, we can account for a broader range of factors and interactions within the network, leading to a more holistic and effective strategy for managing and mitigating the impact of flight delays. This approach not only promises to improve the current state of the route network but also lays the groundwork for more resilient and efficient air travel in the future.
In conclusion, this paper embarks on a comprehensive analysis by initially crafting a detailed route network model comprising 104 nodes and 195 interconnecting edges. The edge weights are meticulously determined through a hierarchical analysis approach, taking into account the saturation levels of routes and a variety of other pertinent factors.
Subsequently, the paper constructs a virtual correlation network, which includes 195 segments and 917 network connecting edges. The correlations between these segments are established based on their correlation factors. To this network, the logistic Steele’s growth model is applied to quantify the recovery probability of each of the 195 segments, factoring in their respective distances. This model also assigns recovery probabilities to the 195 connecting edges, providing a nuanced understanding of the network’s resilience.
Furthermore, the SEIR model is reintegrated into the route network model to govern the propagation dynamics, effectively depicting the infection process of route delays. The simulation initiates with five nodes designated as infected (I state), allowing us to observe and analyze the subsequent delay propagation patterns.
The variability in output values, resulting from the selection of different initial infected nodes, underscores the complexity of delay propagation. To navigate this complexity, GA is introduced. These algorithms employ a fitness function, denoted as f(x), to sift through numerous possibilities and identify the most optimal solutions.
Finally, the paper incorporates stochastic point finding and degree centrality index to pinpoint key nodes within the network. These methods are subjected to comparative experimental analysis, ensuring a robust and reliable identification of nodes that are critical to the network’s operation and the propagation of delays.
Through this multifaceted approach, the paper not only provides a detailed map of the route network’s structure and dynamics but also offers strategic insights into how to manage and mitigate the spread of flight delays, enhancing the overall efficiency and reliability of the aviation system.

2. Route Network Construction

In order to further study the basic model of the aviation network, this chapter takes the airports/navigation points/mandatory reporting points as nodes and the routes as connecting edges and constructs the weighted aviation network topology model of East China oriented to the actual operation by collecting the relevant data of the aviation system of the East China region of China and statistically organizing them.

2.1. Route Network Model

The aviation network topology model G ( V , E , W ) is a network consisting of military and civil airports, navigation points, civil air routes, and temporary routes for military aviation. The node v in the topological model denotes the airports and navigation stations, identified as the set V = { v 1 , v 2 , , v i } , whose number is i ; the edge e denotes the transportation relationship between airports and airports, between airports and navigation points, and between navigation points and navigation points, i.e., the airway routes. If the actual operating airway route in the airspace passes through the airport or navigation point, it is considered that there is a connecting edge between the nodes; otherwise, there is no connecting edge; the set E = { e 1 , e 2 , e j } is the set of edges, and its number is j . The weights on the connected edges w j are set as the combined weights of four indicators, namely, route saturation, meteorological conditions, flight delays, and military aviation activities, which reflect the operation situation of the aviation network and are determined as the set W = { w 1 , w 2 , , w j } .
East China includes many large cities such as Shanghai, Nanjing, Suzhou, Ningbo, etc., with rich economic and trade activities and tourist attractions, while the route network in this region is more complicated. Further, 104 real airports and navigation points in East China were screened as target nodes on 28 April 2024 from the 2023 China Civil Aviation Route Route Data from Civil Aviation Network (https://www.ccaonline.cn/, 21 October 2024). The complex network analysis tool Gephi (a powerful open-source network analysis and visualization tool for processing and displaying various types of complex networks) was applied. It is able to map the relevant network through data import and calculate various attributes of the network, including the degree of nodes, centrality, PageRank, clustering coefficient, etc. Input the geographic coordinates of each node and map the route network of East China, as shown in Figure 1.
Based on the connectivity relationship between airports and navigation point nodes, the East China route network contains a total of 104 nodes and 195 edges. Nodes denote airports/navigation points/mandatory reporting points, and connecting edges are the connection relationship between two nodes.

2.2. Determination of Route Network Margins

On the basis of the contiguous relationship, four indicators, namely, route saturation, flight delay rate, meteorological conditions, and military aviation activities, were analyzed, as shown in Table 1.
According to the influencing factors of the four indicators in Table 1, the corresponding contiguous weights were calculated by the hierarchical analysis process (AHP).
The 1–9 scale method shown in Table 2 is a common method of comparing indicators.
Through expert assessment, the four indicators can be considered to be ranked in order of importance as AS > DF > WC > MA. Matrix S describes the results of the comparison between the four indicators, as follows:
S = 1 3 5 7 1 / 3 1 3 5 1 / 5 1 / 3 1 3 1 / 7 1 / 5 1 / 3 1
Calculate the eigenvector ω corresponding to the largest eigenroot λ of the judgment matrix S and normalize it to obtain the weight vector W:
W i = j = 1 n a i j n i = 1 n j = 1 n a i j n
Where a i j is the element in matrix A and W = [ W 1 , W 2 , , W n ] T is the eigenvector corresponding to the largest eigenvalue of matrix S. According to Equation (2), the weight vector is calculated as follows:
W = [ W 1 W 2 W 3 W 4 ] = [ 0.5650 0.2622 0.1175 0.0553 ]
Next performs a consistency test and calculates the largest eigenvalue: λ max
λ max = 1 n i = 1 n j = 1 n a i j W j W i = 4.1169
Coherence indicator CI reads.
C I = λ max n n 1 = 0.0389
Consistency weighting CR is.
C R = ( λ max n ) / ( n 1 ) R I = 0.0438
Where, RI is the random consistency indicator, when n = 4 , RI is taken as 0.9. Therefore, the judgment matrix satisfies the consistency test and the weights of the indicators are as follows:
W A S = 0.5650 ,   W D F = 0.2622 ,   W W C = 0.1175 ,   W M A = 0.0553
Due to the differences in the order of magnitude of each data, the maximum-minimum method was used to normalize each indicator. The route saturation AS was processed as in Equation (7). The remaining three indicators were processed in the same way, as follows:
A S j = A S j min A S ( e ) max A S ( e ) min A S ( e )
In summary, the weighted sum of the four metrics is the combined edge weight of the route network connecting edges w j :
w j = 0.5650 × A S j + 0.2622 × D F j + 0.1175 × W C j + 0.0553 × M A j
From the definitions of the four indicators, it can be seen that the larger the route network edge weight w j is, the more complex the operational posture of the edge and the higher the degree of operational risk.
As shown in Table 3, the route network contiguous edge weights are derived through weighting. Subsequently, according to the segment correlation analysis, it can be seen that there are different degrees of influence between segments, and when there are flight delays in the segments, these degrees of influence will be transformed into the corresponding weights, which will have a certain impact on the delays of the segment network, and the correlation network of East China is constructed based on the correlation analysis of the segments as shown in Figure 2.
In Figure 2, the East China correlation network includes 195 segment nodes and 917 segment connecting edges. Combined with reality, we believe that the longer the segment distance in real segments, the larger the delay adjustable space of the segment, the higher the self-recovery probability of the nodes, and therefore invoke the logistic Steele growth model to quantify the distance to derive the contiguous edge recovery probability.
The Logistic Growth Model (LGM), also known as the self-inhibitory equation, is a mathematical model widely used to describe population growth, market demand, resource consumption, and other areas. It assumes that the growth rate will gradually slow down with the finiteness of resources and eventually reach a steady state. For example, Yang Bo [22] et al. introduced the logistic Steele growth model to improve the accuracy of medium- and long-term forecasting and better predict the container throughput of container ports. In this paper, we believe that the logistic Steele growth model can be used to characterize the growth of segment distance, predict the saturation point and growth trend of the route, and quantify the infection probability. The formula is expressed as follows:
P ( L ) = 1 1 + e [ α × ( L L 0 ) ]
where P(L) is the probability at a segment length of L; α is a positive coefficient controlling the growth rate. L 0 is the half-saturation constant, i.e., P(L) reaches half of its maximum value when L peaks.
The recovery probability of each segment node can be calculated by the above equation, as shown in Table 4.
In Table 4, we derive the recovery probability based on the LGM from the known segment distance to provide data support for the next step in analyzing the spread of infectious disease delays.

3. Delay Propagation Model for Route Networks

Analyze the applicability of the SEIR model to study the delay propagation law of the route network, and divide the nodes in the route network into normal nodes, delay nodes, delay propagation nodes, and recovery nodes based on the SEIR model, which lays the foundation for constructing the delay propagation model of the route network in the following.

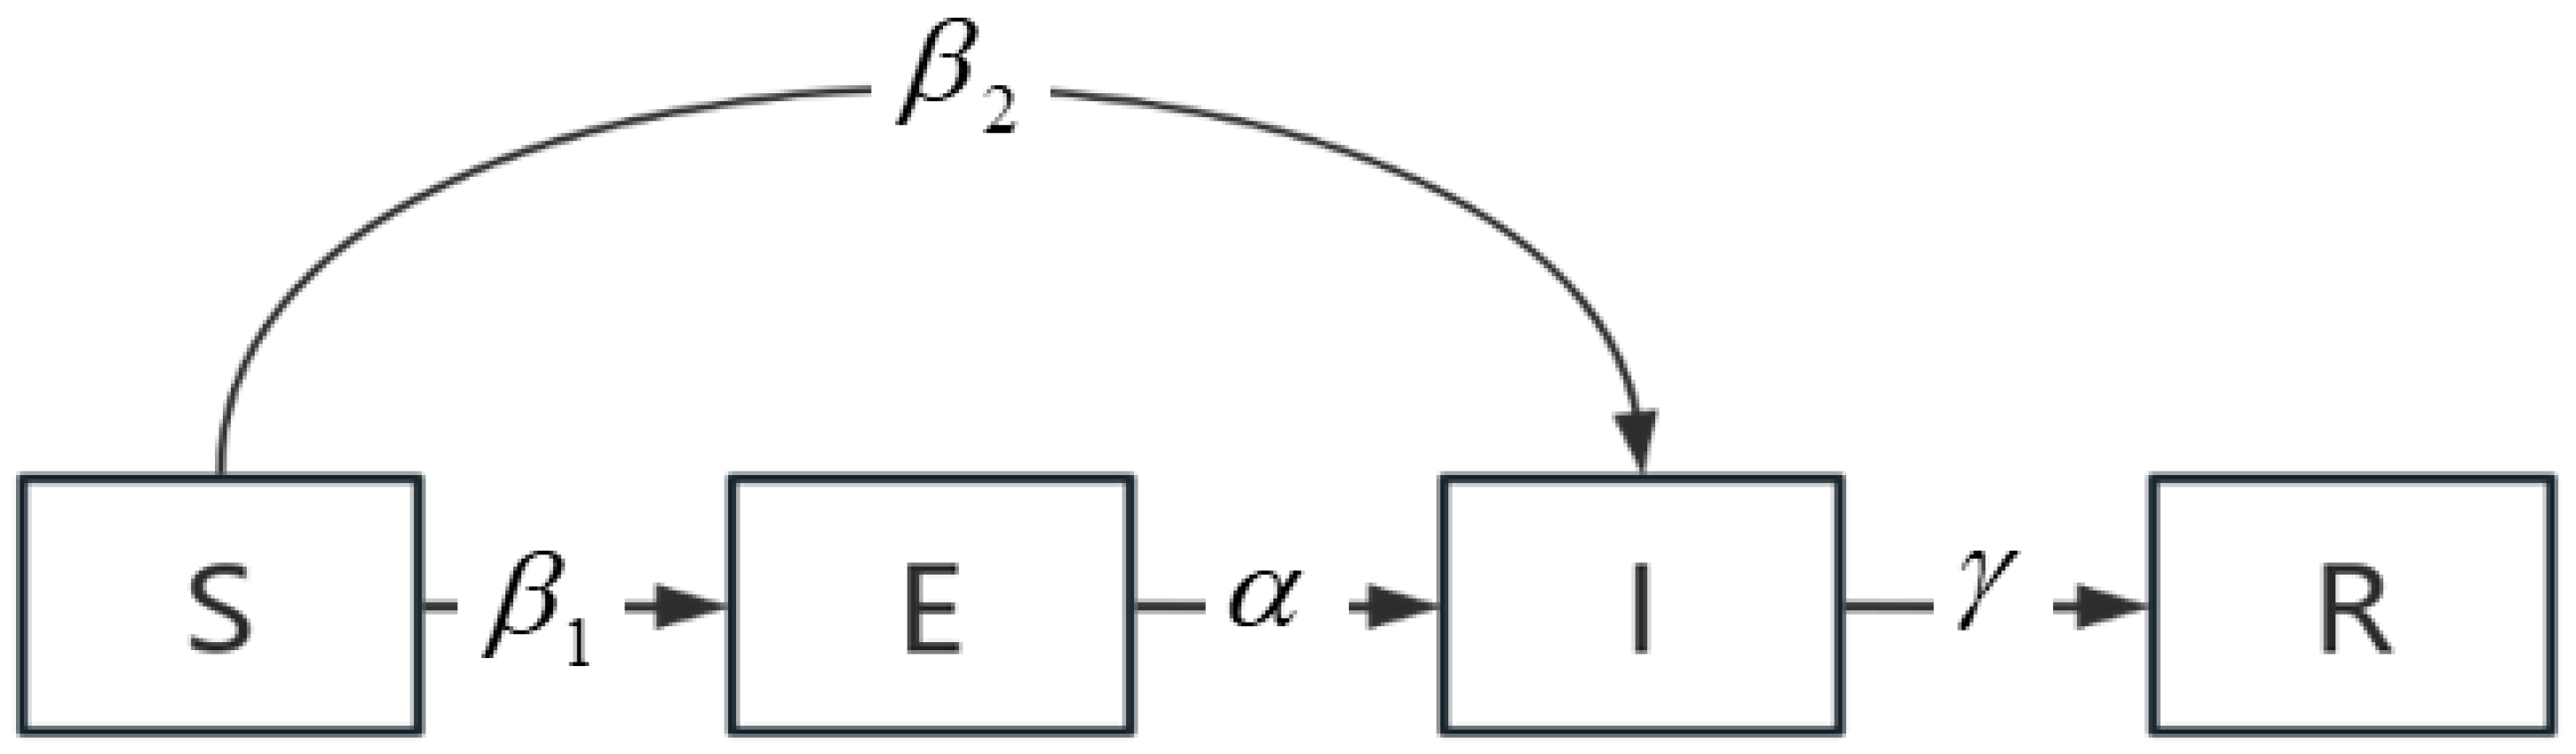
3.1. Suitability of the SEIR Model
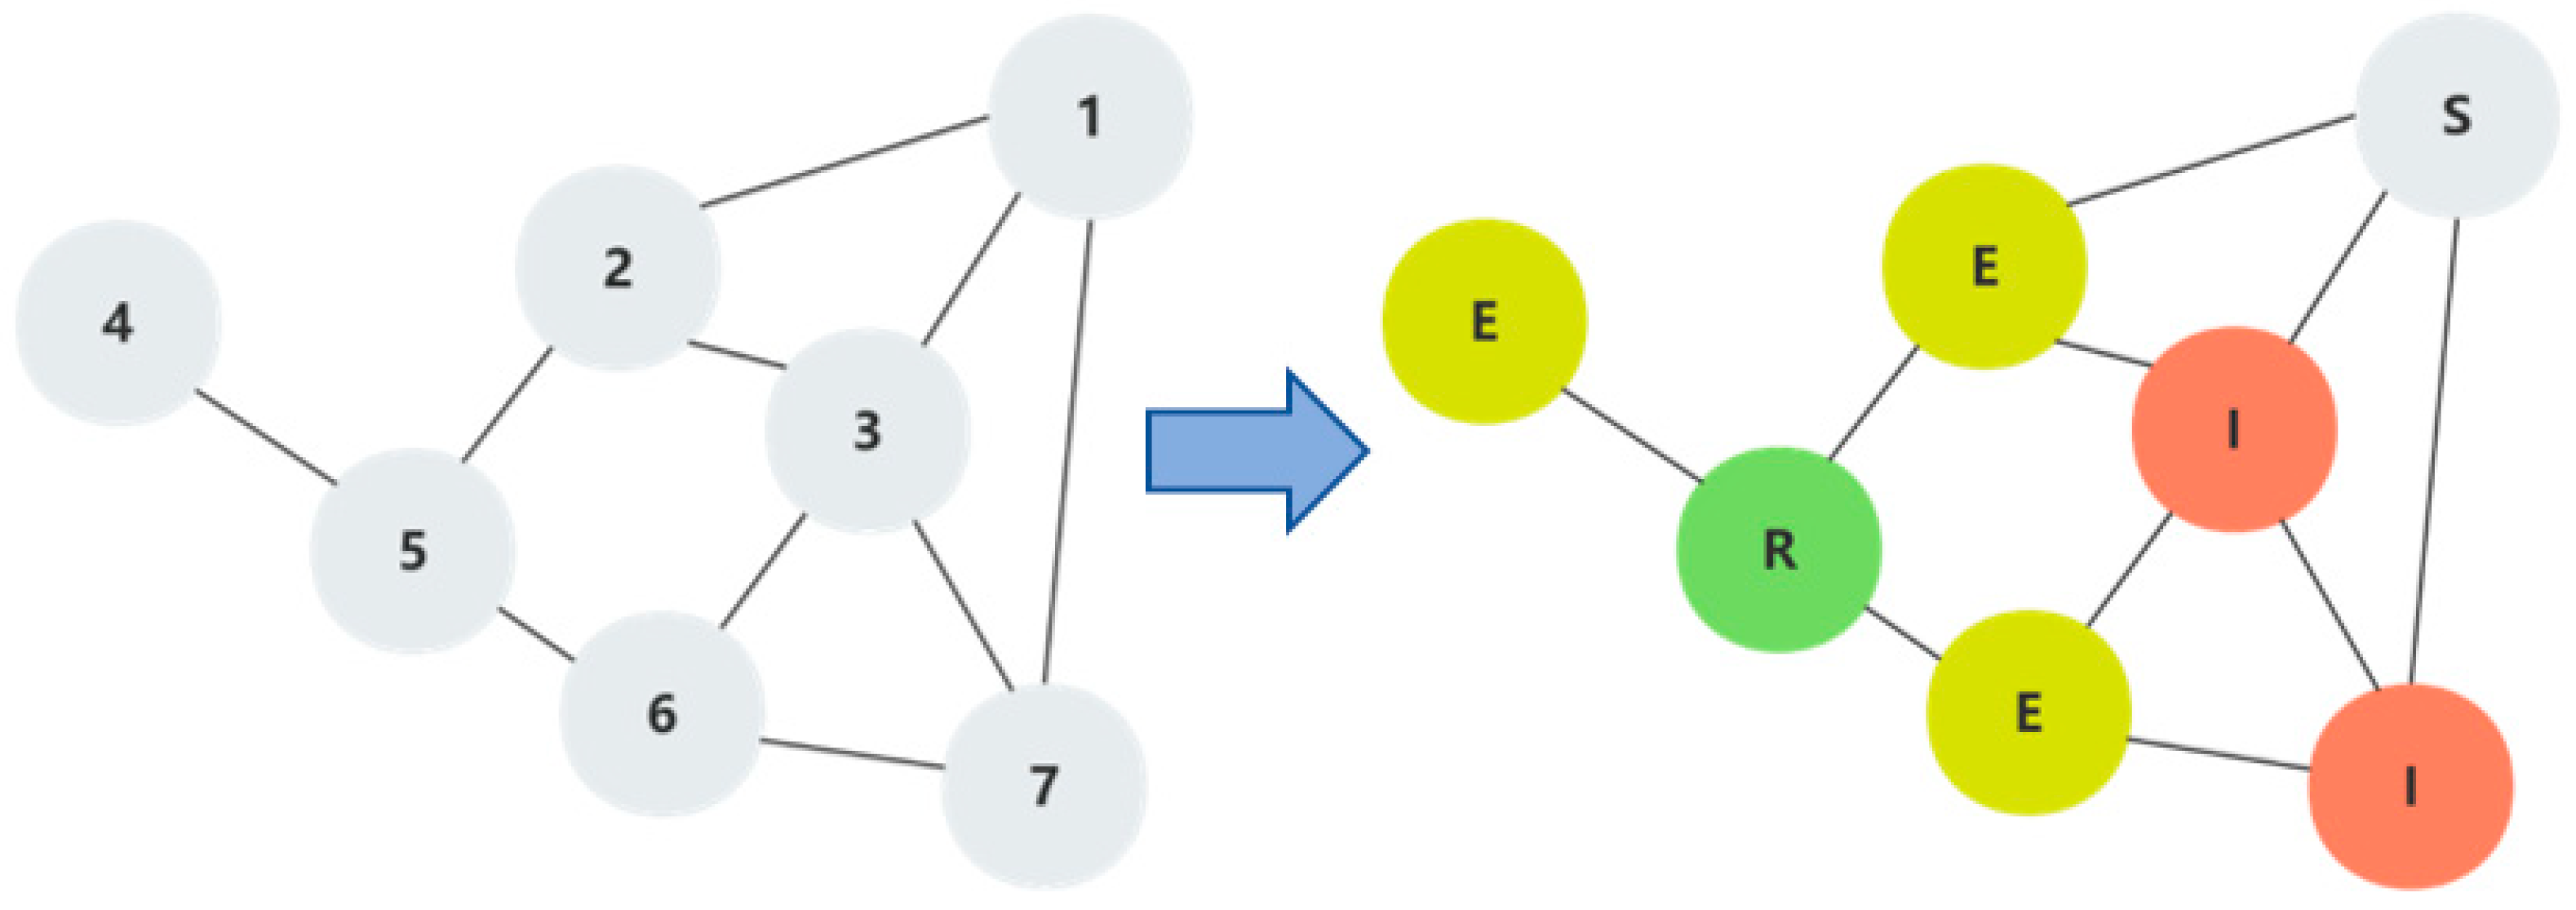
Anderson and May [23] In 1991, the SEIR model was proposed based on the SIR model with the addition of the latency state E of the epidemic, which increased the applicability of the model by the latency period not being infectious. Currently, with the popularization of the model, in addition to epidemiology [24], they are also used in information [25] or social networks [26] of transmission mechanisms, etc., and the state iterative transitions are shown in Figure 3.
(1) A delayed node of a route network can transmit delays to its associated nodes, which is equivalent to an infected person I transmitting a virus to a susceptible person S in the SEIR model.
(2) Normal nodes, after being affected by delayed nodes, do not have delayed propagation capability immediately because the nodes themselves have a certain capacity and will be infected only after a period of time, which is equivalent to the susceptible person S being infected by the infected person I in the SEIR model, which is transformed into the latent person E first and then into the infected person I with the capability of infection.
(3) The delayed nodes of the route network will be delayed and dissipated after a certain period of time by way of route network optimization, flight deployment, etc., and transformed into non-delayed nodes, which is similar to that of an infected person I who recovers from the disease and transforms into an immune person R.
From the above analysis, it can be seen that the route network delay propagation process is similar to the infectious disease model propagation process, which indicates that the SEIR model is borrowed for the study of the route network delay node-to-node propagation applicability is better and more in line with the actual situation than the SIR model.

3.2. Node Division

Based on the SEIR model, the nodes in the route network are divided into the following four states based on the comprehensive consideration of the delay propagation process in the route network, as shown in Table 5.

3.3. Set the Parameters of the Route Delay Propagation Model

The model equation of infectious disease transmission dynamics of delay in the airline network is shown in Equation (10). Solving this model yields the number of delayed nodes within the network, while the model applies to the propagation process throughout the network nodes.
d S d t = ( β 1 E + β 2 I ) S N d E d t = ( β 1 E + β 2 I ) S N α E d I d t = α E γ I d R d t = γ I
In the above equation, the rate of change in the number of susceptible persons over time is proportional to the number of infected persons and the rate of exposure; the rate of change in the number of exposed persons over time is affected by the rate of newly infected susceptible persons and the rate at which exposed persons convert to infected persons; the rate of change in the number of infected persons over time is affected by the rate at which exposed persons convert to infected persons and the rate at which infected persons recover or die; the rate of change in the number of recovered persons over time is proportional to the rate at which infected persons recover.
To aid the GA in deriving state values, which are treated as Markov chains in this study, we posit that the state of one day is solely dependent on the state of the preceding day. Consequently, we introduce the following iterative equation:
S n = S n 1 ( β 1 E n 1 + β 2 I n 1 ) S n 1 N E n = S n 1 ( β 1 E n 1 + β 2 I n 1 ) S n 1 N α E n 1 I n = I n 1 + α E n 1 γ I n 1 R n = R n 1 + γ I n 1
To further clarify the propagation dynamics formula mentioned above, the significance of the variables within the formula is detailed in Table 6.

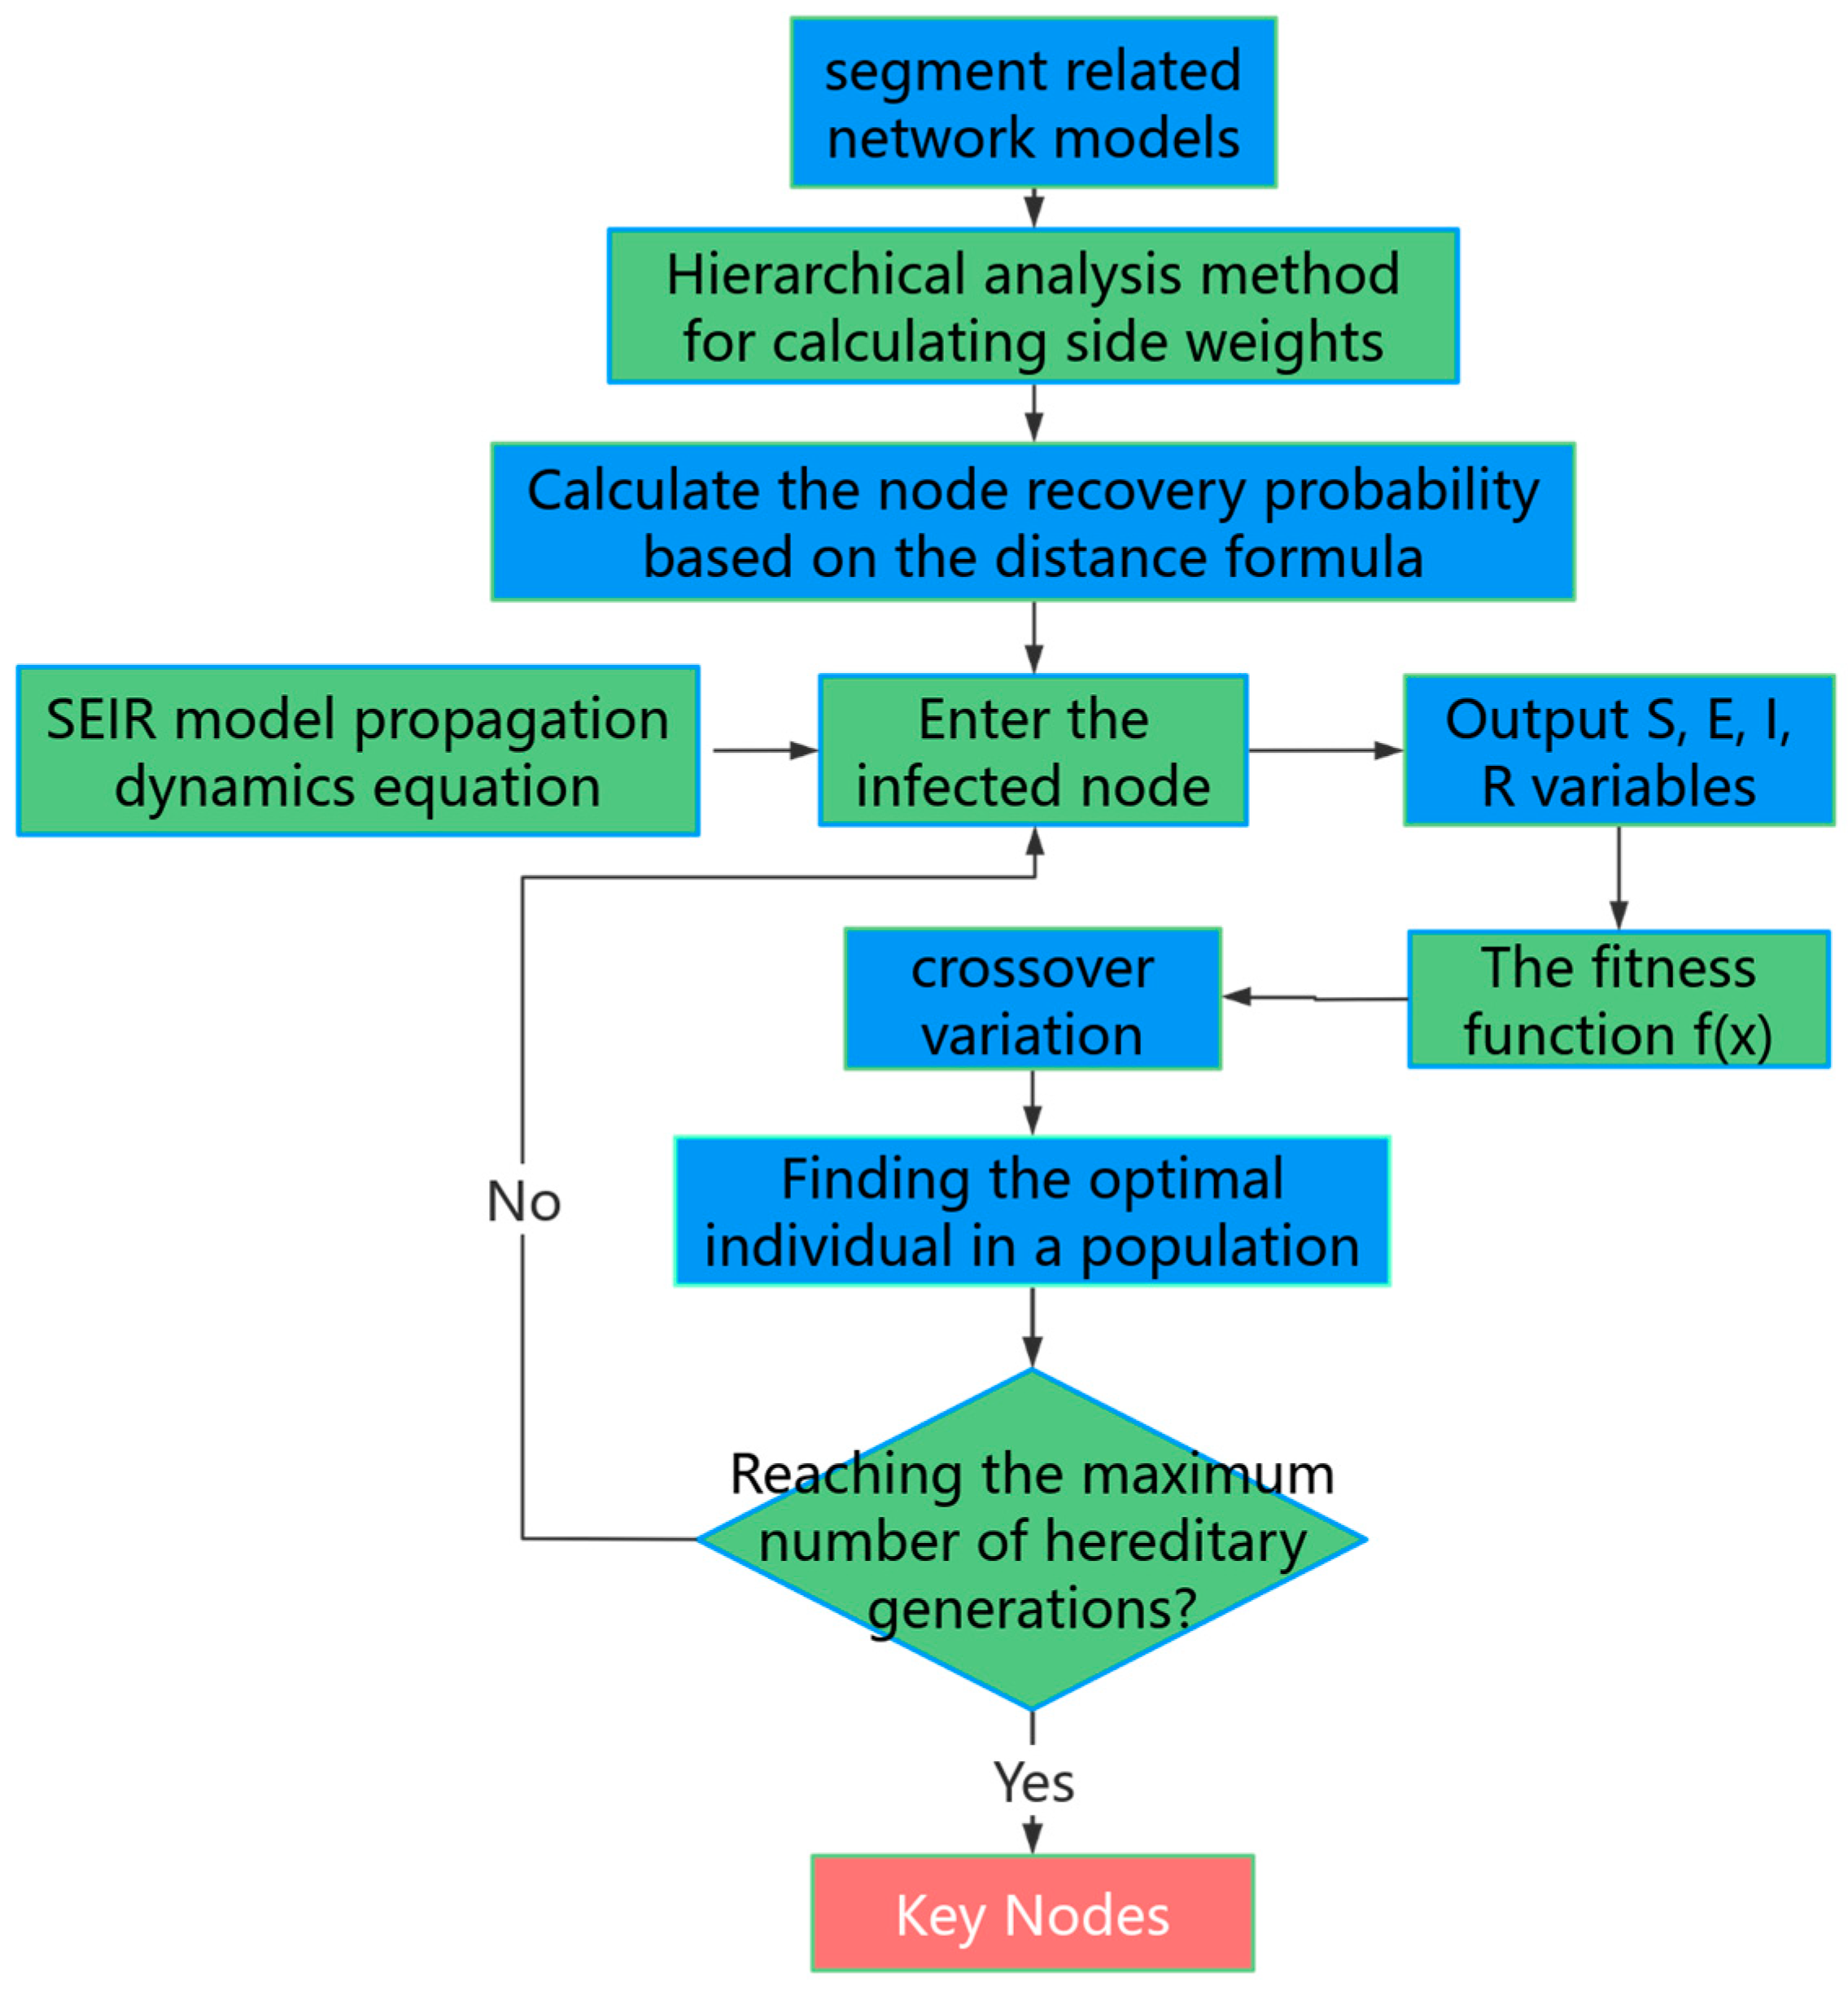
4. Principle and Algorithm of the GA for Identifying the Key Nodes of the Air Route Network

The identification of key nodes of the route network can be done by using GA by parameter setting and optimizing the fitness function to find the initial infected node as the key node by taking the value of the fitness function as a reference.

4.1. Principle of GA

GA takes “generation” as a cycle of calculation; there are several “individuals” in each generation; each individual should be screened by the fitness function, eliminating the individuals with low fitness and selecting the individuals with high fitness for crossover and mutation to form a new individual and participate in the next round of calculation at the same time with the original individual; the process is shown in Figure 4a. The process is shown in Figure 4a, and the principle of crossover and mutation is shown in Figure 4b,c.

4.1.1. Initial Population

An initial population is formed based on 104 nodes in the route network, where each individual represents a potential solution to the problem.

4.1.2. Evaluating Fitness Value

According to the rules and principles of infectious disease transmission dynamics in this paper, 5 nodes out of 104 nodes are selected as a group of infected nodes to form different groups and evaluate their values. A fitness function is also defined to evaluate the fitness of each individual, i.e., their merit as a solution. The higher the fitness, the higher the probability that an individual will be selected for reproduction.

4.1.3. Sort and Select

Individuals are selected based on their fitness, with highly fit individuals having a higher probability of being selected, and the selection process can be roulette selection, tournament selection, or other methods.

4.1.4. Crossover and Mutation

Crossover: selected individuals produce offspring by crossover (or hybridization), in which some of the chromosomes of two-parent individuals are exchanged to produce new chromosomes.
Mutation: randomly changing certain genes in certain individuals with a certain small probability in order to increase the diversity of the population and prevent the algorithm from converging to a local optimum solution prematurely.

4.1.5. Save the Best “Fit” Individuals

A certain number of individuals are selected based on fitness to form the next generation of the population. This process may include elite strategies, i.e., ensuring that the best individuals are passed on directly to the next generation.

4.2. Overview of the Key Node Identification Methods

The process of SEIR infectious disease modeling combined with GAs for critical node identification involves the use of the SEIR model to simulate the propagation of infectious diseases in a network, where each node represents a navigation point and the edges represent the likelihood of delayed propagation between navigation points. Simulation through the SEIR infectious disease dynamics model allows for an assessment of the impact of different nodes in the network on the spread of delays. The selection of key nodes is optimized based on the global search capability of the GA, i.e., the nodes with the most critical impact on the overall delay propagation of the network are identified through iterative selection, crossover, and mutation operations. The method not only considers the topology of the network but also incorporates the dynamic nature of infectious disease propagation, which helps to prioritize interventions to protect or intervene in these critical nodes in resource-limited situations, thus effectively slowing down the propagation of delays.

4.3. Description of Key Parameters of the Route Delay Propagation Model

In the infectious disease transmission dynamics model Equations (10) and (11), the values of α are assumed to be 0.25, β 1 to be 0.65, β 2 to be 0.75, and γ to be 0.1, and the GA parameter selection is further explained.

4.3.1. Group Size N

The population size will affect the final result of genetic optimization as well as the execution efficiency of the GA. When the population size N is too small, the genetic optimization performance is average. Using a larger population size can reduce the chance of the GA falling into a local optimal solution, but a larger population means a higher computational complexity. Generally, N is taken as 10–200. We here select the screened 104 real airports and navigation points population size N in East China.

4.3.2. Crossing Probabilities P c

The crossover probability P c controls how often the crossover operation is used. A larger crossover probability can enhance the ability of the GA to open up new search regions, but the possibility of the high-performance pattern being damaged increases; if the crossover probability is too low, the GA search may fall into a sluggish state. Generally, P c take 0.25–1.00; through the experimental simulation, the crossover probability selected in this paper is 0.7.

4.3.3. Probability of Variation P m

Variation is an auxiliary search operation in GA, and its main purpose is to maintain the diversity of the population. Generally, low-frequency variation can prevent the possible loss of important genes in the population, and high-frequency variation will make the GA tend to purely random search. Usually P m takes 0.001–0.1, and through experimental simulation, the probability of variation selected in this paper is 0.05.

4.3.4. Terminating Evolutionary Algebra T of Genetic Operations

The termination evolutionary algebra T is a parameter indicating the end condition of the GA operation, which indicates that the GA stops running after running to the specified evolutionary algebra and outputs the best individual in the current population as the optimal solution of the required problem. Generally, depending on the specific problem, the value of T can be between 100 and 1000, and through experimental simulation, the number of iterations is selected as 200 in this paper.

5. Experimental Simulation

Degree Centrality is the importance of a node in a network, measured by the number of connections to that node. In complex networks, degree centrality reflects the connectivity of nodes. Therefore, in this paper, we choose Degree Centrality as a complex network parameter index and GA for comparative experimental analysis through simulation experiments to explore which method can identify the key nodes more effectively and provide a better solution to the route network delay.

5.1. Experimental Procedure

According to the real East China route network model, the model includes the recovery probability of each node and edge weight setting, combined with the above proposed SEIR model for the derivation of infectious disease transmission dynamics model for the identification of key nodes, and then optimize the fitness function with the degree centrality of the key nodes for the comparative analysis, to find out the key nodes that are more in line with the realities of the infection, and the overall steps are shown in Figure 5.
The overall flow of the simulation is shown in Figure 5, and the specific execution steps are as follows:
Step 1: Construct the route network. According to the route network delay-related heading saturation, meteorological conditions, military aviation activities, and other indicators, the weights of the four influencing factors are calculated through hierarchical analysis, and then the conversion probability is found according to the Markov chain to calculate the edge weights. The higher the weight value, the more complex the operation situation of the route where the edge is located, and the two neighboring nodes are more likely to cause delay propagation.
Step 2: Set the recovery probability for 104 nodes. Each airport node has a different capacity and therefore different recovery effects for delays. The value of edge weight is related to the point strength of the node; the more the number of edges and the higher the point strength, the better the recovery of that node.
Step 3: Apply the SEIR infectious disease model according to the characteristics of the route network, assuming that node 3 in the 1–7 node network node schematic 6 is the infected person, and simulate the infection of the route network based on the infectious disease dynamics model in Figure 6.
After selecting the local nodes and renumbering them, the states corresponding to nodes 1–7 are judged in conjunction with the analysis of the infectious disease model, and the state judgments of the nodes and their descriptions are shown in Table 7.
Summarizing Table 7 above, the infection of nodes 1–7 changes with the state, and due to the large amount of simulation calculations, it is necessary to introduce a GA to assist the calculation.
Step 4: Optimize the fitness function by GA to find the infected node with the highest weighted value as the optimal solution. Fitness function:
f ( x ) = 0.0553 × S + 0.2622 × E + 0.5650 × I + 0.1175 × R
Step 5: Compare the optimal solution of the GA with the randomly generated nodes and the nodes found out based on degree centrality to derive different infection scenarios for different time periods of the simulation experiments and to better reduce the propagation of delays by protecting the critical nodes.

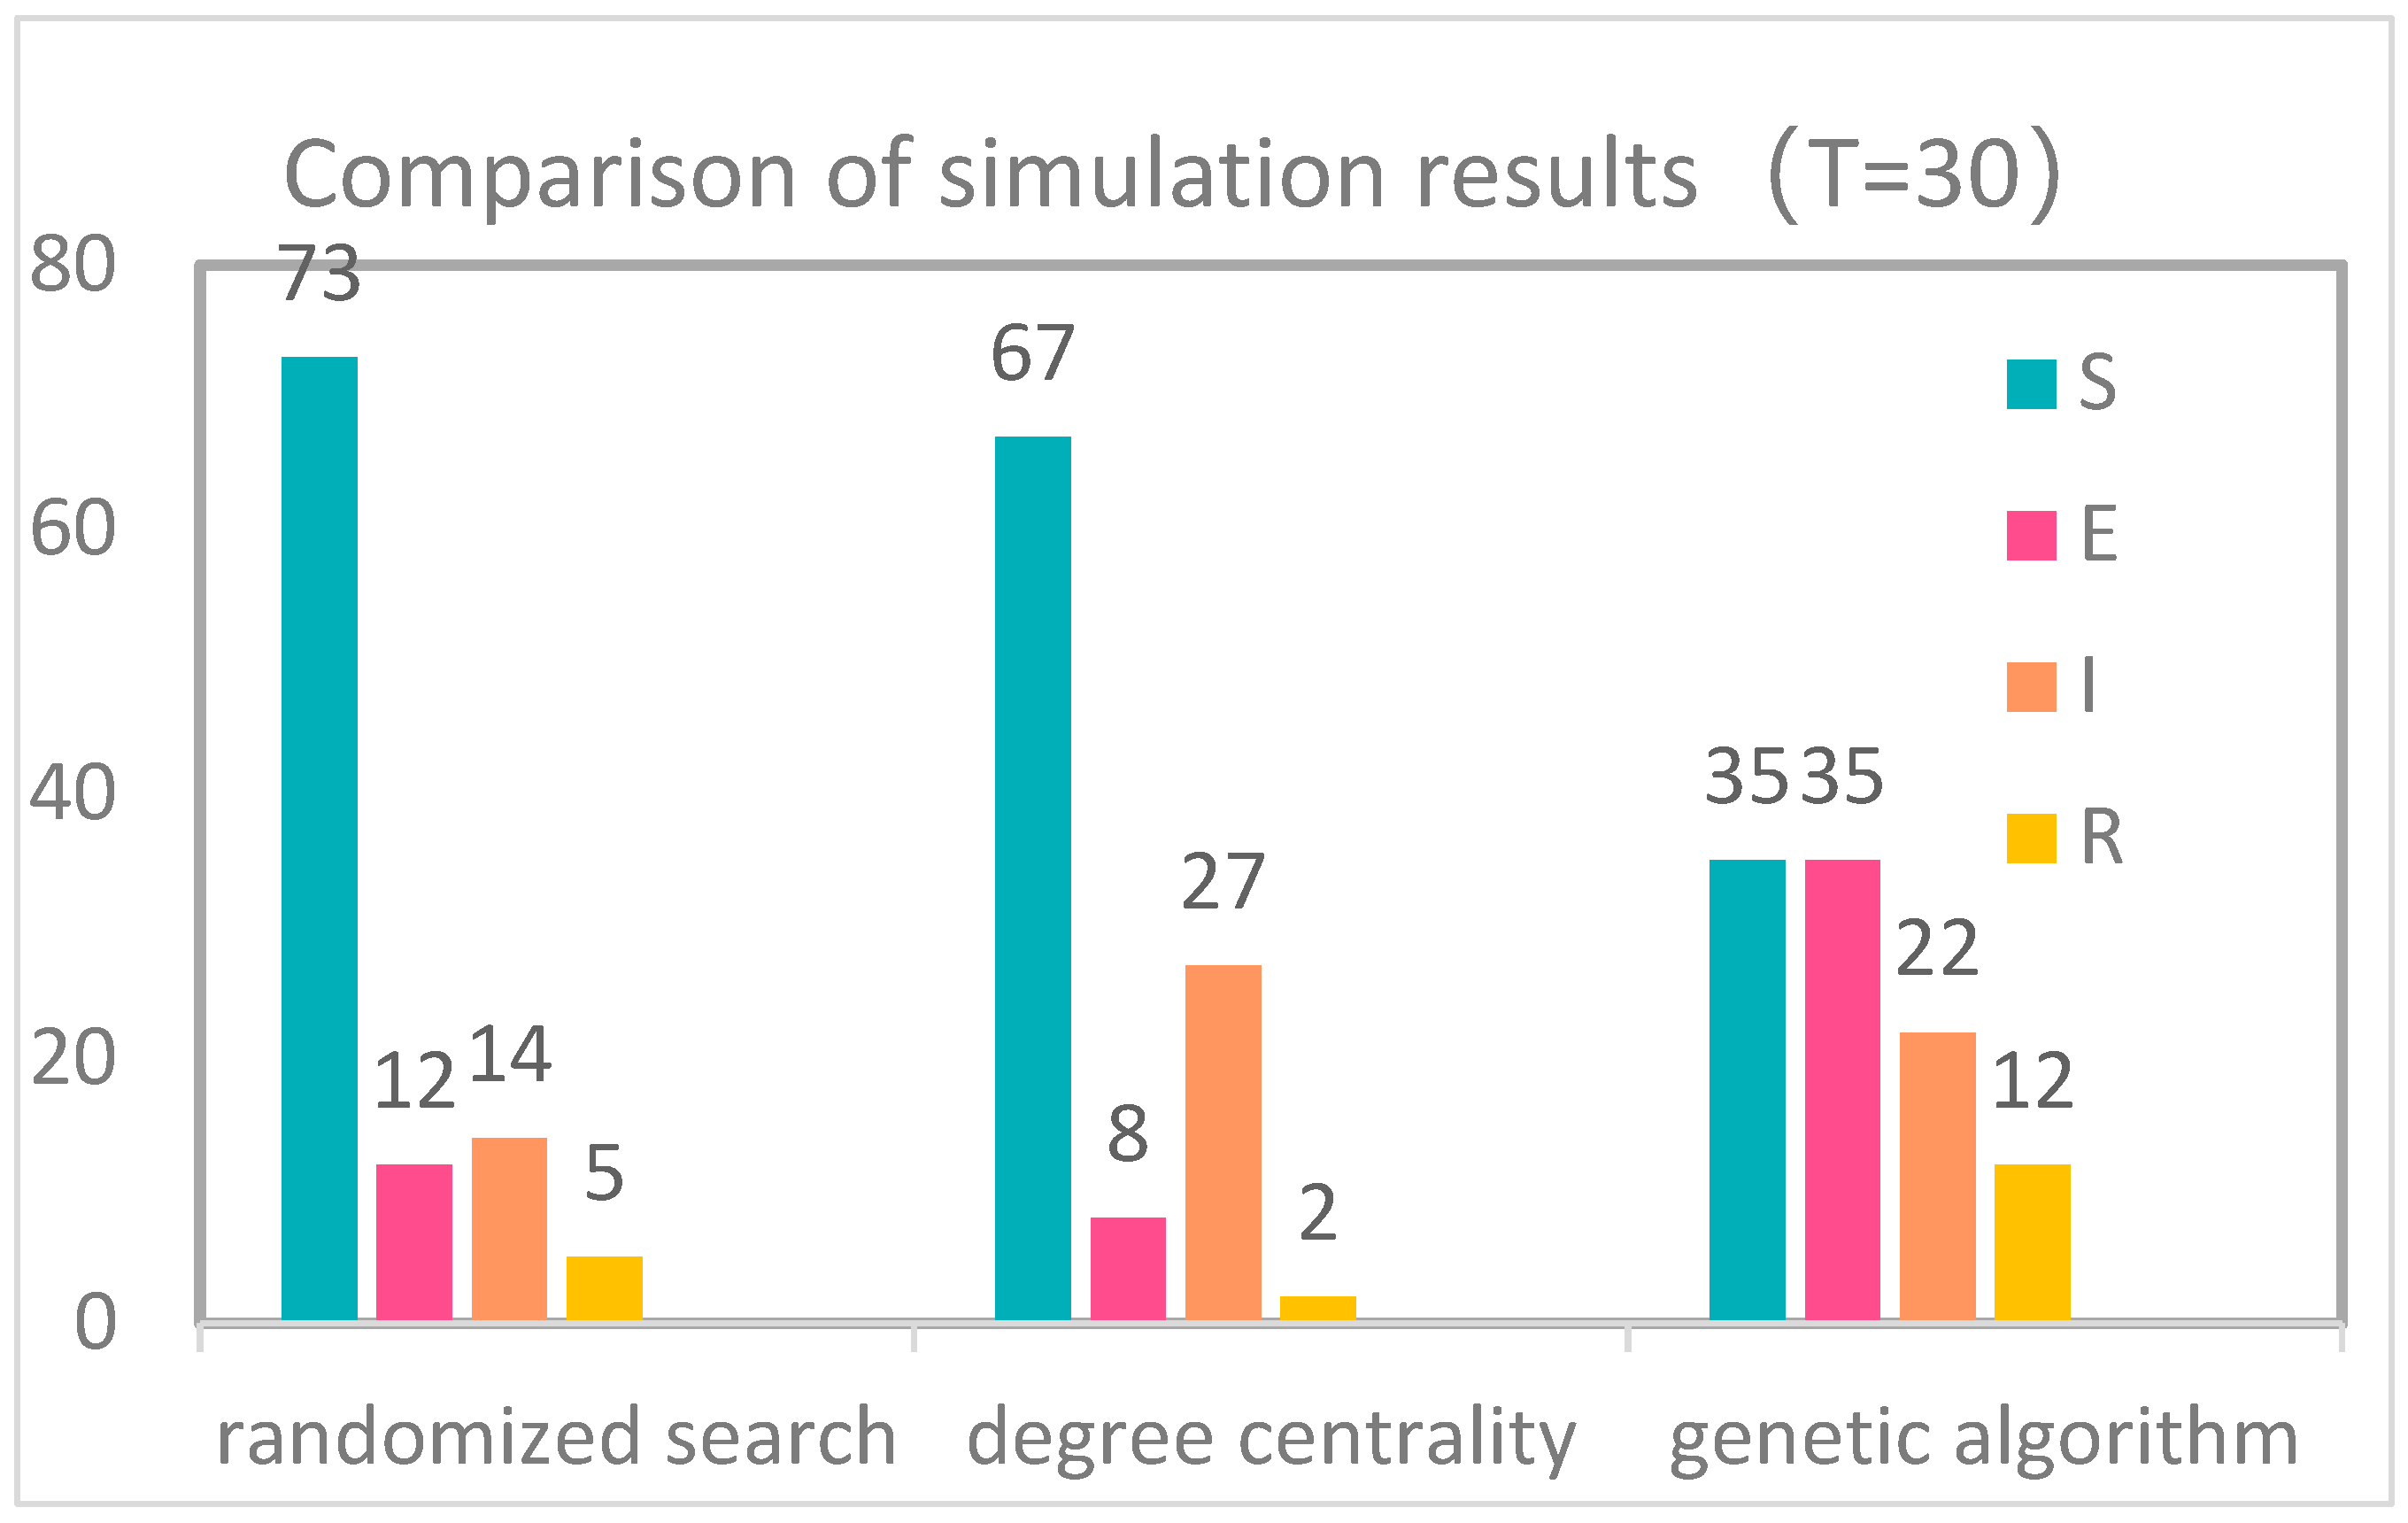
5.2. Simulation Results and the Analysis

According to the above experimental steps, we simulate and analyze the route network model, based on which we introduce the SEIR infectious disease transmission dynamics formula for delay process analysis, and at the same time, we introduce GA, through which the algorithm randomly searches for the appropriate infected node, and then we limit the final result of the infected node with the fitness function and constantly optimize the iteration in order to find the optimal infected node. As shown in Figure 7, the optimal output result is found at about the 20th generation, and the best fitness function extreme value is obtained, so the input node corresponding to this result is exactly the key node to be found in this paper.
Since degree centrality can better reflect the connectivity of nodes in complex networks, the five nodes with the largest degree centrality are considered to be selected as the comparison experiments in this paper. As shown in Figure 8a, the five nodes with degree centrality are LADIX, P07, UDETI, VOR (YCH), and VOR (PUD).
Meanwhile, Figure 5 GA adaptation screening simulation results in an infection scenario where the output five nodes are ALDAP, MAGLI, RAXEV, ANRAT, and NDB (AR), as shown in Figure 8b.
In order to find the nodes in the route network that have the greatest impact on delay propagation, this paper introduces random point finding (any five nodes are selected as a control group to jointly analyze the node infection), and according to the flow chart shown in Figure 6, it inputs five nodes and assigns them to state I, simulates the delay propagation, and outputs four states after 30 iterations (S, E, I, R) in the simulation of the validation of the centrality of the degree and the identification of the nodes of Gas. The simulation results are shown in Figure 9.
According to the simulation results, we integrate the output nodes of the three methods and calculate the weighted values of the simulation results based on the fitness function f (x) = 0.0553 × S + 0.2622 × E + 0.5650 × I + 0.1175 × R, as shown in Table 8.
According to the data in Figure 10 and Table 8, and after comparison, it is found that the delay nodes (state I) of degree centrality at T = 30 are the most (27). However, there are still two-thirds of normal nodes (67), so although there are a lot of delayed segments, they can still maintain the normal operation of the network, while the GA’s normal nodes are only one-third (35), and at this time, the route network has appeared to be delayed in a number of segments and cannot be operated normally. The weighted sum values can also visualize that the GA is better than degree centrality and random point finding, so the key nodes found by the GA have a higher degree of influence on the route network and need to be protected.
In order to experience the completeness of the experimental process, this paper sets the number of iterations to 200 and carries out delay propagation simulation analysis for the degree centrality key node and the GA key node, as shown in Figure 10 and Figure 11.
From the line graph, it can be clearly seen that there are only more than 10 normal nodes left in the route network under the key nodes of GA at 40 generations, and the network suffers from large delays and is difficult to recover; at the same time, there are still more than 60 normal nodes at 40 generations of time-centeredness, and the overall performance of the network is good.
When, after 100 iterations, the GA recovery nodes have reached 70, at this time the network has gradually normal operation. At this time, the degree of centrality of the normal nodes plus recovery nodes is also maintained at about 70, and throughout the iterative process, the degree of centrality of the normal nodes (S state) and the recovery nodes (R state) always remains above 60, so the delay propagation process of the network is affected by delays but still able to operate normally, and GA in the iteration is 30–100. In the 30–100 iterations of the GA, the sum of normal nodes and recovery nodes is still lower than 60, so the network is more seriously affected by the delay, and the key nodes need to be protected in order to improve the overall operation and robustness of the network.

6. Conclusions

This paper is based on the route network model and more SEIR infectious disease propagation dynamics for delayed propagation analysis, followed by parameter calculation and experimental simulation of the key node identification process through GA. On the issue of finding key nodes, this paper starts from two aspects: one is to find some characteristic nodes through the attributes of the complex network itself, analyze the characteristic node comparison to find out the key nodes, and the second is to adjust the corresponding fitness function through the GA by iterating continuously to find out the key nodes and compare them. Simulation results show that the key nodes identified by the GA simulate the infection situation better than the degree centrality nodes, which verifies the applicability of the experiment.
At the same time, there are some limitations in this paper; for example, the choice of parameter values is debugged through simulation experiments, the experiments are biased towards theorizing, and for the time being, do not take into account the subsequent delay of the recovery node infected situation as well as the route network contingency on the network caused by a step of the delay. The subsequent content will be centered on how the key nodes are protected and how to deal with the re-routing process in unexpected situations.

Author Contributions

Conceptualization, X.W. and H.X.; Methodology, M.Z.; Software, M.Z.; Formal analysis, X.W. and H.X.; Resources, M.W.; Data curation, M.W. and H.X.; Writing—original draft, M.Z.; Writing—review & editing, X.W.; Supervision, M.W. All authors have read and agreed to the published version of the manuscript.

Funding

This research received no external funding.

Data Availability Statement

The original contributions presented in the study are included in the article, further inquiries can be directed to the corresponding author.

Conflicts of Interest

The authors declare no conflict of interest.

References

  1. Iata Economics. International Air Transport Association (IATA). Tech. Rep. 2020. [Google Scholar]
  2. Bureau of Transportation Statistics. Airline On-Time Performance and Causes of Flight Delays. 5 March 2020. Available online: https://www.transtats.bts.gov/ot_delay/ot_delaycause1.asp (accessed on 15 July 2020).
  3. Salleh, S.S.; Shukri, A.S.; Othman, N.I.; Saad, N.S.M. Data stories and dashboard development: A case study of an aviation schedule and delay causes. IOP Conf. Ser. Earth Environ. Sci. 2023, 1151, 012049. [Google Scholar] [CrossRef]
  4. Li, S.; Xie, D.; Zhang, X.; Zhang, Z.; Bai, W. Data-Driven Modeling of Systemic Air Traffic Delay Propagation: An Epidemic Model Approach. J. Adv. Transp. 2020, 2020, 8816615. [Google Scholar] [CrossRef]
  5. Din, Y.T.; Guo, J.Z.; Xing, X.Q.; Zheng, M.M.; Xia, T.B.; Xi, L.F. Joint optimization strategy of civil aircraft fleet flight assignment and maintenance scheduling. Comput. Integr. Manuf. Syst. 2024, 30, 205–216. [Google Scholar] [CrossRef]
  6. Qiao, W.H. Thoughts on enhancing the capability of meteorological and extreme weather prediction and early warning service in civil aviation. Civ. Aviat. Adm. 2023, 5, 65–67. [Google Scholar]
  7. Qi, Y.N.; Wang, X.T.; Wu, Z.Y. Air Traffic-Dependent Network Complexity Prediction Based on ICA-LSTM. Complex Systems and Complexity Science. pp. 1–9. Available online: http://kns.cnki.net/kcms/detail/37.1402.n.20240311.1713.004.html (accessed on 15 May 2024).
  8. Liu, T.; You, H.L. Research on transportation scheduling optimization based on human-machine collaborative decision-making. Transp. Syst. Eng. Inf. 2024, 24, 136–148. [Google Scholar] [CrossRef]
  9. He, X.N.; Li, Y.H.; Yang, J. An optimization model of dual hub route network based on competition scenario. J. Beijing Univ. Astronaut. 2022, 50, 2902–2911. [Google Scholar] [CrossRef]
  10. Yang, W.D.; Huang, Y.N.; Zhang, S.R. RCEP based on multi-layer complex network. Complex Syst. Complex. Sci. 2023, 20, 60–67. [Google Scholar] [CrossRef]
  11. Du, T.C.; Han, S.C.; Han, Y.X. Analysis of air route network delay propagation. Mod. Comput. 2022, 28, 1–9. [Google Scholar]
  12. Cheng, Q.; Wang, D.C.; Li, Y.H. Robustness analysis of route network timing under the influence of COVID-19. Comput. Digit. Eng. 2022, 50, 2710–2714+2814. [Google Scholar]
  13. Cao, L.L.; Yang, H.C. Elegant and pure, and so on. Time-lapse SEQS model analysis under the action of multilayer networks with active nodes. J. TC 2024, 53, 277–283. [Google Scholar]
  14. Liu, F.F.; Chen, Y.Q.; Xia, H.X. Coupling Model of Competitive Message Transmission and Infectious Disease Spread on Complex Networks. Theory and Practice of System Engineering. pp. 1–20. Available online: http://kns.cnki.net/kcms/detail/11.2267.N.20240515.1026.015.html (accessed on 15 May 2024).
  15. Zhu, X.F.; Yang, J.H.; Jiang, X. Construction and simulation of symbiotic evolution model of government data with improved SIR model. Mod. Intell. 2020, 40, 122–131. [Google Scholar]
  16. Wang, Z.; Sun, S.W. Analysis of Viral Transmission Dynamics for the Improved SIR Model. Journal of Tianjin University of Technology. pp. 1–8. Available online: http://kns.cnki.net/kcms/detail/12.1374.N.20240429.1831.044.html (accessed on 15 May 2024).
  17. Wang, X.L.; Zhu, L.; Zhang, S.T. Time-varying airport network delayed transmission model based on susceptible-sick-susceptible networks. Sci. Technol. Eng. 2019, 19, 414–419. [Google Scholar]
  18. Dou, Z.L. Kinetic analysis of the Fractional Time Lag SEIR Infectious Disease Model. The Practice and Knowledge of Mathematics. pp. 1–9. Available online: http://kns.cnki.net/kcms/detail/11.2018.O1.20240408.1355.012.html (accessed on 15 May 2024).
  19. Zhu, F.Q.; Jia, X.Y.; Wei, L.; Li, F.X. A Method for Recognizing the Importance of Hypernetwork Nodes Based on Multi-Indicator Decision Matrix. Complex Systems and Complexity Science. pp. 1–9. Available online: http://kns.cnki.net/kcms/detail/37.1402.N.20240926.1155.008.html (accessed on 27 September 2024).
  20. Luo, M.Z.; Li, H.X. Risk coupling analysis of old industrial building construction and renovation based on N-K and SNA models. J. Railw. Sci. Eng. 2024, 1–10. [Google Scholar] [CrossRef]
  21. Li, S.P.; Dong, J.Y.; Liu, J. Link Symbol Prediction for Directed Symbolic Networks Incorporating Node Balance Index. Comput. Eng. 2024, 1–13. [Google Scholar] [CrossRef]
  22. Yang, B.; Liu, Y.; Yang, Z.L. Long-term forecasting of container throughput by introducing logistic Steele growth model. J. Chongqing Jiaotong Univ. 2020, 39, 45–50. [Google Scholar]
  23. Anderson, R.M.; May, R.M. Infectious Diseases of Humans Dynamics and Control; Oxford University Press: Oxford, UK, 1991. [Google Scholar]
  24. Liu, S.Q.; Ma, N.J. Study of peak and peak time in a heterogeneous infectious disease model. J. Shandong Univ. 2023, 58, 1–12. [Google Scholar]
  25. Zhang, J.; Jian, L.R. Study on the Evolutionary Characteristics of Travel Information Dissemination in the New Media Environment. Complex Systems and Complexity Science. pp. 1–8. Available online: http://kns.cnki.net/kcms/detail/37.1402.N.20240417.1623.002.html (accessed on 14 May 2024).
  26. Gu, H.S.; Jia, N.; Meng, Z.C.; Chen, P. Evolution and early warning mechanism based on SEIR-SPN. J. Intell. 2024, 43, 146–155. [Google Scholar]
Figure 1. Eastern China Route Network Schematic.
Aerospace 11 00878 g001
Figure 2. Weighted diagram of the network associated with the East China Segment.
Aerospace 11 00878 g002
Figure 3. Schematic of the SEIR Model.
Aerospace 11 00878 g003
Figure 4. GA diagram (a) Flowchart; (b) Crossover schematic; (c) Variation schematic.
Aerospace 11 00878 g004
Figure 5. Brief diagram of the overall flow of the simulation.
Aerospace 11 00878 g005
Figure 6. Schematic of node delay propagation.
Aerospace 11 00878 g006
Figure 7. GA seeking optimization cross-mutation process.
Aerospace 11 00878 g007
Figure 8. (a) Degree Centrality Node Identification; (b) GA Node Recognition.
Aerospace 11 00878 g008
Figure 9. Comparison of simulation results.
Aerospace 11 00878 g009
Figure 10. Degree-centered critical node infection simulation.
Aerospace 11 00878 g010
Figure 11. GA critical node infection simulation.
Aerospace 11 00878 g011
Table 1. Main influencing factors.
IndexMethodInfluence Degree
Airline saturation (AS)The ratio of the route flow to the maximum capacity of the route.The higher the route saturation, the greater the weight of the network edge, and the more likely it is to affect the corresponding two nodes.
Delay rate of flight (DF)The ratio of the delayed flights to the connecting airport and navigation points on that day.The higher the delay sorties ratio, the less the impact on the network, and the smaller the weight value.
Weather conditions (WC)Weather conditions on the route on the same day.The worse the meteorological conditions, the greater the weight of the network connection edge, and the more likely to cause the impact.
Military navigation
activities (MA)
The ratio of the time of military navigation affecting the operation of the route to the total time of normal operation.The more military aviation activities, the greater the potential conflict, and the greater the impact on the network delay.
Table 2. Scale and description.
Factor i Compared to Factor j Scale   S i j
Equal Importance1
Marginally Important3
More Important5
Very Important7
Table 3. Route network factor.
ConceptionSignificanceMathematical Expression
NodeAirport and navigation
station
Set of points V = { v 1 , v 2 , , v 104 }
SideDataSide set E = { e 1 , e 2 , , e 195 }
WeightThe passing probability of each route under the influencing factors W i j of the edges between points i and j
Table 4. Nodal recovery probability values for each navigation segment.
Section NumberNameDistanceRecovery Probability
1AKARA -LAMEN48.930150960.266843177
2KALBA -DYVOR155.21918650.513045005
3HSVOR -POMOK69.689110260.309360889
............
193JNVOR -WFVOR171.01390390.552342289
194LAGAL -LYGVOR126.20953880.440802791
195ATVIM -XZVOR34.064978510.238785375
Table 5. Node status fact sheet.
StateReason
SThe susceptible node refers to the node with no route network delay when the air traffic network is delayed.
EDelay node refers to the node that has experienced route network delay but does not have the transmission ability.
IDelayed transmission node refers to the node that has experienced route network delay and has transmission ability.
RThe recovery node is the node where the route network delay has dissipated.
Table 6. Alphabetical meaning summary.
SymbolSignificanceSymbolSignificance
SPredisposing nodesαProbability that a delayed node becomes a delayed propagation node
EAirport node (sleeper) β 1 Probability that a susceptible node becomes a delayed node
IRoute crossing point (infected person) β 2 Probability that a susceptible node becomes a delayed propagation node
RRecovery node γDelayed recovery probability of a node
NTotal number of nodestPacemaker
Table 7. Summary of node, state, and descriptions.
NodeStateDescribe
1S stateIt is associated with node 1 and has a large edge right, but the node is not yet infected and is in a normal state because the airport node has some capacity.
2E stateIt is currently latent because it is associated with node 3 and is a short distance away, but also has some capacity as an airport node.
3I stateFor node 3, firstly, there is some relationship with the network nodes connected to the edges, and secondly, node 3 starts with delays and is in the I-state due to saturated routes and a high number of aircraft, as well as the presence of influencing factors such as military aviation activities.
4E stateIn the case where only node 3 is considered to be infected, the node is in a normal state since only the associated node 5 is a normal node.
5R stateSince nodes 2 and 6 are still latent, the node is still in a normal state at this moment.
6E stateSince the network side rights are small, it is a navigation point but still latent at the moment.
7I stateDue to the close proximity to node 3 and being a navigation point itself without capacity, the node transformed from S-state to I-state immediately after the delay occurred.
Table 8. Optimize weighted values.
SEIRWeighted Sum
Random point731214515.6808
Degree centrality67827221.2927
GA 3535221224.9525
Disclaimer/Publisher’s Note: The statements, opinions and data contained in all publications are solely those of the individual author(s) and contributor(s) and not of MDPI and/or the editor(s). MDPI and/or the editor(s) disclaim responsibility for any injury to people or property resulting from any ideas, methods, instructions or products referred to in the content.

