Article

U-Space Contingency Management Based on Enhanced Mission Description

Department of Telecommunications and Systems Engineering, University Autonomous of Barcelona, 08202 Barcelona, Spain
*
Author to whom correspondence should be addressed.
Aerospace 2024, 11(11), 876; https://doi.org/10.3390/aerospace11110876
Submission received: 18 September 2024 / Revised: 17 October 2024 / Accepted: 19 October 2024 / Published: 24 October 2024

Abstract

:
Loss of communication, low battery, or bad weather conditions (like high-speed wind) are currently managed by performing a return to launch (RTL) point maneuver. However, the execution of this procedure can pose a safety threat since it has not been considered within the mission planning process. This work proposes an advanced management of contingency events based on the integration of a new U-space service that enhances mission description. The proposed new service, deeply linked to demand capacity balance and strategic deconfliction services, assigns alternative safe landing spots by analyzing the planned mission. Two potential solutions are characterized (distinguished primarily by the number of contingency vertiports assigned): contingency management based on the assignment of a single alternative vertiport to each mission (static) or the allocation of a set of different contingency vertiports that are valid during certain time intervals. It is proven that this enhanced mission planning could ensure that U-space volumes operate in an ultra-safe system conditions while facing these unforeseen events, highlighting its importance in high-risk scenarios like urban air mobility deployments.

1. Introduction

We stand at a thrilling point in the history of aviation that promises to modify the appearance of our sky. Unmanned aerial vehicles (UAVs) are on the rise, pressing to have access to European airspace to bring new levels of services, transporting people and goods all around the world. An industry like air traffic management (ATM), in which safety culture is its raison d’être, will have to accommodate new kinds of traffic, performance levels, and missions while keeping their safety standards. It should also be noted that any incident involving these newcomers could negatively impact their social acceptance, blocking their commercial application in certain verticals. Undoubtedly, ordinary operations will need to manage unplanned events, such as strong winds or communication losses, which can significantly impact regular activities. How will these unforeseen circumstances be managed safely? How can this new class of aircraft be introduced safely?
To accommodate these new players and create a safe airspace, the aviation industry has worked on the development of an unmanned air management system: UTM (unmanned traffic management)/U-space (in Europe), or urban air mobility (UAM) when it is extrapolated to urban airspace and the system predicts manned aircraft using UTM services.
U-space is a service-oriented concept that provides air traffic management to UAVs for their safe integration into airspace. U-space services aim to promote the development of smart, automated, interoperable, and sustainable traffic management solutions, and they will be a key enabler for achieving this high level of integration [1].
This painstaking work has produced a new traffic management framework, new legislation, and the emergence of new figures within the industry worldwide. However, there are still some fundamental shortcomings that need to be addressed. Several key capabilities are still lacking, with one of the most pressing being the development of standardized and predictable processes for managing off-nominal events or threats specifically tailored to U-space service procedures.
In U-space, mitigation or risk mitigation corresponds to the steps taken to control or prevent a hazard from causing harm and to reduce risk down to a tolerable or acceptable level [2]. This requires a contingency plan that describes the specific measures that a U-space service provider and/or drone operator will have to put in place to prepare for adverse contingencies that might affect future operations (see Figure 1).
Nowadays, UAVs trigger an RTL (return to launch) maneuver when they face a threat like a loss of communication or navigation, bad weather conditions (high-speed wind), or low battery state. RTL mode navigates the copter from its current position to hover above the home position. It should be noted that in the case of remotely piloted missions, the operator will not have any control over the aircraft, as the trajectory to reach the launching point will be automatically executed, flying in a straight line from the threat trigger point to the starting point of the mission. On the way to the home position, this new trajectory has not been processed by any safety service (like a strategic conflict-resolution service) and, consequently, could lead to a loss of separation from other aircraft executing their planned missions. The airspace safety will rely on tactical management by the other airspace users.
This work proposes the advanced management of contingency trajectories through the integration of a new strategic U-space service that considers surrounding traffic during contingencies to guide aircraft to a safe vertiport. It analyzes planned missions and their origin–destination points to assign alternative vertiports available during threat management. As demonstrated, this new service significantly increases the safety level of airspace volumes, even in the face of unforeseen contingency events.

1.1. Related Works

NASA [3] and Europe (CORUS-XUAM [4]) have already highlighted the need for handling contingency management processes in a structured way, envisioning an enhancement of the level of automation of their management. With this aim, improved reliability and survivability of mission-critical systems are driving the development of health monitoring and automated contingency management (ACM) systems that, based on onboard safety monitor systems, detect potential off-nominal situations and trigger contingency procedures. Once the contingency is triggered, state-of-the-art (SoA) can be divided into two approaches, pre-flight and in-flight management, depending on whether the mission to be executed has been designed before the flight or while flying.
In pre-flight management, the UPC team [5,6] proposes the development of a contingency manager that develops strategic contingency plans for each section of the mission (legs) according to the particular threat that the aircraft is facing. Other works have focused on the emergency flight planning of UAVs to a safe landing zone during a contingency situation by using Voronoi diagrams and selecting the most suitable path with dynamic programming [7], avoiding nonflying zones and weather conditions [8]. However, none of these approaches consider other planned traffic.
Using the tactical approach, flight management relies on the use of onboard system capabilities to manage the threat. Atkins [9] and Boskovic [10] addressed the development of search-based trajectory optimization to identify feasible emergency landing paths in real time. This search of potential trajectories can be based on computer vision techniques [11,12] and advanced machine learning techniques [13]. Other in-flight approaches are based on a dynamic reconfiguration of the airspace [14] of predefined flight rules to deal with unforeseen traffic [15].

1.2. Contribution

This work proposes the definition of mission-specific contingency trajectories as part of the strategic mission planning process. It is based on the integration of a new U-space service that considers all the planned mission details to preassign a specific vertiport within the network that will not be occupied by any other UAV, according to mission details. The main advantage of the proposed approach, compared to the state-of-the-art, is that it takes planned traffic into account, pre-determining contingency measures by considering the surrounding traffic that the mission under threat may encounter. Furthermore, it does not require additional infrastructure (such as dedicated emergency/contingency vertiports), nor does it increase the requirements for onboard systems (as tactical resolution-based solutions do).
This work has been divided into the following sections. First, the new U-space contingency service based on an enriched mission description during the strategic phase will be introduced, specifying its interdependencies with the other U-space services. Next, a U-space volume based on a corridor airspace structure will be designed to test the performance of the new proposed solution. Based on this scenario, it will be characterized at what traffic density a contingency event could result in a potential loss of separation with another aircraft, characterizing its dependency on airspace structure and traffic-demand patterns.
Once the safety levels of the scenario have been evaluated for different demand levels, the impact on safety of the proposed contingency service will be studied.

2. Materials and Methods

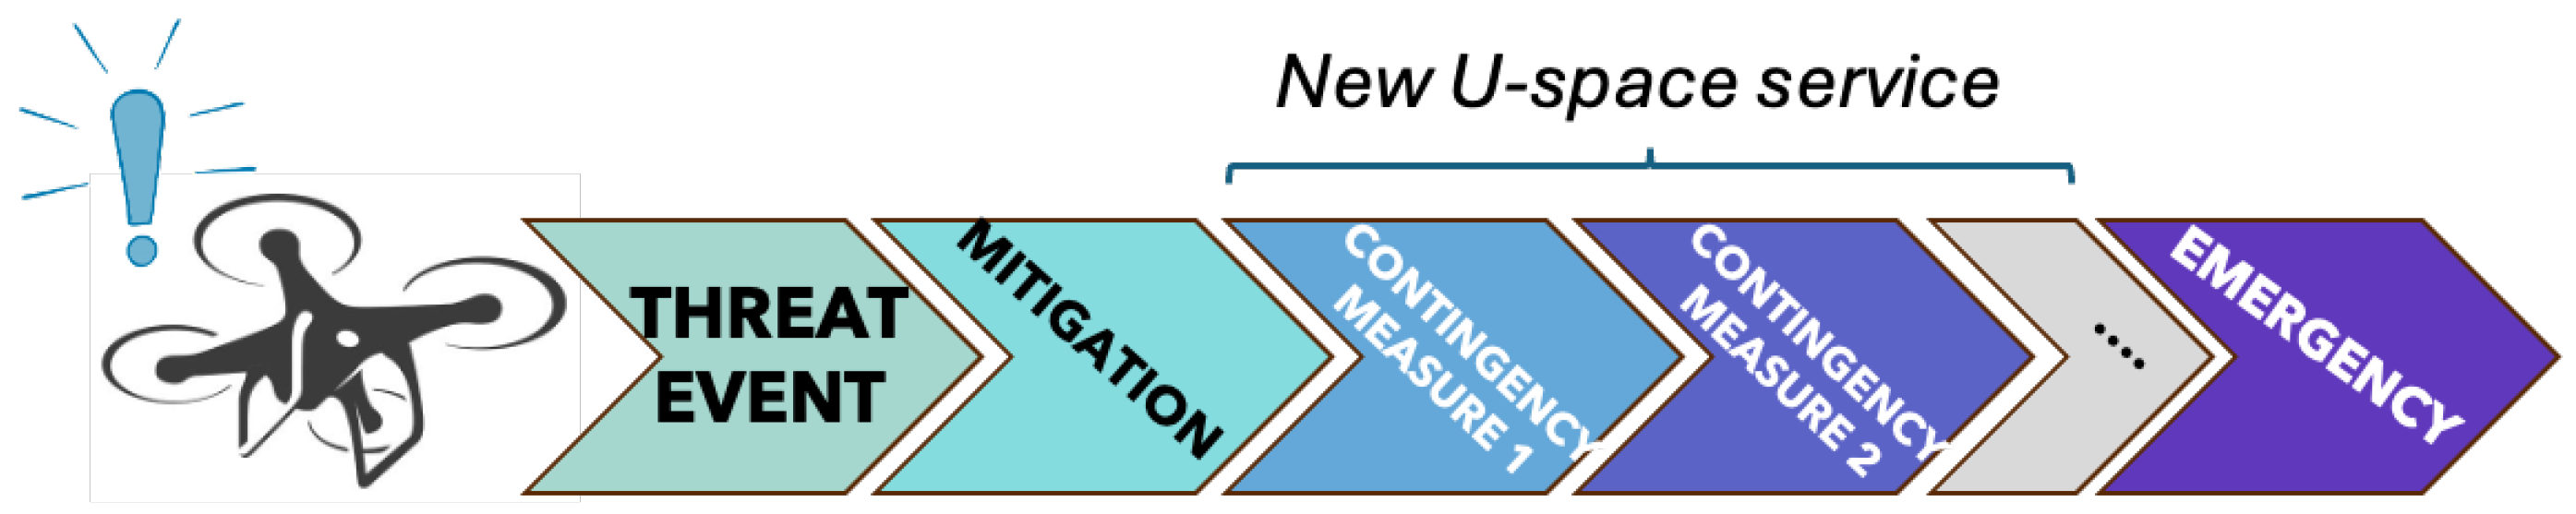
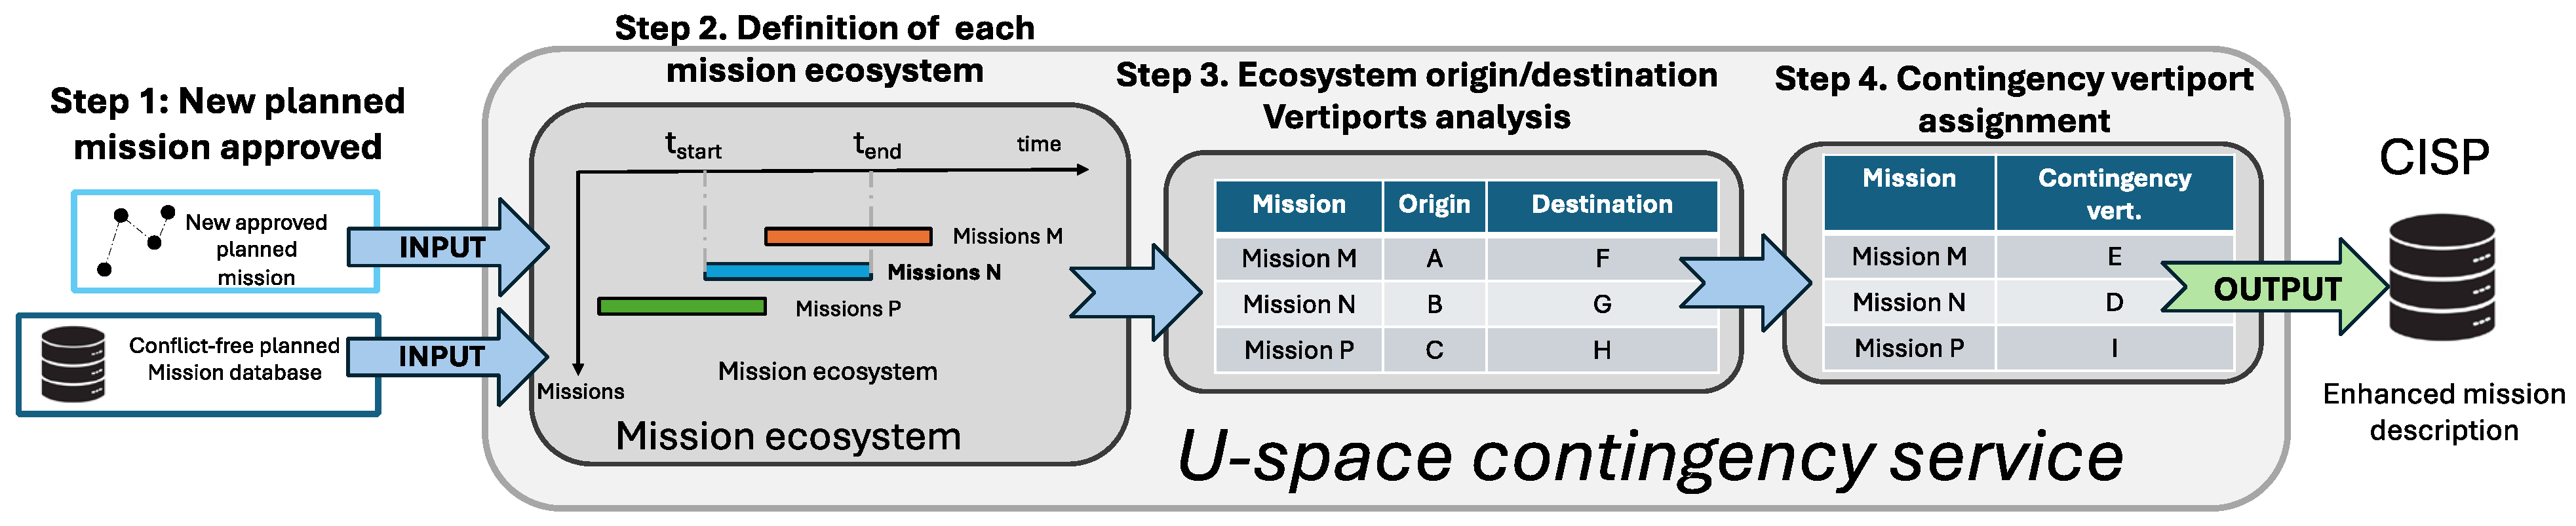
2.1. U-Space Contingency Service

The proposed new U-space contingency service will be a central part of the strategic planning process, together with the deconfliction service, as shown in Figure 2. As can be observed in the diagram, first, the operator gathers strategic context using the geo-awareness service that will inform the restrictions of the very-low-level (VLL) airspace where the mission is planned. Next, the operator will proceed to specify the details of the mission during the mission preparation (flight plan). The trajectories could be specified as a set of volumes or 4D mission definitions composed of a set of latitude, longitude, altitude, and time specifications. Note that in the 4D description, linked to each point there is an uncertainty volume due to the tracking uncertainty, communication delay, etc. The specified mission will be the input to the strategic conflict-resolution service that will verify if there is any other mission planning to use the same airspace at the same time (considering the uncertainty volume of the mission that will fix the separation minima values). If the strategic conflict-resolution service does not find any interdependency with other missions or can be solved by shifting the take-off time or some points of the trajectory, the mission will be accepted [16].
Once the mission is accepted without any potential loss of separation from other aircraft, the new contingency service acts. As has already been mentioned, current RTL maneuvers return to the initial take-off point, which can compromise VLL airspace safety since this new trajectory has not been validated against planned ones. It is highly probable that an RTL may cause a conflict if there is high-density traffic. To avoid this downstream effect, the continency U-space service will assign an RTL vertiport to each mission, different from the departure one, called a contingency vertiport. Figure 2b illustrates the procedure followed by the service in the contingency-vertiport assignment process. Once a mission (called M1 in this example) is approved by the strategic conflict-resolution service, the contingency service explores the missions that will be active while M1 is in execution. This set of active missions will form an ecosystem. The ecosystem is obtained by interacting with the common information system provider (CISP), first introduced by EASA in Opinion No 01/2020, that saves and coordinates all missions planned in a given U-space volume by any potential entity providing planning and execution services (U-space service providers, USSPs). Interacting with the CISP, the contingency service will collect the ecosystem of each new mission approved (getting a list of all the missions that will be active in the figure-specific example [MX, MY, ..., MZ]). Note that the starting point of the ecosystem is a set of missions free of conflict. The main aim of the contingency services is to enhance the safety of the system, assigning a specific and different contingency vertiport to each member of the ecosystem. This procedure is expected to significantly reduce the probability of conflict if any of the ecosystem missions require an RTL, even if the contingency affects two aircraft at the same time, as the contingency vertiports assigned to the members of the ecosystem are different. In that way, the selected contingency vertiport assigner algorithm enhances the mission description of each flight. Every time a new mission is approved by the strategic conflict-resolution service, this process is repeated, resulting in a new list of enhanced mission descriptions [M1, MX, MY, … MZ-assigned contingency vertiports] that is provided to the CISP and the operators/U-space service providers (USSP).
Regarding the algorithm that assigns a contingency vertiport to each member of the ecosystem, two different alternatives have been explored:
  • A static vertiport assigner, which provides a single and fixed contingency vertiport to each mission of the ecosystem during the execution of the flight. This vertiport will be selected from the set of vertiports that will be flown over by the aircraft during the execution of its planned mission. It is also verified that the ecosystem members do not share a contingency vertiport.
  • A dynamic vertiport assigner, which provides a time-evolving contingency vertiport to each mission of the ecosystem that is valid during a time interval. To carry out this dynamic assignment, each aircraft is assigned the closest vertiport to its current position that will not be used for a takeoff or landing by a scheduled mission. In this way, the assigned contingency vertiport evolves along with the mission. Once again, it is verified that the ecosystem members do not share any contingency vertiports.
A more specific description of each methodology, together with its safety-impact assessment, will be provided in the next sections.

2.2. Simulation Framework

In this work, a U-spacer service provider (USSP) platform, called DronAs [17,18], will be used. This platform offers a set of strategic and tactical U-space services (strategic and tactical conflict resolution, demand-capacity balance, conformance monitoring, or traffic information, among others) and simulation capabilities, particularly for the analysis of demand-capacity balance traffic demand. DronAs also has a set of tools for designing the airspace structure [19].
To create a scenario, traffic is randomly generated for a given simulation time (one hour in this specific case). Graph theory allows the definition of an airspace corridor-based structure, shown in Figure 3, that defines 4DT trajectories departing from one of the vertiports and delivering to a parcel at one of the established delivery points. The probability of starting or ending a mission at a given vertiport can be adjusted. The mission’s requested take-off times are randomly selected within the fixed simulation time interval.
Once a traffic density is selected and the airspace structure designed, the traffic generator will produce the specified number of missions according to the defined airspace structure and spatial probability parametrization. Note that this traffic will be the input to the strategic conflict-resolution service that will ensure a conflict-free scenario and avoid any potential loss of separation (considering the uncertainty volumes/separation minima values). Once the free-of-conflict traffic has been generated, a contingency procedure probability value (P, whose value is parametrized) is defined to set the number of planned missions that will trigger an RTL procedure due to a contingency. It will be studied if the execution of the RTL procedure/trajectory will produce a conflict (loss of separation) with other missions.
To ensure the statistical significance of each simulation, 40 randomly generated scenarios are created for each parameter set, statistically characterizing each relevant variable. The separation minima values, linked to the position uncertainty volumes, have been set to 30 m horizontally and 5 m vertically [20,21]. Note also that these values also provide the pilot with reasonable time to react if tactical management of the mission is required.

2.3. Scenario Definition

The scenario used for this analysis, and the contingency service validation process, will be inspired by a logistic scenario. The flights are channeled through an airspace structure designed explicitly for serving last-mile delivery missions, where multirotors are continuously executing deliveries in the area and using the vertiports for the turnaround. This structure consists of a set of nodes (N) representing the vertiports, linked by two different altitude and direction corridors, as shown in Figure 3. The distance between vertiports (graph nodes), d, is constant, and they are connected by a straight line. In the cross-section view of the airspace structure (Figure 3a), it can be observed that UAVs first reach a reference node at the altitude of the corridors. From there, they follow a level flight path to the corridor’s entry point. The airspace structure is articulated around two air corridors, one extending to the west and the other to the east. These corridors run parallel, each at a different altitude within the available envelope for safety. The west corridor operates at 30 m altitude, while the east corridor operates at 50 m altitude. The use of different altitudes ensures the safe crossing of corridors when flying to/from vertiports and delivery points. Additionally, each corridor has a horizontal offset (lat_off) designed to increase safety during any vertical climbs occurring within the corridors.
Furthermore, the parameter dentry defines the slope of the flight path that UAVs follow to reach the reference point at the corridor’s entry. A smoother slope increases the distance between aircraft heading toward the corridor entry from the vertiport and those performing an RTL, descending vertically at the same point

3. Results

3.1. Base Scenario Characterization

Six different demand patterns are studied to analyze the impact on scenario safety of a contingency event. In each of these scenarios, two parameters are modified:
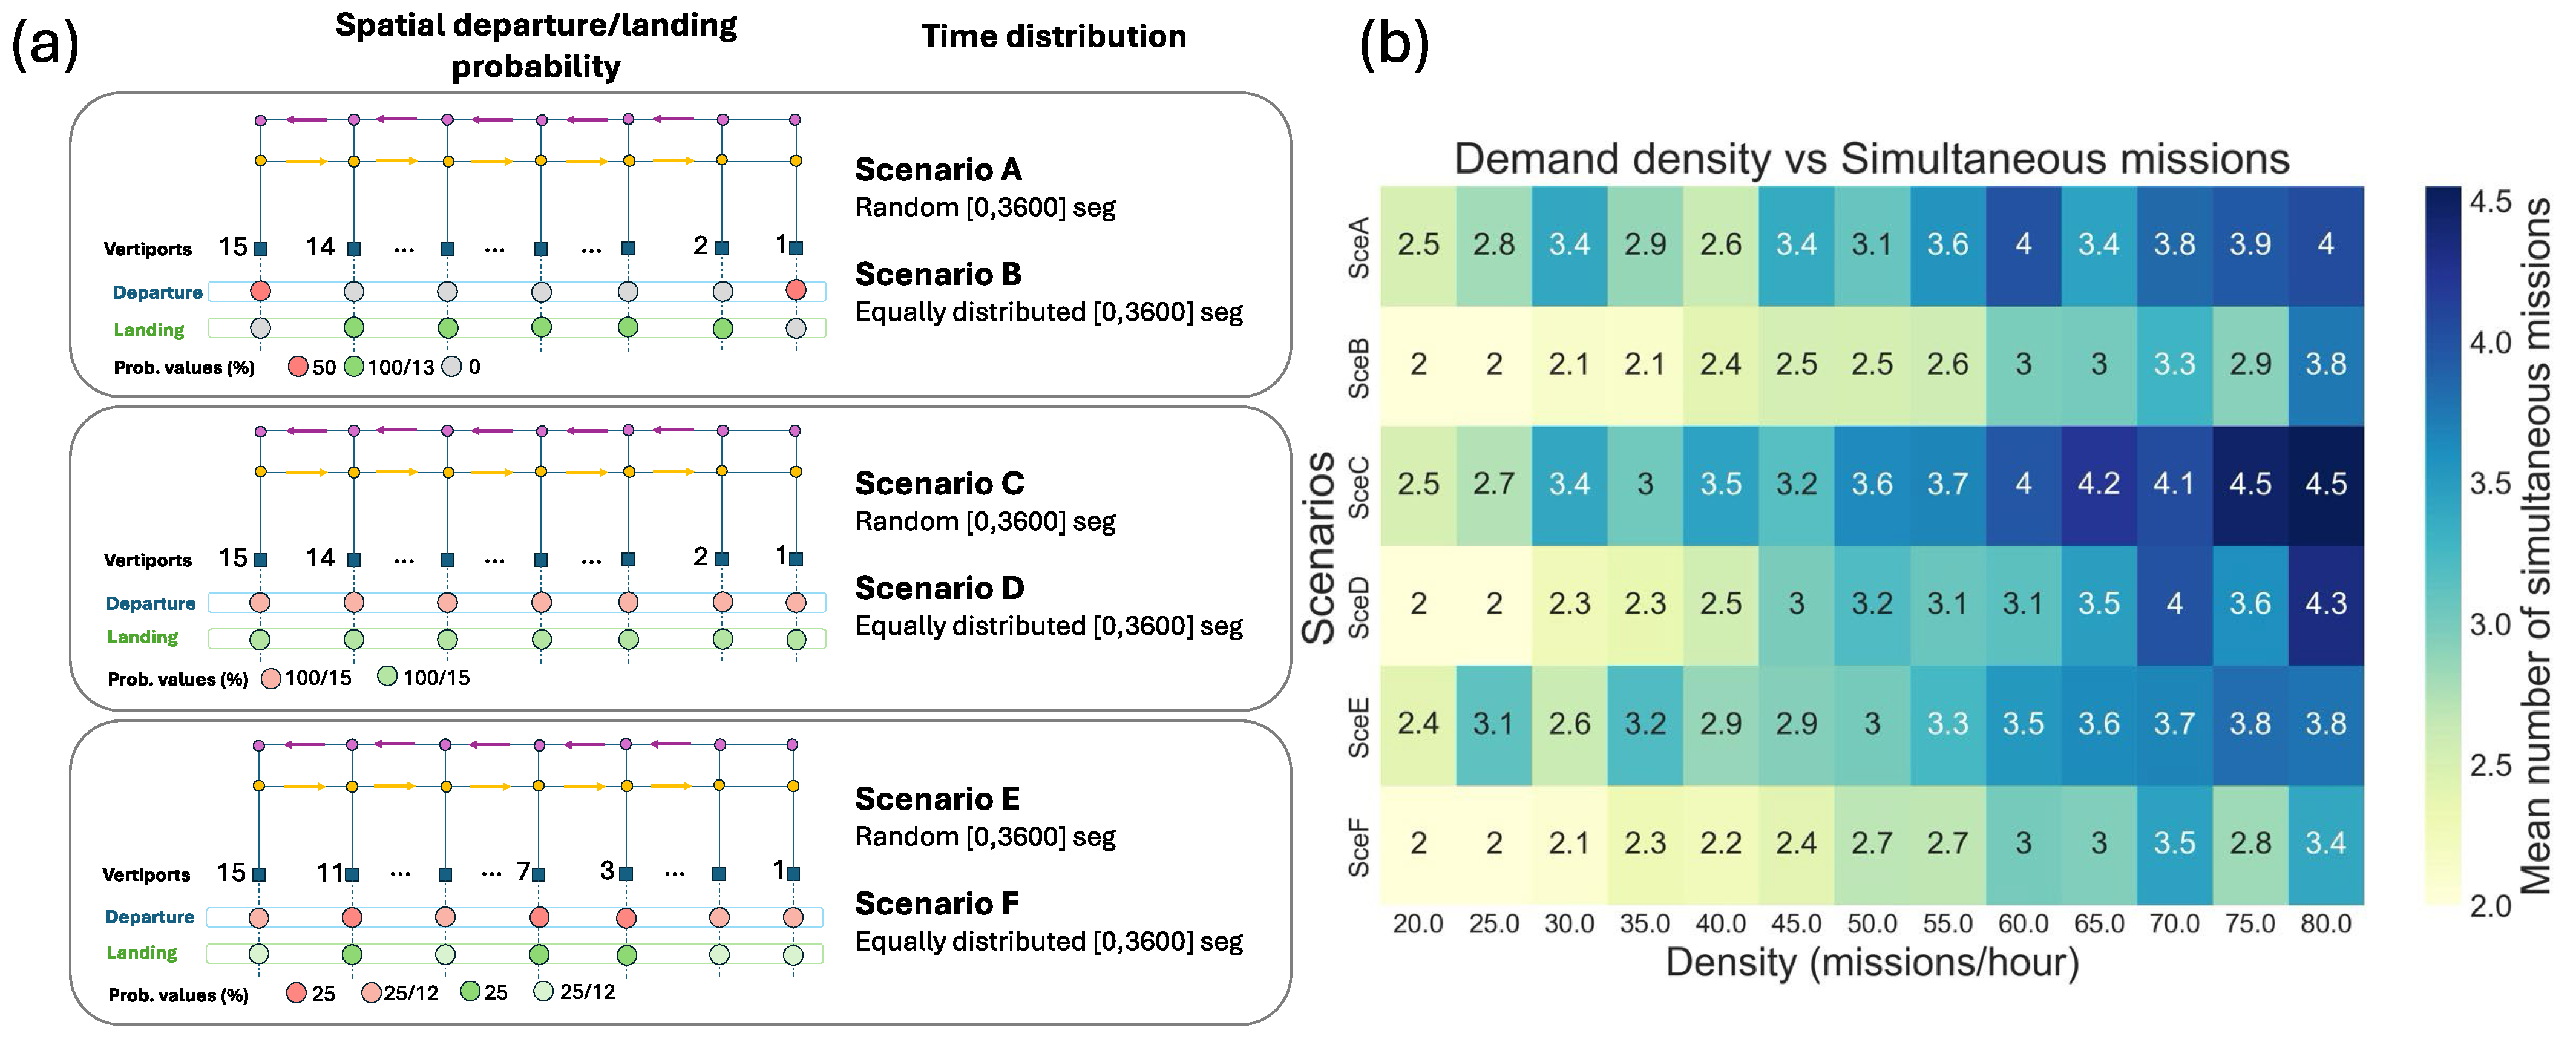
  • Vertiport departure/landing probability. The schematic representation of the spatial departure/landing probability is shown in Figure 4a). The spatial traffic pattern, together with traffic density, will fix the number of flights that will begin and/or end the mission in each node of the graph (that models the airspace structure). As can be observed, three different spatial base scenarios are proposed:
    Scenario A and B: the probability of starting/ending a mission is equal in each node of the graph.
    Scenario C and D: the nodes located at the ends of the graph feed the traffic network.
    Scenario E and F: 75% of the missions generated in these scenarios will start/end in central nodes (nodes 3, 7, and 11).
  • Mission start-time distribution. The starting time of the mission can be randomly defined during the scenario duration or can be forced to be equally distributed during the entire runtime of the scenario.
The mean number of simultaneous missions (the average number of flights coexisting with a mission in progress) obtained in each scenario is depicted in Figure 4b). In each scenario, different demand densities (mission/hour) are generated, and the number of missions flying at the same time (concurrent missions) is characterized. The number of simultaneous missions is represented by a color scale shown on the right side of the figure. This parameter is crucial to the analysis, as a higher number of aircraft sharing the airspace during mission execution increases the risk of conflict when a contingency procedure is triggered. As shown in the figure, the greatest number of simultaneous missions will be obtained when the probability of starting/ending the mission is higher at the end nodes of the graph and the mission start time is randomly fixed (4.5 simultaneous missions are obtained in SceC when the density is equal to 80 missions/h as can be observed in Figure 4b). Higher levels of simultaneous missions are observed across all three spatial probability distributions when the mission start time is set randomly. The number of simultaneous flights is similar when the high probability nodes are evenly distributed (scenarios A and B) or in the central positions (scenarios E and F). The largest difference in the number of simultaneous missions, approximately one (1.1), occurs between scenarios C and F.
Note that the generated and analyzed traffic is free of conflict. It corresponds to the output of the strategic conflict-resolution service. In this specific work, the strategic conflict-resolution service modifies the take-off time of each mission, ensuring that the planned mission does not have any spatiotemporal interdependency with other planned flights (more details of the mitigation process can be found in work [19]). Therefore, these missions represent the approved traffic stored by the CISP (see Figure 2a).
To verify the hypothesis that scenarios with the highest simultaneous missions will have more conflicts in an RTL procedure, 40 scenarios are generated (for each specific density), in which a set of contingency events is triggered in conflict-free traffic. The probability that an aircraft will have a contingency is fixed at 5%, and the aircraft is selected randomly. Once the contingency occurs, the aircraft executes the described RTL trajectory to its origin vertiport, and it is verified if there is any loss of separation from other aircraft in progress. Note that a lower contingency probability is expected due to a detailed characterization of the environment (weather, communications, etc.) and the aircraft. However, this value has been set (and later increased in other simulated scenarios) to stress the performance of the contingency service.
The results of this analysis for the six described scenarios are represented in Figure 5. The probability of conflict per aircraft is calculated by dividing the mean value of conflicts obtained in the 40 scenarios by the traffic density. As can be observed, scenarios C and D (the ones with a higher number of simultaneous missions) present a higher level of conflict probability (close to a 0.020 probability at 80 missions/h). Also, note that these two scenarios have the end nodes of the airspace structure as the feeders of the network. Consequently, when the RTL is triggered, the missions in execution must return to the “origin vertiport,” creating the potential for conflict either during the return trajectory or even during descent to ground level. Since there are only two vertiports where the aircraft departs, the probability of conflict is higher. The other scenarios present a similar level of conflict probability, close to 0.010 (half the value of the scenario showing hotspots at the ends of the airspace structure).
Note that the probability of conflict per aircraft will be our characterization of the target level of safety (TLS) for the described scenarios managed with the described U-space services. The goal of the TLS is to set an upper bound on the aspired level of risk. This goal has been used in manned aviation for more than 40 years, and several statistics have been performed by organizations [22] like the International Civil Aviation Organization (ICAO) or EASA [23]. The notional values for the TLS of different types of systems are usually based on statistics. Systems in general can be categorized into three different types according to their accident rates [24]:
  • Dangerous systems: the risk of an accident is greater than one accident per 1000 operations (i.e., 1 × 10⁻³).
  • Regulated systems: the risk of an accident is between 1 × 10⁻³ and 1 × 10⁻⁵ per operation.
  • Ultra-safe systems: the risk of an accident is set between 1 × 10⁻⁵ and 1 × 10⁻⁷ per operation. Examples of these systems are the nuclear industry or ATM.
As can be observed, U-space deployments can be classified as dangerous systems while executing actual RTL contingency procedures, particularly when high-density traffic is reached. Only scenarios B and F present ultra-safe system (USS) safety performance for densities below 30 missions/hour. It can be observed how a planning service that will sequentially distribute time-departed times (right-side graphs in Figure 5) will slightly reduce the contingency-conflict probability. Therefore, It is clear that a contingency-enhanced procedure needs to be deployed to keep the system safe.
To design the contingency service, it is necessary to differentiate how the conflicts are generated during the contingency procedure. Figure 6 analyzes whether the conflict generated during the RTL occurred during the descent maneuver to the contingency vertiport (as represented in Figure 6b, where the orange line represents the trajectory of the UAV performing the contingency procedure), or in the portion of the trajectory that guides the aircraft to the vertiport where the aircraft will land (as shown in Figure 6c).
As can be observed, the scenarios with high-density departure/landing nodes limited to a small number of vertiports, like scenarios C and E, present a high percentage of conflict during the descent maneuver to the vertiport (close to 80% of the generated conflicts). This fact suggests that the assignment of a contingency vertiport different from the departure point could improve the safety of the system. In the scenarios where the probability of starting in any vertiport is equally distributed, the conflict occurs not only during the descent phase but also when interacting with the aircraft flying inside the corridors (for the specific configuration of SceA, 36% are produced during the landing procedure and 64% while flying to the assigned landing point). In the next section, two different strategic contingency-management services are presented to increase the safety level of the U-space system.

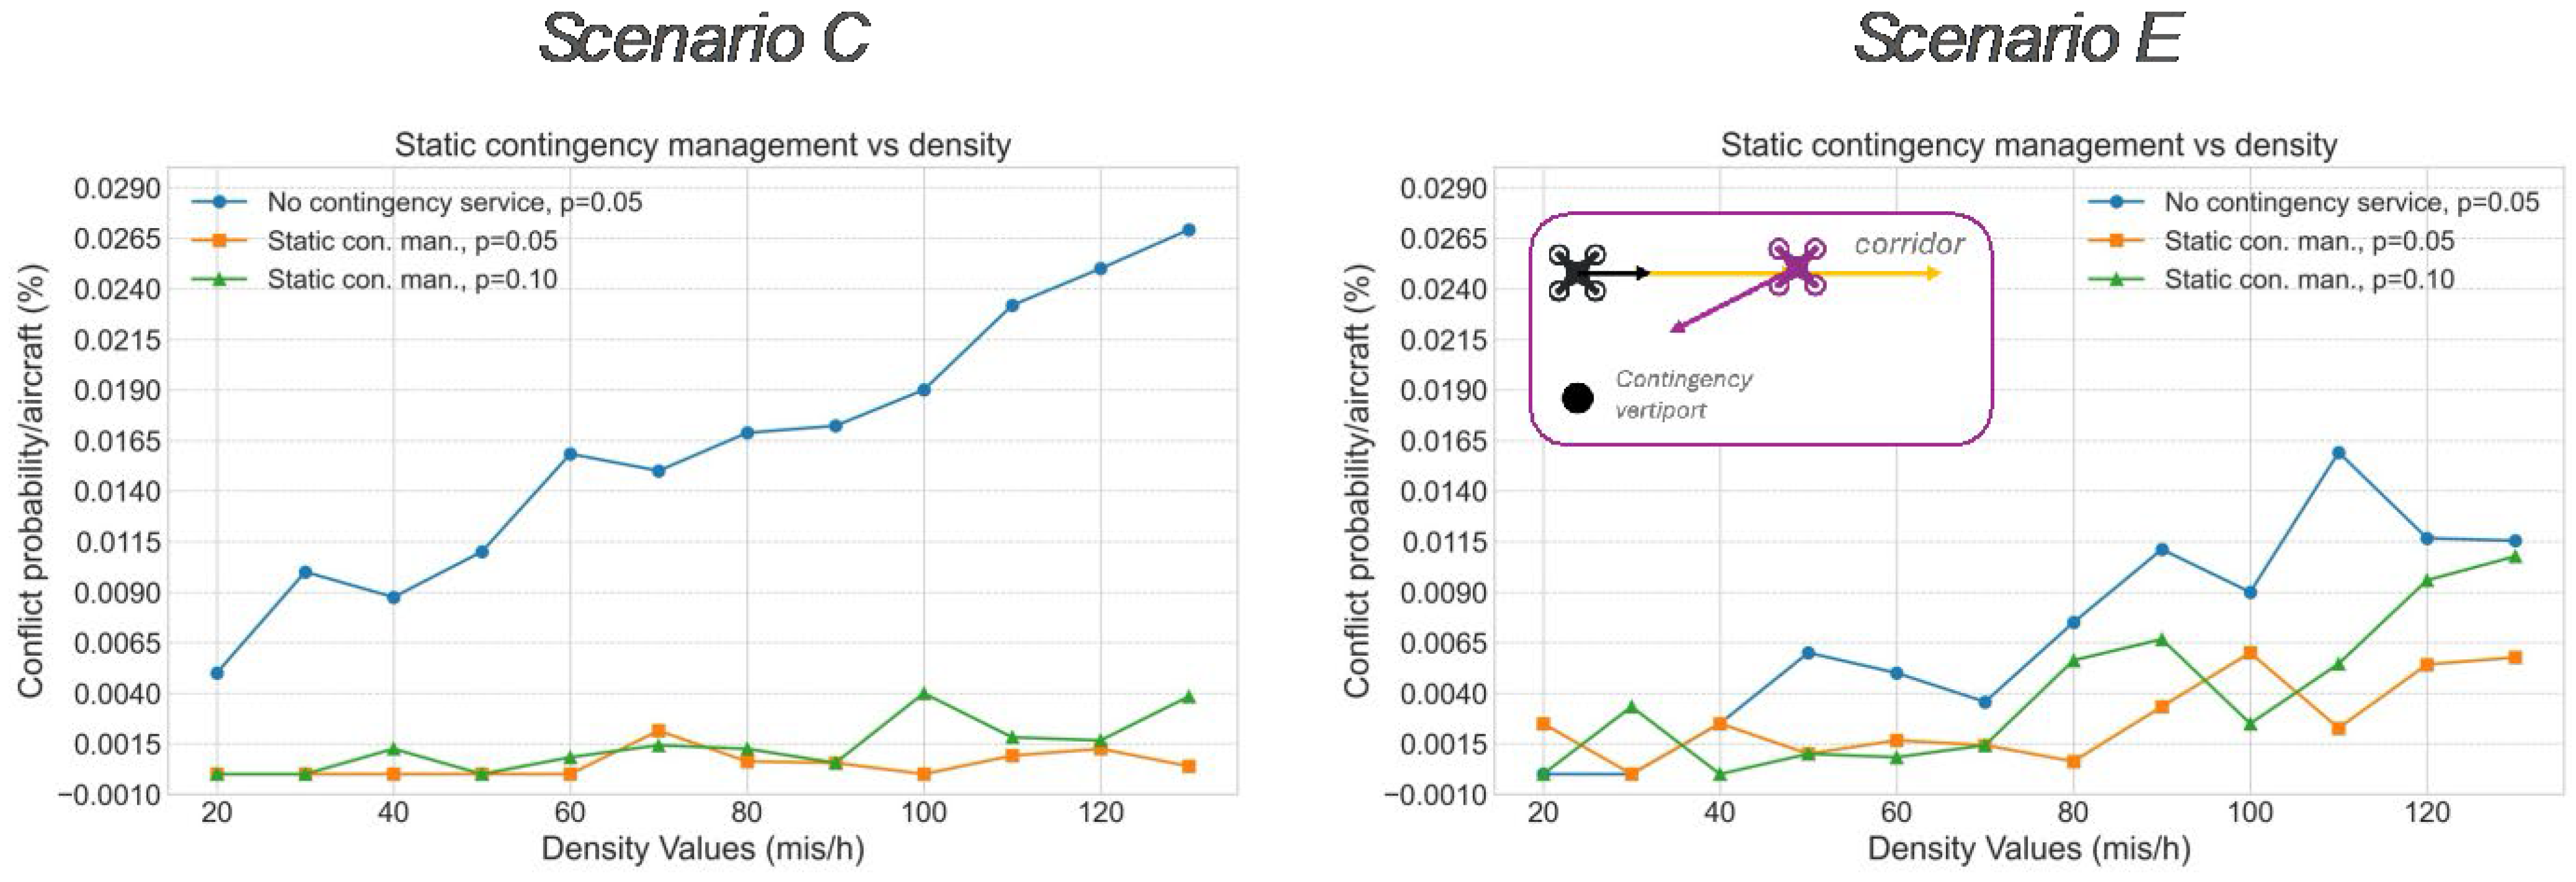
3.2. Static Contingency Management

To prevent an RTL procedure from interacting with an aircraft initializing its mission (during the first vertical ascending phase), a new U-space contingency service is proposed. This service will assign a new contingency vertiport different from its departure point. The following procedure is established: each time that a new mission is approved (by the strategic conflict-resolution service) and is uploaded as a planned mission in the CISP, the mission ecosystem is obtained (as previously explained). The origin and destination vertiports of the ecosystem missions are then acquired (step 3 in Figure 7). These vertiports will be blocked for the contingency procedure, assigning an intermediate vertiport along the flight path of each specific mission (step 4). In this way, each mission within the ecosystem will have a different contingency vertiport that is not going to be used for a planned departure or landing. A different vertiport will be assigned to each aircraft to avoid conflicts if the contingency threat arises for more than one aircraft in the ecosystem. The enhanced description of the mission, including the newly assigned contingency vertiport, is then uploaded again to the CISP to avoid the reassignment of a contingency vertiport already linked to a planned mission. This new service is expected to reduce the number of contingency conflicts and, therefore, increase the safety levels of the airspace, as it avoids any interaction during the descent phase to the vertiport. This was one of the main sources of conflict during RTL management (see Figure 6). This contingency U-space service is referred to as static because the assigned contingency vertiport remains the same throughout the entire mission.
To verify this hypothesis, the static contingency service is integrated into the planning process of each new mission, and its impact in the presented baseline scenarios is characterized. Figure 8 shows the conflict probability per aircraft in scenarios C and E (scenario A is not analyzed, as it presented a similar level of safety to scenario E) when contingency probabilities of 0.05 and 0.10 are fixed and the density of traffic is increased.
As can be observed in the scenario C figure, the integration of the static contingency service prevents any collateral conflict caused by any contingency in traffic density values below 60 missions/hour (with a contingency probability of 0.05). It is also noteworthy that the conflict probability remains below a 0.0040 threshold, even at higher densities (130 missions/hour). The static contingency management reduces conflict probability by a factor of approximately 6.6. These results remain valid even when the contingency probability in the scenario is increased to 0.10.
However, the new service does not significantly increase the safety levels of scenario E, which shows high traffic density in the central nodes of the airspace network. To verify the reasons behind this behavior, Figure 9 shows the probability of conflict (color map) as a function of the number of simultaneous missions and duration (seconds) of the missions. Using Figure 9, it is possible to estimate in which scenario the aircraft will have more options when assigning a contingency vertiport. The number of such vertiports depends on the number of simultaneous missions and the mission duration, as the assigned vertiports must be overflown during the execution of the planned mission. Shorter missions mean fewer contingency-vertiport alternatives.
After analyzing the ecosystems of the two scenarios, it is found that the length (mission duration) of the missions is shorter in scenario E. As a consequence, when the density increases and the number of missions involved in an ecosystem is higher, it becomes impossible to satisfy the condition that each mission in the ecosystem has assigned a different contingency vertiport along its trajectory. Additionally, as shown in the inset of Figure 8, the primary structure of the conflicts found while using the static contingency service is highlighted. The problem arises when the aircraft in contingency has an assigned contingency vertiport that it has already passed along its flight path. In such cases, when the aircraft begins the maneuver to reach the vertiport, it must change direction (opposite to the corridor flow) and approach the vertiport along a straight-line trajectory. This results in the aircraft conflicting with others following their planned trajectories within the corridor. Given that the number of potential alternative contingency vertiports is lower in scenario E, this condition of changing direction occurs more frequently, increasing the number of conflicts generated downstream, as shown in the figure. To address this problem, two solutions have been found: trajectory-based contingency management (not limited to the assignment of a contingency vertiport) or the integration of the dynamic contingency-management service described in the next section.

3.3. Dynamic Contingency Management

The main difference between the dynamic and static contingency services is that the assigned contingency vertiport changes throughout the execution of the planned trajectory. Once the ecosystem of each mission is defined, the next set of verifications is carried out (see Figure 10):
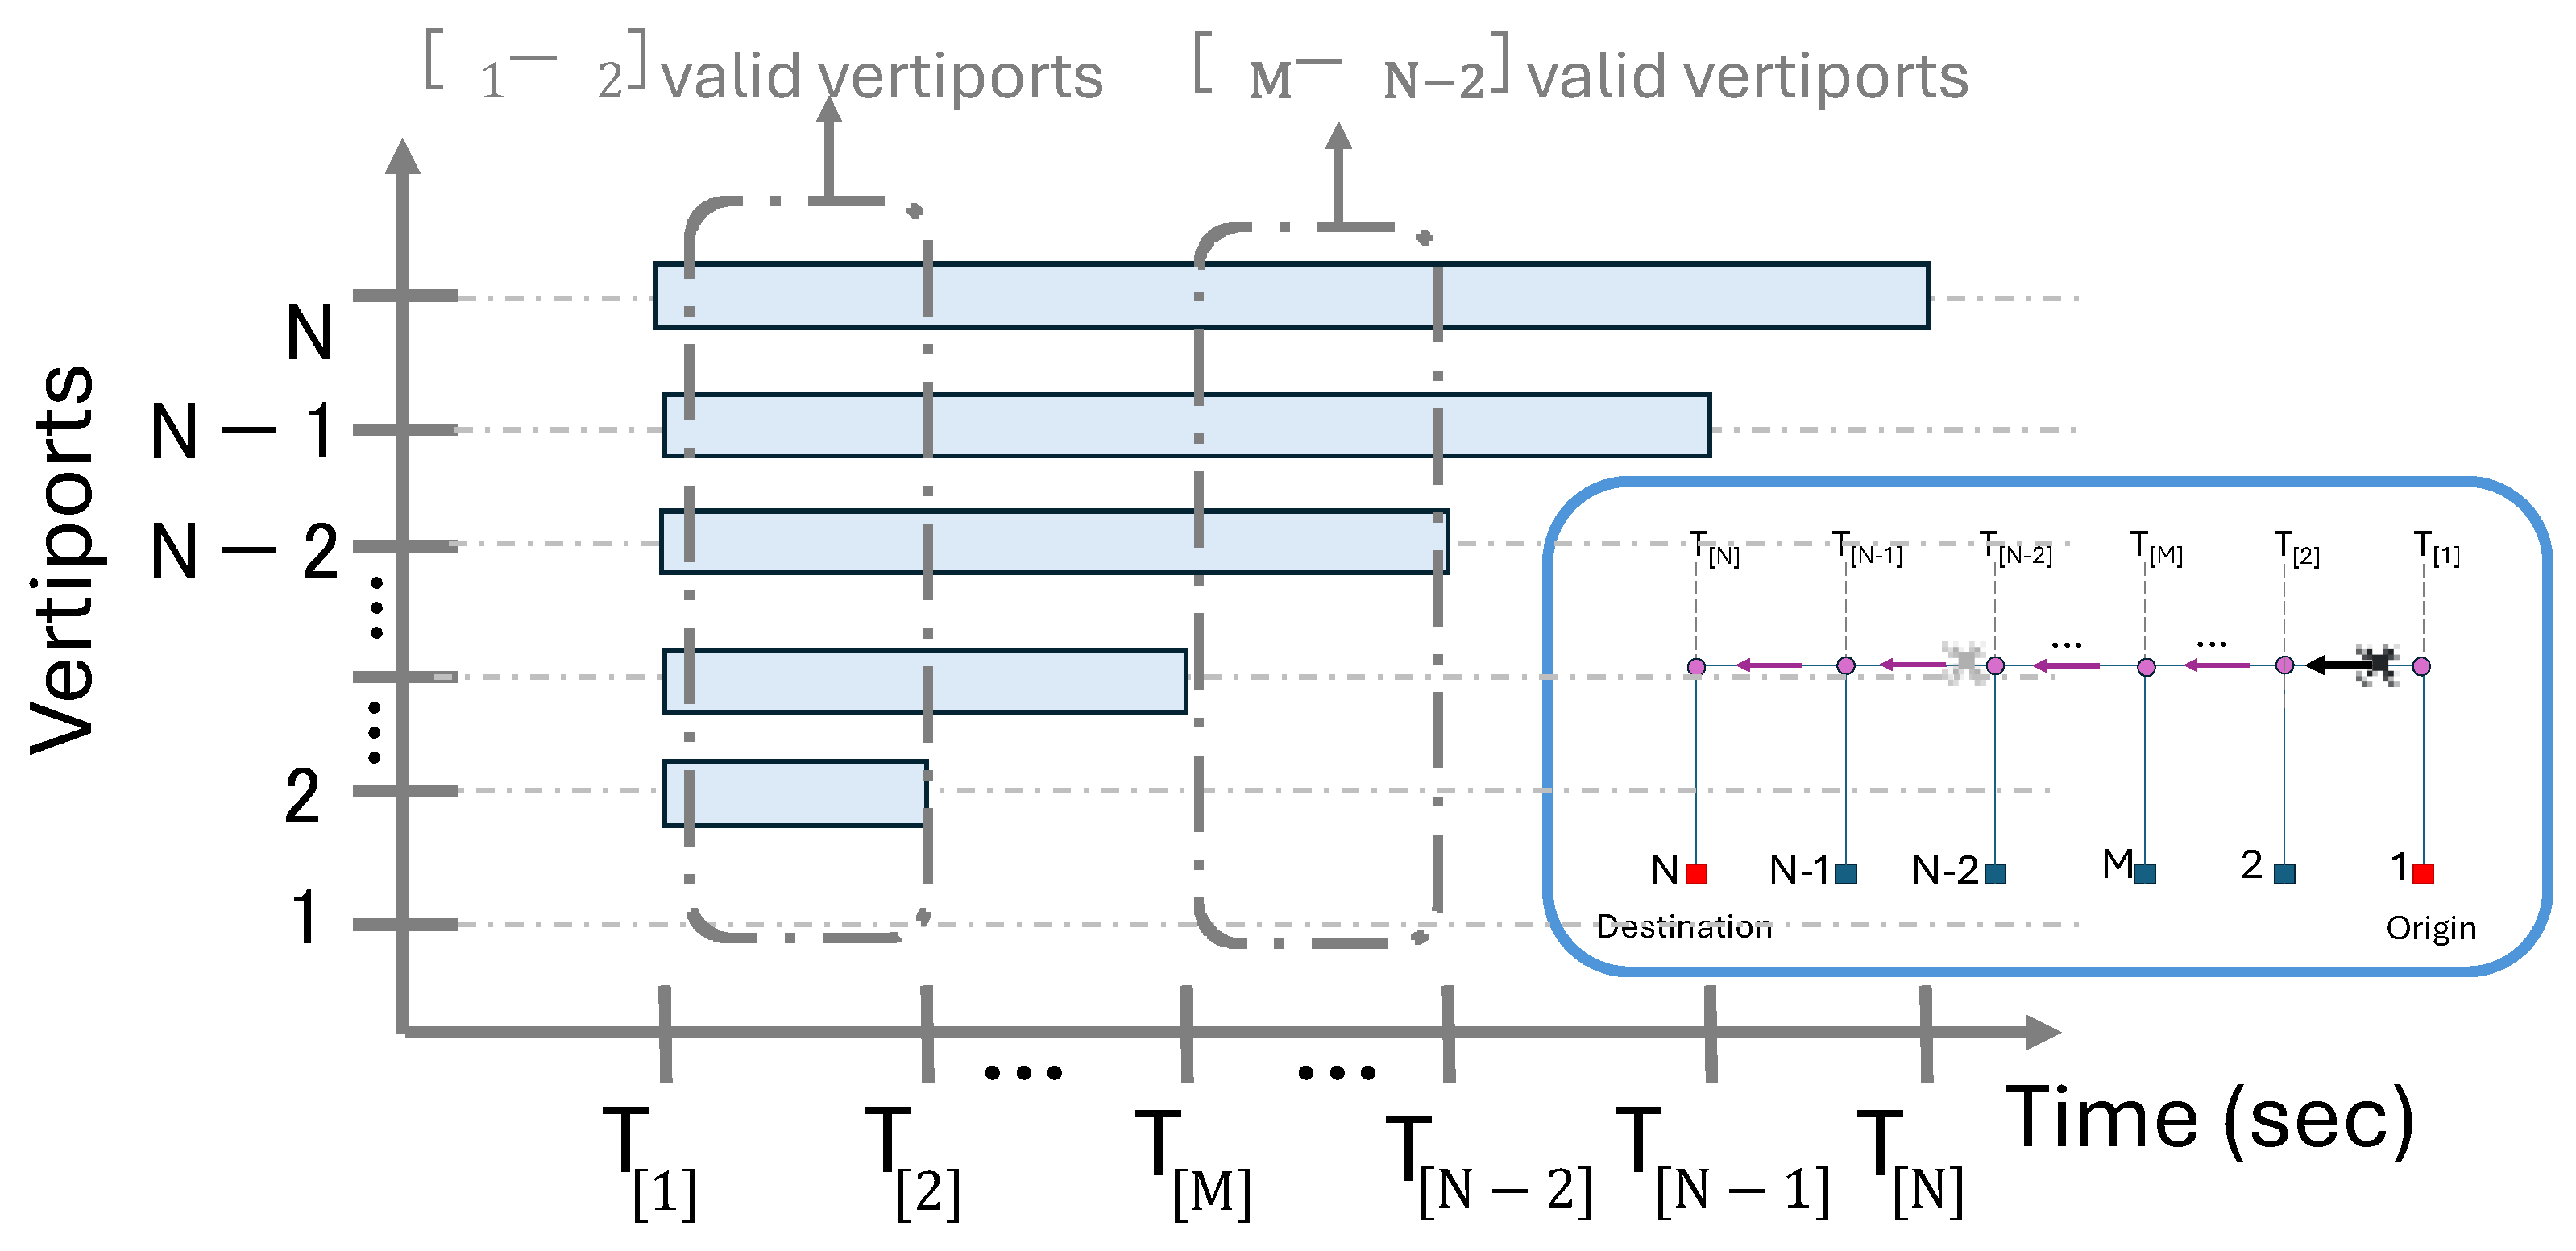
  • All nodes/vertiports to be flown over during the execution of each mission in the ecosystem are identified, including the origin and destination nodes.
  • The time required to reach each vertiport during the execution of a mission is calculated, providing each vertiport a valid time interval to be considered as a contingency vertiport. The validity interval of each vertiport is determined by the mission start time and the time needed to reach its coordinates. It is important to note that once a vertiport is passed, executing an RTL maneuver directed toward that vertiport would result in a change of direction (opposite to the corridor path), potentially generating conflicts with the planned traffic within the corridor.
  • The algorithm responsible for assigning a contingency vertiport to each ecosystem member will not only ensure that the ecosystem members cannot share a contingency vertiport but also will take into account the validity interval of each vertiport. Therefore, the enhanced mission description of each planned flight will be composed of a set of contingencies, each valid for a specific time interval.
  • Additionally, it prevents the assignment of vertiports where, in the event of simultaneous contingencies involving several aircraft, one aircraft would need to overtake the other.
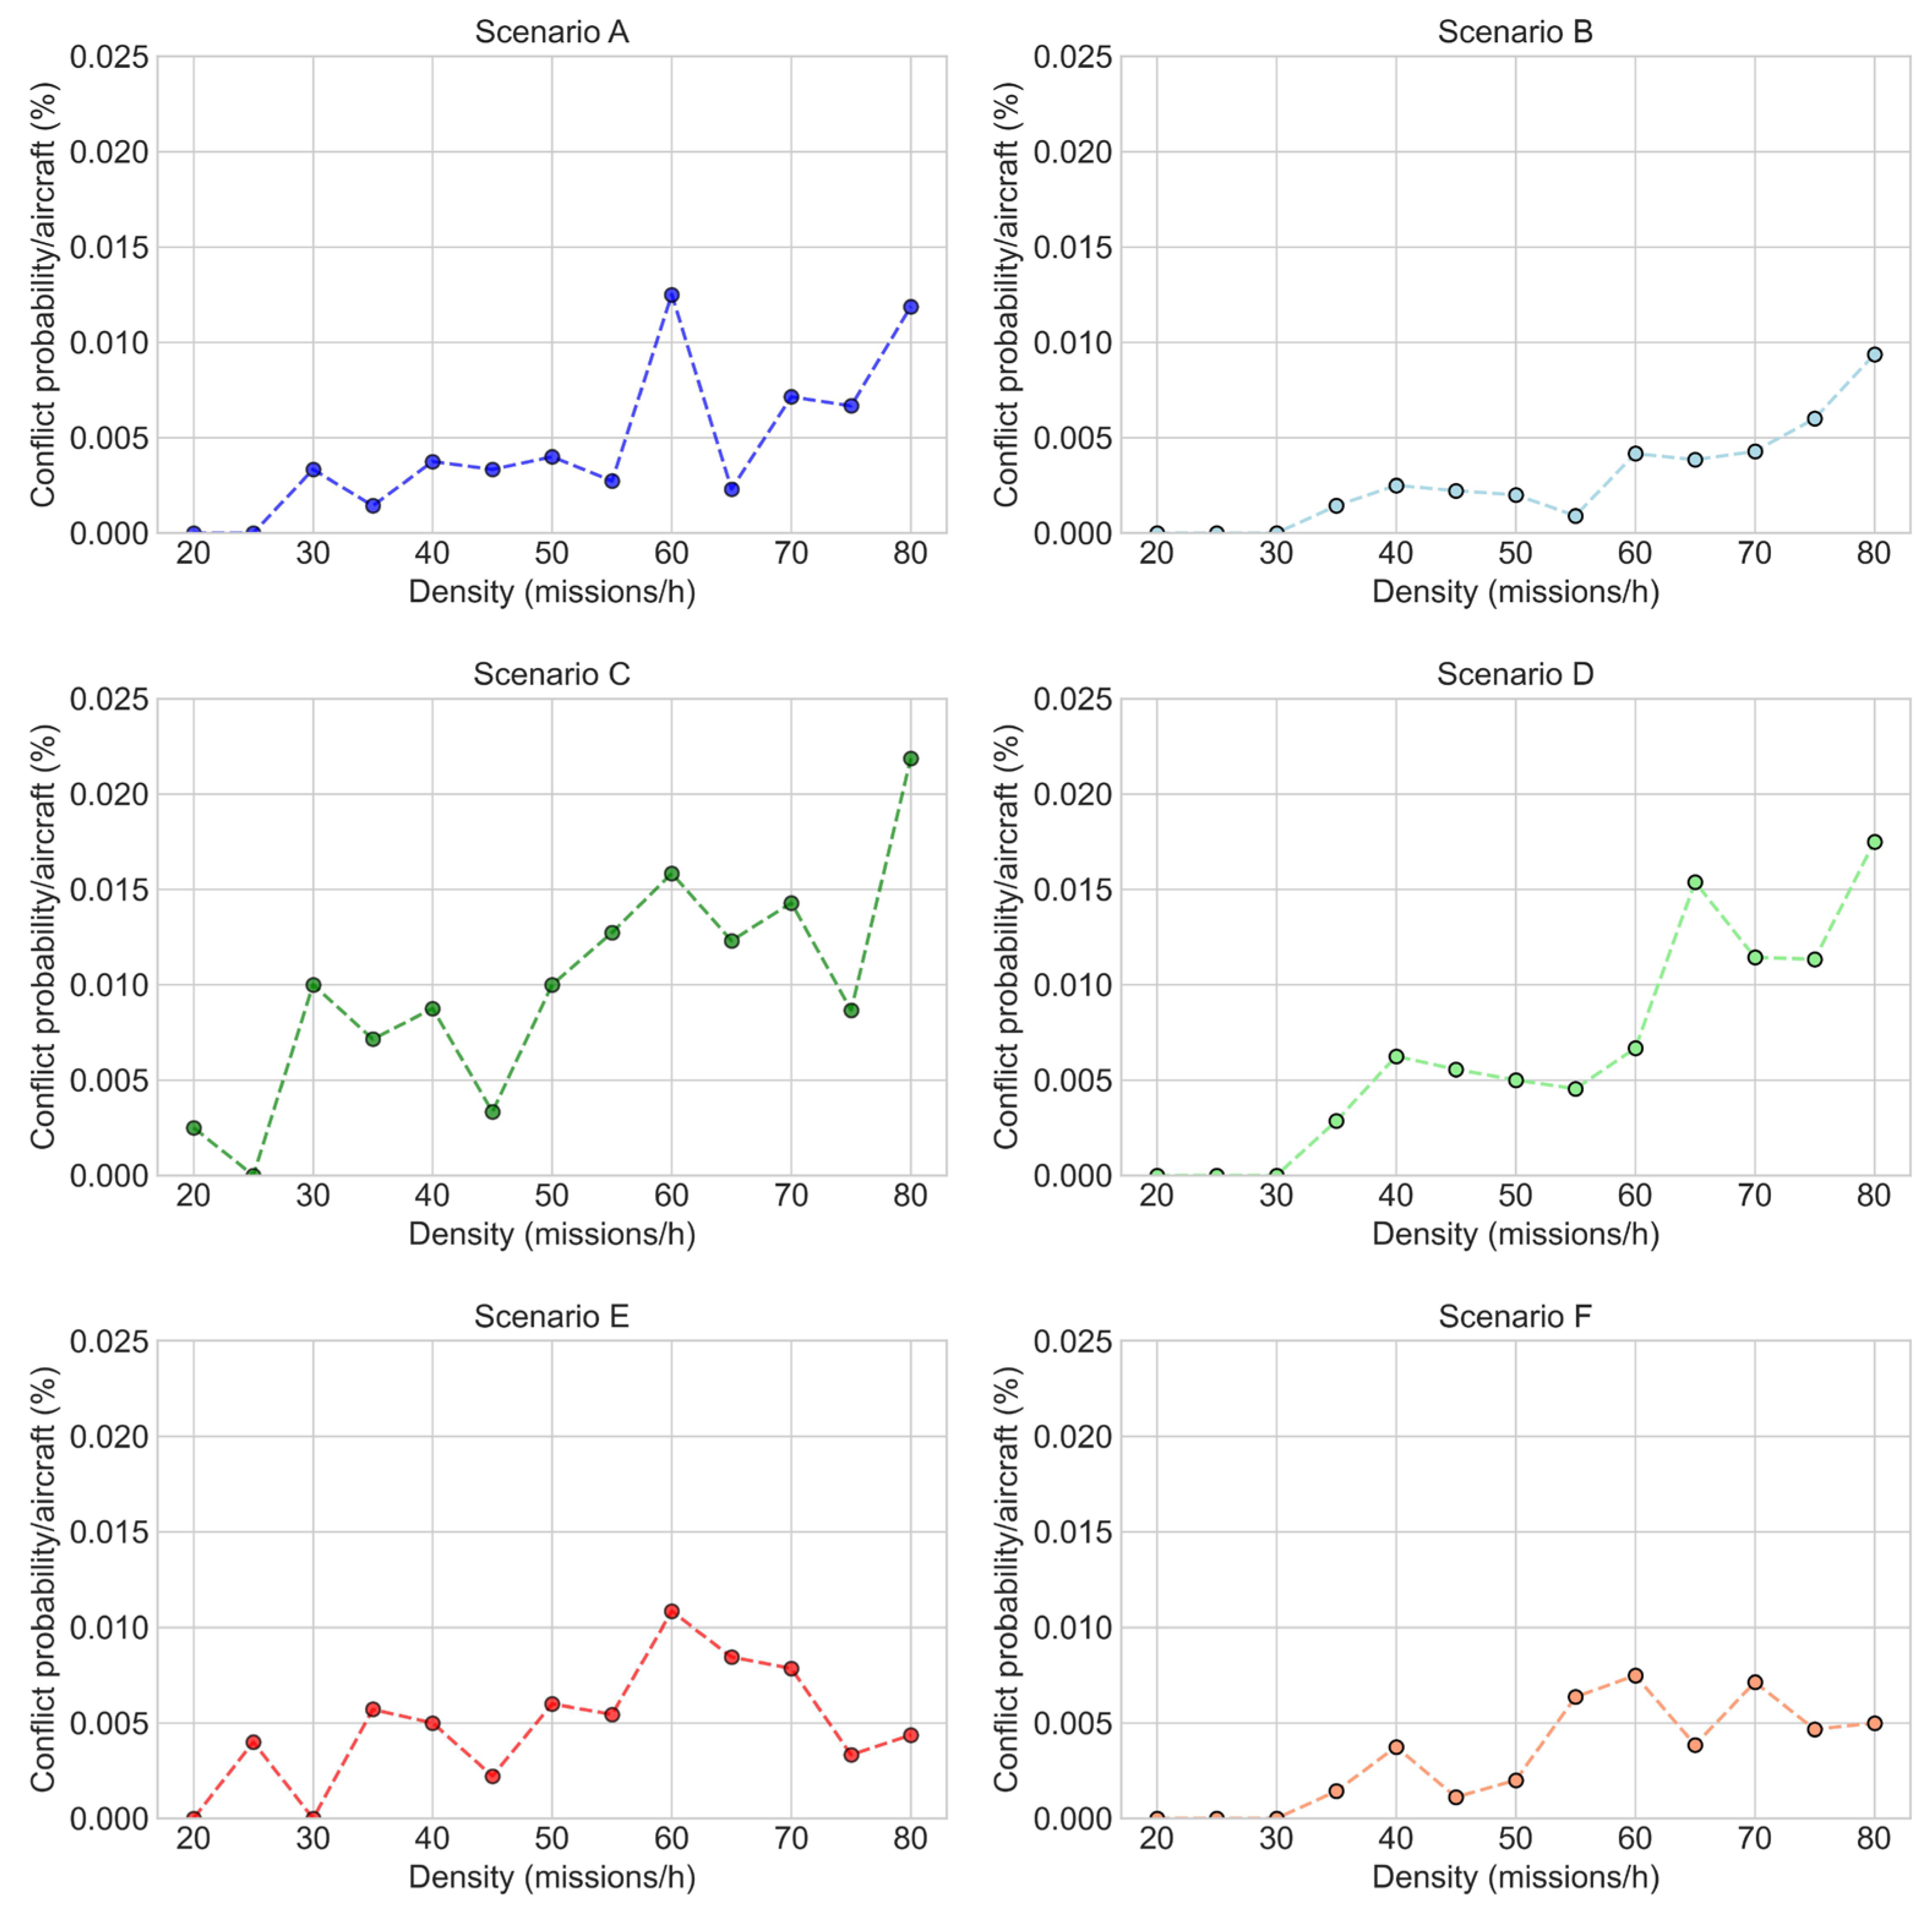
Note that the set of assigned contingency vertiports is determined before the mission begins and does not change during the mission execution. This allows the loading of the enhanced mission description into the onboard control system as part of the planning process prior to the mission’s start. If a contingency event is triggered, the onboard control system must verify which vertiport to approach based on mission progress and the valid interval of the assigned contingency-vertiport list.
With this new dynamic contingency management service, the results presented in Figure 11 are obtained. As can be observed, the use of dynamic contingency management has a deep impact on the system’s safety. In scenario C, it can be observed how the use of the dynamic service avoids any downstream conflict produced by a contingency at any traffic density below 130 missions/hour when the probability of contingency is 0.05. It is worth noting that the static solution is valid for densities lower than 90 missions/hour (with higher contingency probability). When the probability is increased to 0.10, the solution remains valid up to a traffic density of 110 missions/hour. In scenario E, it is observed that the static contingency service does not prevent contingency conflicts for any traffic density, whereas with this approach, conflicts start at approximately 80 missions/hour.
Table 1 summarizes the safety level reached in the characterized scenarios integrating the two different U-space contingency services with varying contingency probabilities. As can be observed, the TSL of the ultra-safe system (USS) is achieved in both scenarios under different conditions. The static contingency service meets this safety requirement only at low density (50 missions/hour) for both probabilities in scenario C. At higher densities and contingency probabilities, the system becomes a regulated (TSL < 1 × 0−3) and dangerous system. However, these safety issues are solved by integrating the dynamic service. It can be observed that scenario C is a USS at any traffic density, even reaching high contingency probability and high-density traffic (traffic density below 130 m/h). In scenario E, which contains a central hotspot in the network due to the spatial probability distribution of the scenario, the scenario remains a USS at high traffic densities (below 130 missions per hour), but the solution becomes invalid at higher contingency probabilities.

4. Discussion

After analyzing the results presented in the previous section, the next set of conclusions are highlighted:
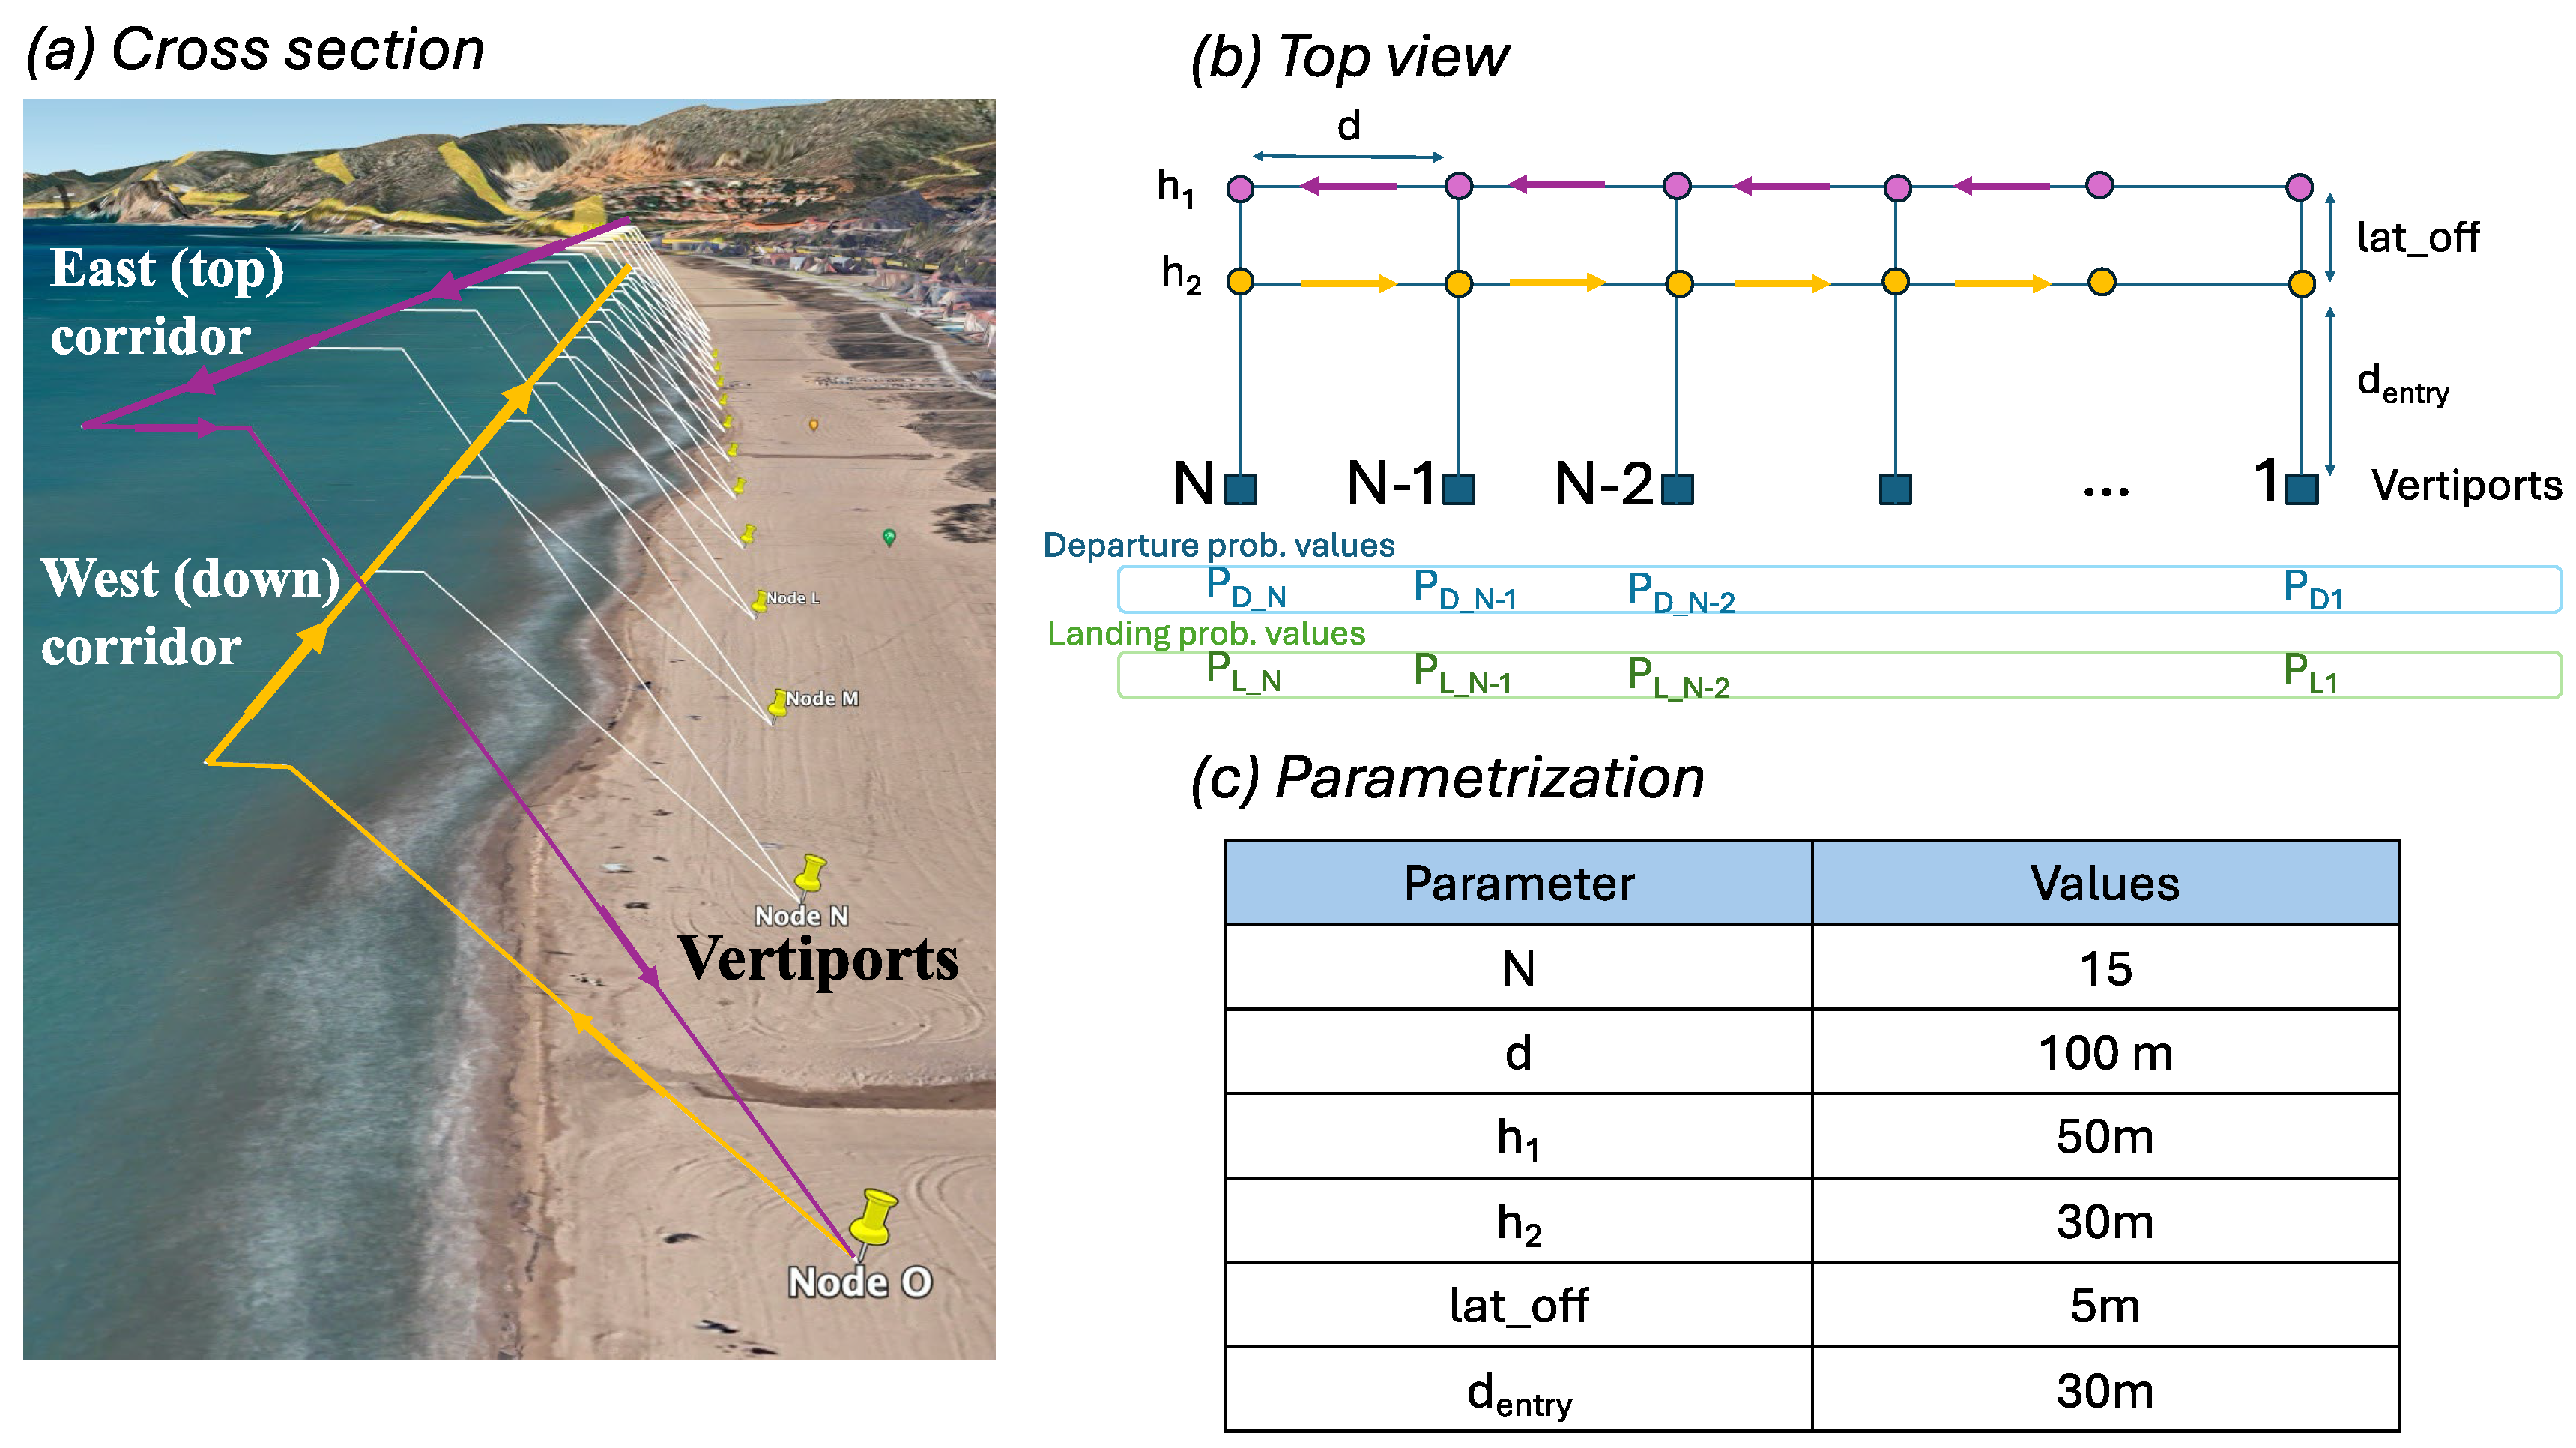
  • As demonstrated during the characterization of the potential scenarios, prior to the integration of the new contingency service, U-space high safety levels are deeply linked to demand capacity balance (DCB) and strategic deconflicting analysis. It has been proven how current contingency maneuvers based on RTL are a safe and valid solution at low traffic-density demand when departures are properly distributed temporally by strategic conflict-resolution services. As highlighted in Figure 5, scenarios B, D, and F can be classified as USSs (facing RTL contingency) for traffic density lower than 30 missions/hour if the departures are coordinated (equally distributed during the characterization time interval). A DCB analysis of the planned traffic, characterizing the spatial hotspot and traffic density, will be the first indicator that it is necessary to apply advanced methodologies or new procedures to manage the contingency procedures. The DCB analysis will also set the contingency service approach (static or dynamic) that will be valid considering the foreseen demand. It is also important to emphasize that the results obtained depend greatly on the designed airspace structure (parameters shown in Figure 3c), and the analysis conducted must be specific to each possible configuration.
  • An airspace structure based on corridors has been used to characterize the impact of contingency, but the results obtained can be extrapolated to other potential airspace configurations like free routing, layers, or zones [25]. As analyzed in Figure 6a), the scenarios with high-demand vertiports will generate a significant number of RTL conflicts. Therefore, the methodology to assign an alternative contingency vertiport will solve a considerable number of conflicts, regardless of the airspace structure. However, the definition of the trajectories that will guide the aircraft to the assigned vertiport requires a more exhaustive characterization. Corridors are the most restrictive airspace structures in terms of spatial distribution, and in this case, they offer an advantage, as they can be anticipated as sections of the U-space volume that will not contain planned missions. To extrapolate the solution to other airspace structure configurations, it will be necessary to analyze the portion of the airspace volumes that are not going to be used (or predefining them) to define the trajectory to reach the contingency vertiport during the RTL maneuver.
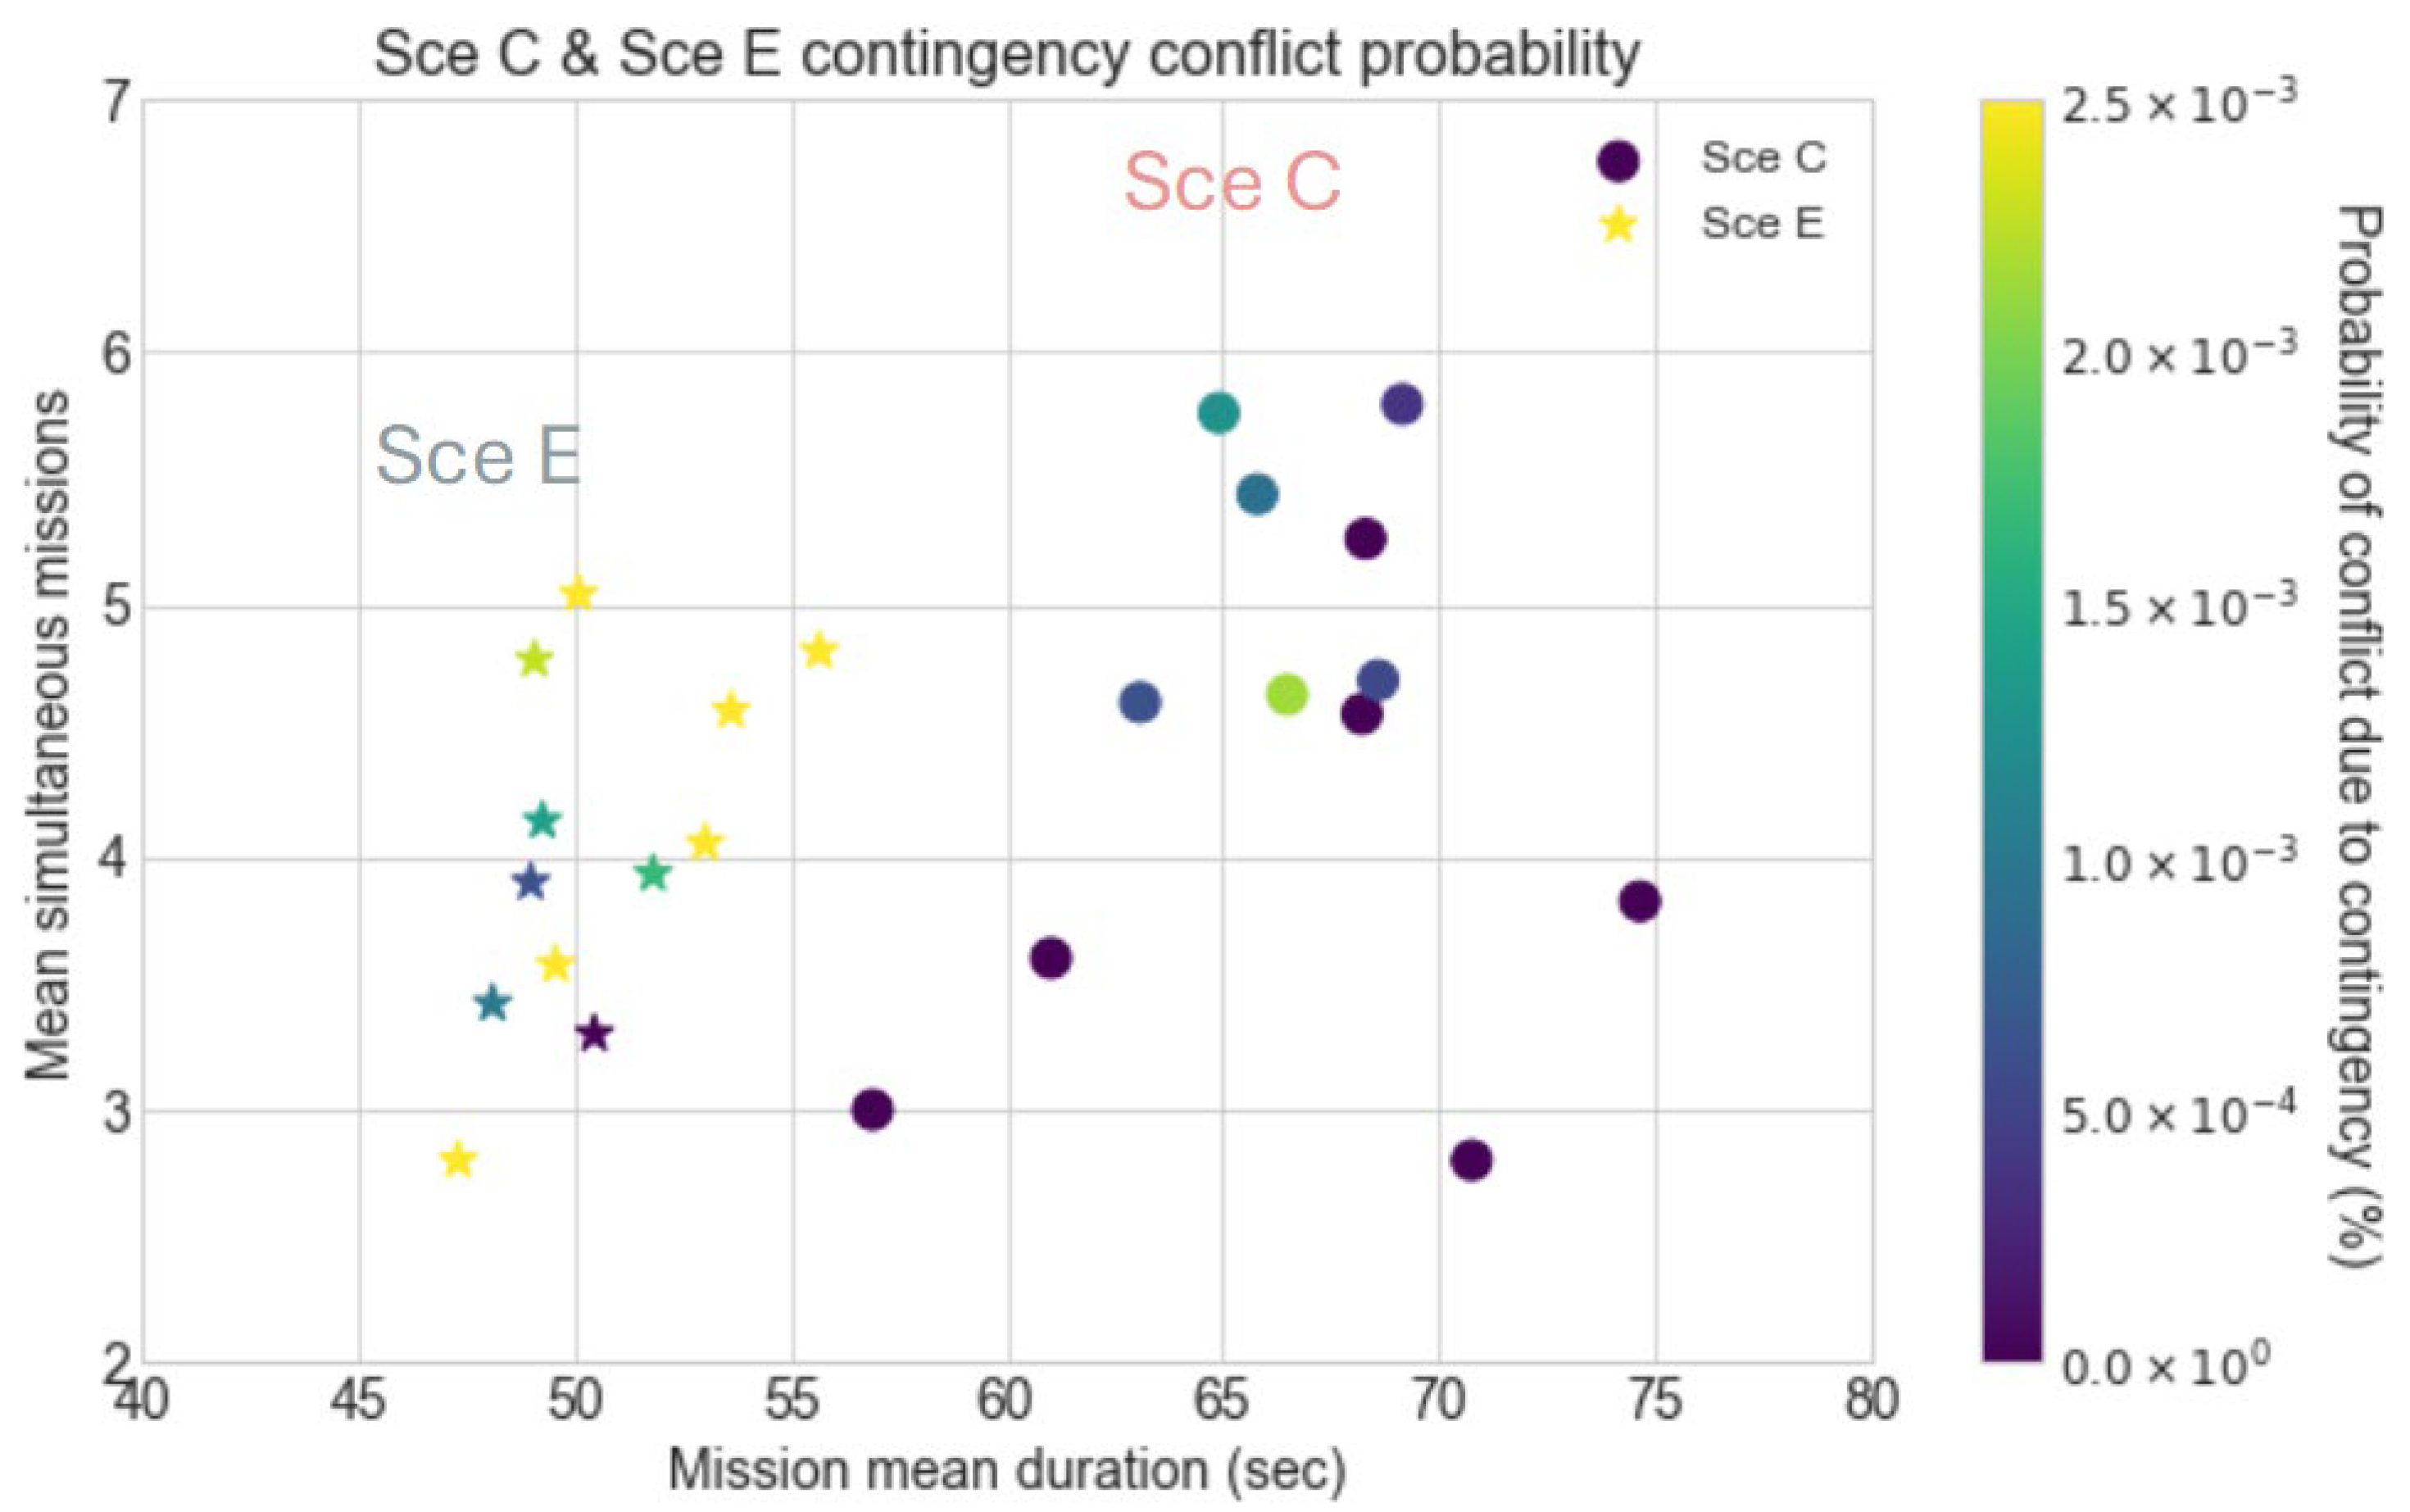
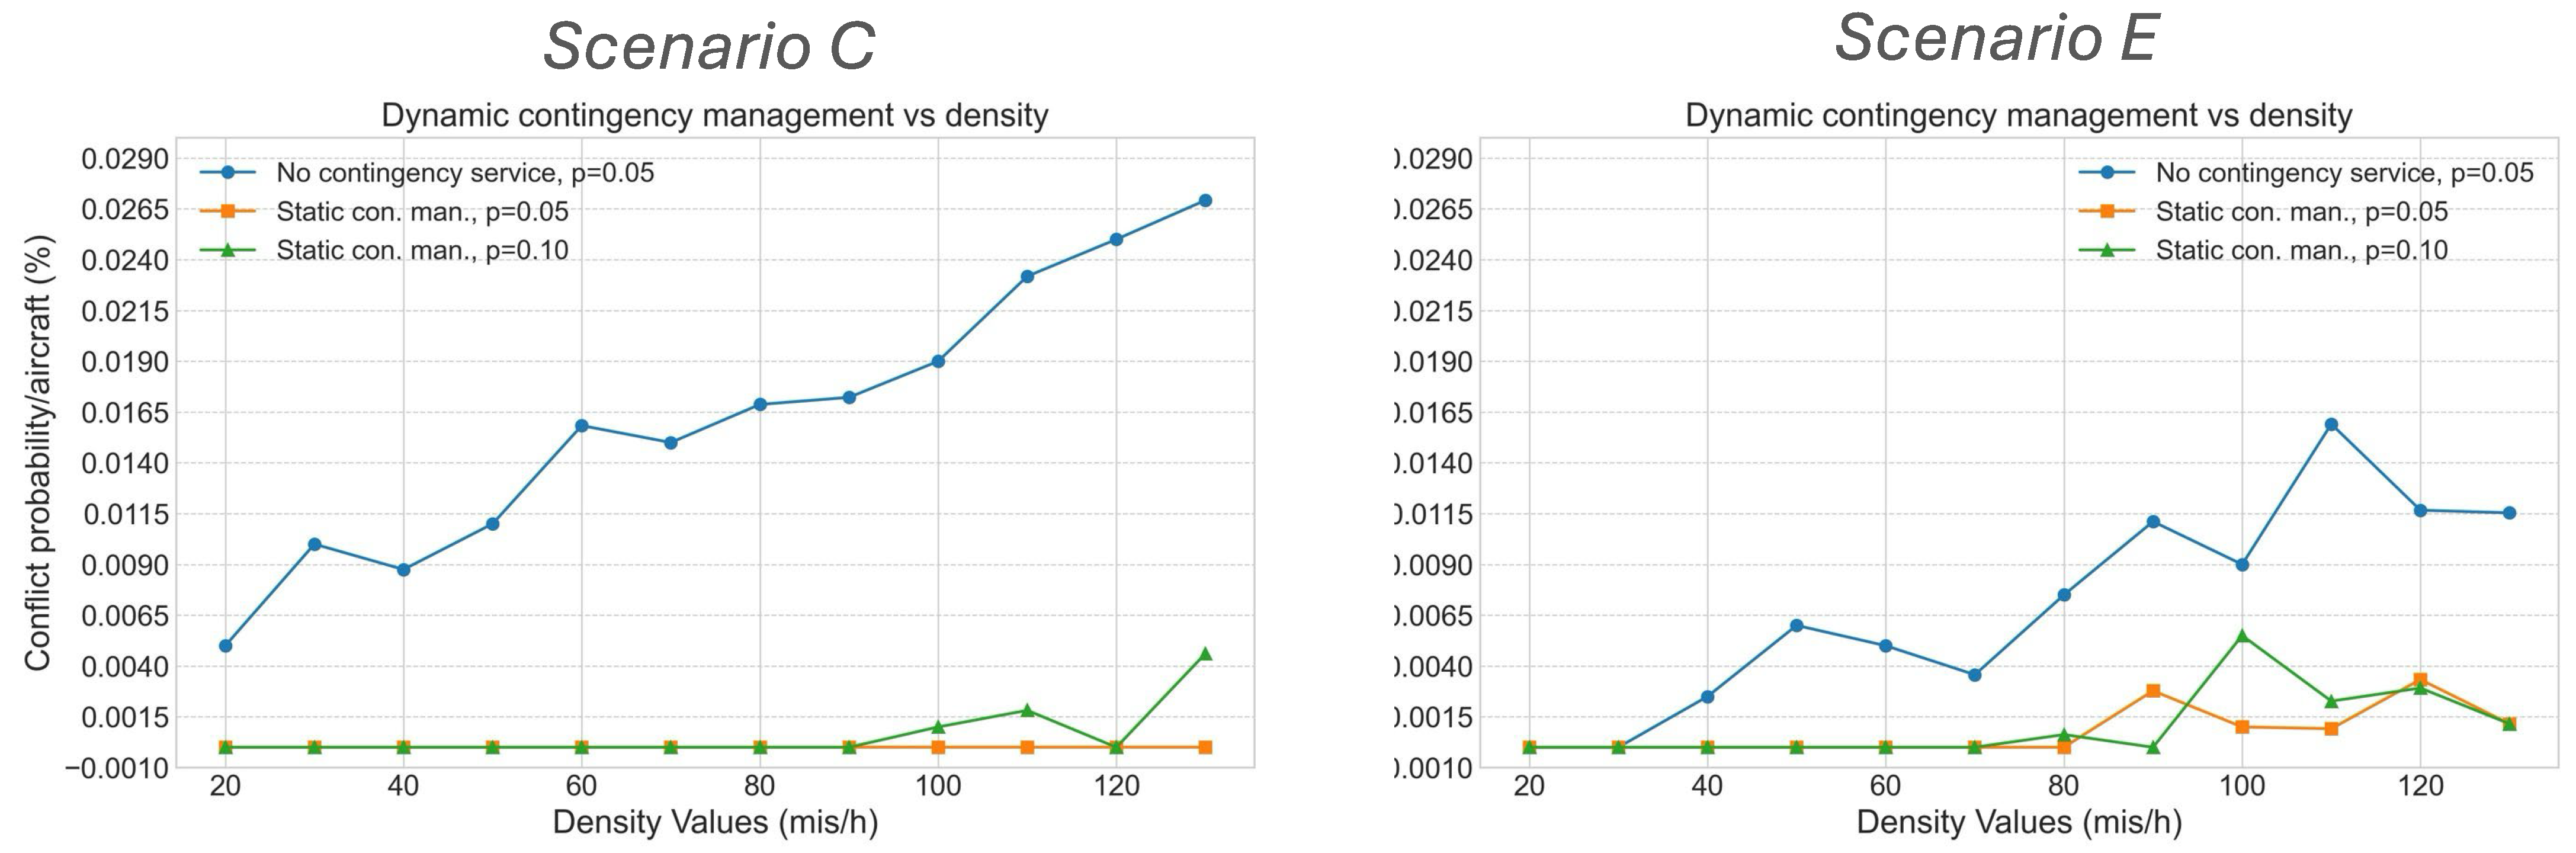
  • The static contingency service, which assigns a single contingency vertiport for the entire duration of each specific mission, has also proven to be a good alternative to those scenarios that present moderate traffic densities (lower than 60 missions/h in the characterized scenarios). As shown in Figure 9, its effectiveness will strongly depend on the traffic pattern, the average number of members in each ecosystem, and the density of vertiports available in the network. Once again, it has been proven that the parametrization of the U-space service cannot be decoupled from the traffic analysis pattern and the design of the airspace structure.
  • The dynamic contingency U-space service has proven to be an excellent solution for enhancing U-space volumes safety in high-density scenarios. As summarized in Figure 11 and Table 1, at low contingency probability, the integration of this new service creates USS airspaces. Since the event triggering the contingency procedures does not impact the capabilities of the aircraft to fly (like CNS coverage issues or low battery state), airspaces that offer robust and detailed characterization (CNS coverage map or weather information) are strong candidates for integrating the dynamic contingency service to enhance system safety.
  • Note that an alternative for handling contingency procedures is a network of dedicated contingency vertiports that do not provide any additional service other than serving as safe landing spots in case of emergency. The contingency vertiport network cartography would need to be characterized to ensure that their locations comply with the design rules and technical requirements [26,27]. The dimensions required to place the infrastructure according to aircraft dimensions, obstacle-free volume (OFV), and final approach and take-off area (FATO) will constrain the potential locations where a vertiport could be placed, but note that this additional infrastructure will have an important economic impact. What additional investment will be required to have a safe, dedicated network of contingency vertiports? As an alternative, the implementation and integration of the defined contingency service will just require an onboard control system (already available in commercial UAVs) capable of managing alternative landing points to be preloaded before the mission starts.
The next step of the described solution will be to adapt the U-space dynamic contingency service to other airspace structures, such as free routing. Additionally, it has also been demonstrated that when high traffic density is reached, the condition of assigning different vertiports to all the members of an ecosystem cannot be met, leading to conflicts when simultaneous contingencies occur. In such cases, a tactical management of the contingency trajectory will be required. Algorithms for defining this safe tactical procedure must be developed, along with the integration of other tactical U-space services that will gather the required flight execution information to define the new trajectory and inform the other airspace users. The additional requirements that this new approach will place on the system on board or communication networks must also be assessed.

5. Conclusions

This work has demonstrated how the integration of a dedicated contingency-management U-space service could transform U-space volumes into ultra-safe-system (USS) deployments, even in high traffic-density scenarios. The proposed approach introduces an enhanced mission description and planning process based on an assignment of a set of alternative vertiports to be used that evolves as the mission is executed. It has been proven that a deep characterization of airspace structure, traffic pattern and density (DCB), and mission description (strategic deconfliction service) could eliminate the need for additional infrastructure to ensure safe landing in the event of unforeseen circumstances. This enriched planning process will be crucial in high-risk deployment scenarios like urban air mobility (UAM) operations.

Author Contributions

Conceptualization, J.L.M.-G. and J.J.R.; methodology, J.L.M.-G. and J.J.R.; software, J.L.M.-G., J.J.R. and Z.L.; validation, J.L.M.-G.; formal analysis, J.L.M.-G. and J.J.R.; investigation, J.L.M.-G. and J.J.R.; resources, J.L.M.-G., J.J.R. and Z.L.; data curation, J.L.M.-G.; writing—original draft preparation, J.L.M.-G.; writing—review and editing, J.L.M.-G.; visualization, J.L.M.-G.; supervision, J.L.M.-G. and J.J.R.; project administration, J.L.M.-G. and J.J.R.; funding acquisition, J.L.M.-G. and J.J.R. All authors have read and agreed to the published version of the manuscript.

Funding

This research was funded by the national Spanish project: “A Multi-Agent negotiation framework for planning conflict-free U-space scenarios” (grant PID2020-116377RB-C22 funded by MCIN/AEI/10.13039/501100011033).

Data Availability Statement

The original contributions presented in this study are included in the article. Further inquiries can be directed to the corresponding author.

Conflicts of Interest

The authors declare no conflict of interest.

References

  1. Barrado, C.; Boyero, M.; Brucculeri, L.; Ferrara, G.; Hately, A.; Hullah, P.; Martin-Marrero, D.; Pastor, E.; Rushton, A.P.; Volkert, A. U-space concept of operations: A key enabler for opening airspace to emerging low-altitude operations. Aerospace 2020, 7, 24. [Google Scholar] [CrossRef]
  2. U-Space Airspace Risk Assessment. Method and Guidelines—Volume 1; Edition 1.0; Eurocontrol: Brussels, Belgium, April 2023.
  3. Kopardekar, P. Safely Enabling UAS Operations in Low-Altitude Airspace (No. ARC-E-DAA-TN45964); NASA: Washington, DC, USA, 2017. [Google Scholar]
  4. U-Space Concept of Operations (CONOPS), 4th ed.; SESAR: Brussels, Belgium, 2023.
  5. Reyes-Muñoz, A.; Barrado, C.; Pastor, E.; Royo, P. ATC Human Factors Involved in RPAS Contingency Management in Non-Segregated Airspace. Appl. Sci. 2023, 13, 1408. [Google Scholar] [CrossRef]
  6. Pastor, E.; Royo, P.; Santamaria, E.; Prats, X.; Barrado, C. In-flight contingency management for unmanned aerial vehicles. J. Aerosp. Comput. Inf. Commun. 2012, 9, 144–160. [Google Scholar] [CrossRef]
  7. Grüter, B.; Seiferth, D.; Bittner, M.; Holzapfel, F. Emergency flight planning using voronoi diagrams. In Proceedings of the AIAA Scitech 2019 Forum, San Diego, CA, USA, 7–11 January 2019; p. 1056. [Google Scholar]
  8. Ayhan, B.; Kwan, C.; Budavari, B.; Larkin, J.; Gribben, D. Preflight contingency planning approach for fixed wing UAVs with engine failure in the presence of winds. Sensors 2019, 19, 227. [Google Scholar] [CrossRef] [PubMed]
  9. Atkins, E. Emergency landing automation aids: An evaluation inspired by US airways flight 1549. In Proceedings of the AIAA Infotech@ Aerospace, Atlanta, GA, USA, 20–22 April 2010. AIAA–2010-3381. [Google Scholar]
  10. Boskovic, J.D.; Prasanth, R.; Mehra, R.K. A multi-layer autonomous intelligent control architecture for unmanned aerial vehicles. J. Aerosp. Comput. Inf. Commun. 2004, 1, 605–628. [Google Scholar] [CrossRef]
  11. Theodore, C.; Rowley, D.; Ansar, A.; Matthies, L.; Goldberg, S.; Hubbard, D.; Whalley, M. Flight trials of a rotorcraft unmanned aerial vehicle landing autonomously at unprepared sites. In Annual Forum Proceedings-American Helicopter Society; Vertical Flight Society (VFS): Fairfax, VA, USA, 2006; p. 1250. [Google Scholar]
  12. Patterson, T.; McClean, S.; Morrow, P.; Parr, G.; Luo, C. Timely autonomous identification of UAV safe landing zones. Image Vis. Comput. 2014, 32, 568–578. [Google Scholar] [CrossRef]
  13. Li, S.; Egorov, M.; Kochenderfer, M. Optimizing collision avoidance in dense airspace using deep reinforcement learning. arXiv 2019, arXiv:1912.10146. [Google Scholar]
  14. Pang, B.; Dai, W.; Ra, T.; Low, K.H. A concept of airspace configuration and operational rules for UAS in current airspace. In Proceedings of the 2020 AIAA/IEEE 39th Digital Avionics Systems Conference (DASC), San Antonio, TX, USA, 11–15 October 2020; IEEE: Piscataway, NJ, USA, 2020; pp. 1–9. [Google Scholar]
  15. Chin, C.; Gopalakrishnan, K.; Balakrishnan, H.; Egorov, M.; Evans, A. Protocol-based congestion management for advanced air mobility. J. Air Transp. 2023, 31, 35–44. [Google Scholar] [CrossRef]
  16. Ribeiro, M.; Ellerbroek, J.; Hoekstra, J. Review of conflict resolution methods for manned and unmanned aviation. Aerospace 2020, 7, 79. [Google Scholar] [CrossRef]
  17. Lappas, V.; Kostopoulos, V.; Zoumponos, G. EuroDRONE, a european UTM testbed for U-Space. In Proceedings of the 2020 International Conference on Unmanned Aircraft Systems (ICUAS), Athens, Greece, 1–4 September 2020; IEEE: Piscataway, NJ, USA, 2020. [Google Scholar]
  18. Liu, Z.; Munoz-Gamarra, J.L.; Ramos Gonzalez, J.J. Characterization of Strategic Deconflicting Service Impact on Very Low-Level Airspace Capacity. Drones 2024, 8, 426. [Google Scholar] [CrossRef]
  19. Munoz-Gamarra, J.L.; Ramos, J.J.; Liu, Z.; Sobejano, A. Impact of USSPs performance in shared U-space volumes. In Proceedings of the SESAR Innovation Days, Seville, Spain, 27–30 November 2023. [Google Scholar]
  20. Puchol, C.C.; Vélez, N.V.; Tejedor, J.V.B.; Vila Carbó, J.A. BUBBLES: A new concept of operations for separation management in the U-space. J. Phys. Conf. Ser. 2023, 2526, 012092. [Google Scholar] [CrossRef]
  21. Rahman, M.F.; Ellerbroek, J.; Hoekstra, J.M. Effect of CNS Systems Performance on Autonomous Separation in U-Space. In Proceedings of the International Conference on Research in Air Transportation, Singapore, 1–4 July 2024. [Google Scholar]
  22. Lin, X.G.; Fulton, N.; Westcott, M.; Lin, X. Target Level of Safety Measures in Air Transportation-Review, Validation and Recommendations. 2009. Available online: https://www.researchgate.net/publication/265251293 (accessed on 12 October 2019).
  23. Pfisterer, H. European Regulation of Aerodrome Safety Managment Systems in the EASA System; Kassel University Press GmbH: Kassel, Germany, 2017; Volume 21. [Google Scholar]
  24. Amalberti, R. The paradoxes of almost totally safe transportation systems. In Human Error in Aviation; Routledge: Abingdon, UK, 2017; pp. 101–118. [Google Scholar]
  25. Sunil, E.; Ellerbroek, J.; Hoekstra, J.; Vidosavljevic, A.; Arntzen, M.; Bussink, F.; Nieuwenhuisen, D. Analysis of airspace structure and capacity for decentralized separation using fast-time simulations. J. Guid. Control Dyn. 2017, 40, 38–51. [Google Scholar] [CrossRef]
  26. Vertiports Prototype Technical Specifications for the Design of VFR Vertiports for Operation with Manned VTOL-Capable Aircraft Certified in the Enhanced Category (PTS-VPT-DSN); EASA: Cologne, Germany, 2022.
  27. Urban Air Mobility (UAM) Concep of Operations v2.0; Federal Aviation Administration: Washington, DC, USA, April 2023. Available online: https://www.faa.gov/sites/faa.gov/files/Urban%20Air%20Mobility%20%28UAM%29%20Concept%20of%20Operations%202.0_1.pdf (accessed on 26 April 2023).
Figure 1. Positioning of U-space contingency service in threat, mitigation, contingency, and emergency procedures.
Aerospace 11 00876 g001
Figure 2. (a) Schematic diagram of the integration of the U-space contingency service in the strategic U-space services framework. At the same time, the figure also highlights the procedures between airspace users, USSP, and CISP during the planning process. (b) U-space contingency service workflow.
Aerospace 11 00876 g002
Figure 3. (a) Scenario corridors airspace-structure cross-section. (b) Schematic top-view diagram of the corridors-based airspace structure. (c) Scenario parameter values.
Aerospace 11 00876 g003
Figure 4. (a) Simplified diagram of the traffic-demand pattern, specifying start/end probability and start-time demand distribution. (b) Mean number of simultaneous missions vs. traffic demand.
Aerospace 11 00876 g004
Figure 5. Aircraft conflict probability after contingency procedures for each of the traffic-pattern scenarios with different traffic densities.
Aerospace 11 00876 g005
Figure 6. (a) Conflict origin analysis of the three spatial distributions. (b) Image of a vertiport conflict (orange trajectory shows the mission under contingency procedure. (c) Image of a trajectory conflict (yellow trajectory shows the mission under contingency procedure).
Aerospace 11 00876 g006
Figure 7. Schematic representation of the static U-space contingency service.
Aerospace 11 00876 g007
Figure 8. Conflict probability evolution with the integration of the static contingency service (with a contingency probability of 0.05/0.10) as a function of traffic-density increase.
Aerospace 11 00876 g008
Figure 9. Comparison of scenarios C and E, mission mean duration, simultaneous missions, and probability of conflict due to a contingency.
Aerospace 11 00876 g009
Figure 10. Representation of the validity interval for each ecosystem member in an RTL-based contingency. The inset of the figure shows a simplified diagram of the mission in execution and the times when the different vertiports of the trajectory will be overtaken.
Aerospace 11 00876 g010
Figure 11. TSL evolution with the integration of the dynamic contingency service while facing a contingency probability of 0.05/0.10 as a function of traffic density increase.
Aerospace 11 00876 g011
Table 1. Conflict probability values per aircraft for scenarios C and E, integrating static and dynamic U-space contingency services varying contingency probabilities. The USS label is assigned when the conflict probability is below the 1 × 10⁻⁵ threshold.
ScenarioDensity (m/h)Static
(p = 0.05)
Static (p = 0.10)Dynamic
(p = 0.05)
Dynamic
(p = 0.10)
Scenario C50USSUSSUSSUSS
806.25 × 10−41.25 × 10−3USSUSS
1303.84 × 10−43.84 × 10⁻³USS4.61 × 10−3
Scenario E501.00 × 10−31.00 × 10⁻³USSUSS
806.15 × 10−45.62 × 10−3USS6.05 × 10−4
1305.70 × 10−31.07 × 10−21.15 × 10−31.15 × 10⁻³
Disclaimer/Publisher’s Note: The statements, opinions and data contained in all publications are solely those of the individual author(s) and contributor(s) and not of MDPI and/or the editor(s). MDPI and/or the editor(s) disclaim responsibility for any injury to people or property resulting from any ideas, methods, instructions or products referred to in the content.

