Abstract
This article examines the flight dynamics and trajectory analysis of a parachute–payload system deployed from a C-17 aircraft. The aircraft is modeled with an open cargo door, extended flaps, and four turbo-fan engines operating at an altitude of 2000 feet Above Ground Level (AGL) and an airspeed of 150 knots. The payloads consist of simplified CONEX containers measuring either 192 inches or 240 inches in length, 9 feet in width, and 5.3 feet in height, with their mass and moments of inertia specified. At positive deck angles, gravitational forces cause these payloads to begin a gradual descent from the rear of the aircraft. For aircraft at zero deck angle, a ring-slot parachute with approximately 20% geometric porosity is utilized to extract the payload from the aircraft. This study specifically employs the CREATE-AV Kestrel simulation software to model the chute-payload system. The extraction and suspension lines are represented using Kestrel’s Catenary capability, with the extraction line connected to the floating confluence points of the CONEX container and the chute. The chute and payload will experience coupled motion, allowing for an in-depth analysis of the flight dynamics and trajectory of both elements. The trajectory data obtained will be compared to that of a payload (without chute and cables) exiting the aircraft at positive deck angles. An adaptive mesh refinement technique is applied to accurately capture the engine exhaust flow and the wake generated by the C-17, chute, and payloads. Friction and ejector forces are estimated to align the exit velocity and timing with those recorded during flight testing. The results indicate that the simulation of extracted payloads aligns with expected trends observed in flight tests. Notably, higher deck angles result in longer distances from the ramp, leading to increased exit velocities and reduced payload rotation rates. All payloads exhibit clockwise rotation upon leaving the ramp. The parachute extraction method yields significantly higher exit velocities and shorter exit times, while the payload-chute acceleration correlates with the predicted drag of the chute as demonstrated in prior studies.
1. Introduction
Modeling and Simulation (M&S) techniques can provide valuable insights into physical scenarios before undertaking resource-intensive experimental characterization. This article discusses the findings of a study aimed at achieving realistic simulations of ring-slot parachute–payload system configurations as they exit the cargo ramp of a C-17 aircraft. The study focuses on low-velocity, gravity-assisted airdrop types, with the airdrop altitude varying based on the type and number of parachutes utilized.
Mudrak [1] outlined the steps involved in payload extraction. The payload is equipped with a parachute, which is packed into a compact deployment bag. A static line is attached to the deployment bag, with its other end connected to an anchor cable running the length of the cargo compartment. When the airdrop is initiated (determined by factors such as speed, deck angle, and altitude), the payload is released, sliding toward the ramp and tipping over the edge while still attached to the static line. The exit time is defined as the moment when the payload is still inside the aircraft, and this timing is influenced by the aircraft’s deck angle, which may vary due to shifts in the center of gravity caused by the payload’s movement. At the moment of exit, the payload tips over the ramp edge while the static line remains connected. Just a few seconds later, the static line becomes taut, pulling the suspension line. This action causes the suspension lines to quickly tighten, pulling the parachute from the deployment bag. The parachute then enters the freestream and begins to inflate until it reaches its maximum radius and drag force.
Modeling and Simulation (M&S) of this scenario requires high-fidelity multiphysics simulations that encompass fluid–structure interactions, propulsion systems, multi-body dynamics, structural dynamics, and the physics of cables. Previous studies on the simulation of extraction parachutes have instilled confidence in the computational techniques employed for future airdrop development efforts [2,3,4,5].
Bergeron et al. [2] investigated the near-field flow solutions of the C-17 aircraft with both open and closed cargo ramps. The simulations incorporated engine inlet and exhaust flows, extended flaps, and an asymmetric fuselage due to the installation of the auxiliary power unit on the starboard side of the aircraft. A rigid model of a ring-slot chute with a projected diameter of 24.45 feet () was placed behind the C-17 cargo door. However, it is important to note that the chute–C-17 simulations were conducted primarily for demonstration purposes, as the chute’s position relative to the C-17 did not accurately reflect the actual lengths of the extraction and suspension lines. Bergeron et al. [2] demonstrated that the flow field impacting the chute comprises two primary components: an accelerated flow emanating from beneath the fuselage and an unsteady wake flow.
Noetscher et al. [3] utilized the same 24.45-foot-diameter chute, but positioned it realistically as indicated in Figure 1, considering the lengths of the extraction and suspension lines. Additionally, the impact of the C-17’s deck angle on chute performance was analyzed. Notably, the mean position of the vortices for the deck angle configuration is lower than that observed in the case. Consequently, a relatively strong velocity field affects the lower portion of the canopy rather than the top, a difference highlighted by the upward deflection of the apex jet as it exits the canopy. Finally, Noetscher et al. [3] investigated the influence of extraction line distance on the aerodynamics of the chute.
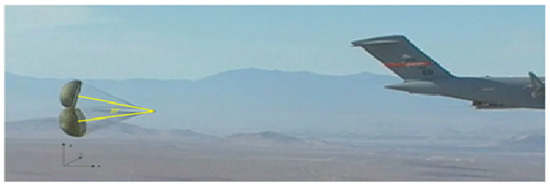
Figure 1.
Configuration of a cluster of three ring-slot parachutes during payload extraction from the C-17.
Bergeron et al. [4] employed a different rigid model chute: a standard 28-foot-diameter (nominal diameter, ) ring-slot canopy with 20% geometric porosity, defined as the ratio of open areas to the total canopy area. The aerodynamic characteristics of both a single 28-foot-diameter chute and a cluster of three such chutes were analyzed under free-stream conditions and in the wake of the C-17.
Ghoreyshi et al. [5] studied the stability and control analysis of rigid models of both a single ring-slot chute and a cluster of three chutes, with geometric porosities of 0% and 20%. These were evaluated in free-stream conditions and in the wake of a C-17 aircraft with an open cargo door and extended flaps. Angle-of-attack sweep motions were employed to generate continuous aerodynamic plots over a wide range of angles and to examine the static stability characteristics. An adaptive mesh refinement method was implemented to accurately capture the wakes behind the chutes and the C-17.
The dynamic stability of the chutes was investigated through responding-body motion simulations in both free-stream conditions and behind the C-17 aircraft. A Catenary utility was utilized to model the static lines connected to the extraction chutes. During the responding-body motions, weight and balance data for the chutes were estimated, allowing the chute to respond to aerodynamic forces and its own weight. A “ball” constraint was defined to maintain a constant distance to the suspension line confluence point throughout the motion. The positions and Euler angles from these simulations were extracted and compared, helping to determine the dynamic stability characteristics of the chutes. Additionally, the Catenary capability was tested to include static and suspension lines during the responding-body motions.
Ghoreyshi et al. [5] showed that decreasing geometric porosity increases the drag coefficient but reduces the stability of the rigid chute model. Furthermore, a rigid chute model positioned behind the C-17 with an open cargo ramp exhibits less stability than one in free-stream conditions. The responding-body motions confirmed that an extraction chute with 20% geometric porosity is both statically and dynamically stable in the pitch direction. In contrast, a rigid chute model with 0% porosity experienced significant pitch angle oscillations with no damping observed during the simulation.
This study again uses the rigid 28-foot-diameter chute models with 20% geometric porosity. High-fidelity models of these parachutes, CONEX containers, and the C-17 aircraft are presented to analyze the complex interactions among the parachute, payload, and the aircraft wake. Responding-body motion is utilized to investigate the flight dynamics of the chute-payload system as it exits the C-17. Additionally, the extraction and suspension lines are modeled.
These results enhance the understanding of the flight dynamics of parachute–payload systems within the context of the aircraft’s flow field, significantly contributing to the design and testing of a major DoD acquisition program.
2. Test Cases and Computational Grids
The problem being considered is shown in Figure 1. Snapshots of the payload being released from the C-17 aircraft at various time intervals are also shown in Figure 2. The C-17 configuration used in study is similar to the one used in Refs. [2,4]. This geometry is shown in Figure 3. The C-17 aircraft model, used here, has four F117-PW-100 Turbofan engines (Pratt & Whitney, East Hartford, CT, USA), an open cargo door, and flaps extended. This geometry includes the asymmetric fuselage resulting from the addition of the auxiliary power unit on the starboard side of the aircraft. C-17 models have deck (pitch) angles of 0, 5, and 7 degrees. C-17 with deck angle of 7 degrees is compared with the model with zero angle in Figure 3.
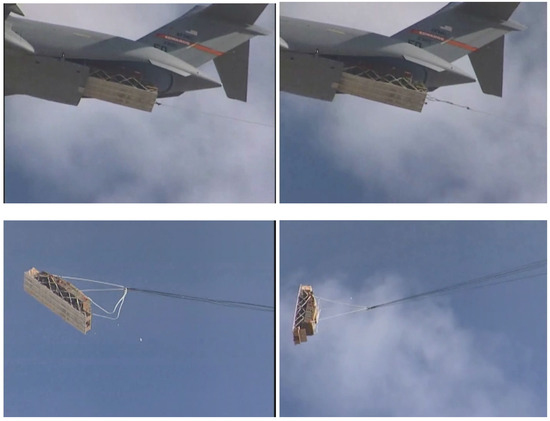
Figure 2.
Payload extraction utilizing suspension lines with a deck angle of .
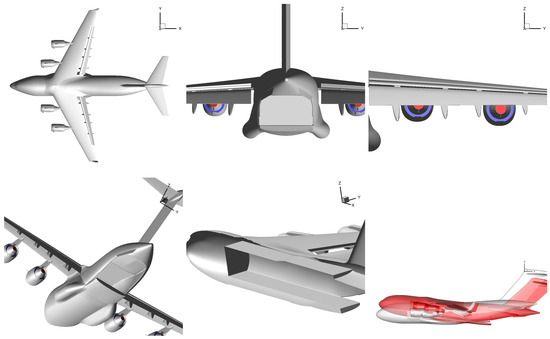
Figure 3.
C-17 aircraft model utilized in the simulations. The red-shaded C-17 is set at a deck angle of 7 degrees.
It is important to note that in the computational models, each engine has an inlet plane modeled with a sink boundary condition, along with two exhaust planes incorporating source boundary conditions for both core (hot) and bypass (cold) exhaust flows. The engine exhaust conditions are set to correspond to Mach 0.78 and a bypass ratio of 5.9.
The ring-slot chute, used here, is detailed in Ref. [5], and has a nominal diameter () of 28 ft; the so-called 28 ft chute and has a projected diameter () of approximately 21.5 ft. The chute geometry terminology is presented in Figure 4a. The 28 ft chute geometry and the definition of forces and moments are given in Figure 4b as well. The length of suspensions lines is .
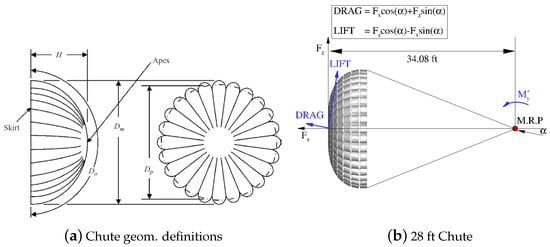
Figure 4.
Ring-slot chute. (a) Geometry definitions. (b) 28 ft chute and definition of lift, drag, and pitch moment.
Three CONEX geometries are considered in this study. These geometries are cuboids with a width of 108 inches, a height of 64 inches, and lengths of either 192 inches or 240 inches. The initial positions of the payloads within the C-17 cargo bay are depicted in Figure 5. The shorter CONEX, referred to as “payload4” (shown in blue), has a length of 192 inches, and is positioned 65 inches from the ramp edge. Payload1, represented by the green CONEX, measures 240 inches in length and is located 299 inches from the ramp end. Lastly, “payload2”, indicated by the red-shaded CONEX, also has a length of 240 inches and is situated 581 inches from the ramp edge.
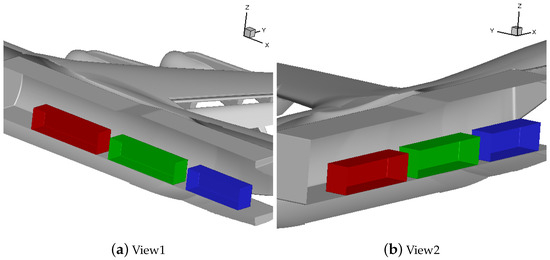
Figure 5.
Three CONEX units positioned inside the C-17 aircraft.
In the simulations of the payload-chute system, the chute is positioned 180 feet from the end of the ramp, as illustrated in Figure 6. This distance corresponds to the lengths of the extraction and suspension lines. In the payload-chute simulations, a single 28-foot ring-slot chute is positioned 180 feet from the end of the ramp, with the chute confluence point located 40 feet from the apex. A total of 36 suspension lines connect the chute at 36 fixed positions to the floating confluence point, as depicted in Figure 6. The extraction line includes two floating points: one at the chute confluence point and the other above Payload4. The latter point is linked to four fixed points at the top corners of Payload4. The simulation set up of the payload-chute system is shown in Figure 7.

Figure 6.
The chute’s position behind the C-17.
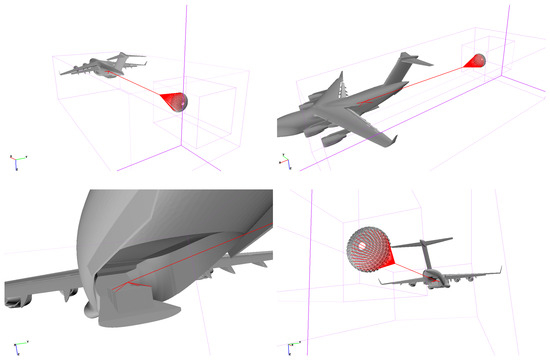
Figure 7.
Modeling of chute suspension and extension lines, along with payload cables. Solid red lines indicate the Cartesian grid boundaries, while dashed red lines denote refinement regions around the C-17 and chute.
Subset grids for the C-17, chute, and CONEX were generated. These subset grids have a small outer boundary and are overset on a background Cartesian grid that refines in specified regions every 250 time steps based on predicted scaled-Q criterion values. While the subset grids capture the boundary layer around wall surfaces, adaptive mesh refinement is employed to accurately depict wakes and separated flows around both fixed and moving bodies. Subset grids are shown in Figure 8. The subset distance for C-17 aircraft has a 64 indistance from no-slip walls, and contains approximately 53 million cells. The chute has a subset distance of 50 in as well, and approximately 108 million cells. CONEX grids include only hexahedral cells and contain approximately 5 and 6 million cells for small and long geometries. Figure 8 shows CONEX and C-17 subset grids overset on the Cartesian Background grid before enabling mesh refinement.
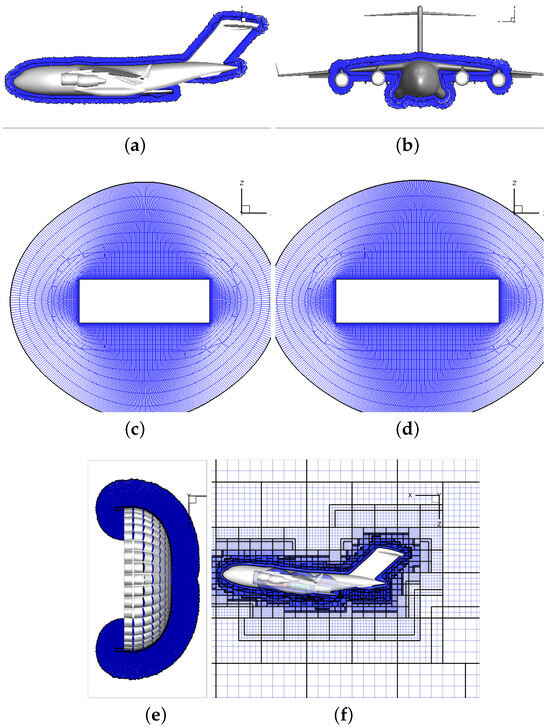
Figure 8.
Subset grids of C-17 and CONEX geometries. (a) C-17 subset grid. (b) C-17 subset grid. (c) Payload4 subset grid. (d) Payload1,2 subset grids. (e) 28 ft chute subset grid. (f) Overset grids.
3. CFD Solver
All simulations of this work are performed using Kestrel software. Kestrel is the fixed-wing product of the CREATE-AV program funded by the DoD High Performance Computing Modernization Program (HPCMP). The objective of the CREATE program is to improve the Department of Defense acquisition time, cost, and performance using state-of-the-art computational tools for design and analysis of ships, aircraft and antenna. Kestrel is specifically developed for multidisciplinary fixed-wing aircraft simulations incorporating components for aerodynamics, jet propulsion integration, structural dynamics, kinematics, and kinetics. The code has a Python-based infrastructure that integrates Python, C, C++, or Fortran-written components [6]. Kestrel version 12.2 is used in this work. The code has been extensively tested and a variety of validation documents have been reported [7,8].
Kestrel CFD solvers include KCFD [9], COFFE [10], and KCFD/SAMAir [11]. The KCFD flow solver is used in this study. KCFD uses a second-order accurate cell-centered finite-volume discretization; however, SAMAir utilizes a fifth-order finite-volume discretization on Cartesian meshes [12]. In more detail, the KCFD flow solver discretizes the Reynolds-Averaged Navier–Stokes (RANS) equations into a second-order cell-centered finite-volume form. The code then solves the unsteady, three-dimensional, compressible RANS equations on hybrid unstructured grids [13]. The KCFD flow solver uses the Method of Lines (MOL) to separate temporal and spatial integration schemes from each other [9]. The spatial residual is computed via a Godunov type scheme [14]. Second-order spatial accuracy is obtained through a least squares reconstruction. The numerical fluxes at each element face are computed using various exact and approximate Riemann schemes with a default method based on HLLE++ scheme [15]. In addition, the code uses a subiterative, point-implicit method (a typical Gauss–Seidel technique) to improve the temporal accuracy. Some of the turbulence models available within Kestrel include Spalart–Allmaras (SA) [16], Spalart–Allmaras with rotational/curvature correction (SARC) [17], Menter’s SST [18], and Delayed Detached Eddy Simulation (DDES) with SARC [19].
Some Kestrel capabilities used in this study are briefly described.
3.1. Body Assembly
The payload-chute are simulated using body assembly tools implemented in Kestrel. McDaniel et al. [20] detailed the process of positioning of multiple bodies in inertial space at user-specified locations. This could become a complex task when bodies of different frame of references and coordinate systems need to be assembled. Note that bodies are setup from “definitions”, which contain the grid details and physical properties such as mass and moments of inertia. Bodies can then been assembled by translations and rotations. For example, the large CONEX grid is a definition and then Payload1 and Payload2 are assembled by using body tools in Kestrel (U.S DoD HPCMP, CREATE Program) each have a translation/rotation from defined grid. An advantage of such approach is that moments of inertia could be input for the original grid or definition and not needed for each rotated or translated body. Kestrel automatically calculates moments of inertia for a rotated and translated body. A parent/child body assembly is very helpful to model fins, store separation, etc. Parent is in the inertial reference frame. Parent could be setup as a “Meshless” body with a defined frame of reference and coordinate system. In this case, all children outputs are reported in the meshless reference frame.
3.2. Rigid Body Motion
It is highly recommended to use a parent/child body assembly for rigid body motions. It is much easier to specify the motion of a body relative to its parent vs. specifying it inertially. For example, it would be desirable to provide store motion relative to an aircraft. The end goal of the rigid-body motion in a simulation is to properly position the coordinates of the nodes of the mesh defining the body for the flow solver. The nodes of all meshes in the simulation must be in a consistent reference frame and coordinate system for the flow solution. Instead of attempting to compute and apply a relative rigid-body motion increment for each mesh node at each time step, all rigid-body motion in Kestrel is computed as a single translation/rotation from the initial position. This is performed by storing the position vectors of each node in the mesh, or said a different way, storing the mesh node positions in a body-fixed coordinate system.
Two types of motions are used in this study: (1) prescribed-body motion and (2) responding-body motion. The prescribed-body motion allows prescribing a time-dependent rigid movement of the computational grids. The motion is 6DOF with rotations in pitch, yaw, or roll directions and translation in three directions. Arbitrary motions could input to the code using external files that contain time instants and Euler angles and mesh reference point at each time instant. Kestrel then reads these data and interpolates them to the current simulation time to generate the required basis vectors. Some available motion types include: constant rate pitch/yaw/roll, sinusoidal, pitch/yaw/roll motion with time varying amplitude and frequency, ramp, and step motions [13].
In the responding-body motion, weight and balance data of moving bodies are needed. As the motion begins, the body position and orientation at the next time step are calculated form acting aerodynamic and external forces as well as gravitational forces and moments. The grid is then moved to the new position in order to estimate the new aerodynamic forces and moments. User-defined constraints of “ball”, “hinge”, and “rail” could be use to limit motion degrees of freedom. Contact-collision capability has been recently implemented for the proper handling of bodies in contact [20].
3.3. Catenary Modeling
The catenary capability brings the computational models of ropes or cables into Kestrel. Any number of cables could be modeled; each cable could have an end-point fixed to a body or a floating in inertial space. Cables are modeled in the form of uniformly distributed nodes each has a mass portion of total cable mass and interconnected to neighboring nodes via a tension force in a straight line. Node motions follow the Newton’s Second Law. Tension force is calculated from distance between nodes and user-specified modulus of elasticity and diameter for each cable. Weight and cable aerodynamic forces are included as well. Aerodynamic forces are estimated from circular cross-section equations developed by Hoerner [21]. Note that cable models do not include aerodynamic effects and therefore do not impact the flow solutions, e.g., no additional drag and no shedding wake captured behind the cables.
4. Computational Setup
Table 1 documents the relevant flow conditions. These conditions are consistent with U.S. Air Force heavy airdrop procedures, as verified with subject matter experts. All simulations described below have all been conducted with these flow conditions.

Table 1.
Simulation flow conditions.
For Deck angle , Payload4 is extracted using cables and extraction lines attached to a 28 ft ring-slot chute. For Deck angles , Payload1, Payload2, and Payload4 are released at time zero (after 6000 startup iteration) and will move inside the cargo bay using gravitational forces. In the second simulation setup, an initial ejector and a friction force are applied to all payloads in order to make simulation conditions closer to the flight test data.
For all simulations, spatial accuracy is second-order computed with the HLLE++ inviscid flux scheme and LDD+ viscous flux scheme. All simulations include 6000 startup iterations in which all bodies will remain stationary. The simulation time during these startup iterations remains zero. Turbulence model of SARC-DDES was used. In these simulations, time step is 0.001 s, 5 Newton subiterations was used and temporal damping was 0.01.
An adaptive mesh refinement technique was used in which C-17, chute, and CONEX subset grids are overset on a background Cartesian grid. The Cartesian grid solver uses fifth-order spatial accuracy, second-order temporal accuracy, and uses Scaled-Q criterion to refine grids in the specified region. The Cartesian extent is shown in Figure 6 with solid red lines. Two refinement regions were specified: one which covers the space from the outboard engines until a downstream location at four ramp width distance behind the ramp’s end. This region covers all four engines, and a large space below C-17 aircraft in the estimated path of released payloads. The second refinement region covers the space around the chute. These refinement regions move with moving chute. Mesh refinement begins at time step 3000 with a frequency of 250.
For the chute-payload system motions, a chute with mass of 0.1036 snail and moments of inertia of 795, 2224, 2241 snail. for are used. Payload4 has a mass of 59.48 snail and moments of inertia of 221,374, 428,274, 338,460 snail. for . Payload1 and Payload2 have a mass of 64.47 snail and moments of inertia of 241,702, 612,178, 518,105 snail. for .
In more detail, Table 2 describes simulation runs. Runs 1a and 1b are gravity airdrops at deck angles of and , respectively. Neither ejection nor friction forces are modeled in these simulations. Payloads 1, 2, and 4 begin to move slowly due to gravity. A rail constraint was defined for these payloads in which payload only moves in the cargo bay axial direction without any rotation and side and vertical translations. Rail constraints are set to 761, 479, and 209 inches for Payload2, Payload1, and Payload4, respectively. Exit velocity and duration from Run1a are compared with flight test data. Simulation predictions have different exit velocities specially for Payload 2 due to the lack of friction modeling. Subsequently, Run2a and Run2b were set up to include estimations of ejection and friction forces, allowing for better alignment with flight test data. These forces were estimated using motion equations based on given parameters such as distance, exit velocity, and exit time. The ejection force, friction, and ejection period were calculated to ensure the motion data matched the available test data. For all payloads, friction and ejection forces were assumed to be constant, which is a current limitation of the CFD solver. It is assumed that ejection force is applied for about 0.45 s and then the friction force slows down payloads. A friction force of 1000 lb and an ejection force of 3800 lb were applied for Simulations Run2a and Run2b. In Run3, C-17 has a deck angle of . Payload4 is attached to the chute suspension line with four cable. The chute pulls Payload4 out of C-17 aircraft. No ejection or friction forces are modeled in this case.

Table 2.
Simulation runs.
The Catenary utility in Kestrel is used to model cables for suspension and extraction lines and those attached to the payloads. All cables are assumed to have steel properties with an estimated mass from the length and a diameter of 0.125 in. Extraction line is modeled with a 1840 in length cable attached to two floating points. One floating point is initially located above the top surface of Payload4. The second floating point is at Chute confluence point which is 40 ft in the front of the vent. Four 240 in long cables attach the suspension line to the four top corners of Payload4. There are 36,413 in cables that attach confluence point to the chute skirt. These lines are shown in Figure 6.
5. Results and Discussions
First, simulations show Run1a Trajectory data in Figure 9. In this run, C-17 is at deck angles and payloads are extracted using gravity. Payload4 is shown by blue, Payload2 is shown by red, and finally Payload1 is shown by green. Figure 9 shows payloads follow expected trajectories of projectiles; the payloads at further distance have larger exit velocities and therefore have a smaller dropping rate. Due to positions and similar geometries of Payloads 1 and 2, they have closer trajectories compared with Payload4.
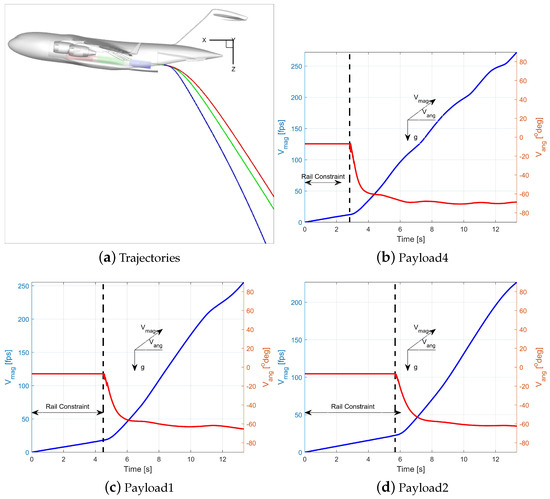
Figure 9.
Trajectory, velocity, and exit data for Run1a with no chute, no friction, and no ejection. Deck angle is .
Note that Figure 9 only shows simulation data. The measured data were limited to exit velocity and exit time. These values represent the simulation time and velocity data following the removal of the rail constraint in the simulation plots. Despite this, the available simulation figures provide valuable insights that cannot be gathered from flight test data alone. They illustrate the container’s trajectory as it exits the C-17, along with velocity time histories and the precise moment and speed at which the cargo departs the aircraft. Additionally, they capture how velocity and angles evolve after the container leaves the aircraft.
In summary, these simulations offer a framework for studying cargo exit dynamics and identifying potential premature exit scenarios. This allows for more informed decisions regarding aircraft deck angle, flow conditions, and ejection forces, reducing the risk and cost of conducting expensive and hazardous flight tests. A premature exit could cause damage to both the cargo and the aircraft.
Figure 9b–d show the velocity magnitudes and angles for each payload. All of these plots feature dual Y-axes: the left Y-axis, in blue, represents the velocity magnitude, while the right Y-axis, in red, shows the velocity angle. Please note that the plot colors correspond to their respective Y-axis definitions. Note that all payloads undergo a nearly constant acceleration (velocity slopes) when there are inside the cargo bay. This acceleration corresponds to , especially for Payloads 1 and 2. After leaving the cargo bay and completing the rail constraints, payloads will experience gravitational and aerodynamic forces and therefore the velocity slopes change. Note that the acceleration rate after the rail constraint is not 32.17 , but smaller, because of the drag forces. The velocity angle indicates the angle between velocity and horizontal line and is positive when the velocity vector is above the horizon. In this definition, a free-fall has − angle. Figure 9b–d show that all payloads have a constant velocity angle of about − while they are moving inside the C-17 cargo bay. The velocity angle suddenly drops after the ramp and eventually reach angles about −.
In addition, Figure 10 shows the payload rotations during Run1a. Again, trends follow what observed during flight tests. These payloads are expected to show a clock-wise pitch rotation after leaving C-17 aircraft. Positive pitch rates in the predicted plots show clock-wise rotations as well. Note that Kestrel reported pitch angle is in the range of [−–], and a drop in the pitch rate at means a continues pitch rotation. Additionally, a higher exit velocity leads to a smaller rotation rate. Figure 10 shows that Payload2 has the smallest rate and Payload4 has highest pitch rotation rates. Payload4 shows a continues negative roll to −, at which the roll sign changes to for further roll rotations. Payload2 shows a positive roll and Payload1 shows a negative roll as well.
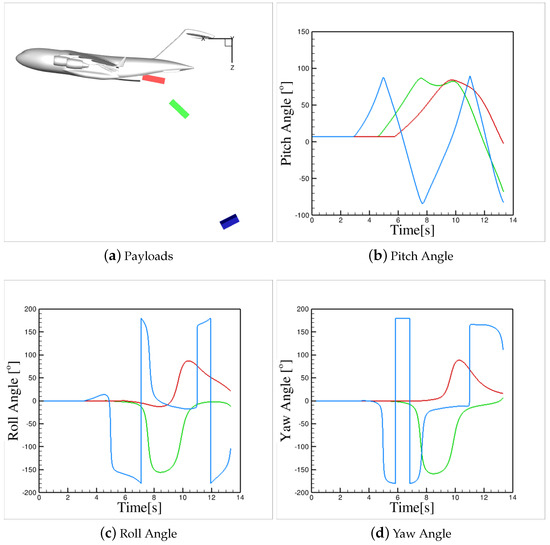
Figure 10.
CONEX rotations during Run1a with no chute, no friction, and no ejection. Deck angle is .
Finally, Figure 11 shows the flow-field around C-17 and payloads at different exit times. Vorticity Iso-surfaces are shown and colored by velocity magnitude values. Note that there there is a large wake predicted behind the ramp and engine exhaust flow, which extends to the refinement region boundary behind the ramp. A large separation wake is formed behind payloads in the free-stream conditions. The wake region changes with payload orientation. Please note that the flow over prismatic shapes is primarily governed by separation and reattachment regions, which are influenced by factors such as the side ratio (length-to-height), Mach number, Reynolds number, and angle of attack. The sharp upstream corners of rectangular prisms cause airflow separation, leading to increased aerodynamic instability. This separation creates a free shear layer that generates vortices and heightens pressure drag. The aerodynamics of rectangular containers in the wake of the C-17 and its engine exhaust are highly complex and unsteady. The wake can significantly alter the characteristics of the separation and reattachment lines, resulting in different moment coefficients and increased instability of the container. This reader is referred to Ref. [22] for more details of the aerodynamics of rectangular prisms.
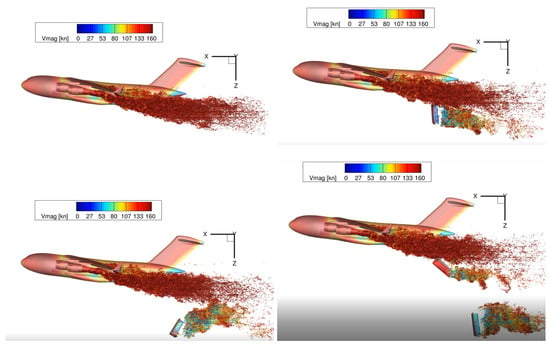
Figure 11.
Vorticity iso-surfaces of C17-payload system. Deck angle and gravity drop.
In more detail, Table 3 compares the exit velocity and duration of different runs with any available flight test data. Run1a using gravity to extract payloads lead to larger exit velocities, especially for Payload2 which is located at the furthest distance form the ramp. Velocity is linearly increases with time. In order to better match exit data with flight test data, Run2a was set up in which an ejection force and a friction force imposed to all payloads. The amount of friction and ejection was assumed to be similar for all payloads. Friction force was set to 1000 lb and the ejection force to 3800 lb.

Table 3.
Exit velocity and duration from CFD and flight test data.
Figure 12 shows trajectories and plots of velocity magnitudes and angles for Run2a. Trajectories slightly change from Run1a due to lower exit velocities. Exit velocities and duration are again given in Table 3. Run2a shows smaller velocities and comparable data with flight test data specially for Payloads 2 and 1. Figure 12 shows two different velocity slopes during rail constraints. The first slope seen until 0.5 s is due to the ejection force. Then, the slope decreases due to the removal of ejection force and including the friction force. The acceleration rate after ejection is about 3 , which is less than Run1a data. Velocity angles follow similar trends to Run1a.
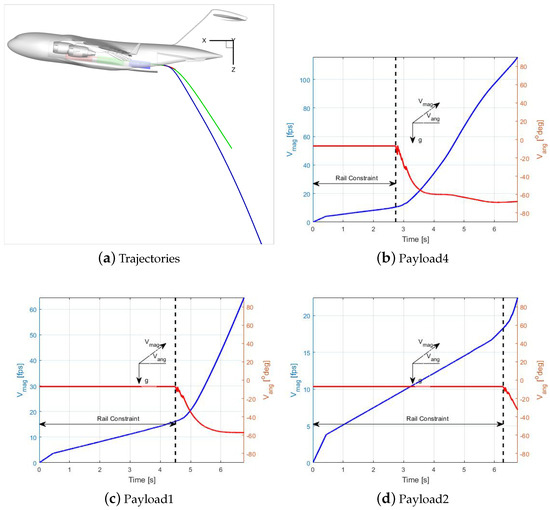
Figure 12.
Trajectory, velocity, and exit data for Run2a with no chute but with friction, and ejection. Deck angle is .
Figure 13 and Figure 14 show trajectories and plots of velocity magnitudes and angles for Run2b. This is similar to Run1a, but the deck angle was set to . Predictions show that due to smaller gravitational component (because of smaller deck angle) acting on payloads, they have smaller exit velocity and longer time to clear the ramp end. Exit data are given in Table 3. Figure 14 illustrates that all payloads experience a clockwise pitch rotation upon exiting the C-17 aircraft. The highest pitch rotation rate is observed for “payload4” (represented by the blue CONEX), which has the lowest exit velocity due to its shorter release distance. In contrast, “payload2” (the red CONEX) exhibits the smallest rotation rates in both the roll and yaw directions.
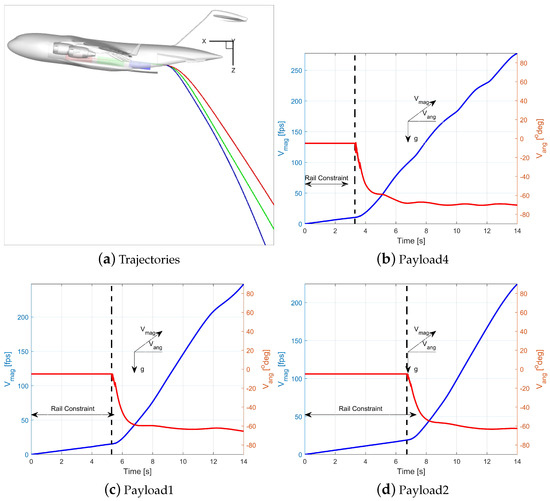
Figure 13.
Trajectory, velocity, and exit data for Run2b with no chute but with friction, and ejection. Deck angle is .
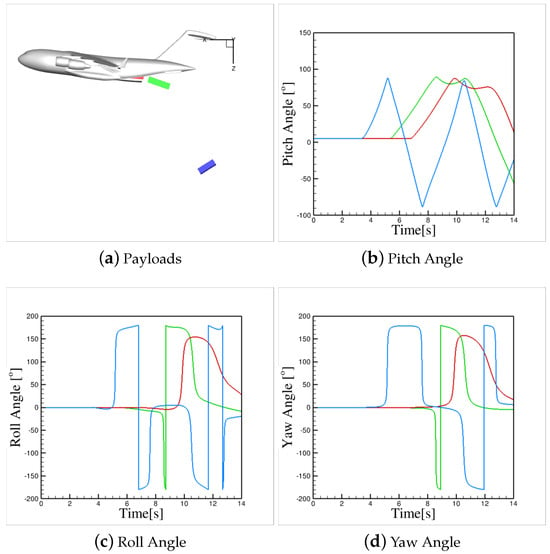
Figure 14.
CONEX rotations during Run2b with no chute but with friction, and ejection. Deck angle is .
Finally, Figure 15 shows velocity data and Euler angles of Payload4 leaving a C-17 aircraft with zero-deg deck angle using a Chute and suspension line. Payload will go under a sudden acceleration due to Chute drag force. Payload acceleration is about 36.5 . Payload clears the ramp end with 39.22 fps exit velocity during 1.075 s. Acceleration correlates with predicted drag chute coefficient of 0.714 reported in Ref. [5].Chute drag is about 30,000 lb force. Figure 15 shows that Chute exit path has less negative angles than previous runs. Payload moves at an angle of − relative to horizon at simulation time of 2.3 s. Payload undergoes positive pitch (clock-wise rotation), positive roll, and positive yaw as well. Figure 16 shows chute/payload orientations at positions at different simulation time. Note that the chute moves to the right due to drag and it drops as simulation time progresses due to its weight.
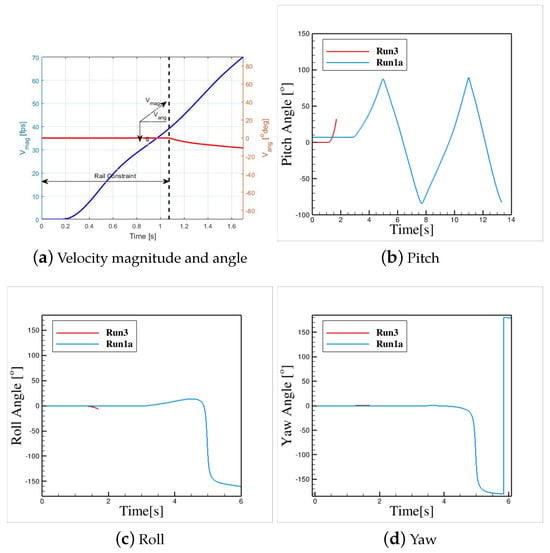
Figure 15.
Velocity, and Euler angles for Run3 with chute and cables. Deck angle is .
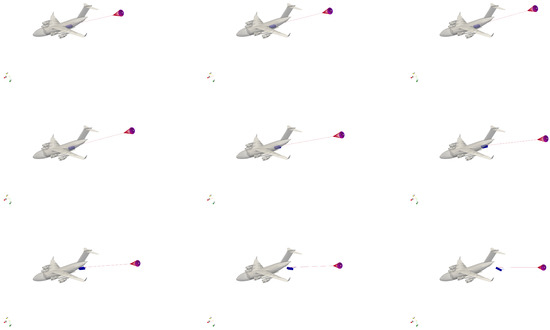
Figure 16.
Payload–chute system modeling.
6. Conclusions
This article established a framework for simulation of payload extractions during gravity or chute-extraction airdrop operations. Simulations were run for C-17 ramp airdrops at three different deck angles. Three CONEX geometries were studied. These payloads have different size, mass properties, and are standing at different positions relative to the ramp end. An adaptive mesh refinement technique was used to capture the flow-field for engine exhaust and wakes behind aircraft and payload. Simulations were run with and without ejection and friction forces. In gravity-only airdrops, exit velocities are larger than those measured during flight testing. Payloads with further distance from the ramp will have larger exit velocities and therefore slower drop rate and rotation rates. Acceleration inside cargo bay is mainly due to gravity because predicted acceleration data match with gravity component in the direction of movement. This means aerodynamic forces are negligible inside the cargo bay. Once the payloads leave the aircraft, they will subject to gravity acceleration and drag forces acting on the bodies. Payloads trajectory paths show a sudden drop and then they reach a velocity angle of about − relative to the horizon.
In order to better match exit data with flight test measurements, an ejection force and friction were modeled as constant external forces. Ejection is applied for initial 0.45 s. Similar ejection and friction amount were used for payloads and simulations at deck angle 5 degrees. Using external forces, payloads undergo an initial acceleration and then a slower acceleration due to friction. Predicted exit data match better with measurements for all payloads.
For zero-deg deck angle, a chute was placed 180 ft behind the ramp end. This chute undergoes responding body motions due to its aerodynamic forces/moments and weight. Chute is then connected to the suspension line using 36 cables all assumed to be steel. Suspension line is then connected to another floating point, which is connected to the payload using four cables. Simulations show that payload is extracted from the cargo bay with an acceleration that correlated with chute drag force from previous studies. Payload have a much larger exit velocity and shorter exit time compared with gravity airdrop cases.
Author Contributions
Investigation, M.G. and K.B.; Resources, J.S.; Writing—original draft, M.G.; Writing—review & editing, K.B. All authors have read and agreed to the published version of the manuscript.
Funding
Mehdi Ghoreyshi was funded by the U.S. Air Force Academy under agreement number FA7000-20-2-0014.
Data Availability Statement
Data is contained within the article.
Acknowledgments
Mehdi Ghoreyshi sponsorship is through the US Air Force Academy under agreement number FA7000-20-2-0014. Material presented in this article is a product of the HPCMP -AV project sponsored by the U.S. Department of Defense HPC Modernization Program Office. The authors would like to acknowledge the support received from Jake Allen and Dan Prosser of CREATE-AV Quality Assurance team for body assembly and modeling cables for this study. This article was approved for public release by USAFA under PA#: USAFA-DF-2024-661.
Conflicts of Interest
The authors declare no conflicts of interest.
Nomenclature
| drag, lift, and side force coefficients in stability axis | |
| pitch, roll, and yaw moment coefficients in stability axis | |
| pressure coefficient | |
| c | mean aerodynamic chord, m |
| M | Mach number |
| Reynolds number, | |
| t | time, s |
| velocity components in x,y,z directions, m/s | |
| V | velocity, m/s |
| free-stream velocity, m/s | |
| aircraft position coordinates, in |
References
- Mudrak, J. Development of a parachute deployment model for airdrop simulations. In Proceedings of the Interservice/Industry Training, Simulation, and Education Conference (I/ITSEC), Orlando FL, USA, 28–30 November 2016. Paper, number 16133. [Google Scholar]
- Bergeron, K.; Ghoreyshi, M.; Larsen, E.; Jirasek, A.; Rose, T.M.; Noetscher, G. Near-Body/Cartesian Off-Body Simulations for C-17 and Extraction Parachute. In Proceedings of the AIAA AVIATION 2020 FORUM, Virtual, 15–19 June 2020. [Google Scholar] [CrossRef]
- Noetscher, G.; Ghoreyshi, M.; Rose, T.M.; Jirasek, A.; Bergeron, K. Optimization of Extraction Line Distance for Ringslot Parachute Extraction of Heavy Cargo from C-17. In Proceedings of the AIAA Scitech 2021 Forum, Virtual, 11–15 & 19–21 January 2021. [Google Scholar] [CrossRef]
- Bergeron, K.; Ghoreyshi, M.; Noetscher, G.; Jirasek, A.; Rose, T. Computational Study and Modeling of Single and Clustered Parachutes in the Wake of an Aircraft. In Proceedings of the AIAA AVIATION 2021 FORUM, Virtual, 2–6 August 2021. [Google Scholar] [CrossRef]
- Ghoreyshi, M.; Bergeron, K.; Jirasek, A.; Seidel, J.; Noetscher, G. Investigation of New HPCMP CREATETM-AV Kestrel Capabilities for Simulation of Extraction Parachutes. In Proceedings of the AIAA AVIATION 2022 Forum, Chicago, IL, USA, 27 June–1 July 2022. [Google Scholar] [CrossRef]
- Morton, S.A.; McDaniel, D.R. A fixed-wing aircraft simulation tool for improving DoD acquisition efficiency. Comput. Sci. Eng. 2015, 18, 25–31. [Google Scholar] [CrossRef]
- Hine, D.; Forsythe, J.; Hallissy, B.P.; Shafer, T.; Laiosa, J.P. Fundamental Physics Validation Using CREATE-AV KestrelTM Part I. In Proceedings of the 52nd Aerospace Sciences Meeting, National Harbor, MD, USA, 13–17 January 2014. [Google Scholar] [CrossRef]
- Holst, K.R. HPCMP CREATE-AV Kestrel Entries to the High-Fidelity CFD Verification Workshop. In Proceedings of the AIAA SCITECH 2024 Forum, Orlando, FL, USA, 8–12 January 2024. [Google Scholar] [CrossRef]
- McDaniel, D.R.; Nichols, R.H.; Eymann, T.A.; Starr, R.E.; Morton, S.A. Accuracy and Performance Improvements to Kestrel’s Near-Body Flow Solver. In Proceedings of the 54th AIAA Aerospace Sciences Meeting, San Diego, CA, USA, 4–8 January 2016. [Google Scholar] [CrossRef]
- Glasby, R.S.; Erwin, J.T. Introduction to COFFE: The Next-Generation HPCMP CREATETM-AV CFD Solver. In Proceedings of the 54th AIAA Aerospace Sciences Meeting, San Diego, CA, USA, 4–8 January 2016. [Google Scholar] [CrossRef]
- Eymann, T.A.; Nichols, R.H.; Tuckey, T.; McDaniel, D.R. Cartesian Adaptive Mesh Refinement with the HPCMP CREATE™-AV Kestrel Solver. In Proceedings of the 53rd AIAA Aerospace Sciences Meeting, Kissimmee, FL, USA, 5–9 January 2015. [Google Scholar] [CrossRef]
- Glasby, R.; Erwin, J.; Eymann, T.; Nichols, R.; McDaniel, D.; Karman, S., Jr.; Stefanski, D.; Holst, K. Results from DoD HPCMP CREATETM-AV Kestrel for the 3rd AIAA High Lift Prediction Workshop. In Proceedings of the 2018 AIAA Aerospace Sciences Meeting, Kissimmee, FL, USA, 8–12 January 2018. [Google Scholar] [CrossRef]
- Morton, S.A.; Tillman, B.; McDaniel, D.R.; Sears, D.R.; Tuckey, T.R. Kestrel–A Fixed Wing Virtual Aircraft Product of the CREATE Program. In Proceedings of the 47th AIAA Aerospace Sciences Meeting including The New Horizons Forum and Aerospace Exposition, Orlando, FL, USA, 5–8 January 2009. [Google Scholar] [CrossRef]
- Godnov, S. A difference scheme for numerical computation of discontinuous solution of hydrodynamic equations. Math. Sb. 1959, 47, 271–306. (In Russian) [Google Scholar]
- Tramel, R.; Nichols, R.; Buning, P. Addition of improved shock-capturing schemes to OVERFLOW 2.1. In Proceedings of the 19th AIAA Computational Fluid Dynamics, San Antonio, TX, USA, 22–25 June 2009. [Google Scholar] [CrossRef]
- Spalart, P.; Allmaras, S. A one-equation turbulence model for aerodynamic flows. In Proceedings of the 30th Aerospace Sciences Meeting and Exhibit, Reno, NV, USA, 6–9 January 1992. [Google Scholar] [CrossRef]
- Spalart, P.; Shur, M. On the sensitization of turbulence models to rotation and curvature. Aerosp. Sci. Technol. 1997, 1, 297–302. [Google Scholar] [CrossRef]
- Menter, F.R. Eddy viscosity transport equations and their relation to the k-ε model. ASME J. Fluids Eng. 1997, 119, 876–884. [Google Scholar] [CrossRef]
- Spalart, P.R. Comments on the feasibility of LES for wings, and on a hybrid RANS/LES approach. In Proceedings of the First AFOSR International Conference on DNS/LES, Ruston, LA, USA, 4–8 August 1997; Greyden Press: Columbus, OH, USA, 1997. [Google Scholar]
- McDaniel, D.R. A Summary of New and Emerging Features in HPCMP CREATETM-AV Kestrel. In Proceedings of the AIAA Scitech 2021 Forum, Virtual, 11–15 & 19–21 January 2021. [Google Scholar] [CrossRef]
- Hoerner, S. Fluid-Dynamic Drag; Hoerner Fluid Dynamics: Bakersfield, CA, USA, 1965. [Google Scholar]
- Benson, R.; Bumpus, D.; Fagley, C.P.; Siefers, T.M.; Ghoreyshi, M.; Bergeron, K. Computational and Experimental Static Stability Analysis of Rectangular Prisms. In Proceedings of the AIAA SCITECH 2024 Forum, Orlando, FL, USA, 8–12 January 2024. [Google Scholar] [CrossRef]
Disclaimer/Publisher’s Note: The statements, opinions and data contained in all publications are solely those of the individual author(s) and contributor(s) and not of MDPI and/or the editor(s). MDPI and/or the editor(s) disclaim responsibility for any injury to people or property resulting from any ideas, methods, instructions or products referred to in the content. |
© 2024 by the authors. Licensee MDPI, Basel, Switzerland. This article is an open access article distributed under the terms and conditions of the Creative Commons Attribution (CC BY) license (https://creativecommons.org/licenses/by/4.0/).