Article

Liquid Rocket Engine Performance Characterization Using Computational Modeling: Preliminary Analysis and Validation

1
Aerospace Center, Department of Aerospace and Mechanical Engineering, The University of Texas at El Paso, El Paso, TX 79968, USA
2
AMIIC, 5021 Technology Dr NW Suite E, Huntsville, AL 35805, USA
*
Author to whom correspondence should be addressed.
Aerospace 2024, 11(10), 824; https://doi.org/10.3390/aerospace11100824
Submission received: 6 September 2024 / Revised: 2 October 2024 / Accepted: 7 October 2024 / Published: 8 October 2024

Abstract

:
The need to refuel future missions to Mars and the Moon via in situ resource utilization (ISRU) requires the development of LOX/LCH4 engines, which are complex and expensive to develop and improve. This paper discusses how the use of digital engineering—specifically physics-based modeling (PBM)—can aid in developing, testing, and validating a LOX/LCH4 engine. The model, which focuses on propulsion performance and heat transfer through the engine walls, was created using Siemens’ STAR-CCM+ CFD tool. Key features of the model include Eulerian multiphase physics (EMP), complex chemistry (CC) using the eddy dissipation concept (EDC), and segregated solid energy (SSE) for heat transfer. A comparison between the complete GRI 3.0 and Lu’s reduced combustion mechanisms was performed, with Lu’s mechanism being chosen for its cost-effectiveness and similar output to the GRI mechanism. The model’s geometry represents 1/8th of the engine’s volume, with a symmetric rotational boundary. The performance of this engine was investigated using NASA’s chemical equilibrium analysis (CEA) and STAR-CCM+ simulations, focusing on thrust levels of 125 lbf and 500 lbf. Discrepancies between theoretical predictions and simulations ranged from 1.4% to 28.5%, largely due to differences in modeling assumptions. While NASA CEA has a zero-dimensional, steady-state approach based on idealized conditions, STAR-CCM+ accounts for real-world factors such as multiphase flow, turbulence, and heat loss. For the 125 lbf case, a 9.2% deviation in combustion chamber temperature and a 15.0% difference in thrust were noted, with simulations yielding 113.48 lbf compared to the CEA’s 133.52 lbf. In the 500 lbf case, thrust reached 488 lbf, showing a 2.4% deviation from the design target and an 8.6% increase over CEA predictions. Temperature and pressure deviations were also observed, with the highest engine wall temperature at the nozzle throat. Monte Carlo simulations revealed that substituting LNG for LCH4 affects combustion dynamics. The findings emphasize the need for advanced modeling approaches to enhance the prediction accuracy of rocket engine performance, aiding in the development of digital twins for the CROME.

1. Introduction

LOX/LCH4 bi-propellant engines (such as Blue Origin’s BE-4 and Space-X’s Raptor engine) are currently being developed in industry for future missions to the Moon, Mars, and further into our solar system. This specific propellant combination is attractive because of its potential to be produced via in situ resource utilization (ISRU), specifically on Mars, where methane has been detected [1,2,3]. The ability to produce propellants on Mars directly from the planet’s atmospheric CO2 and available water sources is a key enabler for sustainable human presence. This will remove the necessity of having to worry about running out of fuel while further away from Earth. Research into processes like CO2 capture and utilization via calcium looping [4], methane reforming, and Fischer–Tropsch synthesis shows the potential to generate methane fuel, reducing the need to transport resources from Earth. This advances technologies that aim to harness local resources for construction materials [5] and chemical feedstocks [6], critical for long-term missions. Electrochemical methods to convert CO2 into useful chemicals further reinforce the viability of LOX/LCH4 systems for efficient propulsion and energy on Mars, emphasizing their role in future deep-space missions.
However, production of these types of engines can be costly and lengthy, in contrast to the timeline given to produce and implement them into their respective spacecraft. Design, testing, and validation research for LOX/LCH4 propulsion shows the level of complexity required to evaluate the physical system. Shen and Zhou [7] evaluated the injection and combustion of LOX/LCH4 for a pintle injector. The experiment was conducted with the purpose of determining how the length of the injector from the perpendicular combustion chamber plate affects the injection and combustion process. Data were recorded through instrumentation measurements as well as with a recording system that captured the process from a window on the micro-second scale. Lechner et al. [8] discussed a test set up to determine the inner-wall temperatures for a LOX/LCH4 engine with propellants under cryogenic and combustion conditions. To measure data with a level of precision of ±30 K, the team utilized dynamic phosphor thermometry. Boué et al. [9] present the planning and execution for testing of a LOX/LCH4 engine, along with modeling and data comparison between the two. A timeline is presented that initiates with the testing of certain individual components from the engine, such as the injector and the fuel and oxidizer pumps, and finishes with the hot-fire testing of the engine, over a period of 11 years. System digitalization can reduce high complexity, cost, safety risk, testing time, and economic expenses.
As part of the implementation of digital engineering, computer modeling of the propulsion system can allow for fast model analysis, without requiring extensive testing of the physical components. This serves as a cost-effective alternative, with the tradeoff of determining the validity of the computer models made for different phenomena of the system. Tools and methods like digital twins, multiphysics simulations, and CFD/FEA models can substantially reduce the number of physical tests required, mitigate risks, and optimize design parameters, saving both time and resources. By applying digitalization, engineers can conduct virtual tests, predict system failures, and streamline the path to successful, real-world engine operation [10,11,12]. For example, Chua et al. [13] discuss how they can implement a digital model strategy to improve the scheduling and planning of a production plan. Jiang et al. [14] present a plan to establish a digital twin model through Part Digital Twin Modeling (PDTM), an effort between the designer and the customer to create a digital model that updates with data from its operation once in service. Tao et al. [10] summarize in their research how to approach digital modeling through a digital twin, and which available tools can be used to create this model. One of digital engineering’s goals is to develop a digital twin (DT), a replica of a system in a computational environment [15,16,17]. Physics simulation software, such as Finite Element Analysis (FEA) and computational fluid dynamics (CFD) simulations, can be used to replicate a system in a virtual environment. In the case of LOX/LCH4 engines, both FEA and CFD are vital computational analysis techniques, with their application varying by scenario. FEA is used for tasks like heat transfer and thermal stress analysis due to high combustion temperatures, while CFD is employed for performance evaluation related to combustion [15,18,19].
Current research on engine modeling and conjugate heat transfer simulations is constrained by model limitations. Combustion simulations require reduced reaction mechanisms to simulate chemical reactions at a lower computational cost, with a sacrifice to the validity of the model. Blanchard et al. [20] and Schneider et al. [21] discuss research that focuses on analyzing reduced chemistry models for oxygen/methane combustion, as well as the benefits and limitations found when compared to non-reduced models. Their conclusion mainly identifies how much fidelity is sacrificed to gain a reduction in the computational power required for the model. Similar observations are seen when implementing a solid component in the simulation, which increases cell quantity, thus increasing the computational cost. Potier et al. [19] and Leccese et al. [22] consider a similar model, where a fraction of the engine is used to simulate combustion and conjugate heat transfer across the engine for a ribbed-wall combustion chamber. Song and Sun [23] consider another model of engine with cooling channels, where only a 30-degree slice is considered to analyze combustion and heat transfer as well. Kose et al. [24] conducted a one-dimensional combustion analysis to identify thermophysical properties and create thrust chamber profiles for both a liquid oxygen (LOX)/liquid methane (LCH4) engine and a LOX/liquid propane (LPC3H8) engine. Their results suggest that a higher oxidizer mass flow rate improves cooling performance. They also found that cooling the LOX/LPC3H8 engine is somewhat more challenging than cooling the LOX/LCH4 engine. Pizzarelli et al. [25] examined the cooling of a LOX/LCH4 rocket engine and concluded that heat transfer could be severely affected by minor changes in operating conditions relative to nominal conditions. Remiddi et al. [26] investigated conjugate heat transfer in liquid rocket engines, highlighting limitations in the development and validation of these engines using current conjugate heat transfer models. Also, the software used for this type of modeling can be very narrow or specific for each case, which makes it difficult to reproduce and further improve on in a different software package. This leaves room for not only improving the models but expanding the application to different software and the approaches used within.
To overcome the above limitations, this paper introduces a model designed to predict steady-state combustion and heat transfer in a liquid oxygen/liquid methane (LOX/LCH4) engine, known as the Centennial Restartable Oxygen–Methane Engine (CROME). The engine components include manifolds and lines made from SS 316, an injector assembly fabricated from Inconel 625, and a thrust chamber and nozzle constructed from Inconel 718. Combustion modeling was initially conducted using STAR-CCM+, serving as a foundation to understand combustion behavior and to align results with Manuel Herrera’s theoretical approximations [27]. Subsequently, the solid domain was introduced to analyze conjugate heat transfer once steady-state combustion was reached.
The authors want to highlight that the novelty of this work lies in developing a comprehensive digital model for LOX/LCH4 combustion engines that integrates both combustion and conjugate heat transfer simulations within a single software environment—STAR-CCM+. Unlike previous studies that either focus on isolated components (e.g., injectors and cooling channels) or rely on reduced models that sacrifice fidelity, this research aims to produce a more holistic model that accurately predicts steady-state combustion while also considering the thermal effects on engine walls. By utilizing STAR-CCM+, which has not been extensively applied to LOX/LCH4 engine modeling before, this study explores and establishes the necessary configurations to approximate theoretical results closely. Additionally, this approach addresses the current limitations of narrow software applicability, paving the way for future advancements in engine digitalization and offering a framework that can be adapted for use in other modeling software. This dual focus on both combustion accuracy and heat transfer analysis in a unified digital environment provides a more efficient, cost-effective alternative to the traditional, time-consuming physical testing methods.

2. Methodology

The authors examined the multiphase flow and combustion characteristics of a liquid rocket engine (LOX-LCH4) using insights from theoretical analysis, equilibrium chemical analysis (CEA), and computational modeling with STAR-CCM+. It should be noted that while the theoretical analysis is not discussed in detail in this paper, it was based on established thermodynamic, heat transfer, and propulsion equations, which were employed to predict engine performance parameters such as thrust and impulse for the LOX/LCH4 engine. An equilibrium adiabatic calculation using the major species was also implemented in theoretical analysis. The CEA, a zero-dimensional, steady-state, single-phase, ideal gas, adiabatic analysis method, was used to determine engine performance parameters, including upper-bound temperature, pressure, velocity, Mach at the combustion chamber, nozzle throat, exit, etc.
The authors acknowledge that this approach represents an idealized scenario, and the results are expected to deviate significantly from real-world rocket engine performance. To capture the multiphysics flow properties and engine performance parameters over a wide range of real-world operating conditions, the authors utilized STAR-CCM+, a physics-based modeling approach. Unlike CEA, this method accounts for non-adiabatic, inhomogeneous, non-equilibrium effects and critically includes the complex behavior of two-phase flow during injection, mixing, breakdown, vaporization, interaction of liquid–gas phases, and the impact of wall heat transfer (heat loss) between the combustion chamber and surroundings. As a result, the computational fluid dynamics (CFD) predictions are expected to diverge from the theoretical and CEA results due to the inclusion of real-world physical phenomena. Nevertheless, these different approaches were integrated to provide a comprehensive assessment of engine performance, acknowledging the expected variations between them. The detailed methodologies for combustion modeling, multiphysics flow analysis, and NASA CEA are presented in the following sections.

2.1. Combustion Modeling and Associated Governing Equations

To accurately determine conditions within the combustion chamber, a method of calculating the properties of combustion within the combustion chamber is needed. To resolve this with the accuracy desired of a digital twin simulation, a form of combustion chemical analysis must be integrated with the simulation. Fortunately for this purpose, the chemistry of methane and oxygen has been well studied in recent years due to the fuel’s popularity for both legacy applications such as heating and newer applications in aerospace as a high-performance fuel mixture. While maximum performance may be acquired by combusting the propellants at or near the stochiometric oxygen/fuel (OF) ratio, to protect the engine during operation from the maximum flame temperature or oxidation from remaining oxygen radicals, the engine core combustion is fuel-rich at an OF ratio of 2.7 compared to the stochiometric OF ratio of 4 [27]. Using Cantera and the GRI 3.0 mechanism to evaluate the combustion temperature at the given OF ratio, the predicted flame temperatures for each pressure case are given in Table 1 [28].
One assumption made for the purpose of this simulation is the assumption of the fuel as pure methane (LCH4), as opposed to the liquid natural gas (LNG) the CROME is slated to use. However, this assumption is not always shown to be valid, as the presence of pollutants can noticeably alter the transport and evaporative characteristics of the liquid natural gas fuel in the high-temperature, high-pressure regime typical of rocket engines [29]. To analyze the impacts of typical pollutants on combustion, a Monte Carlo (MC) simulation was set up and run to find the impact of differing pollutant fractions on the temperature and ratio of specific heats of the post-combustion mixture. This simulation was programmed within MATLAB, with Cantera used for CEA and GRI-3.0 reaction mechanism files imported into the STAR-CCM+ for combustion modeling of methane along with pollutant compounds.
To perform such an analysis, the first thing needed is a list of pollutants considered. According to data by Dr. Foss of the University of Texas in Austin, the most common pollutants in a standard liquid natural gas mixture are the larger hydrocarbons ethane, propane, and butane, along with nitrogen and carbon dioxide dilutants [21]. For the purposes of this analysis, butane has been omitted, as the GRI-3.0 mechanism does not include C4 hydrocarbon reactions, while the typical butane mole fraction of liquid natural gas is >1%, making it relatively insignificant in the combustion process. For each pollutant, bounds of the max and minimum mole fraction in the liquid natural gas mixture are given in Table 2, with max bounds chosen to be on the high end typical of other reported liquid natural gas compositions [30,31].
To provide reference values to calculate relative errors against, Cantera was used to calculate the combustion temperature of pure methane and oxygen at an OF ratio of 2.7 and pressure of 235 psia, with an initial gas temperature of 300 K. This yields an adiabatic flame temperature of 3289.7 K and ratio of specific heat values of 1.2142. Then, to calculate the properties of the flame for a randomized composition, the mole fraction of each pollutant is calculated by Equation (1), where y is the mole fraction of compound i, with rng being a randomly generated value between 0 and 1. Minimum and maximum mole fractions are taken per substance from Table 2.
y i = y i ,   m i n + r n g ( y i ,   m a x y i ,   m i n )
After the generation of each mole fraction, the mole fraction of CH4 is calculated to be the value needed to sum the mole fractions to 100%; then, the mole fractions for each component are converted to a mass fraction via Equation (2).
x i = y i M W i 1 n y i M W i
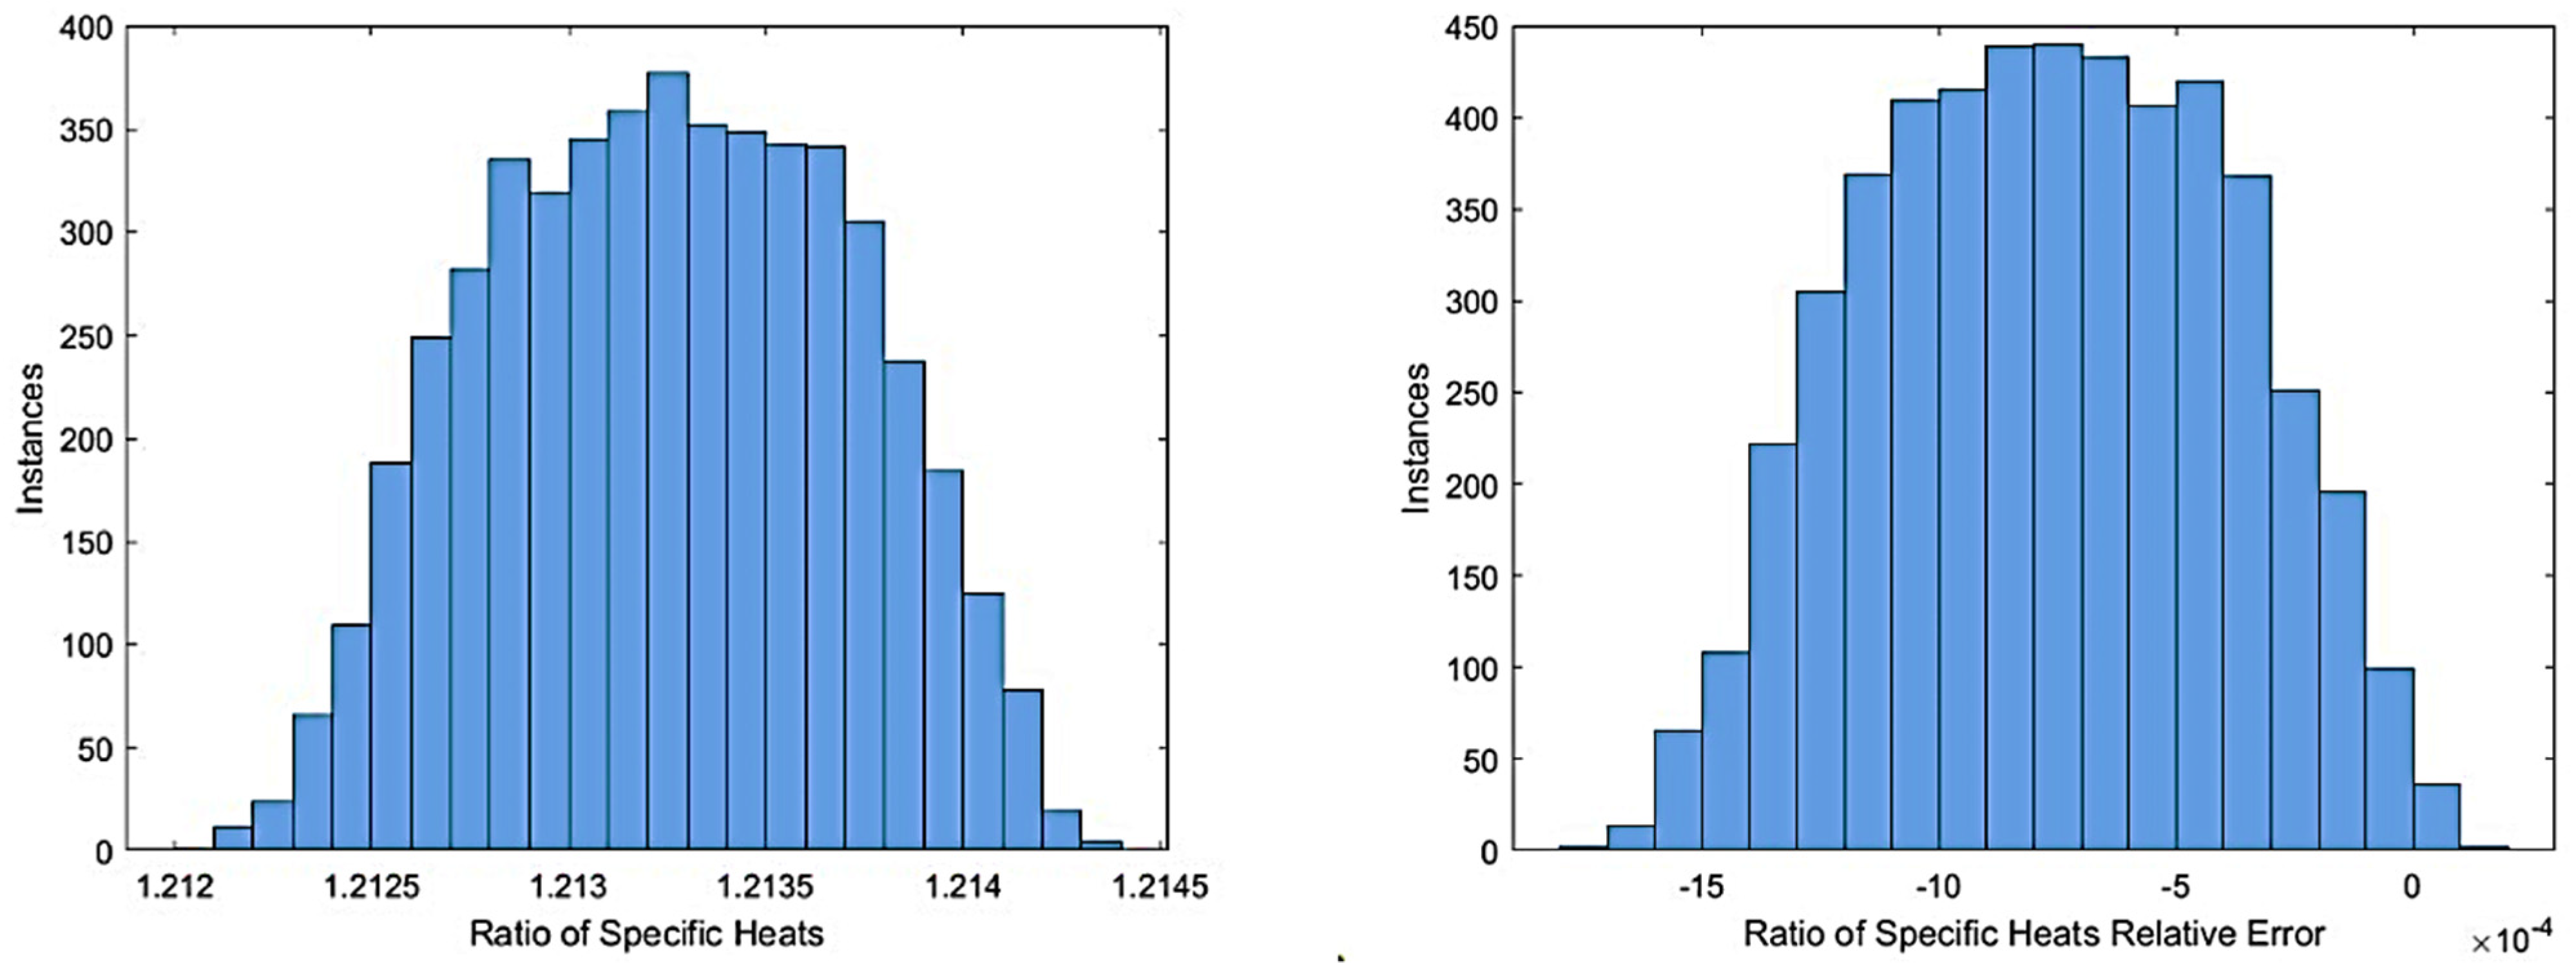
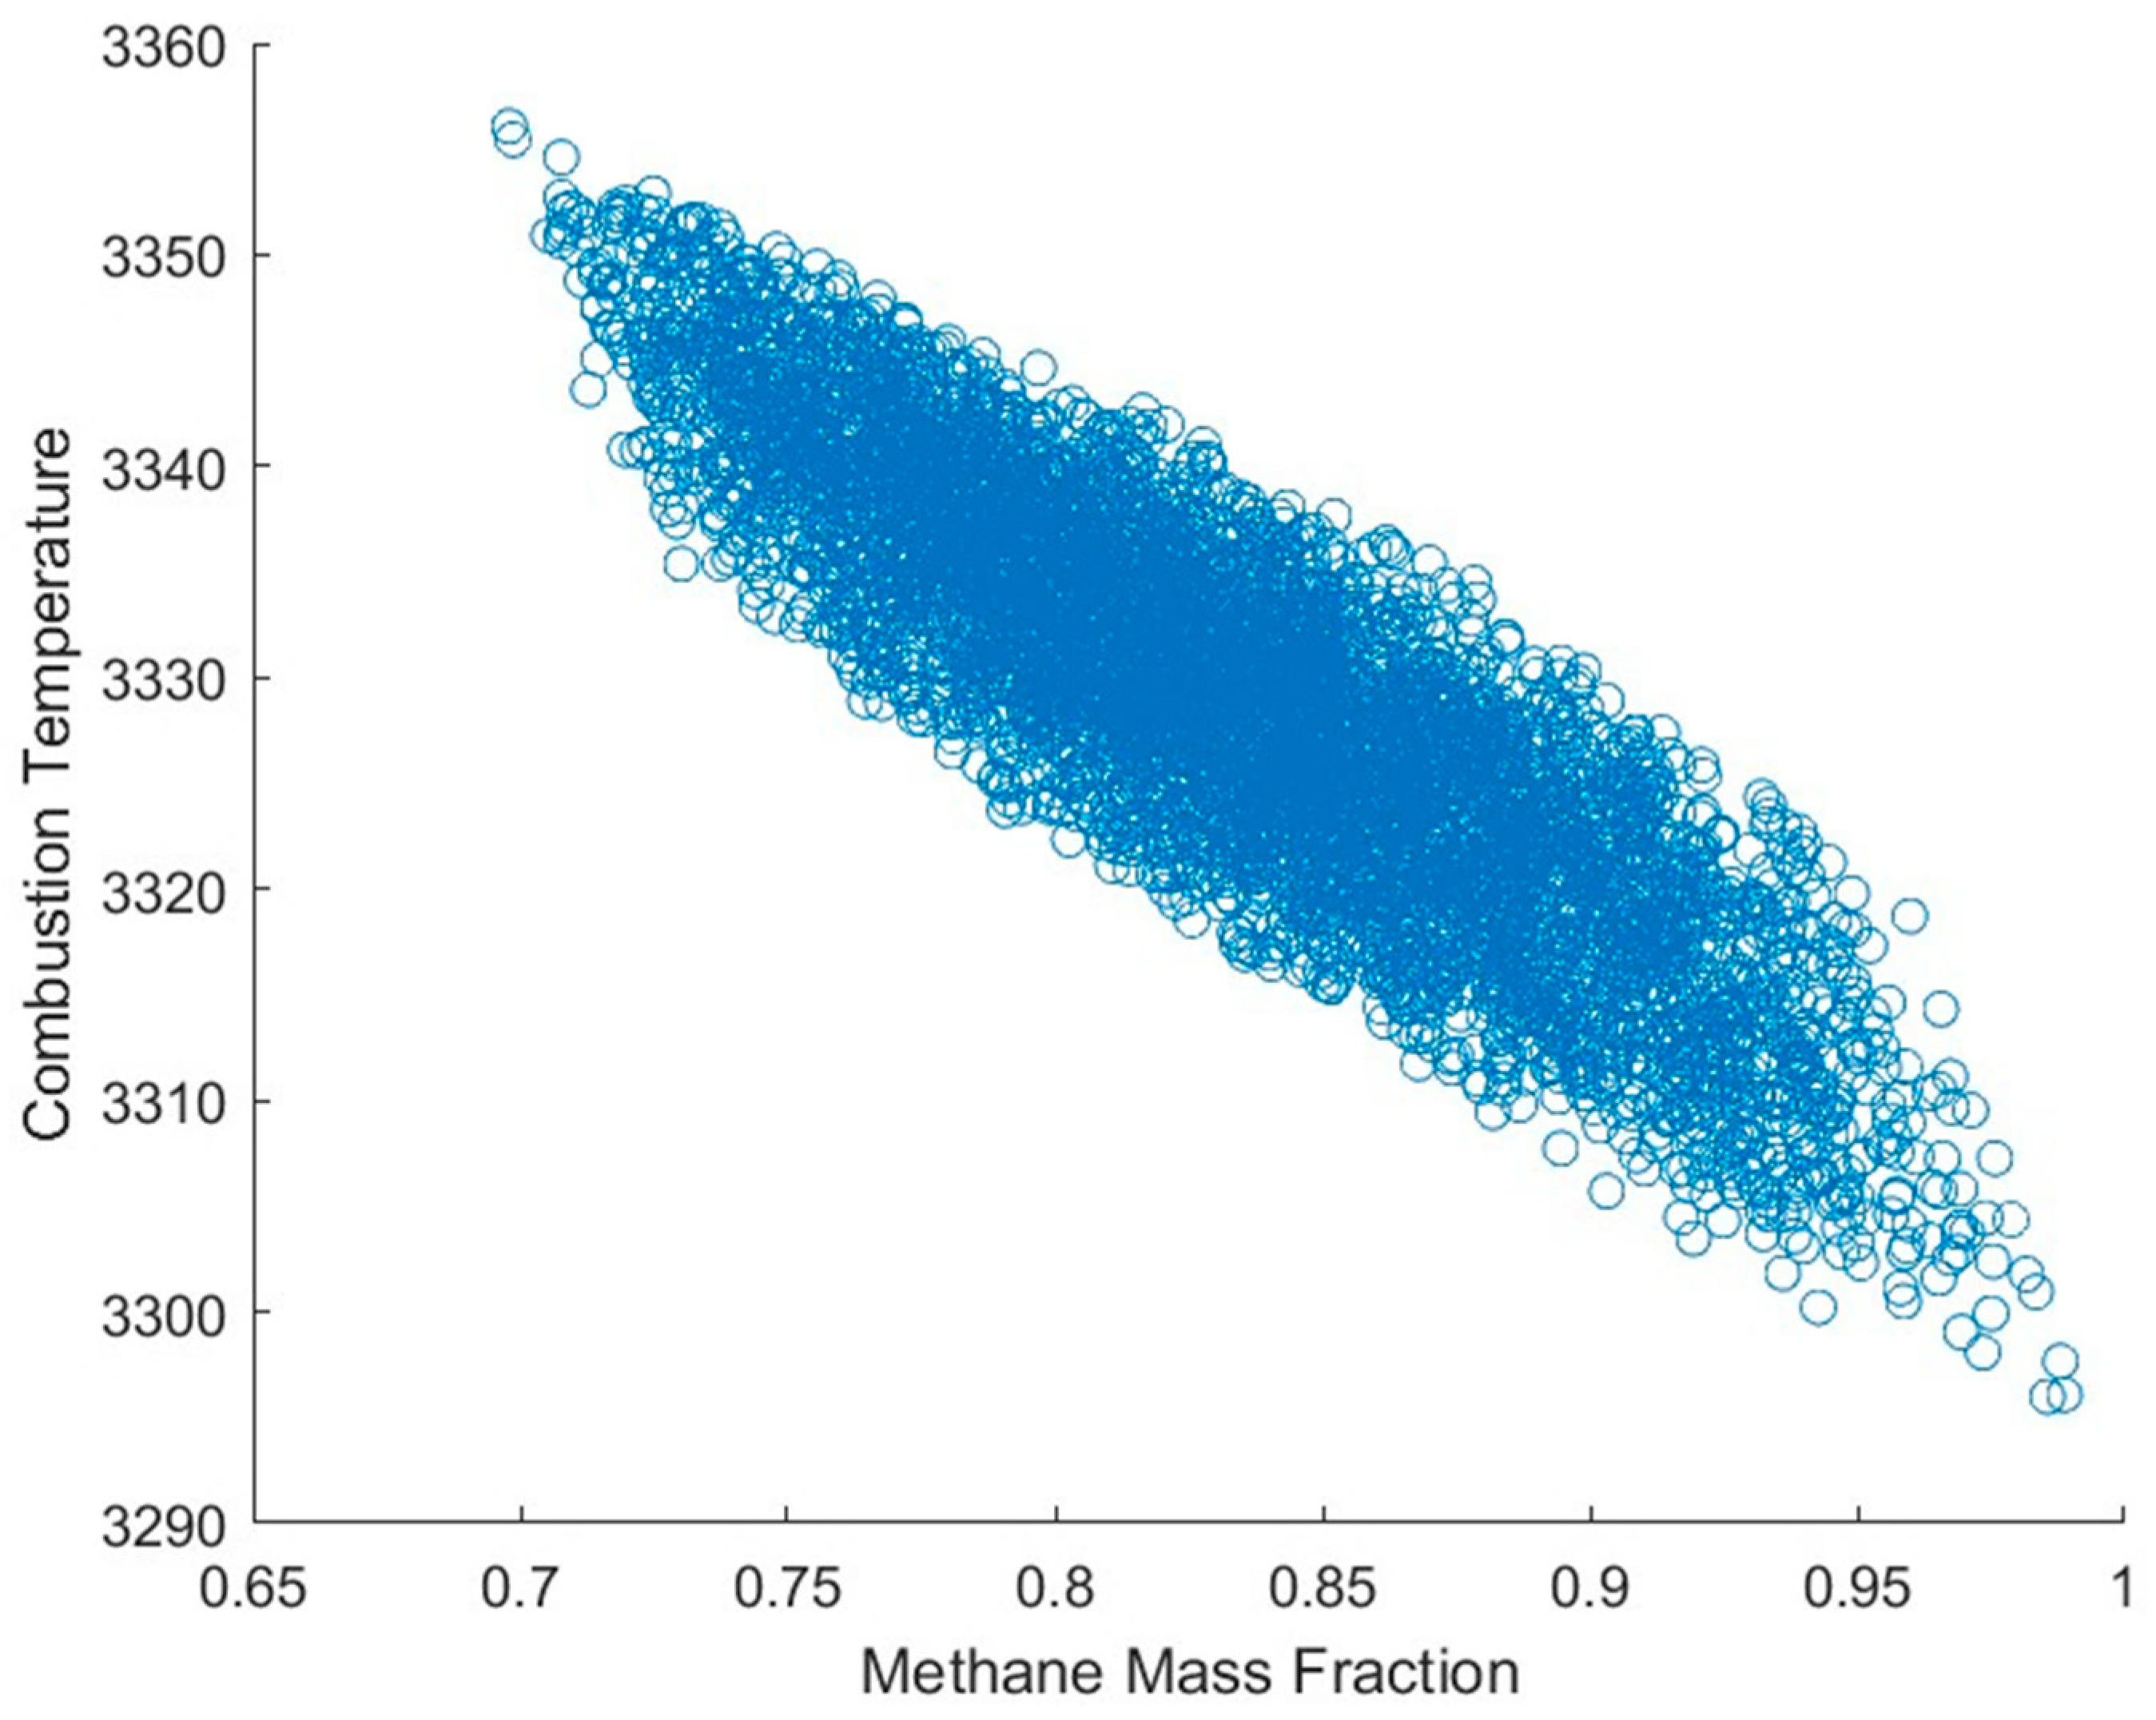
Finally, this mixture is entered into a Cantera gas object with O2 at a 2.7 OF ratio, a pressure of 235 psia, and a temperature of 300 K and calculated to chemical equilibrium at constant pressure and enthalpy to simulate combustion. This analysis was run for 5000 iterations, and the final temperature, specific heat results with relative errors, and combustion temperature compared with the methane mass fraction are shown in Figure 1, Figure 2 and Figure 3.
From these results (Figure 1, Figure 2 and Figure 3), it is shown that while fuel mixture has a noticeable impact on equilibrium combustion, the effect for combustion temperature and ratio of specific heats are within 2% and −0.2%, respectively; thus, for the initial iterations of a performance simulation, the assumption of pure methane is accurate within reasonable bounds while reducing computational complexity. Additionally, the simulation of a compositionally accurate fuel mixture requires knowledge of the fuel’s blend; as the CROME team has not finalized the vendor for the LNG, the exact composition used for testing is not known, and thus there is no way to be certain that the simulated fuel blend is realistic enough to justify it over a fully methane simulation. However, for further simulations, the accurate representation of liquid natural gas as the fuel will become more important, as the difference in saturation pressures and transport properties between constituent species can change the behavior of the fuel within the fluid feed systems, which a digital twin model would have to accurately represent [29].
For accurate modeling of combustion within the chamber, some methods of evaluating finite-rate chemistry effects within the chamber are required. For this, Star-CCM+ offers a few simulation methods, divided into two primary categories: Reacting Species Transport models (RSTMs), in which the conservation equations for each chemical species are calculated individually, and flamelet models (FLMs), in which the conservation equations are calculated for a reduced number of general chemical reaction factors, primarily the mixture fraction and mixture fraction variance [32,33,34]. Generally, flamelet models are generally less computationally intensive than the Reacting Species Transport models due to this simplification of conservation. However, flamelet models are also less accurate, especially for simulations where the mixing timescale is significant in relations to the reaction timescale, as is generally the case within rocket engine combustion, where the residence time of the reacting fluids is small [35]. Also, RSTM features a comprehensive chemistry model, allowing it to be used in various combustion scenarios (both premixed and non-premixed). It has greater dimensionality, can adapt to dynamic changes in flow conditions, fuel characteristics, and temperature, and, importantly, it incorporates transport phenomena like species diffusion and convection. This results in enhanced accuracy (higher fidelity) in predicting species distributions and flame structures compared to a flamelet model [36,37]. Thus, for the engine simulation, Reacting Species Transport is deemed more accurate and is the selected overarching model for this application.
Within Reacting Species Transport are two primary reaction models: complex chemistry (CC) and Eddy Break Up (EBU). The complex chemistry model is considered the most computationally accurate and complex model, as it uses a stiff ODE solver to solve for the chemical source terms [38,39,40,41]. Through this robust solver, this model can calculate the chemical source terms for equations comprising hundreds of reactions over varying timescales for dozens or more species, making it the best candidate for simulating complex chemical models. The other option, Eddy Break Up, is more optimized for simpler mechanisms. Eddy Break Up (EBU) computes reaction rates based on turbulent mixing and kinetic rates or their combination [42,43]. It implements a straightforward equation for species source terms, avoiding the need for stiff ODE solving used in complex chemistry. However, this restriction confines the model to simpler reactions, typically one or two steps, making it unsuitable for the complex multi-stage mechanisms being studied [44,45]. Therefore, complex chemistry is preferred as the solver [46]. In addition, the authors considered using the eddy dissipation concept (EDC) along with the complex chemistry model so that the turbulent mixing component could be precisely combined with the chemical reactions [47]. The EDC has improved predictions for reaction turbulence rates and provides a more realistic representation of turbulent flow and combustion efficiency. It simplifies computations by separating turbulence and chemistry calculations, leading to better predictions of combustion characteristics such as flame stability, ignition behavior, and pollutant formation [48,49]. The governing equations considered for complex chemistry (CC) with the eddy dissipation concept (EDC) are shown in Equations (3) and (4) below [50,51]:
Species Transport Equation:
ρ Y i x + . ρ u Y i = . D i Y i + ω ˙
where Yi is the mass fraction of species i, Di is the diffusion coefficient of species i, and ω ˙ i is the reaction rate of species i.
Eddy Dissipation Concept (EDC):
ω ˙ i = min ( E D C i , c h e m , E D C i , t u r b )   o r   ω ˙ i = A   ρ Y i τ e d d y
where ω ˙ i is the reaction rate, EDCi,chem is the chemical reaction rate, EDCi,turb is the turbulent reaction rate, τeddy is the timescale for eddy dissipation, which is modeled based on the turbulence characteristics (from the k − ω or SST turbulence models), and A is a constant.
The Gas Research Institute developed the GRI 3.0 mechanism for complex chemistry (CC) analysis [52]. Later on, this was also embedded in Berkeley’s depository [52]. Initially, the combustion of vaporized propellants was modeled using the GRI-3.0 mechanism for methane–air combustion, which is widely recognized for its comprehensive nature [28]. However, due to its complexity, involving 325 reactions across 53 species, it significantly strains the chemical solver during high-computation tasks. This complexity arises from the inclusion of detailed nitrogen chemistry for air combustion, along with mechanisms irrelevant to the specific use-case, such as those related to flame radiation. As a result, while GRI-3.0 served as a computational benchmark, a reduced model for methane combustion was prioritized to improve efficiency.
The initial candidate for this reduced model became the methane–air combustion model developed by Lu et al. [53]. Lu’s model operates under similar conditions and with similar reactions to the GRI-3.0 model, as it was originally reduced from the GRI’s original model. Thus, it was predicted that its behavior would imitate the GRI model suitably to become a replacement [54]. With 184 reactions between 30 tracked species, this model features approximately half the complexity of the GRI model. This was accomplished through the application of a directed relation graph, in which the coupling between each species in the reaction is analyzed on a directed graph, with reactions with weak couplings, as determined by a user-defined error tolerance, being eliminated. Under an error tolerance of 0.13, and with the elimination of species related to NO formation, the removal of 23 species and 141 reactions was accomplished with minimal change in combustion characteristics.
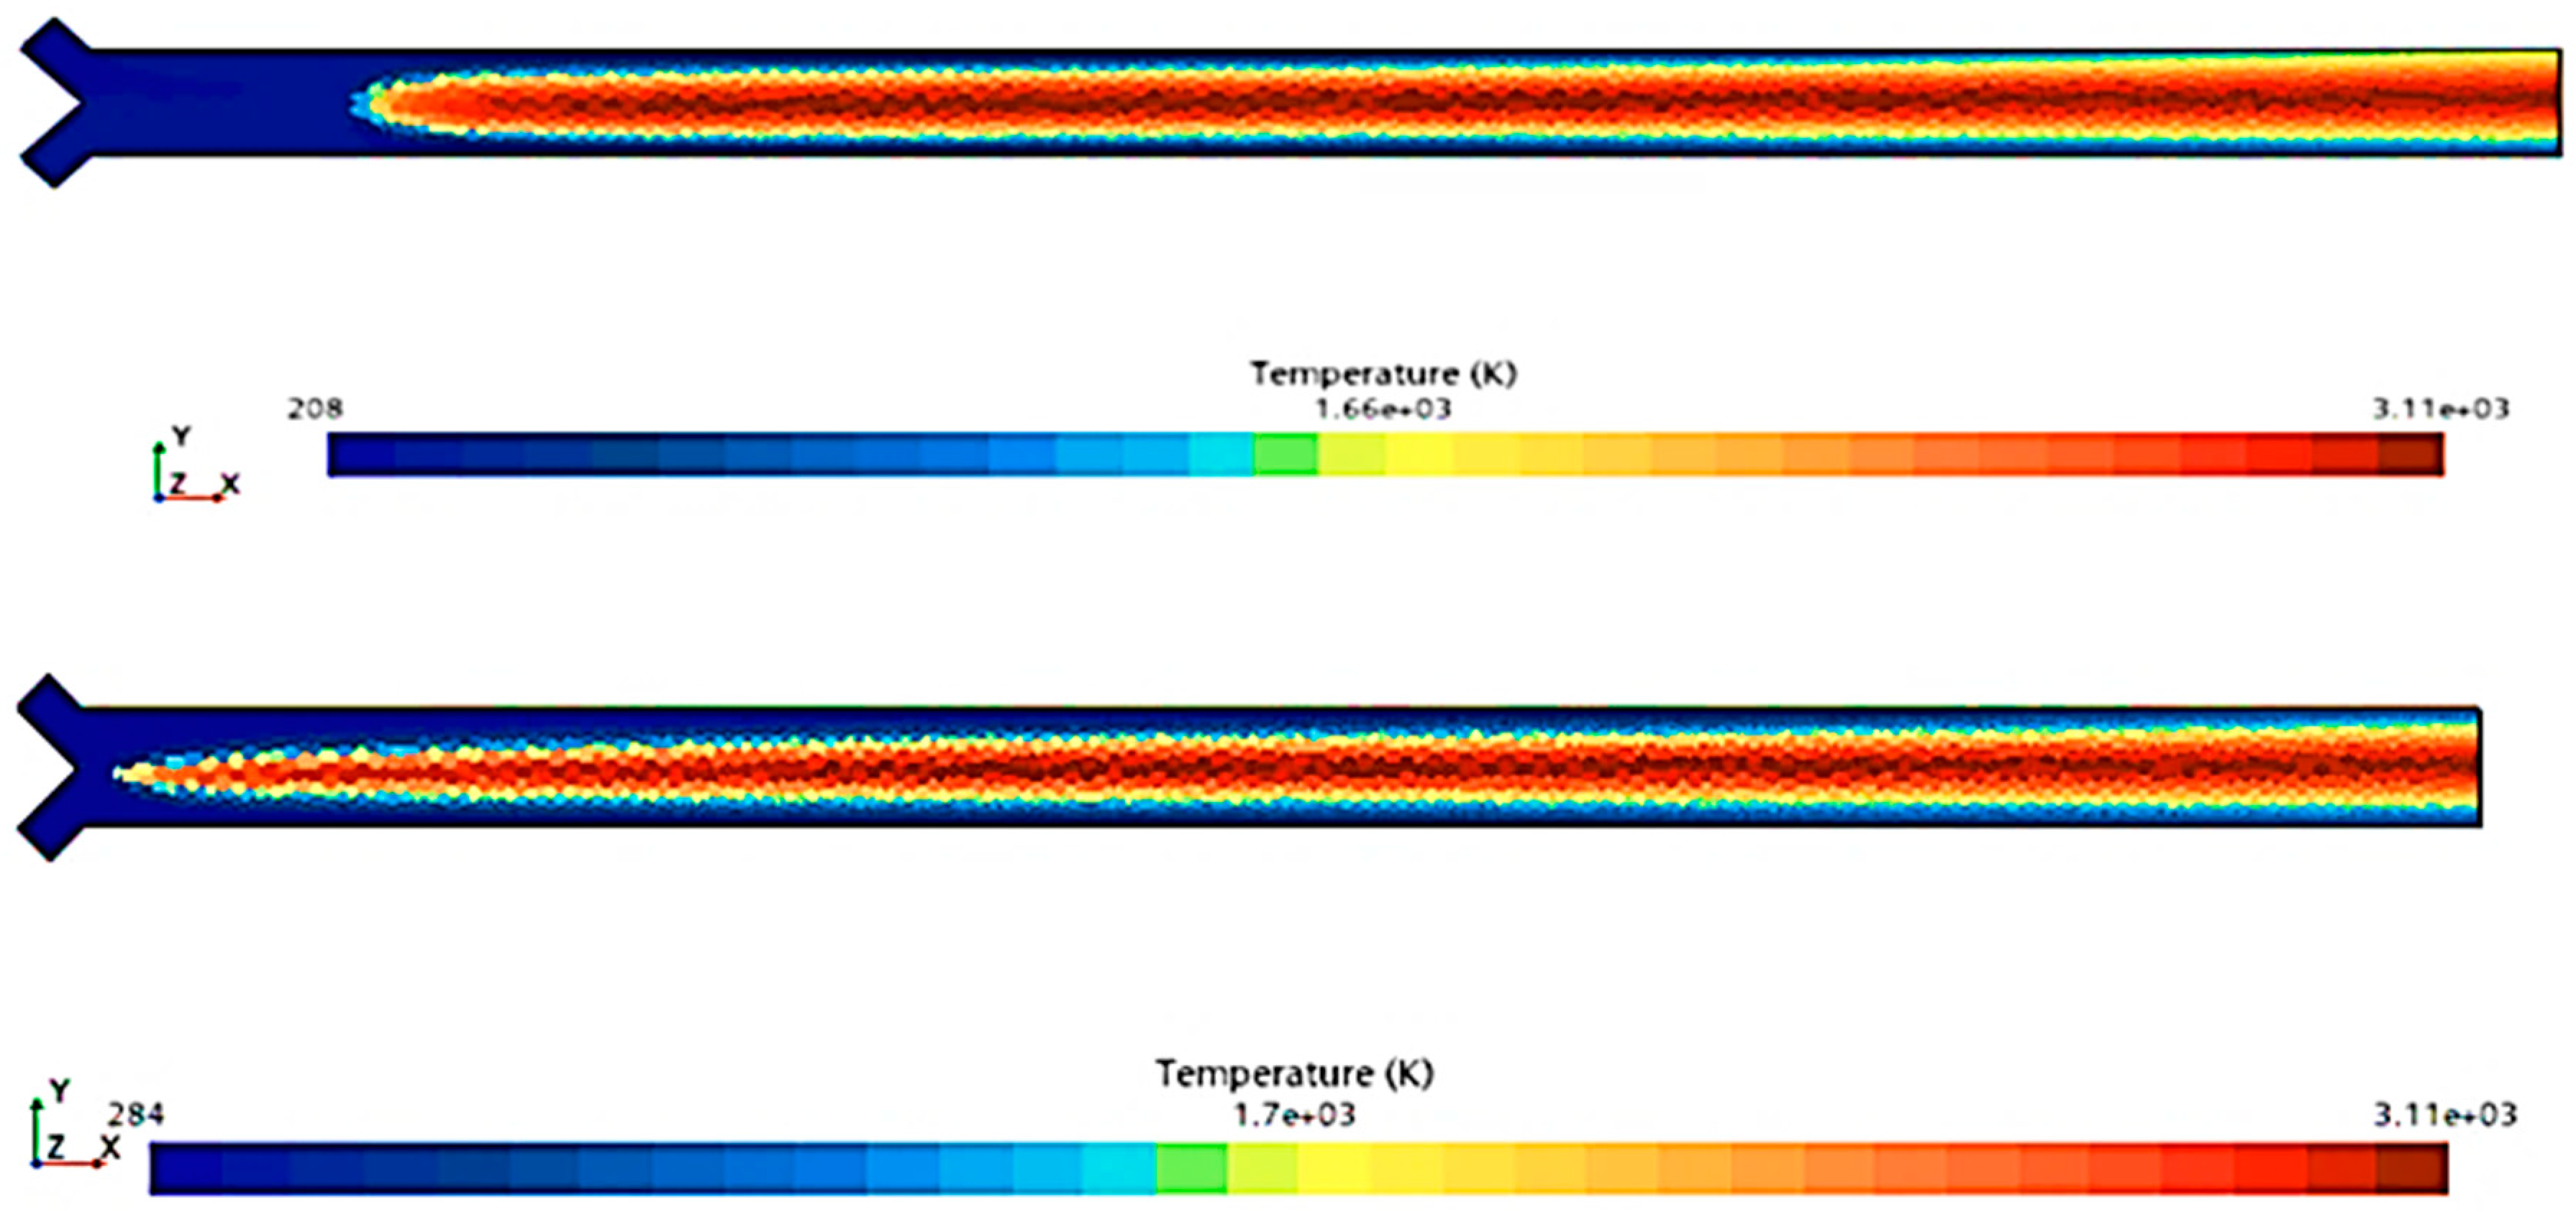
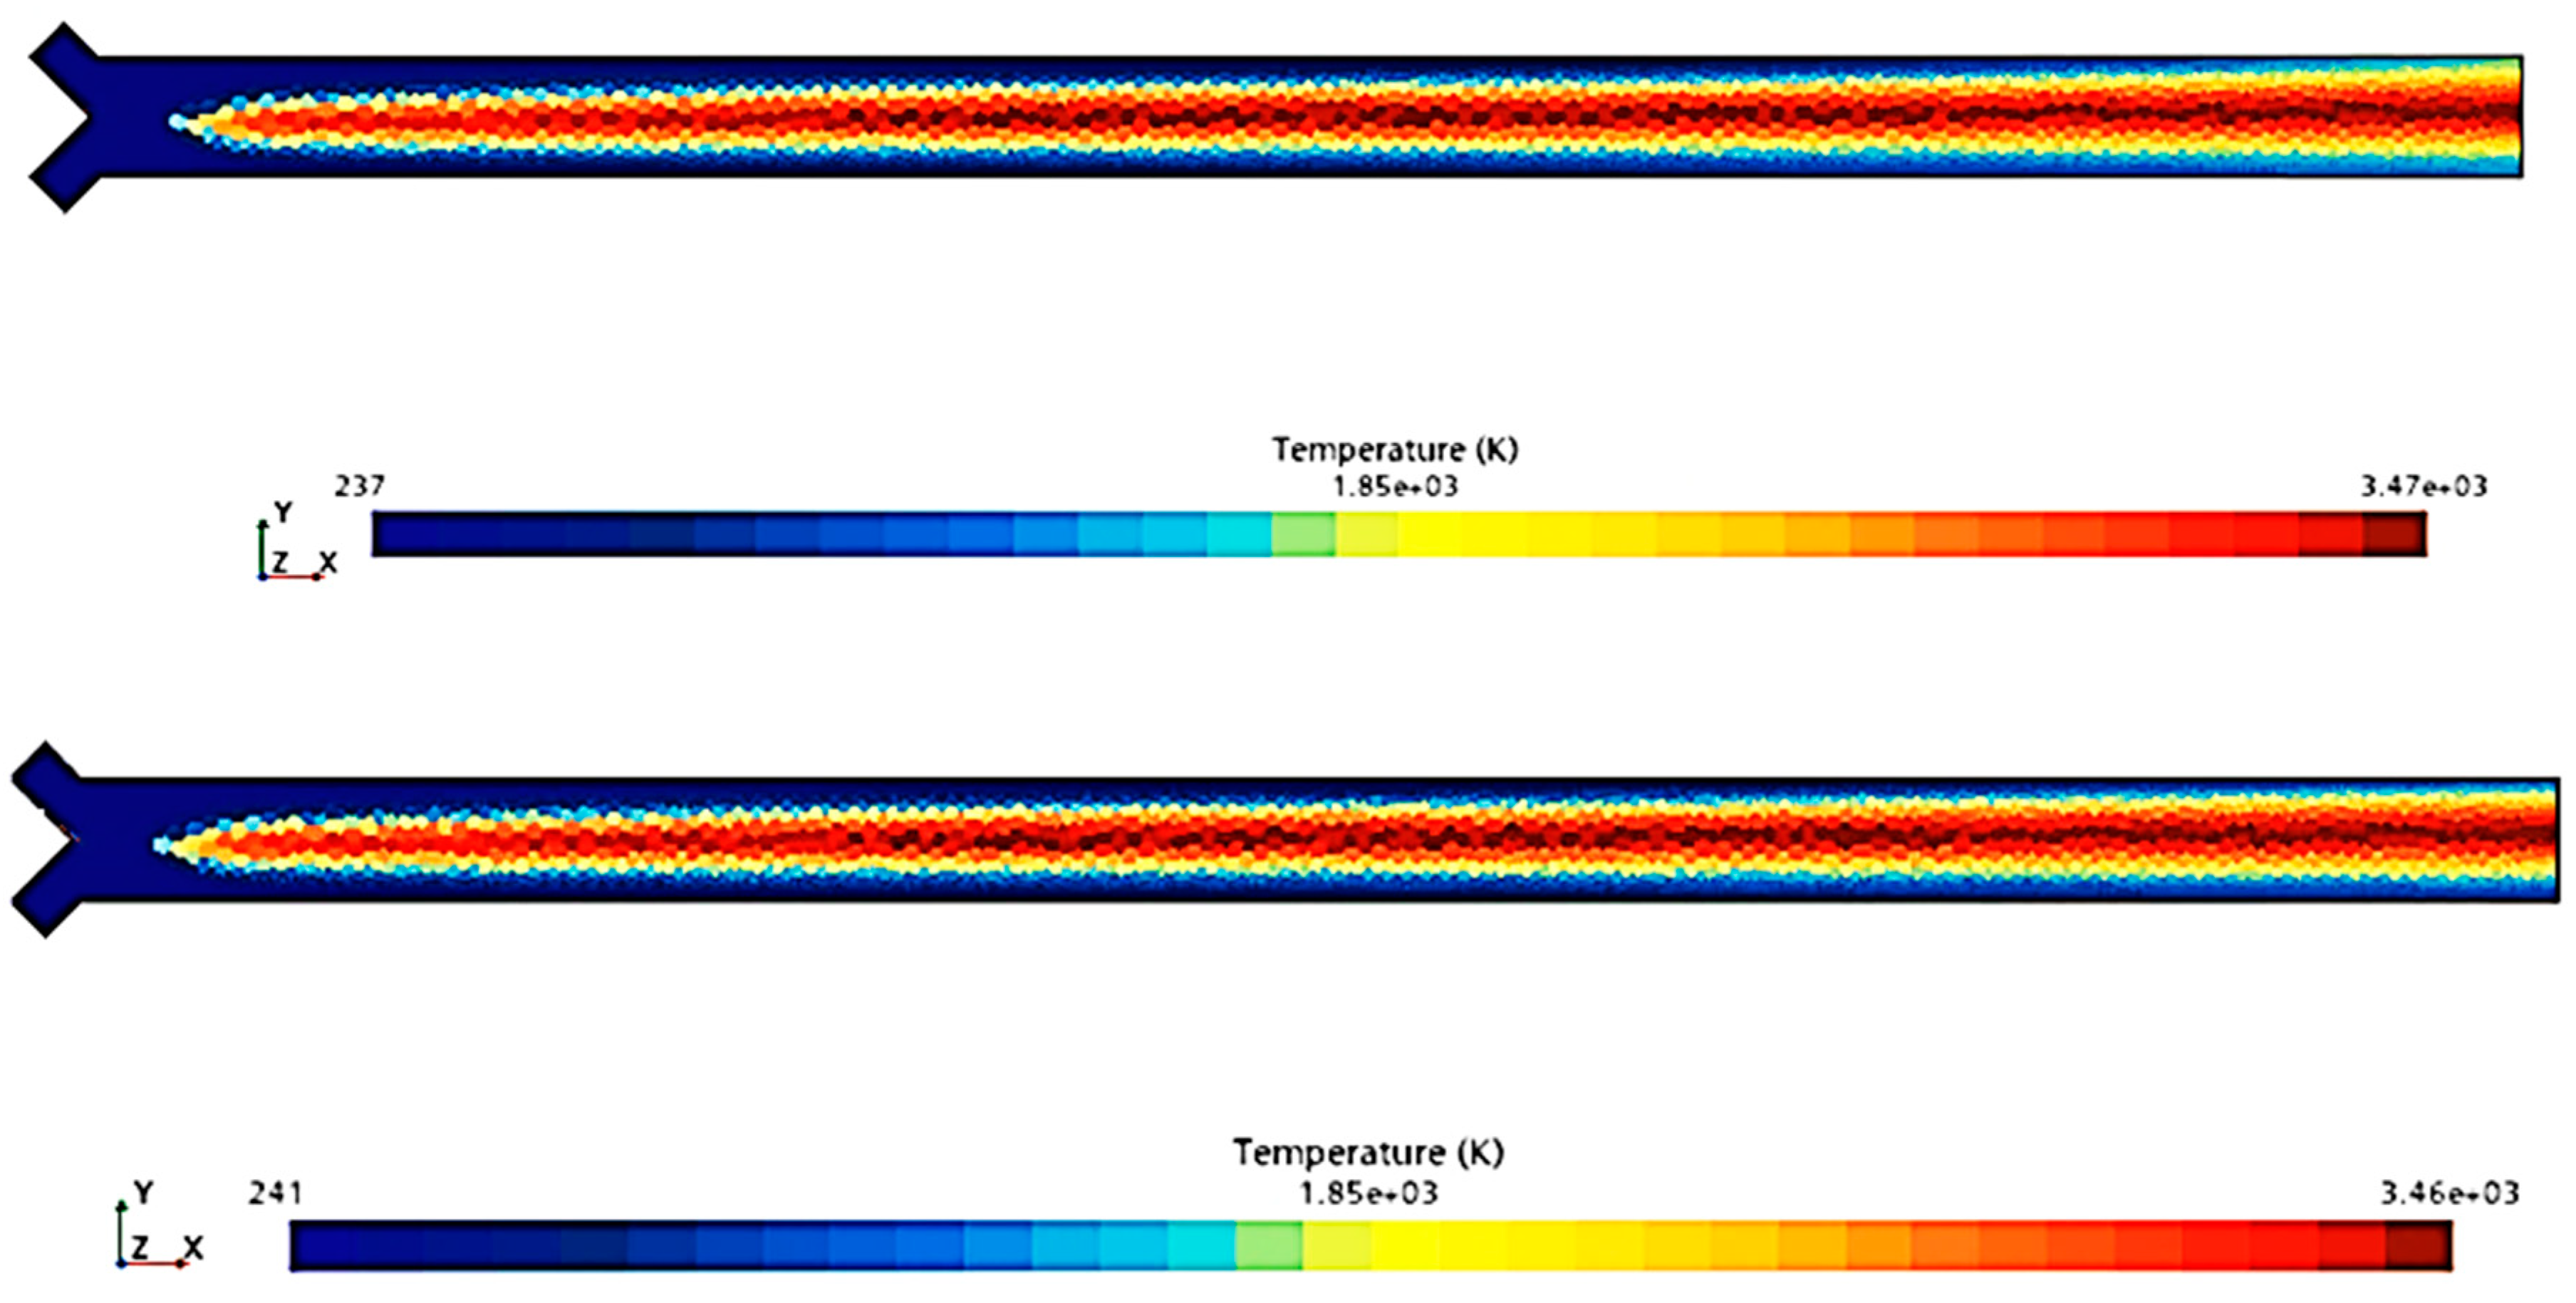
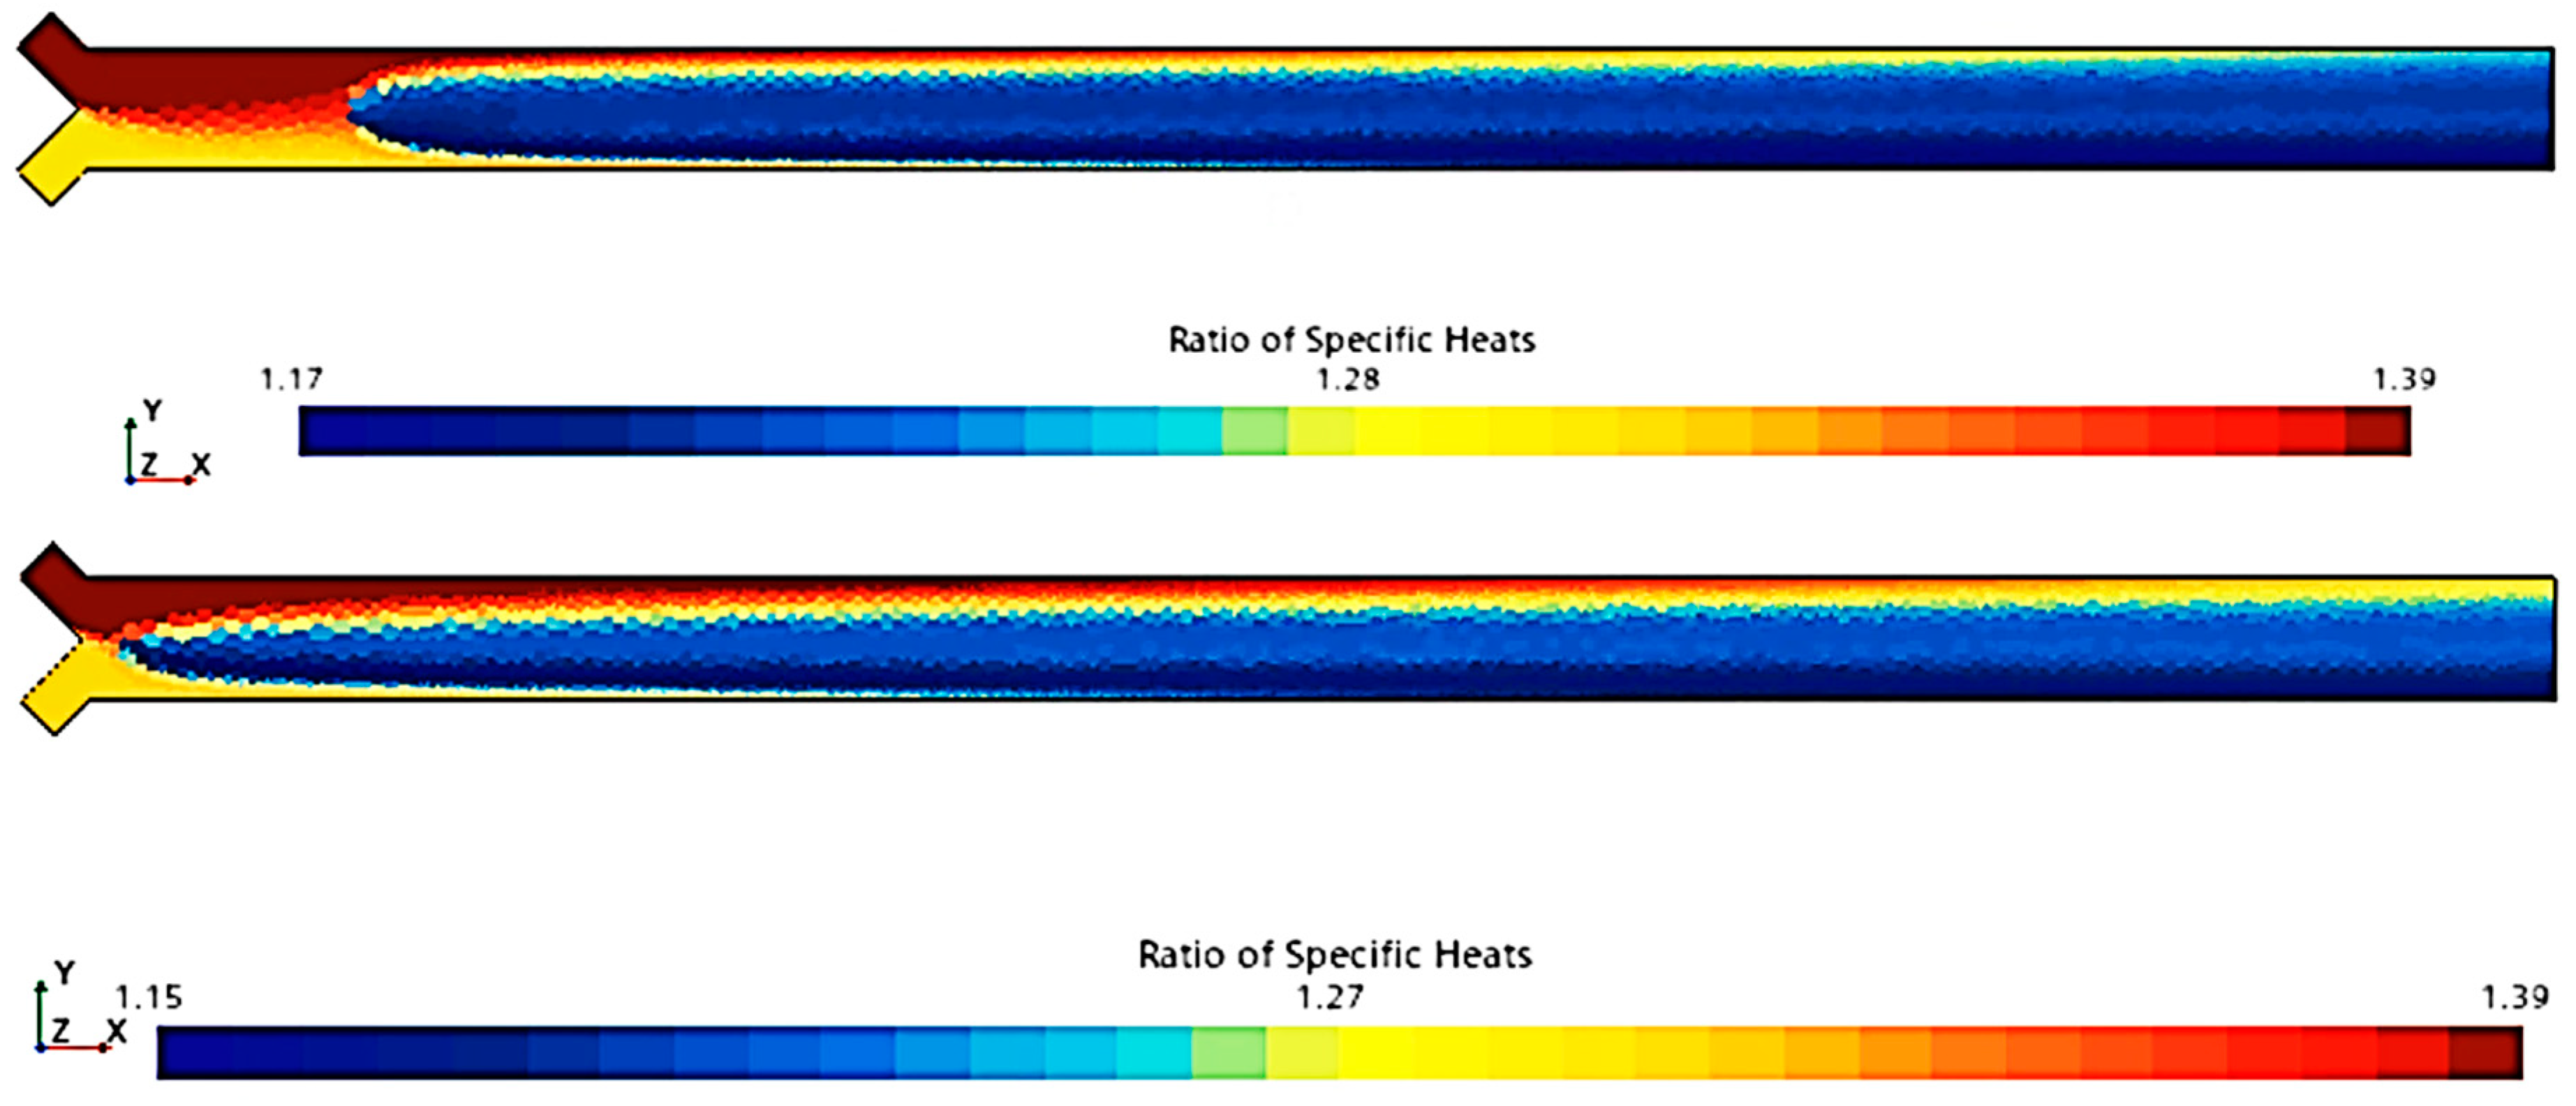
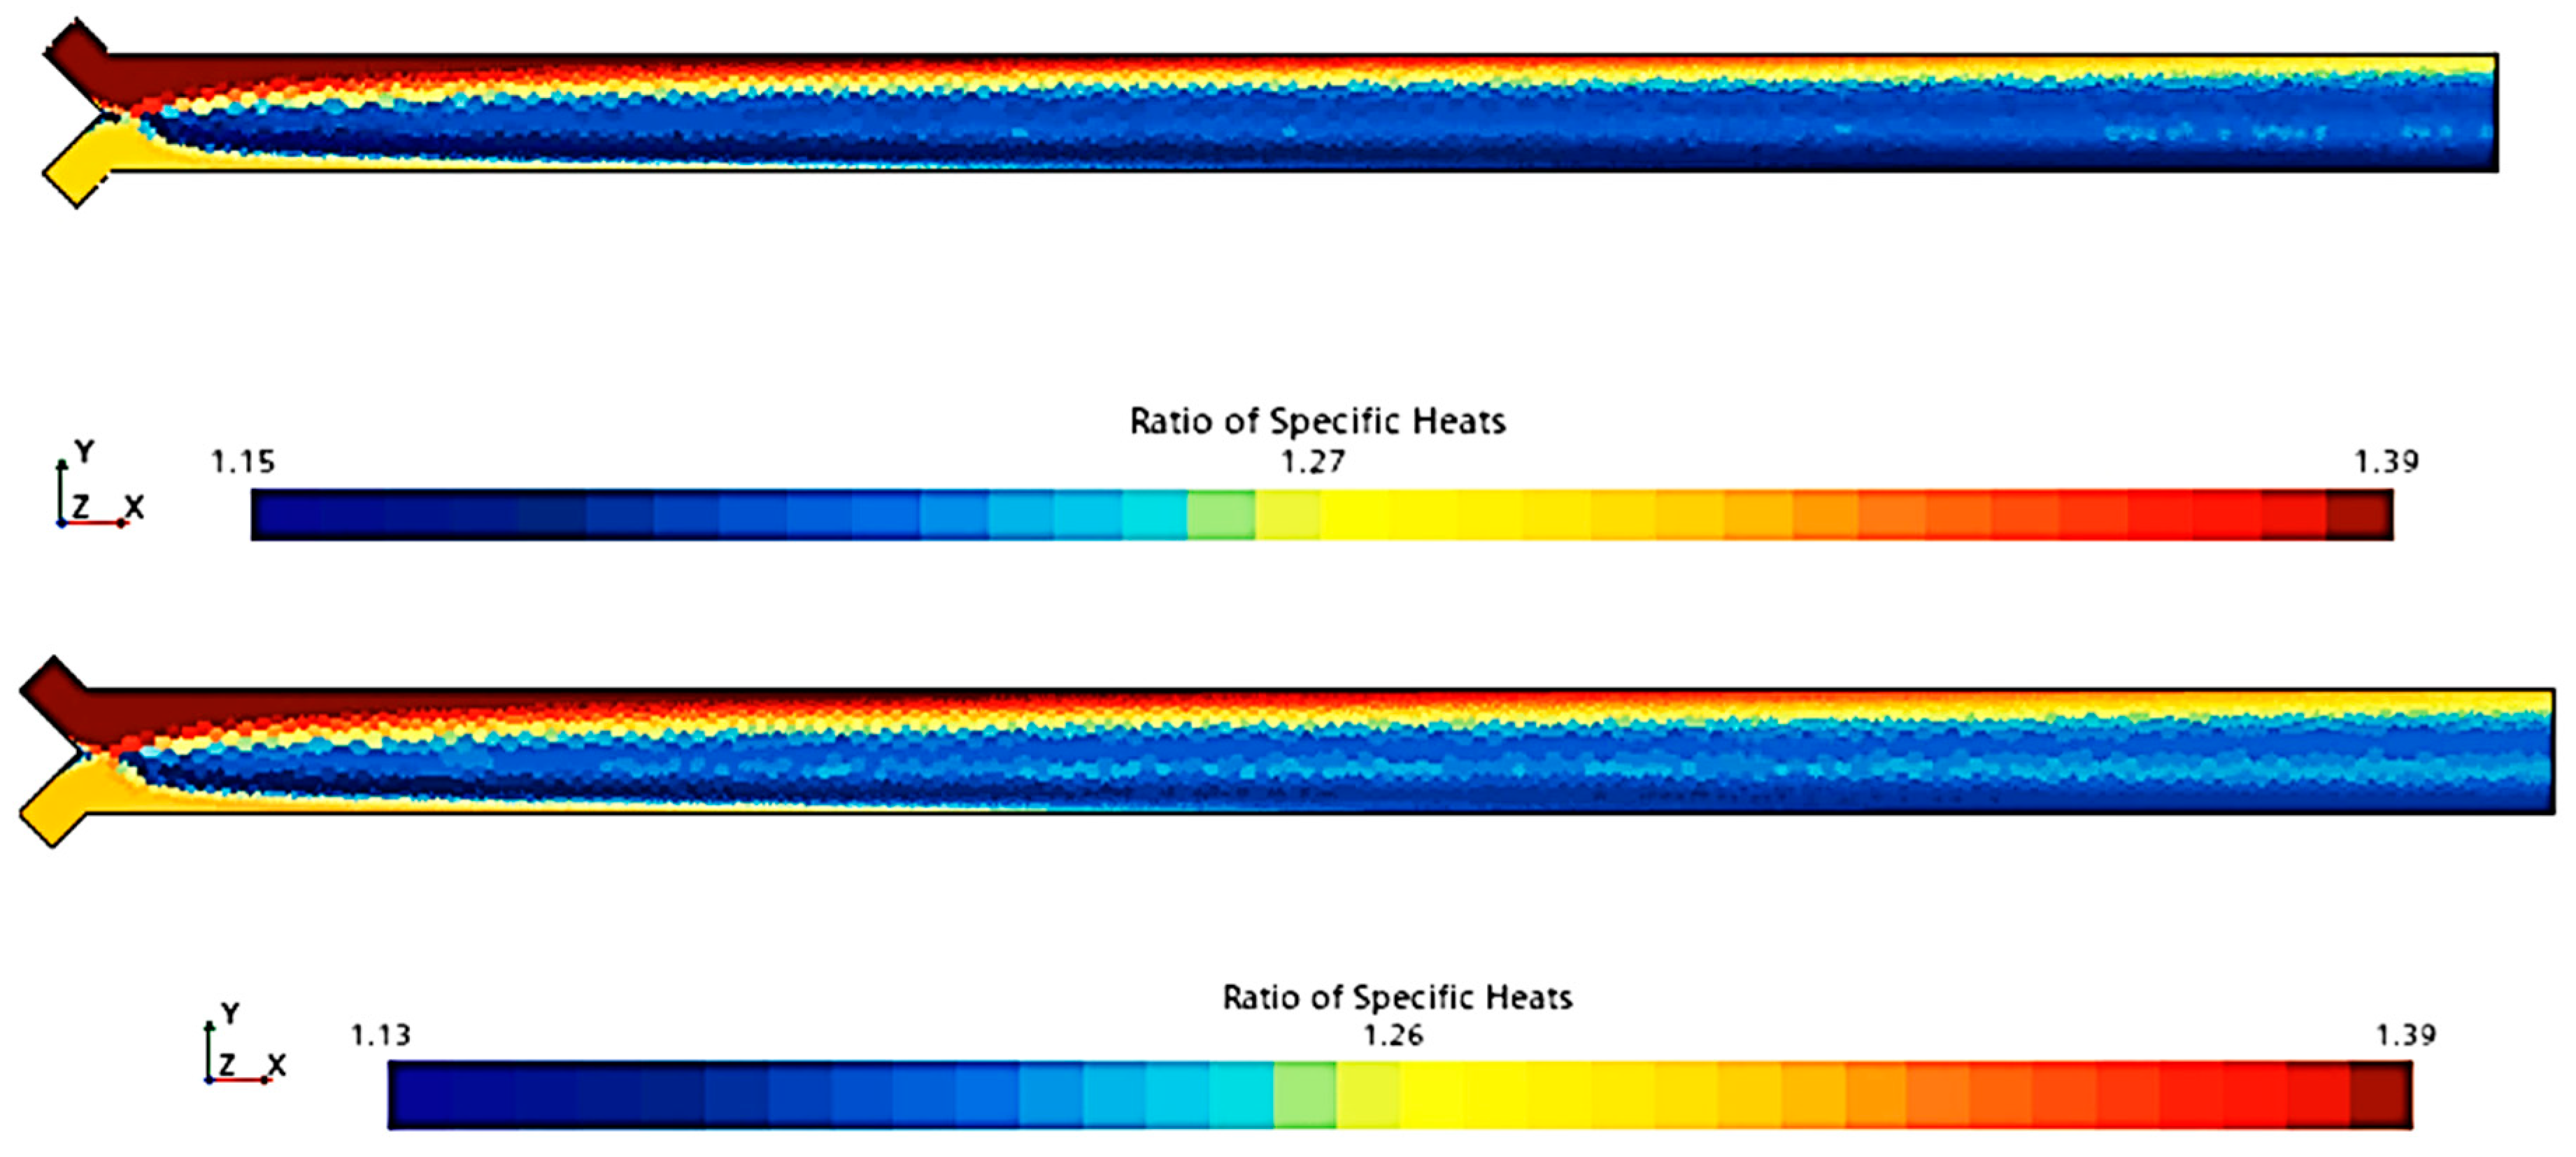
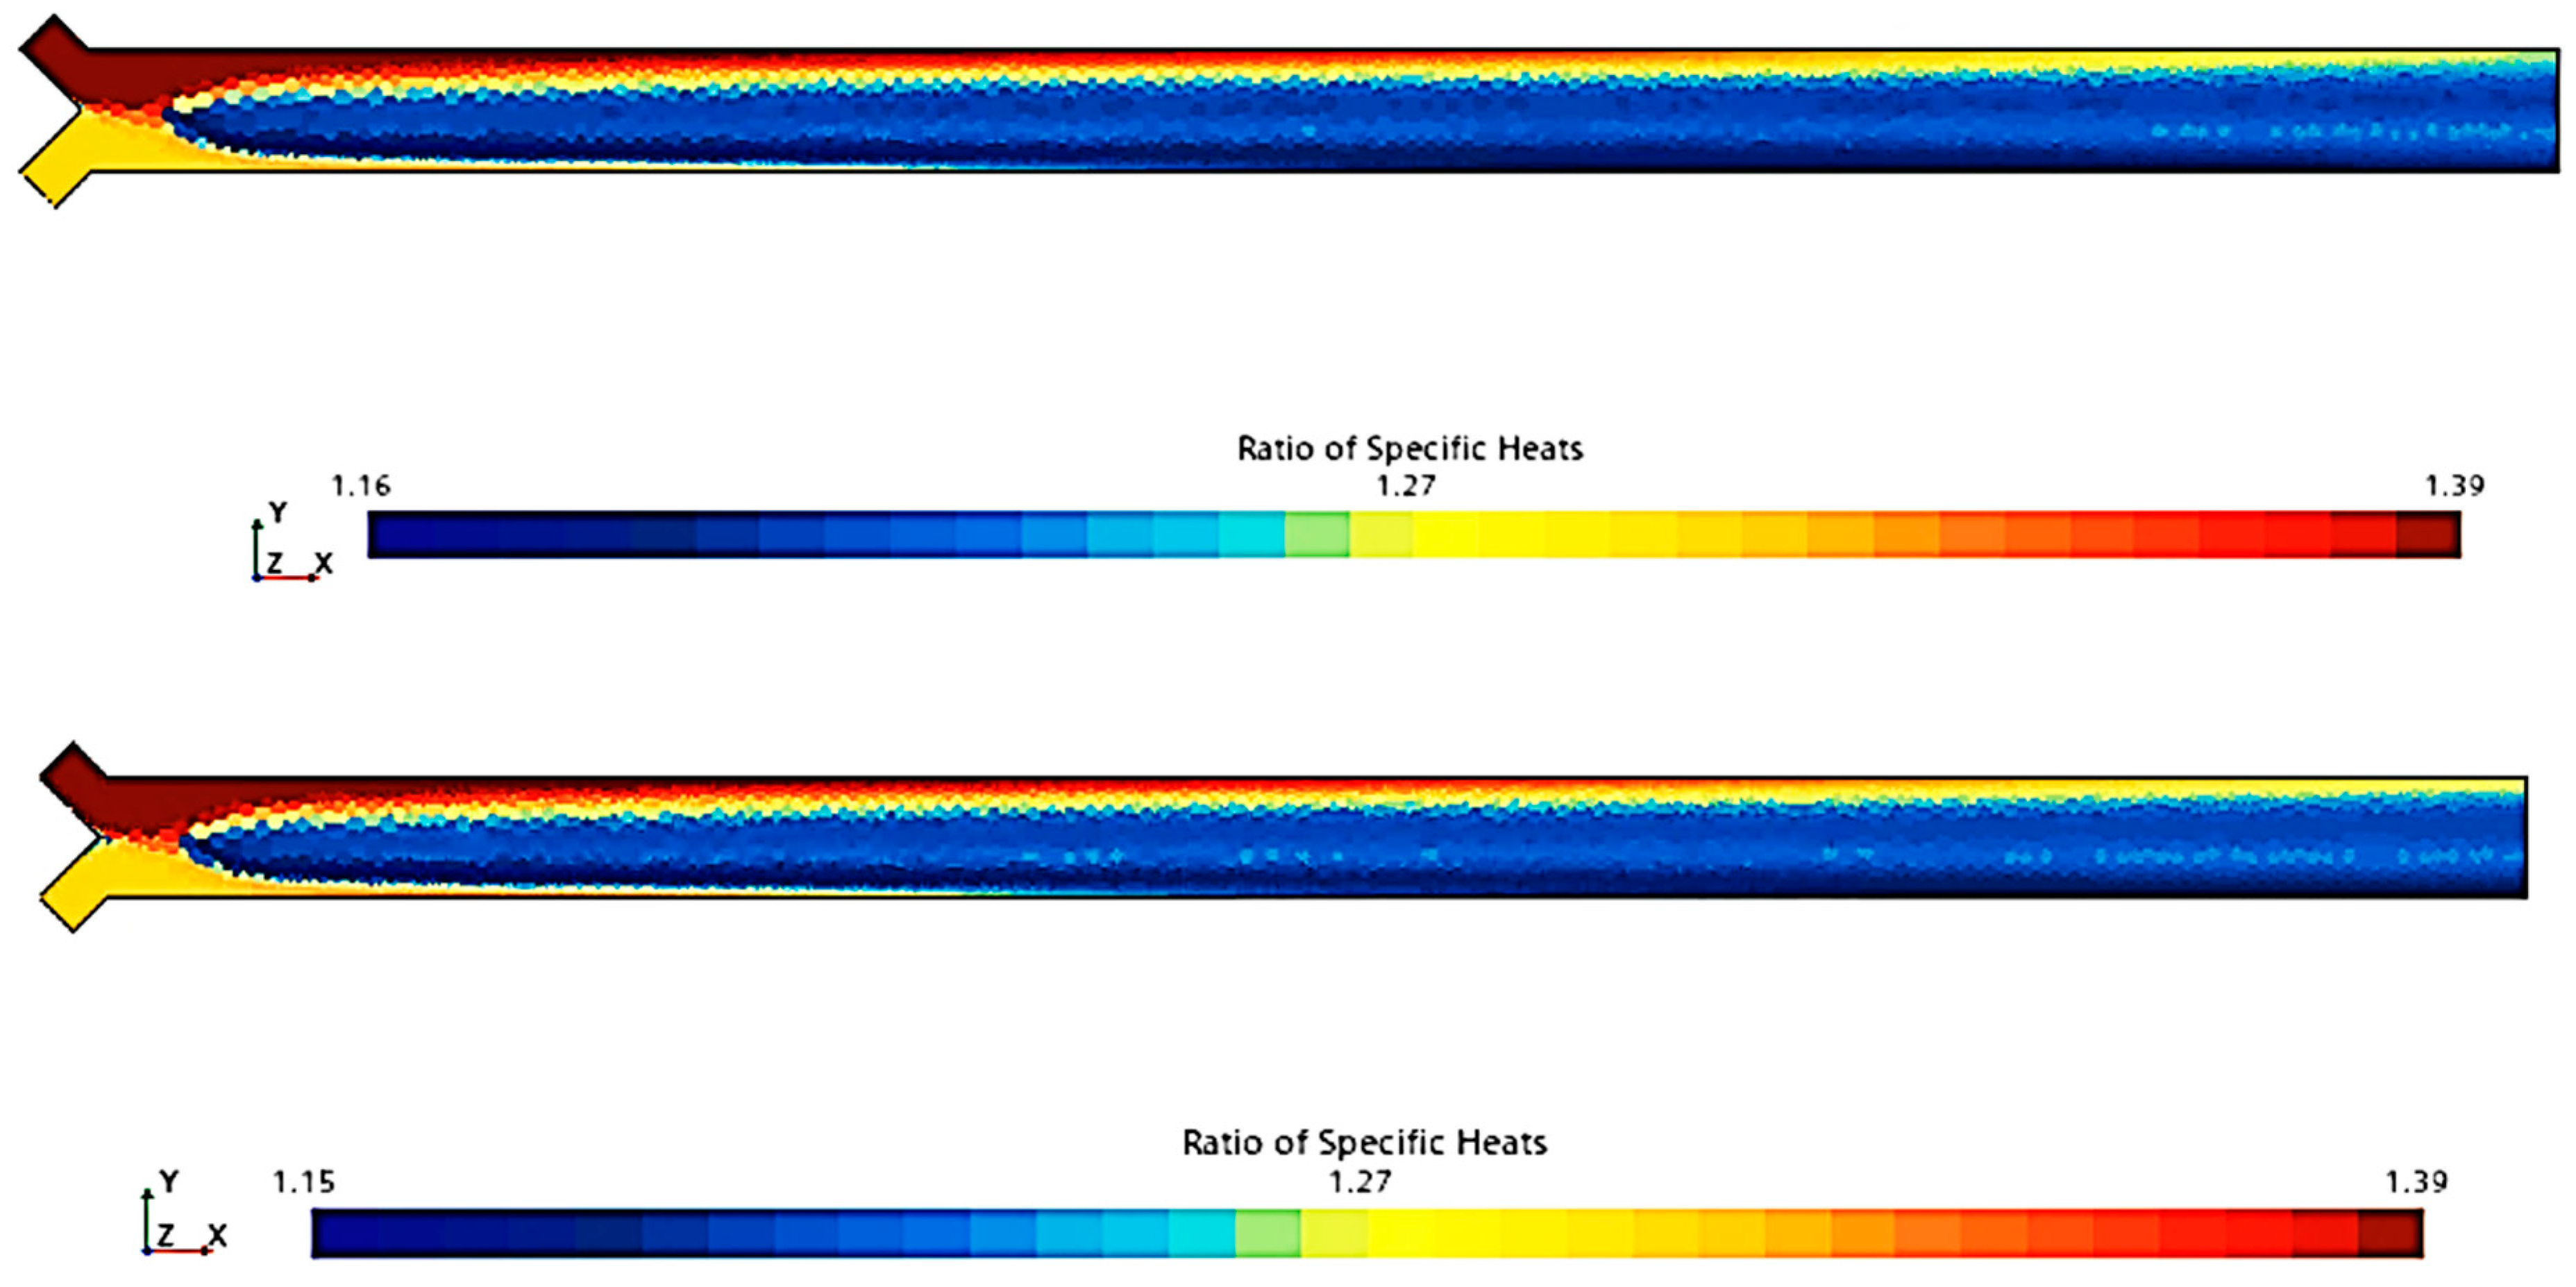
To compare the combustion characteristics of the two models, a 2D test case was set up in Star-CCM+. The geometry consisted of a converging “tube” where fuel and oxidizer paths intersected at a 90-degree angle before merging into a straight section angled at 45 degrees to both paths. Fuel and oxidizer were injected at an OF ratio of 2.7 and pressures of 0, 125, and 250 psig were used to simulate expected rocket chamber conditions. A Coupled Flow solver was used for the flow model, enhancing stability by controlling the CFL number, along with a standard k-omega SST model for turbulence. Each pressure scenario was tested over roughly 8000 iterations, following a staged CFL progression: 0.1 for the first 1000 iterations, 1 for the next 1000, 10 for 2000 iterations, 100 for another 2000, and 1000 for the final 2000 iterations. This approach achieved satisfactory convergence, confirmed by a three-order reduction in continuity residuals and no visual changes in the temperature field during the final iterations. Post-convergence, temperature and specific heat ratio fields were compared, as shown in Figure 4, Figure 5, Figure 6, Figure 7, Figure 8 and Figure 9.
Figure 4, Figure 5, Figure 6, Figure 7, Figure 8 and Figure 9 show that there is a minimal difference in flame characteristics and shape between the two mechanisms tested. Across all conditions, the core flame temperature and ratio of specific heats for the products are nearly identical. The main difference observed is a longer ignition delay in the GRI-3.0 mechanism at 0 psig, where the flame shape significantly deviates from other conditions, suggesting that the Lu mechanism’s flame behavior is more accurate. Additionally, the Lu mechanism closely matches flame temperatures and exhibits similar specific heats profiles for post-combustion products (see Table 3), supporting its use for nozzle flow modeling.
Thus, according to the tests conducted (Figure 4, Figure 5, Figure 6, Figure 7, Figure 8 and Figure 9 and Table 3), the Lu model maintains most of the accuracy afforded by the GRI-3.0 model at a considerably lower runtime of approximately half that of the GRI-3.0 model due to the reduction in tracked species and reactions. For these reasons, the Lu mechanism was chosen for usage in the final combustion model, as also reported in [55].

2.2. Multiphase Flow Modeling and Associated Governing Equations

The compressible flow within the nozzle was modeled using methods that balance accuracy and computational efficiency. The ideal gas model was selected for the gaseous equation of state due to its simplicity and sufficient accuracy within the engine’s operating range, compared to the more complex Real Gas model. The Reynolds-Averaged Navier–Stokes (RANS) approach, combined with the K-Omega turbulence model, was applied to solve the Navier–Stokes equations for chamber flow, chosen for its ability to accurately predict near-wall turbulence [56], which influences boundary layer effects and fuel film cooling. Similarly, Wilcox [57] numerically validated that the k-Omega model is quite accurate for the attached boundary layer in an adverse pressure gradient, compressible boundary layer, and free shear flow. Likewise, Menter [58] confirmed that integrating RANS with the k-omega model enhances the understanding of near-wall behavior compared to other models. They also noted that the k-omega model avoids the use of damping functions, relying instead on straightforward Dirichlet boundary conditions. This simplicity makes the k-omega model more stable numerically, while still maintaining accuracy in predicting mean flow profiles, comparable to other models. Also, they suggested using SST k-Omega, which is like a hybrid approach and helps in resolving both the near-wall performance and free-stream stability. Because of the aforementioned reasons, the authors in this paper combined RANS with k-omega (SST). A segregated solver was employed for the multiphase flow model, offering faster computation by solving mass and momentum conservation equations sequentially, though it is less robust than the coupled solver, particularly for supersonic flow [56,59,60]. This method, supported by fine-tuning of under-relaxation parameters, was adopted to ensure stable convergence for the multiphase flow.
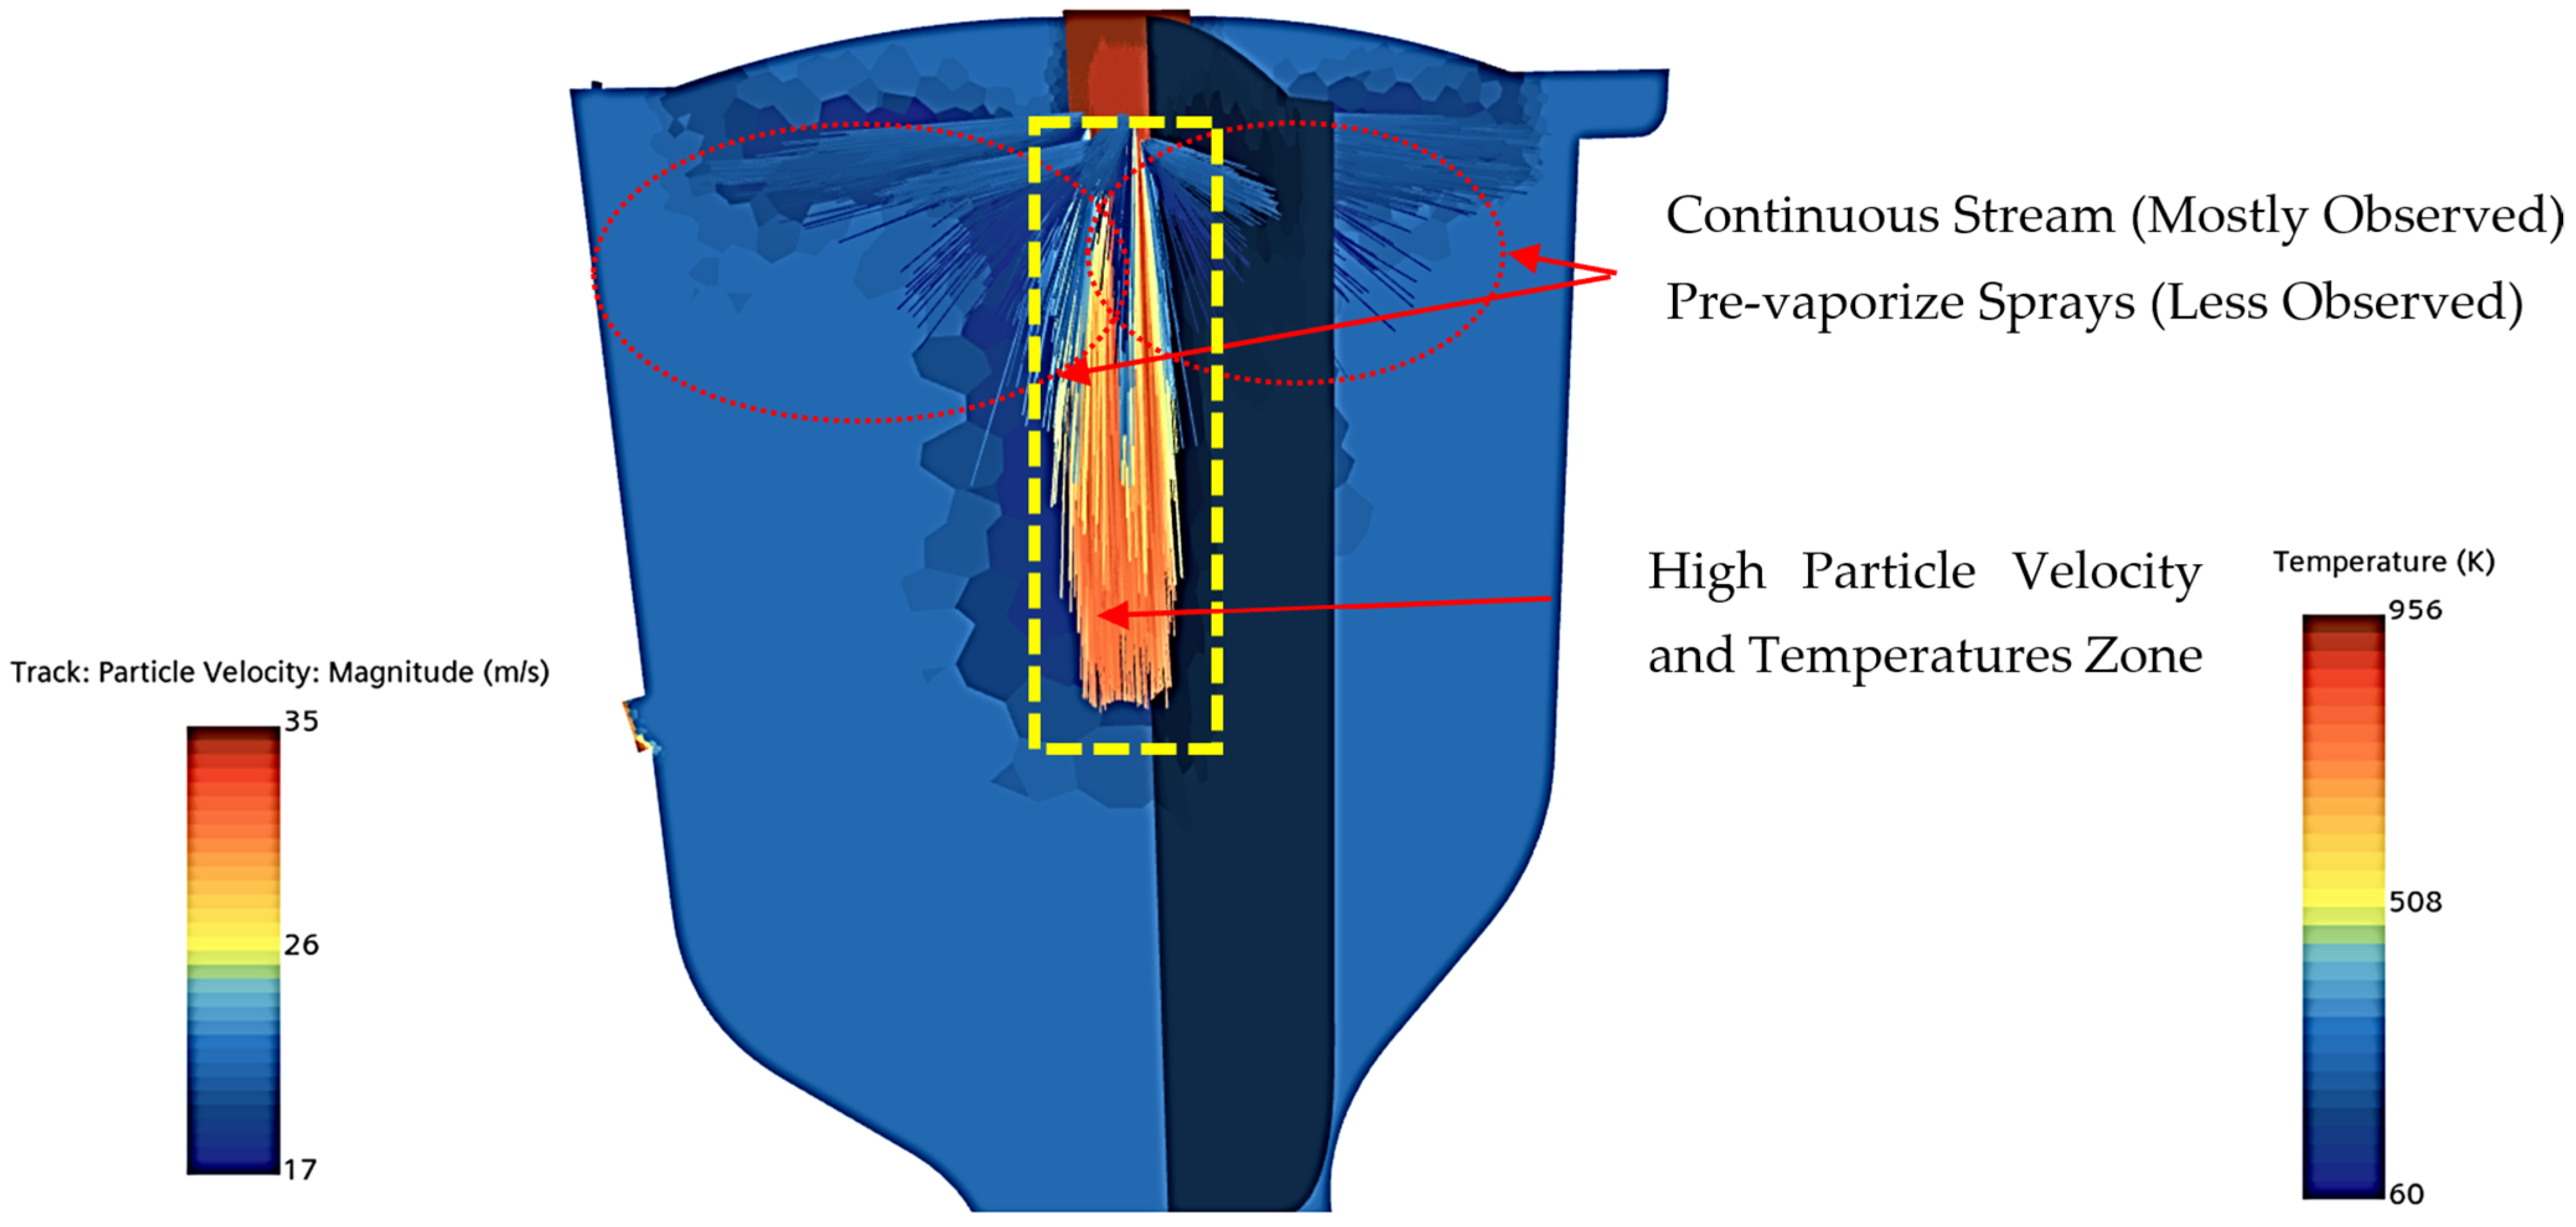
To accurately model the injection of liquid propellants, it is essential to represent each phase along with the associated mass and heat transfer properties. In Star-CCM+, two major methods are available for simulating multiphase flows: the Lagrangian model [61,62], where phases are treated as discrete particles moving through the primary phase within a resolved mesh, and the Eulerian model [63,64], which solves the conservation equations for all phases on the same mesh grid. Initially, the Lagrangian model was used to simulate particle flows from fuel orifices due to its ease of implementation and its effectiveness in replicating spray injections in rocket engines [61]. However, the CROME’s injection elements produce continuous (intact) streams rather than pre-vaporized sprays; thus, the driving force for mixing is impingement rather than atomized spray, as demonstrated in initial cold flow tests [27]. As depicted in Figure 10, the Lagrangian model’s probabilistic NTC particle impingement did not achieve adequate impingement, failing to capture the expected dynamics near the injector.
From there, it was determined that an Eulerian-type model had to be used, of which there are three primary options to choose from: Eulerian Multiphase (EMP), which solves the conservation equations of each phase separately, Mixture Multiphase (MMP), which solves the conservation equations of the phases using a mixture assumption, and Volume of Fluid (VOF), which is similar to MMP with an additional assumption of stratified flow in each phase. Initial impingement tests were carried out with the VOF model, due to its valid assumption of flow stratification and relative ease of computation compared to EMP [65]. However, for full engine simulation, this model is unsuitable as it calculates the energy of each phase through a temperature-dependent solver, rather than an enthalpy-based solver, and therefore could not simulate the effect on gas temperature from the heat release of combustion [38]. The only available Eulerian model to feature an enthalpy-based energy solver is EMP and, thus, multiphase modeling had to be switched to the more complex but proven Eulerian Multiphase model [66]. The governing equations used under EMP are shown in Equations (5)–(7) below [67,68]:
Continuity Equation (for each phase α):
ϵ α ρ α t + . ϵ α ρ α u α = . α α G α + S α
where ρα is the density, ϵα is the volume fraction, uα is the velocity field, Gα is the diffusion flux, and Sα represents source terms.
Momentum Equation (for each phase α):
ϵ α ρ α u α t + . ϵ α ρ α u α u α = ϵ α p + . ϵ α τ α + F α β + S α
where p is the pressure shared between phases, τ α is the stress tensor for phase α , F α β is the interphase interaction forces, and S α is the source term (e.g., gravity).
Energy Equation (for each phase α):
ϵ α ρ α h α t + . ϵ α ρ α u α h α = . k α T α + Φ α   or , ϵ α ρ α E α t + . ϵ α ρ α u α E α = . ϵ α q α + Q α + β α Q ˙ β α
where hα is the enthalpy, kα is the thermal conductivity, Tα is the temperature, Φα = Qα represents heat sources, Eα is the energy per unit mass of phase α, qα is the heat flux in phase α, and Q ˙ β α is the interphase heat transfer from β to phase α .
The saturation pressure of the fuels is modeled using the Antoine equation [69,70], as described in Equation (8), where A, B, and C are empirical constants, and T refers to the liquid temperature, with values for oxygen and methane provided by the NIST [71]. Heat transfer and evaporation are simulated using the Multicomponent Droplet Evaporation (MDE) model, with heat and mass transfer determined by the Ranz–Marshall correlations for Sherwood and Nusselt numbers. Liquid–vapor equilibrium is modeled using Raoult’s Law [66,72]. Droplet atomization and coalescence are modeled without a Lagrangian approach by employing an S-Gamma distribution of droplet size based on Sauter mean diameter, alongside the Luo and Coulaloglou and Eskin models for droplet coalescence and breakup, respectively [73,74,75].
P s a t = 10 ( A B T + C )
A steady-state simulation for nozzle flow and combustion was performed using these parameters. The model settings for steady-state combustion and nozzle flow are outlined in Table 4 below.

2.3. Conjugate Heat Transfer and Associated Governing Equations

Conjugate heat transfer analysis in a combustion chamber is critical for ensuring the performance, efficiency, and safety of combustion chambers, especially in high-performance aerospace propulsion systems. It is also important because it helps to understand the interaction between fluid dynamics, heat transfer, and structural integrity within the chamber. This analysis combines the heat transfer mechanisms in both the solid walls (conduction) and the fluid flow (convection and radiation). For this, the solid component was added in the simulation alongside the fluid domain. In this simulation, the solid domain is discretized using a polyhedral mesh, which provides improved accuracy in capturing complex geometries. The physics settings include the segregated solid energy model, where heat transfer is analyzed in a steady-state regime with constant density, ensuring that energy conservation is accurately computed within the solid domain. To enable data exchange between the fluid and solid regions, contacts were established between the two domains, particularly in areas like the combustion chamber, nozzle, and internal orifices (e.g., acoustic chambers and injector orifice). This approach is commonly used to study heat exchange between solids and fluids, enabling the design and optimization of thermal management systems. The governing equation for solid energy heat transfer is provided in Equation (9) [76,77]. The physics and mesh settings used for the solid component are shown in Table 5.
Solid energy equation used for heat transfer:
C p , s   ρ s T s t + . C p , s   ρ s u s T s = . k s Δ T s + Q s
where ρs is the solid density, Cp,s is the specific heat capacity at constant pressure, Ts is the solid temperature, ks is the thermal conductivity of the solid, and Qs represents internal heat generation or any heat source term. In the modeling, Equation (10) was used to determine the heat flux due to conduction:
q = k T
where k is the thermal conductivity of the material and T is the temperature gradient [38]. Inconel 718 is used to fabricate the engine chamber and nozzle, with a thermal conductivity value of k of 9.94 W/m·K at 300 K. The thermophysical properties of Inconel 718 at various temperatures were taken from literature sources [78,79]. This heat flux, q, is used to determine the Qs mentioned in the above equation. Further details about the engine requirements are found in a related publication by this team [27].
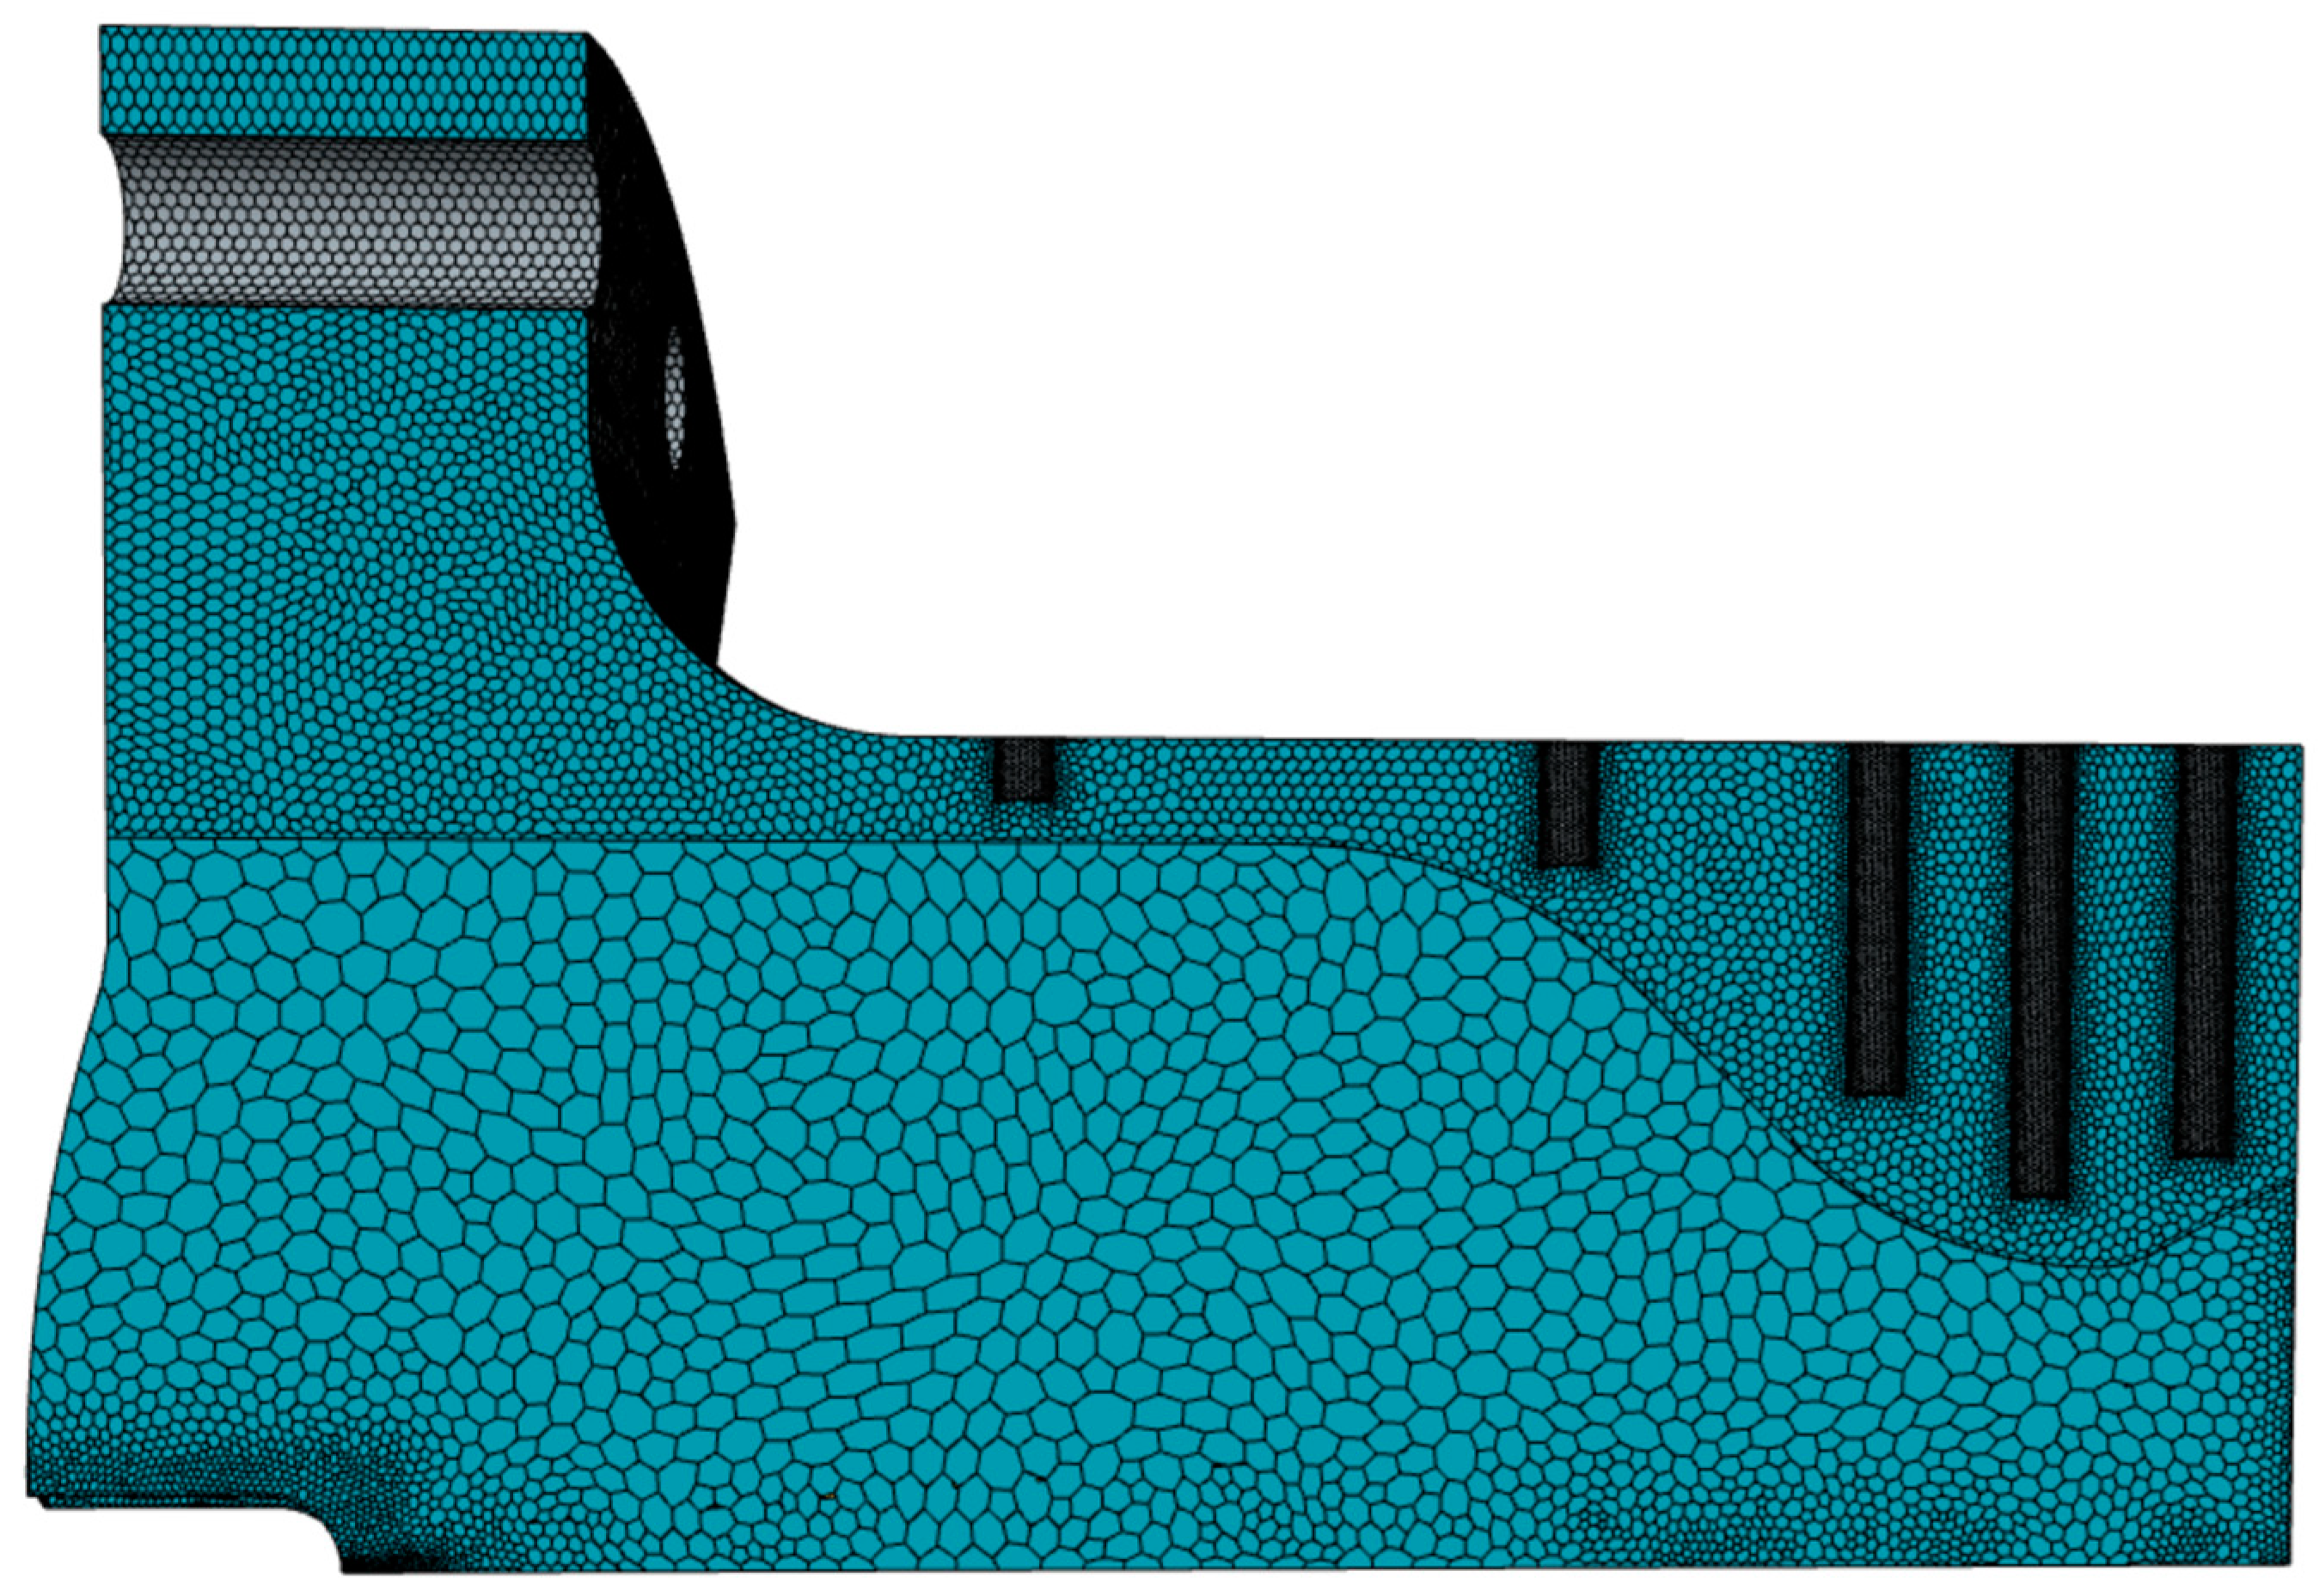
The model considers 1/8th of the full engine volume, to reduce the computational expense of the simulation. It utilizes a symmetric boundary condition on the section walls where the model was sliced. Similar strategies are employed by other research dealing with combustion and heat transfer analysis. This is also dependent on the dimensionality of the simulation, as certain approaches consider more simplified assumptions, such as only considering convection from the combustion gases or considering one-dimensional heat transfer. Lv et al. [18] show how an engine’s one-dimensional model can approach similar results to an experimental set up, when considering all possible uncertainties between the model and the experiment. Munk et al. [15] use a 2-dimensional model, with two distinct grids. One is used to predict the flow stream, temperature, and mass fractions for the combustion of methane and oxygen, while the second grid uses the boundary values to predict the heat transfer across the solid engine walls. Table 6 and Figure 11 present the boundary conditions applied to the solid regions, and the resulting grid for the entire model, respectively.
The boundary conditions set for the outer surfaces were estimated for the convective heat transfer due to the environmental conditions where the system was tested. These settings will be employed in simulating the combustion of the engine at different thrust outputs, with their respective inputs. The simulation assumes the required conditions are achieved at the engine fuel and oxidizer inlets. In this simulation, fuel film injection for cooling was excluded due to limitations in STAR-CCM+, particularly in model compatibility. When trying to simulate fuel–oxygen combustion with multiphase injections, STAR-CCM+ could not accurately model the interaction between the fuel film used for wall cooling and the combustion process. As a result, the effects of fuel film evaporation, and its influence on wall temperature and combustion gases, were not captured. To address this, the authors developed a workaround using 1D heat transfer calculations and a separate 3D fuel film cooling (FFC) model to ensure adequate cooling during hot-fire tests. They used conduction and convection formulas to analyze wall temperatures across various FFC levels. In the 3D FFC model, the combustion chamber was assumed to be at a high temperature, allowing the team to study cooling effects without initializing the combustion model. They found that with proper FFC levels, the surface temperature could remain below the metallurgical limit of Inconel 718 (melting point temperature = 1260–1336 °C). The authors plan to publish detailed findings on FFC in a future paper. To know more about the fuel film cooling injection orifices and injection orientation, please refer to [27].

2.4. Chemical Equilibrium Analysis (CEA) Validation

To compare the CFD model cases, the online version of NASA’s CEA was utilized. NASA’s CEA evaluates engine performance by calculating the chemical equilibrium of combustion products, which facilitates accurate predictions of thrust and specific impulses, thus enabling engineers to optimize propulsion systems effectively. The authors input the types and compositions of fuel and oxidizer, equivalence ratio, expansion ratio, pressure, and temperature into the CEA platform. It employs chemical thermodynamics to forecast the final concentrations of species at equilibrium, accounting for all potential reactions and allowing the prediction of compounds such as water vapor (H2O), carbon dioxide (CO2), and unburned fuel. More information on NASA CEA is available in [80,81].
The authors modeled two cases—500 lbf and 125 lbf—with CEA to compare their results with those from CFD [82]. These cases represent the CROME’s upper and lower performance limits [27]. The input values for the CEA are provided in Table 7. Since the CEA does not output thrust directly, the thrust for each case was calculated using Equation (11):
T = C f × A t h r o a t × P c h a m b e r
where C f is the coefficient of thrust, A t h r o a t is the area of the throat, and P c h a m b e r is the pressure inside the chamber.

3. Results and Validations

In this paper, the authors investigated the multiphase flow and combustion characteristics of a LOX-LCH4 liquid rocket engine through theoretical analysis, chemical equilibrium analysis (CEA), and computational modeling using STAR-CCM+. While the theoretical analysis is not detailed, it relied on standard thermodynamic and propulsion equations to estimate performance metrics like thrust and impulse. CEA, a zero-dimensional adiabatic method, calculated parameters such as temperature and pressure using the chemical equilibrium approach. Acknowledging that these approaches are idealized, the authors used STAR-CCM+ to model real-world conditions, capturing complex phenomena like two-phase flow and heat transfer, resulting in CFD predictions that differ from theoretical outcomes. In this section, the authors will present the CEA results, followed by the STAR CCM+ findings for two test cases: one at 125 lbf and the other at 500 lbf.

3.1. NASA CEA Results Observed at F = 125 Lbf and 500 Lbf

The results for both the 125 lbf and 500 lbf propulsion cases demonstrate notable differences in performance parameters (see Table 8). The Mach number at the nozzle exit was slightly higher for the 500 lbf case (1.87) compared to the 125 lbf case (1.86), indicating a marginal increase in exhaust velocity. The combustion chamber temperature also increased significantly from 3065.00 K in the 125 lbf case to 3190.90 K in the 500 lbf case, suggesting enhanced thermal efficiency at higher thrust levels. Furthermore, the exit pressure rose significantly from 11.65 psia for the 125 lbf case to 38.60 psia for the 500 lbf case, which may contribute to the increased thrust output. Ultimately, the thrust produced was 133.52 lbf for the lower case and 449.50 lbf for the higher case, highlighting the substantial impact of combustion chamber conditions on thrust performance in these propulsion systems. The thrust values deviate from the theoretical predictions by around 10%. It is important to note that in the CEA method, a temperature of 116.5 K was used for LCH4 in both cases, as this was the closest available value in the CEA database to the specified temperature.

3.2. Engine Flow and Combustion Characteristics at F = 125 lbf

In the simulated case of a 125 lbf thrust LOX-LCH4 engine, the flow and combustion exhibited transient behavior, particularly during the early stages of the simulation. Over the first 50 iterations, the injection of fluids initiated the combustion process, with gradual development of temperature and Mach number gradients. This resulted in a corresponding rise in thrust and chamber pressure as the system progressed toward convergence. By iteration 110, the simulation attempted to stabilize near the anticipated thrust and chamber pressure values, as shown in Figure 12. The final thrust output reached 113 lbf, representing a 9.6% deviation from the theoretical thrust and a 15% deviation from the chemical equilibrium analysis (CEA) results. Notably, this final thrust was reached after a series of oscillations that brought the simulation closer to the theoretical target of 125 lbf. However, extending the simulation beyond this point resulted in divergence of the residuals, resulting in a floating-point error that indicated instability in the computational model. The authors want to highlight that the observed deviation is expected, as CEA analyses are more idealized compared to STAR-CCM+. Theoretical analyses rely on simplified thermodynamic equations, using equilibrium adiabatic assumptions that focus on major species while neglecting minor species and intermediates that influence combustion stability, flame temperature, and exhaust composition. CEA also omits real-world factors such as transient effects and dynamics, operating as a zero-dimensional model with no spatial resolution, limited to single-phase, ideal gas, and steady-state assumptions. In contrast, STAR-CCM+ offers a more comprehensive approach, incorporating non-adiabatic effects, non-equilibrium conditions, wall heat transfer, and detailed two-phase flow interactions. However, the STAR-CCM+ model could be further refined by optimizing parameters such as mesh sizing, CFL numbers, Y+ values, and relaxation factors, as noted in [20,83].
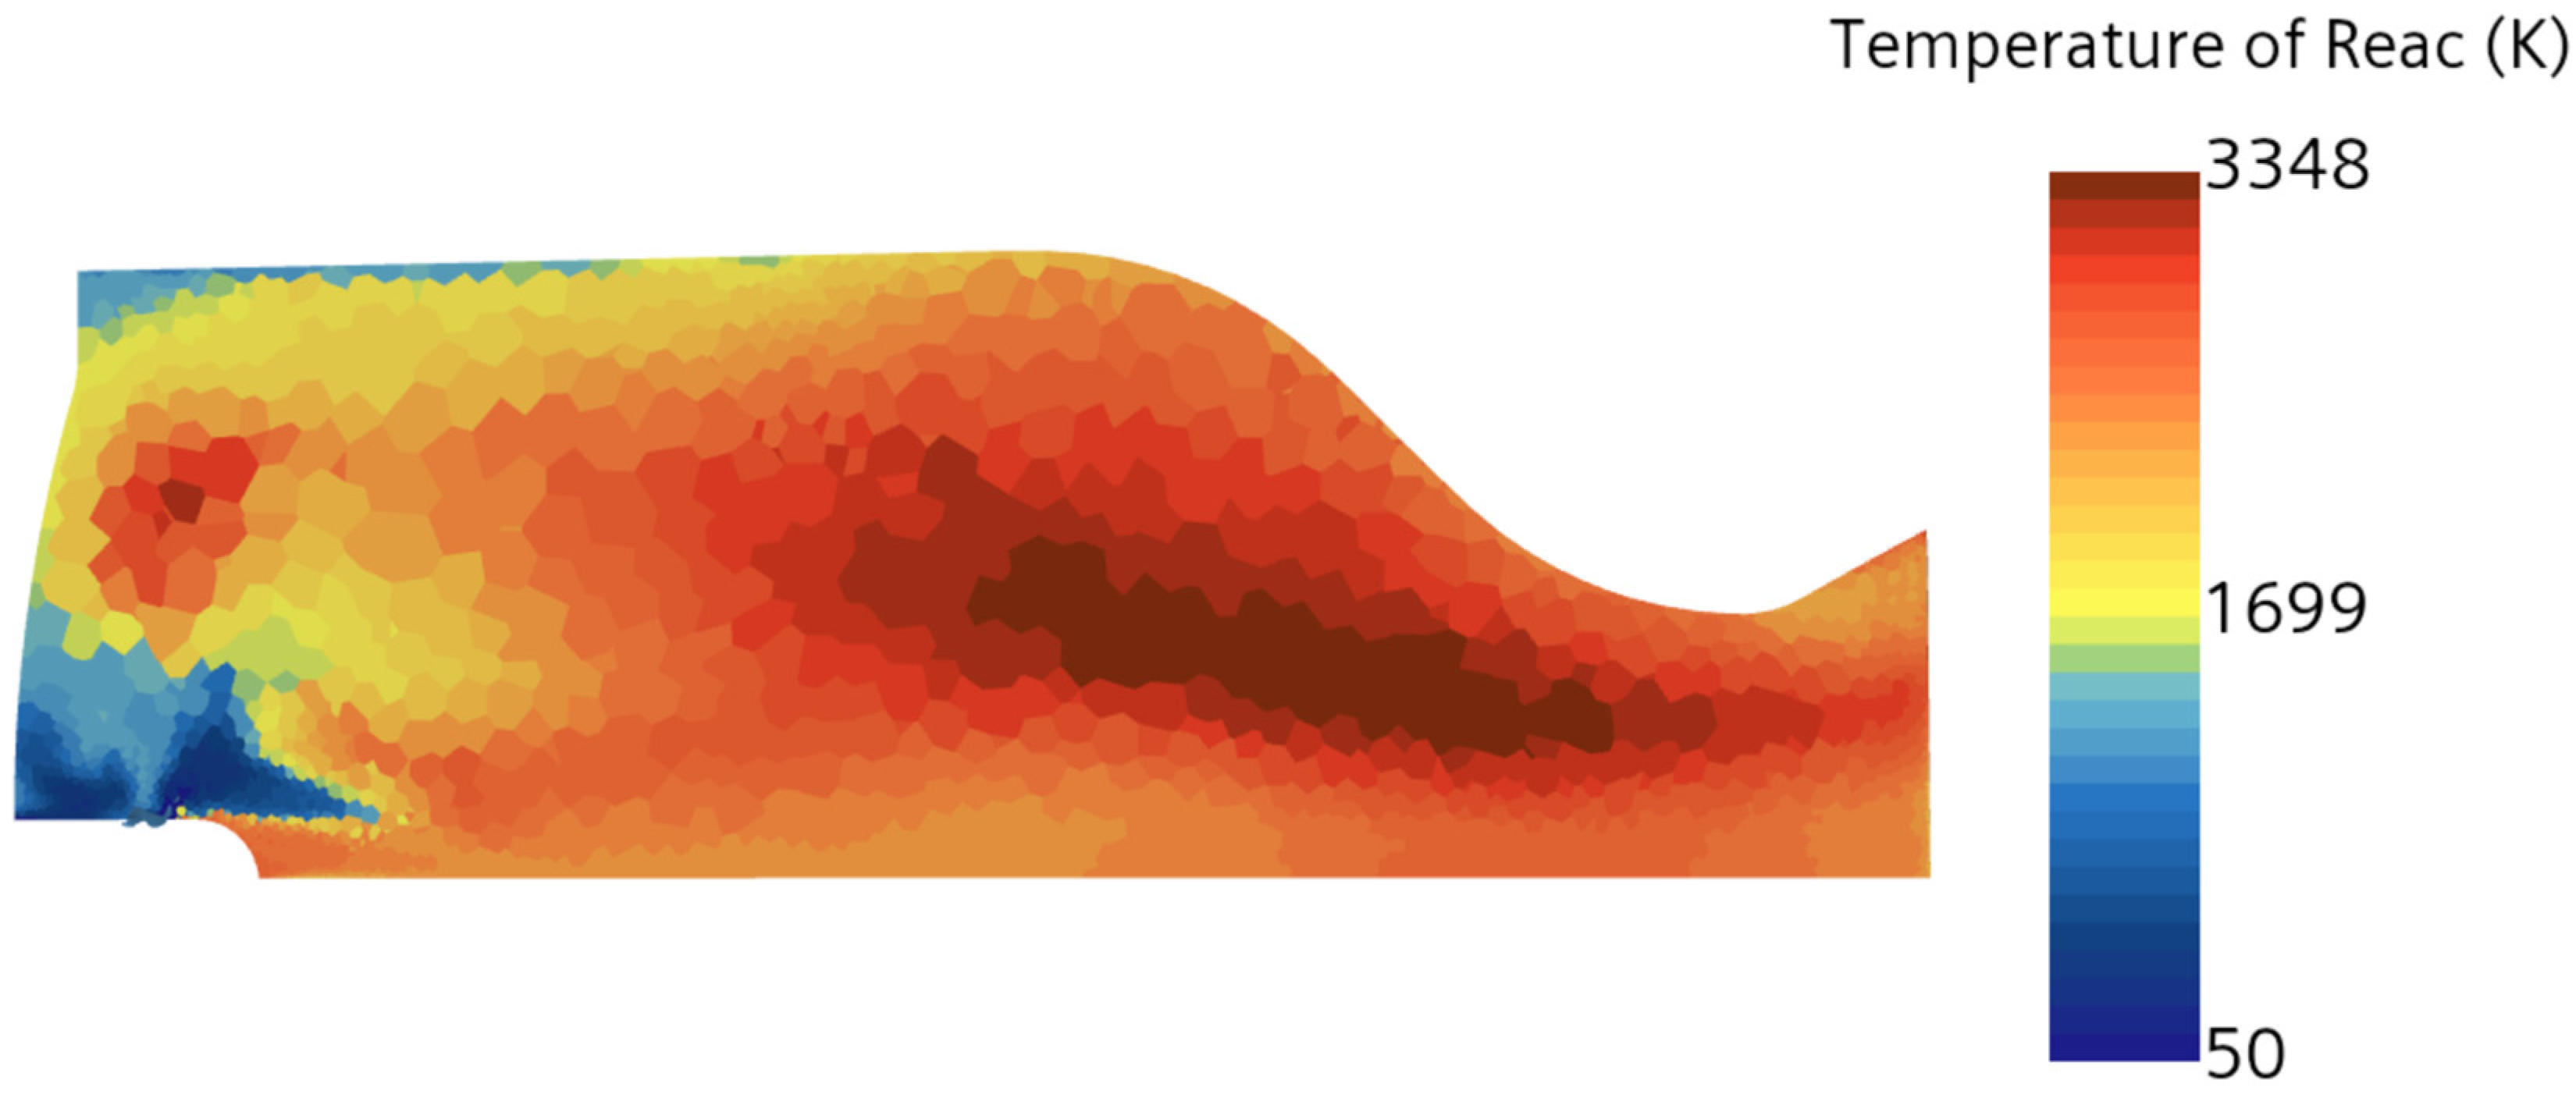
The temperature contour plot shown in Figure 13 shows a typical combustion temperature distribution in a LOX-LCH4 propulsion system. The central red and dark red areas represent the hottest regions, with temperatures nearing or exceeding 3000 K, indicating the combustion zone where chemical reactions produce substantial thermal energy. Surrounding this, the yellow and orange zones reflect intermediate temperatures of approximately 1500–2500 K, suggesting thermal dissipation as heat radiates outward. In contrast, the blue and light blue areas on the lower left show much cooler temperatures, dropping to around 50 K, likely where unburnt fuel and oxidizer enter the system or where cooling occurs due to contact with cooler surfaces. A steep temperature gradient, especially on the left side, indicates a rapid increase in temperature, possibly linked to ignition or the introduction of high-energy combustion products into cooler environments. This gradient becomes more gradual to the right, suggesting a more uniform temperature downstream, indicative of expanded hot gases and effective heat transfer.
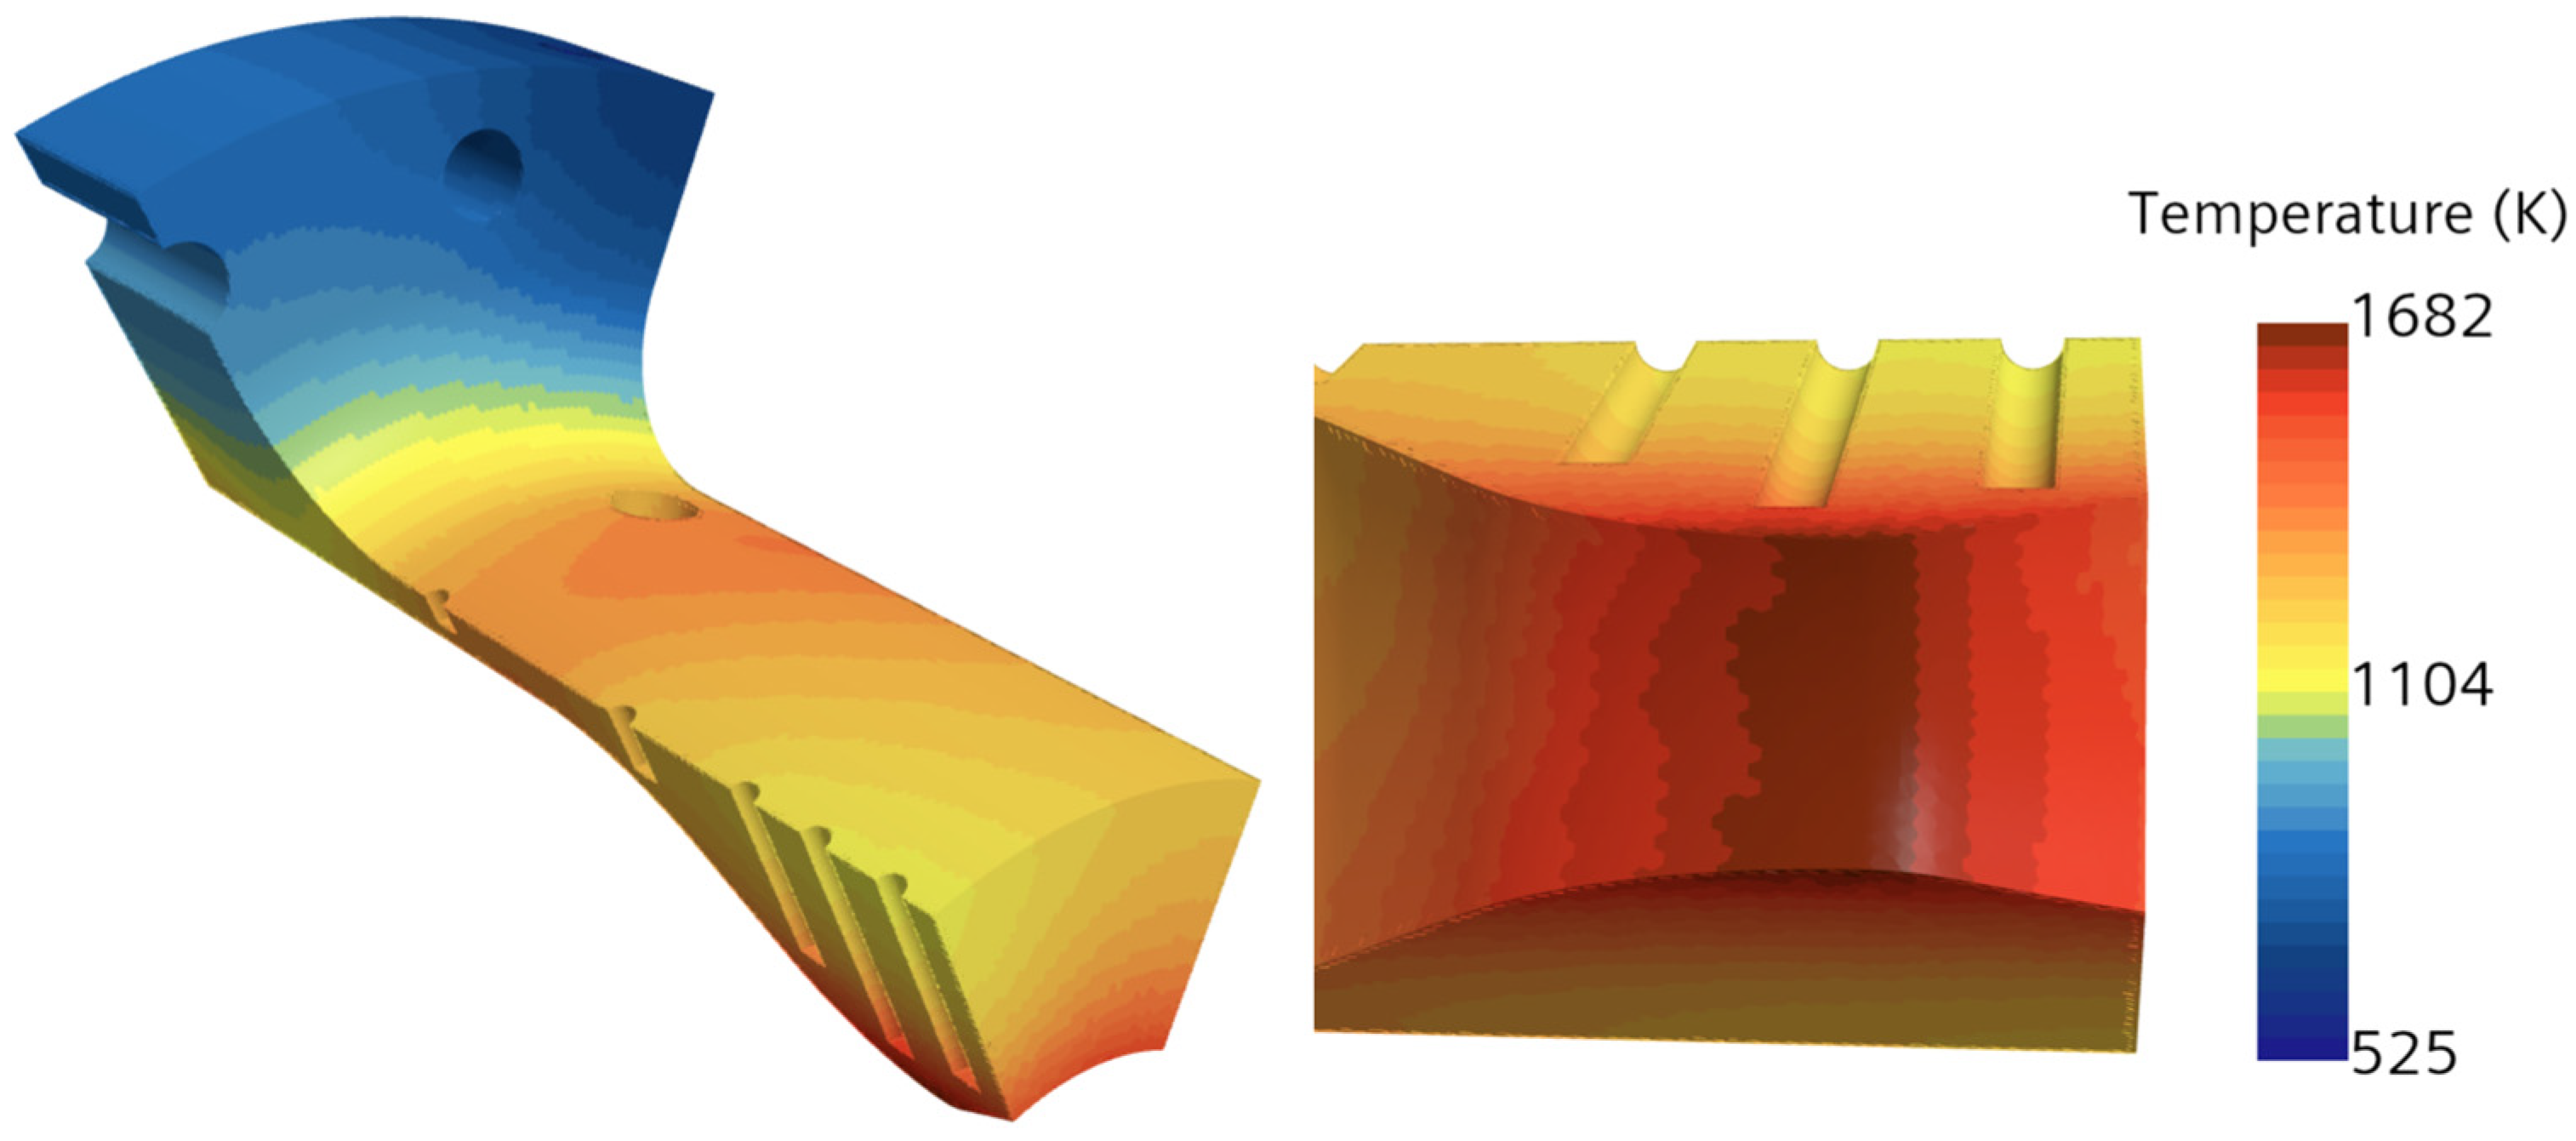
The surface temperature along the engine and nozzle wall ranges from 525 K to 1682 K (see Figure 14). The blue zone at the engine inlet indicates where the propellant enters through the injector plate, with surface wall temperatures between 525 K and 600 K. As anticipated, the temperature rises from the inlet to the nozzle exit, reaching 1600 K at the core of the engine chamber. The peak temperature (1682 K) occurs at the nozzle throat, which experiences the highest concentration of heating. Although the maximum surface temperature of 1682 K is close to the melting point range (1533 K to 1610 K) of Inconel 718 alloy, with an appropriate cooling mechanism, this temperature could be maintained within the expected limits. The authors want to highlight that while the EMP multiphase flow model with CC + EDC is used for combustion, STAR-CCM+ cannot simultaneously activate the FFC model. Consequently, this study does not include the effects of FFC on wall heat transfer and its implications for engine properties. However, the authors emphasize that if FFC is taken into account, a thin boundary layer will develop near the wall, leading to enhanced transport of both momentum and heat, which in turn changes the thermal and hydrodynamic velocity gradient. Analyzing this phenomenon will provide insights into how the thermal and hydrodynamic properties within the boundary layer influence engine core characteristics and contribute to combustion and engine sustainability. The authors intend to publish all this FFC information in a separate paper.
Based on Figure 13 and Figure 14, it is observed that the highest combustion temperatures occur in the nozzle’s converging section, particularly near the throat and between the walls and engine center. This is due to the concentration of chemical reactions, supported by previous combustion simulations (Figure 4, Figure 5 and Figure 6). Isentropic flow assumptions indicate that the exit temperature is lower than that at the combustion chamber entrance, implying higher temperatures inside the engine compared to the exit. This is consistent with Figure 14, which also reveals elevated temperatures at the throat and combustion chamber surface. Therefore, it can be inferred that these regions undergo the most significant heat transfer, in line with Equation (4)’s predictions, which assumes a constant k value owing to the engine’s uniform material composition.
The absolute pressure distribution in the combustion chamber shown in Figure 15 closely aligns with the theoretical target of 70 psia. As the flow transitions through the nozzle, a significant pressure drop occurs, particularly noticeable at the exit where the pressure falls below atmospheric levels, indicating over-expanded flow conditions (Pexit < Patm). This behavior is especially prominent in the upper nozzle region. Despite this drop, the observed pressure gradient conforms to isentropic flow principles, resulting in elevated pressures prior to the engine throat and reduced pressures in the nozzle’s downstream region, consistent with established theoretical expectations [66,72].
The Mach number contours illustrated in Figure 16 reveal a substantial flow acceleration as the exhaust transitions from the combustion chamber inlet to the convergent nozzle. The flow reaches Mach 1 at the nozzle throat and further accelerates to a peak Mach number of 1.8 at the exit. This significant increase in Mach number signifies the onset of shock waves, which are characteristic of supersonic flow regimes. Such behavior is consistent with the expected dynamics of compressible gas flow through the Condi nozzle, directly contributing to the thrust depicted in Figure 12. The thrust generation is primarily driven by the momentum component, assuming a constant mass flow rate, as outlined in reference [72]. However, a section of minimum Mach values is observed at the top of the exit surface contour, which is attributed to the relaxation factors employed in the simulation.
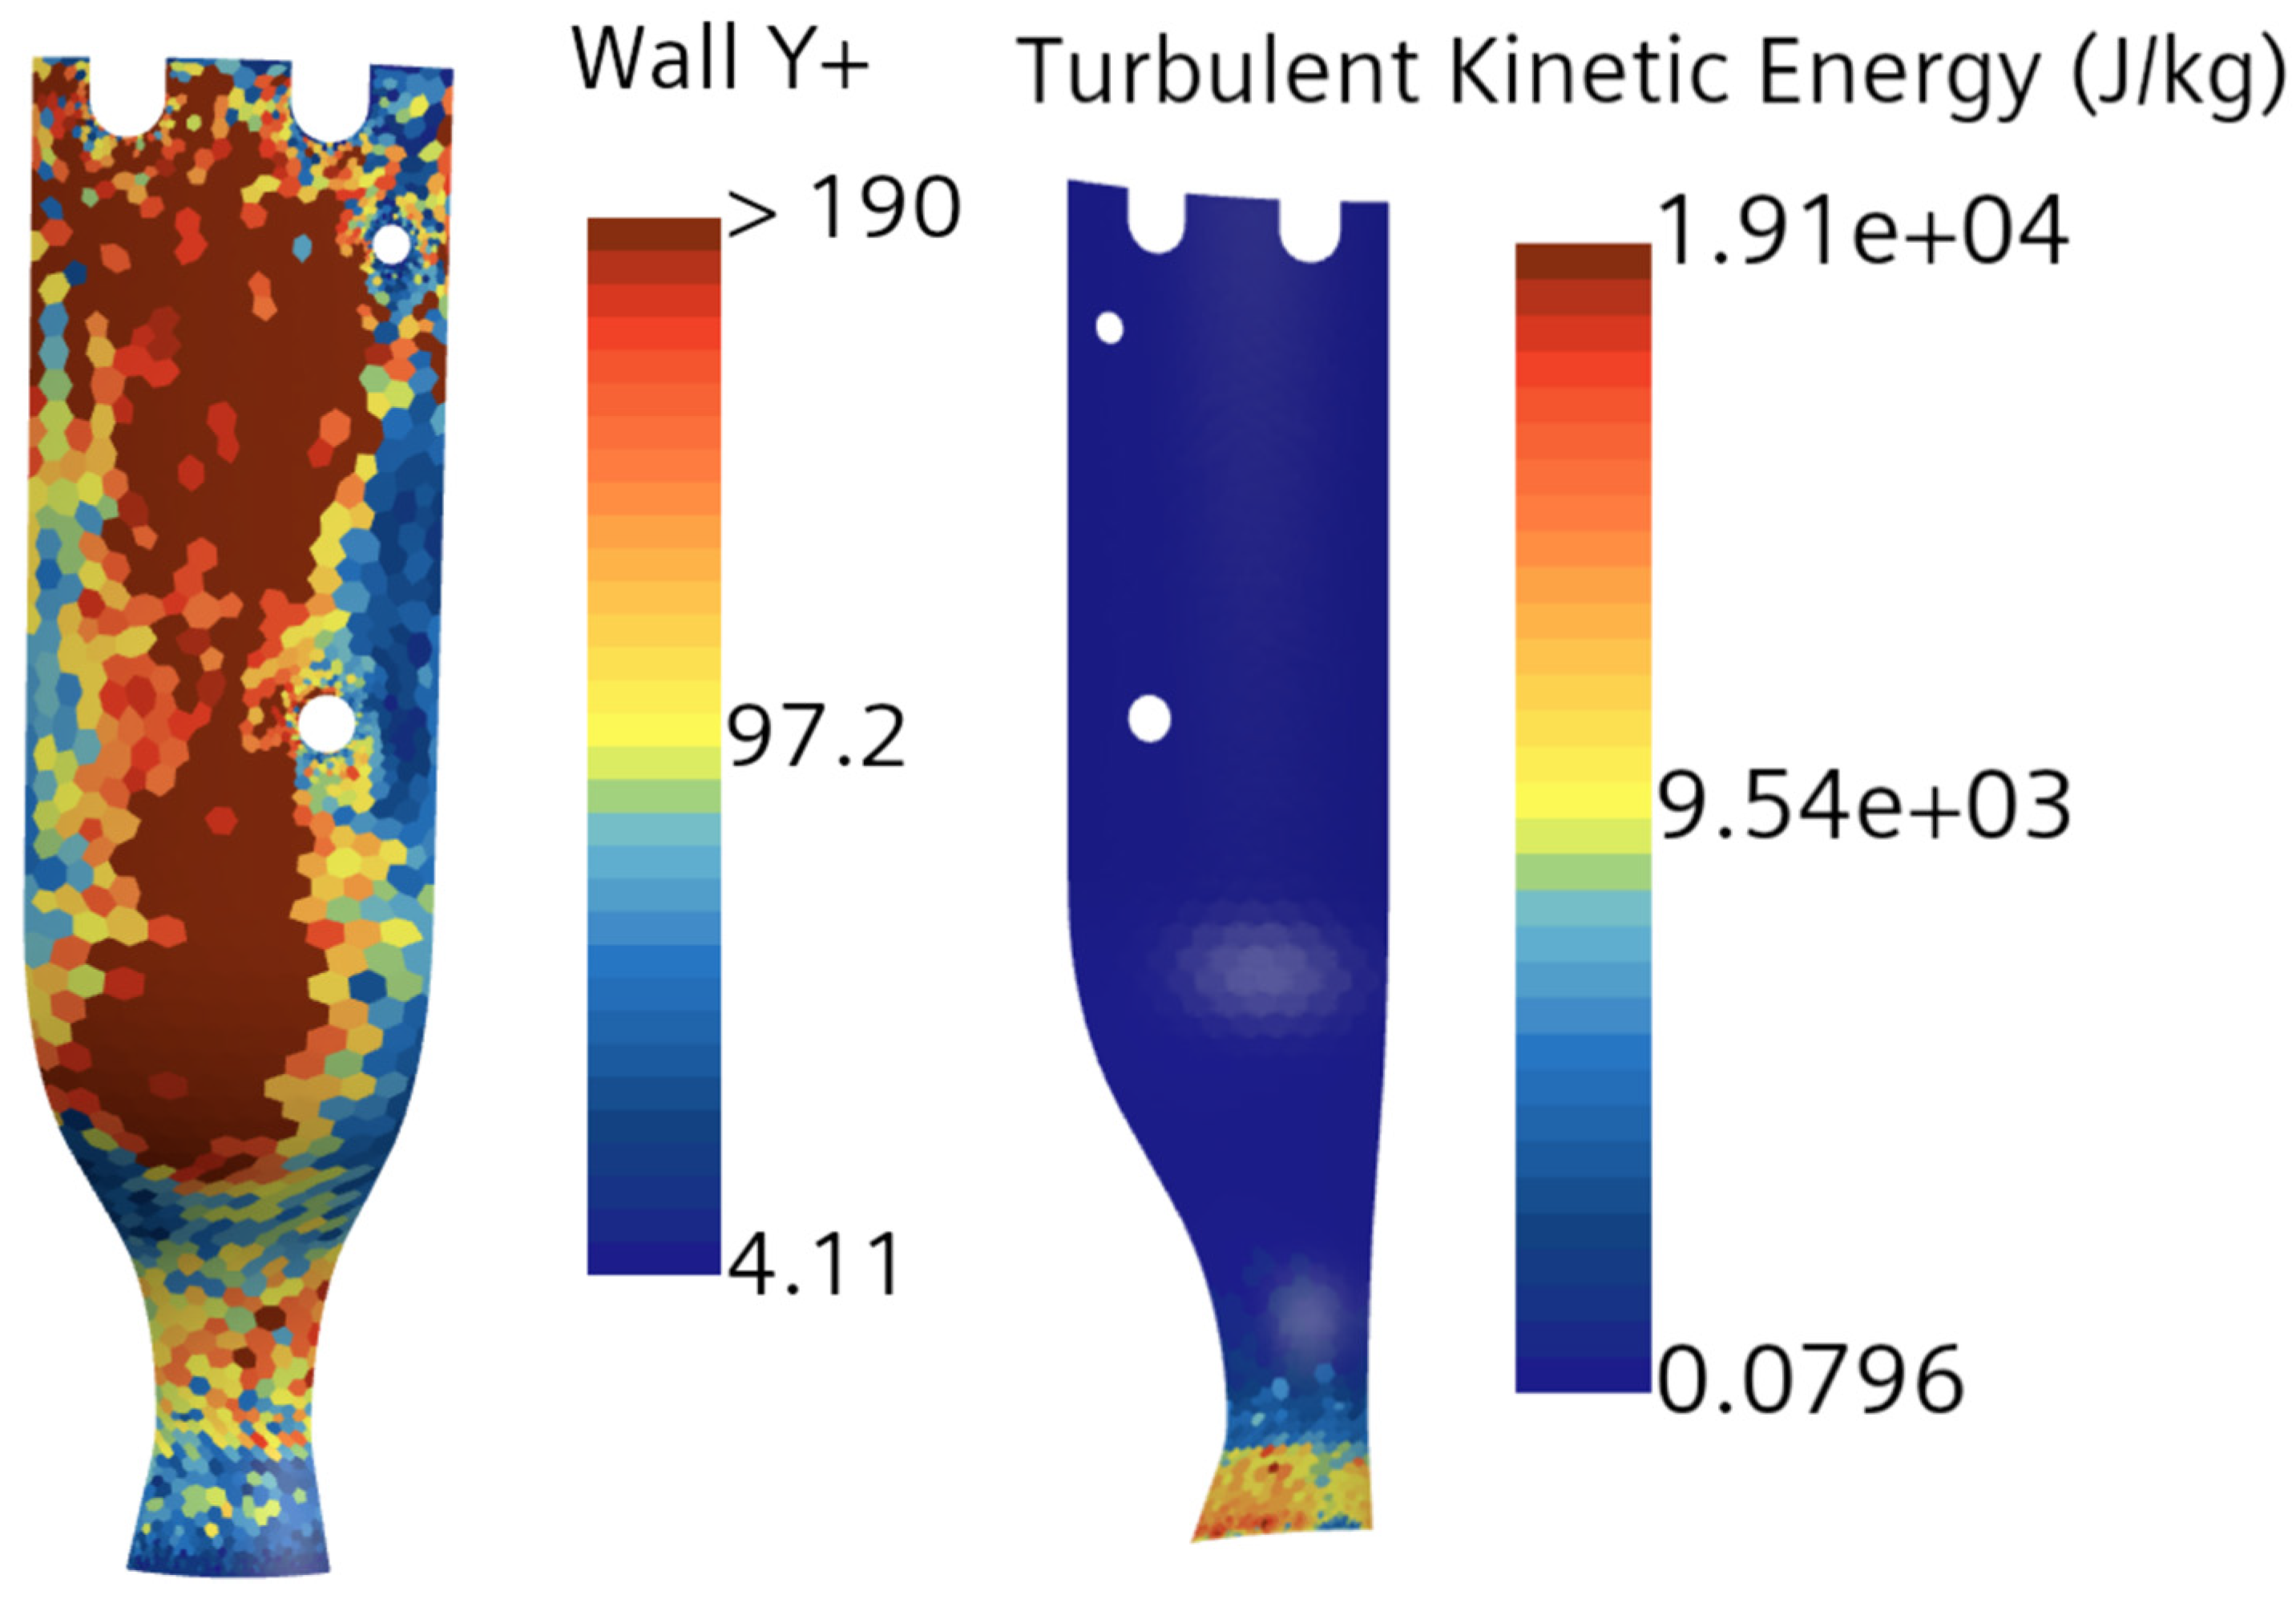
Figure 17 illustrates the impact of viscous effects on Y+ values near the wall and toward the center of the chamber. It highlights whether the near-wall flow is accurately resolved, which can significantly influence predictions of kinetic energy and vorticity in a combustion chamber or other flow environments. In the figure, Y+ values are lower near the wall (e.g., 4.11), where viscous effects dominate due to the steep velocity gradient from the no-slip condition, resulting in a thicker viscous sublayer. Since the Y+ value is less than 5, it indicates a well-resolved near-wall region, allowing for an accurate representation of viscous effects and turbulence. In contrast, the Y+ values are higher in the center of the flow (100 to >190), where inertial forces become more significant and viscous effects diminish. As expected, these higher Y+ values are concentrated mainly in the combustion chamber, with fewer occurrences near the throat. The authors also compare the Y+ values with the turbulent kinetic energy (TKE) distribution within the chamber. TKE levels are low inside the chamber (0–5 J/kg) but increase significantly near the wall (9.54 × 10³ to 1.91 × 10⁴ J/kg), confirming the presence of higher Y+ values in the core and lower values near the wall.
Table 9 and Figure 18 show how closely the simulation results match those from NASA CEA at a thrust level of 125 lbf. The Mach number at the nozzle exit indicates a deviation, with the CEA predicting a value of 1.86, while the simulation output shows 1.52, resulting in an 18.4% difference. The combustion chamber temperature also exhibits a divergence, recorded at 3065 K in the CEA and 3348 K in simulation, yielding a 9.2% increase. Chamber pressure remains relatively consistent, with the CEA at 70 psia and the simulation output at 69 psia, reflecting only a 1.4% deviation. However, thrust performance shows a considerable reduction; the CEA anticipates 133.52 lbf, contrasting with the simulation’s 113.48 lbf, resulting in a 15.0% discrepancy. However, these deviations are expected as CEA is an adiabatic and equilibrium analysis compared to the non-adiabatic, non-equilibrium STARCCM analysis, as discussed earlier in this paper.

3.3. Engine Flow and Combustion Characteristics at F = 500 lbf

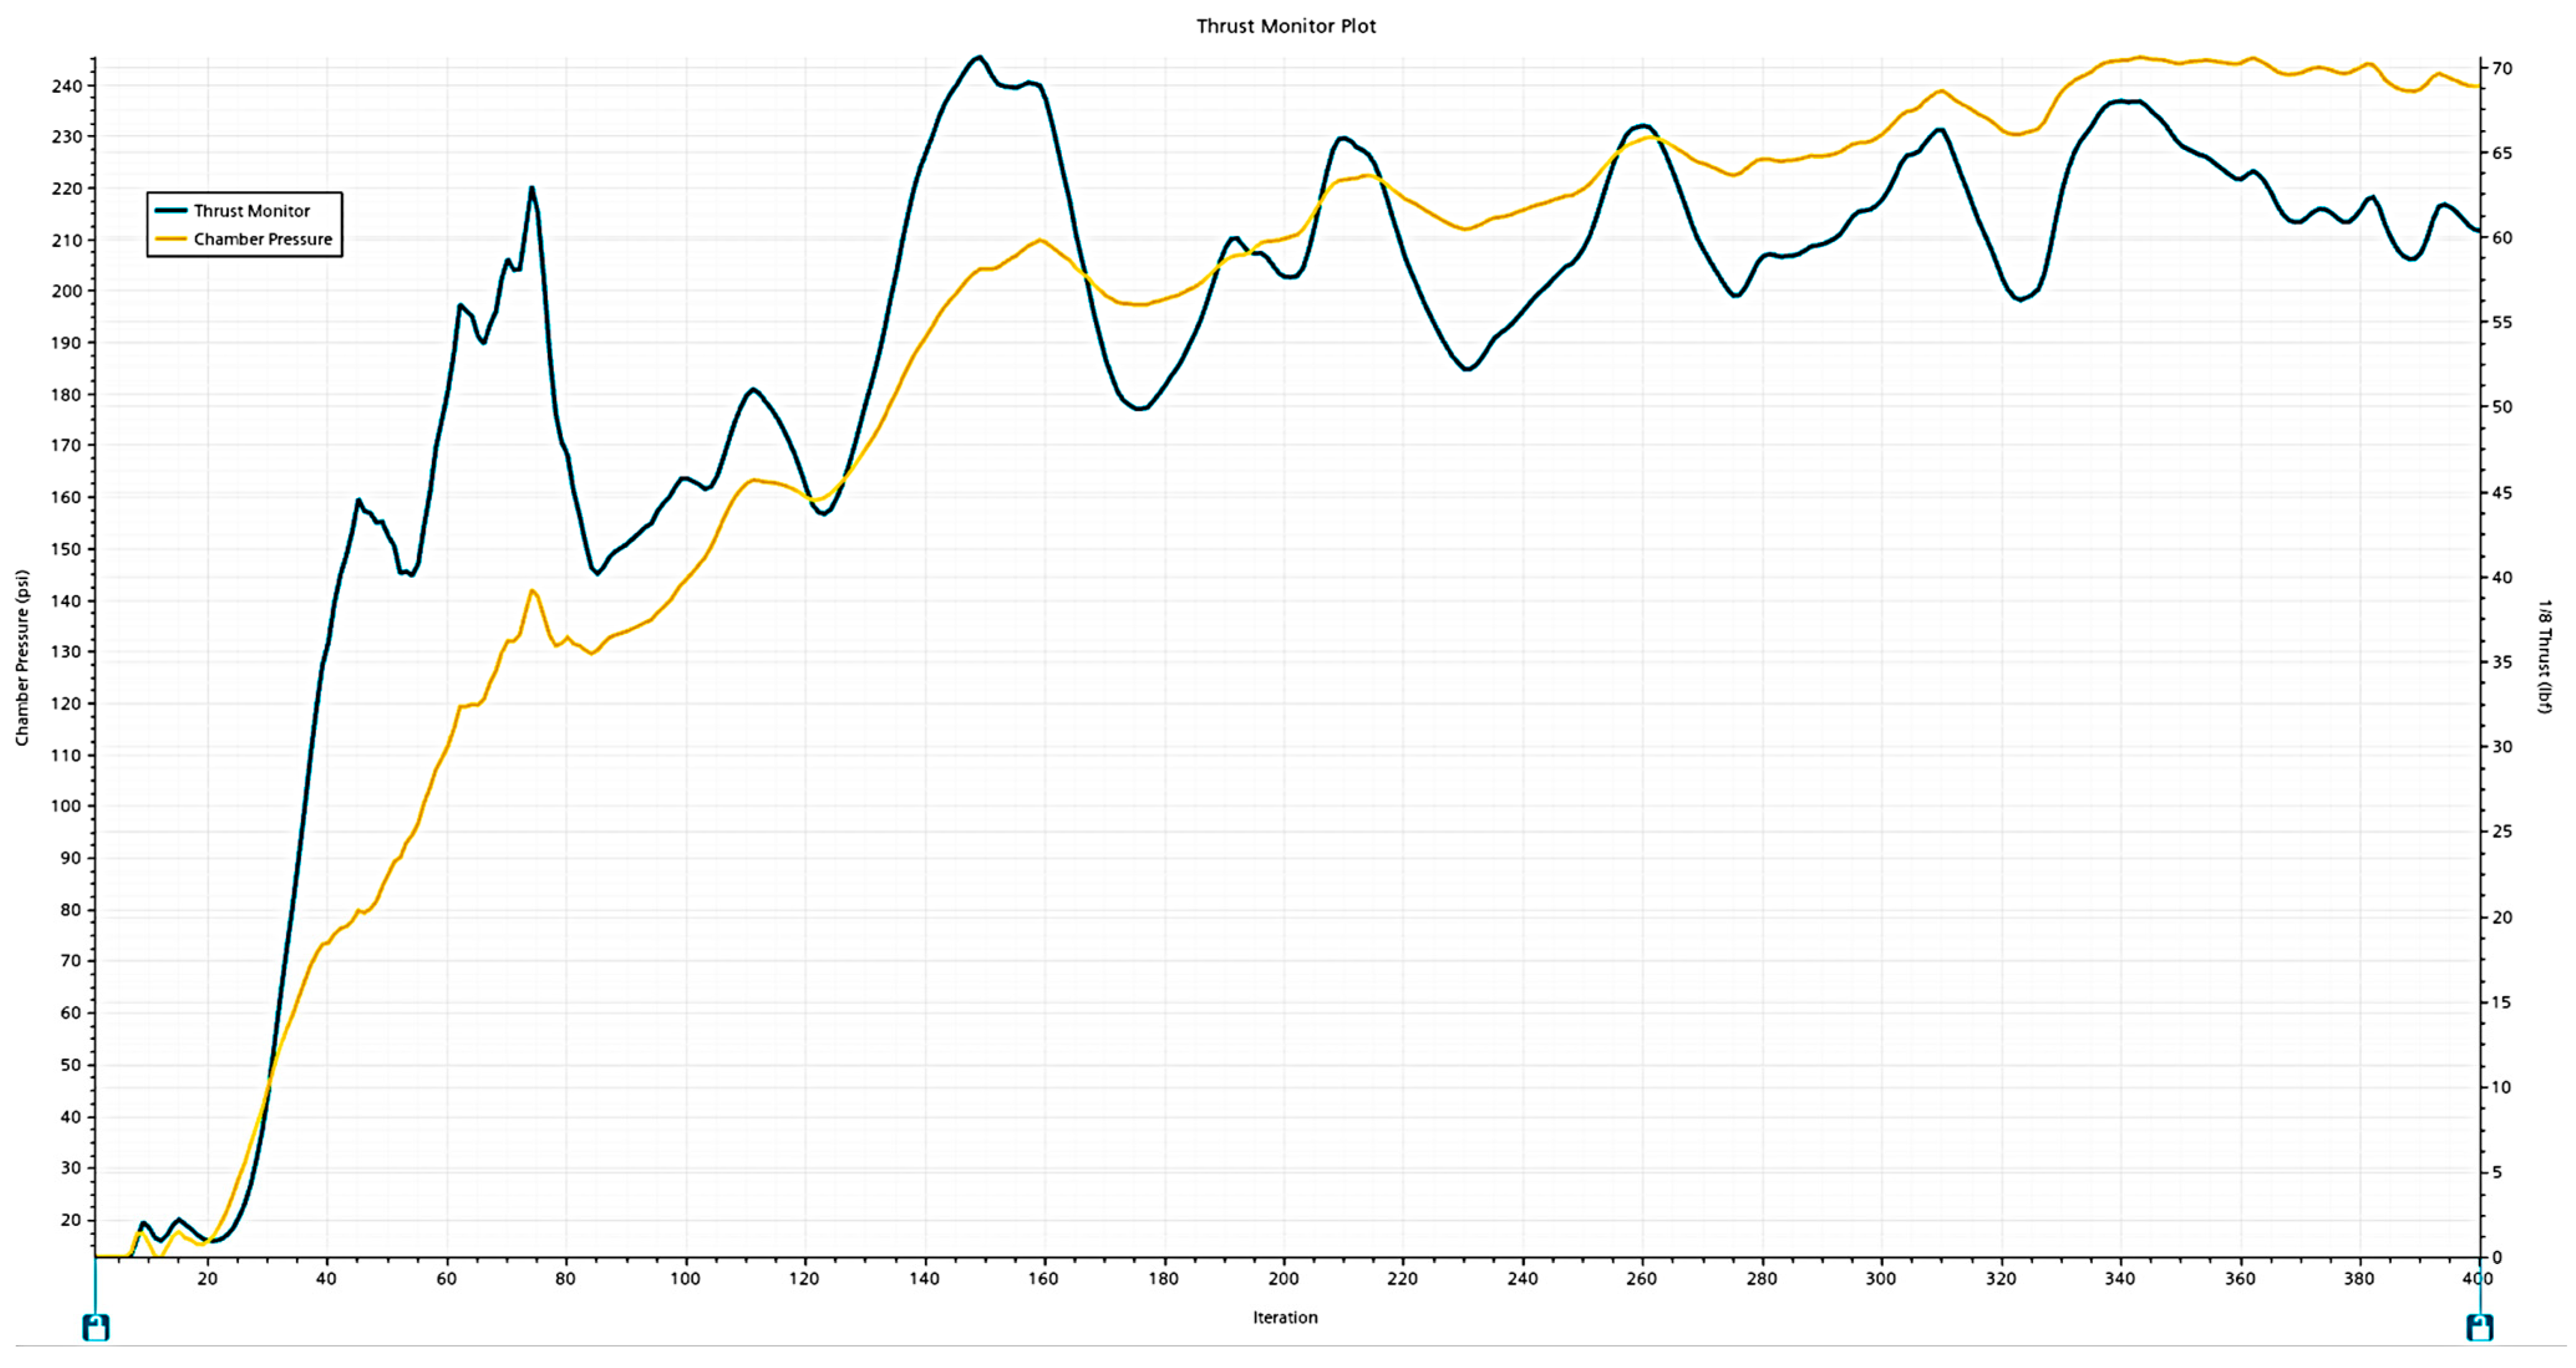
The authors performed combustion modeling to analyze the interactions between combustion and flow at the maximum limit of 500 lbf for this CROME. Like the 125 lbf case, both the chamber pressure and thrust in this instance also exhibited transient behaviors (see Figure 19). The results varied around a chamber pressure of 241 psia and a thrust of 61 lbf in the one-eights section, totaling 488 lbf of thrust. This results in a relative error of 2.4% from the intended design target of 500 pounds of thrust and an 8.56% error compared to the value obtained from NASA CEA calculations. As explained before, these deviations are expected because of the nature of the CEA and STAR-CCM+ models.
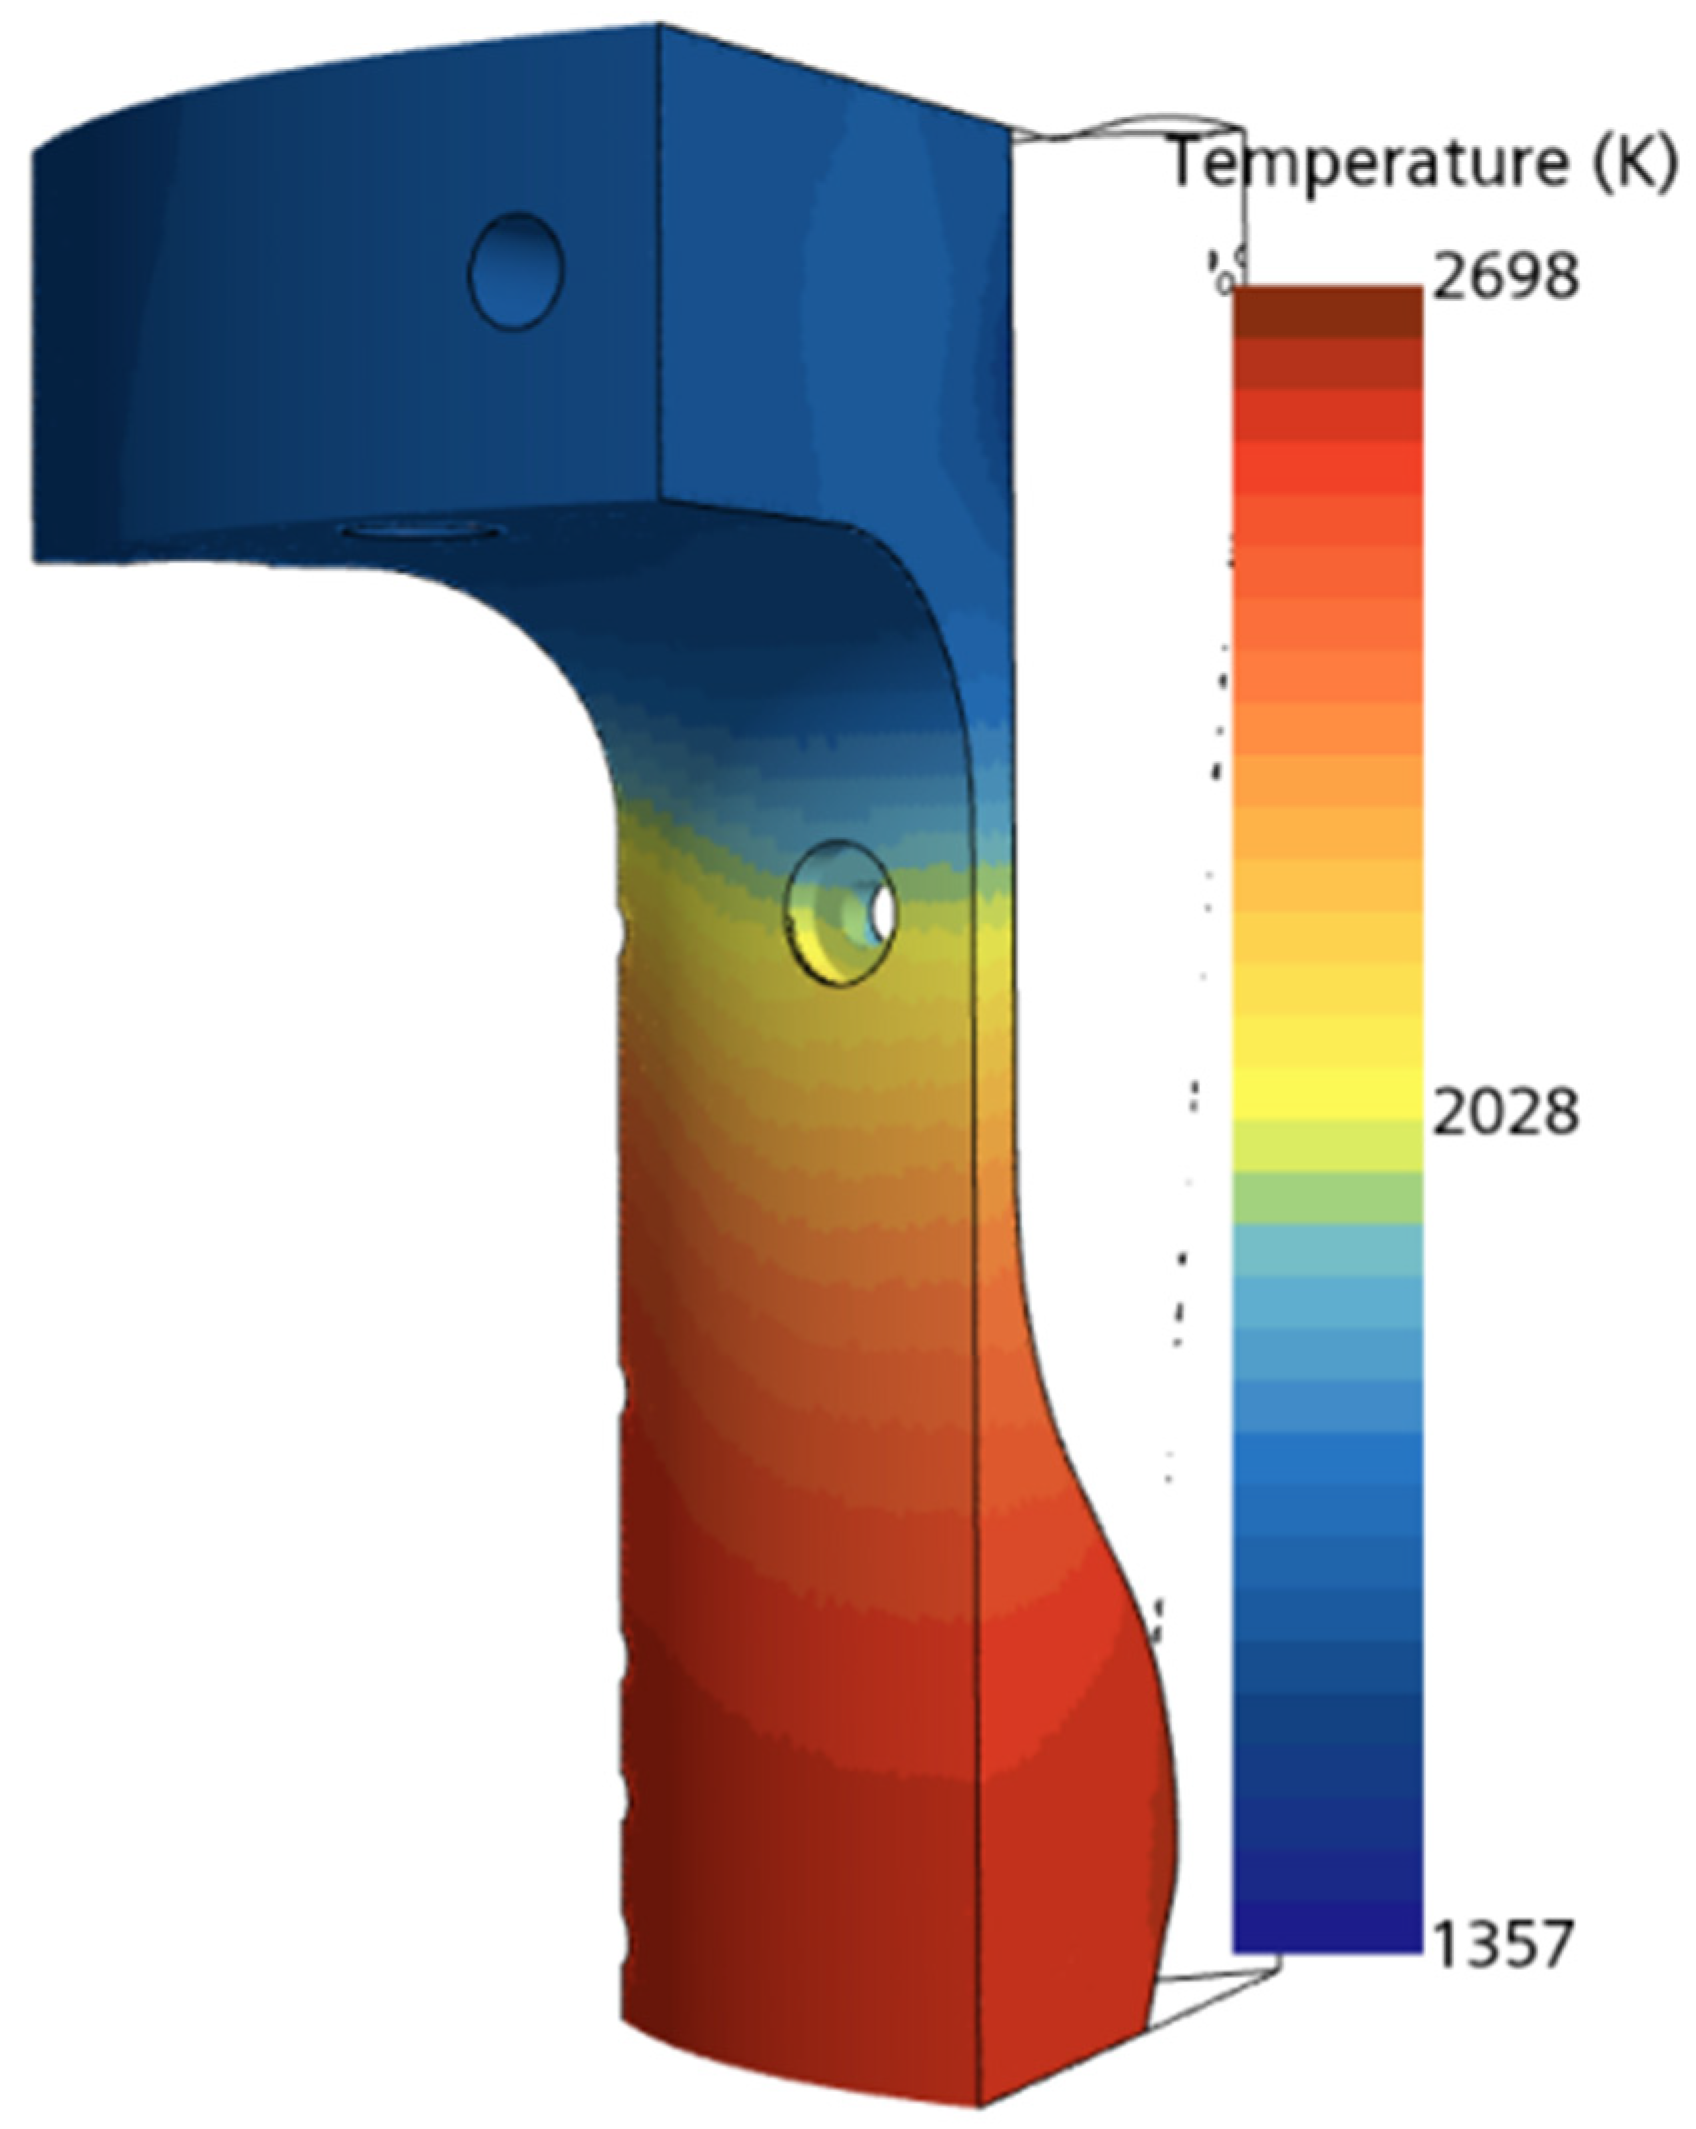
The engine and nozzle wall temperatures range from 1357 K to 2698 K (see Figure 20). The blue zone at the engine inlet, where the propellant enters through the injector plate, shows surface wall temperatures between 1357 K and 1400 K. As expected, temperatures increase towards the nozzle exit, peaking at 2400 K in the engine core. As expected, the highest temperature, 2698 K, is observed at the nozzle throat. The authors again want to highlight that fuel film cooling was not included in this simulation; however, based on the analysis, if 28% to 30% FFC is implemented, the surface temperature could be maintained below the critical melting point of Inconel 718 (1533 K to 1610 K). The authors will disseminate the FFC results in a separate publication.
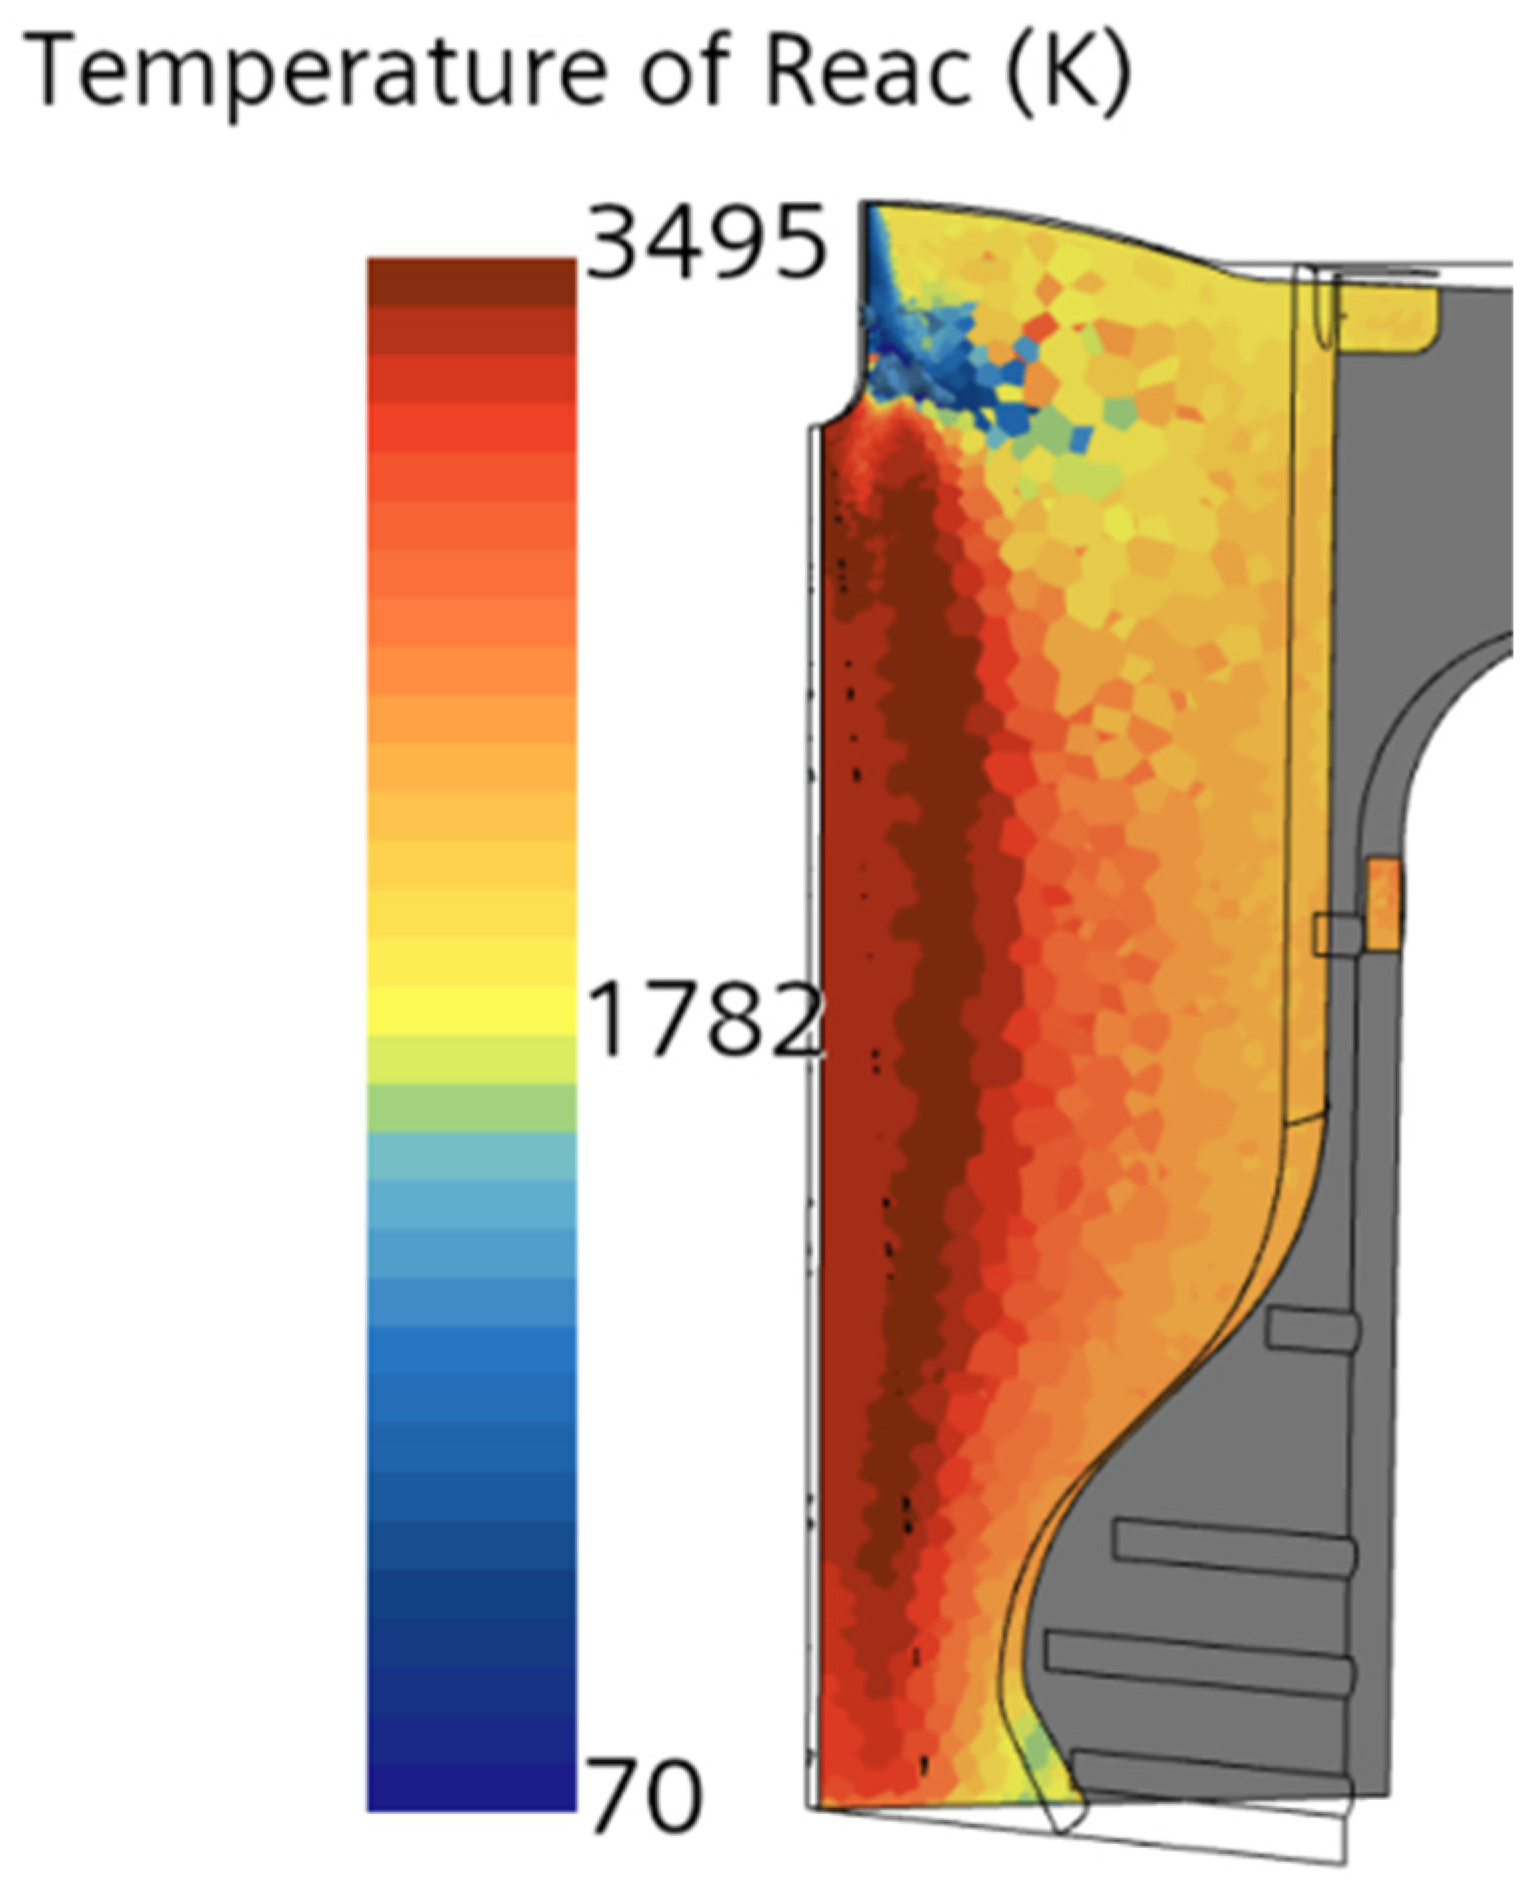
Figure 21 illustrates the gas temperature contour of the CROME in a steady-state condition. The central red areas where chemical reactions generate significant thermal energy show a peak temperature of 3495 K in the combustion zone. Surrounding regions in yellow and orange where heat dissipation occurs indicate temperatures between 1650 and 2650 K. Conversely, blue areas that have mostly unburnt fuel or oxidizer reflect cooler temperatures around 70 K. In comparing Figure 20 and Figure 21, it is evident that surface temperatures predominantly increase along the engine outlet axis, surpassing those recorded in the 125 lbf scenario. However, higher temperatures are concentrated in the nozzle throat, as previously noted. Figure 21 shows wider temperature contours extending from the engine wall to the nozzle exit, unlike the earlier case where the highest temperature was confined to the throat. The peak combustion temperature is also elevated, due to the greater mass flow of the fuel and oxidizer. Moreover, the temperature difference from an isentropic flow assumption is more significant in higher-thrust cases, aligning with previous findings [72].
The Mach number contours shown in Figure 22 indicate a significant increase in flow velocity as the exhaust moves from the combustion chamber inlet to the convergent nozzle. The flow achieves Mach 1 at the nozzle throat and continues to accelerate, reaching a maximum Mach number of 2.4 at the exit. This difference in exit Mach numbers is related to the variations in temperature ratios between the nozzle inlet and exit, according to isentropic principles [66,72]. Some slight variations near the section wall remain, likely due to model settings, similar to findings in earlier cases but with lower peak values.
The pressure distribution in the combustion chamber, as depicted in Figure 23, exceeds the anticipated theoretical target of 235 psia. As the flow moves through the nozzle, there is a notable drop in pressure, especially at the exit. Nevertheless, the pressure at the nozzle exit remains above atmospheric levels, indicating under-expanded flow conditions (Pexit > Patm), which affects engine efficiency. This effect is particularly evident in the upper part of the nozzle.
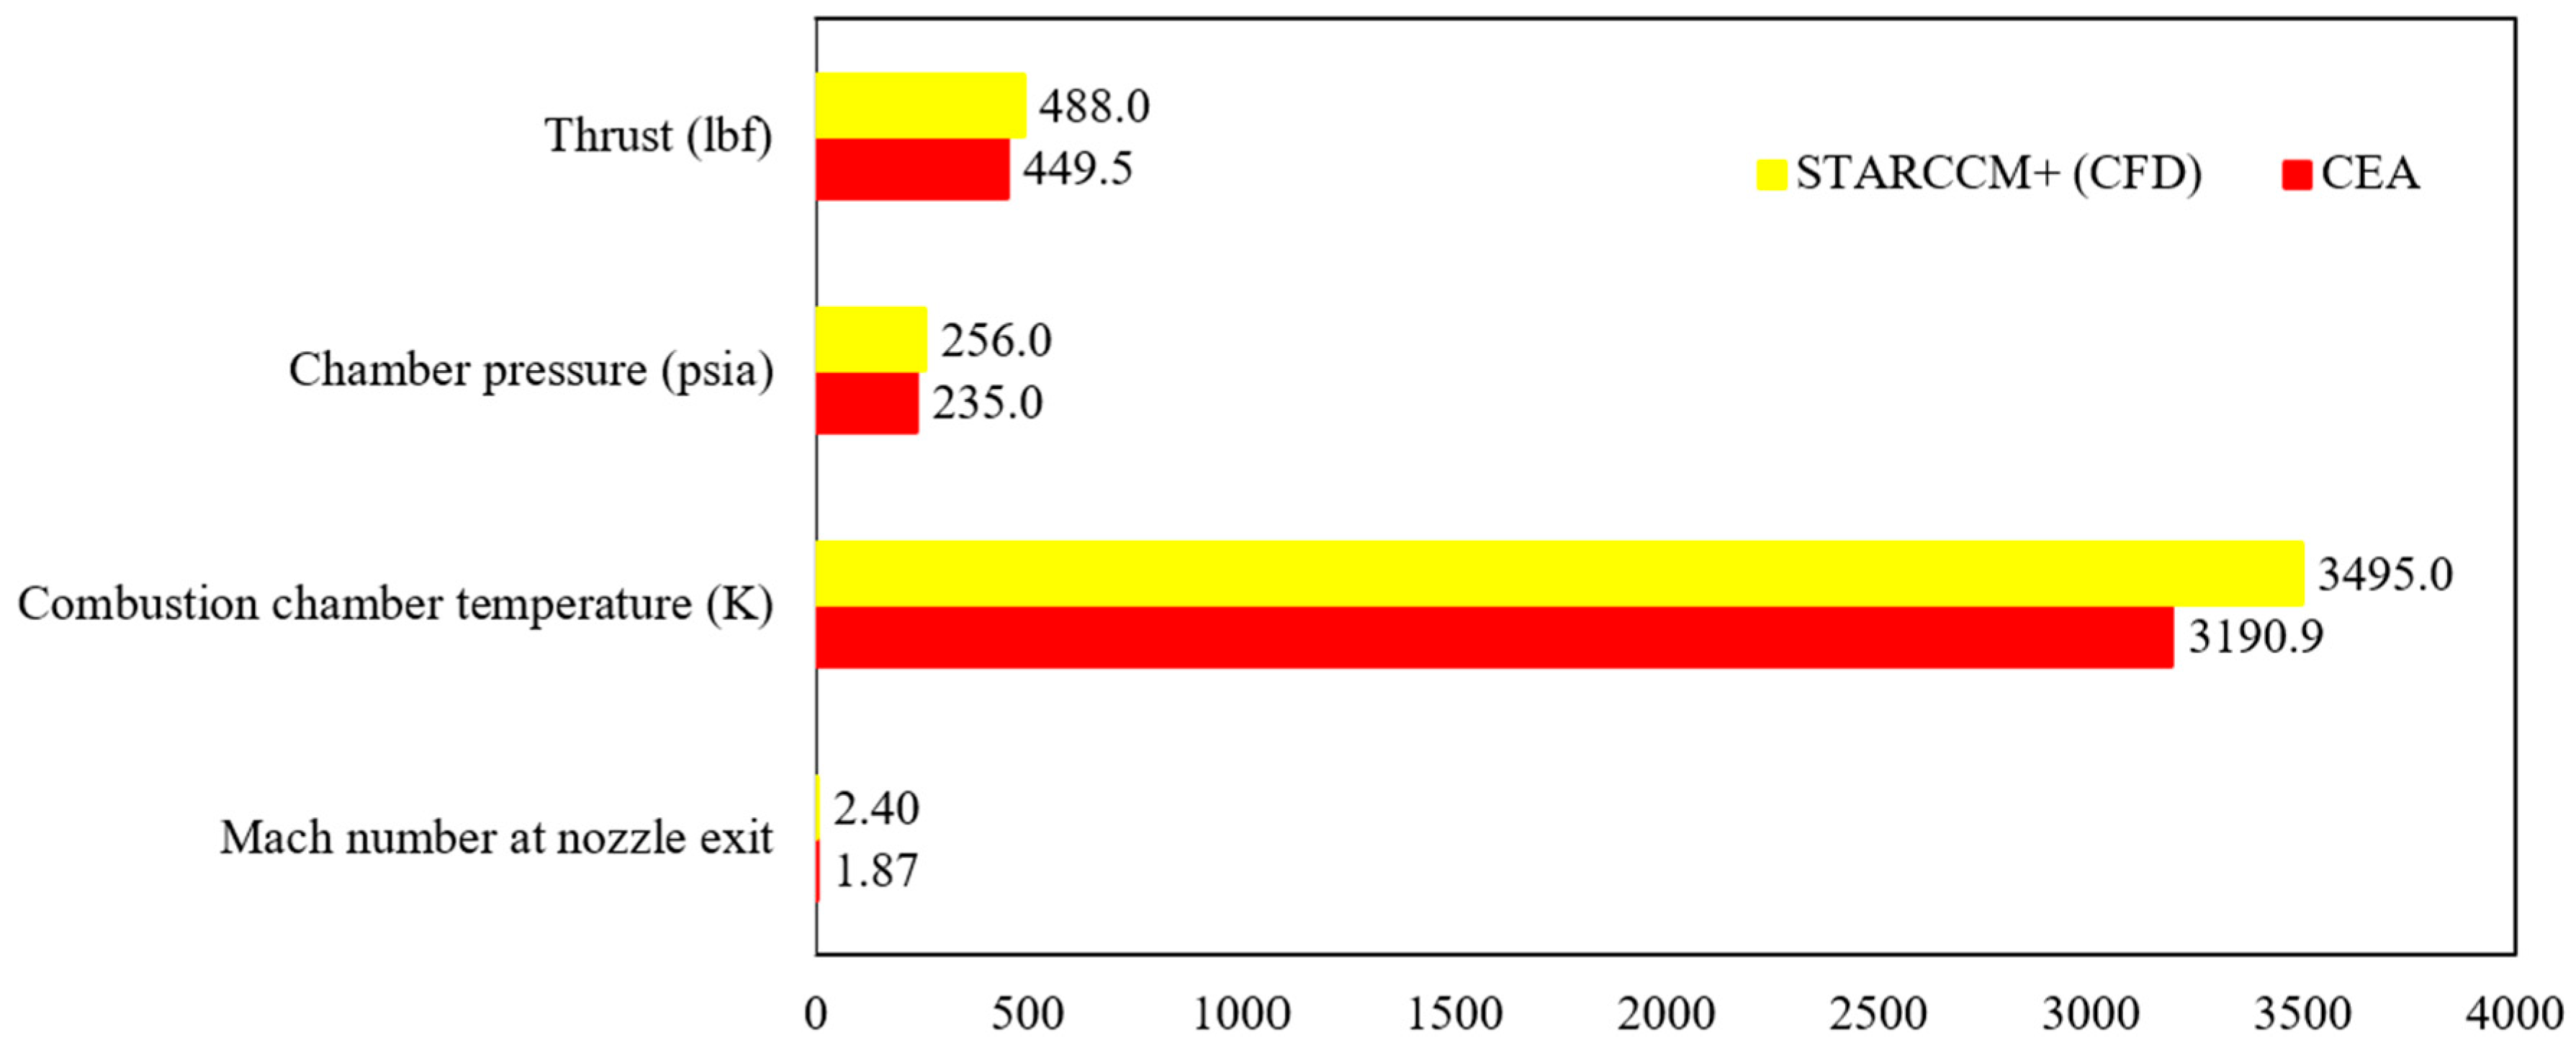
Table 10 and Figure 24 illustrate the degree of deviation between the simulation results and those obtained from NASA’s CEA at a thrust level of 500 lbf. The Mach number at the nozzle exit reveals a discrepancy, with the CEA predicting a value of 1.87, while the simulation yields 2.40, indicating a difference of 28.5%. Similarly, the combustion chamber temperature shows a divergence, recorded at 3190.9 K in the CEA and 3495.0 K in the simulation, representing a 9.5% increase. Chamber pressure also differs, with the CEA measuring 235.0 psia and the simulation showing 256.0 psia, resulting in an 8.9% deviation. On the other hand, thrust performance shows a notable increase; the CEA forecasts 449.5 lbf, while the simulation reports 488.0 lbf, leading to an 8.6% difference. As discussed earlier in this paper, these discrepancies are anticipated, as the CEA and STAR-CCM+ analyses are based on ideal and real-world assumptions, respectively.

4. Conclusions

This study examined the performance of a liquid rocket engine using NASA’s chemical equilibrium analysis (CEA), focusing on 125 lbf and 500 lbf thrust cases. While theoretical thrust predictions were close to the CEA results, deviations ranging from 1.4% to 28.5% were observed in STAR-CCM+ simulations. These deviations are expected as theoretical analysis is an equilibrium adiabatic analysis that uses major species to predict the combustion characteristics. In contrast, the NASA CEA method is a zero-dimensional, steady-state, single-phase approach with ideal gas equilibrium adiabatic calculation using minor species, while CFD is closer to the reality and facilitates multiphase, turbulent flow with heat loss and inhomogeneous non-equilibrium calculation. Within the computational analysis, a Monte Carlo (MC) simulation was employed to assess the impact of substituting LNG for LCH4, showing that LNG composition affects combustion temperature, a factor to consider in future testing. Additionally, a separate CFD analysis compared the computational efficiency of GRI 3.0 and Lu reaction mechanisms for methane, revealing minimal deviations between the reduced and complete models, with a slight ignition delay observed. Together, these simulations show the need for refined models to better predict real-world rocket engine performance and support the development of digital twins of the CROME.
For the 125 lbf case, the temperature contours illustrate that the highest combustion temperatures, approaching 3000 K, occur in the nozzle’s converging section, particularly near the throat, supporting the concentration of chemical reactions in this region. This gradient becomes more gradual to the right, suggesting a more uniform temperature downstream, indicative of expanded hot gases and effective heat transfer. A deviation of 9.2% was observed in the combustion chamber temperature between the CEA and STAR-CCM+ analyses. The observed pressure distribution aligns with theoretical predictions (70 psi), indicating over-expanded flow conditions (Pexit < Patm) at the nozzle exit. Mach number contours show flow acceleration to Mach 1.8, with an 18.4% difference from CEA predictions. Thrust performance was lower, with the simulation yielding 113.48 lbf, a 15.0% difference from the 133.52 lbf predicted by the CEA. The Y+ values highlight the influence of viscous effects on flow dynamics, indicating lower values near the wall where turbulence is increased. For the 125 lbf case, temperature contours show the highest combustion temperatures, nearing 3000 K, concentrated in the nozzle’s converging section near the throat, confirming significant chemical reactions in this region. A more gradual temperature gradient downstream indicates uniform expansion of hot gases and effective heat transfer. A 9.2% deviation in combustion chamber temperature was noted between the CEA and STAR-CCM+ analyses. Pressure distribution aligns with theoretical predictions at 70 psi, suggesting over-expanded flow conditions (Pexit < Patm) at the nozzle exit. Mach number contours show flow acceleration to Mach 1.8, with an 18.4% difference from the CEA predictions. Thrust performance was lower, with the simulation yielding 113.48 lbf, a 15.0% difference from the 133.52 lbf predicted by the CEA. The Y+ values indicate increased turbulence near the wall, driven by viscous effects. Despite some deviations, the simulation results closely align with NASA CEA and theoretical benchmarks, with variations attributed to non-adiabatic conditions.
For the 500 lbf case, the analysis showed expected transient variations in chamber pressure and thrust, with the thrust reaching 488 lbf—2.4% below the design target (500 lbf) and 8.6% higher than NASA CEA predictions (449.5 lbf). The simulation produced a nozzle exit Mach number of 2.40, compared to 1.87 from the CEA, indicating a 28.5% difference. The combustion chamber temperature in the simulation was 3495 K, a 9.5% increase from the CEA’s 3190.9 K, while chamber pressure was 256 psia, deviating by 8.9% from the CEA’s 235 psia. Engine and nozzle wall temperatures ranged from 1357 K to 2698 K, with the highest values at the nozzle throat. Although fuel film cooling was not considered, a 28–30% fuel film cooling application could keep surface temperatures below the Inconel 718 melting point. This study also noted under-expanded flow (Pexit > Patm) and Mach number discrepancies, largely due to real-world factors. For the 500 lbf case, the findings demonstrated anticipated transient behavior in both chamber pressure and thrust, achieving a thrust of 488 lbf, which corresponds to a 2.4% relative error from the target of 500 lbf and an 8.6% deviation from NASA CEA calculations (449.5 lbf). At the nozzle exit, the Mach number exhibited a notable discrepancy, with the CEA predicting 1.87 compared to the simulation’s 2.40, indicating a 28.5% difference. The combustion chamber temperature also varied, recorded at 3190.9 K in the CEA and 3495.0 K in the simulation, marking a 9.5% increase. Similarly, chamber pressure was measured at 235.0 psia in the CEA versus 256.0 psia in the simulation, resulting in an 8.9% deviation. The nozzle and engine wall temperatures spanned from 1357 K to 2698 K, peaking at the nozzle throat. Although fuel film cooling was excluded from the analysis, the study suggests that implementing 28–30% fuel film cooling could keep surface temperatures below Inconel 718’s melting point. The simulation also revealed under-expanded flow conditions (Pexit > Patm) and discrepancies in Mach numbers relative to NASA CEA results, largely due to real-world factors. The authors believe that the flow and combustion models detailed in this paper, along with the established correlations between turbulence and combustion characteristics across varying thrust conditions, will significantly benefit the scientific community in the design, testing, and validation of the LOX/LCH4 propellant feed system and engine.

5. Future Work

As part of the future work on the current model, intermediate cases of 250 lbf and 375 lbf will be run to obtain predictive results before testing the actual system. Additionally, research will be conducted to improve the model while continuing to use the STAR-CCM+ CFD software. After completing the intermediate cases and enhancing the steady-state model, the team will develop a transient model to understand the margin of the steady-state processes. The team will maintain the current methodology initially, adjusting as necessary. This new model will consider all four cases, potentially providing better insights into system performance, timing, and required real-life modifications.

Author Contributions

Conceptualization: A.C. and M.A.H.; methodology, M.A.H.; software, A.M. and I.H.; validation, A.M., I.H., and M.A.H.; formal analysis, A.M., I.H., and M.A.H.; investigation, A.M., I.H., and M.A.H.; resources, A.C.; data curation, A.M. and I.H.; writing—original draft preparation, A.M., I.H., and M.A.H.; writing—review and editing, M.A.H.; visualization, A.M. and I.H.; supervision, M.A.H. and A.C.; project administration, J.Q. and A.C.; funding acquisition, J.Q. and A.C. All authors have read and agreed to the published version of the manuscript.

Funding

This material is based on research sponsored by Air Force Research Laboratory under Agreement Number FA8650-20-2-5700.

Data Availability Statement

Source data and other raw data are available from the corresponding author upon request.

Acknowledgments

We sincerely thank the UTEP Aerospace Center for its crucial resources and guidance in executing and developing the LOX-LCH4 propulsion project. We are very grateful to the mentors and faculty supervisors for their vital support in digital modeling and validating the CROME system. The U.S. Government is authorized to reproduce and distribute reprints for governmental purposes, notwithstanding any copyright notation thereon. The views and conclusions contained herein are those of the authors and should not be interpreted as necessarily representing the official policies or endorsements, either expressed or implied, of the Air Force Research Laboratory or the U.S. Government.

Conflicts of Interest

The authors declare no conflicts of interest.

Nomenclature

PBMPhysics-based model
CCComplex chemistry
CEAChemical equivalence analysis
ISRUIn situ resource utilization
EMPEulerian multiphase physics
EDCEddy dissipation concept
EBUEddy Break Up
CFLCourant–Friedrichs–Lewy number
NTCNo-Time Collision
RANSReynolds-Averaged Navier–Stokes
EMPEulerian Multiphase
MMPMixture Multiphase
VOFVolume of Fluid
MDEMulticomponent Droplet Evaporation
RANSReynolds-Averaged Navier–Stokes
MCMonte Carlo

References

  1. Wang, Y.; Hao, L.; Li, Y.; Sun, Q.; Sun, M.; Huang, Y.; Li, Z.; Tang, D.; Wang, Y.; Xiao, L. In-situ utilization of regolith resource and future exploration of additive manufacturing for lunar/martian habitats: A review. Appl. Clay Sci. 2022, 229, 106673. [Google Scholar] [CrossRef]
  2. Guo, Y.; Wang, S.; Li, R.; Yu, J.; Zhang, X.; Li, M.; Zheng, X.; Zhu, J.; Song, Y.; Wang, G.; et al. In situ exsolved CoFe alloy nanoparticles for stable anodic methane reforming in solid oxide electrolysis cells. Joule 2024, 8, 2016–2032. [Google Scholar] [CrossRef]
  3. Qi, S.; Wang, J.; Liu, X.; Xia, C.; Li, X.; Shao, W.; Wang, Z. Experimental and simulation investigation of lunar energy storage and conversion thermoelectric system based on in-situ resource utilization. Appl. Therm. Eng. 2024, 254, 123854. [Google Scholar] [CrossRef]
  4. Zhang, C.; Li, Y.; Chu, Z.; Fang, Y.; Han, K.; He, Z. Analysis of integrated CO2 capture and utilization via calcium-looping in-situ dry reforming of methane and Fischer-Tropsch for synthetic fuels production. Sep. Purif. Technol. 2024, 329, 125109. [Google Scholar] [CrossRef]
  5. Cheng, S.; Gao, Y.; Shi, Y.; Xiao, L.; Ding, L.; Zhou, C.; Zhou, Y. Advances in in-situ resources utilization for extraterrestrial construction. Adv. Space Res. 2024, 74, 3297–3325. [Google Scholar] [CrossRef]
  6. Shahid, M.; Chambers, B.; Sankarasubramanian, S. On the viability of electrochemical carbon dioxide in-situ resource utilization to produce chemical feedstocks on Mars. Chem. Eng. J. 2024, 496, 153976. [Google Scholar] [CrossRef]
  7. Shen, C.; Zhou, R. Experimental study on the combustion characteristics of LOX/LCH4 pintle injectors. Fuel 2023, 339, 126909. [Google Scholar] [CrossRef]
  8. Lechner, V.; Betrancourt, C.; Scouflaire, P.; Vingert, L.; Ducruix, S. Dynamic characterization of wall temperature in LOX/CH4 rocket engine operating conditions using phosphor thermometry. Proc. Combust. Inst. 2023, 39, 5033–5041. [Google Scholar] [CrossRef]
  9. Boué, Y.; Vinet, P.; Magniant, S.; Motomura, T.; Blasi, R.; Dutheil, J. LOX/methane reusable rocket propulsion at reach with large scale demonstrators tested. Acta Astronaut. 2018, 152, 542–556. [Google Scholar] [CrossRef]
  10. Islam, M.R.; Ahmed, Z.U.; Hossain, K.A. Numerical analysis of LOx-BioLPG combustion in high-pressure liquid rocket engine propulsion system. S. Afr. J. Chem. Eng. 2023, 45, 83–99. [Google Scholar] [CrossRef]
  11. Candel, S.; Durox, D.; Schuller, T.; Darabiha, N.; Hakim, L.; Schmitt, T. Advances in combustion and propulsion applications. Eur. J. Mech. -B/Fluids 2013, 40, 87–106. [Google Scholar] [CrossRef]
  12. Chen, Y.S.; Chou, T.H.; Gu, B.R.; Wu, J.S.; Wu, B.; Lian, Y.Y.; Yang, L. Multiphysics simulations of rocket engine combustion. Comput. Fluids 2011, 45, 29–36. [Google Scholar] [CrossRef]
  13. Chua, P.C.; Moon, S.K.; Ng, Y.T.; Ng, H.Y. Chapter six—Digital twin-based decision support system for planning and scheduling. In Digital Manufacturing; Patel, C.D., Chen, C., Eds.; Elsevier: Amsterdam, The Netherlands, 2024; pp. 213–245. [Google Scholar] [CrossRef]
  14. Jiang, L.; Su, S.; Pei, X.; Chu, C.; Yuan, Y.; Wang, K. Product-part level digital twin modeling method for digital thread framework. Comput. Ind. Eng. 2023, 179, 109168. [Google Scholar] [CrossRef]
  15. Munk, D.J.; Selzer, M.; Seiler, H.; Ortelt, M.; Vio, G.A. Analysis of a transpiration cooled LOX/CH4 rocket thrust chamber. Int. J. Heat Mass Transf. 2022, 182, 121986. [Google Scholar] [CrossRef]
  16. Song, J.; Sun, B. Coupled numerical simulation of combustion and regenerative cooling in LOX/methane rocket engines. Appl. Therm. Eng. 2016, 106, 762–773. [Google Scholar] [CrossRef]
  17. Neill, T.; Judd, D.; Veith, E.; Rousar, D. Practical uses of liquid methane in rocket engine applications. Acta Astronaut. 2009, 65, 696–705. [Google Scholar] [CrossRef]
  18. Lv, J.; Gao, Y.; Jin, P.; Qi, Y.; Liu, B.; Li, R.; Cai, G. A simplified one-dimensional transient heat transfer model for rocket thrust chamber. Appl. Therm. Eng. 2023, 218, 119379. [Google Scholar] [CrossRef]
  19. Potier, L.; Duchaine, F.; Cuenot, B.; Saucereau, D.; Pichillou, J. Prediction of Wall Heat Fluxes in a Rocket Engine with Conjugate Heat Transfer Based on Large-Eddy Simulation. Entropy 2022, 24, 256. [Google Scholar] [CrossRef]
  20. Blanchard, S.; Cazères, Q.; Cuenot, B. Chemical modeling for methane oxy-combustion in liquid rocket engines. Acta Astronaut. 2022, 190, 98–111. [Google Scholar] [CrossRef]
  21. Schneider, D.; Oschwald, M.; Karl, S.; Hannemann, V.; Ramunno, M.A.; Boyd, I.M.; Grandhi, R.V.; Camberos, J.; Kostyrkin, K.; Takahashi, H.; et al. Numerical Model for Nozzle Flow Application Under Liquid Oxygen/Methane Hot-Flow Conditions. J. Propuls. Power 2018, 34, 221–233. [Google Scholar] [CrossRef]
  22. Leccese, G.; Bianchi, D.; Betti, B.; Lentini, D.; Nasuti, F. Convective and Radiative Wall Heat Transfer in Liquid Rocket Thrust Chambers. J. Propuls. Power 2018, 34, 318–326. [Google Scholar] [CrossRef]
  23. Song, J.; Sun, B. Thermal-structural analysis of regeneratively-cooled thrust chamber wall in reusable LOX/methane rocket engines. Chin. J. Aeronaut. 2017, 30, 1043–1053. [Google Scholar] [CrossRef]
  24. Kose, Y.M.; Celik, M. Regenerative Cooling Comparison of LOX/LCH4 and LOX/LC3H8 Rocket Engines Using the One-Dimensional Regenerative Cooling Modelling Tool ODREC. Appl. Sci. 2023, 14, 71. [Google Scholar] [CrossRef]
  25. Pizzarelli, M.; Betti, B.; Nasuti, F.; Ricci, D.; Roncioni, P.; Battista, F.; Salvatore, V. Cooling channel analysis of a LOX/LCH4 rocket engine demonstrator. In Proceedings of the 50th AIAA/ASME/SAE/ASEE Joint Propulsion Conference, Cleveland, OH, USA, 28–30 July 2014; p. 4004. [Google Scholar]
  26. Remiddi, A.; Indelicato, G.; Lapenna, P.E.; Creta, F. Development and validation of an efficient numerical framework for Conjugate Heat Transfer in Liquid Rocket Engines. In Proceedings of the AIAA SCITECH 2022 Forum, San Diego, CA, USA, 3–7 January 2022; p. 2119. [Google Scholar]
  27. Herrera, M. The Design and Testing of A 500 Lbf Liquid Oxygen/Liquid Methane Engine. Master’s Thesis, The University of Texas at El Paso, El Paso, TX, USA, 2019. [Google Scholar]
  28. Frenklach, M.; Wang, H.; Goldenberg, M.; Smith, G.P.; Golden, D.M. Gri-Mech: An Optimized Detailed Chemical Reaction Mechanism for Methane Combustion; Topical Report, September 1992–August 1995 (No. PB-96-137054/XAB); SRI International: Menlo Park, CA, USA, 1995. [Google Scholar]
  29. Santese, T.; Shvab, J.; Suslov, D.; Haidn, O.J.; Slavinskaya, N. Impact of impurities on liquid methane properties under typical rocket operation conditions. Int. J. Thermofluids 2023, 18, 100343. [Google Scholar] [CrossRef]
  30. Tomasz Wlodek MSc, P.E. Safety aspects of different composition liquefied natural gas storage processes. Int. Multidiscip. Sci. GeoConference SGEM 2016, 4, 167–174. [Google Scholar]
  31. Swanger, A. Liquefied Natural Gas (LNG) as Propellant Fuels; Storage and Transfer Effects: Background, Testing, Data, & Analysis. 2021. Available online: https://ntrs.nasa.gov/api/citations/20205010056/downloads/LNG%20Weathering_Data%20Drop.pptx.pdf (accessed on 5 September 2024).
  32. Li, W.; Lou, Z.; Ladeinde, F. Comparison of flamelet and transported species-based modeling of scramjet combustor. In Proceedings of the 53rd AIAA/SAE/ASEE Joint Propulsion Conference, Atlanta, GA, USA, 10–12 July 2017; p. 4745. [Google Scholar]
  33. Liberatori, J.; Malpica Galassi, R.; Bianchi, D.; Nasuti, F.; Valorani, M.; Paolo Ciottoli, P. Family of Skeletal Reaction Mechanisms for Methane–Oxygen Combustion in Rocket Propulsion. J. Propuls. Power 2024, 40, 303–319. [Google Scholar] [CrossRef]
  34. Trends, T.C.M.A.N. Turbulent Combustion Modeling Advances New Trends and Perspectives Fluid Mechanics and Its Applications; Springer: Berlin/Heidelberg, Germany, 2011. [Google Scholar]
  35. Foss, M.M. An Overview on Liquefied Natural Gas (LNG), Its Properties, the LNG Industry, and Safety Considerations; Center for Energy Economics: Austin, TX, USA, 2012. [Google Scholar]
  36. Weiss, J.; Merkle, C. Numerical investigation of reacting flowfields in low-thrust rocket engine combustors. In Proceedings of the 27th Joint Propulsion Conference, Sacramento, CA, USA, 24–26 June 1991; p. 2080. [Google Scholar]
  37. Rahn, D.; Haidn, O.; Riedmann, H. Timescale-Based Frozen Nonadiabatic Flamelet Combustion Modeling for Rocket Engine Thrust Chambers. J. Propuls. Power 2021, 37, 495–508. [Google Scholar] [CrossRef]
  38. Star CCM+ User’s Manual. Available online: http://www.cd-adapco.com/products/star-ccm/documentation (accessed on 7 February 2023).
  39. Wallesten, J.; Lipatnikov, A.; Chomiak, J. Modeling of stratified combustion in a direct-ignition, spark-ignition engine accounting for complex chemistry. Proc. Combust. Inst. 2002, 29, 703–709. [Google Scholar] [CrossRef]
  40. Law, C.K. Comprehensive description of chemistry in combustion modeling. Combust. Sci. Technol. 2005, 177, 845–870. [Google Scholar] [CrossRef]
  41. Evlampiev, A. Numerical Combustion Modeling for Complex Reaction Systems. Ph.D. Thesis, Technische Universiteit Eindhoven, Eindhoven, The Nederland, 2007. [Google Scholar]
  42. Spalding, D.B. Development of the eddy-break-up model of turbulent combustion. In Numerical Prediction of Flow, Heat Transfer, Turbulence and Combustion; Elsevier: Pergamon, Greek, 1983; pp. 194–200. [Google Scholar]
  43. Nicolleau, F.; Mathieu, J. Eddy break-up model and fractal theory: Comparisons with experiments. Int. J. Heat Mass Transf. 1994, 37, 2925–2933. [Google Scholar] [CrossRef]
  44. Giusti, A.; Mastorakos, E. Turbulent combustion modelling and experiments: Recent trends and developments. Flow Turbul. Combust. 2019, 103, 847–869. [Google Scholar] [CrossRef]
  45. Zhou, L.X.; Hu, L.Y.; Wang, F. Large-eddy simulation of turbulent combustion using different combustion models. Fuel 2008, 87, 3123–3131. [Google Scholar] [CrossRef]
  46. Desjardin, P.E.; Frankel, S.H. Assessment of turbulent combustion submodels using the linear eddy model. Combust. Flame 1996, 104, 343–357. [Google Scholar] [CrossRef]
  47. Wei, J.; Ye, M.; Zhang, S.; Qin, J.; Haidn, O.J. Modeling of a 7-elements GOX/GCH4 combustion chamber using RANS with Eddy-Dissipation Concept model. Aerosp. Sci. Technol. 2020, 99, 105762. [Google Scholar] [CrossRef]
  48. De Giorgi, M.G.; Sciolti, A.; Ficarella, A. Different combustion models applied to high pressure LOX/CH4 jet flames. In Proceedings of the 4th European Conference for Aerospace Sciences, Saint Petersburg, Russia, 4–8 July 2011; pp. 4–8. [Google Scholar]
  49. Ertesvåg, I.S. Analysis of some recently proposed modifications to the Eddy Dissipation Concept (EDC). Combust. Sci. Technol. 2020, 192, 1108–1136. [Google Scholar] [CrossRef]
  50. Jeffery, C.A.; Reisner, J.M.; Moulton, D. Limiting Spurious Evaporation in Clouds: Magnussen and Hjertager (1976)’s EDC Model, Revisited. Available online: https://ams.confex.com/ams/pdfpapers/113601.pdf (accessed on 5 September 2024).
  51. Magnussen, B. On the structure of turbulence and a generalized eddy dissipation concept for chemical reaction in turbulent flow. In Proceedings of the 19th Aerospace Sciences Meeting, St. Louis, MO, USA, 12–15 January 1981; p. 42. [Google Scholar]
  52. Smith, G.P.; Golden, D.M.; Frenklach, M.; Moriarty, N.W.; Eiteneer, B.; Goldenberg, M.; Bowman, C.T.; Hanson, R.K.; Song, S.; Gardiner, W.C., Jr.; et al. Gri 3.0 Mechanism, Gas Research Institute. 1999. Available online: http://www.me.berkeley.edu/gri_mech (accessed on 20 September 2024).
  53. Lu, T.; Law, C.K. A criterion based on computational singular perturbation for the identification of quasi steady state species: A reduced mechanism for methane oxidation with NO chemistry. Combust. Flame 2008, 154, 761–774. [Google Scholar] [CrossRef]
  54. Laguillo, S.; Ochoa, J.S.; Ortiz, A. Chemical reaction mechanisms assessment for simulation of methane combustion in domestic gas cooking burners. Energy Fuels 2019, 33, 9171–9183. [Google Scholar] [CrossRef]
  55. Revuelta, S.L. Numerical Modeling of Chemical Reaction Processes Describing Methane Combustion in Gas Cooking Burners. Ph.D. Dissertation, Universidad de Cantabria, Cantabria, Spain, 2020. [Google Scholar]
  56. Bell, I.H.; Wronski, J.; Quoilin, S.; Lemort, V. Pure and pseudo-pure fluid thermophysical property evaluation and the open-source thermophysical property library CoolProp. Ind. Eng. Chem. Res. 2014, 53, 2498–2508. [Google Scholar] [CrossRef]
  57. Wilcox, D.C. Reassessment of the scale-determining equation for advanced turbulence models. AIAA J. 1988, 26, 1299–1310. [Google Scholar] [CrossRef]
  58. Menter, F.R. Two-equation eddy-viscosity turbulence models for engineering applications. AIAA J. 1994, 32, 1598–1605. [Google Scholar]
  59. Godino, D.M.; Corzo, S.F.; Ramajo, D.E. Two-phase modeling of water-air flow of dispersed and segregated flows. Ann. Nucl. Energy 2020, 149, 107766. [Google Scholar] [CrossRef]
  60. Shabani, M.O.; Alizadeh, M.; Mazahery, A. Fluid flow characterization of liquid–liquid mixing in mixer-settler. Eng. Comput. 2011, 27, 373–379. [Google Scholar] [CrossRef]
  61. Gomet, L.; Robin, V.; Mura, A. Lagrangian modelling of turbulent spray combustion under liquid rocket engine conditions. Acta Astronautica. 2014, 94, 184–197. [Google Scholar] [CrossRef]
  62. Tartakovsky, A.M.; Ferris, K.F.; Meakin, P. Lagrangian particle model for multiphase flows. Comput. Phys. Commun. 2009, 180, 1874–1881. [Google Scholar] [CrossRef]
  63. Papoulias, D.; Gada, V.; Tandon, M.; Lo, S. CFD modelling of multiphase slug flow in a pressurized water reactor using the Eulerian-Eulerian model and adaptive interface sharpening scheme. In Proceedings of the 17th International Topical Meeting on Nuclear Reactor Thermal Hydraulics (NURETH-17), Xi’an, China, 3–8 September 2017. [Google Scholar]
  64. Huang, S. Numerical simulation of oil-water hydrocyclone using reynolds-stress model for eulerian multiphase flows. Can. J. Chem. Eng. 2005, 83, 829–834. [Google Scholar] [CrossRef]
  65. Rajesh, V.M.; Buwa, V.V. Volume-of-fluid simulations of gas-liquid-liquid flows in minichannels. Chem. Eng. J. 2018, 345, 688–705. [Google Scholar] [CrossRef]
  66. Yu, D.; Chen, Z. Theoretical analysis on droplet vaporization at elevated temperatures and pressures. Int. J. Heat Mass Transf. 2021, 164, 120542. [Google Scholar] [CrossRef]
  67. Paladino, E.; Aguirre, J.; Quintella, E. Developing multiphase models for liquid-liquid hydrocyclone flow. In Proceedings of the 6th International Conference on Multiphase Flow, ICMF, Leipzig, Germany, 9–13 July 2007. [Google Scholar]
  68. Frank, T.; Shi, J.; Burns, A.D. Validation of Eulerian multiphase flow models for nuclear safety application. In Proceeding of the Third International Symposium on Two-Phase Modelling and Experimentation, Pisa, Italy, 22–25 September 2004; pp. 22–25. [Google Scholar]
  69. Thomson, G.W. The Antoine equation for vapor-pressure data. Chem. Rev. 1946, 38, 1–39. [Google Scholar] [CrossRef]
  70. Clark, J. Universal equations for saturation vapor pressure. In Proceedings of the 40th AIAA/ASME/SAE/ASEE Joint Propulsion Conference and Exhibit, Fort Lauderdale, FL, USA, 11–14 July 2004; p. 4088. [Google Scholar]
  71. Prydz, R.; Goodwin, R.D. Experimental Melting and Vapor Pressures of Methane. J. Chem. Thermodyn. 1972, 4, 127–133. [Google Scholar] [CrossRef]
  72. Ranz, W.E.; Marshall, W.R. Evaporation from drops--Part I and II. Chem. Eng. Prog. 1952, 48, 141. [Google Scholar]
  73. Emekwuru, N.G. Using the general gamma distribution to represent the droplet size distribution in a spray model. In Hydrodynamics-Theory and Model; IntechOpen: London, UK, 2012. [Google Scholar]
  74. Eskin, D.; Taylor, S.D.; Yang, D. Modeling of droplet dispersion in a turbulent Taylor–Couette flow. Chem. Eng. Sci. 2017, 161, 36–47. [Google Scholar] [CrossRef]
  75. Han, L.; Luo, H.A.; Liu, Y. A theoretical model for droplet breakup in turbulent dispersions. Chem. Eng. Sci. 2011, 66, 766–776. [Google Scholar] [CrossRef]
  76. Li, Y.; Kong, S.C. Coupling conjugate heat transfer with in-cylinder combustion modeling for engine simulation. Int. J. Heat Mass Transf. 2011, 54, 2467–2478. [Google Scholar] [CrossRef]
  77. Yang, K.; Jiang, G.H.; Qu, Q.; Peng, H.F.; Gao, X.W. A new modified conjugate gradient method to identify thermal conductivity of transient non-homogeneous problems based on radial integration boundary element method. Int. J. Heat Mass Transf. 2019, 133, 669–676. [Google Scholar] [CrossRef]
  78. Agazhanov, A.S.; Samoshkin, D.A.; Kozlovskii, Y.M. Thermophysical properties of Inconel 718 alloy. J. Phys. Conf. Ser. 2019, 1382, 012175. [Google Scholar] [CrossRef]
  79. Sweet, J.N.; Roth, E.P.; Moss, M. Thermal conductivity of Inconel 718 and 304 stainless steel. Int. J. Thermophys. 1987, 8, 593–606. [Google Scholar] [CrossRef]
  80. Leonardi, M.; Di Matteo, F.; Steelant, J.; Betti, B.; Nasuti, F.; Onofri, M. Development of thrust chamber components for a system analysis tool. In Proceedings of the 50th AIAA/ASME/SAE/ASEE Joint Propulsion Conference, Cleveland, OH, USA, 28–30 July 2014; p. 3876. [Google Scholar]
  81. McBride, B.J. Computer Program for Calculation of Complex Chemical Equilibrium Compositions and Applications; NASA Lewis Research Center: Cleveland, OH, USA, 1996; Volume 2.
  82. Brower, G.T.; Thodos, G. Vapor pressures of liquid oxygen between the triple point and critical point. J. Chem. Eng. Data 1968, 13, 262–264. [Google Scholar] [CrossRef]
  83. Paravan, C.; Galfetti, L.; Bisin, R.; Piscaglia, F. Combustion processes in hybrid rockets. Int. J. Energetic Mater. Chem. Propuls. 2019, 18, 255–286. [Google Scholar] [CrossRef]
Figure 1. Distribution of combustion temperatures and relative errors compared to 100% methane combustion for 5000 random LNG mixtures.
Aerospace 11 00824 g001
Figure 2. Distribution of ratio of specific heats and its relative errors compared to 100% methane combustion for 5000 random LNG mixtures.
Aerospace 11 00824 g002
Figure 3. Distribution of combustion temperatures vs. methane mass fraction.
Aerospace 11 00824 g003
Figure 4. Temperature fields for GRI-3.0 (Top) and Lu (Bottom) at 0 PSI gage pressure.
Aerospace 11 00824 g004
Figure 5. Temperature fields for GRI-3.0 (Top) and Lu (Bottom) at 125 PSI gage pressure.
Aerospace 11 00824 g005
Figure 6. Temperature fields for GRI-3.0 (Top) and Lu (Bottom) at 250 PSI gage pressure.
Aerospace 11 00824 g006
Figure 7. Ratio of specific heat fields for GRI-3.0 (Top) and Lu (Bottom) at 0 PSI gage pressure.
Aerospace 11 00824 g007
Figure 8. Ratio of specific heat fields for GRI-3.0 (Top) and Lu (Bottom) at 125 PSI gage pressure.
Aerospace 11 00824 g008
Figure 9. Ratio of specific heat fields for GRI-3.0 (Top) and Lu (Bottom) at 250 PSI gage pressure.
Aerospace 11 00824 g009
Figure 10. Lagrangian multiphase spray and impingement pattern.
Aerospace 11 00824 g010
Figure 11. Grid for solid and fluid geometries.
Aerospace 11 00824 g011
Figure 12. Thrust and chamber pressure plot for every iteration.
Aerospace 11 00824 g012
Figure 13. Temperature gradient for inner volume in the X-Y plane.
Aerospace 11 00824 g013
Figure 14. Surface temperature gradient for the engine wall (left) and the engine nozzle section (right).
Aerospace 11 00824 g014
Figure 15. Pressure gradient for entire inner volume.
Aerospace 11 00824 g015
Figure 16. Mach number gradient for entire inner volume (left) and for the nozzle outlet (right).
Aerospace 11 00824 g016
Figure 17. Y+ values and TKE along the inner volume of the outer wall.
Aerospace 11 00824 g017
Figure 18. Engine performance parameters observed in both CEA and CFD analyses at F = 125 lbf.
Aerospace 11 00824 g018
Figure 19. One-eight thrust and chamber pressure plot for every iteration.
Aerospace 11 00824 g019
Figure 20. Surface temperature contours at steady state.
Aerospace 11 00824 g020
Figure 21. Gas temperature contours at steady state.
Aerospace 11 00824 g021
Figure 22. Mach distribution contours at steady state.
Aerospace 11 00824 g022
Figure 23. Steady-state pressure distribution within chamber.
Aerospace 11 00824 g023
Figure 24. Engine performance parameters observed in both CEA and CFD analyses at F = 500 lbf.
Aerospace 11 00824 g024
Table 1. Equilibrium flame temperatures of methane–oxygen combustion at an OF ratio of 2.7.
Pressure (psia)Temperature (K)
703086.7
1253144.3
1803180.0
2353205.8
Table 2. Minimum and maximum mole percentages of tested common LNG dilutants.
Mole (%)C2H6C3H8N2CO2
Min. Mole Percent0000
Max Mole Percent10511
Table 3. Comparison of flame yemperatures (K) and specific heat ratios under GRI 3.0 and LU mechanism.
Pressure (Psig)Flame Temperature (K) Ratio of Specific Heats
GRI 3.0 Mechanism LU Mechanism GRI 3.0 Mechanism LU Mechanism
0311031101.391.39
12533703380
25034703460
Table 4. Model settings for steady-state combustion and nozzle flow simulation.
Meshing
  • Automated Mesh Function: Base Mesh Size = 0.2 inches; Cell Count = 28.3 K
  • Polyhedral Mesh
  • Custom Meshing: Liquid Fuel Injection Area, 10% Cell Base Size
Boundary Conditions
  • Core Chamber Wall: No-slip
  • Other Wall: No-slip
  • Fuel Annulus:
    Velocity inlet
    V100% steady-state flow = 43.0 m/s
    V100% start up = 68.92 m/s
    Tstatic = 116.5 K; VF = 1.0
    Sauter Mean Diameter = 1 × 10⁻⁴ m
  • OX Inlets:
    Velocity inlet
    V100% steady-state flow = 19.6 m/s
    V100% start up = 31.41 m/s
    Tstatic = 90 K; VF = 1.0
    Sauter Mean Diameter = 1 × 10⁻⁴ m
  • Engine Outlet: Patm = 12.8 psia; mfN2 = 0.73; mfO2 = 0.27
  • Rotational Periodic Boundary (45-degree transformation)
General Models
  • Steady-State
  • Multiphase
    Eulerian Multiphase
  • Turbulent
    K-Omega Turbulence
    Mixture Turbulence
    SST (Menter) K-Omega
    Gamma-ReTheta Transition
    All y+ Wall Treatment
  • Phase-Coupled Fluid Energy
Liquid Phase Models
  • Constant Density
  • Segregated Fluid Enthalpy
  • Segregated Species
  • Turbulent
  • Non-Reacting
  • Particle Size Distribution
    S-Gamma
    Min. Diameter: 1.0 × 10⁻⁶ m
    Max Diameter: 0.1 m
    Discrete Quadrature S-Gamma
Gas Phase Models
  • Ideal Gas
  • Segregated Fluid Enthalpy
  • Segregated Species
  • Turbulent
  • Reacting
    Reacting Species Transport
    Complex Chemistry
    Eddy Dissipation Concept
Multiphase Interaction Models
  • Continuous–Dispersed Topology
    Continuous Phase: Gas
    Dispersed Phase: Liquid
  • Drag Force
  • Interaction Area Density
    Method: Spherical Particle
  • Interaction Length Scale
    Method: Sauter Mean Diameter
  • Interphase Mass Transfer
    Multicomponent Droplet Evaporation Mass Transfer Rate
    Continuous Phase Sherwood Number: Ranz–Marshall
    Continuous Phase Nusselt Number: Ranz–Marshall
    Equilibrium Coefficient: Raoult’s Law
  • Multiphase Material
    Surface Tension: 0.014 N/m
  • S-Gamma Breakup
    Breakup Rate Method: Coulaloglou and Eskin
  • S-Gamma Coalescence
    Coalescence Efficiency Method: Luo
Solvers
  • Segregated EMP Flow
    Phase-Coupled Velocity
    Implicit Under-Relaxation Factor: 0.3
    Explicit Under-Relaxation Factor: 1.0
    Pressure
    Under-Relaxation Factor: 0.05
  • Volume Fraction
    Implicit Under-Relaxation Factor: 0.3
    Explicit Under-Relaxation Factor: 1.0
    Number of Steps: 4
  • Segregated Species
    Under-Relaxation Factor: 0.8
  • S-Gamma
    Implicit Under-Relaxation Factor: 1.0
    Explicit Under-Relaxation Factor: 0.3
  • Segregated Energy
    Fluid Under-Relaxation Factor: 0.1
    Solid Under-Relaxation Factor: 0.99
  • K-Omega Turbulence
    Under-Relaxation Factor: 0.9
  • K-Omega Turbulent Viscosity
    Under-Relaxation Factor: 0.9
  • GammaReTheta Transition
    Under-Relaxation Factor: 0.8
Table 5. Mesh and physics settings for combustion with conjugate heat transfer simulation.
Mesh settingsSolid domain:
  • Polyhedral mesh
Physics settingsSolid models:
  • Segregated solid energy
  • Steady state
  • Constant density
Table 6. Boundary conditions for combustion with conjugate heat transfer simulation.
Initial conditions
  • Solid domain: T s t a t i c = 300   K
  • Chamber/nozzle (Inconel 718): k = 9.94 W/m·K at 300 K [77,78].
Boundary conditions
  • Outer engine surfaces
    T a m b i e n t = 300   K
    h a m b i e n t = 25   W m 2 K
    R a m b i e n t = 5.258   m K W
  • SYM1 and SYM2
    Symmetry plane
  • Nozzle, default, combustion chamber:
    Adiabatic
Interface settings
  • Engine/combustion chamber volume interface
    Conjugate heat transfer
  • Fluid and solid symmetry planes
    Rotational interface
Table 7. Input parameters for each thrust case used in NASA CEA.
Input Parameter125 lbf Case500 lbf Case
Pressure (psia)70125
Fuel LCH4
Fuel temperature (K)116.5
Oxidizer LOX
Oxidizer temperature (K)90
Oxidizer/fuel ratio2.66672.7419
Supersonic area ratio1.694
Mass flux/chamber area (kg/s·m2)48.23159.305
Table 8. CEA outputs for each thrust case.
Parameters125 lbf case500 lbf case
Mach number at nozzle exit1.861.87
Combustion chamber temperature (K)3065.003190.90
Exit pressure (psia)11.6538.60
Thrust (lbf)133.52449.50
Deviation (from theoretical values) (%)6.8110.10
Table 9. CEA and simulation results at F = 125 lbf.
ParametersCEASimulation Output D e v i a t i o n from CEA (%)
Mach number at nozzle exit1.861.5218.4
Combustion chamber temperature (K)306533489.2
Chamber pressure (psia)70691.4
Thrust (lbf)133.52113.4815.0
Table 10. CEA and simulation results at F = 500 lbf.
ParametersCEASimulation OutputDeviation from CEA (%)
Mach number at nozzle exit1.872.4028.5
Combustion chamber temperature (K)3190.93495.09.5
Chamber pressure (psia)235.0256.08.9
Thrust (lbf)449.5488.08.6
Disclaimer/Publisher’s Note: The statements, opinions and data contained in all publications are solely those of the individual author(s) and contributor(s) and not of MDPI and/or the editor(s). MDPI and/or the editor(s) disclaim responsibility for any injury to people or property resulting from any ideas, methods, instructions or products referred to in the content.