Article

Shock Wave and Aeroelastic Coupling in Overexpanded Nozzle

National Key Laboratory of Aerospace Liquid Propulsion, Xi’an 710100, China
*
Author to whom correspondence should be addressed.
Aerospace 2024, 11(10), 818; https://doi.org/10.3390/aerospace11100818
Submission received: 11 September 2024 / Revised: 2 October 2024 / Accepted: 4 October 2024 / Published: 7 October 2024
(This article belongs to the Section Aeronautics)

Abstract

:
The growing demand for increasing the engine power of a liquid rocket is driving the development of high-power De-Laval nozzles, which is primarily achieved by increasing the expansion ratio. A high-expansion-ratio for De-Laval nozzles can cause flow separation, resulting in unsteady, asymmetric forces that can limit nozzle life. To enhance nozzle performance, various separation control methods have been proposed, but no methods have been fully implemented thus far due to the uncertainties associated with simulating flow phenomena. A numerical study of a high-area-ratio rocket engine is performed to analyze the aeroelastic performance of its structure under flow separation conditions. Based on numerical methodology, the flow inside a rocket nozzle (the VOLVO S1) is analyzed, and different separation patterns are comprehensively discussed, including both free shock separation (FSS) and restricted shock separation (RSS). Since the location of the flow separation point strongly depends on the turbulence model, both the single transport equation and two-transport-equation turbulence models are simulated, and the findings are compared with the experimental results. Therefore, the Spalart–Allmaras (SA) turbulence model is the ideal choice for this rocket nozzle geometry. A wavelet is used to analyze the amplitude frequencies from 0 to 100 Hz under various pressure fluctuation conditions. Based on a clear understanding of the flow field, an aeroelastic coupling method is carried out with loosely coupled computational fluid dynamics (CFD)/computational structural dynamics (CSD). Some insights into the aeroelasticity of the nozzle under separated flow conditions are obtained. The simulation results show the significant impact of the structural response on the inherent pressure pulsation characteristics resulting from flow separation.

1. Introduction

By optimizing the nozzle contour of the rocket engine, the maximum thrust is achieved within the limits of the entire engine system. Therefore, different types of nozzles have been developed to increase consistent performance, such as thrust-optimized (TO), parabolic perfectly truncated (PT) and compressed perfectly truncated (CPT) nozzles. The first-stage rocket engine nozzle is intended to operate under atmospheric conditions ranging from sea-level to vacuum environments. To maintain optimal performance throughout the flight, the nozzle is designed for an intermediate nozzle pressure ratio (NPR; chamber-to-ambient pressure ratio, Pc/Pa), which is between sea-level pressure and altitude pressure. Under operating conditions, the nozzle flow is overexpanded (Pe < Pa) at low altitudes and under-expanded (Pe > Pa) at high altitudes, where Pe is the outlet pressure [1]. During atmospheric flight, the high temperature, high pressure, and high- velocity gas flow adapt to the ambient pressure through oblique shock and expansion waves. The flow separation within the nozzle occurs when the boundary layer separates from the wall due to the increase in unfavorable pressure from the shock. Flow separation in a rocket nozzle, in general, is a result of a natural adjustment process by which a viscous flow adjusts to its surroundings under particular conditions. This adjustment mechanism may, in certain cases, enhance performance or permit better flow control conditions, while in others, it may result in performance penalties and instabilities that arise from separation. In general, as the flow expands in the divergent section of the nozzle, it separates from the nozzle wall at some axial location where the wall pressure reaches a particular fraction of the ambient pressure. Sometimes, the wall’s full expansion pressure during the startup process of the nozzle may be much lower than the surrounding air pressure. This difference causes flow separation in the nozzle extension direction. The nozzle structure can be damaged by strong lateral forces resulting from this separation, which is undesirable due to its fluctuating and three-dimensional properties. The side-loads are the most well-known type of dynamic load. One of the greatest challenges in optimizing main engine nozzles is flow separation, particularly at sea level. For decades, researchers and engineers have focused on nozzle flow separation to reduce the mechanical and thermal stresses associated with this phenomenon and to gain an enhanced understanding of its physics.
Despite significant efforts by scholars in the space industry and in research institutions in offload investigations, to the author’s knowledge, analytical predictions are generally still insufficiently accurate. Research appears to have begun at the Jet Propulsion Laboratory (JPL) and California Institute of Technology (Caltech) in the late 1940s and focused on impact-induced boundary layer separation within overexpanded rocket nozzles and on the mechanism of separation under rocket nozzle side-loading [1,2]. To determine the circumstances that led to boundary layer separation, this research and subsequent studies were conducted in the 1950s, 1960s, and 1970s.
However, under transient operating conditions, such as startup and shutdown, and steady-state operating conditions with separated flow within the nozzle, side-loads can be observed in both subscale and full-scale rocket nozzles. During J-2S testing, the first significant report on lateral forces was published [3].
Afterward, many scientists have conducted research at various institutes, such as Volvo Aero Corporation (VAC), Deutsches Zentrum fur Luft-und Raumfahrt (DLR), National Aeronautics and Space Administration (NASA), European Space Agency (ESA), Office National d’Etudes et Recherches Aérospatiales (ONERA), and Japan Aerospace Exploration Agency (JAXA). Scholars at the Swedish National Space Board (SNSB) and National Center for Space Studies (CNES) are conducting experiments to study the phenomena and mechanisms surrounding nozzles. Frey [4], Ralf [5], and Östlund [6] performed very detailed studies on the creation of side-loads and their physical causes. This work provides a thorough introduction to the flow physics of shock wave interactions, supersonic flows, and nozzles. Both authors have focused on exploring the mechanism underlying the transition from the free shock separation (FSS) mode to the restricted shock separation (RSS) mode, which is the main source of side-loads in thrust-optimized parabolic (TOP) nozzles, which are widely used, e.g., Raptor or Space Shuttle Main Engine (SSME).
As Figure 1 (left) shows, in free shock separation, the flow separates fully from the nozzle wall due to the presence of an oblique shock that originates from the nozzle wall and is directed towards the nozzle centerline. Thereafter, the separated shear layer continues as a free jet. The resulting streamwise wall pressure evolution is mainly governed by the physics of shock wave boundary layer interactions occurring in any supersonic flow separation. Since no reattachment occurs downstream of the separation location, this exhaust flow pattern is termed free shock separation (FSS). Downstream of the separation location, a back flow region exists wherein the ambient air is being sucked into the nozzle due to the entrainment effect of the separated jet flow.
As shown by Figure 1 (right), in restricted shock separation (RSS), the flow separation is restricted over some short axial distance after which the separated shear layer reattaches to the nozzle wall thereby inducing shocks and expansion waves. This is attributed to a reattachment of the separated flow to the nozzle wall, inducing a pattern of alternating shocks and expansion waves along the wall. The reattached flow results in wall pressures above ambient, which can initiate unsteady side-loads depending upon the asymmetry of the overall flow pattern, and the oscillatory behavior of the associated shock system.
Experimental side-load measurements are difficult to perform, and the costs of such experiments are very high. With the improvement in numerical techniques and the rapid increase in computing power, computational fluid dynamics (CFD) has become a primary tool for the study of jet flows. Therefore, numerical approaches for addressing mismatched flow fields in rocket nozzles are very promising. Numerical methods for thrust-optimized nozzle startup and shutdown processes have attracted considerable attention in recent years [7,8,9,10,11,12,13,14,15]. Hadjadj [16] provided a brief overview of the numerical relationships concerning nozzle flow separation. Resolutions of the Reynolds-averaged Navier–Stokes (RANS) equations have served as the basis for most studies on shock patterns in rocket nozzles.
Using the axisymmetric unsteady RANS (URANS) method, we can model the transient flow properties of the nozzle flow. As the computing power increases rapidly, the detached eddy simulation (DES)/large eddy simulation (LES) and direct numerical simulation (DNS) models can be used to simulate the flow clearly. In the literature, the transitions of flow separation patterns from free shock separation to limited shock separation [17], and vice versa, have been identified as key factors in load sources.
Inspired by the original Pekkari concept for inviscid flow utilizing a simplified wall pressure distribution, N. Bekka [18] developed a new model that can implement complex pressure distributions related to viscous effects. Luciano Garelli [19] used the couple fluid/structure interaction to analyze aeroelastic processes occurring during the startup phase of a rocket engine. The influence of fluid/structure coupling in the nozzle is revealed.
The purpose of this work is to study the FSS and RSS flow separation patterns and analyze the aeroelastic properties of the nozzle under these conditions. The paper is structured as follows. First, we briefly introduce the numerical method and comprehensively discuss the flow field in the context of an overexpanded nozzle. The loosely coupled CFD/computational structural dynamics (CSD) method is then presented, and the results are briefly discussed.

2. Flow Separation Analysis

2.1. Numerical Methodology (CFD)

The governing equations for evaluating the nozzle flow field are performed with a two-dimensional, axisymmetric, time-precise solver for ideal gases. Since the direct numerical solution of the Navier–Stokes equations is overly expensive, the equations are time-averaged, suggesting that any small, turbulent fluctuations in the flow that contribute to their complexity are not resolved but rather modeled. This simplification eliminates certain characteristics of the flow and significantly reduces the complexity of the solution. Reynolds averaging divides all time-dependent variables into average and fluctuating components. The Navier–Stokes equations are then averaged over time, restoring the original inviscid flows, which are defined by averaged variables. New nonlinear fluctuating terms are introduced due to their similarity to the Reynolds stress tensors and added to the viscous flows. These concepts are not solvable and must be modeled.
The governing equations can be expressed as follows:
U t + F x + G r + H = 0
U = r ( ρ , ρ u , ρ v , ρ E ) T , F = r ( ρ u , ρ u 2 τ x x , ρ u v τ x r , ρ E u τ x x u τ x r v + q x ) T , G = r ( ρ v , ρ u v τ r x , ρ v 2 τ r r , ρ E v τ r x u τ r r v + q r ) T , H = ( 0 , 0 , τ θ θ , 0 ) T ,
E = ( γ 1 ) p ρ + 1 2 ( u 2 + v 2 ) ,
τ x x = p 2 3 μ ( v r + v r ) + 4 3 μ u x ,
τ r r = p 2 3 μ ( u x + v r ) + 4 3 μ v r ,
τ x r = τ r x = μ ( u x + v r ) ,
τ θ θ = p 2 3 μ ( u x + v r ) + 4 3 μ v r ,
q x = k T x ,
q r = k T r
where U is a conservation variable vector, F and G are flux vectors; H is the source term corresponding to turbulence; x is the axial coordinate; r is the radial coordinate; u is the axial velocity; v is the radial velocity; ρ is the density; p is the pressure; λ is the specific heat ratio; μ is the viscosity coefficient; and k is the thermal conductivity.
In the numerical solution, the Roeflux-difference splitting (FDS) method with second-order accuracy for spatial discreteness was used. To avoid nonphysical oscillations near the discontinuity, a min-mod limiter was used. Moreover, entropy correction was performed to avoid challenges in understanding and prevent the occurrence of a high Mach number. Over time, the implicit method is used for iterative solutions until the flow field converges.
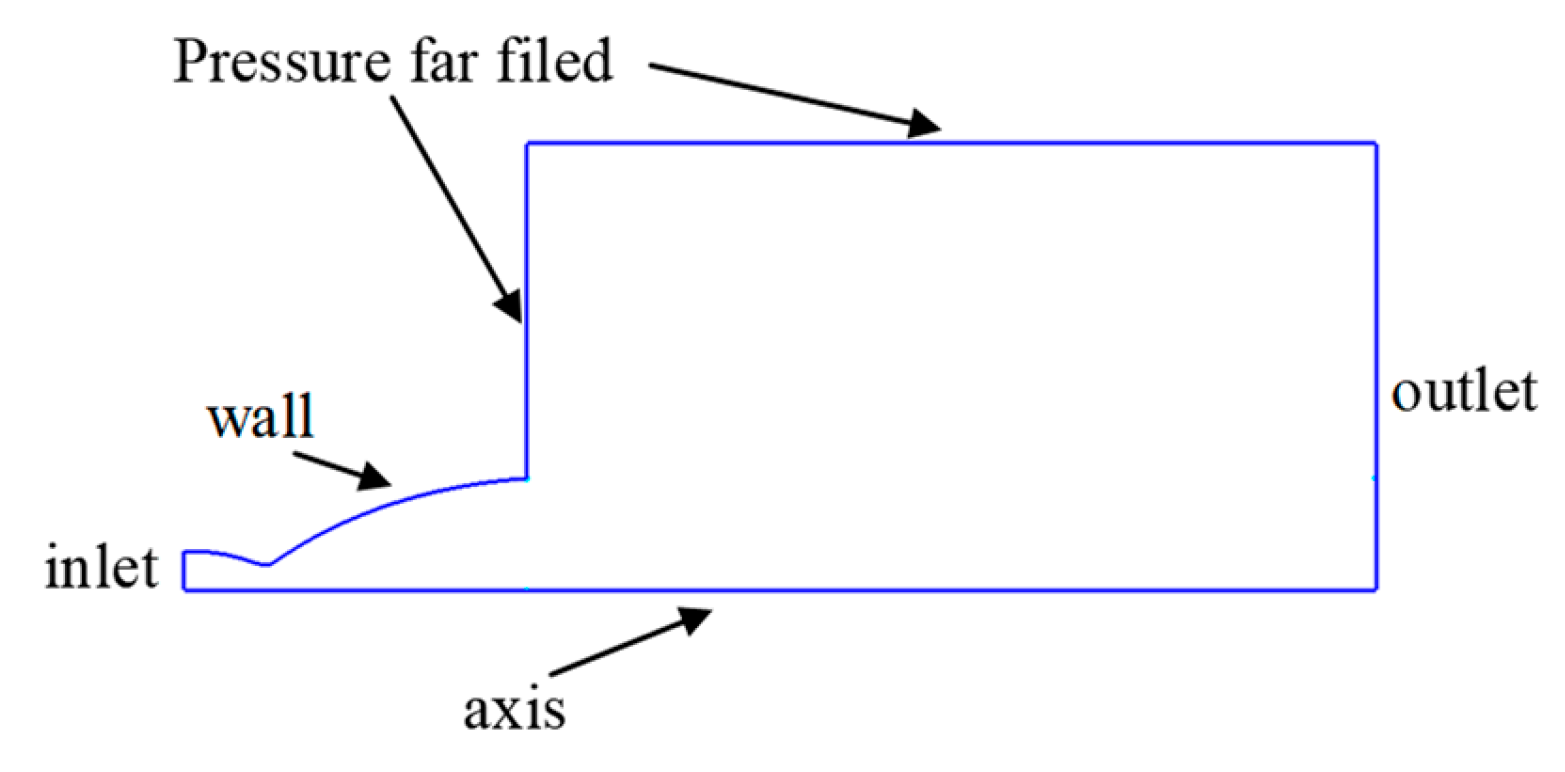
The enforced boundary conditions are shown in Figure 2; subsonic inflow at the nozzle feed chamber (total temperature and total pressure are forced together with the flow direction), axis of symmetry, adiabatic wall, subsonic inflow boundary condition on the left side of the outside area (main flow direction is from left to right), assigned pressure and non-reflective boundary conditions on the top and right sides, respectively. The turbulence intensity of the inlet boundary was set to 5% of the turbulence characteristic length nozzle inlet diameter.

2.2. Turbulence Model

The most common Reynolds stress modeling approach is the eddy viscosity model. This model is based on the Boussinesq hypothesis that turbulent quantities can be modeled by an additional viscosity coefficient, called turbulent viscosity, which is analogous to molecular viscosity. There are various models that can be applied to calculate turbulent viscosity either directly from the averaged flow variables or from additional variables for which equations must be solved. All models contain different empirical coefficients that are precisely tuned to the required flow type by comparing the CFD results with the experimental data. The advantage of RANS turbulence modeling is its low computational cost and the fact that the results are presented as time-averaged quantities, which is typically of interest for engineers.
The selection of a turbulence model is contingent upon various factors, including the physics of the flow, established practices for a given class of problems, the required level of accuracy, available computational resources, and simulation time. In this article, numerous models are selected, and the outcome is verified through experimentation.
To verify the ability of the numerical tool to predict the flow separation structure in overexpanded nozzles, validation test cases are considered. The subscale parabolic nozzle (VOLVO S1) [6] is the analysis object of this paper. This geometry is chosen because it shows both flow separation structures and experimental data are provided in the literature [6].
For the turbulence model, eight models are selected, including: the Spalart–Allmaras (SA), the standard k–e model, feasible k–e models, the re-normalization group (RNG) k–e model, standard and shear stress transport (SST) k–w models, the transient SST model, and the Reynolds stress model (RSM).
The near-wall modeling significantly impacts the fidelity of numerical solutions, inasmuch as walls are the main source of mean vorticity and turbulence. After all, it is in the near-wall region that the solution variables have large gradients, and the momentum and other scalar transports occur most vigorously. Therefore, accurate representation of the flow in the near-wall region determines successful predictions of wall-bounded turbulent flows. In this paper, we refer to the rule in reference [20] to select the wall function suitable for different turbulence models from Table 1.
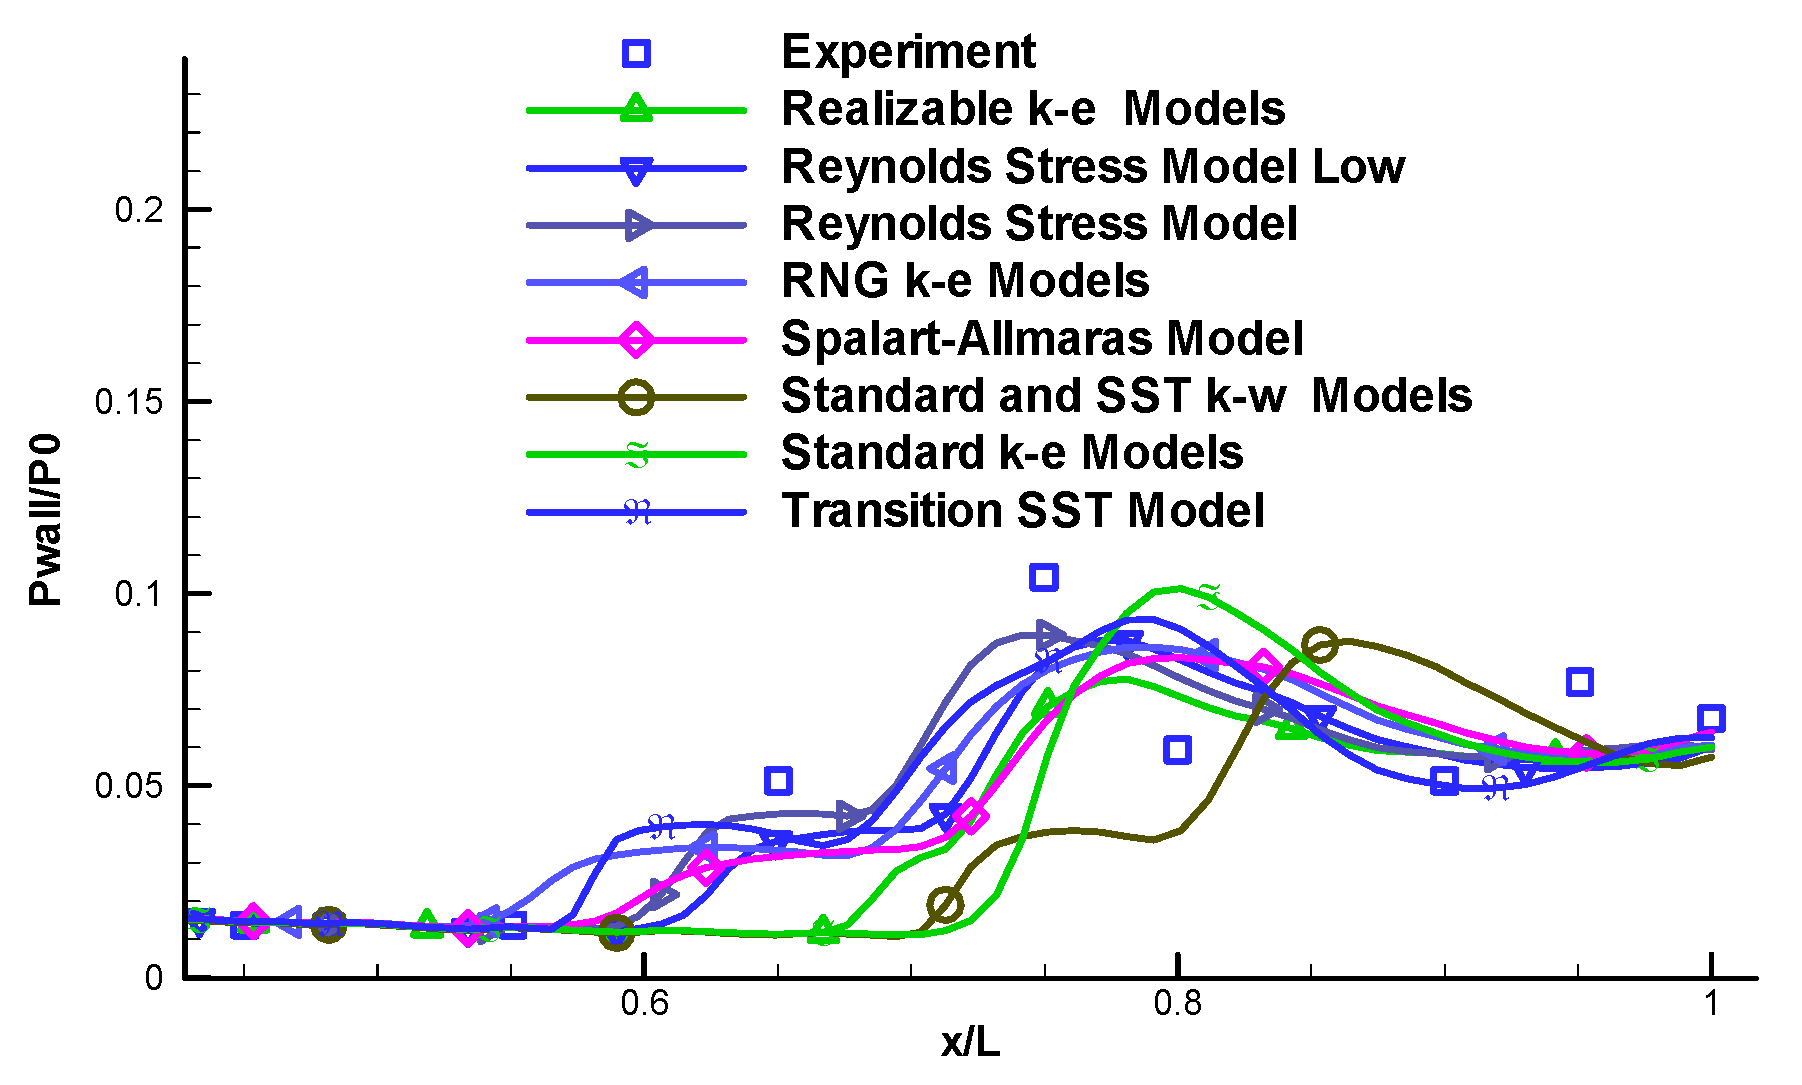
An OpenFOAM software V11 is used to simulate the flow inside the VOLVO S1nozzle with the NPR 16. The fluid is cold air. Figure 3 displays the pressure distribution along the nozzle wall. The Pwall means the pressure of the wall and the Po is the total pressure of the inlet. Both the SA and SST turbulence model give more accurate calculations.
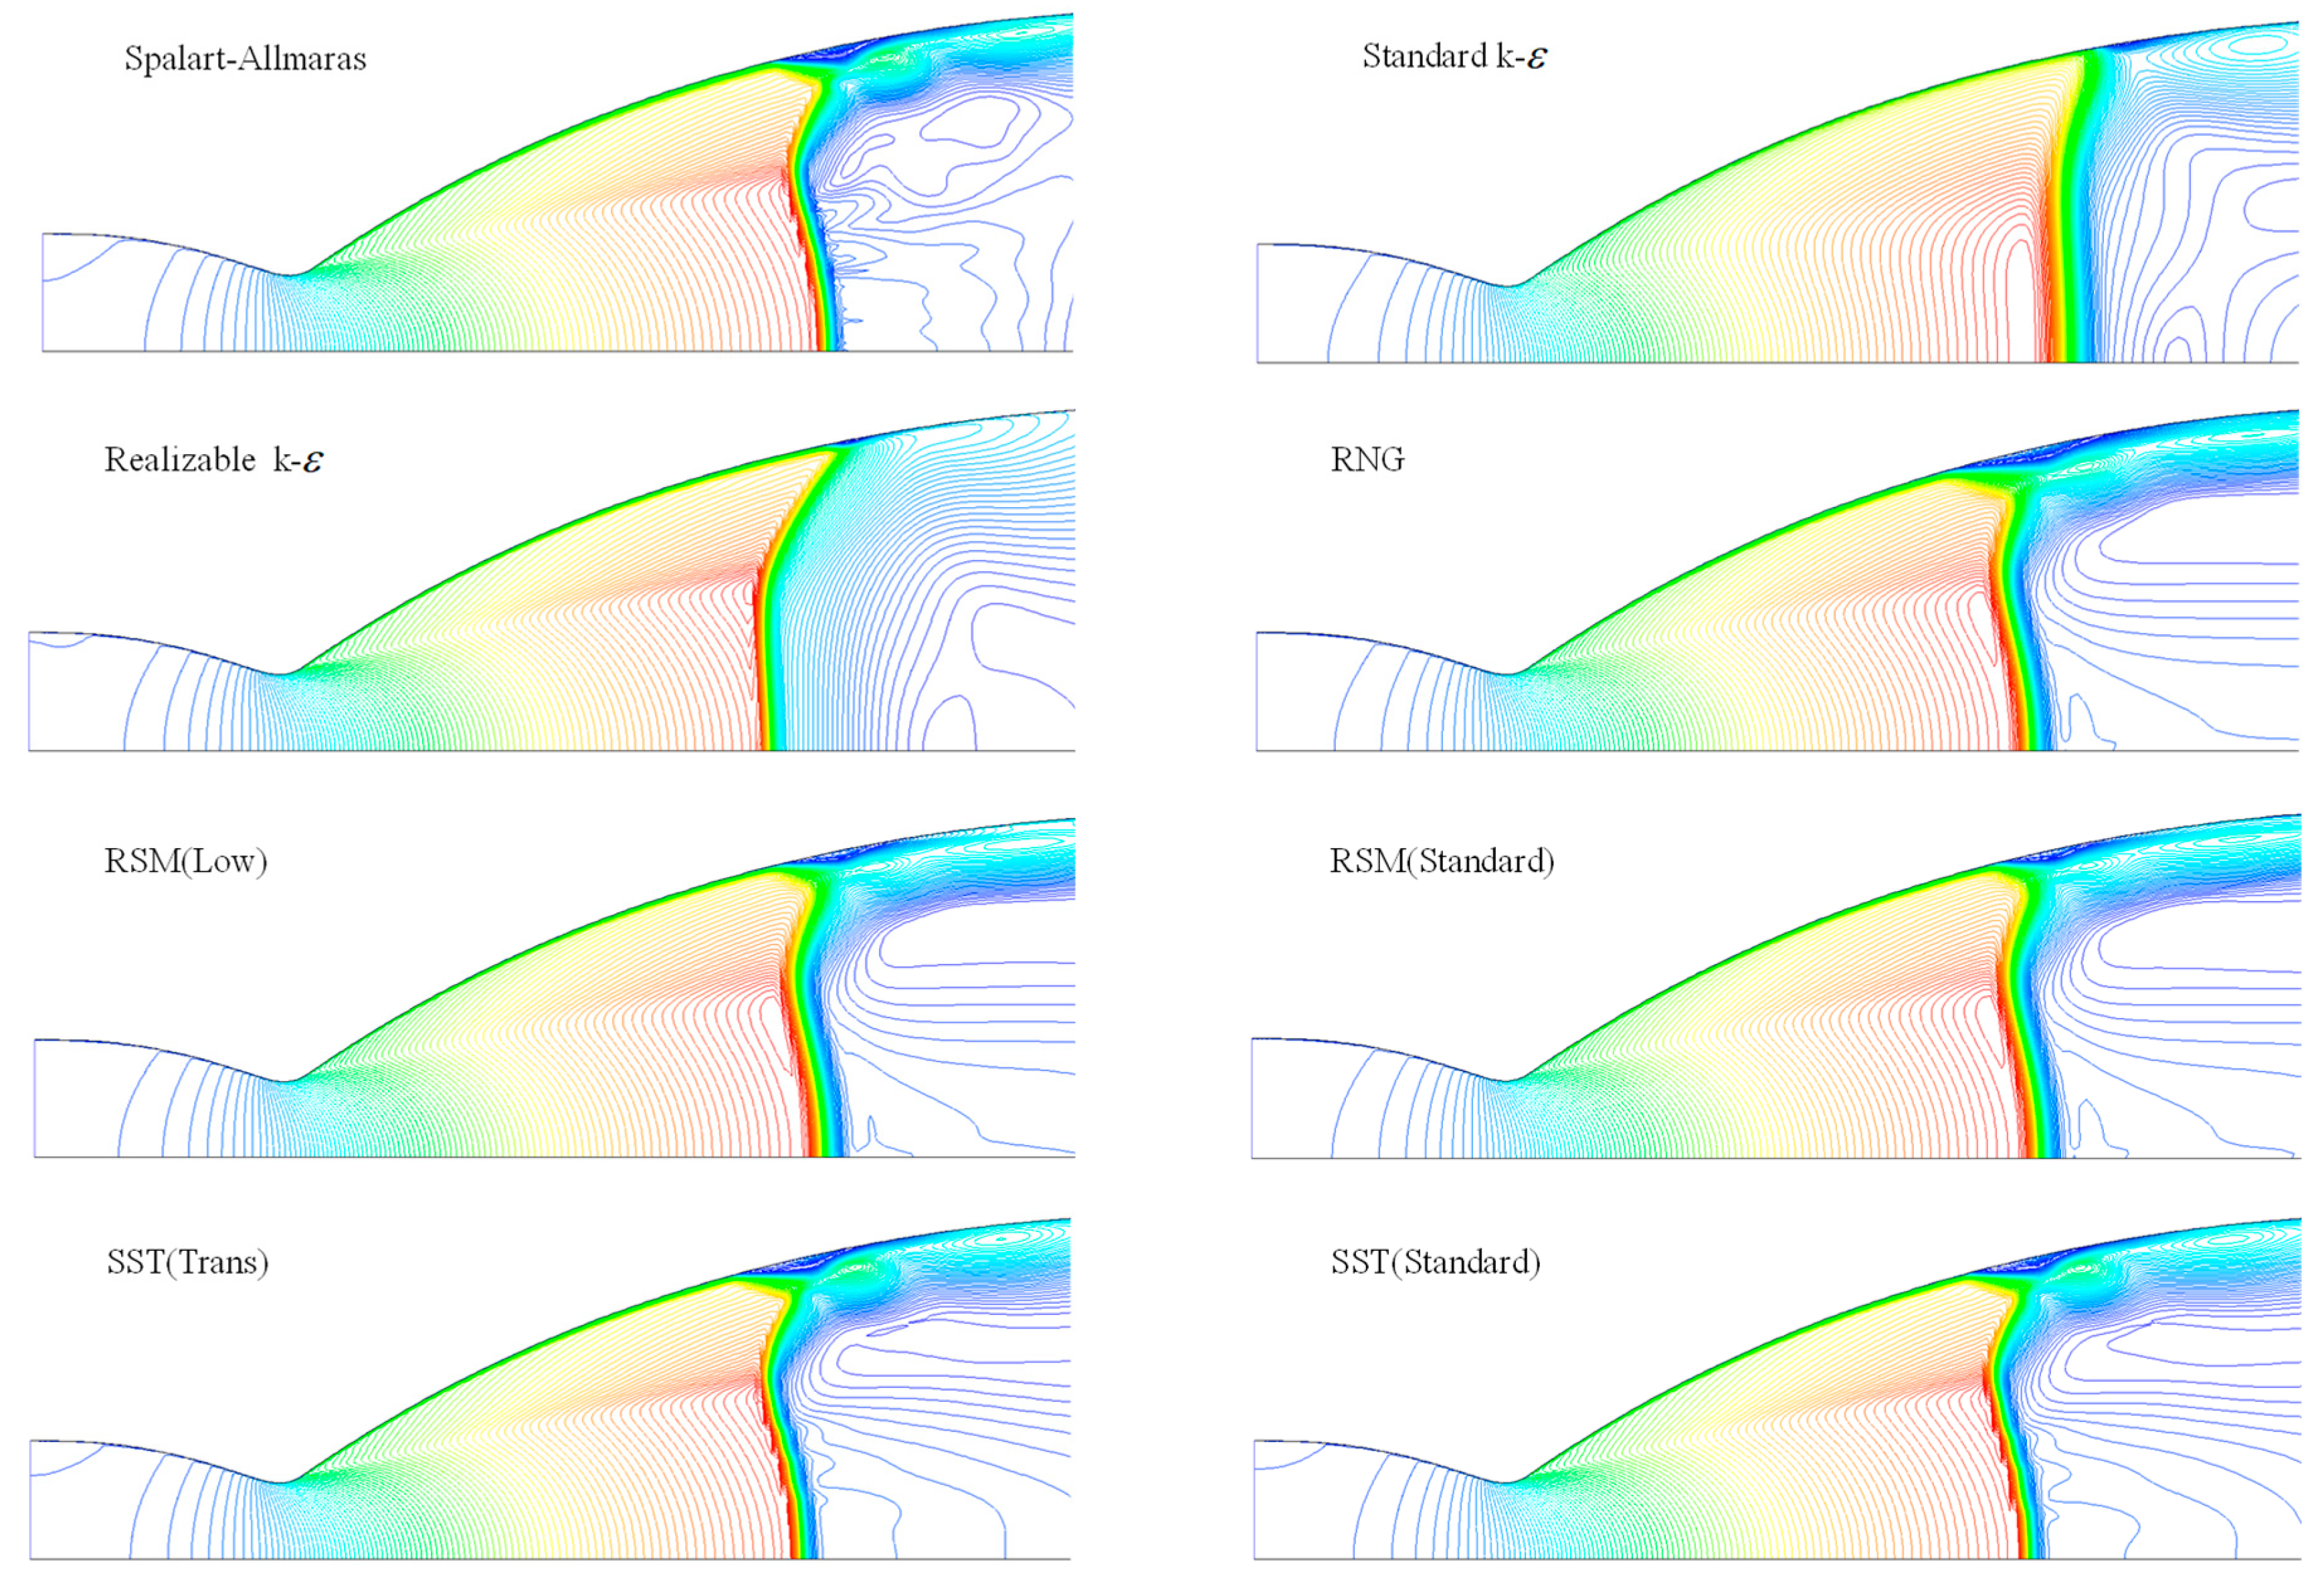
Figure 4 shows the contours of the velocity for different turbulence models. From the experiment results we know that the NPR 16 flow separation pattern is the RSS. The SA\RSM\SST turbulence models show better results. Based on the experimental results and computational efficiency, a turbulence model with an SA equation for numerical calculation of the flow separation was selected.

2.3. Case Test

Numerical simulation has its own scientific basis. The result of the separation flow simulation depends heavily on the quality of the mesh grid. In this article, the steady-state convergence solutions are first determined. Then, the mesh grid is refined. The simulation is carried out with the same boundary and initial conditions. The refined results and the rough results are essentially the same. Then, grid independence can be proven. In this article, the wall y+ is less than 1 to ensure that the premise calculates the convergence solution, and the mesh grid spacing is adjusted according to the mesh grid refinement. In this article, the two different pressures versus ambient pressure (NPR) conditions analyzed for the combustors (NPR = 14 and NPR = 16) are listed. Table 2 shows the specific distribution of the mesh grid.
Figure 4 shows the results of the nozzle wall pressure by comparison with the experimental data at PR = 14 and 16. The figure shows that the coarse and fine meshes achieve similar results, which is consistent with the experimental results. Grid independence is shown in Figure 5. As the present comparison shows, the calculated cutoff points at PR = 14 and PR = 16 are downstream relative to the measured position. Therefore, simulation method can be used to display the nozzle separation flow.

2.4. Ressult

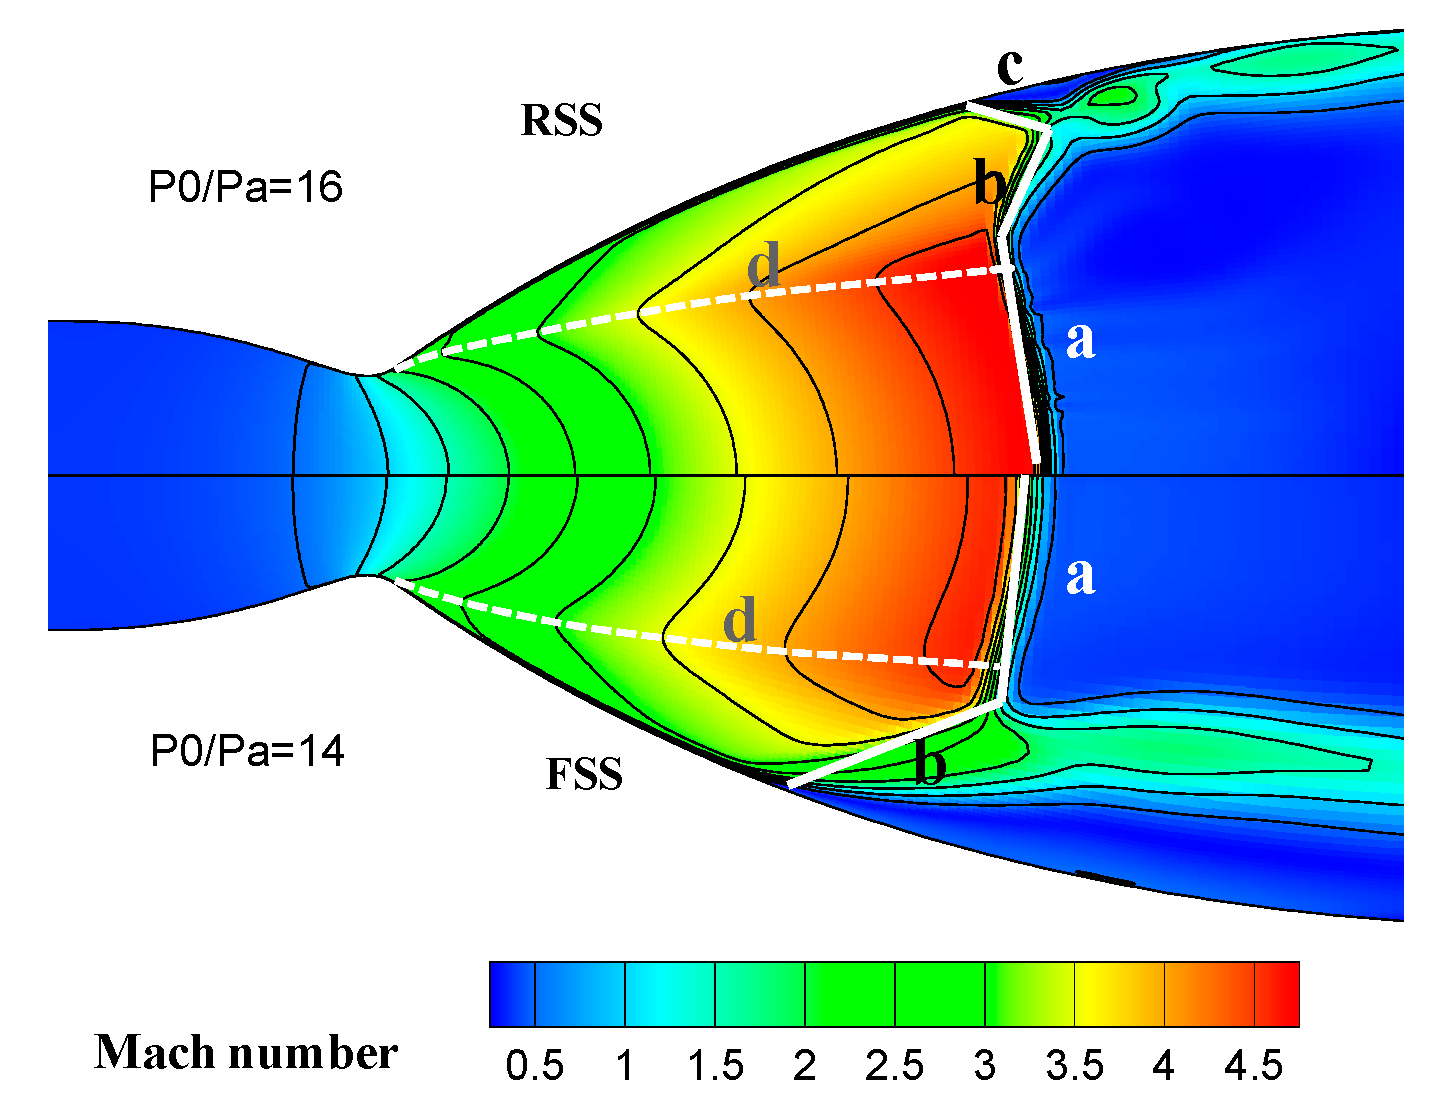
The shock wave contours are shown for the VOLVO S1 nozzle at different combustion chamber pressures. In the numerical simulation, NPRs of 8, 10, 12, 14, 16.4, 21, 25, 30, 35, 40, 45, and 50 are simulated and analyzed according to the above numerical methodology. The above calculation results represent the initial values for each condition. The results show that under different conditions from high to low inlet pressures, two different shock separation modes occur sequentially in the nozzle flow field: free shock and restricted shock separation, as shown in Figure 6. Under the two different shock separation modes, the flow field and pressure distribution in the nozzle exhibit different characteristics.
At NPR = 14, the FSS pattern is observed, and the gas stream separates and never reconnects to the wall. At NPR = 16, the RSS pattern is observed, and the flow field is characterized by reattachment to the wall to form a closed recirculation bubble. Figure 6 shows the shock nomenclature: a is the Mach disk, b is the oblique shock wave, c is the restricted shock wave, and d is the internal shock wave.
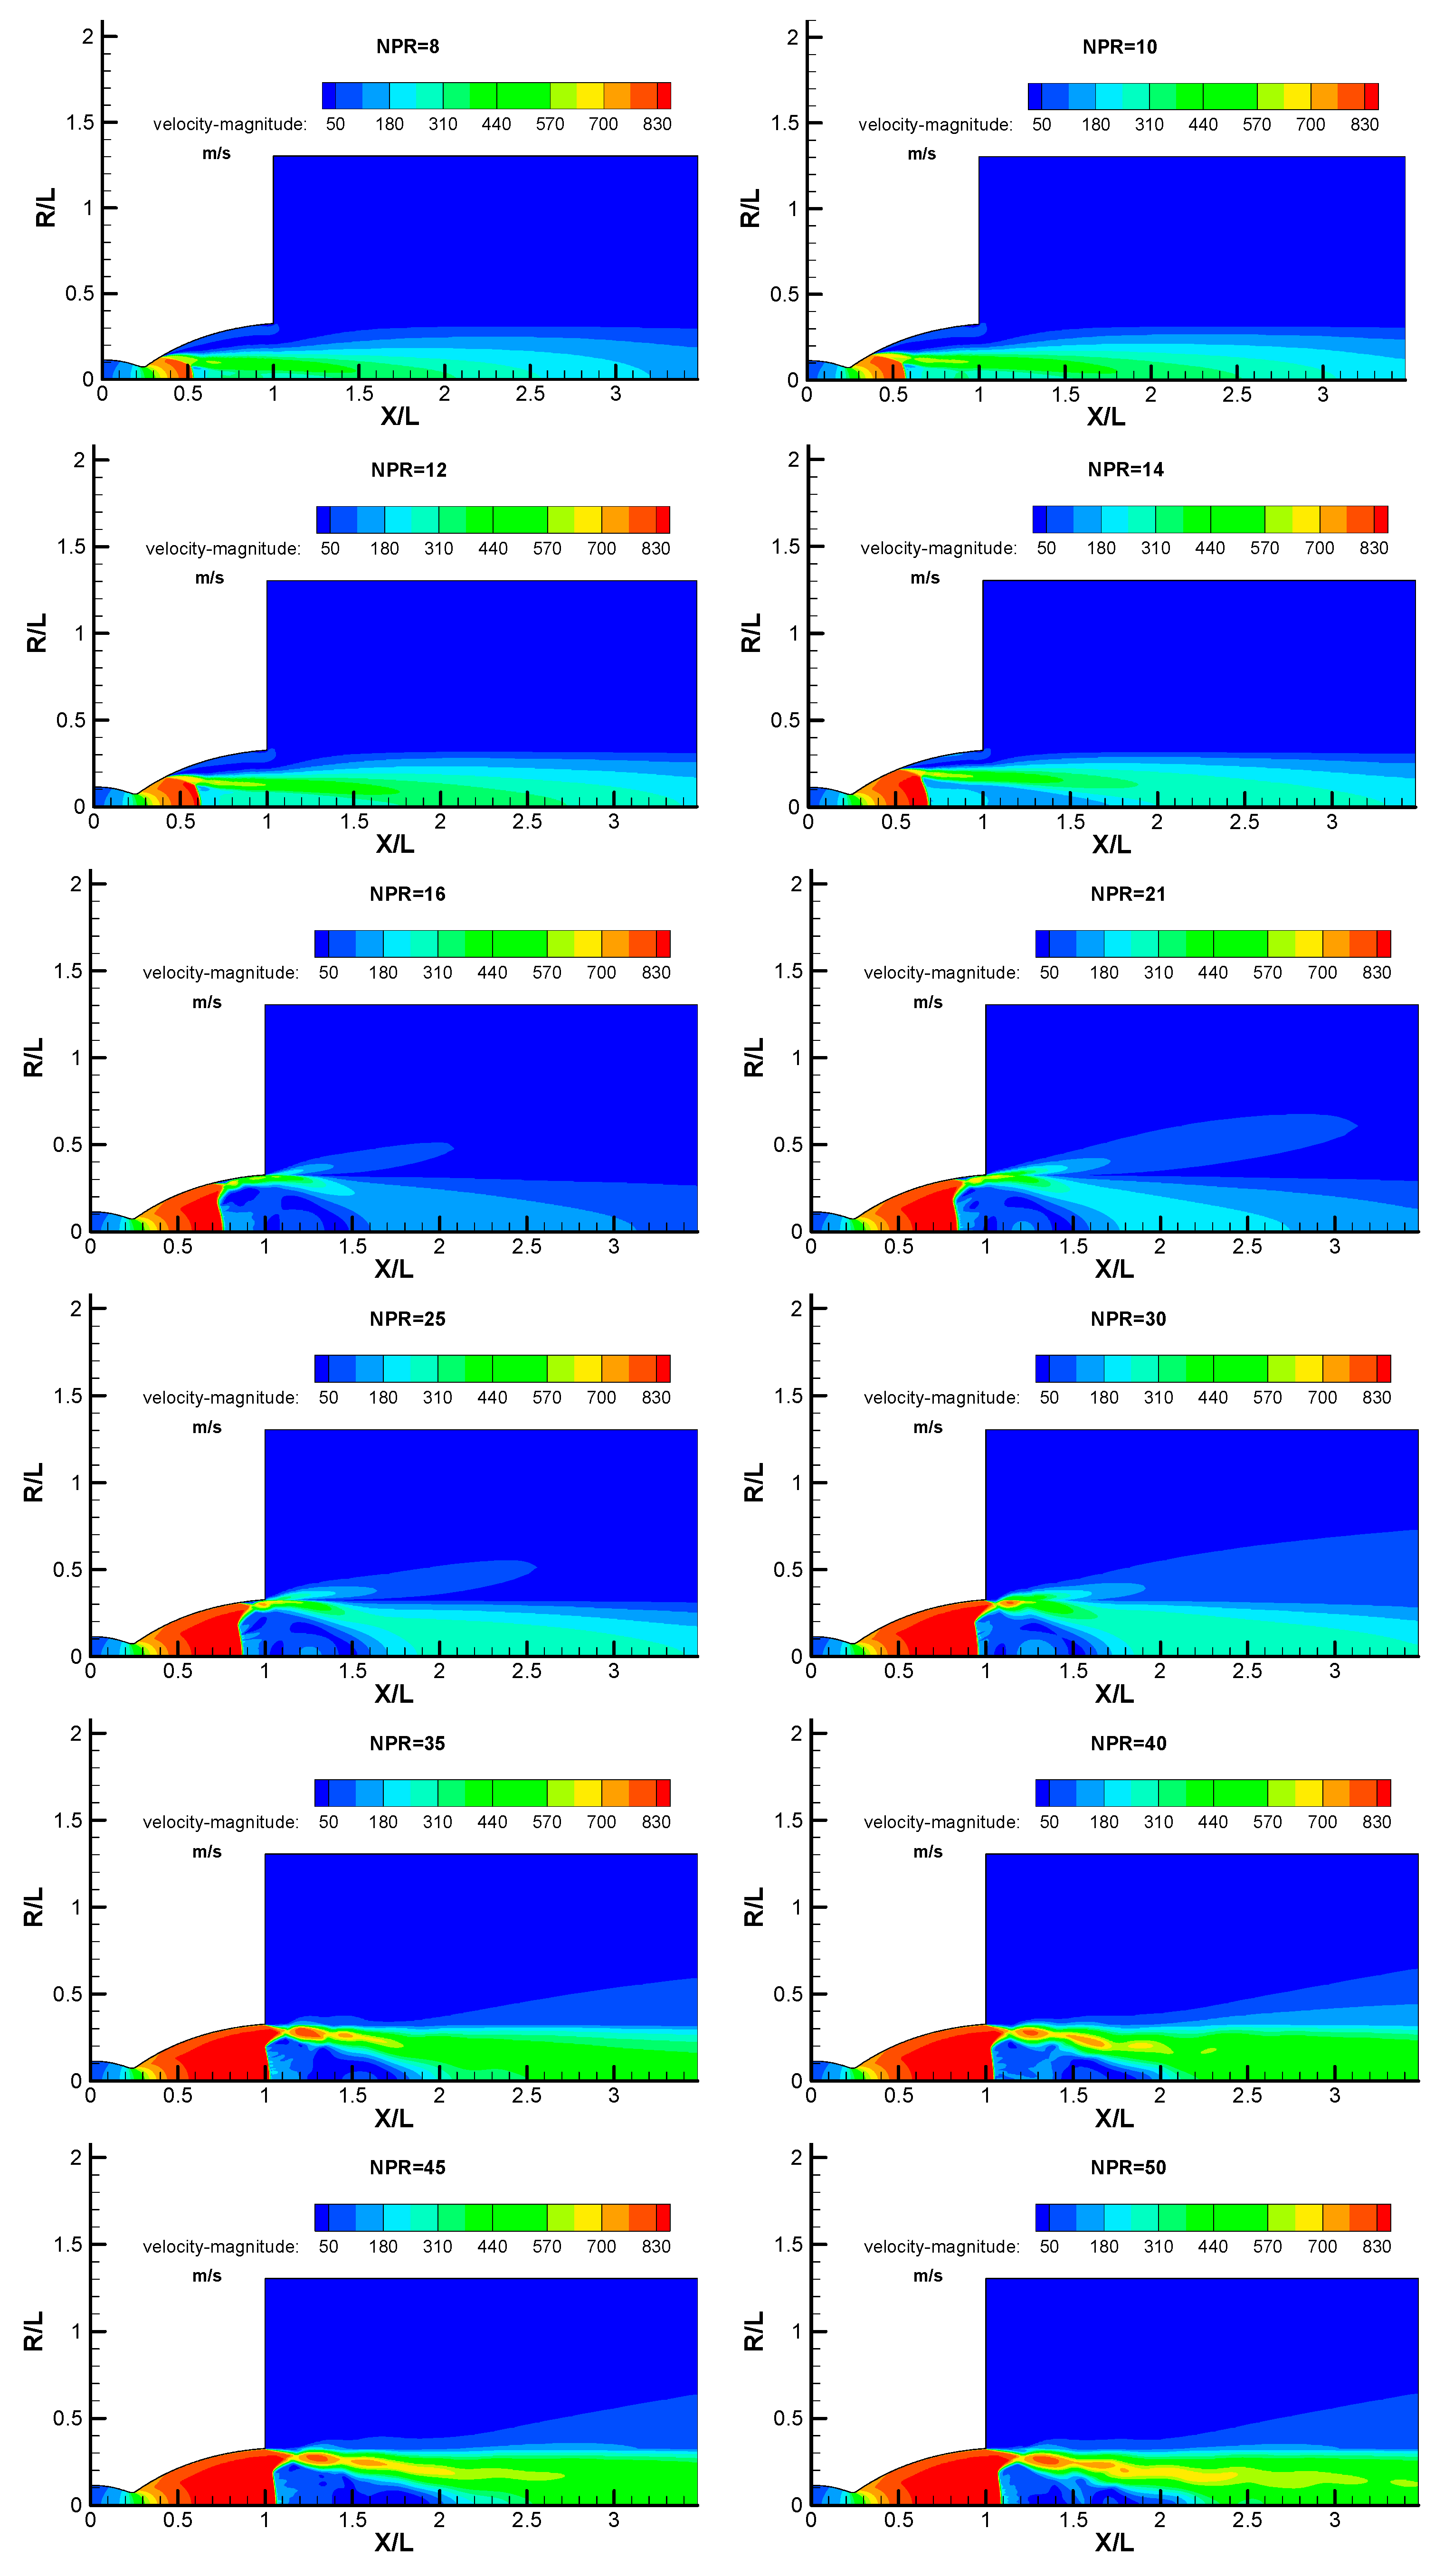
The calculated contours of the velocity quantities are shown in Figure 7. The instantaneous streamlines are shown in each figure.
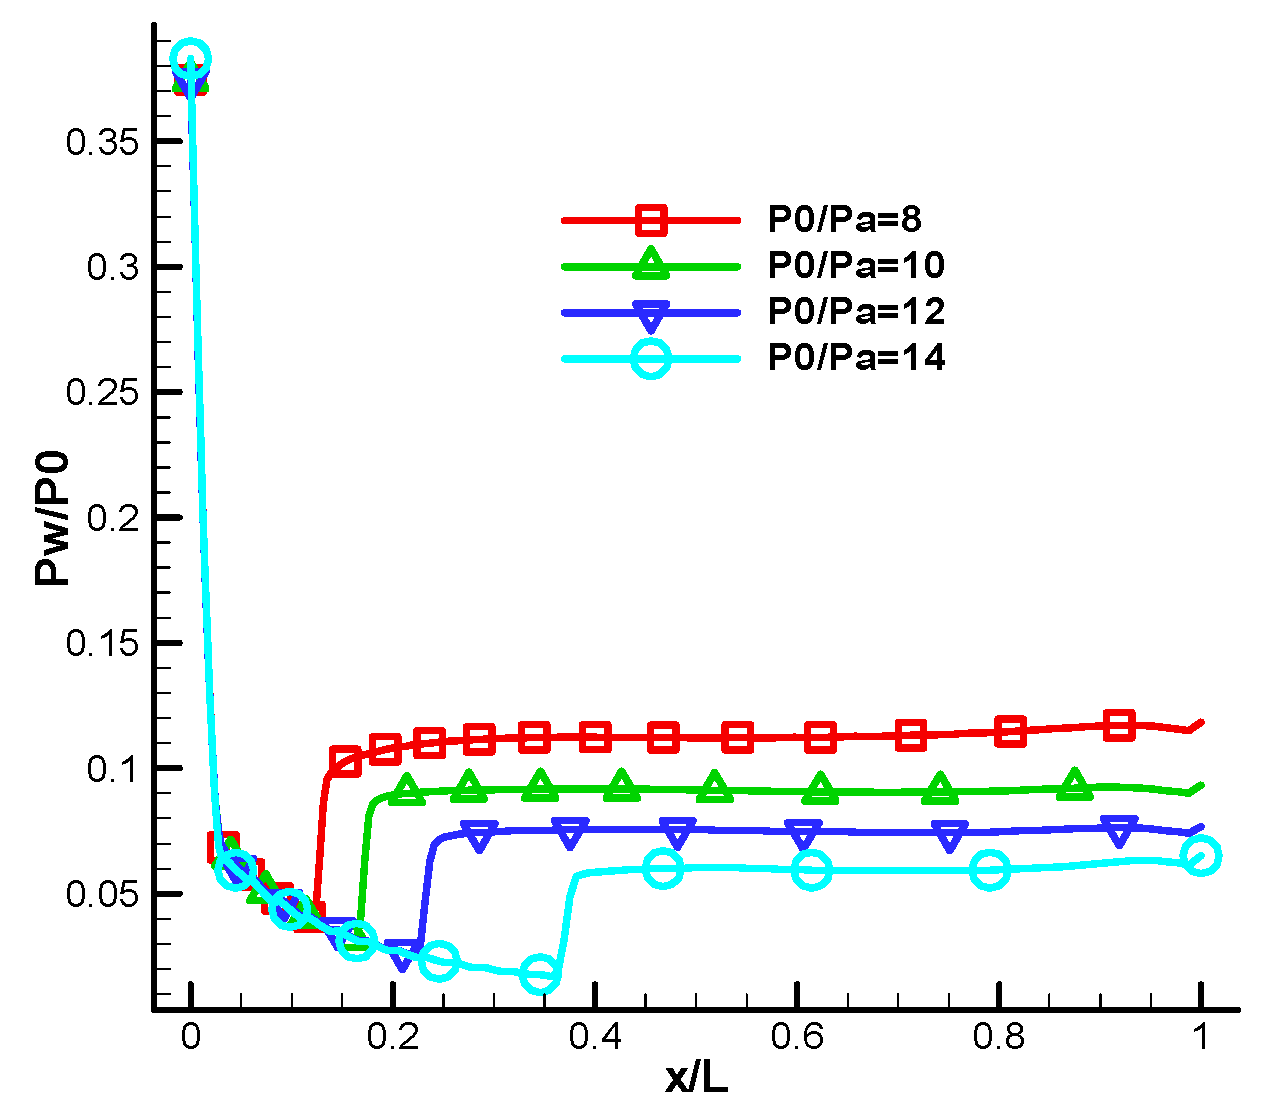
At an NPR of 8, 10, 12, or 14, the separation pattern is FSS, and Mach reflection of the separation shock wave occurs. As the NPR increases, the triple point of the Mach reflection moves toward the nozzle wall, reaching the location of the internal shock wave. In the FSS case, the developmental characteristics of wall pressure are mainly determined by classical supersonic flow separation.
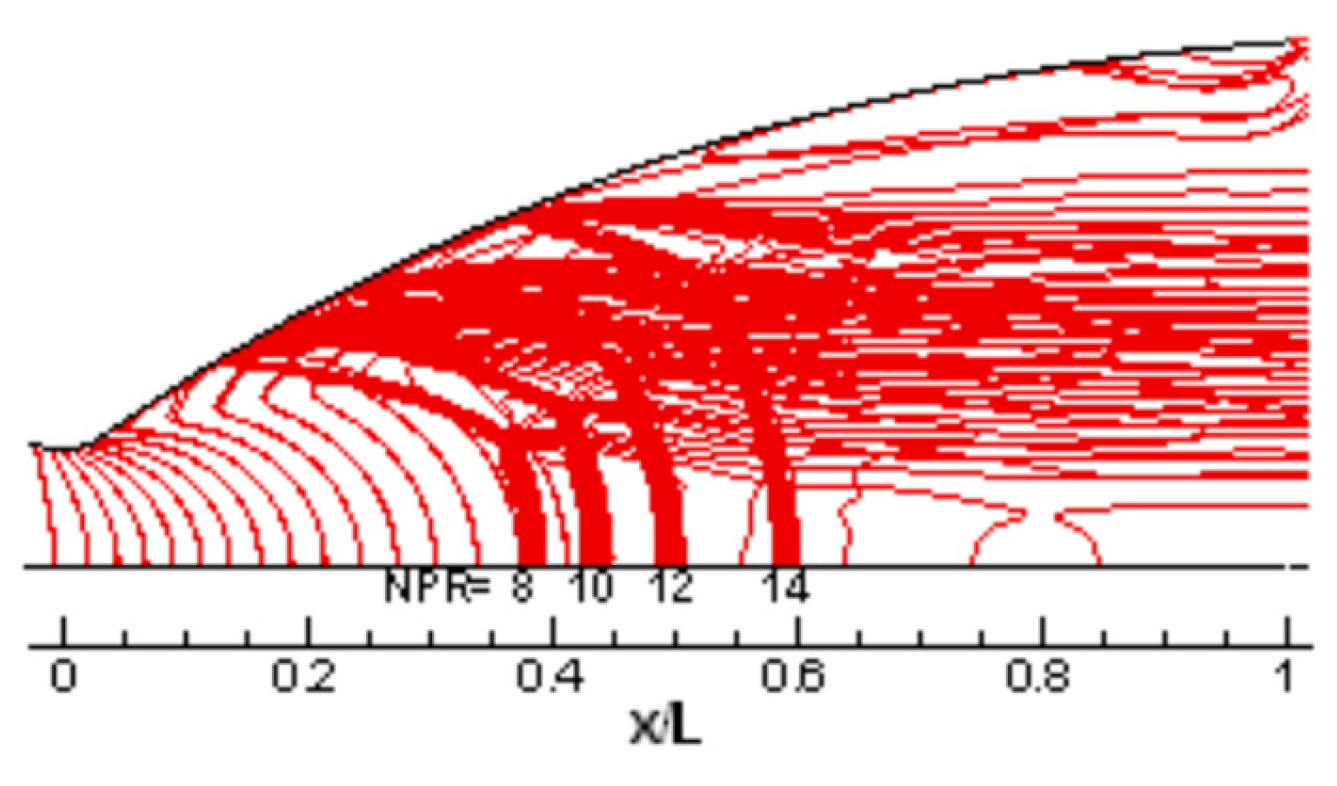
In the FSS pattern, the airflow in the nozzle separates from the wall and flows from the nozzle. Because the nozzle expands considerably, the airflow in the nozzle is in a state of overexpansion. In addition, the total pressure of the combustion chamber is lower than the ambient back pressure, resulting in the appearance of shock waves in the nozzle. However, as shown in Figure 8, after the air flows through expansion wave a and oblique shock wave b, a Mach disk is formed internally, and the gas is separated from the wall, no longer sticking to it. Moreover, as the total pressure of the combustion chamber increases, the shock waves in the nozzle move toward the exit, but the parameters of the flow field in front of the shock waves remain fundamentally unchanged.
Figure 9 shows the wall pressure distribution curve of the nozzle expansion section in the combustor in free shock mode. According to the figure, in free shock mode, the pressure increases rapidly to the magnitude of the environmental pressure through the shock wave after wall separation.
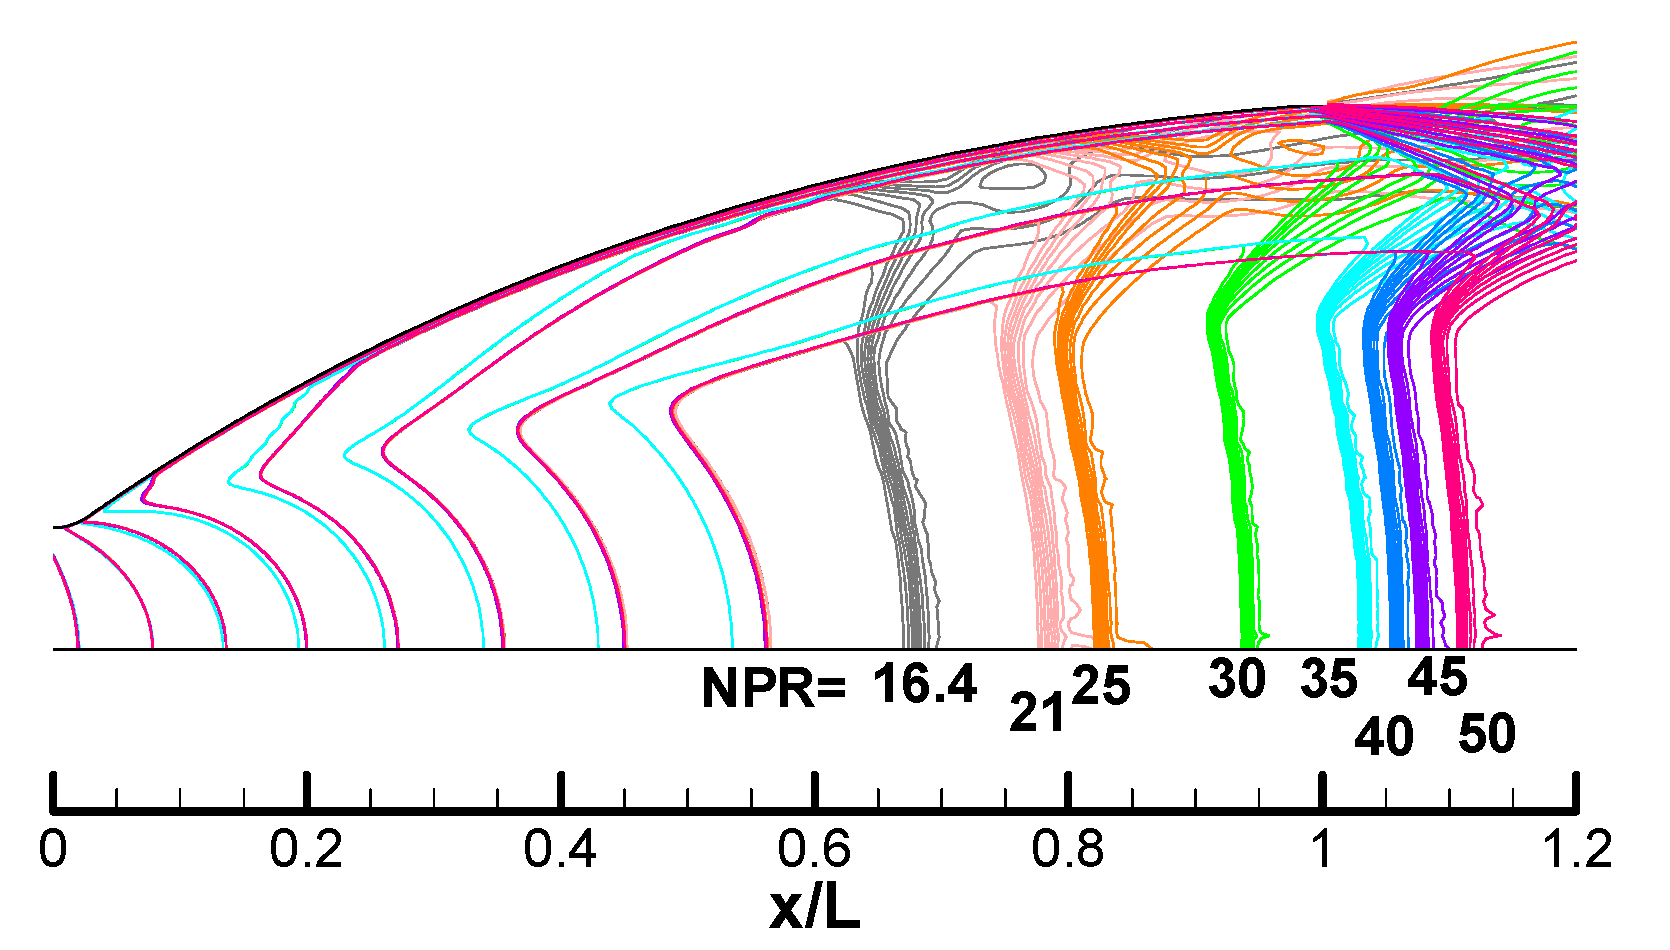
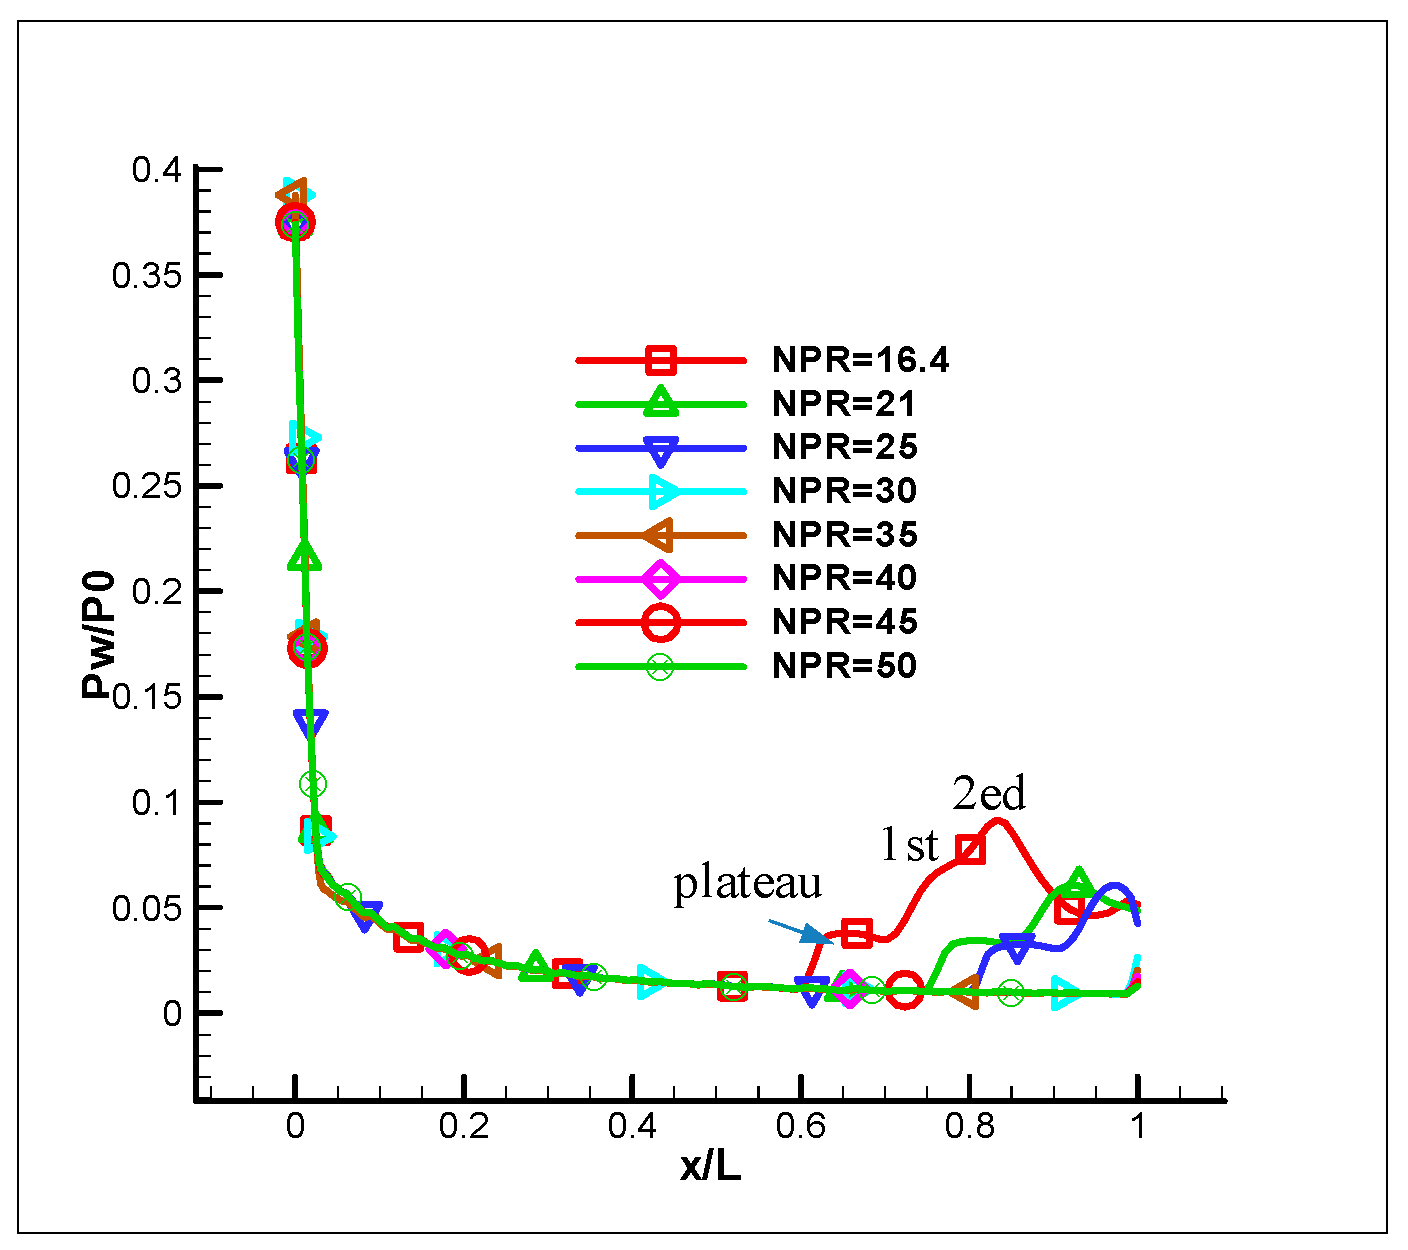
In the RSS pattern, the reattached stream travels along the nozzle wall and is expelled from the nozzle exit. The exhaust cloud eventually converges downstream toward the nozzle centerline. In the subsonic flow region behind the Mach disk at the nozzle center, the flow continues along the nozzle axis, and a recirculation region forms due to the presence of a high-pressure region generated by the convergence of the plume. Figure 9 shows the flow field structures of the nozzle when the NPRs are 16.4, 21, 25, 30, 35, 40, 45, and 50. The Figure 9 indicates that as the pressure ratio of the combustion chamber increases, the shock wave mode does not change, and after the wall air separates, the flow adheres to the wall surface and forms a flow attachment zone. When the NPR is 40, the shock wave is pushed out of the nozzle, and the nozzle plume forms a clear Mach disk. At the separation point, the wall pressure increases rapidly to a relatively stable pressure (platform area shown in Figure 10) because of the oblique separation shock wave. Unlike in FSS mode, the airflow is reattached to the wall after a short separation period. Due to the strong effect of the reattachment shock wave, the wall pressure at the reattachment site increases sharply and exceeds the ambient pressure. Then, through a series of gradually decreasing fluctuations, the wall pressure eventually drops slightly below the ambient pressure until it reaches the nozzle exit.
Figure 11 shows the wall pressure distribution in the nozzle expansion section of the combustion chamber in RSS mode. As shown in the figure, as the air =flow increases, the wall pressure gradually decreases. This pressure fluctuation decreases due to the reflective properties of the shock waves. The reattached shock wave tends to reflect away from the wall, and the strength of this tendency is determined by the strength of the shock wave. This shock wave causes the airflow characteristics to be the same both far from the wall and close to the wall, creating a series of shock waves in the barrier area, which then lead to wall pressure fluctuations.
The reattachment of the separated boundary layer generates a reattachment shock wave, and the wall pressure increases. However, the arrival of expansion waves from the inner free boundary of the reattached flow reduces the wall pressure. This reduction results in the first pressure peak, marked as “1” in Figure 11. Another high-pressure region is generated downstream from the reattachment point due to the interaction between the reattachment shock wave and the compression waves from the inner boundary of the reattachment flow, which form a second pressure peak labeled “2” in Figure 11. Due to the unfavorable pressure gradient resulting from the second peak, another separation bubble forms immediately upstream of this peak. Farther downstream, the shock, compression and expansion waves continue to be reflected between the nozzle wall and the free boundary of the reattached flow. As a result, pressure areas that are either higher or lower than the ambient pressure form in the reattached flow. As the NPR increases, the reattached flow structure moves downstream and is gradually discharged from the nozzle exit. The main structures of the reattached stream remain similar under RSS conditions. At NPRs above 30, the plume diverges from the nozzle exit.
For the two different separation modes mentioned above, an internal shock wave is generated in the nozzle of each separation shock mode (d-curve in Figure 7). This internal shock wave arises at the starting point of the nozzle parabola. The design method of the maximum thrust nozzle suggests that the nozzle profile at this point is a second-order discontinuous point, which is an unstable flow point that indicates the easy generation of shock waves. A schematic representation of the flow field structure shows that this internal shock wave largely determines the shape of the shock wave in the central area. The vortex behind the positive shock wave in the central flow field tends to push the flow toward the wall. When the momentum of the liquid flowing to the wall reaches a certain level, separation and reattachment occur.
As we all know, the lateral force cannot be obtained through two dimensional axisymmetric calculations, but different modes of flow separation and changes in wall pressure can be analyzed; And the turbulence models comparison can provide support for the analysis of three-dimensional models.

3. Static Structure Analysis

3.1. Wavelet Transfer Method

Mathematical functions called wavelets are used to separate data into different frequency components and to analyze each component at an appropriate resolution scale. These functions are better than conventional Fourier techniques when applied to examine physical scenarios in which signals have sharp peaks and discontinuities.
Discrete wavelet transforms (DWTs) and continuous wavelet transforms (CWTs) are two types of wavelet transforms. When used with the Fourier transform, these transforms may offer additional insights into dynamic systems. Similar to the mechanism by which the fast Fourier transform (FFT) relates the input signal to a superposition of cosine terms when transforming a signal from the time domain to the frequency domain, wavelet transforms relate an input signal to a basis function, which is considered the mother wavelet.
Nonetheless, a wavelet analysis can detect nearly instantaneous frequency changes due to the finite length of the signal considered in this method. Conversely, FFT analyses cannot detect such changes since this process involves a signal with an infinite length. In this paper, the Haar wavelet transmission of pressure during the given time is used. The Haar wavelet is a mathematical sequence of rescaled “quadratic” functions that collectively comprise a wavelet basis or family. Similar to a Fourier analysis, a wavelet analysis enables the representation of an objective function as an orthonormal function basis over an interval. The noncontinuous and, hence, nondifferentiable nature of the Haar wavelet is its technical drawback. Nevertheless, this characteristic can be useful in flow separation and signal analyses involving abrupt transitions.
ψ ( t ) = 1 0 t < 0.5 1 0.5 t < 1 0 o t h e r w i s e

3.2. Analysis of the Lateral Side-Load Force

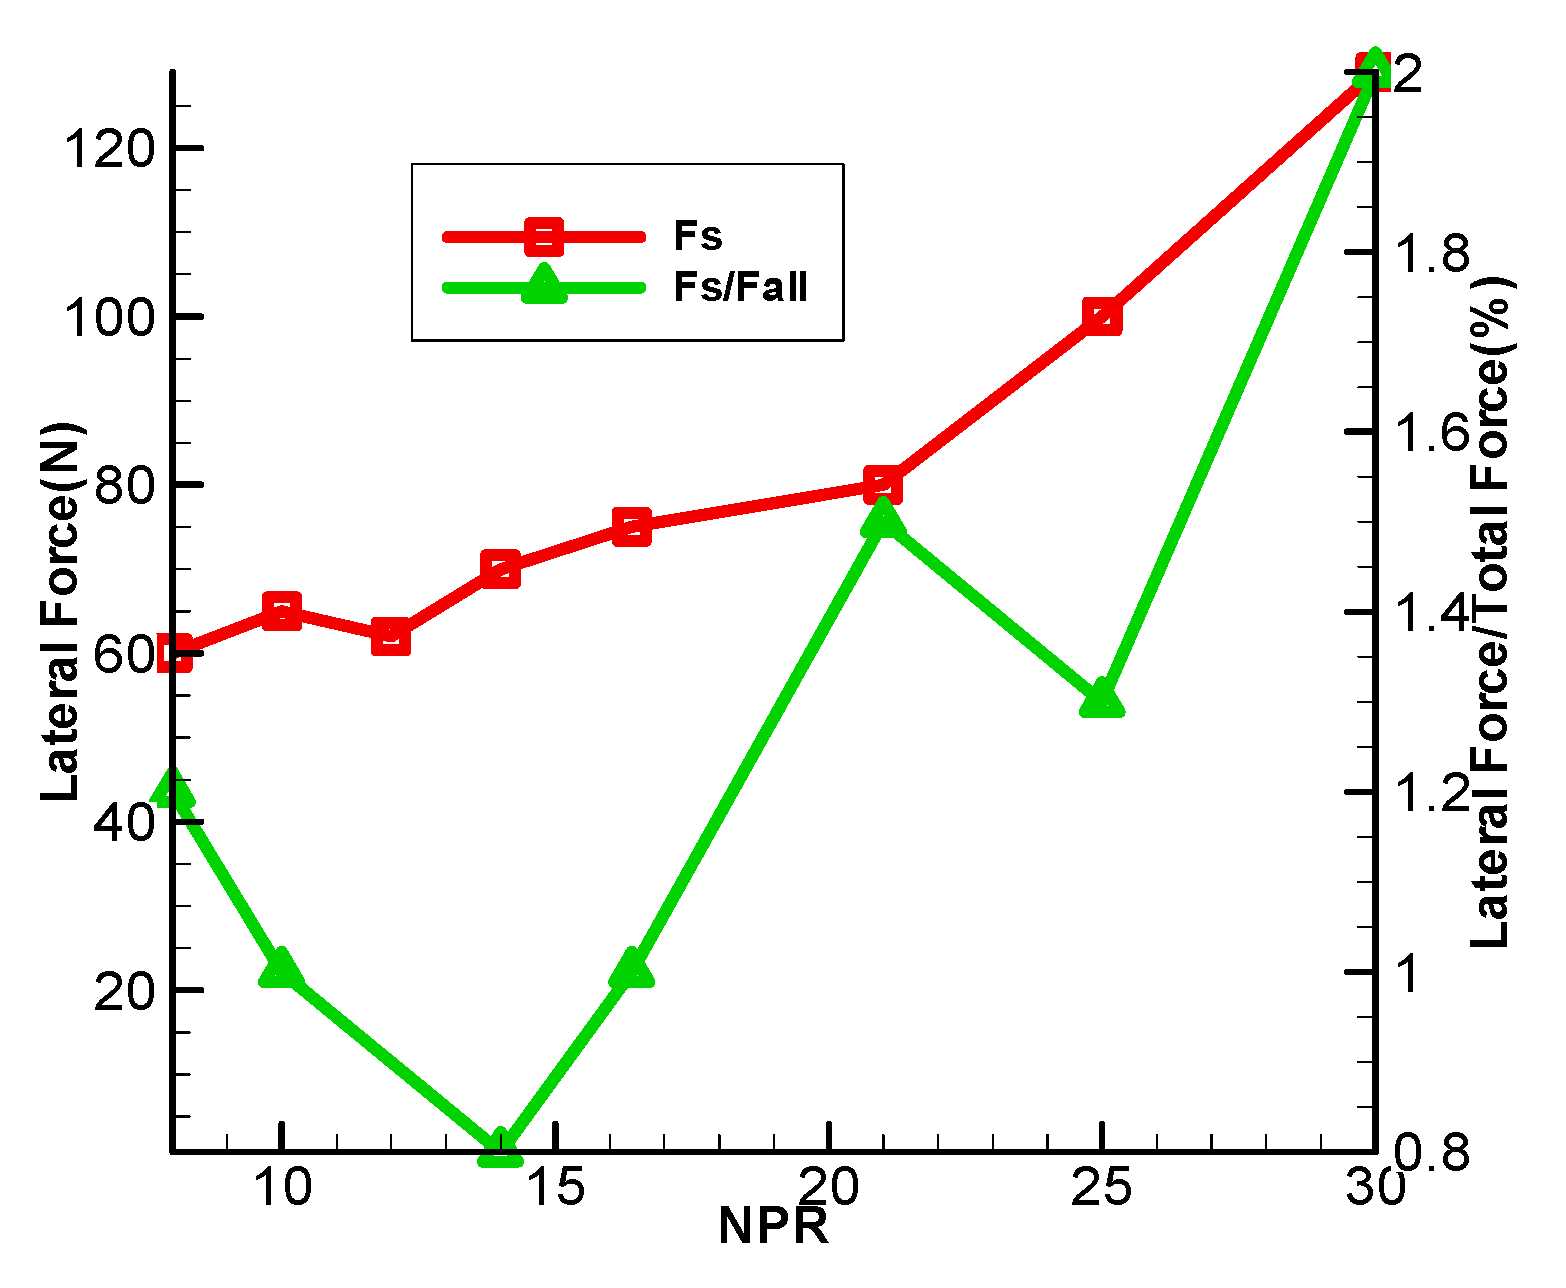
Using the previously mentioned flow field calculation method, a three-dimensional analysis of a high-expansion-ratio nozzle is conducted herein. By integrating the pressure on the nozzle wall, different directional forces of the nozzle are detected based on the convergent solution. In this article, the combined nonaxial shear force is referred to as the shear force. The nozzle pressure is integrated at different pressure ratios according to the defined lateral load force. Ultimately, the nonaxial transverse load force can be determined by calculating the force components in each direction. Figure 12 shows the relationship curve between the lateral loading force and the compression ratio NPR. The figure shows that the lateral loading force increases with the increase in the compression ratio.
The relationships between the lateral load force and the total thrust (thrust on the engine axis) under different pressure conditions are shown in Figure 12. The figure shows that there is no monotonic relationship between the pressure ratio and the change in the transverse load in the total thrust. The contribution of the lateral load force to the total thrust is negligible (generally less than 2%) under the various operating conditions examined in this paper. A steady state is used as the basis for a transient simulation calculation that comprehensively analyzes the effects of the lateral load force. The SA turbulence model is used for the operating conditions in which NPR is 16. Moreover, the pressure distributions across several nozzle points are observed. Table 3 shows the exact location of the dot array.
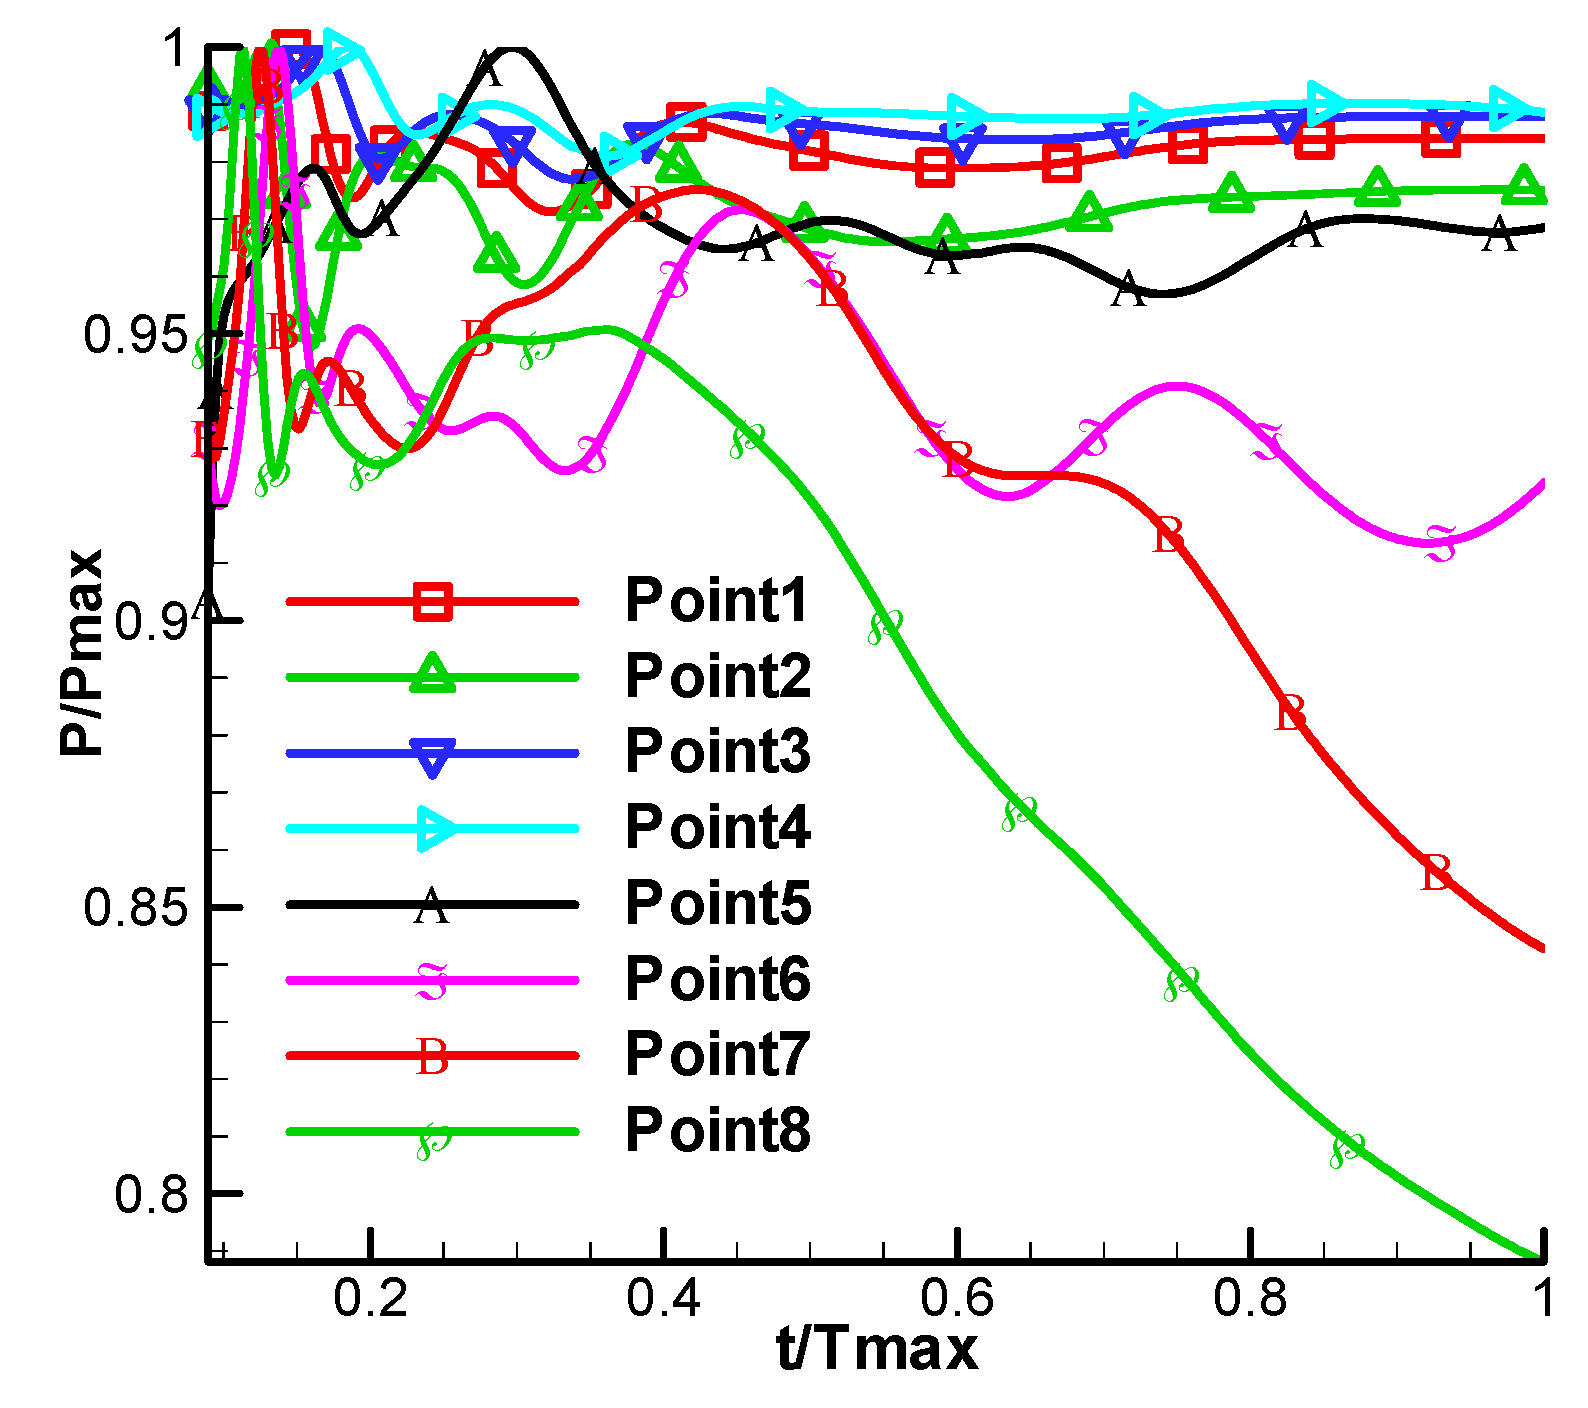
Figure 13 shows the pressure fluctuations at each point using a transient simulation of this operating condition. Each monitoring value is reorganized to have a variation range of 0–1 by dividing the value by the maximum value in the dataset. This process allows the figure to accurately represent the variations in the monitoring measurements.
As shown in the figure, the pressures at all monitoring points at the beginning of the flow process exhibit similar fluctuations and are relatively high. Over time, the flow field evolves, and different monitoring points exhibit unique pressure fluctuations. Before the separation point (points 1–5), an equilibrium state is reached within a certain period, indicating flow stability before shock wave separation, at which point the parameters are essentially the same. Different monitoring points (points 6–8) initially show similar trends during the first flow period after shock waves occur. However, pressure fluctuations arise because separate shock waves disrupt the established transition flow of the flow field over time. As a result, important parameter changes occur after shock wave separation. High-velocity flows cause complex turbulent pulsations that follow shock waves caused by interactions between near-wall shock waves and boundary layers and by the entrainment of low-temperature air. Changes in the vortex that follow contained shock waves affect the changes in the pressure state.

3.3. Frequency Result Discuss

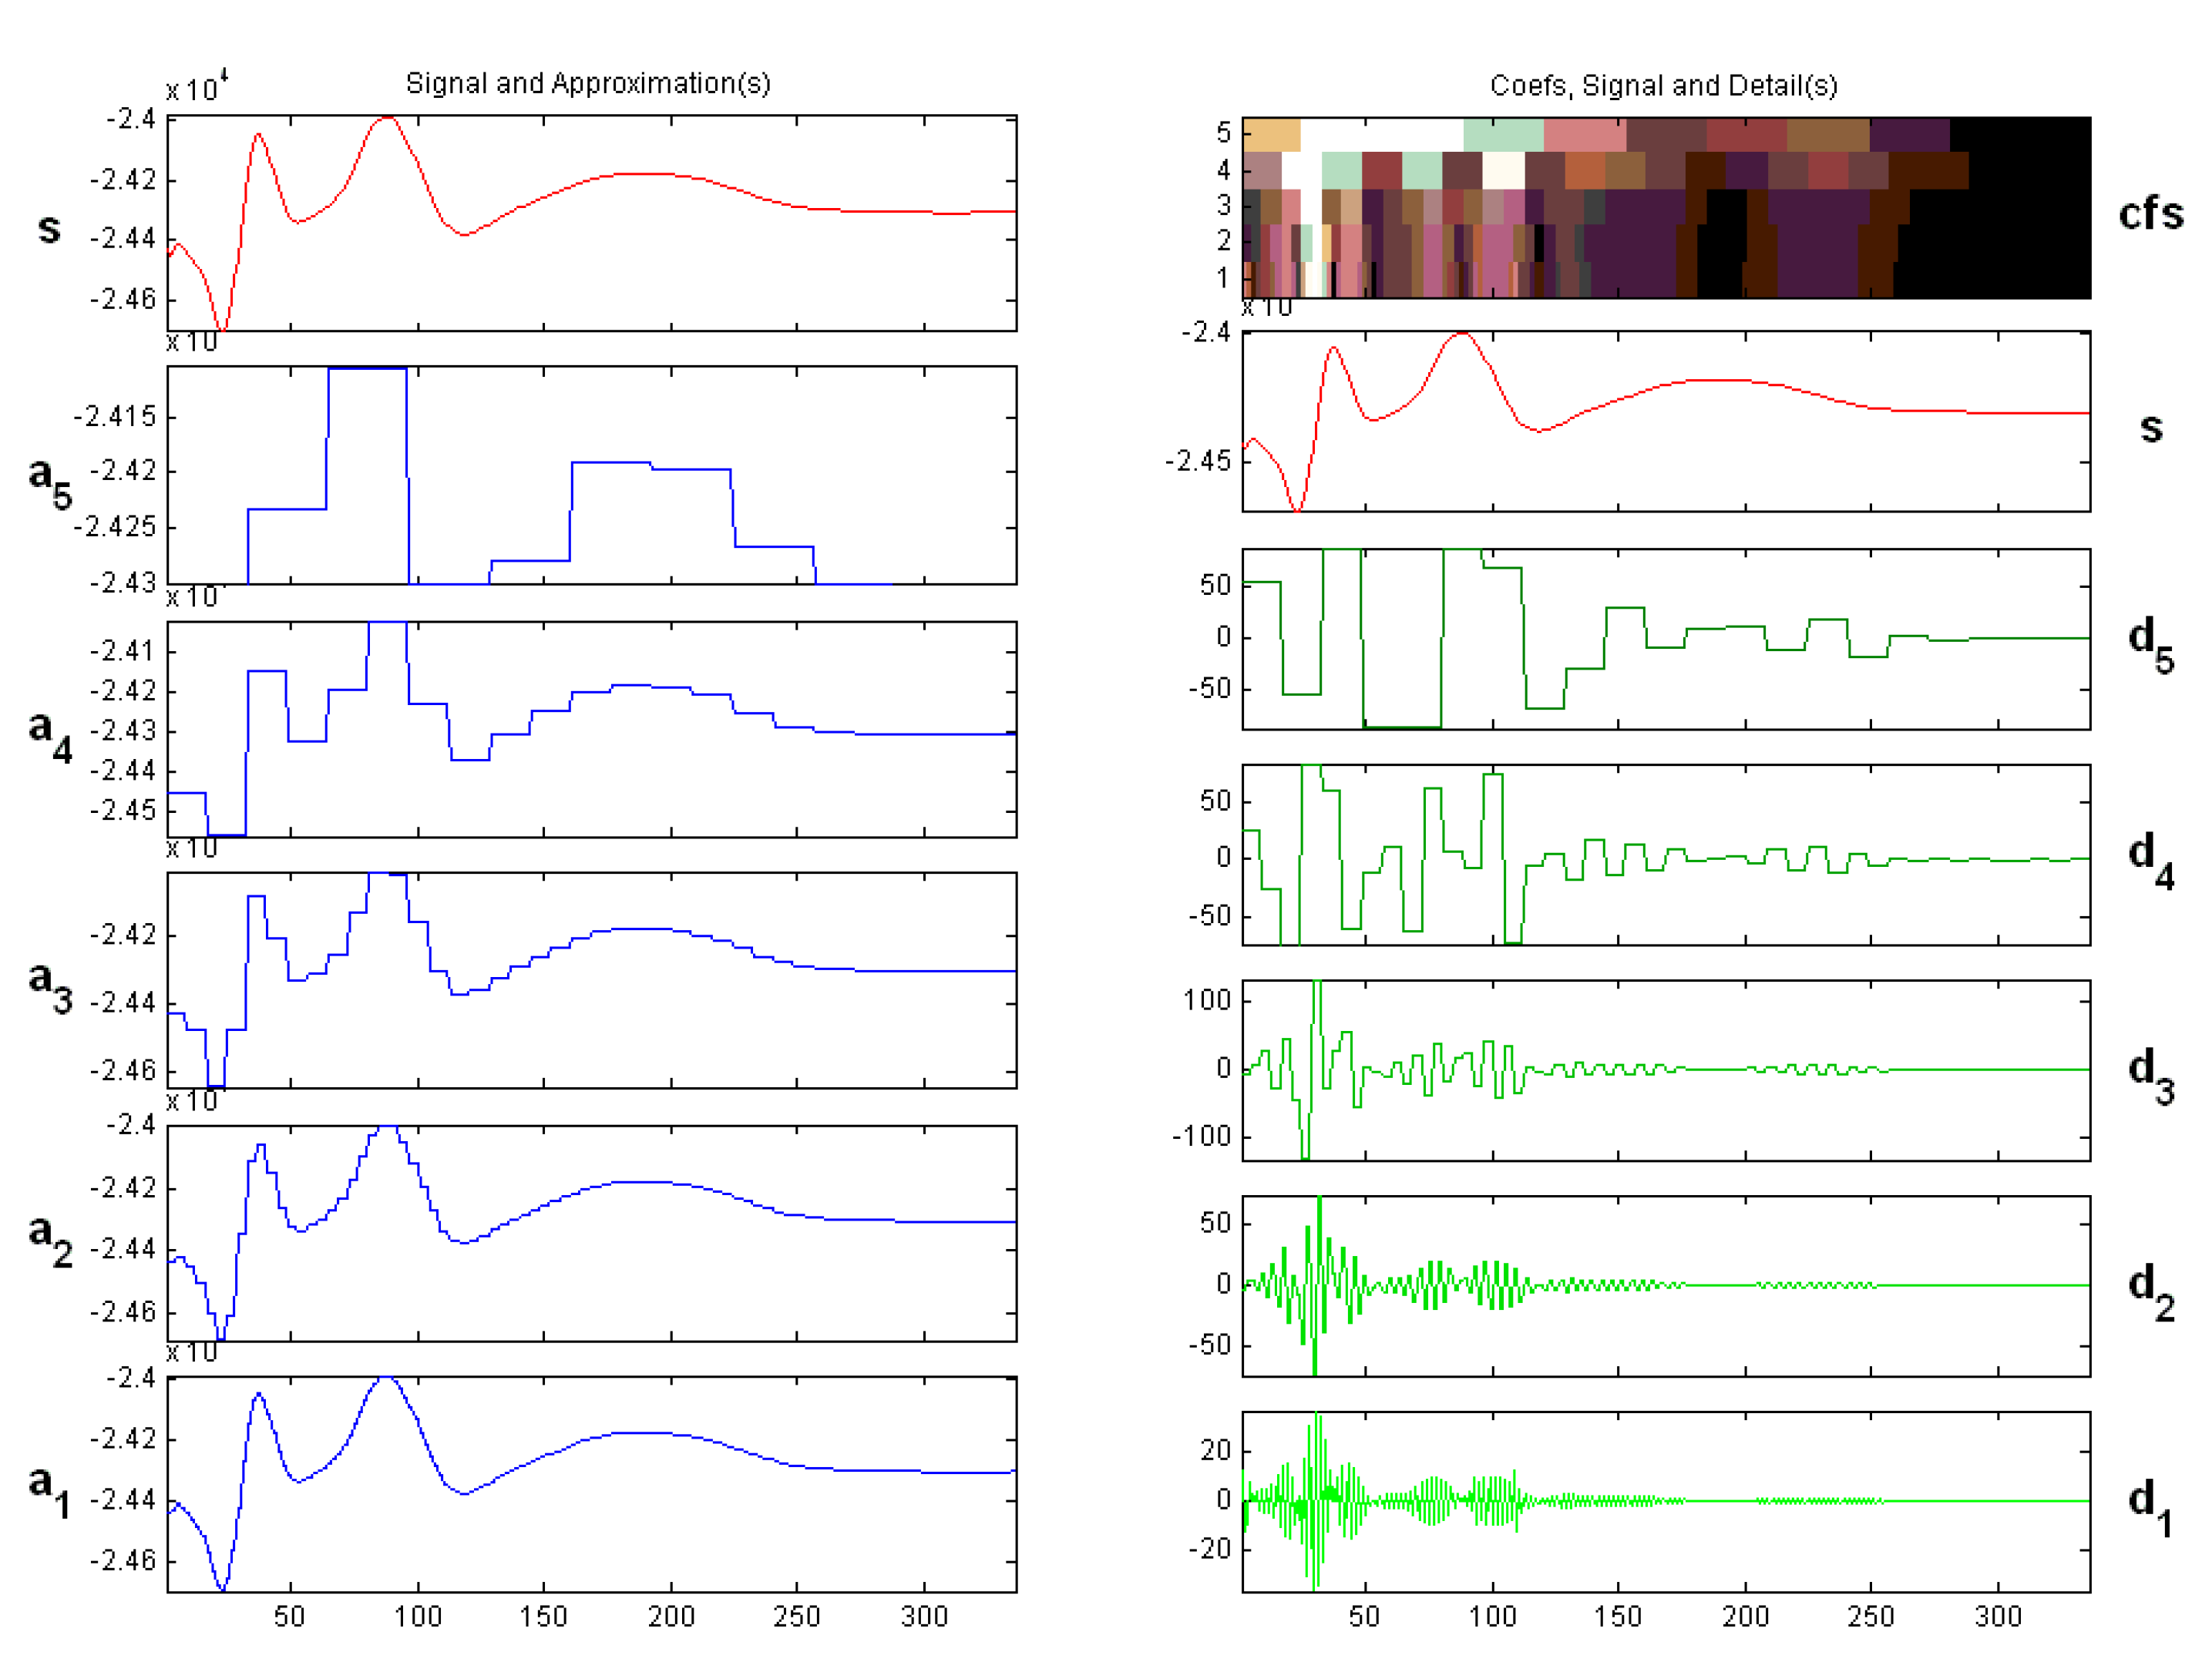
The information obtained from the base clusters at monitoring point 5 is applied to determine the listed monitoring point in the frequency incidence range. A total of 5 monitoring points are used to analyze the object. Figure 14 shows the respective calculation results. The figure indicates that the pressure-pulsation frequency range is mainly between 0 and 100 Hz, and the five base clusters (d1, d2, d3, d4 and d5) all exhibit low-frequency pulsation curves. The main cause of these pulsations is the separation of the flow caused by shock waves during the flow process. After separation occurs, rhomboid-shaped shock waves form in the area near the shock wave wall; however, these waves strongly pulsate. By disrupting the boundary layer and creating a complicated excitation system, large-scale near-wall turbulent vortices are simultaneously generated, and the motion dissipation of these vortices leads to an overall variation in the flow field, which generates flow pulsation. A resonance phenomenon occurs when the pulsation frequency of the print matches the natural frequency of the nozzle. This phenomenon could lead to increasingly complex circumstances or possible structural failure.

3.4. Modal Analysis

When designing a nozzle, a structural analysis is required to ensure that the strength of the product meets the design requirements in response to different loads, such as the chamber pressure. The structure should not break under operational conditions. The nozzle structure may be damaged by strong lateral forces resulting from this separation.
This analysis can be performed in numerous manners. The simplest technique involves mass, inertia, and a torsion spring on the neck as the only characteristics of the nozzle. Relatively complex models, such as the technique examined in this paper, require additional steps. The natural frequencies and mode shapes of the nozzle are first ascertained through a modal analysis. These characteristics are important considerations when designing nozzles for dynamic loading conditions.
The block Lanczos method is introduced in this article to get the natural frequency of the nozzle. This method is applicable to large symmetric eigenvalue problems. The block Lanczos method uses a sparse matrix solver and overrides any solvers specified via the equation solver (EQSLV) command.
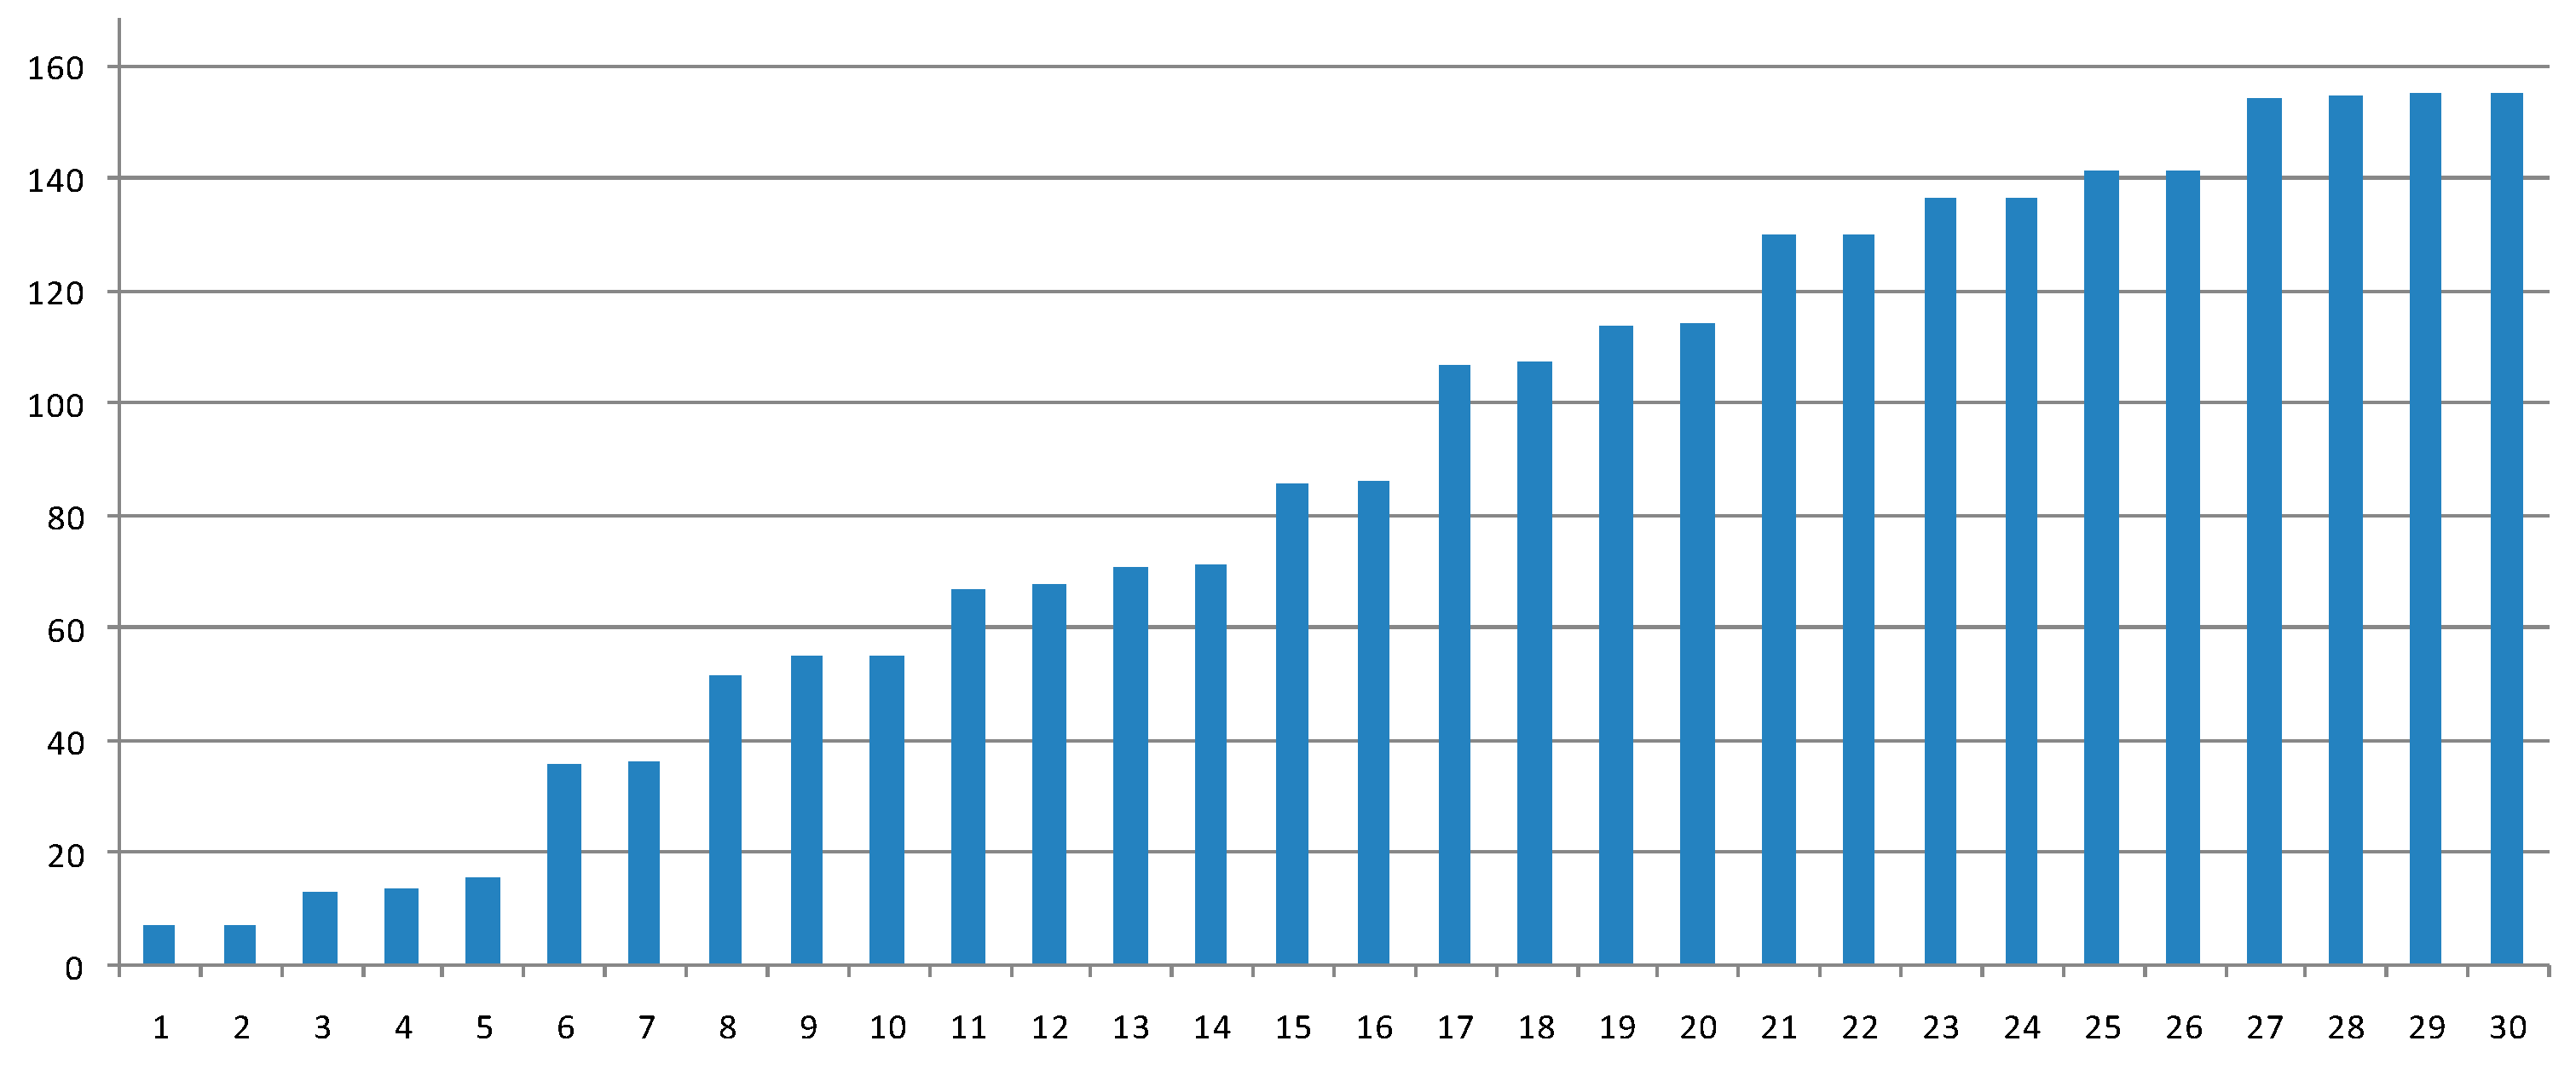
As part of this work, the first 30 natural frequencies of the characteristic modes of the nozzle are determined.
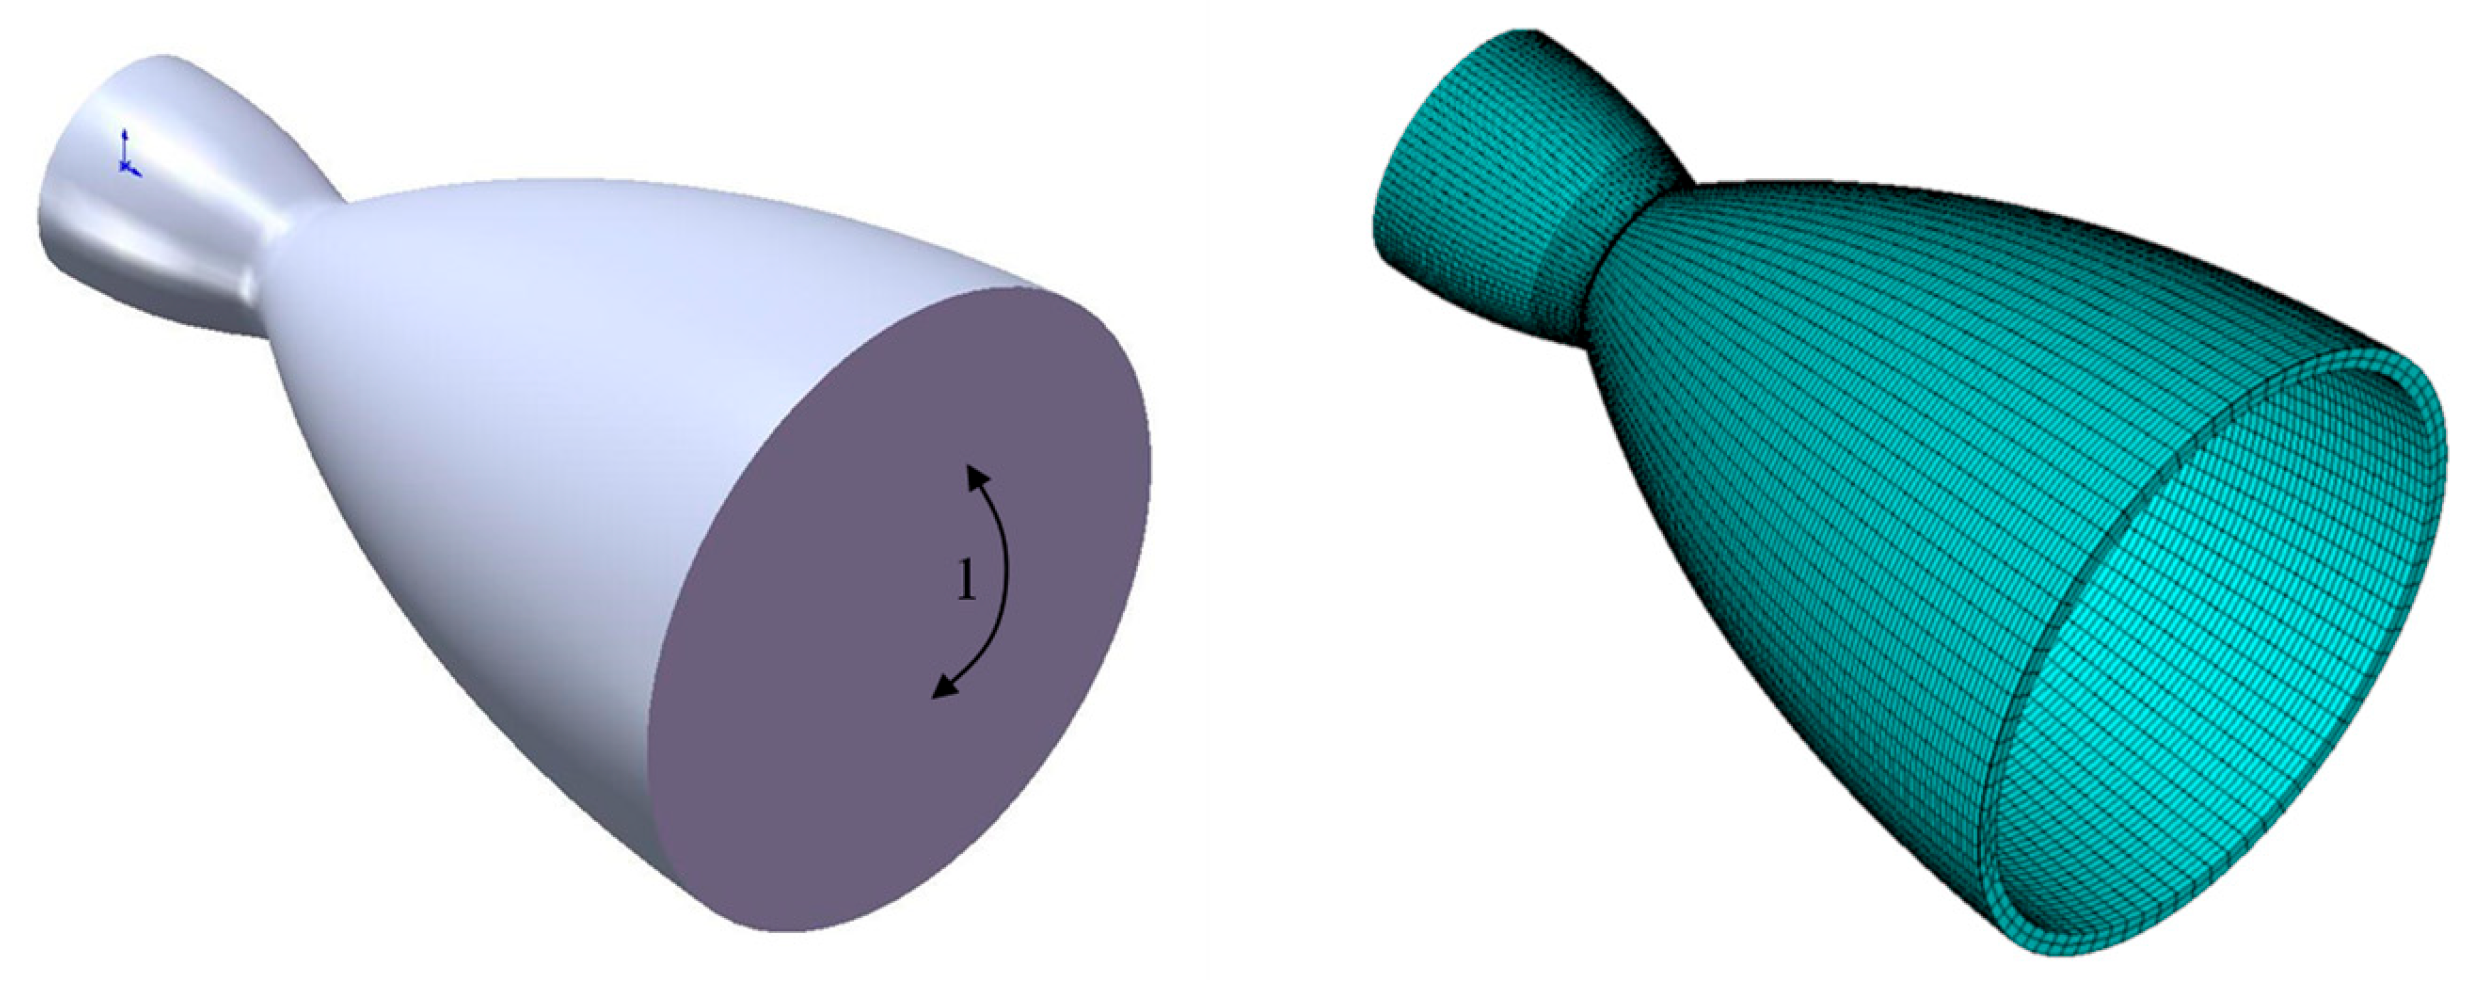
The simulation is carried out using the eigenvalue analysis method. Figure 15 shows the mesh of the nozzle for the modal analysis. According to Figure 16, the first thirty modes are selected. As the figure shows, the nozzle has sixteen modes below 100 Hz in its natural frequency. Specifically, the nozzle can experience flow-related resonance in the pressure-pulsating frequency range. Therefore, further comprehensive considerations for a structural performance analysis under flow separation are required for engine design.
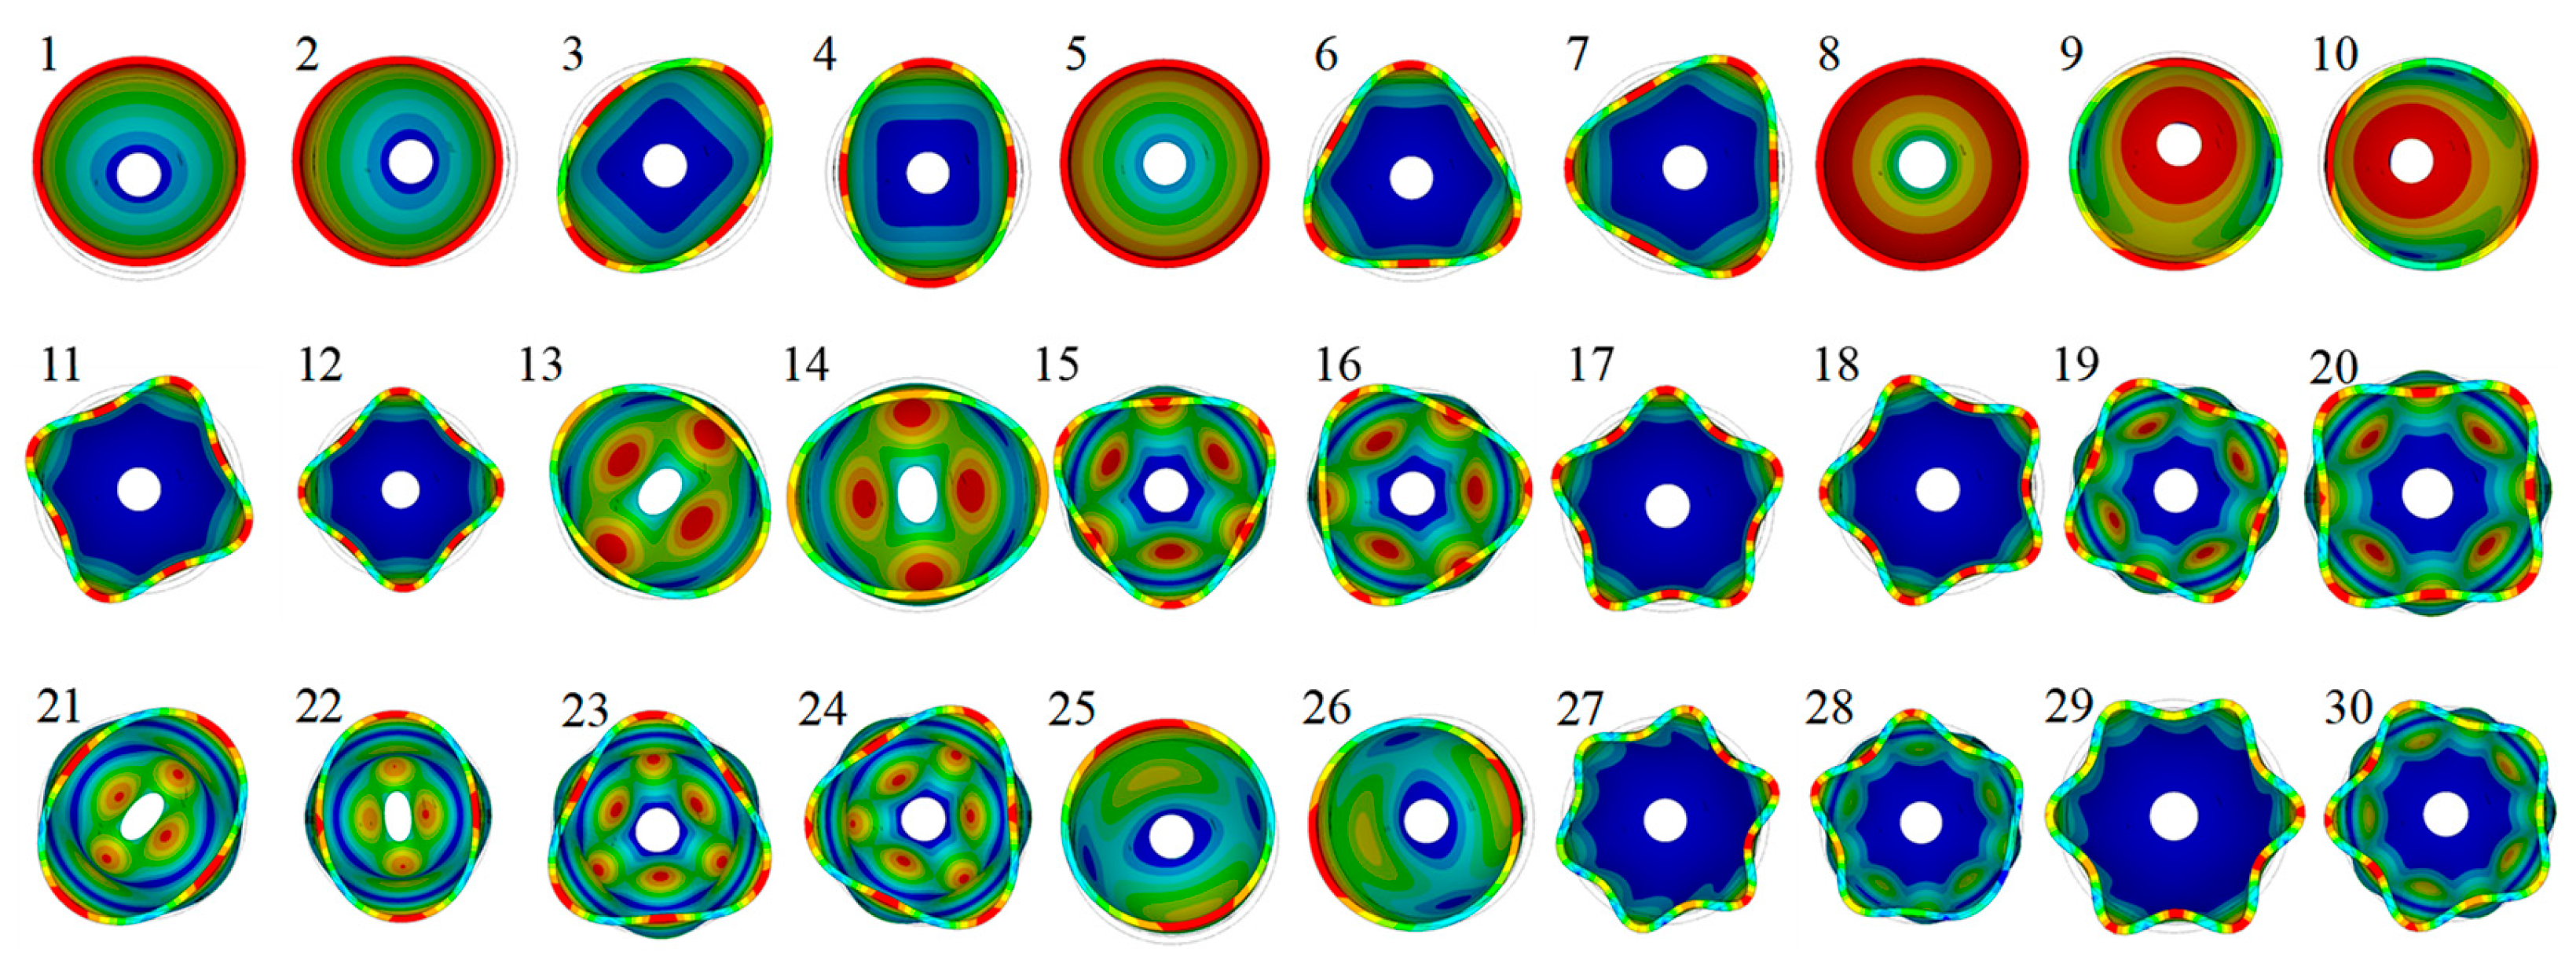
Figure 17 shows the modes of each order in the free mode of the nozzle. The modes of each order under these nozzle conditions are displayed. The analysis of the maximum significance of the static deformation of the nozzle shape can be derived from the figure. This deformation occurs at the trailing edge of the nozzle.

4. Aeroelastic Coupling

4.1. Numerical Methodology (CSD)

When calculating the stress distribution of the nozzle, first, the stress distribution under the action of external forces is determined. Then, the stress distribution is determined by the relationship between the stress and strain. The connection between the external force and strain is established through the virtual working principle. The finite element method (FEM) is used to analyze the structural dynamic response with respect to the load of the flow pressure inside the nozzle. The relevant equation of motion for the solid domain is as follows [11]:
[M]{Ÿ} + [C]{Ý} + [K]{Y} = {F}
where {Y} is the displacement vector, [M] is the mass matrix, [C] is the damping matrix, [K] is the stiffness matrix, and {F} is the force vector due to side-loads.

4.2. Fluid/Structure Coupling

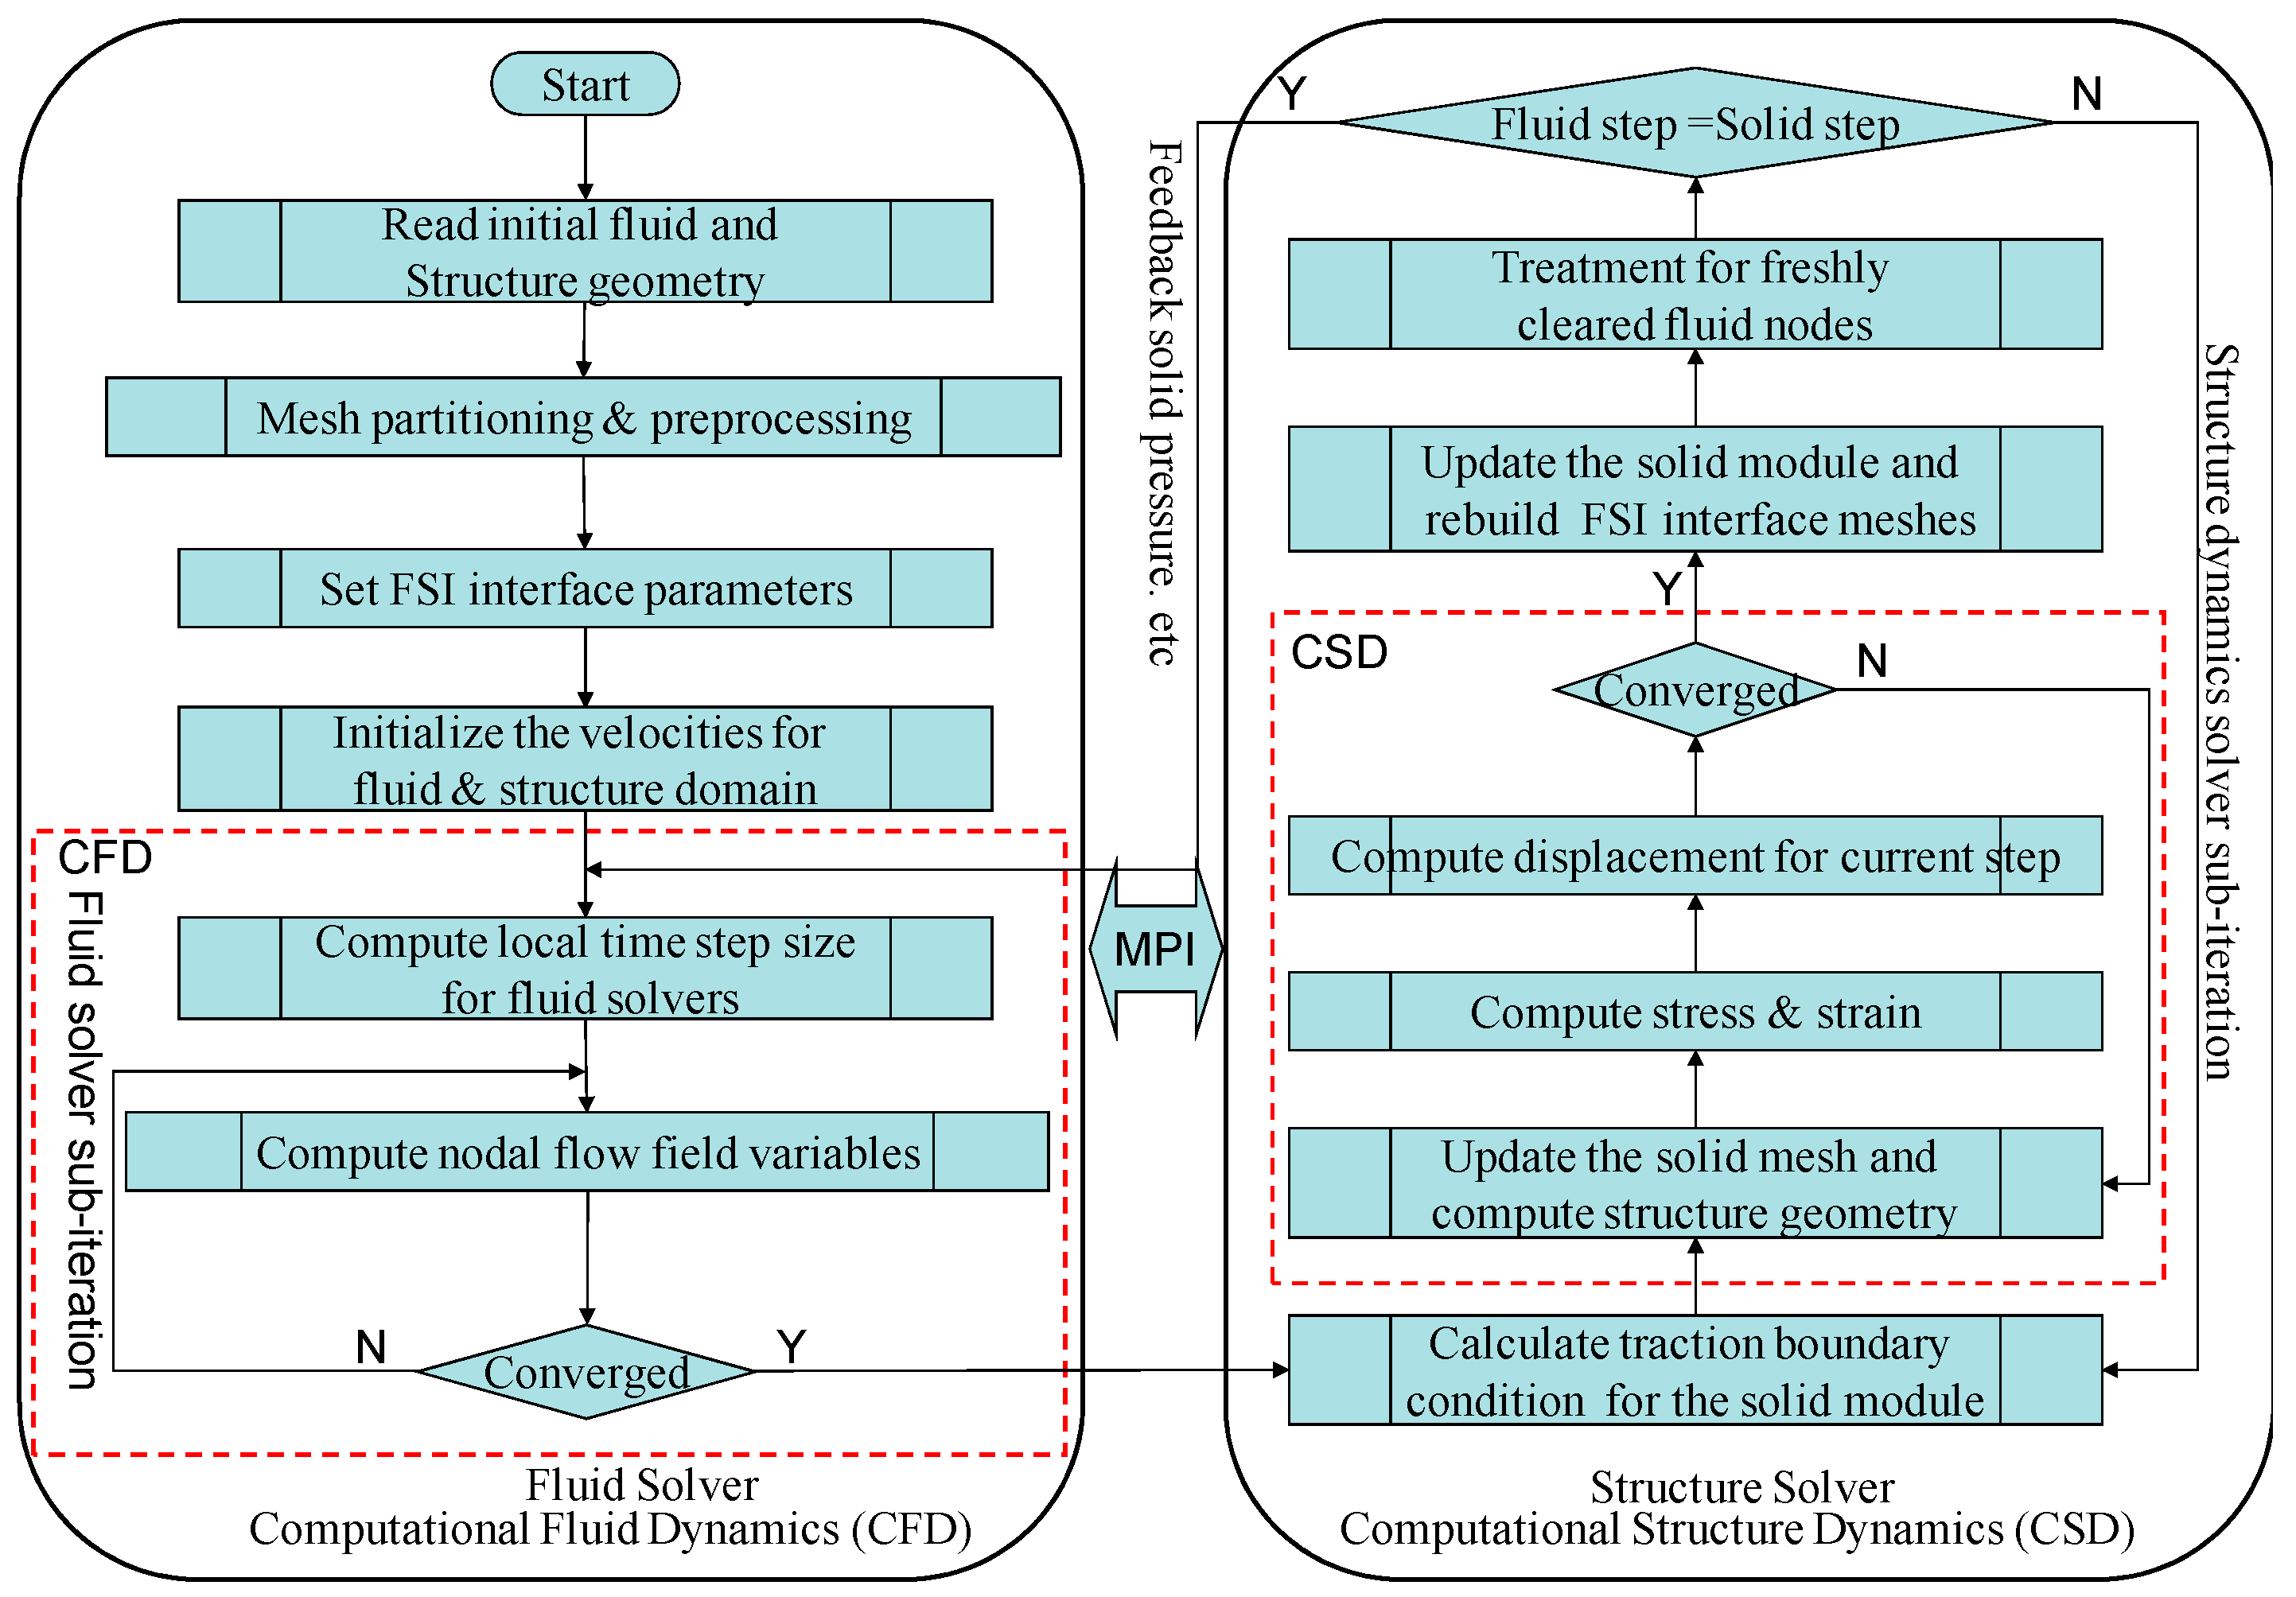
Fluid/structure coupling (FSI) occurs when a fluid flow deforms a structure, which in turn changes the boundary conditions of this flow. The deformation must be transferred to the CFD model, which corresponds to the node displacement quantities, while forces are transferred from the CFD model to the CSD model. The systems under consideration are referred to as coupled systems, which include a fluid analysis and a structural analysis. Figure 18 shows the parameters that were exchanged between CFD and CSD using the MPI method.
Aeroelastic coupling(FSI):
First system: CFD, fluid flow (Navier–Stokes equations)
Second system: CSD, solid mechanics (equilibrium)
Quantities: pressure (1–2), deformation(2–1)
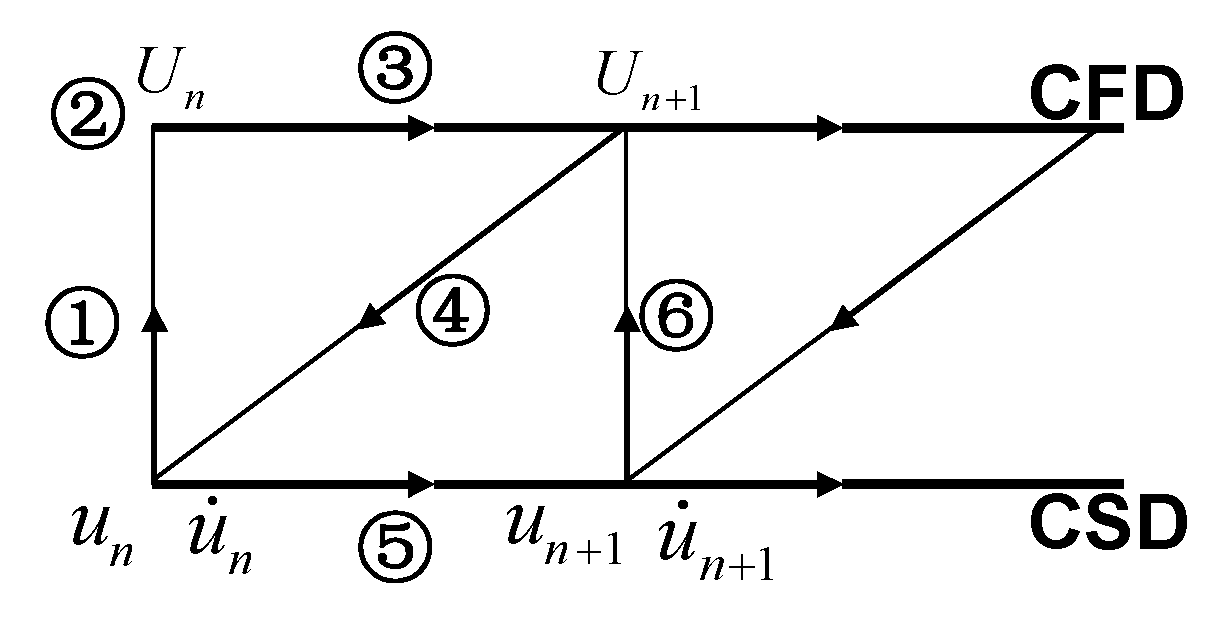
In this work, an alternative approach involving the weak coupling method is used to obtain numerical results of nozzle aeroelasticity. Each calculation area is solved individually, and the variables of the boundaries of the different areas are swapped and inserted into the equations of the other problem. Figure 19 shows the solution mechanism of series loosely coupled algorithm.
(i)
The structural deformation resulting from the transition of the solid domain to the fluid domain is calculated.
(ii)
The fluid domain mesh grid is reconfigured, and the variables of the FSI boundary are updated.
(iii)
The fluid system is updated, and the flow field is simulated.
(iv)
The new fluid pressure of the FSI boundary (and stress field) is updated into a structural load.
(v)
the structural system under the given pressure loads is advanced.
In this algorithm, CFD and CSD are performed simultaneously. For simplicity, one can imagine the basic algorithm as if there is no competition between the codes. Specifically, at any given time, only model is running. This separation can be controlled via the message passing interface (MPI). A schematic diagram is shown in Figure 20.
The geometry for the aeroelastic computations is constructed and appropriate boundary conditions and initial conditions are set. First, the flow field results are obtained, followed by the pressure distribution of the wall. The structure simulation analysis of the nozzle is carried out with pressure serving as the load. After the simulation, the structural deformation is obtained. The mesh grid is reconfigured, and the CFD process is repeated. This process is iterated until the calculation is complete. The CFD process is three dimensional with the SA turbulence model.

4.3. Result Disscuss

The VOLVO S1 nozzle is again used for a fluid structure interaction analysis. The structural physical parameters for the nozzle walls are listed in Table 4.
Figure 21 shows the calculated results for VOLVO S1 with PR = 30 for uniform materials during different periods. The simulation shows that the movement of the nozzle during the simulation time is approximately 1 × 10⁻⁶ m, which is very small. This small movement arises because the combustion pressure is low (3 MPa), the thickness of the nozzle is large, and the simulation time is short (2 × 10⁻⁴ s).
From the velocity contour, we can observe that the shock formed moves quickly through the stagnant low-pressure medium. In addition, a secondary shock wave traveling to the left is created, which is carried to the right due to the supersonic carrier flow. This shock wave combines the high Mach number, low pressure flow, lower velocity, and high-pressure gas behind the primary shock. Moreover, the maximum radial displacements at different times are not at the end of the shell. As the pressure inside the nozzle increases, the deformation of different parts of the nozzle will change. The cloud image shows that the convergence section of the nozzle exhibits a large deformation due to its high pressure.
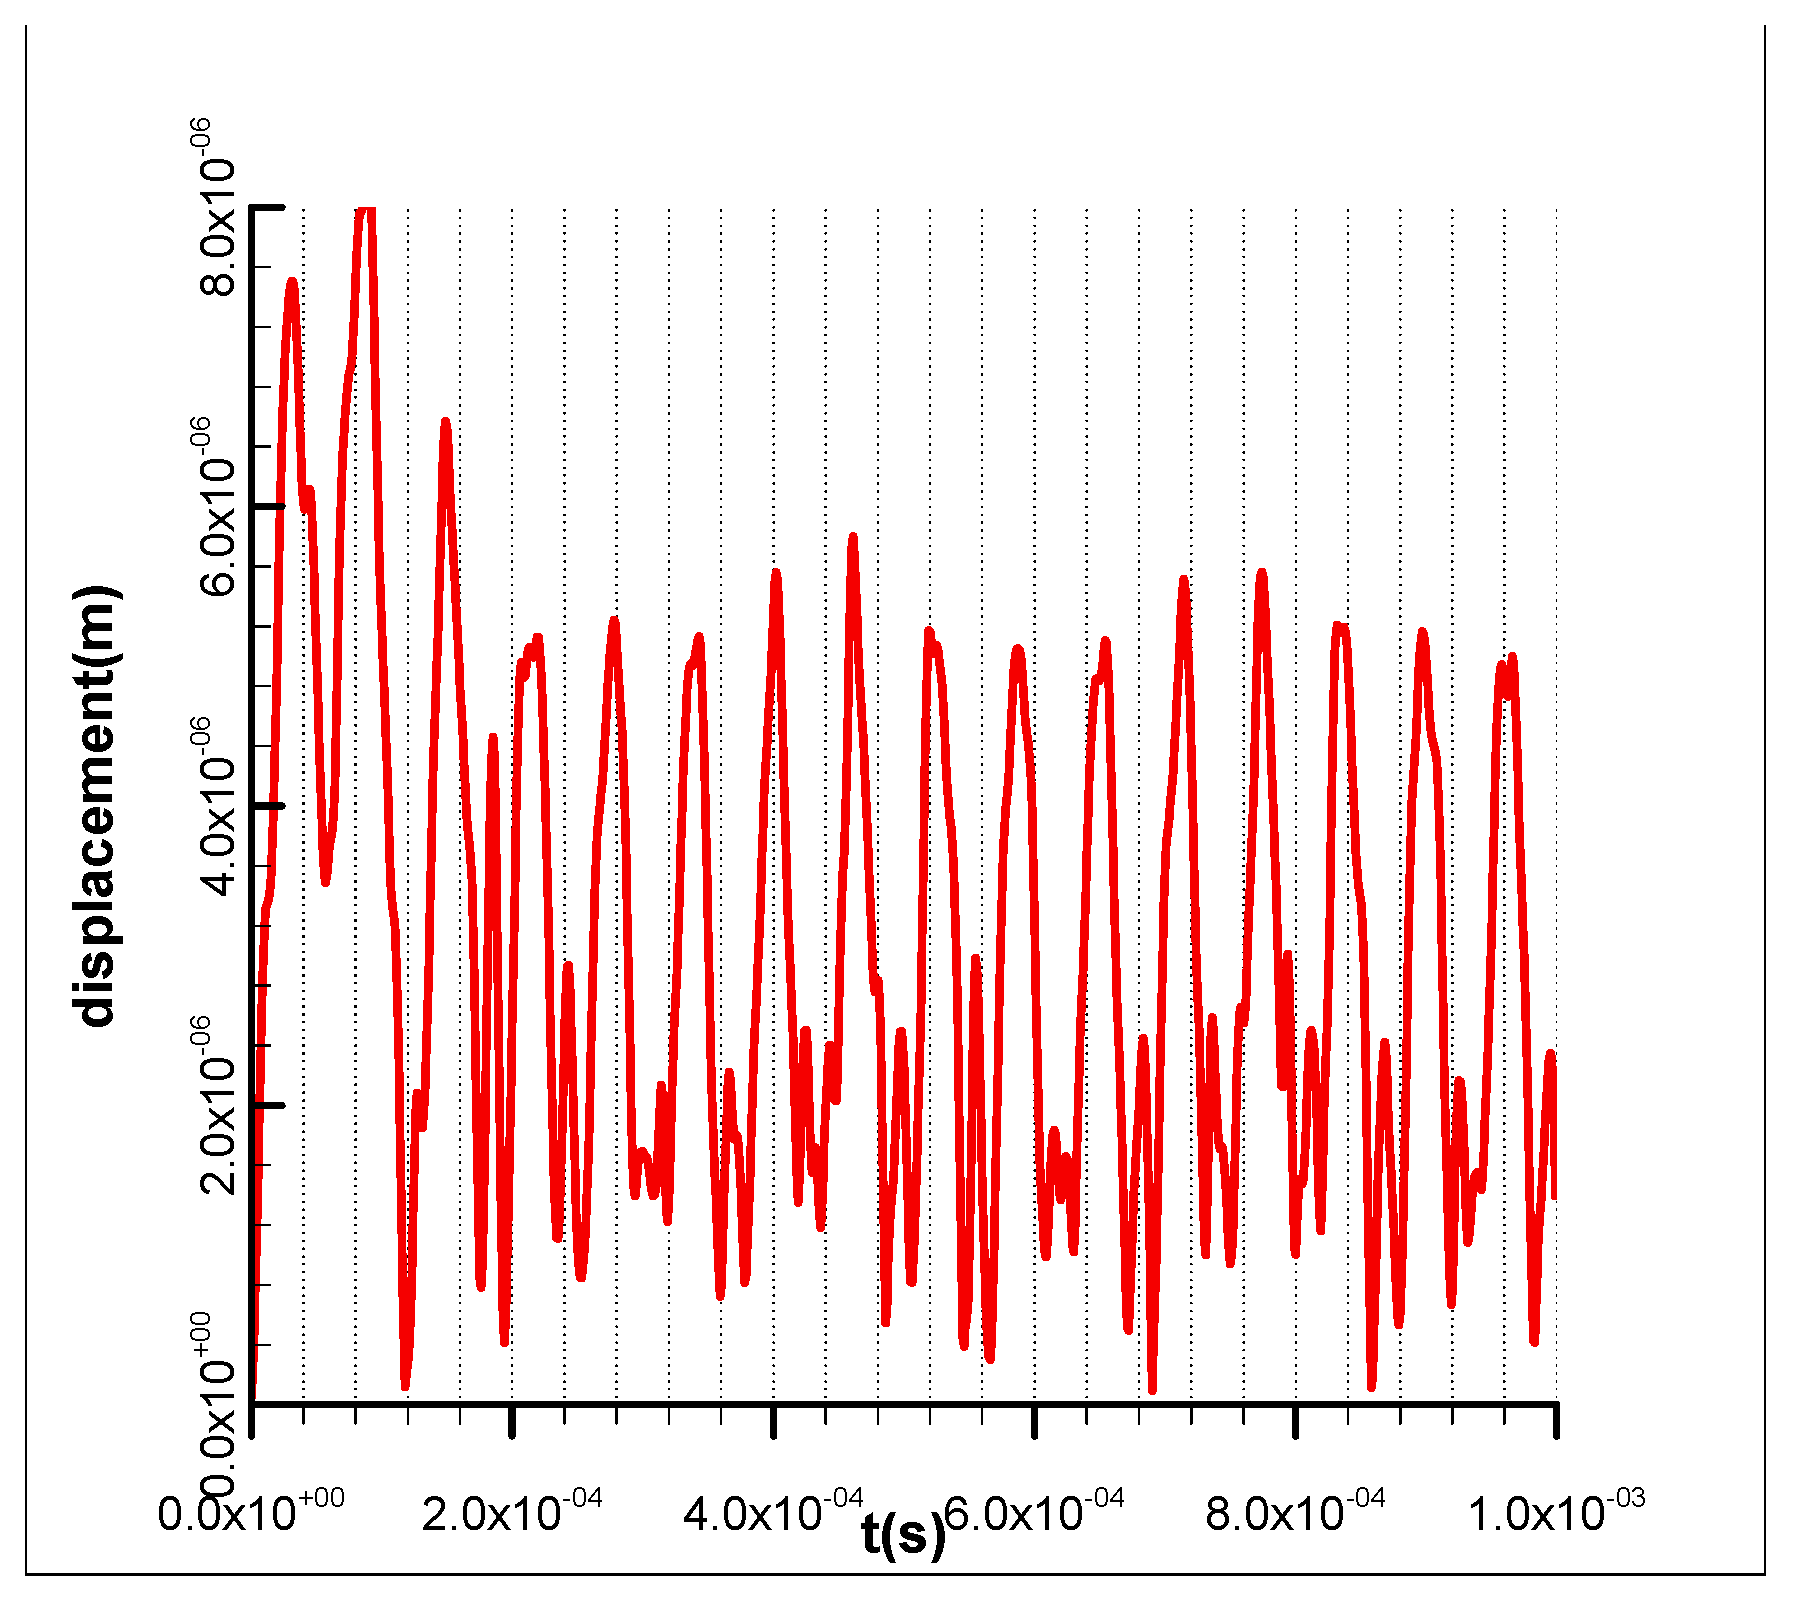
Figure 22 shows the time course of the radial displacement at the end of the nozzle. The figure shows that the displacement at the end of the nozzle is the largest at the initial stage, and with the formation of the flow field inside the nozzle, the displacement at the end gradually degenerates into oscillatory deformation. However, from the amplitude shown in Figure 21, the displacements during the simulated time are all negative, the simulation time is short, and no periodic changes are formed during the simulated period. As shown in Figure 21, the displacement oscillation at the endpoint is not periodic because under a combustion chamber pressure of 3 MPa, the separation state in the nozzle is limited by a shock wave, and the airflow in the separation state first sticks to the wall and then separates and reattaches until the air flows from the nozzle. The pressure in the fastening area changes, which leads to the generation of complex forces on the wall and ultimately results in structural vibrations.
The results show that different structural deformations occur in distinct parts of the nozzle as the internal pressure increases. In the nozzle expansion section, the pressure is greater, the deformation is greater, and the deformation of the end part of the nozzle expansion section is not strictly periodic with time. This result arises mainly because the pressure on the wall fluctuates under restricted separation. This paper provides a basis for further detailed analyses of lateral loads. The flow inside the nozzle is complicated, and the lateral load generated under separation conditions is usually asymmetric. Therefore, a three-dimensional analysis is needed to reveal the structural response under these separation conditions in detail.

5. Conclusions

A numerical investigation of the flow separation was carried out on a thrust-optimized contour nozzle (VOLVO S1). Various turbulence models were used to predict this complex flow regime. In this paper, insights into the mechanisms by which the structure of a separation flow nozzle could withstand complex drop-loading processes were reported. First, the flow separation patterns of FSS and RSS were discussed in detail. A wavelet was used to analyze the amplitude under various pressure fluctuations. Based on a clear understanding of the flow field, an aeroelastic coupling method was carried out with loosely coupled CFD/CSD. Some insights into the aeroelasticity of the nozzle under separated flow conditions were obtained. The simulation results showed the significant impact of the inherent pressure-pulsation on the structural response due to flow separation.

Author Contributions

Conceptualization, H.H. and X.G.; methodology, Y.G. and J.Y.; software, H.H.; validation, X.G.; formal analysis, H.H.; investigation, H.H.; resources, Y.G. and J.Y.; data curation, H.H. and X.G.; writing—original draft preparation, H.H.,Y.G. and J.Y; writing—review and editing, H.H. and X.G.; visualization, X.G.; supervision, Y.G. and J.Y.; and project administration, Y.G. All authors have read and agreed to the published version of the manuscript.

Funding

This research received no external funding.

Data Availability Statement

The data that support the findings of this study are available from the corresponding author upon reasonable request.

Acknowledgments

I would like to express my deep gratitude to all those who have offered me a lot of help and support in the process of this paper. We thank Bao for the helpful discussion on FSI.

Conflicts of Interest

The authors have no conflicts to disclose.

References

  1. Cowles, F.B.; Foster, C.R. Experimental Study of Gas-Flow Separation in Overexpanded Exhaust Nozzles for Rocket Motors; No. JPL-PR-4-103; Jet Propulsion Laboratory: Pasadena, CA, USA, 1949. [Google Scholar]
  2. Keanini, R.G.; Brown, A.M. Scale analysis and experimental observations of shock-induced turbulent boundary layer separation in nozzles. Eur. J. Mech. B Fluids 2007, 26, 494–510. [Google Scholar] [CrossRef]
  3. Nave, L.H.; Coffey, G.A. Sea Levels Side Loads in High Area-Ratio Rocket Engines. In Proceedings of the 9th Propulsion Conference, Las Vegas, NV, USA, 5–7 November; American Institute of Aeronautics and Astronautics: Reston, VA, USA, 1973. AIAA Paper 1973-1284. [Google Scholar]
  4. Frey, M.; Hagemann, G. Status of flow separation prediction in rocket nozzles. In Proceedings of the 34th AIAA/ASME/SAE/ASEE Joint Propulsion Conference & Exhibit, Cleveland, OH, USA, 13–15 July 1998. [Google Scholar] [CrossRef]
  5. Stark, R. Flow separation in rocket nozzles, a simple criteria. In Proceedings of the 41st AIAA/ASME/SAE/ASEE Joint Propulsion Conference & Exhibit, Tucson, AZ, USA, 10–13 July 2005. AIAA Paper 2005-3940. [Google Scholar] [CrossRef]
  6. Östlund, J. Flow Processes in Rocket Engine Nozzles with Focus on Flow Separation and Side-Loads; TRITA-MEK Technical Report 2002:09; Royal Institute of Technology Department of Mechanics S-100 44: Stockholm, Sweden, 2002; ISSN 0348-467X. ISRN KTH/MEK/TR–02/09-SE. [Google Scholar]
  7. Takahashi, M.; Ueda, S.; Tomita, T.; Takahashi, M.; Tamura, H.; Aoki, K. Transient flow simulation of a compressed truncated perfect nozzle. In Proceedings of the 37th AIAA/ASME/SAE/ASEE Joint Propulsion Conference, Salt Lake City, UT, USA, 8–11 July 2001. [Google Scholar]
  8. Verma, S.B.; Haidn, O. Unsteady Side-Load Evolution in a Liquid Rocket Engine Nozzle. J. Spacecr. Rocket. 2020, 57, 391–397. [Google Scholar] [CrossRef]
  9. Perigo, D.; Schwane, R.; Wong, H. A numerical comparison of the flow in conventional and dual-bell nozzles in the presence of an unsteady external pressure environment. In Proceedings of the 39th AIAA/ASME/SAE/ASEE Joint Propulsion Conference and Exhibit, 20–23 July 2003; American Institute of Aeronautics and Astronautics: Reston, VA, USA, 2003. AIAA Paper 2003-4771. [Google Scholar]
  10. Wang, T.-S. Transient Three-Dimensional Analysis of Side Load in Liquid Rocket Engine Nozzles. In Proceedings of the 40th AIAA/ASME/SAE/ASEE Joint Propulsion Conference and Exhibit, Fort Lauderdale, FL, USA, 11–14 July 2004; American Institute of Aeronautics and Astronautics: Reston, VA, USA, 2004. AIAA Paper 2004-3681. [Google Scholar]
  11. Wang, T.-S. Transient Three-Dimensional Analysis of Nozzle Side Load in Regeneratively Cooled Engines. In Proceedings of the 41st AIAA/ASME/SAE/ASEE Joint Propulsion Conference & Exhibit, Tucson, AZ, USA, 10–13 July 2005; American Institute of Aeronautics and Astronautics: Reston, VA, USA, 2005. AIAA Paper 2005-3942. [Google Scholar]
  12. Verma, S.B.; Stark, R.; Haidn, O. Relation between shock unsteadiness and the origin of side-loads inside a thrust optimized parabolic rocket nozzle. Aerosp. Sci. Technol. 2006, 10, 474–483. [Google Scholar] [CrossRef]
  13. Zebiri, B.; Piquet, A.; Hadjadj, A. Analysis of shock-wave unsteadiness in conical supersonic nozzles. Aerosp. Sci. Technol. 2020, 105, 106060. [Google Scholar] [CrossRef]
  14. Khan, M.S.; Minhaj, S.A. Numerical Analysis of de Laval Nozzle Under Surrounding Zone and Compressed Flow. Int. J. Res. Appl. Sci. Eng. Technol. 2021, 9, 98–105. [Google Scholar] [CrossRef]
  15. Martelli, E.; Nasuti, F.; Onofri, M. Numerical calculation of FSS/RSS transition in highly overexpanded rocket nozzle flows. Shock Waves 2010, 20, 139–146. [Google Scholar] [CrossRef]
  16. Hadjadj, A.; Onofri, M. Nozzle flow separation. Shock Waves 2009, 19, 163–169. [Google Scholar] [CrossRef]
  17. Lijo, V.; Kim, H.D.; Setoguchi, T.; Matsuo, S. Numerical simulation of transient flows in a rocket propulsion nozzle. Int. J. Heat Fluid Flow 2010, 31, 409–417. [Google Scholar] [CrossRef]
  18. Bekka, N.; Sellam, M.; Chpoun, A. Aeroelastic Stability Analysis of Flexible Overexpanded Rocket Nozzle. Shock Waves 2016, 26, 513–527. [Google Scholar] [CrossRef]
  19. Garelli, L.; Paz, R.R.; Storti, M.A. Fluid–structureinteractionstudyofthestart-upofarocketenginenozzle. Comput. Fluids 2010, 39, 1208–1218. [Google Scholar] [CrossRef]
  20. Ansys Fluent Theory Guide. Available online: https://www.ansys.com/ (accessed on 16 January 2024).
Figure 1. Sketch of the FSS/RSS flow separation patterns.
Aerospace 11 00818 g001
Figure 2. Fluid computational domain with boundary conditions.
Aerospace 11 00818 g002
Figure 3. Distributions of the pressure for different turbulence models.
Aerospace 11 00818 g003
Figure 4. The contours of the velocity for different turbulence models.
Aerospace 11 00818 g004
Figure 5. The nozzle wall pressure left the NPR =14 and right NPR = 16.
Aerospace 11 00818 g005
Figure 6. Mach number contours of the FSS and RSS for VOLVO S1 nozzle (up NPR = 16, RSS; down NPR = 14, FSS).
Aerospace 11 00818 g006
Figure 7. Calculated different velocity contours in the VOLVO S1 nozzle at different pressure ratios.
Aerospace 11 00818 g007
Figure 8. The sketch of the FSS model inside the nozzle.
Aerospace 11 00818 g008
Figure 9. Wall pressures during the different NPR of the FSS model.
Aerospace 11 00818 g009
Figure 10. VOLVO S1 Mach number contour lines during the different NPR when the RSS model.
Aerospace 11 00818 g010
Figure 11. Wall pressures during the different NPR of the RSS model.
Aerospace 11 00818 g011
Figure 12. Lateral side-load force and pressure ratio NPR curve.
Aerospace 11 00818 g012
Figure 13. The pressure variation curve over time at each monitoring point in the nozzle.
Aerospace 11 00818 g013
Figure 14. Schematic diagram showing the monitoring point data’s wavelet analysis results.
Aerospace 11 00818 g014
Figure 15. The grid of the nozzle.
Aerospace 11 00818 g015
Figure 16. The frequency of the different model.
Aerospace 11 00818 g016
Figure 17. Thirty modes shapes of the nozzle deformed model.
Aerospace 11 00818 g017
Figure 18. The parameters were exchanged between two codes(CFD and CSD).
Aerospace 11 00818 g018
Figure 19. Initial exchange and resulting coupling algorithms for two codes with “exchange before solution”.
Aerospace 11 00818 g019
Figure 20. The flow chart of the loosed-coupled analysis.
Aerospace 11 00818 g020
Figure 21. The deform of the nozzle during the different times.
Aerospace 11 00818 g021
Figure 22. Point at the end of the deformation in the radial direction vs. time.
Aerospace 11 00818 g022
Table 1. The turbulence models description.
ModelDescription
Spalart–
Allmaras
A single transport equation model that directly solves for modified turbulent viscosity. This device has been designed specifically for aerospace applications involving wall-bounded flows on a fine near-wall mesh. SA is a low-cost RANS model that is mainly intended for aerodynamic applications with mild separation, such as supersonic/transonic flows over airfoils and boundary-layer flows.
Standard k–εThe baseline two-transport-equation model for solving k and ε. This model is the default k–ε model. Coefficients are empirically derived and are valid for fully turbulent flows. This model can account for viscous heating, buoyancy, and compressibility, which can be calculated with other k–ε models.
RNG k–εA variant of the standard k–ε model. The equations and coefficients are analytically derived. Significant changes in the ε equation improve the ability to model highly strained flows. Additional options aid in predicting swirling and low Reynolds number flows.
Realizable k–εA variant of the standard k–ε model. The realizability of this model stems from changes that allow for the application of certain mathematical constraints, which ultimately improves the performance of this model.
Standard k–ωA two-transport-equation model for solving for k and ω. The specific dissipation rate (ε/k) is based on Wilcox (1998), and it is the default k–ω model. This model performs very well for wall-bounded and low-Reynolds-number flows. This approach has potential for use in predicting transitions. This model accounts for transitional, free shear, and compressible flows.
SST k–ωa variant of the standard k–ω model. The original Wilcox model for use near walls and the standard k–ε model for use away from walls are combined using a blending function. Additionally, the turbulent viscosity is limited to guarantee that τT~k. The transition and shearing options are borrowed from standard k–ω. Compressibility is not included in this model.
Reynolds StressThe Reynolds stresses are directly solved using transport equations, avoiding the isotropic viscosity assumption of other models. This model can be used for highly swirling flows. The quadratic pressure–strain model improves the performance for many basic shear flows.
Table 2. The mesh grid distributions of VOLVO S1 nozzle.
NPRCasex/mmy/mmTotal Nodes
14A2009050,538
B30015054,818
16A27012052,680
B37018067,658
Table 3. Positions of the monitoring points in the nozzle.
Location
Nodes 123456789
X (mm)210250280320360400420440460
Y (mm)88105116128137144146148150
Z (mm)000000000
Table 4. Structure physical parameter for nozzle walls.
Young’s Modulus (N m−2)Poisson’s RatioMass Density (kg m−3)Thickness (mm)
7 × 10100.34289011.5
Disclaimer/Publisher’s Note: The statements, opinions and data contained in all publications are solely those of the individual author(s) and contributor(s) and not of MDPI and/or the editor(s). MDPI and/or the editor(s) disclaim responsibility for any injury to people or property resulting from any ideas, methods, instructions or products referred to in the content.