4.1. Mesh and Boundary
The study concerns a physically simplified model of the typical conical missile “Fattah” [
3].
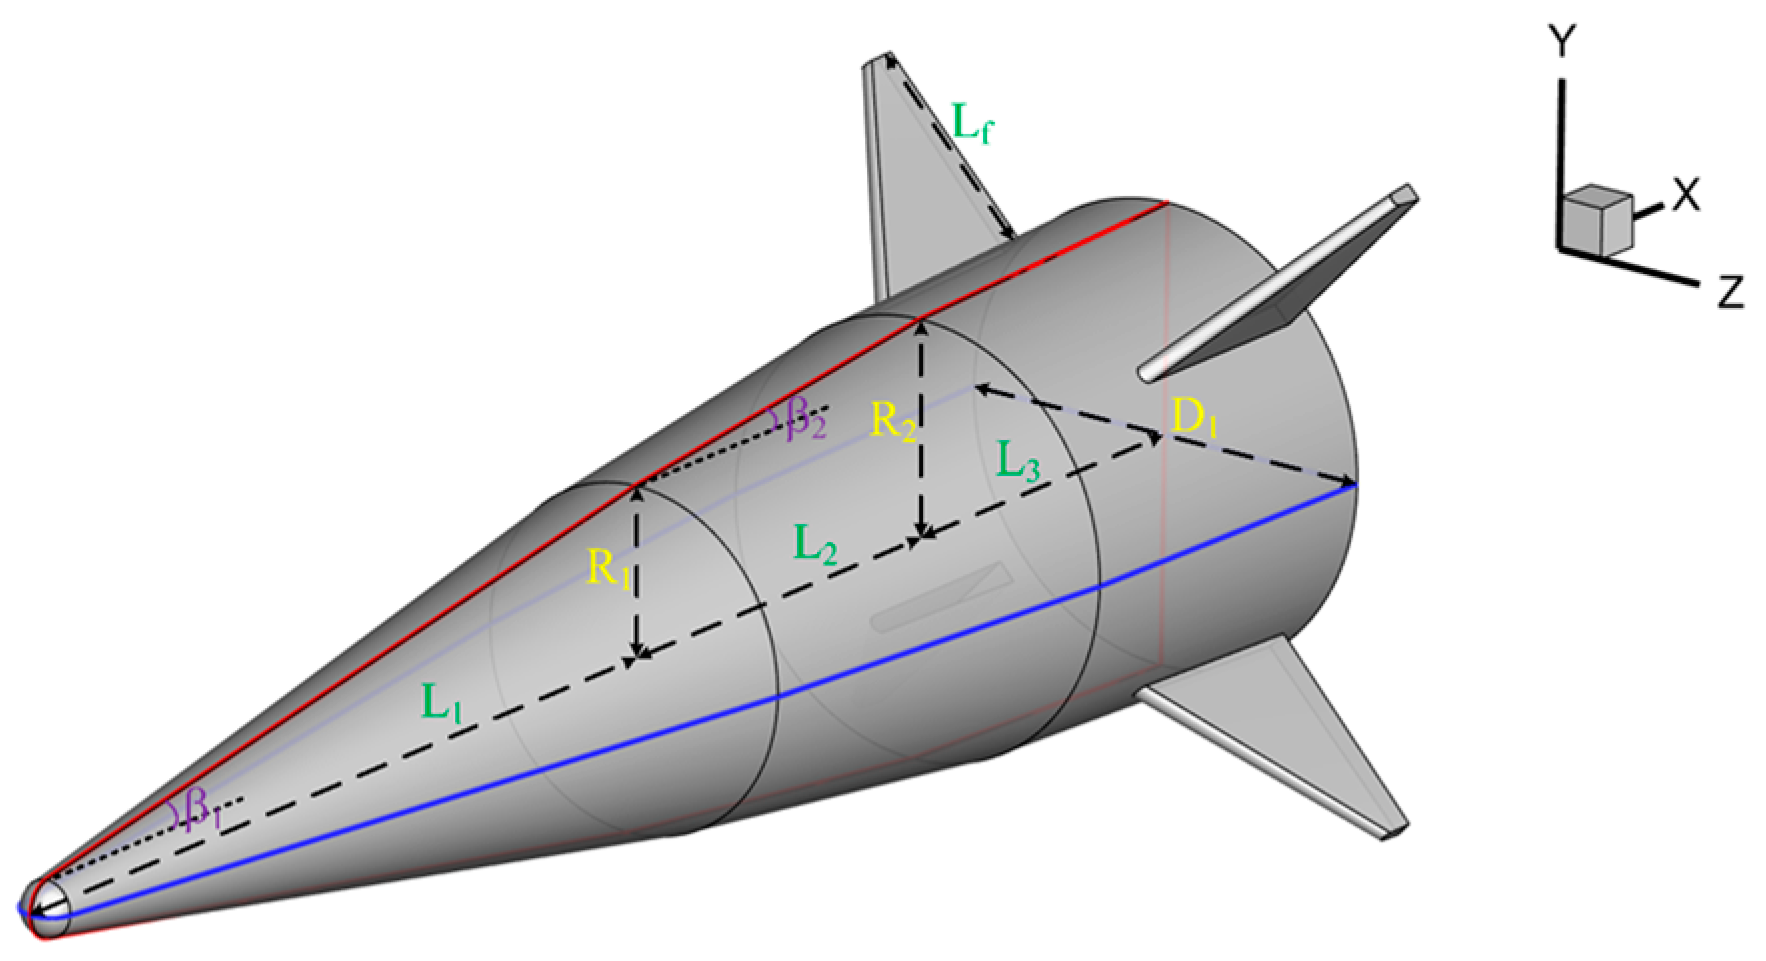
Figure 9. depicts the geometric structure of the simplified missile model, with specific dimensional parameters detailed in
Table 1. This research aims to explore intrinsic radiation and flow field radiation of hypersonic vehicles, excluding the propulsion solid rocket motor from all physical models.
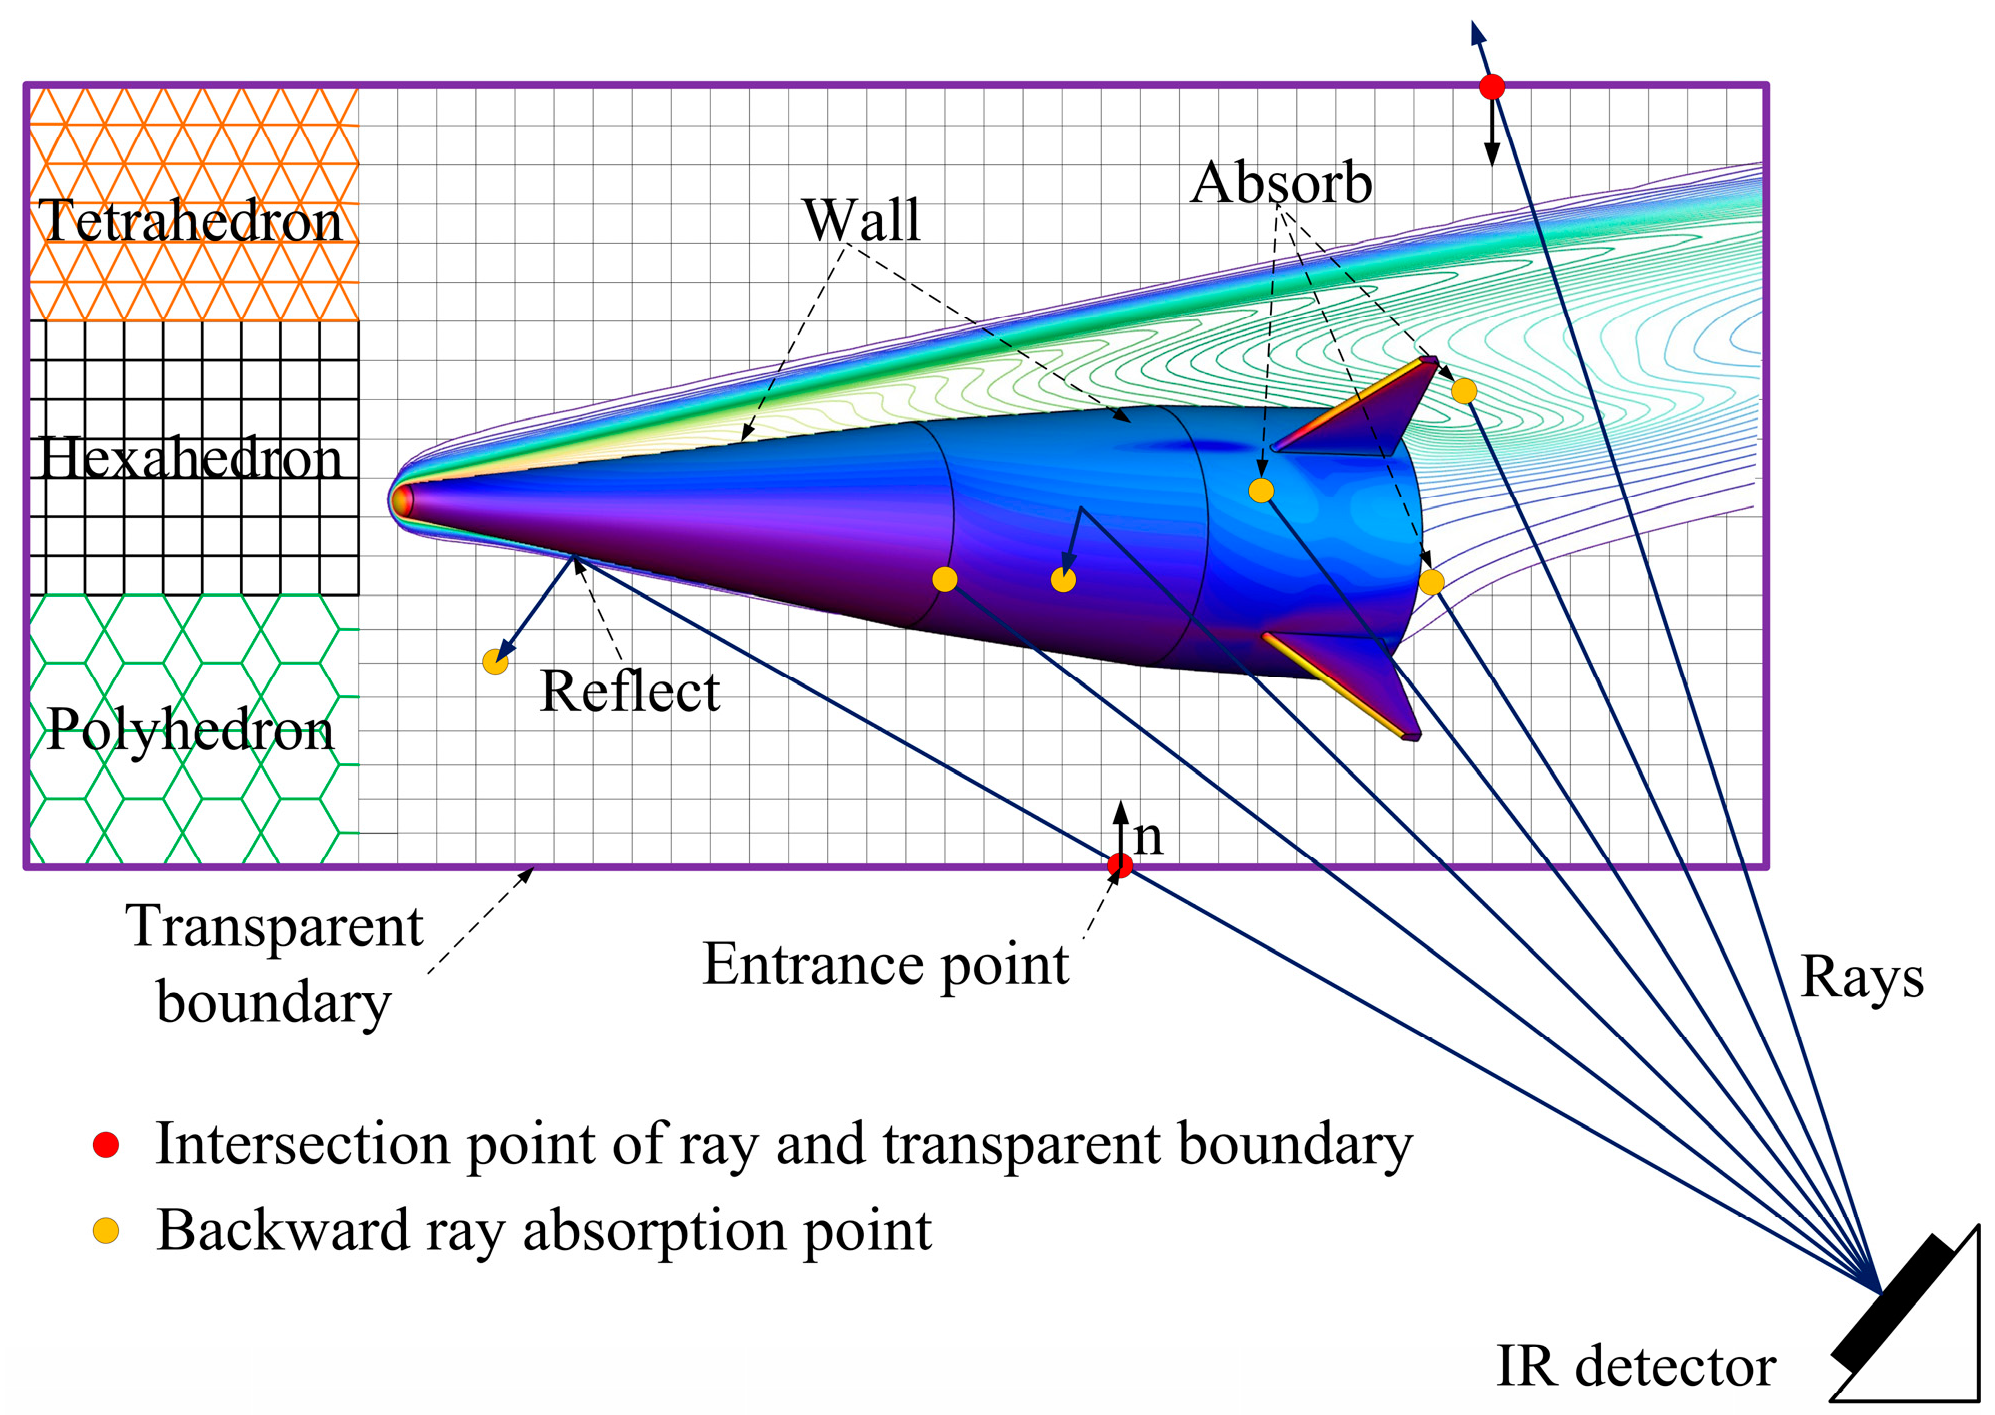
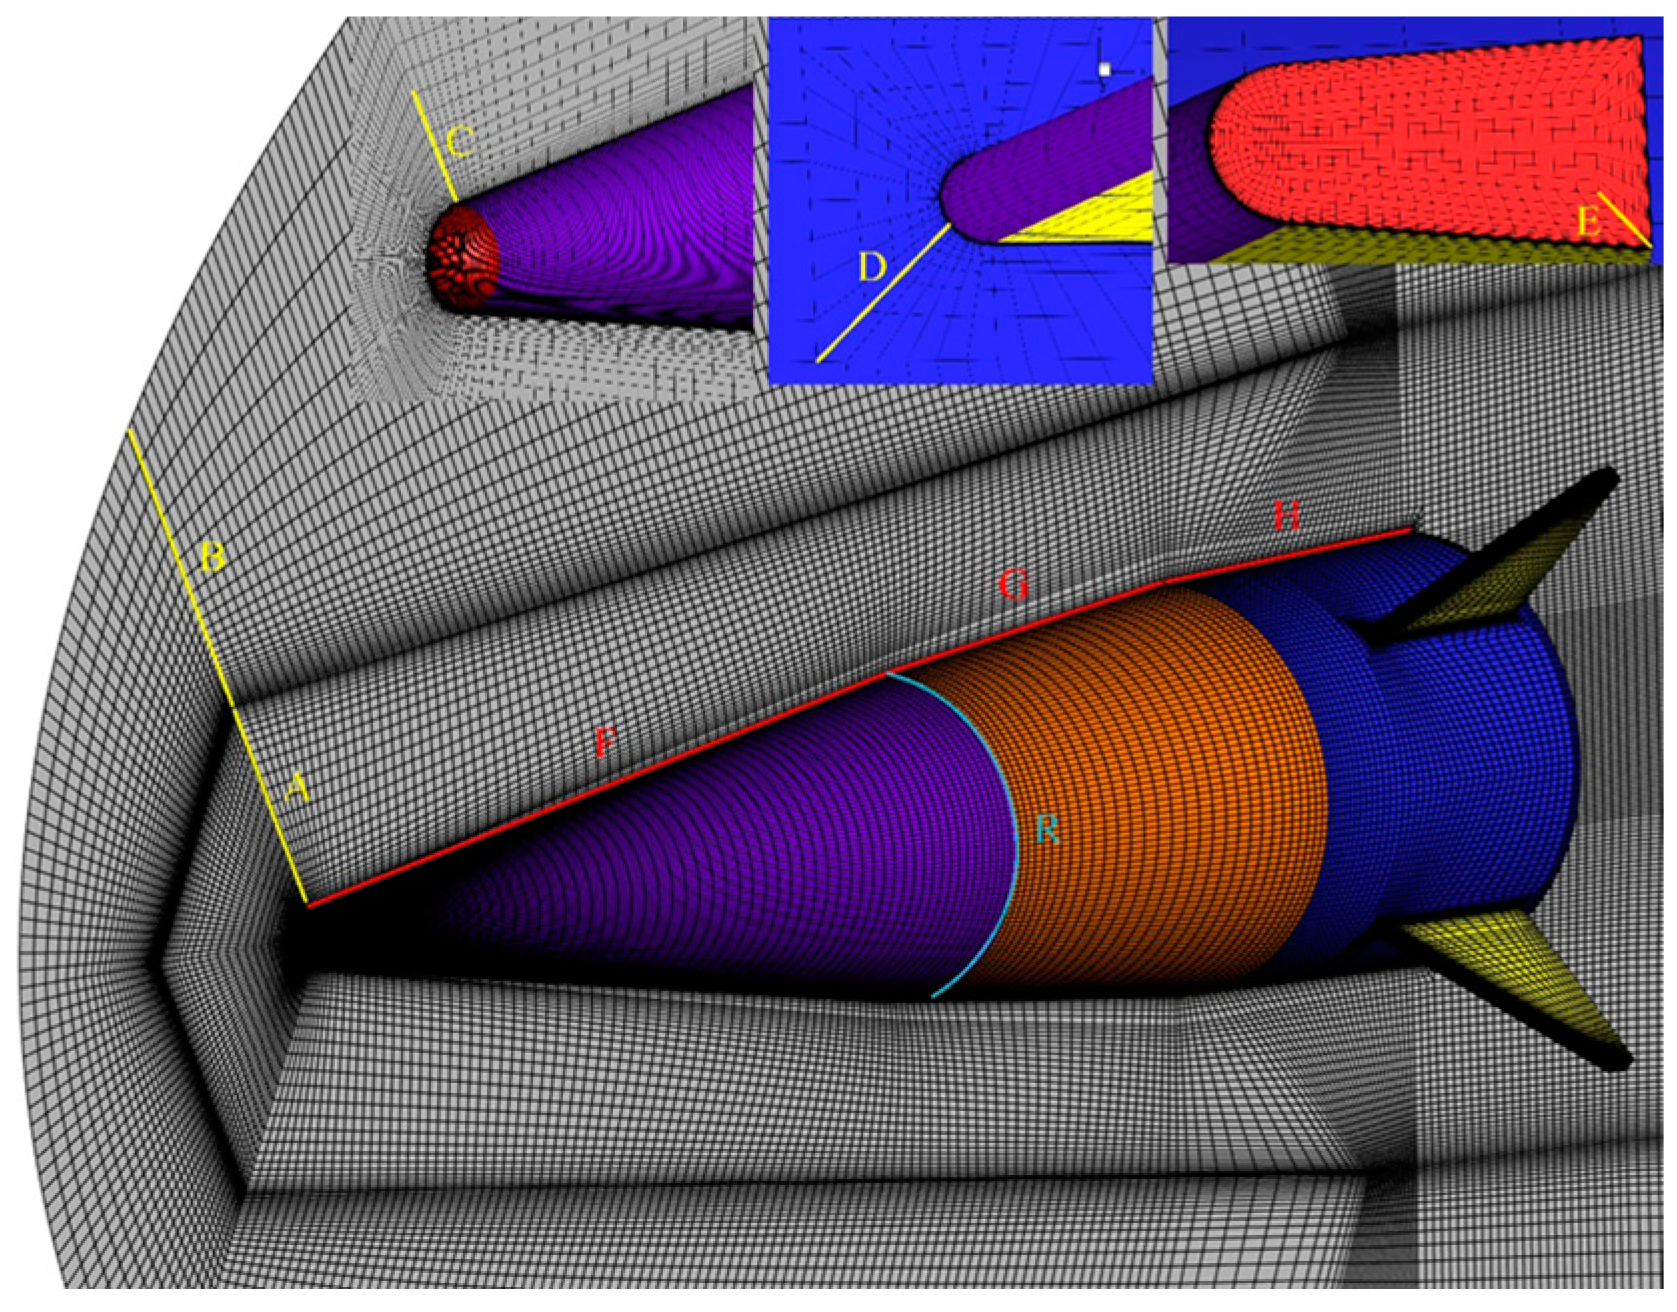
In the finite volume method, hexahedral grids are advantageous for achieving convergence in flow field calculations. As shown in
Figure 10, the computational domain is divided into multiple topological blocks to discretize space effectively. “Y”-shaped grid areas were utilized near the missile body and fin to segment the ring wall. The far-field region of the missile is segmented using a “C”-type grid, while an “O”-type grid discretizes the boundary layer near the missile’s surface. The hyperbolic tangent spacing function controlled the distribution of grid points along all block grid connection lines, ensuring a growth rate of less than 1.2 between grid points. Control line locations between coarse, medium, and dense grids are marked in
Figure 10 and are further illustrated in
Figure 11.
Based on the discretization of grid control points shown in
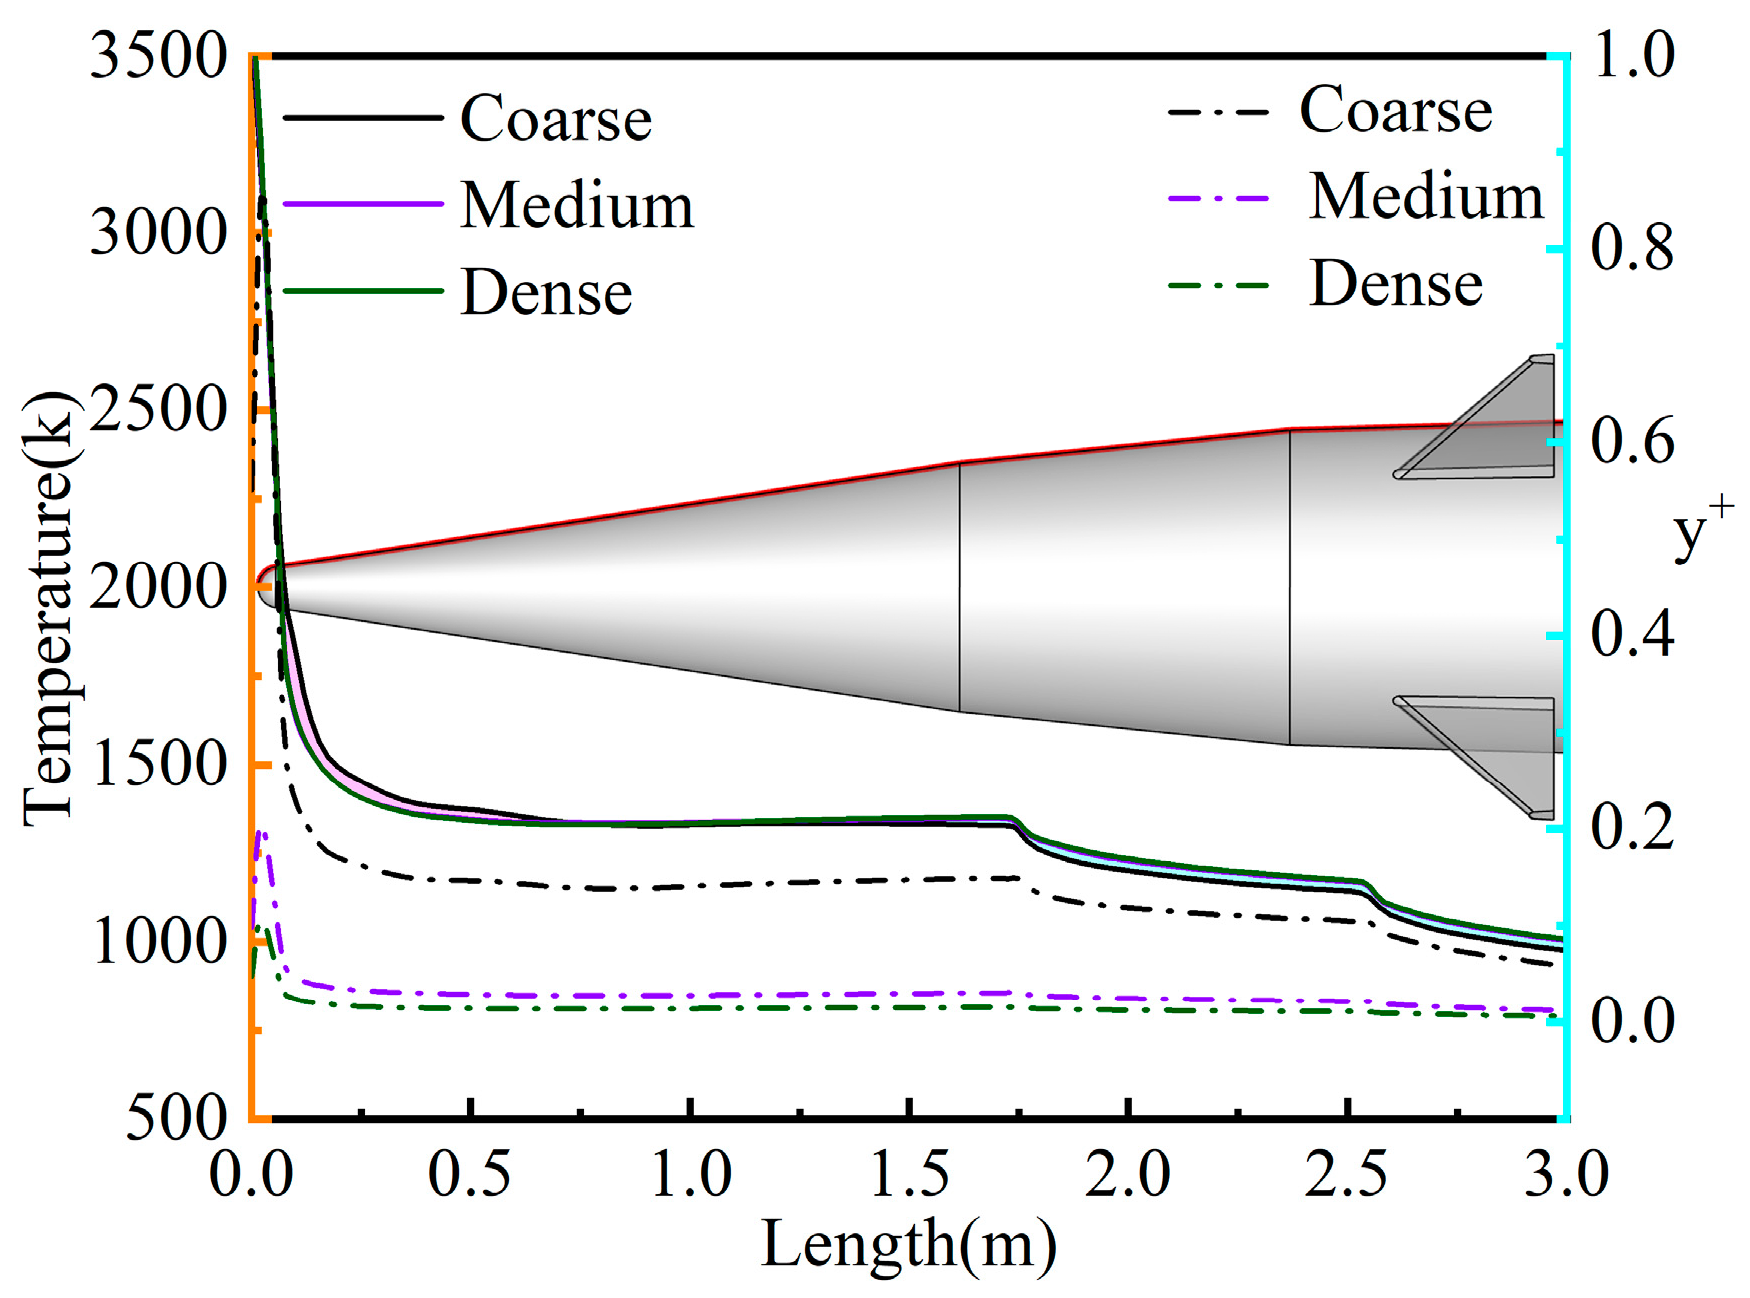
Figure 10, the entire flow domain of the missile is segmented into three mesh configurations for subsequent independent mesh convergence testing: a coarse mesh (2.5 million cells), a medium mesh (3.8 million cells), and a dense mesh (5.5 million cells). Analysis of the missile’s surface wall temperature revealed that the coarse grid model overestimated the temperature in the 0–1 m range and underestimated it in the 1–3 m range. Additionally, the coarse grid model exhibited significantly higher wall y
+ values compared to the medium and dense grid models. However, differences in wall temperature and wall y
+ values between the dense and medium mesh models were minimal. Based on the above comparison, while considering the accuracy of flow field parameter calculations, it is advisable to select a medium mesh for discretizing the missile flow field domain, aiming to improve computational efficiency from the perspective of computing resources.
In the analysis of a hypersonic missile’s trajectory [
3], the operating conditions are set with a flight speed of 15 Mach and a flight altitude of 50 km. Due to the limited scope of this study, the effects of changes in the angle of attack are temporarily disregarded, assuming a constant angle of attack of 0°. Four calculation models are taken into account: Non-equ, Equ, No-reac, and Cat-W models. The parameters of the far-field free flow and calculation models are detailed in
Table 2.
4.2. Aerodynamic Analysis of Different Calculation Models
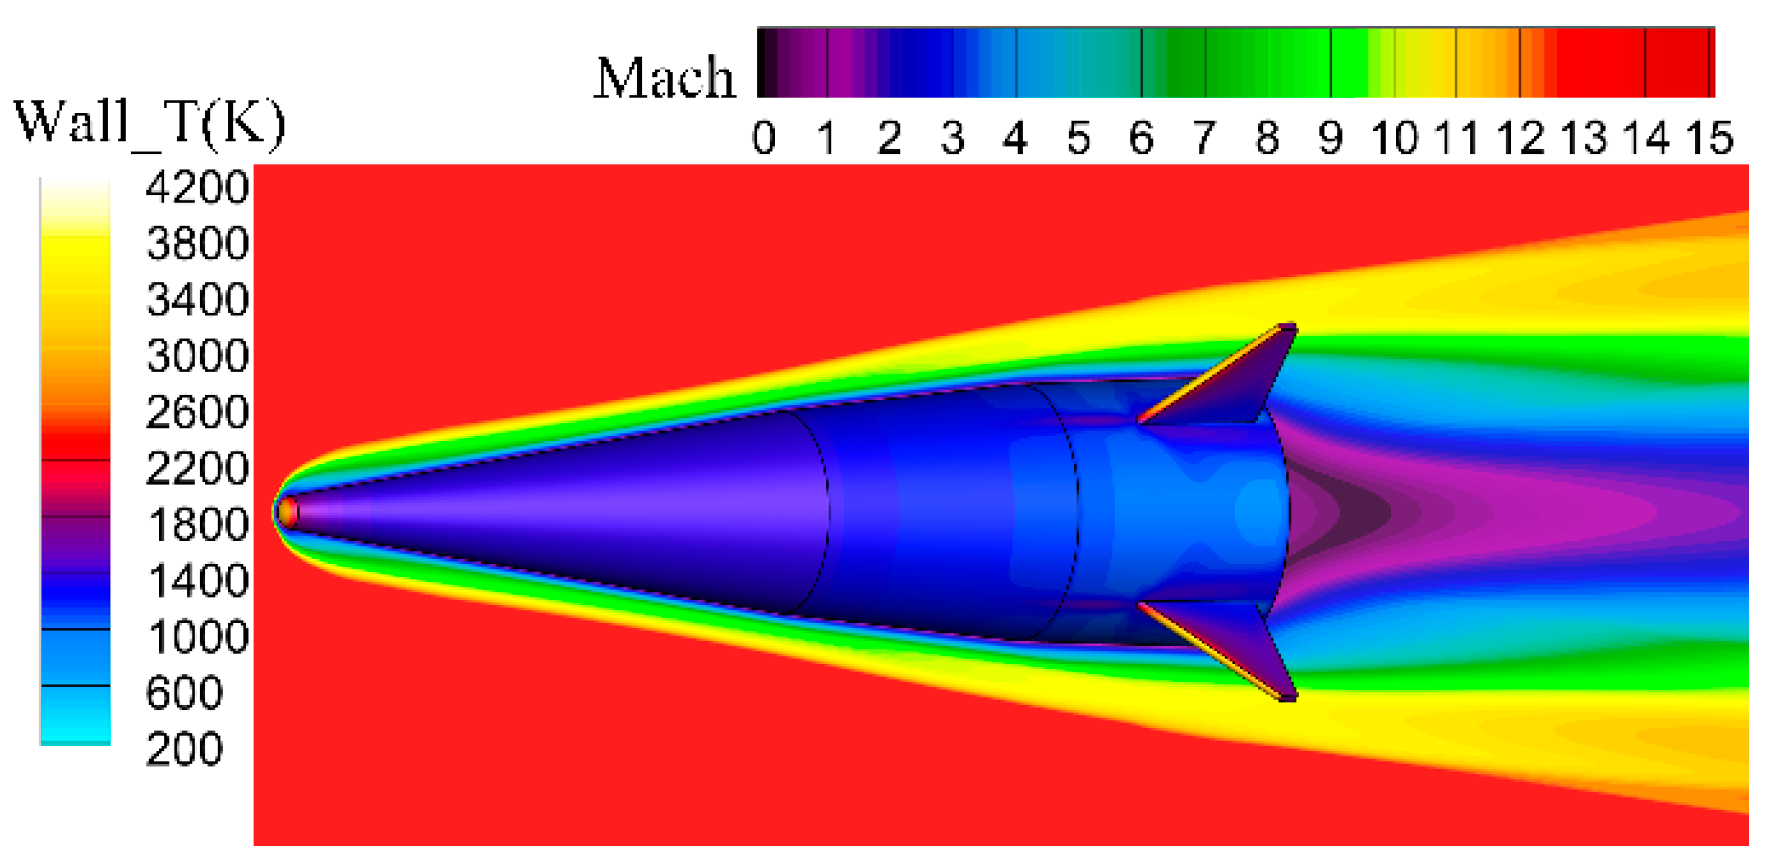
Figure 12 presents the Mach number and wall temperature distribution for the Non-equ model.
Figure 12 reveals high-temperature areas on the nose cone head and the windward head wall of the fin, resulting from the aerodynamic heating of the high-temperature airflow in the missile head’s strong shock wave layer. The nose cone head’s wall surface reaches a maximum temperature exceeding 4000 K. High-emissivity coatings and thermal insulation materials at these locations induce an ablation effect, reducing the head wall surface temperature and providing missile protection. The front cone’s wall temperature ranges between 1500 and 2000 K, while the rear cone’s wall temperature lies between 1000 and 1500 K. Most of the cylinder’s wall surface maintains a temperature below 1000 K, with a temperature around 1500 K appearing near the fin’s root. The missile’s wall temperature distribution satisfies the endurance limit temperature requirements of existing thermal protection materials [
35].
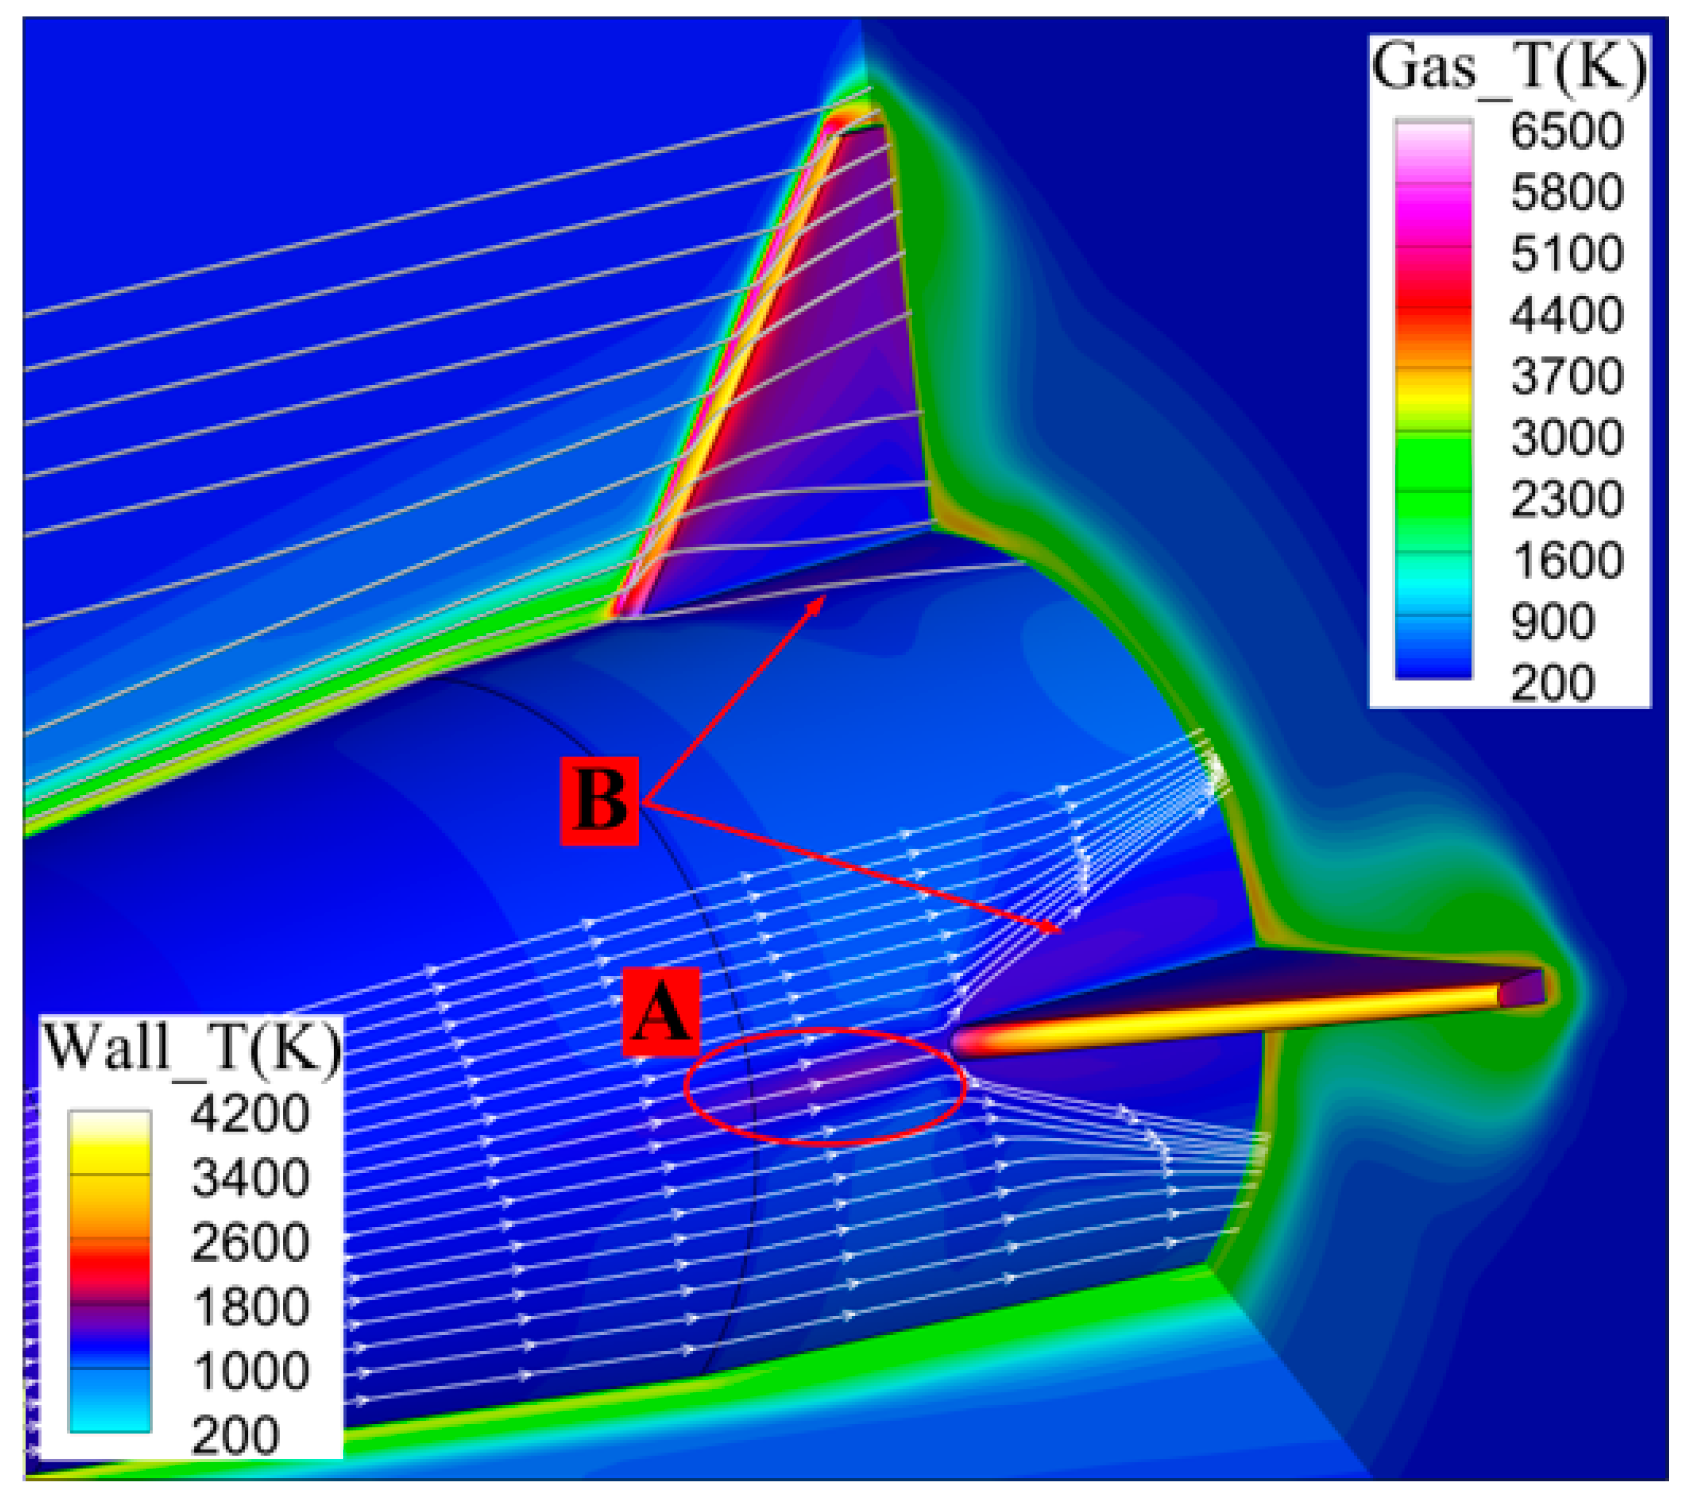
Figure 13 illustrates the flow field structure near the missile tail for the Non-equ model. A strong shock layer exists at the windward head of the fin, leading to a high-temperature area due to the radiative heating of the fin’s wall surface by the high-temperature shock layer. The high-temperature wall surface of the fin also radiates heat to the surrounding space airflow and solid wall. Position A, marked in the figure, exhibits a high-temperature wall zone due to the combined effect of the fin head’s strong shock wave aerodynamic heating and high-temperature wall radiation heating. The distribution of space and wall streamlines indicates hypersonic airflow separation on both sides of the fin wall. This separation leads to a decrease in hypersonic airflow speed and an increase in temperature, aerodynamically heating the solid wall near the separation area, marked as position B in the figure.
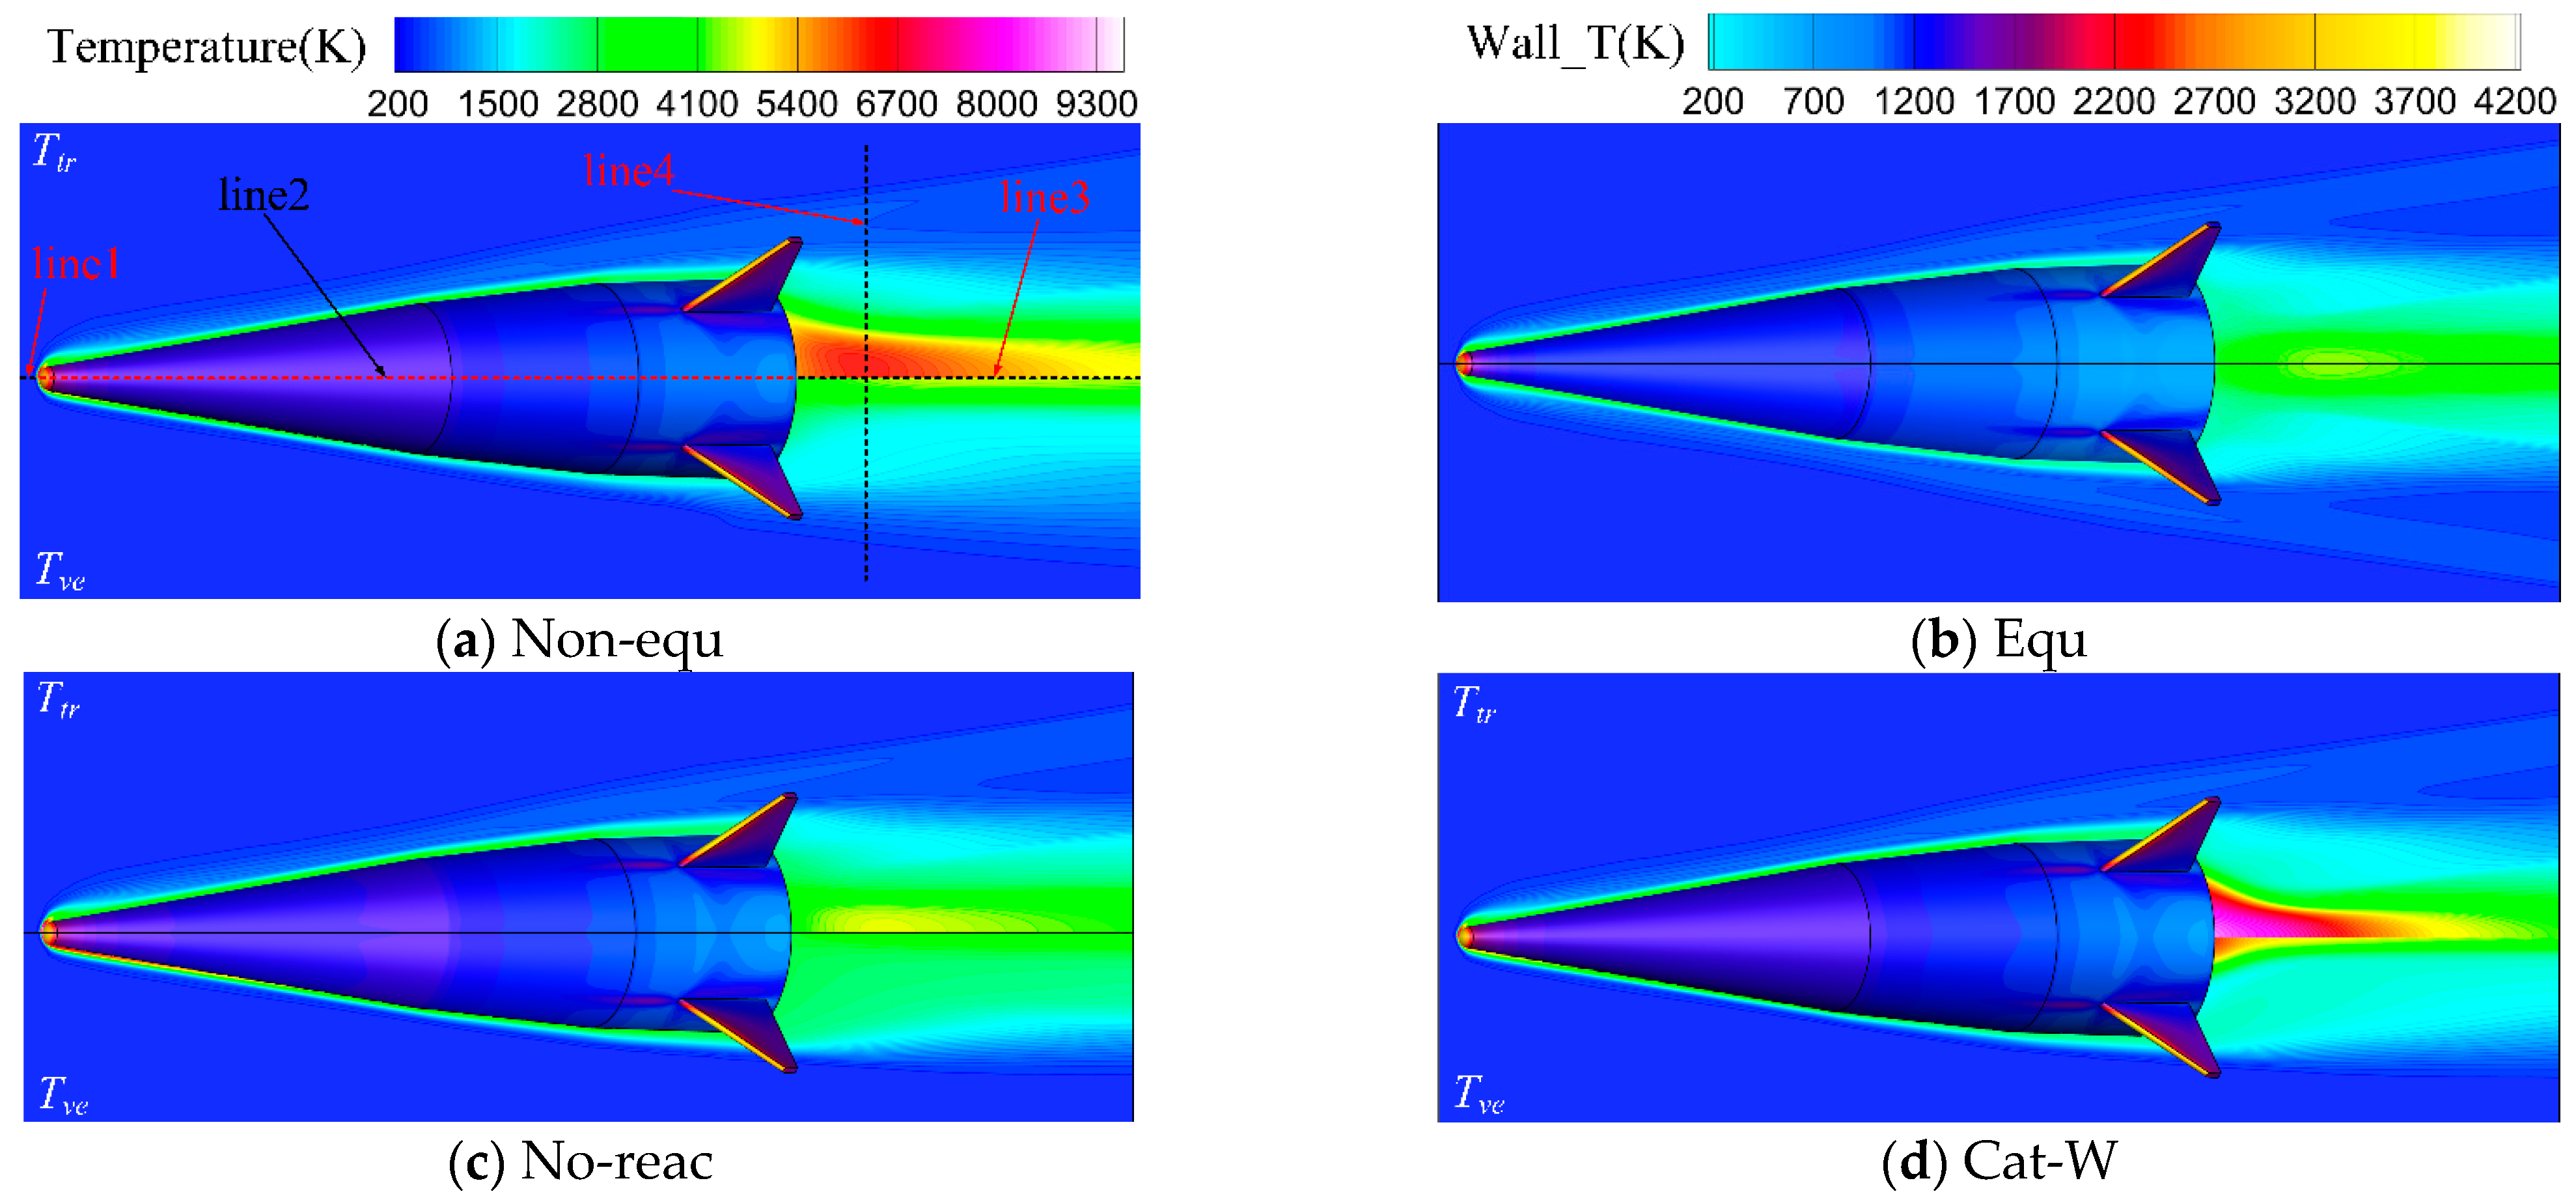
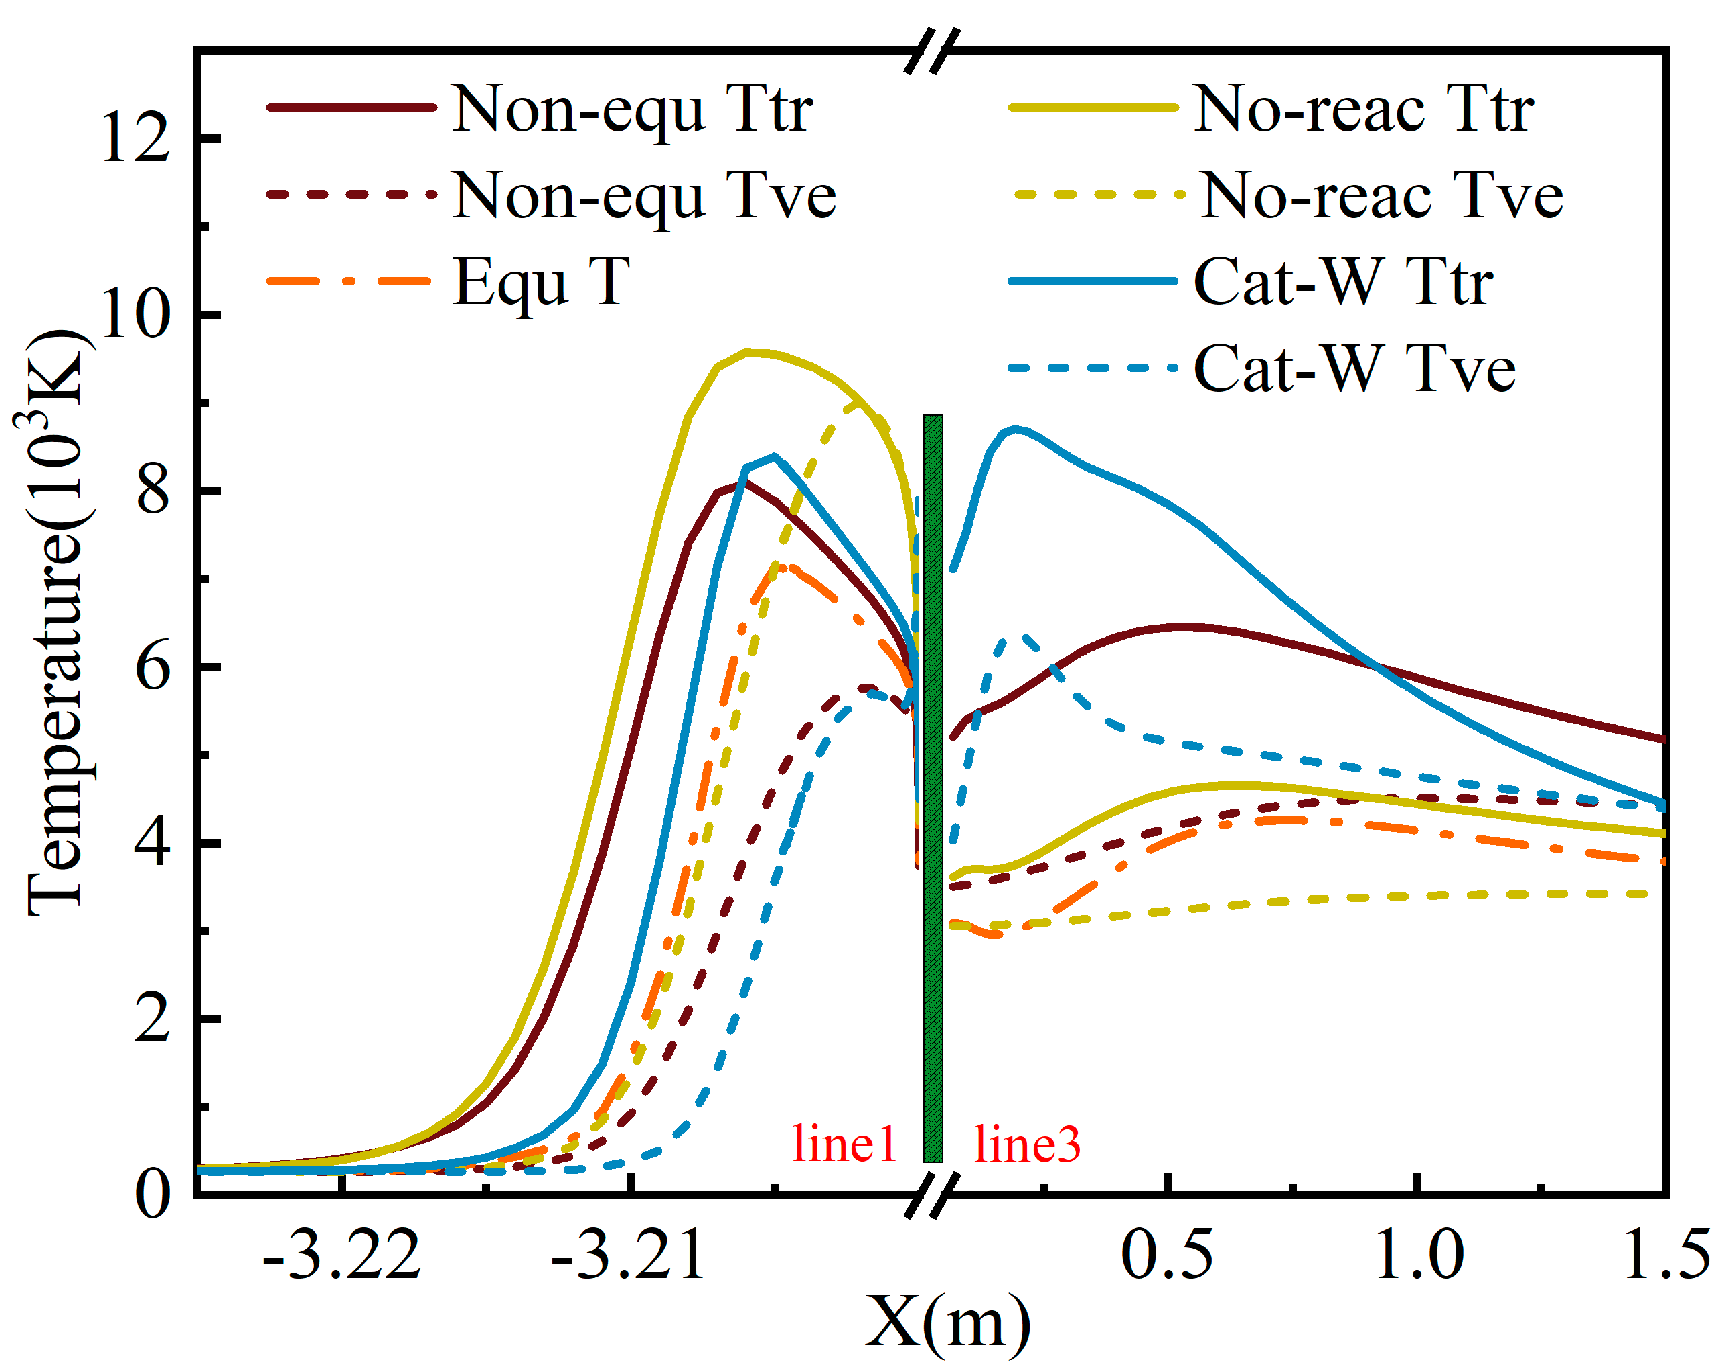
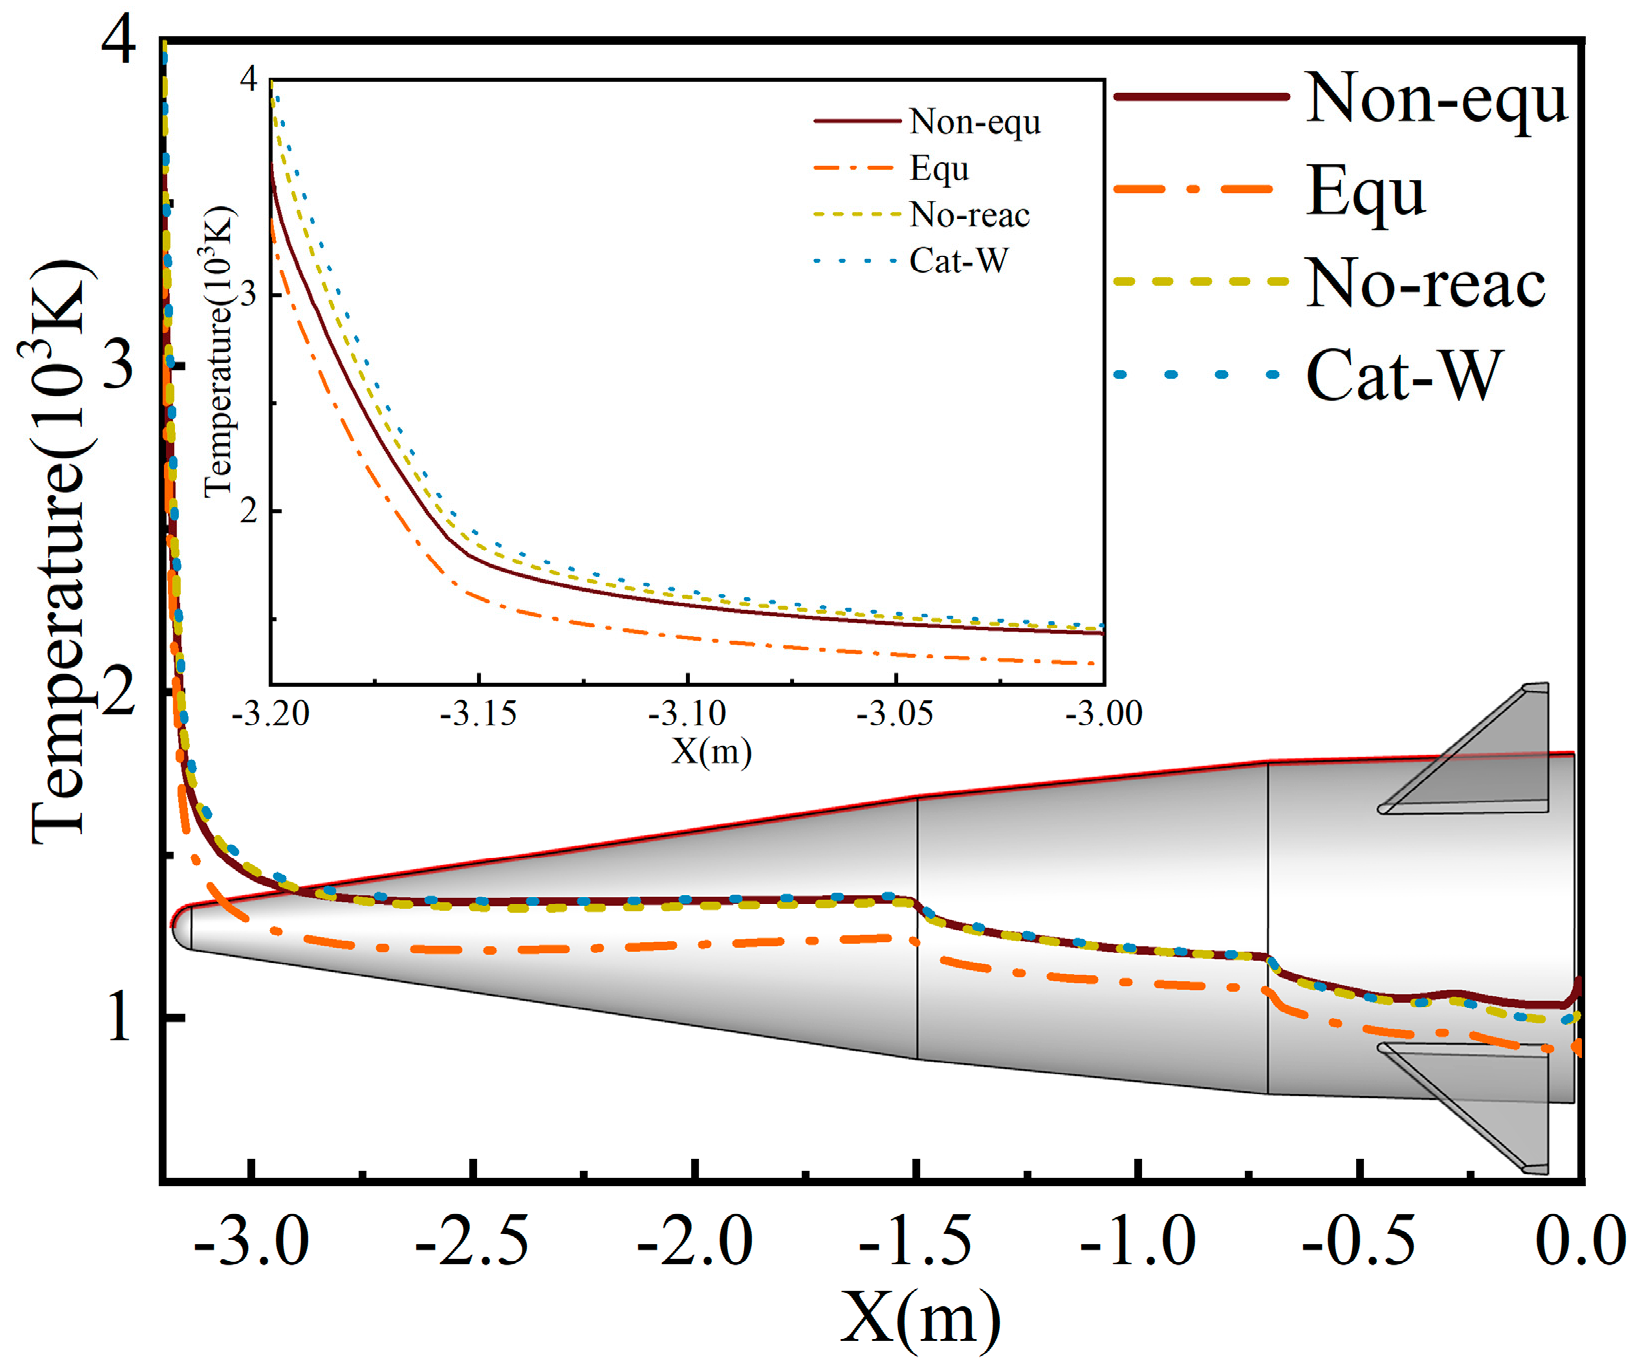
Figure 14 illustrates the flow field and wall temperature distribution of four calculation models. In the figure, line 1 represents the stagnation line along the X-axis at the model’s head, starting from the stagnation point (−3.2, 0.0, 0.0) and ending at (−3.225, 0.0, 0.0). All coordinates in this paper are in meters. Line 2 is the intersection between the model’s surface and the symmetry plane of the computational domain, starting from the stagnation point (−3.2, 0.0, 0.0) and ending at the junction of the cylinder and aft body (0.0, 0.4, 0.0). Line 3 is the characteristic line along the X-axis in the missile separation region, starting at (0.0, 0.0, 0.0) and ending at (1.5, 0.0, 0.0). Line 4 is the characteristic line along the Y-axis in the missile separation region, starting at (0.52, −2.0, 0.0) and ending at (0.52, 2.0, 0.0). Temperature data for line 1 and line 3, marked in
Figure 14a, are provided in
Figure 15, while the wall temperature distribution for line 2 is presented in
Figure 16.
Given the large mean free path of the atmosphere at an altitude of 50 km, the airflow in the missile head’s shock layer and the tail’s separation and expansion zone under a 15 Ma flight condition exhibit significant non-equilibrium effects. In
Figure 14a, the maximum
Ttr of the gas in the Non-equ model missile head’s shock layer exceeds 8000 K, with a maximum
Tve of approximately 5500 K. The maximum
Ttr near the tail’s separation expansion zone is about 6500 K, with
Tve reaching about 4500 K. Comparing
Figure 14a,b, the Equ model’s calculated gas temperatures in the flow field are significantly lower than the Non-equ model’s
Ttr in both the head and tail regions, and slightly higher than its
Tve. According to the radiant heat balance wall boundary condition, the Non-equ model’s wall temperature will also be higher than that of the Equ model. The difference in wall temperature data distribution between the two is evident in
Figure 16.
The dissociation reaction of high-temperature gas in the missile head’s shock layer necessitates energy absorption to break the chemical bonds between molecules. In
Figure 14c, the high-temperature shock layer of the No-reac model does not undergo a gas dissociation reaction. Consequently, the
Ttr and
Tve on the head stagnation line 1 of the No-reac model are higher than those of the Non-equ model. Conversely, in the missile tail’s separation expansion zone, the NO generation reaction is overall exothermic. Thus, on the separation expansion zone line 3 in
Figure 15, the No-reac model’s
Ttr and
Tve are lower than those of the Non-equ model. Influenced by the increased temperature of the flow field around the head, the wall temperature data distribution of the No-reac model’s nose cone in
Figure 14c and
Figure 16 is slightly higher than that of the Equ model.
Compared to the Non-equ model in
Figure 14a, the Cat-W model in
Figure 14d incorporates a complete catalytic wall model based on the non-equilibrium temperature model. The molecules dissociated in the flow around the wall undergo a polymerization reaction, releasing energy. Consequently, the wall temperature data distribution of the Cat-W model in
Figure 14d and
Figure 16 is higher than that of the Equ model. According to the radiant heat balance wall boundary condition, the wall heats the surrounding gas through thermal radiation, leading to an increase in the temperature of the gas in the surrounding flow field. Upon reaching radiation heat balance, the temperature of the Cat-W model line 1 in
Figure 15 significantly increases near the wall, and the
Ttr and
Tve on the tail separation zone line 3 are also significantly higher than the Non-equ model.
As the No-reac model does not generate NO,
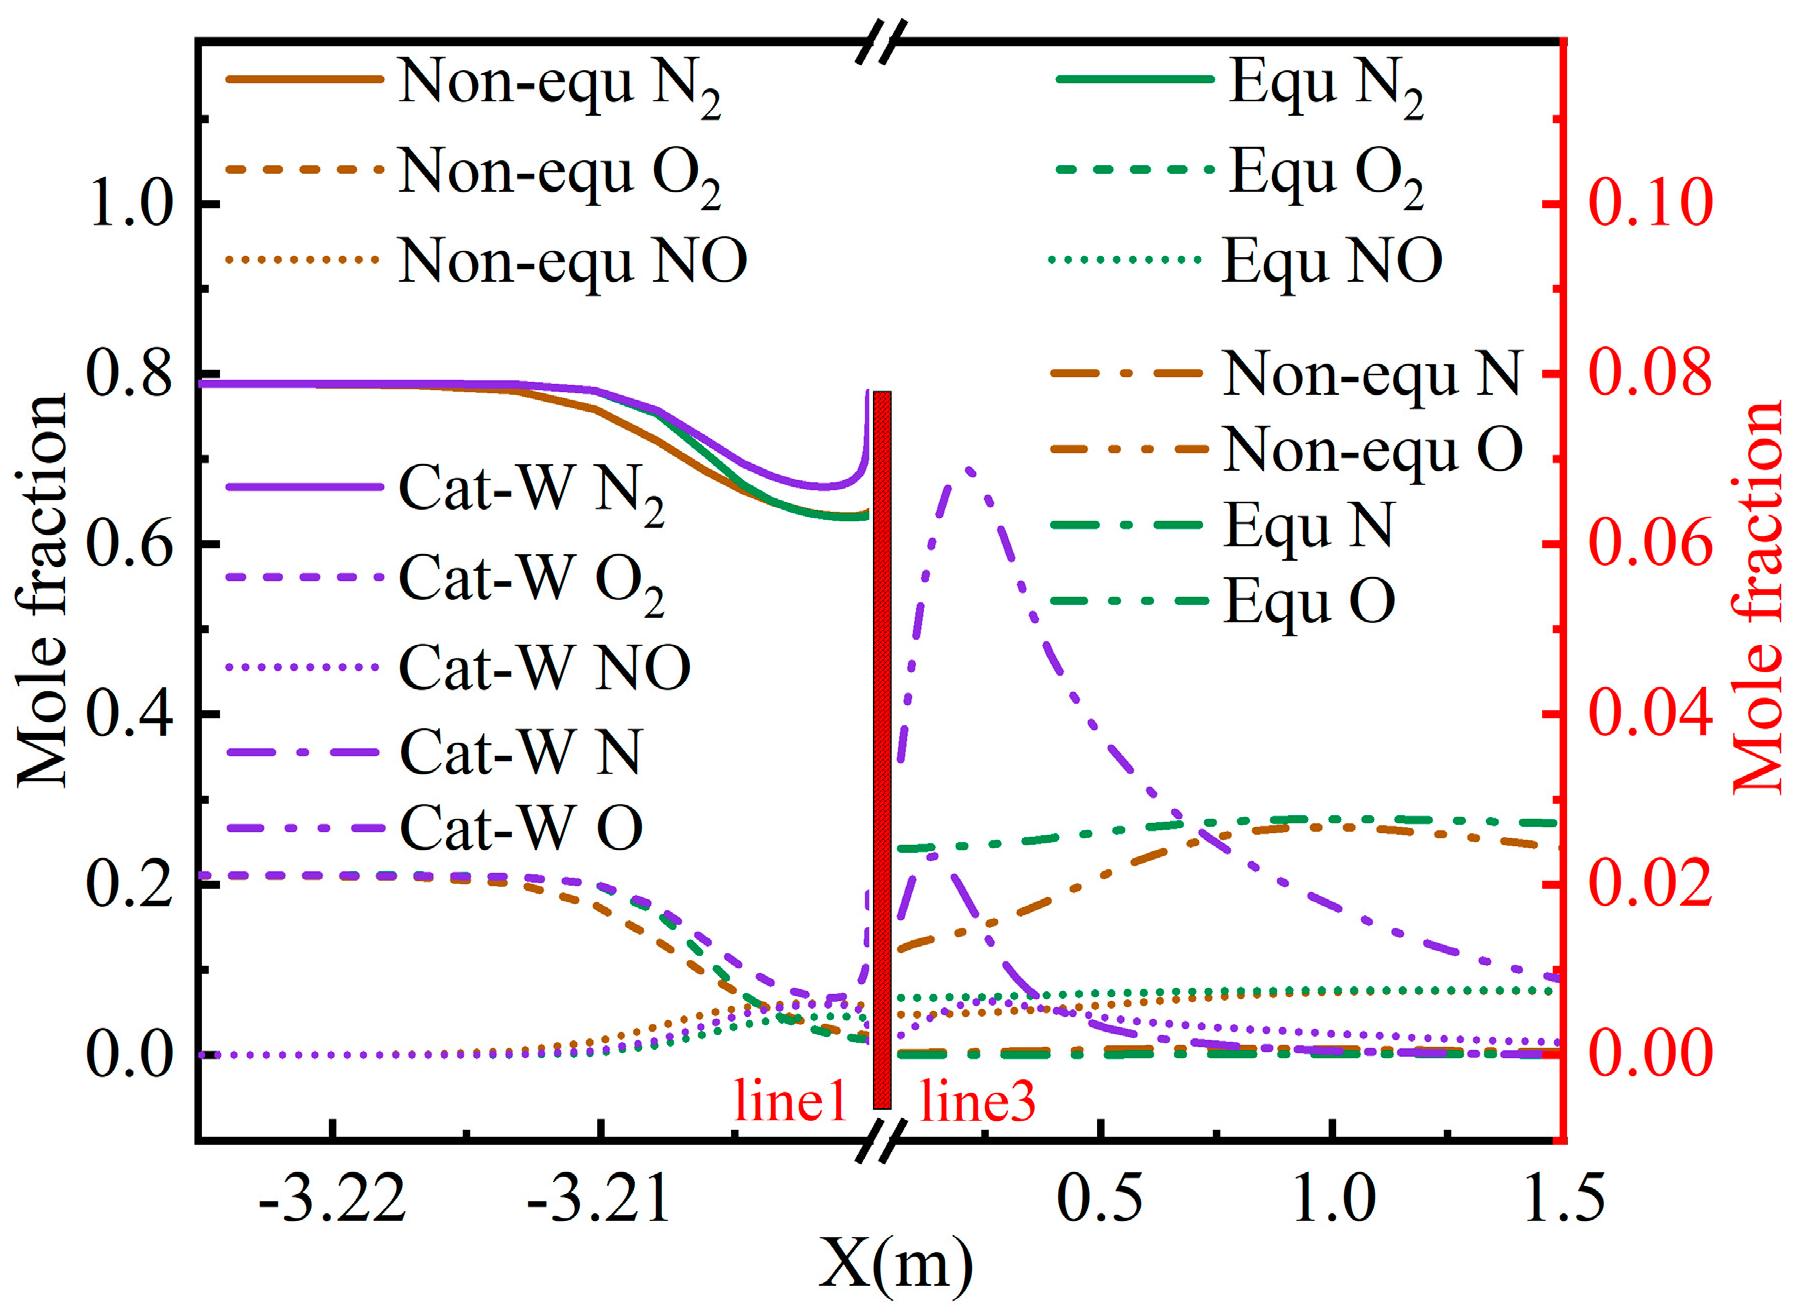
Figure 17 displays the NO mole fraction distribution for the remaining three models.
Figure 18 provides the NO mole fraction distribution for these models at line 1 and line 3 positions.
Figure 17a reveals minimal difference in the NO mole fraction in the nose cone between the Non-equ and Equ models. However, the Equ model exhibits an increased NO mole fraction in the flow around the missile. Due to the combined effects of NO transport in the front flow field and NO generation in the tail, the NO mole fraction in the Equ model’s tail separation expansion zone is significantly higher than that of the Non-equ model. In
Figure 18, the NO mole fraction on line 1 of the Equ model’s head stagnation line is smaller than that of the Non-equ model. The mole fractions of N
2 and O
2 show little variation, but the O mole fraction on line 3 of the Equ model is significantly larger than that of the Non-equ model. As NO is primarily generated by neutral exchange reactions, the NO mole fraction of the Equ model on line 3 is also significantly higher than that of the Non-equ model. By combining the data in
Figure 17a and
Figure 18, it can be inferred that the amount of O
2 dissociation in the Equ model’s flow field is higher than that of the Non-equ model. Consequently, more O atoms participate in the neutral exchange reaction, leading to an increase in NO production.
Under the complete wall catalytic boundary condition of the Cat-W model, the dissociated components undergo polymerization reactions near the wall, resulting in a decrease in the NO mole fraction. Therefore, the NO mole fraction in the flow around the Cat-W model missile in
Figure 17b is significantly less than that of the Non-equ model. The mole fractions of N atoms and O atoms on line 3 of the Cat-W model in
Figure 18 are higher than those of the Non-equ model due to the higher temperature causing increased dissociation of N
2 and O
2 in the extremely small separation core area. This is substantiated by the data in
Figure 14d and
Figure 15. Generally, the N and O mole fractions in the tail separation expansion zone of the Cat-W model are reduced compared to the Non-equ model, resulting in the NO mole fraction in the tail separation expansion zone of the Cat-W model being noticeably lower than that of the Non-equ model in
Figure 17b.
4.3. Radiation Characteristics of Hypersonic Missiles under Different Calculation Models
NO generated in the flow field around the hypersonic missile undergoes excitation and emits radiation in the ultraviolet band.
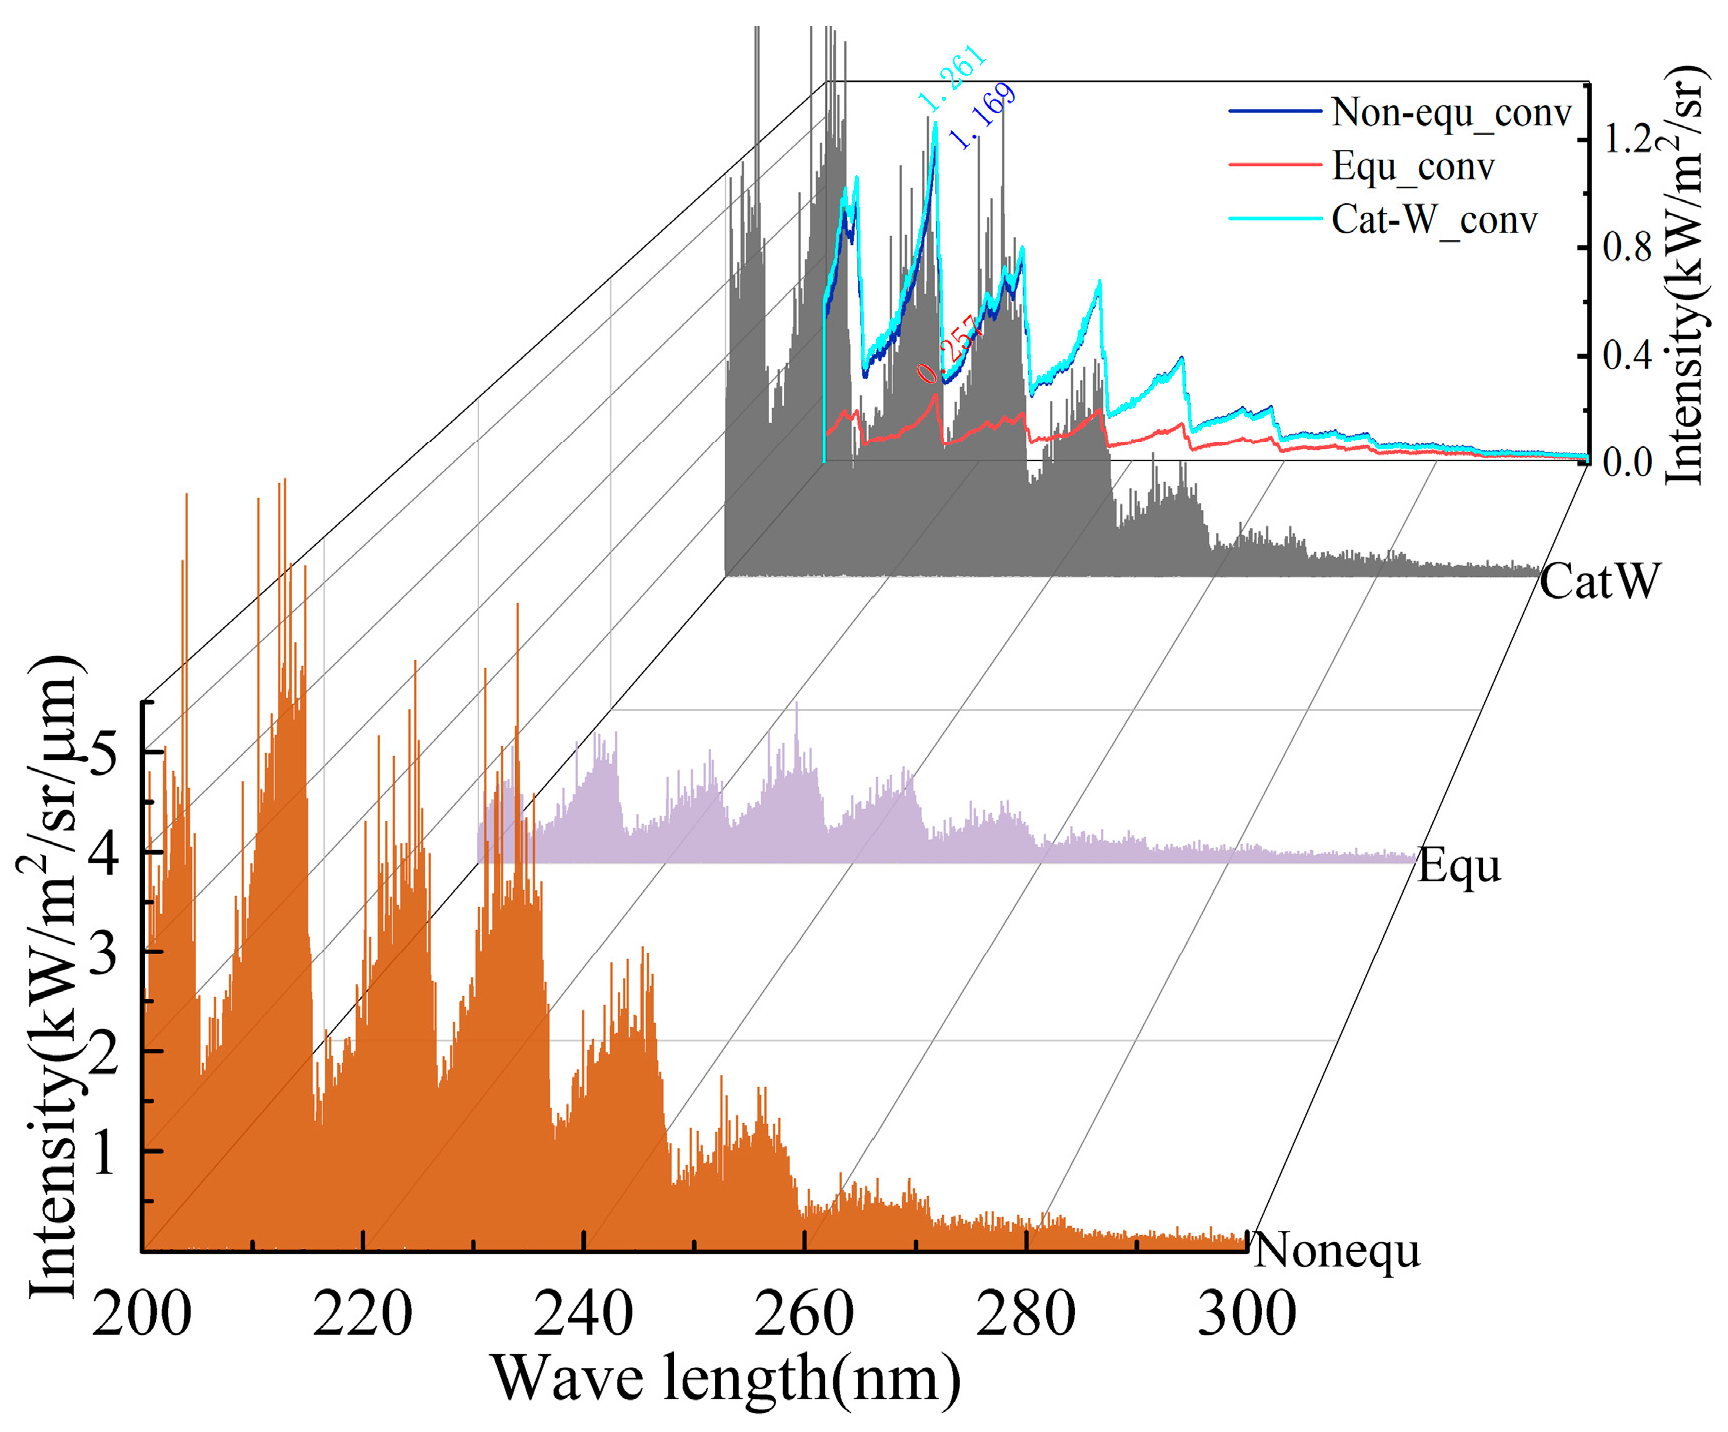
Figure 19 presents the line-by-line calculation results of the ultraviolet spectral radiation intensity on the missile head’s stagnation line 1, within the wavelength range of 200–300 nm. The upper right of the figure shows the radiation intensity after convolution with the slit function (Full Width at Half Maximum, FWHM = 0.2 nm). The calculation results from all three models display distinct excited state transition peaks at
γ (1, 0),
γ (0, 0),
γ (0, 1),
γ (0, 2),
γ (0, 3), and
γ (0, 4). The maximum transition radiation intensity peak occurs at the
γ (1, 0) position, with the radiation intensity peak decreasing as the wavelength increases.
Based on the data analysis results from
Figure 15 and
Figure 18, the NO mole fraction generated on the head’s stagnation line 1 of the Equ model is smaller than that of the Non-equ model. Its equilibrium temperature is also lower than the
Ttr of the Non-equ model. Consequently, the radiation intensity values calculated by the Equ model in
Figure 19 are significantly lower than those of the Non-equ model in the 200–300 nm range. The convolution peak values of the maximum transition radiation intensity for the Non-equ model and the Equ model are approximately 1169 W/m
2/sr and 257 W/m
2/sr, respectively. The NO mole fraction generated on the head’s stagnation line 1 of the Cat-W model is not significantly different from that of the Non-equ model. However, its maximum
Ttr is slightly higher than that of the Non-equ model. Therefore, the radiation intensity value calculated by the Cat-W model in
Figure 19 is slightly higher than that of the Non-equ model in the 200–230 nm range.
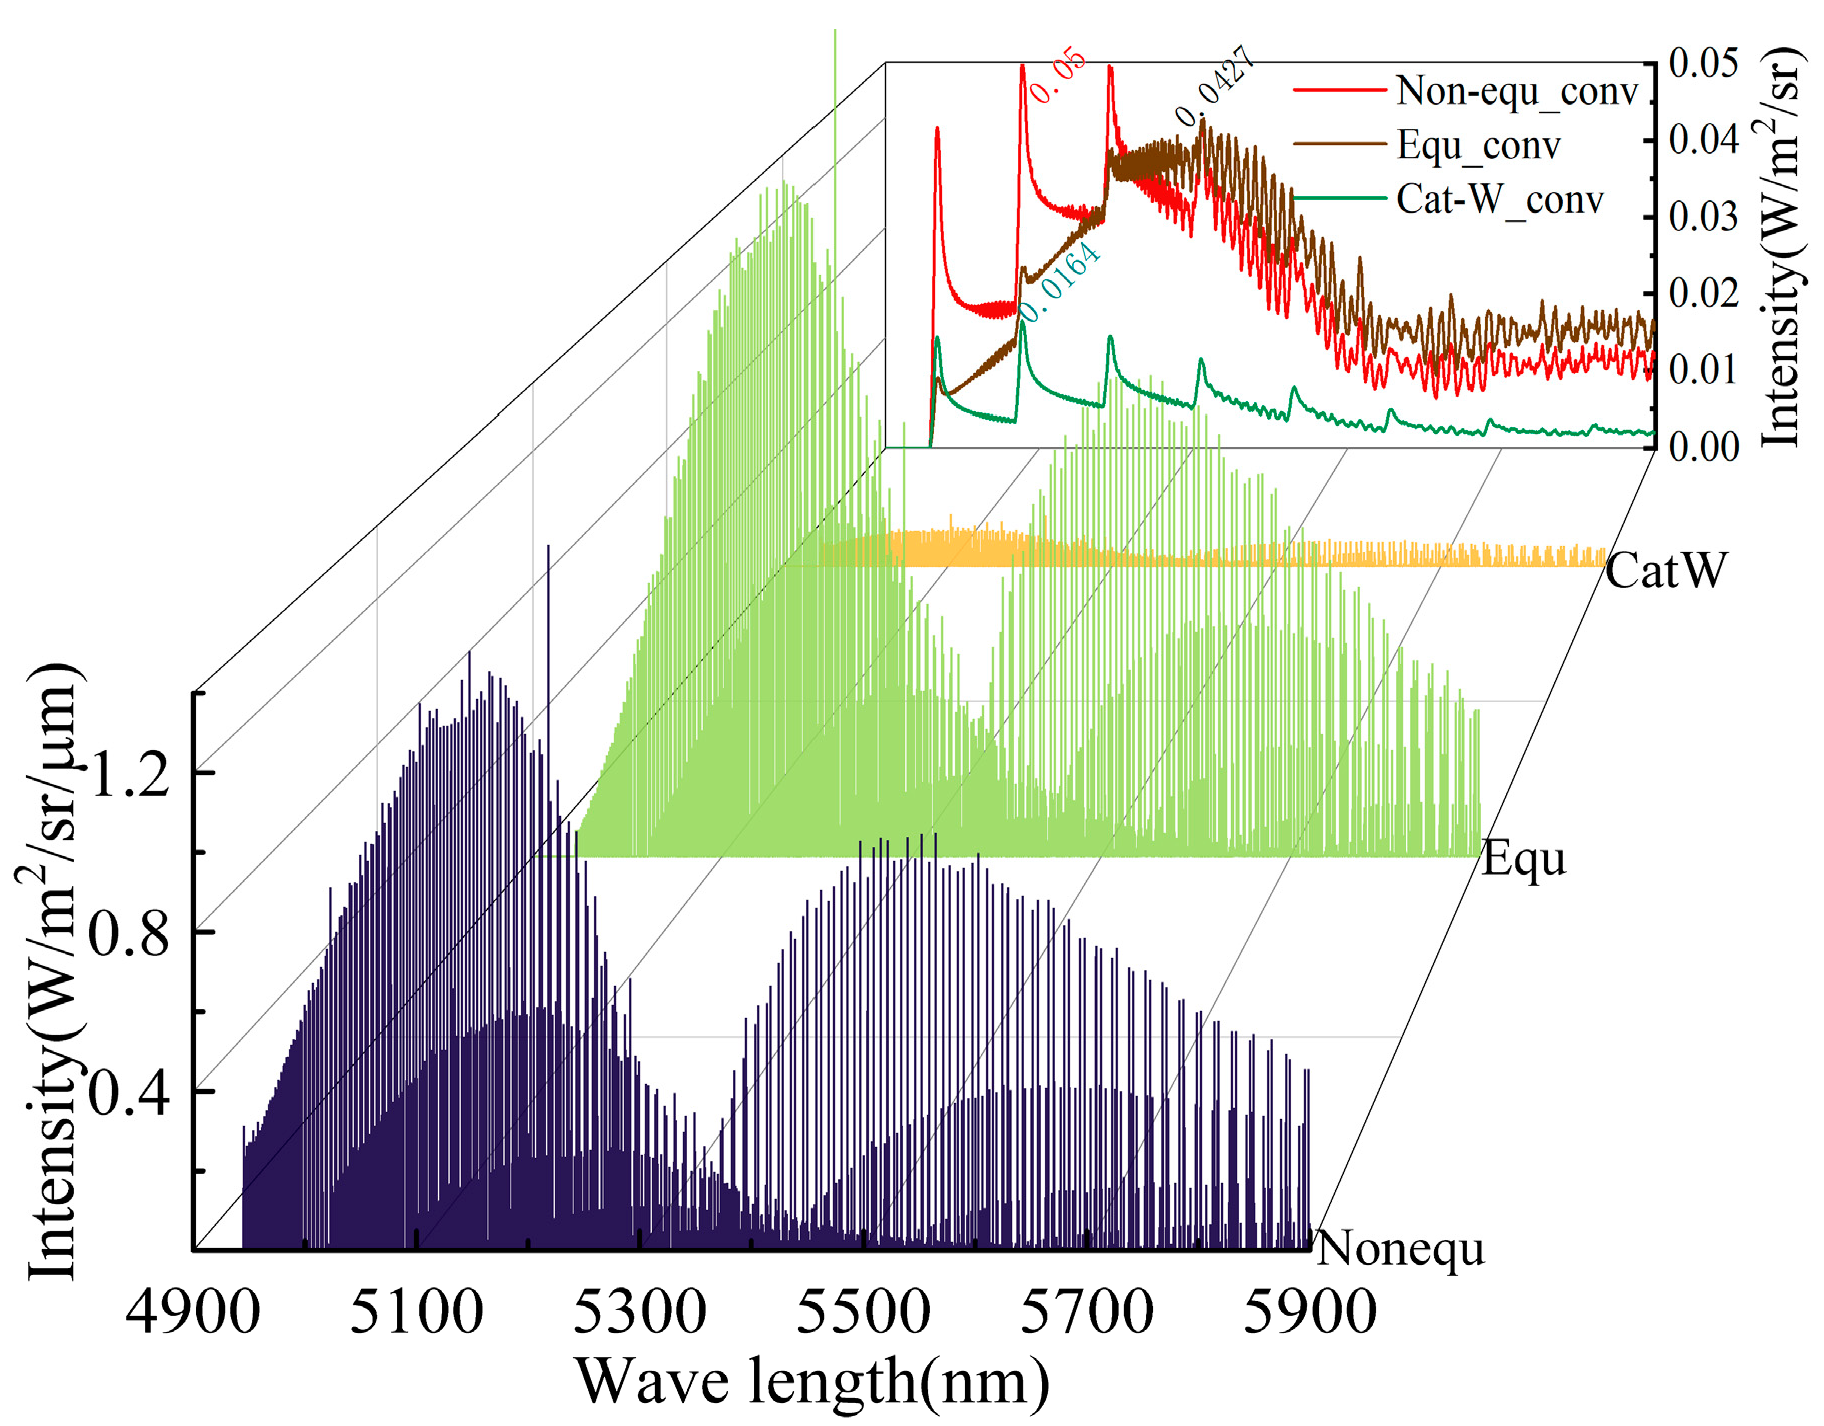
Figure 20 presents the line-by-line calculation results of the infrared spectral radiation intensity within the wavelength range of 4900–5900 nm. These results are for the missile tail separation expansion zone line 4. The upper right of the figure displays the radiation intensity after convolution with the slit function (FWHM = 5 nm). The three models’ calculation results all exhibit distinct fundamental frequency band (
) transition peaks. The Non-equ model’s maximum transition radiation intensity convolution peak appears at the (2, 1) position, approximately 0.05 W/m
2/sr. The Equ model’s peak appears at the (4, 3) position, approximately 0.0427 W/m
2/sr. The Cat-W model’s peak appears at the (2, 1) position, approximately 0.0164 W/m
2/sr.
According to the data analysis results from
Figure 15 and
Figure 18, the Equ model’s equilibrium temperature in the tail’s separation expansion core region is lower than the Non-equ model’s
Ttr and
Tve. However, the Equ model generates a larger NO mole fraction. Comparing the convolved radiation intensities, it is evident that in the 4900–5300 nm range, the fundamental frequency transition peaks at (1, 0), (2, 1), and (3, 2) positions are influenced by the increase in
Ttr and
Tve. The Non-equ model’s radiation intensity at these positions is greater than that of the Equ model. Within the 5300–5900 nm range, the fundamental frequency transitions at the (4, 3) and (5, 4) positions are primarily affected by the NO mole fraction. The spectral radiation intensity distributions of the Non-equ model and the Equ model are relatively similar, but the Equ model’s radiation intensity at each wavelength position is greater than that of the Non-equ model.
The Cat-W model generates a much smaller NO mole fraction in the tail separation expansion zone than the Non-equ model. Therefore, the spectral radiation intensity value calculated by the Cat-W model in
Figure 19 is also much smaller than that of the Non-equ model in the 4900–5900 nm range.
Due to the computational speed limitations of the line-by-line method, the SNB + RMCM method is employed to calculate the spectral radiation intensity within the detection angle range, as shown in
Figure 21.
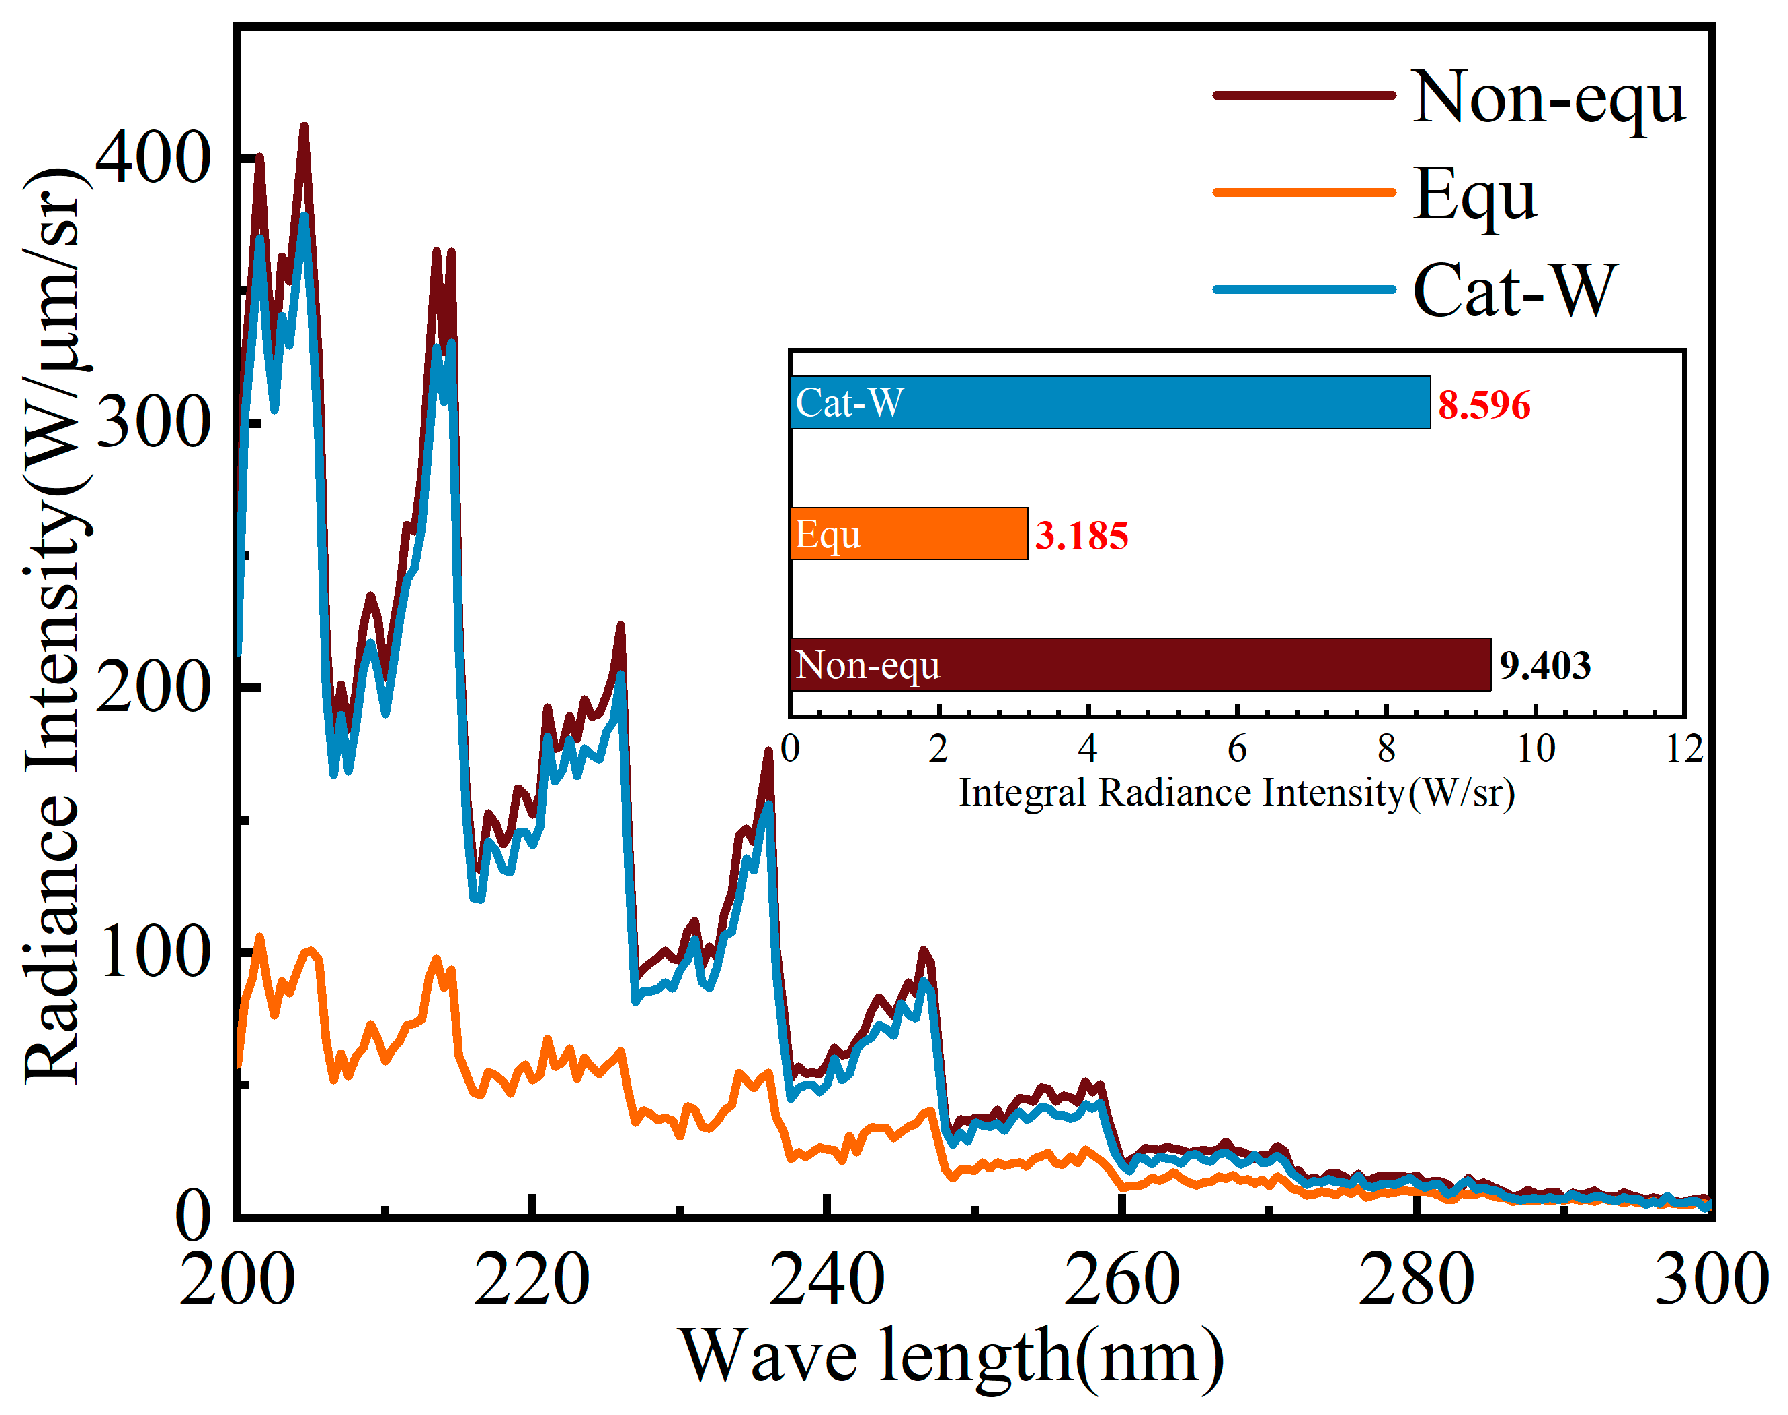
Figure 21 illustrates the intensity of ultraviolet radiation within the 200–300 nm band for the head shock layer across three models. The calculation results from all three models, similar to the LBL results for the head stagnation line 1 in
Figure 19, exhibit distinct excited state transition peaks. The maximum transition peak occurs at the δ (0, 2) position, with the radiation intensity peak decreasing as the wavelength increases. The radiation peaks for the Non-equ, Equ, and Cat-W models are approximately 400 W/μm/sr, 100 W/μm/sr, and 370 W/μm/sr, respectively. Overall, the band distribution and intensity of the ultraviolet spectral radiation of the shock layer in the Non-equ model and the Cat-W model are quite similar.
Figure 21 also displays the integrated radiation intensity of the three models in the 200–300 nm band. The integrated radiation intensities for the Non-equ, Equ, and Cat-W models are approximately 9.403 W/sr, 3.185 W/sr, and 8.596 W/sr, respectively. Notably, the integrated radiation intensity of the Non-equ model is about three times that of the Equ model.
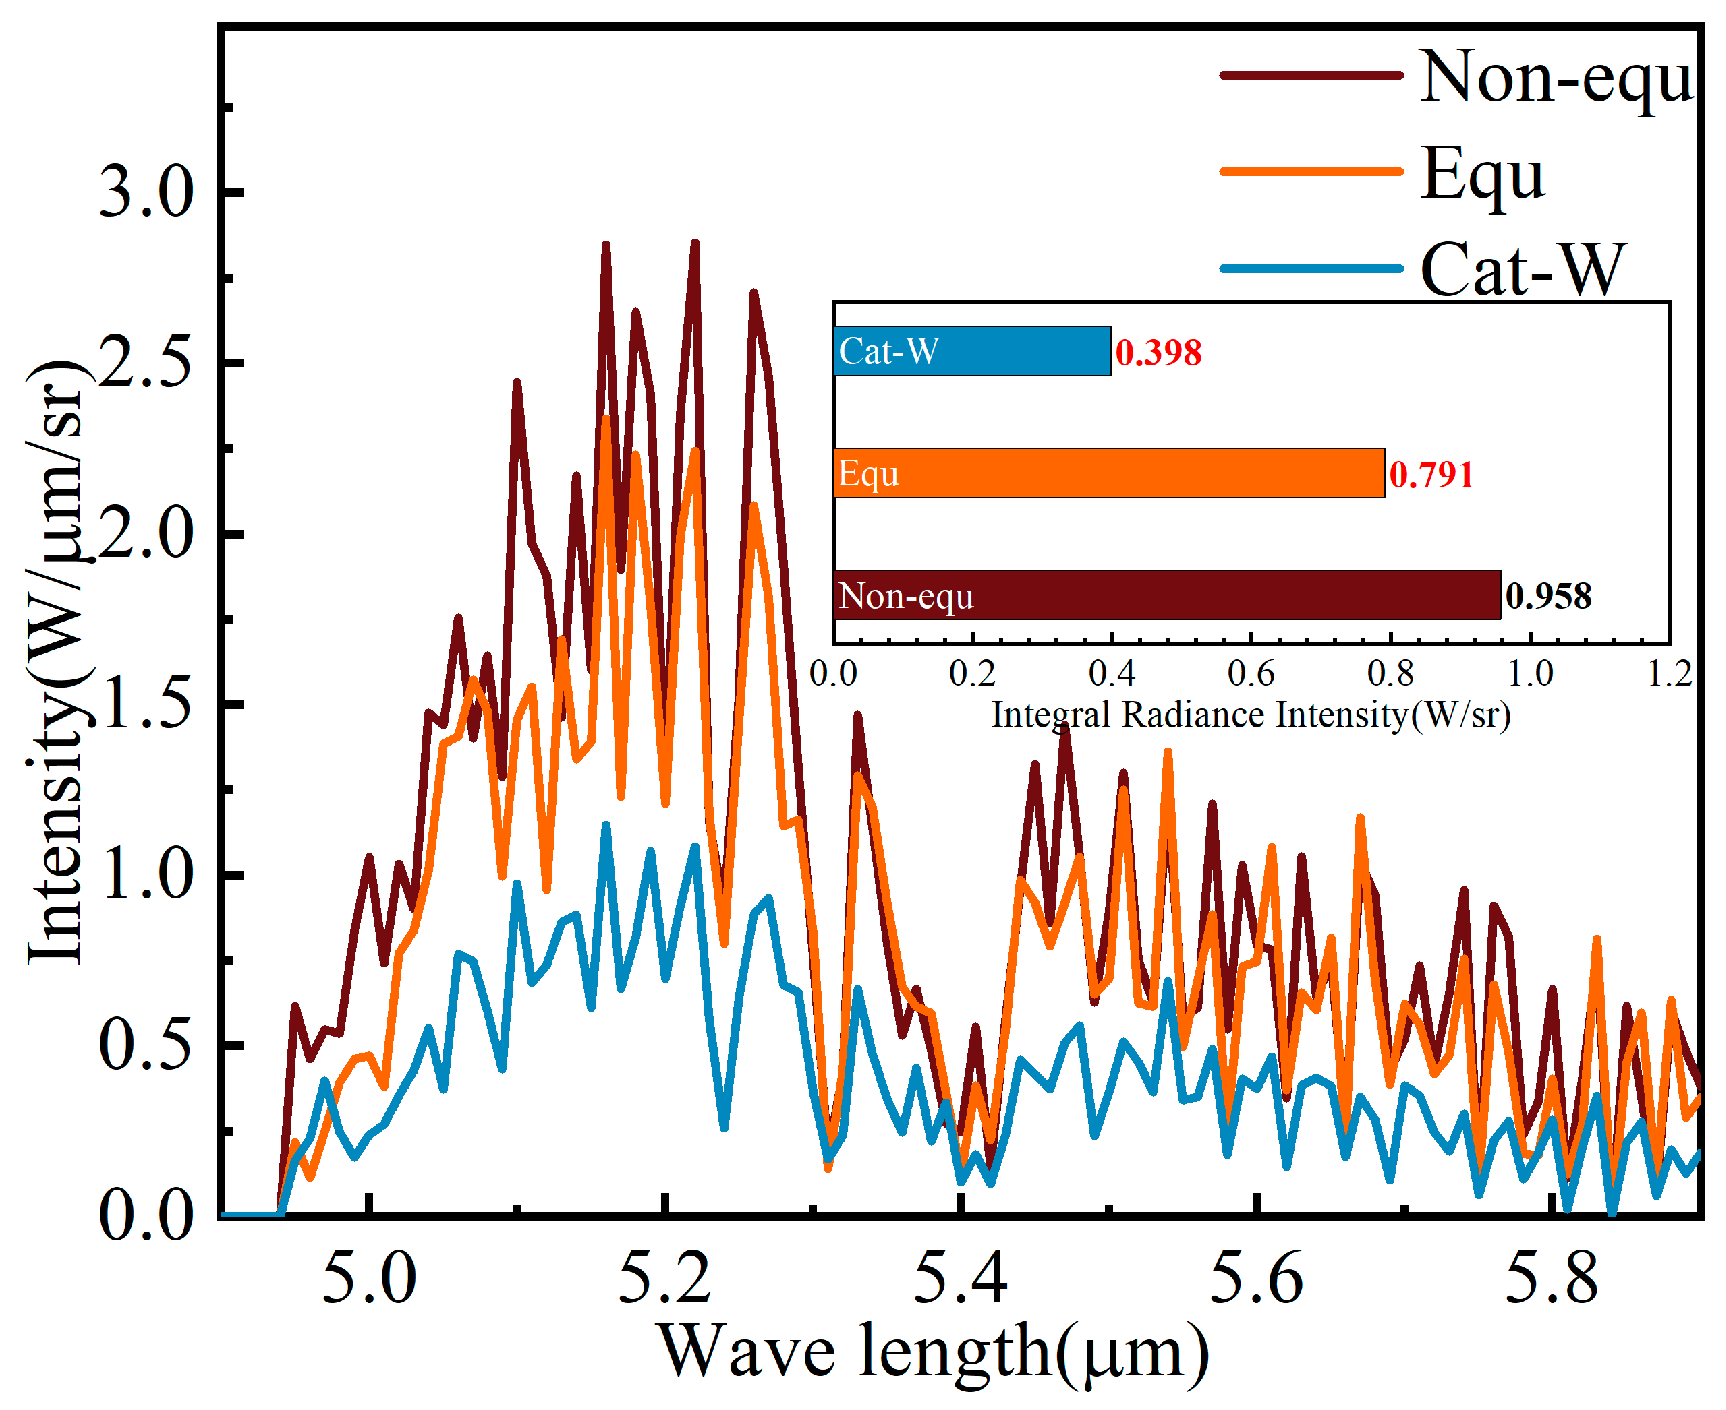
Figure 22 presents the SNB + RMCM calculation results of the infrared radiation intensity in the 4.9–5.9 μm band for three flow field models at a 90° horizontal detection angle. Despite the limitations imposed by the selected wavelength range, which obscure the transition peak of the spectral distribution, the radiation intensity peak for all three models still appears near 5.2 μm. The Non-equ model exhibits a radiation peak of approximately 2.75 W/μm/sr and an integrated radiation intensity of about 0.958 W/sr. The Equ model shows a radiation peak of about 2.3 W/μm/sr and an integrated radiation intensity of approximately 0.791 W/sr. The Cat-W model has a radiation peak of about 1.1 W/μm/sr and an integrated radiation intensity of approximately 0.398 W/sr.
The combined effects of gas temperature and the generated NO mole fraction result in the Equ model’s radiation intensity being slightly smaller than that of the Non-equ model. Although the Cat-W model has the smallest NO mole fraction in the surrounding flow field and a higher temperature, its calculated infrared radiation intensity is smaller than those of the Non-equ and Cat-W models.
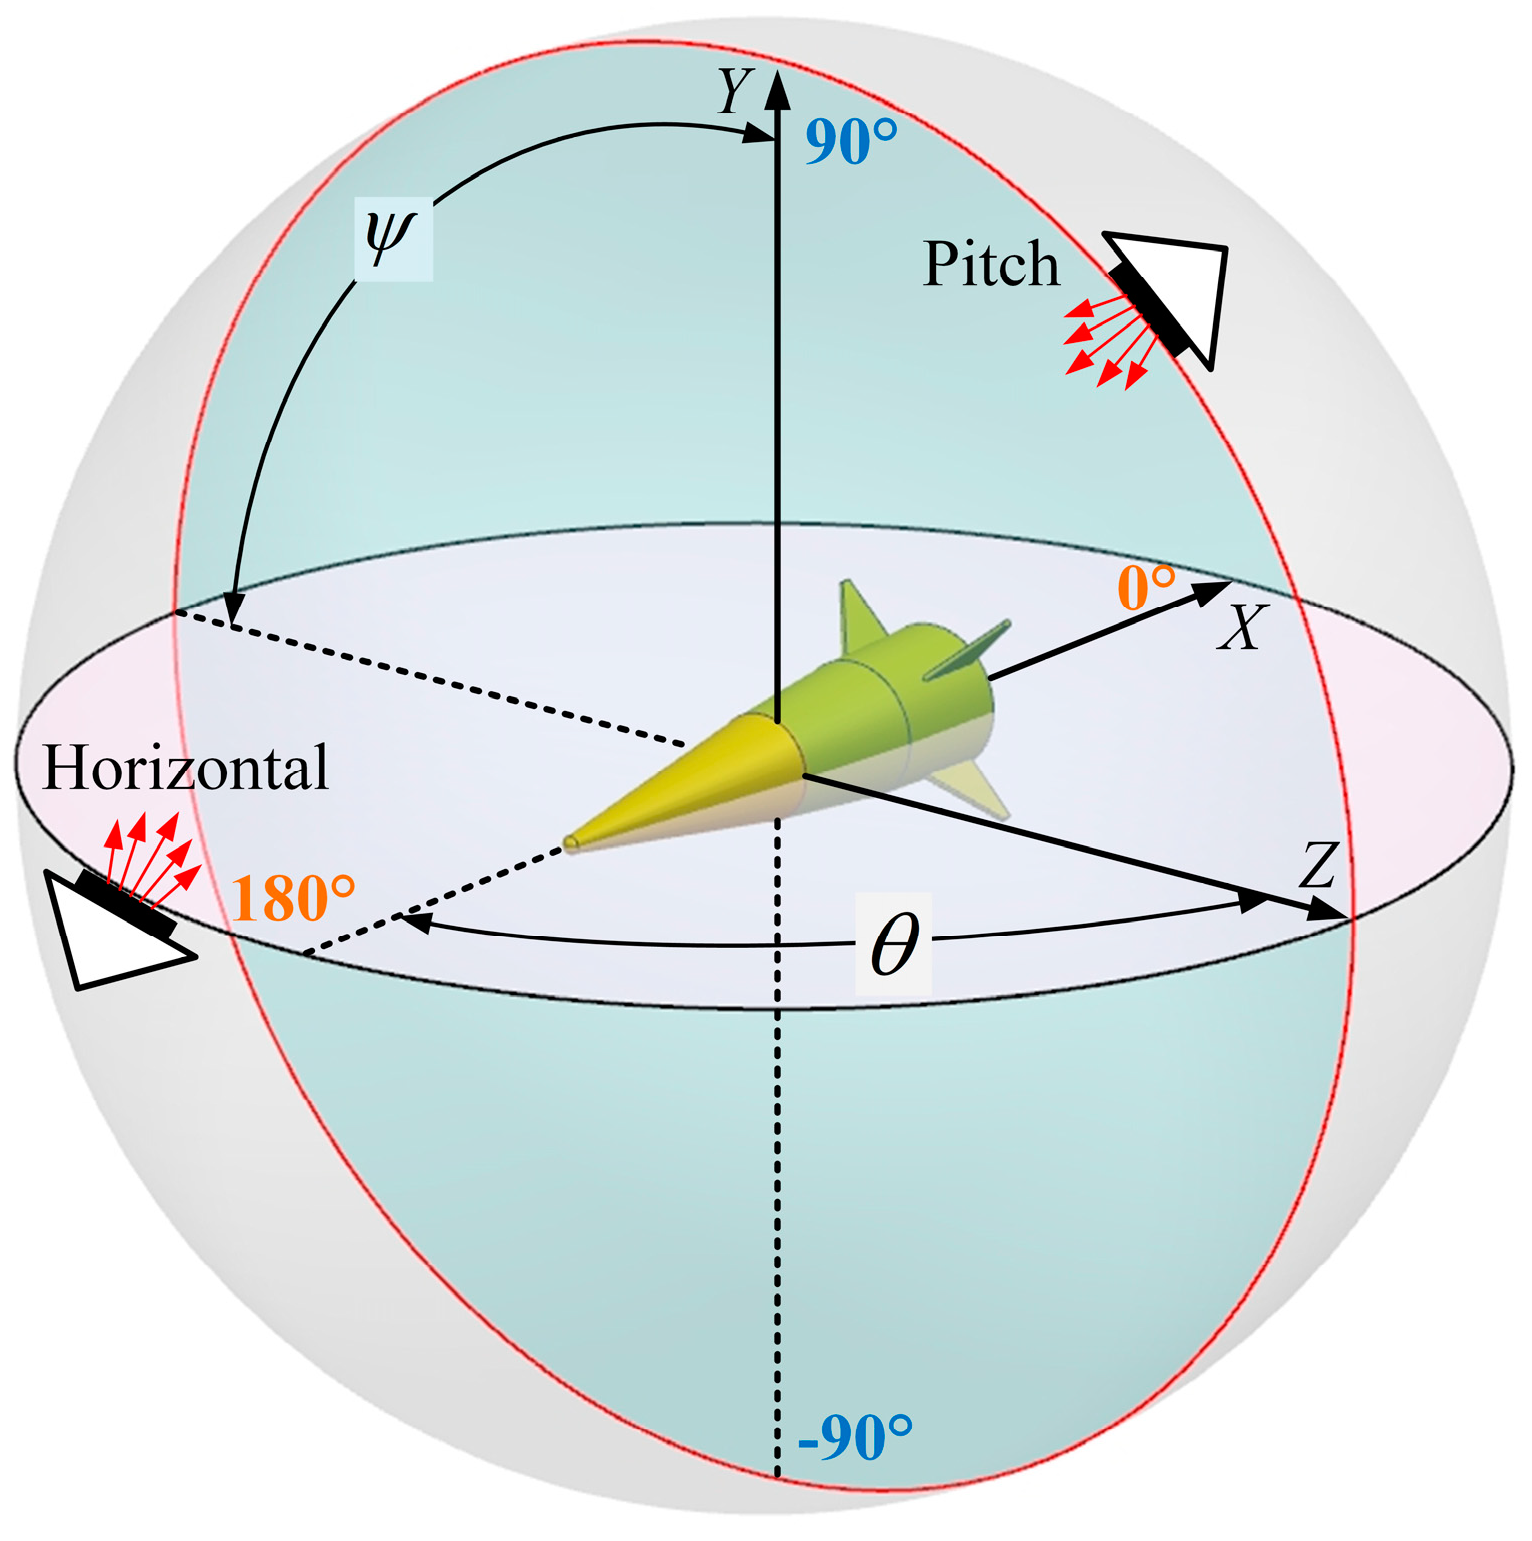
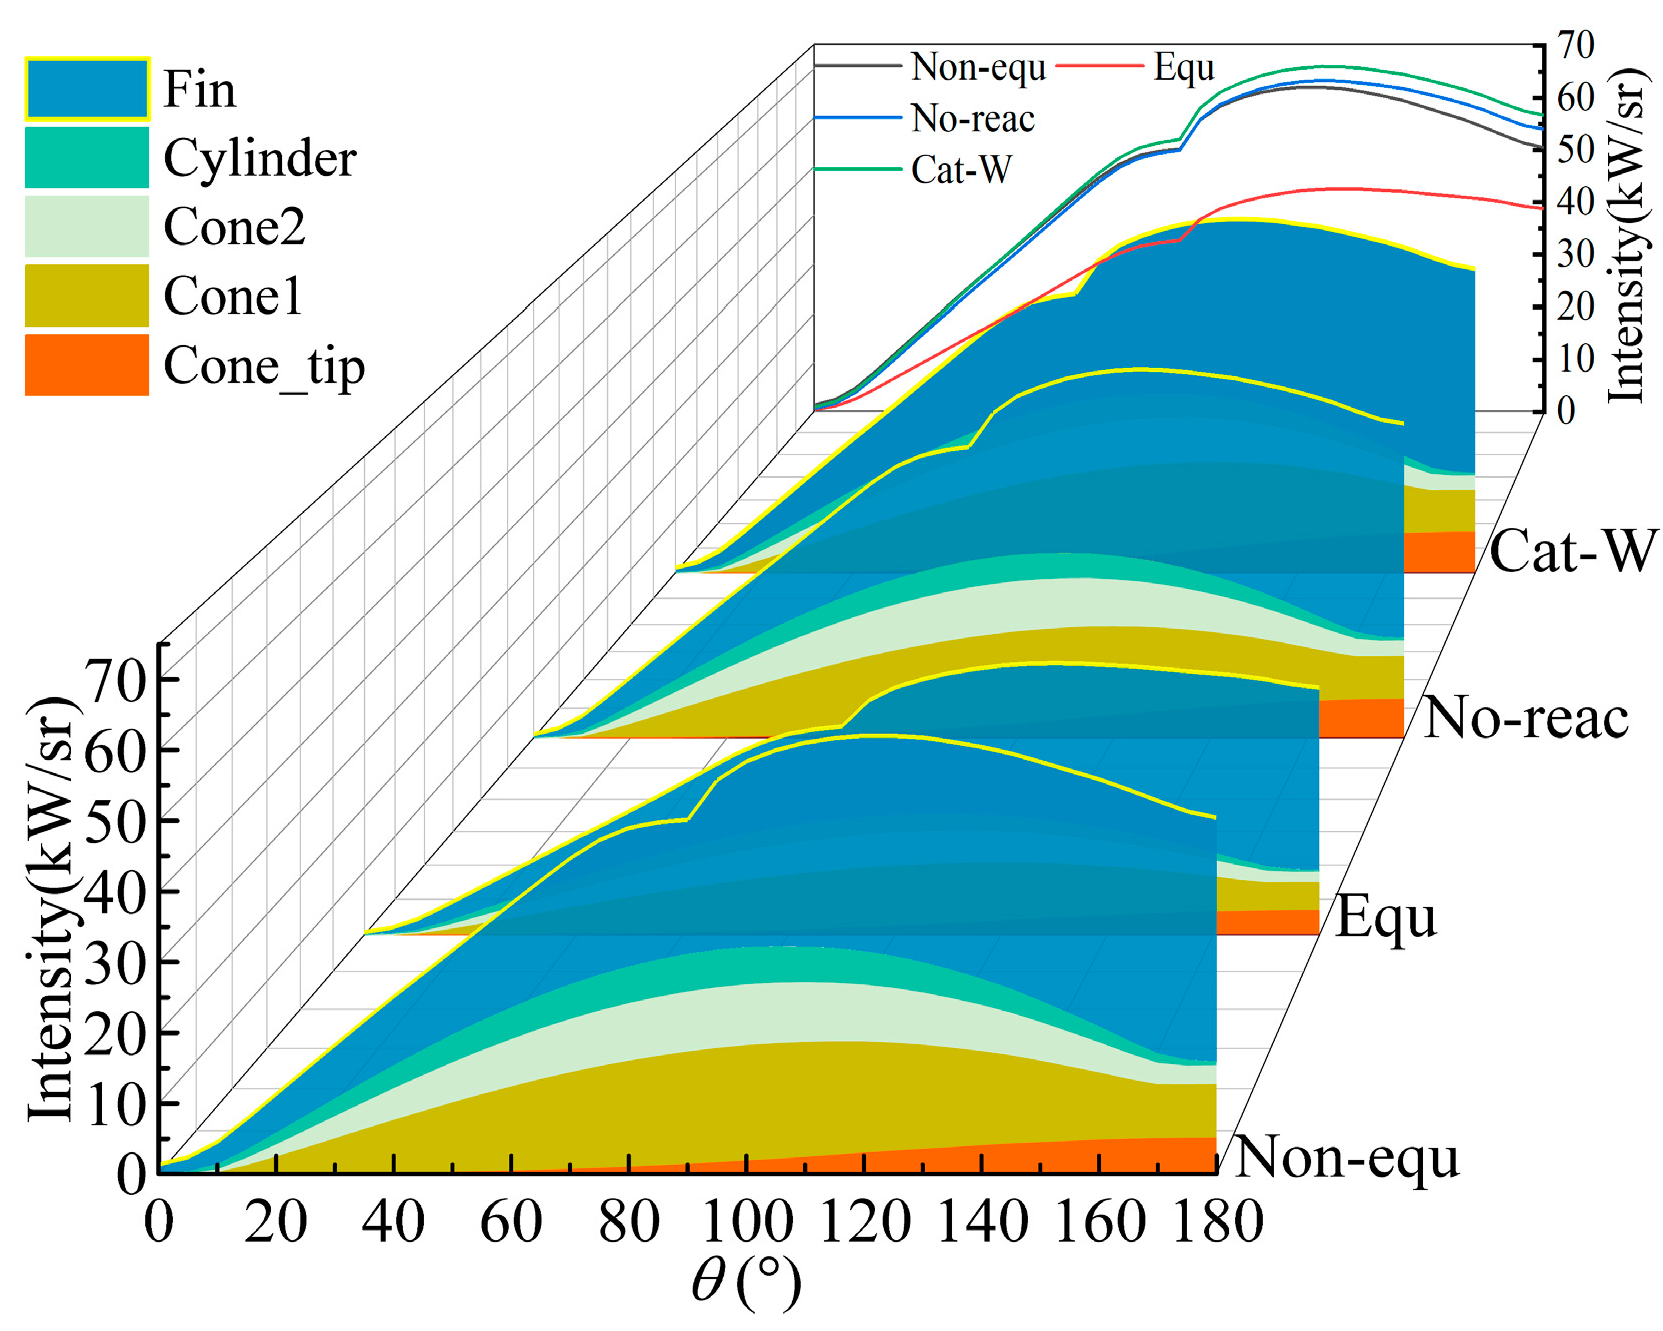
Figure 23 presents the integrated radiation intensity contributions of each missile component within the 1–3 μm band for four models across a horizontal detection plane of 0–180°. The upper right corner displays the total integrated infrared radiation intensity for each model. For all four models, as the horizontal detection angle expands from 0 to 90°, the visible area of the missile’s high-temperature wall enlarges, leading to an increase in the calculated infrared radiation intensity. This increase is consistent with Planck’s law, which states that the calculated value of infrared radiation intensity on the wall is a function of temperature and wavelength.
Interestingly, as the horizontal detection angle further increases from 90 to 180°, the infrared radiation intensity of the missile does not consistently rise. Instead, it peaks near 127°, after which the infrared radiation intensity decreases with the increasing detection angle. This pattern results from the combined effect of the shrinking visible area of the missile’s high-temperature wall and the rising average temperature of the visible missile wall.
In the 0–90° range, the Cat-W model’s radiation intensity is marginally higher than that of the Non-equ and No-reac models, but the overall difference is minimal. The Equ model exhibits the lowest calculated radiation intensity. In the 90–180° range, the differences between the Cat-W, Non-equ, and No-reac models become more pronounced. This divergence is primarily due to the increasing difference in the infrared radiation intensity of the nose cones of the three models as the detection angle widens. The total radiation intensity decreases in the order of Cat-W, No-reac, and Non-equ models, with the Equ model still showing the lowest calculated radiation intensity. In general, the fin and the first cone are the main contributors to the missile’s infrared radiation intensity.
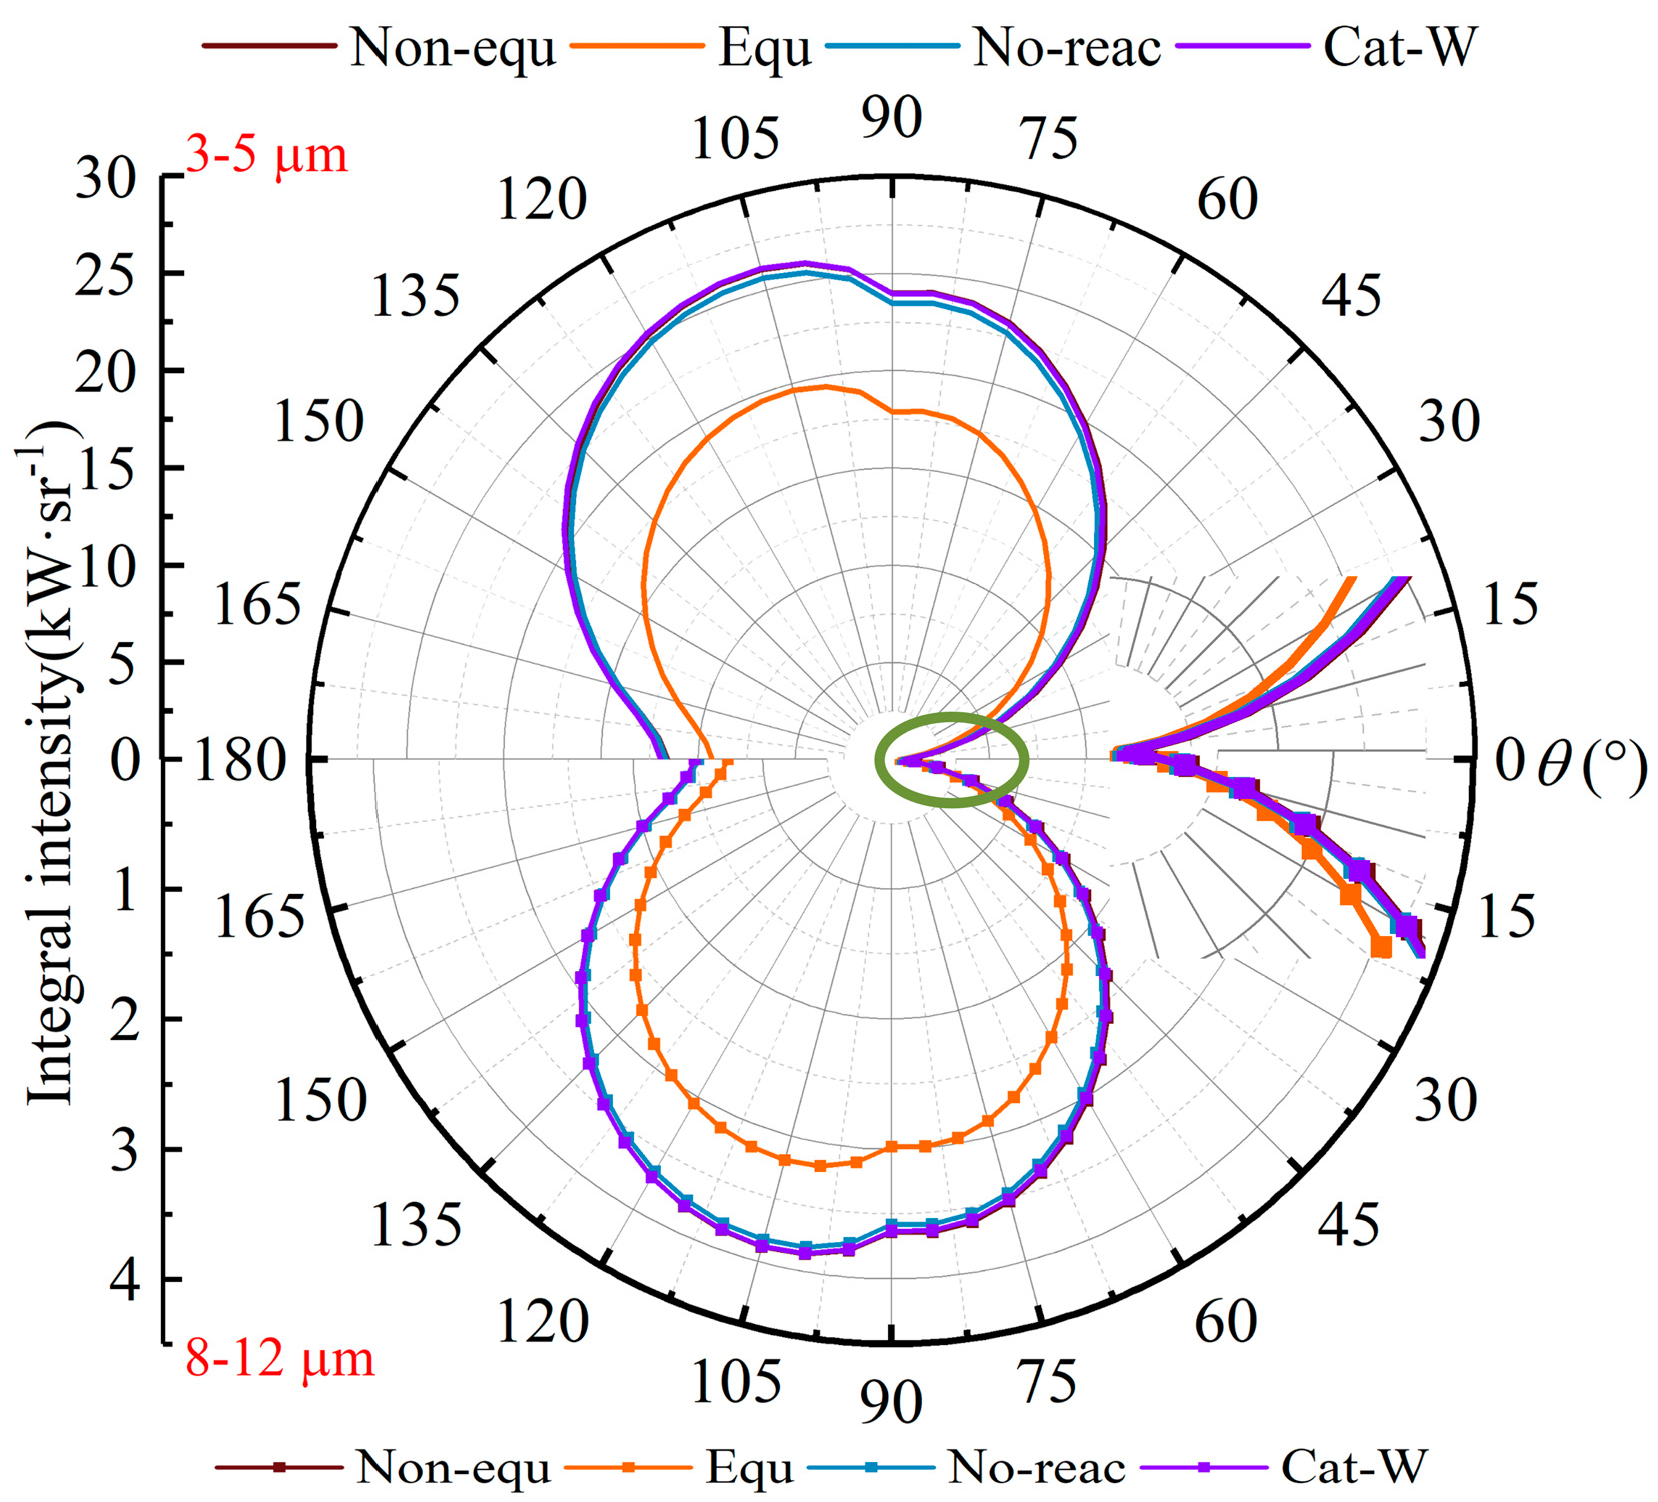
Figure 24 illustrates the integrated infrared radiation intensity of four missile models within the 3–5 μm and 8–12 μm bands across a horizontal detection plane of 0–180°. For all models, as the horizontal detection angle widens from 0 to 90°, the visible area of the missile’s high-temperature wall expands, leading to an increase in the calculated infrared radiation intensity in both bands.
As the detection angle further increases from 90 to 180°, the infrared radiation intensity of the missile in both bands peaks near 105°. Beyond this point, the infrared radiation intensity decreases with the increasing detection angle. This trend is a result of the combined effect of the decreasing visible area of the missile’s high-temperature wall and the increasing average temperature of the visible missile wall.
Referring to
Figure 23, the radiation intensity of the 3–5 μm band is typically about 40% of that of the 1–3 μm band, while the radiation intensity of the 8–12 μm band is generally about 6% of that of the 1–3 μm band. Moreover, the ratio of each model’s radiation intensity to the maximum value at the 180° detection angle diminishes as the wavelength increases. The difference ratio between the four models also decreases with increasing wavelength. This is in line with Planck’s law, which states that the calculated value of infrared radiation intensity on the wall is a function of temperature and wavelength. As the wavelength lengthens, the relative influence of temperature on the radiation intensity value lessens. The total radiation intensity of the Cat-W, No-reac, and Non-equ models shows little variation, with the Equ model consistently exhibiting the lowest calculated radiation intensity.
4.4. The Effect of High-Emissivity Coating Failure on Missile Radiation Characteristics
High-emissivity missile coatings can exhibit failure behaviors such as cracking, ablation, and peeling under extreme thermal conditions of high temperature and velocity. To analyze the impact of these failures on the infrared radiation characteristics of solid missiles, a new high-emissivity coating material referenced in Reference [
36] was selected.
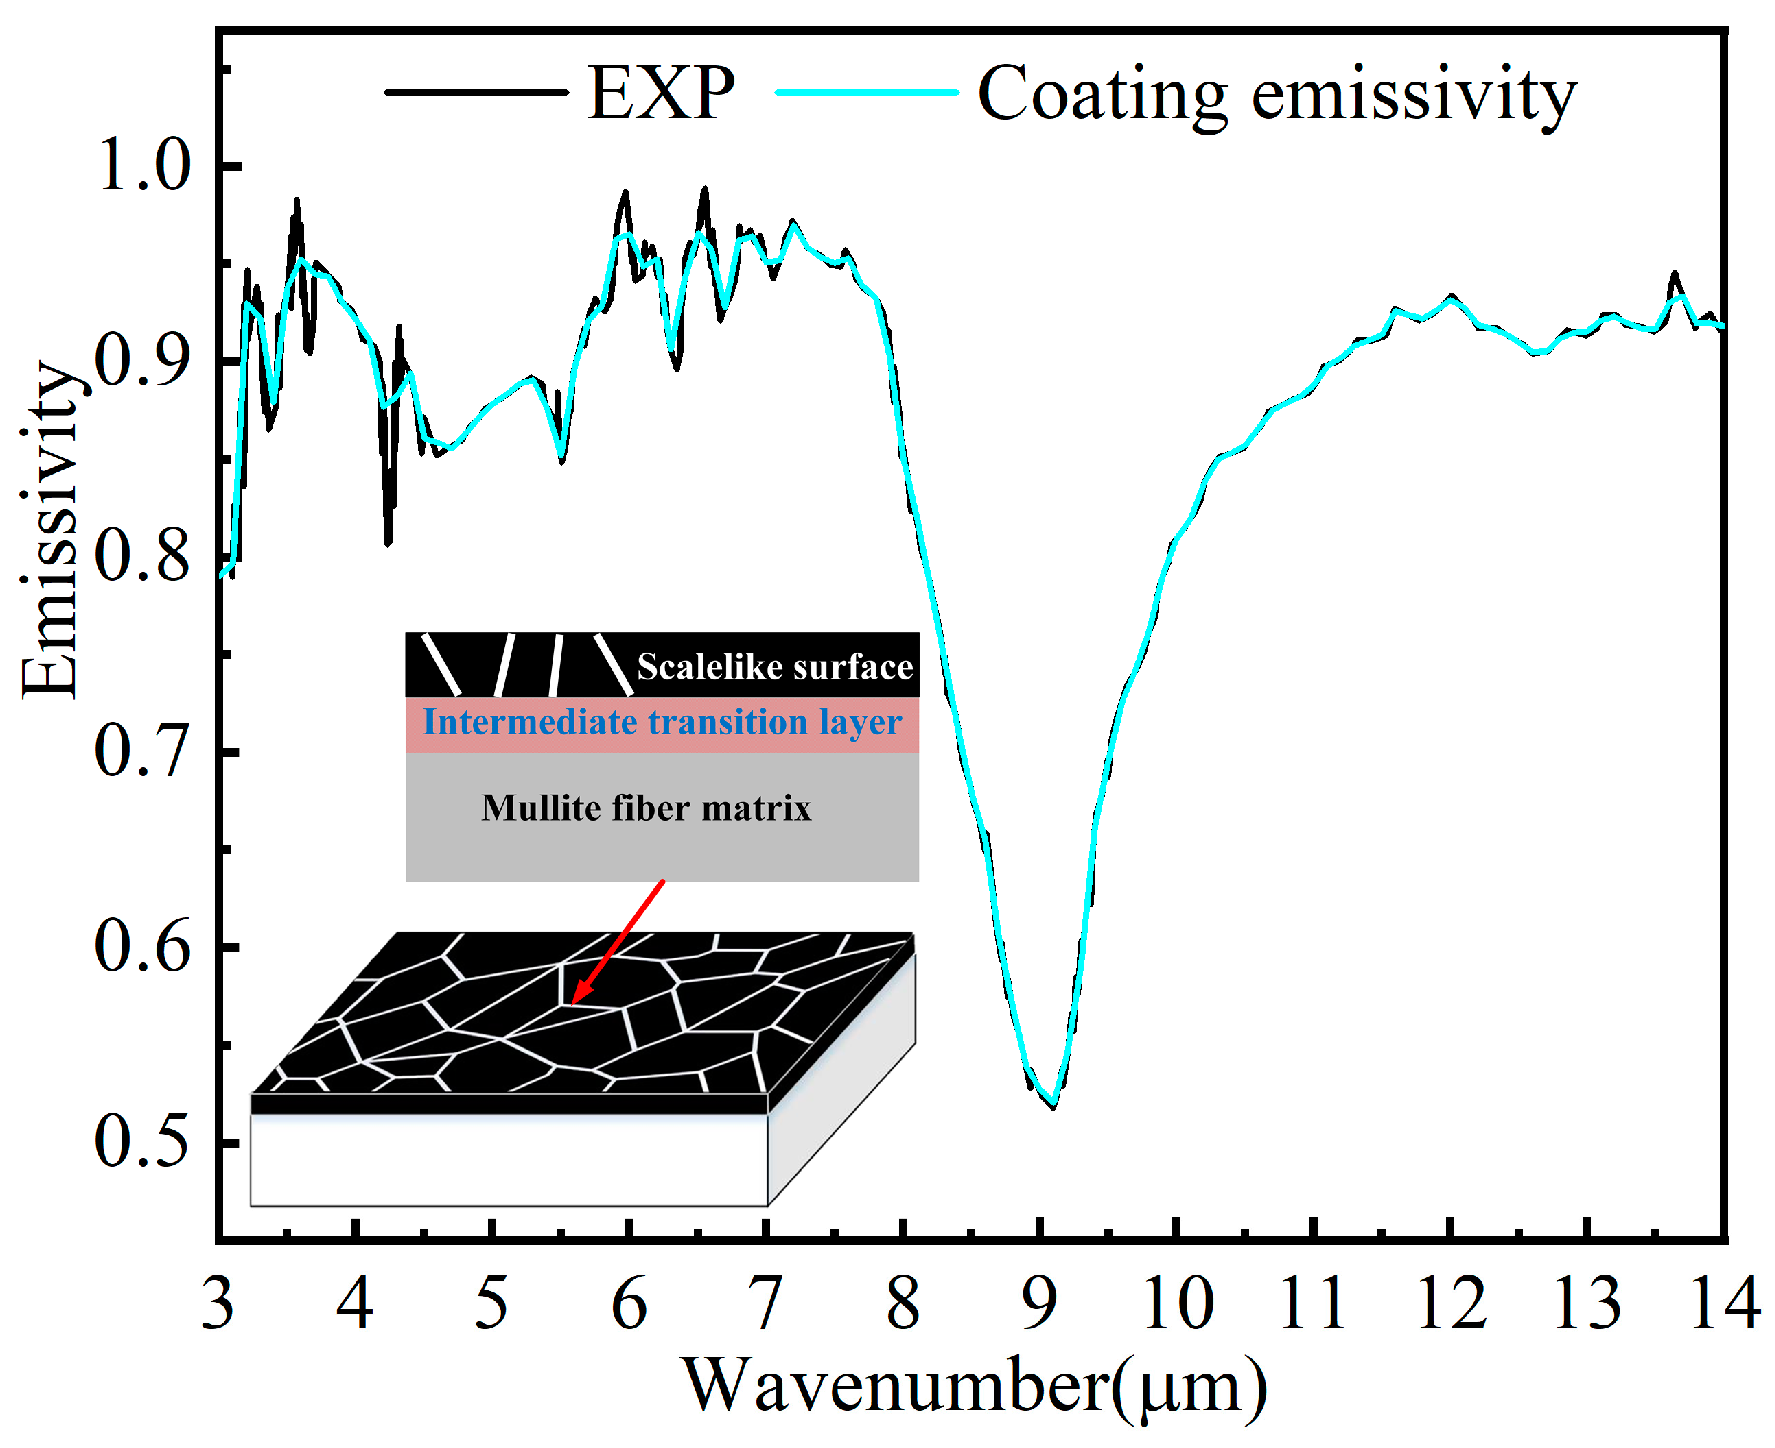
Figure 25 provides a schematic diagram of this coating material and its emissivity within the 3–14 μm band. The coating comprises a scale-like surface layer, an intermediate transition layer, and a mullite fiber matrix. The total hemispheric emissivity of the coating is approximately 0.85, with a notable infrared absorption peak at 8–10 μm. This peak primarily results from the asymmetric Si-O stretching vibration absorption of SiO
4 tetrahedra [
37], a common occurrence in many silicate glasses. An additional absorption peak at 4–6 μm is attributed to the Bo and Si-O bonds in borosilicate glass [
38]. The experimentally measured coating emissivity, fitted with a wavelength interval of 0.1 μm in the 3–14 μm band, was used as the calculated wavelength of the SNB + RMCM program.
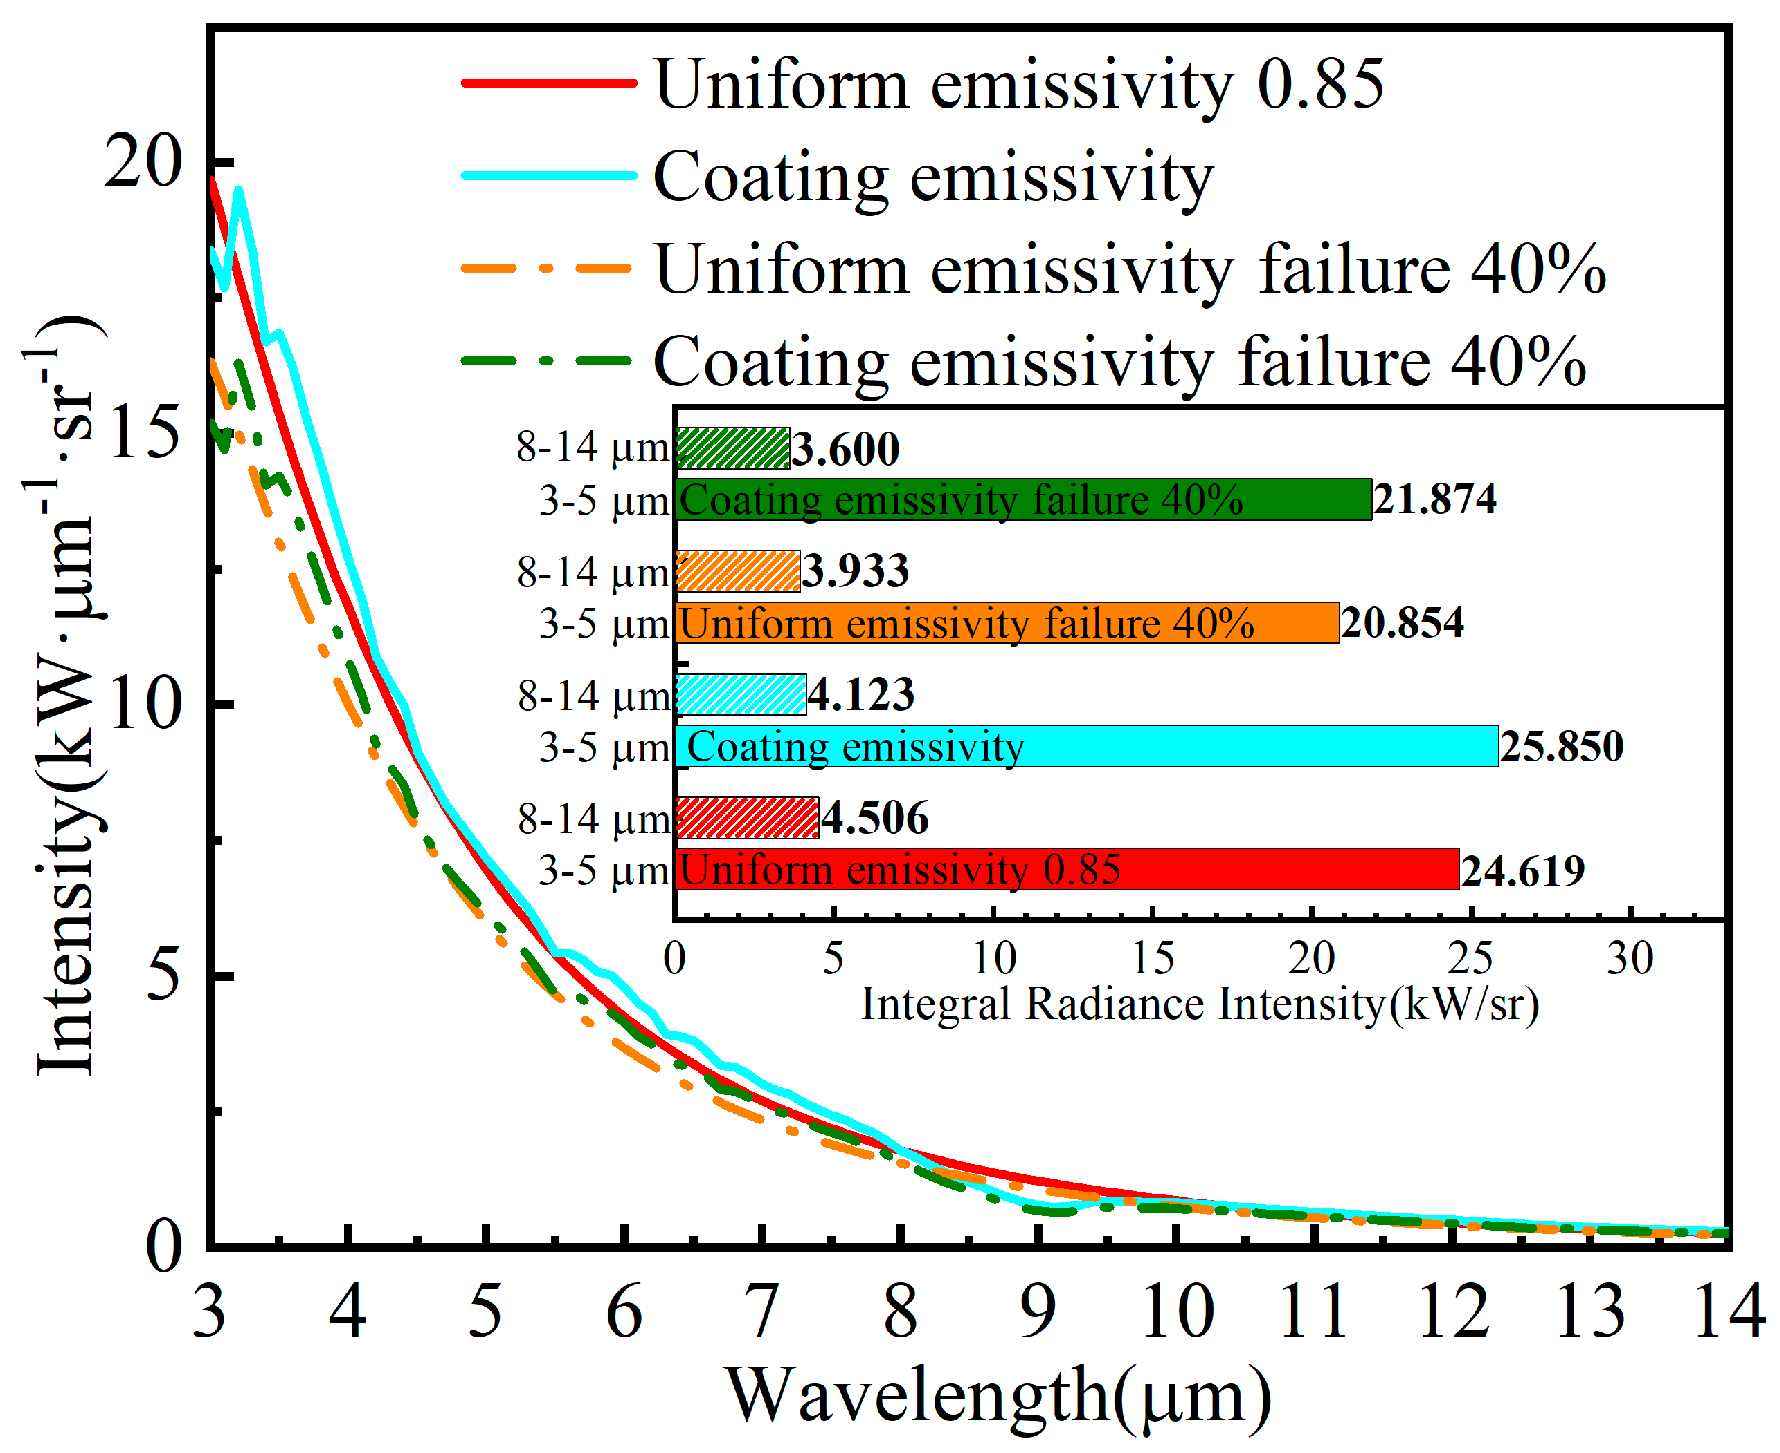
Figure 26 compares the spectral radiation intensity of two solid missile wall models: one using a uniform emissivity of 0.85 and the other using the experimentally measured coating emissivity. The figure reveals that the infrared radiation intensity of the real coating emissivity solid wall exceeds that of the uniform emissivity model in the 3–8 μm and 10–14 μm bands but falls short in the 8–10 μm band. This discrepancy is due to the Si-O absorption peak depicted in
Figure 25.
Moreover, the integrated radiation intensity of the real coating emissivity solid wall in the 3–5 μm band is roughly 5% higher than that of the uniform emissivity model, while the integrated radiation intensity in the 8–14 μm band is about 8.51% lower. However, according to Wien’s displacement law, the wavelength corresponding to the maximum blackbody light radiation emission is inversely proportional to the absolute temperature of the blackbody. As the temperature rises, a greater proportion of radiation occurs in the short wavelength range. Given that the radiant energy of high-emissivity, high-temperature-resistant coatings in the short wavelength range accounts for over 90% of the radiated energy in the full wavelength range, the thermal radiation performance of the real coating emissivity solid wall is superior in the overall band.
Coating failure is an extremely complex process in real-world scenarios. This article uses the thermal shock characteristic test results from Reference [
36] as a reference and calculates the thermal stress of the high-emissivity coating according to the Tsui and Stoney formula [
39]. Simplifying the coating failure mechanism, it is assumed that the high-emissivity coating will fail if the thermal stress exceeds 40 MPa.
Figure 26 displays the spectral radiation intensity of the two models—uniform emissivity and real coating emissivity—after a 40% failure in coating emissivity. Following partial coating failure, the integrated radiation intensity of the real coating emissivity solid wall in the 3–5 μm band decreases by about 15.38%, and the integrated radiation intensity in the 8–14 μm band decreases by about 12.67%. The uniform emissivity solid wall sees a decrease in the integrated radiation intensity in the 3–5 μm band by approximately 15.29% and a decrease in the integrated radiation intensity in the 8–14 μm band by approximately 12.72%.
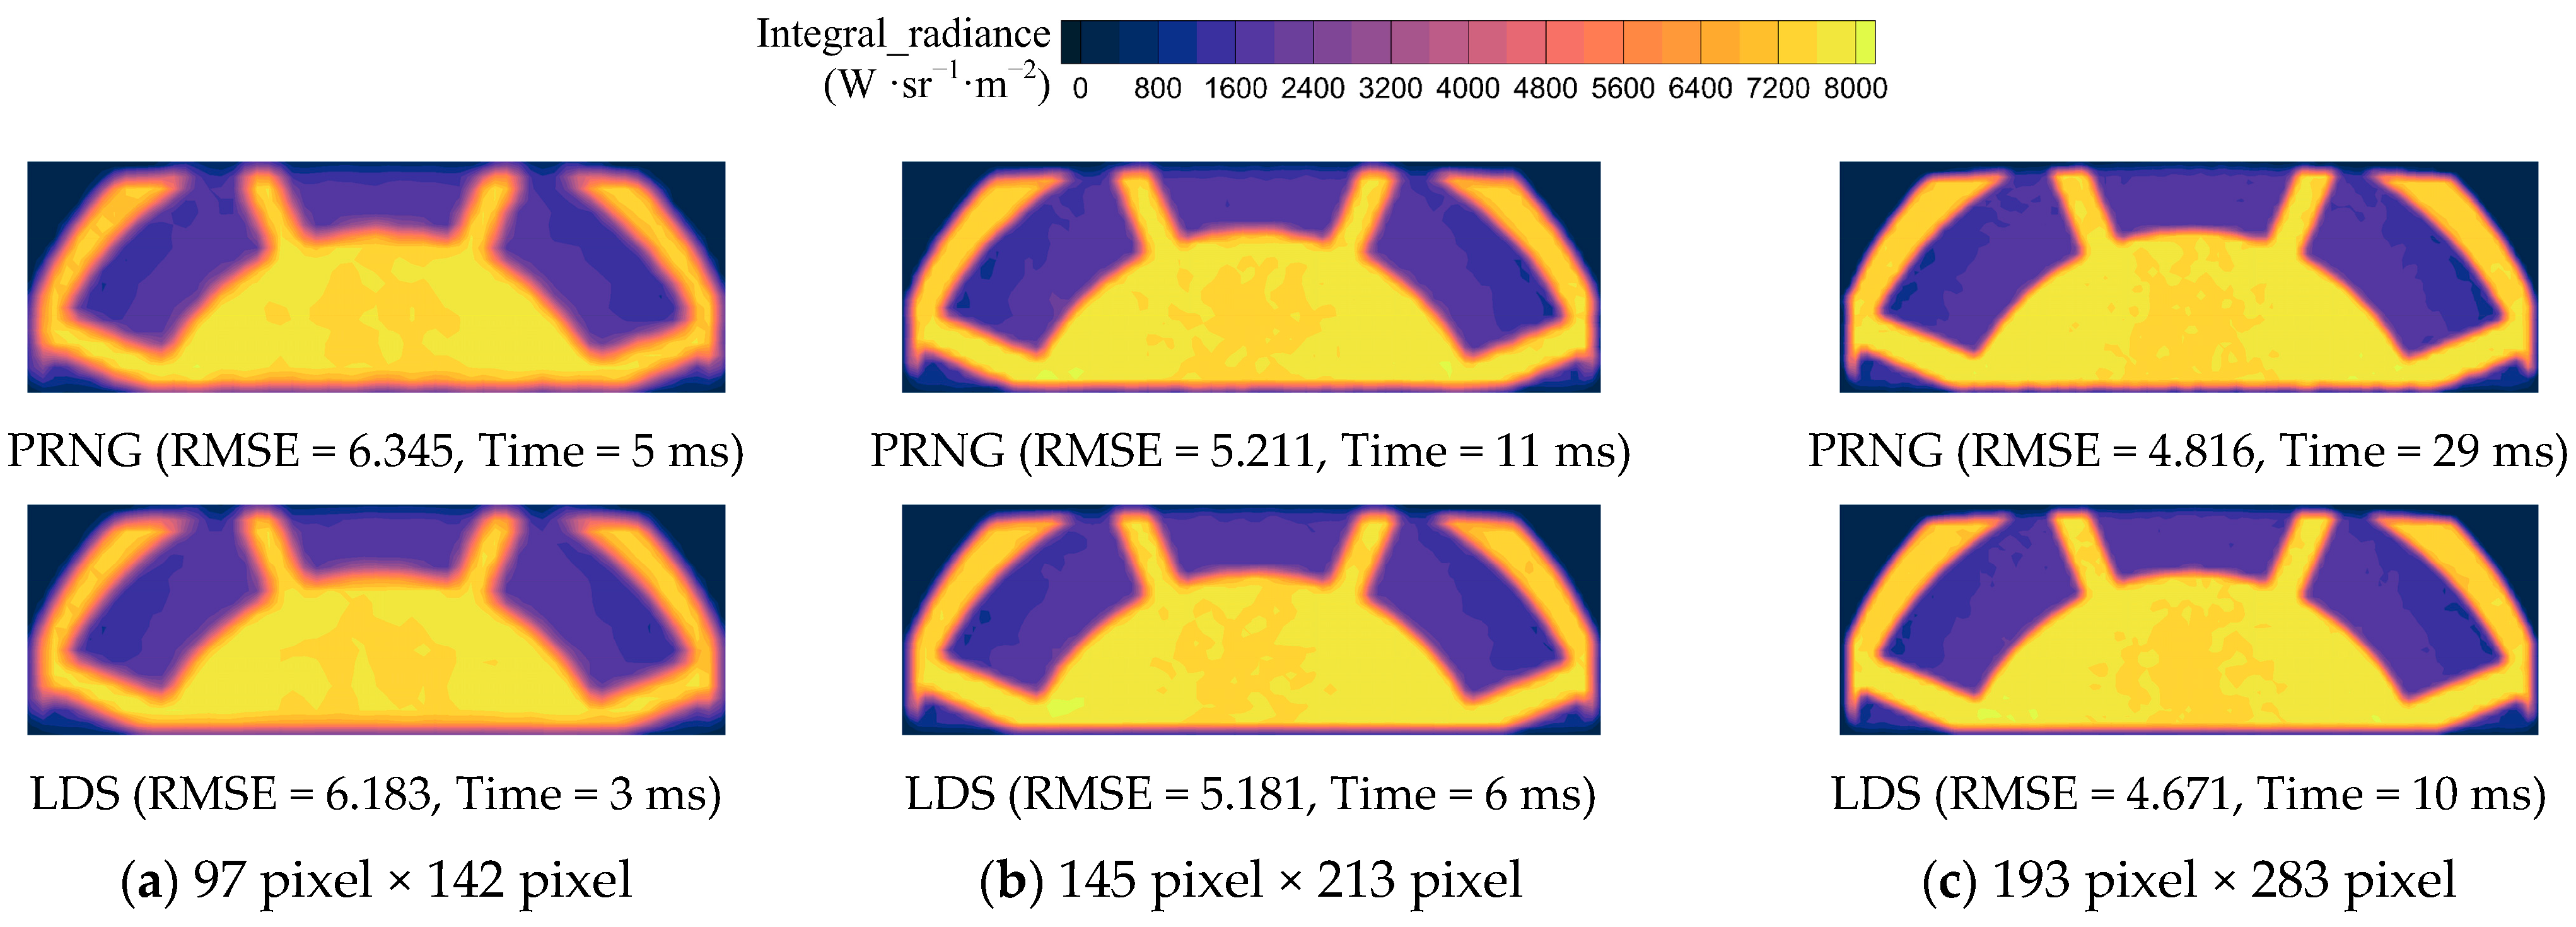
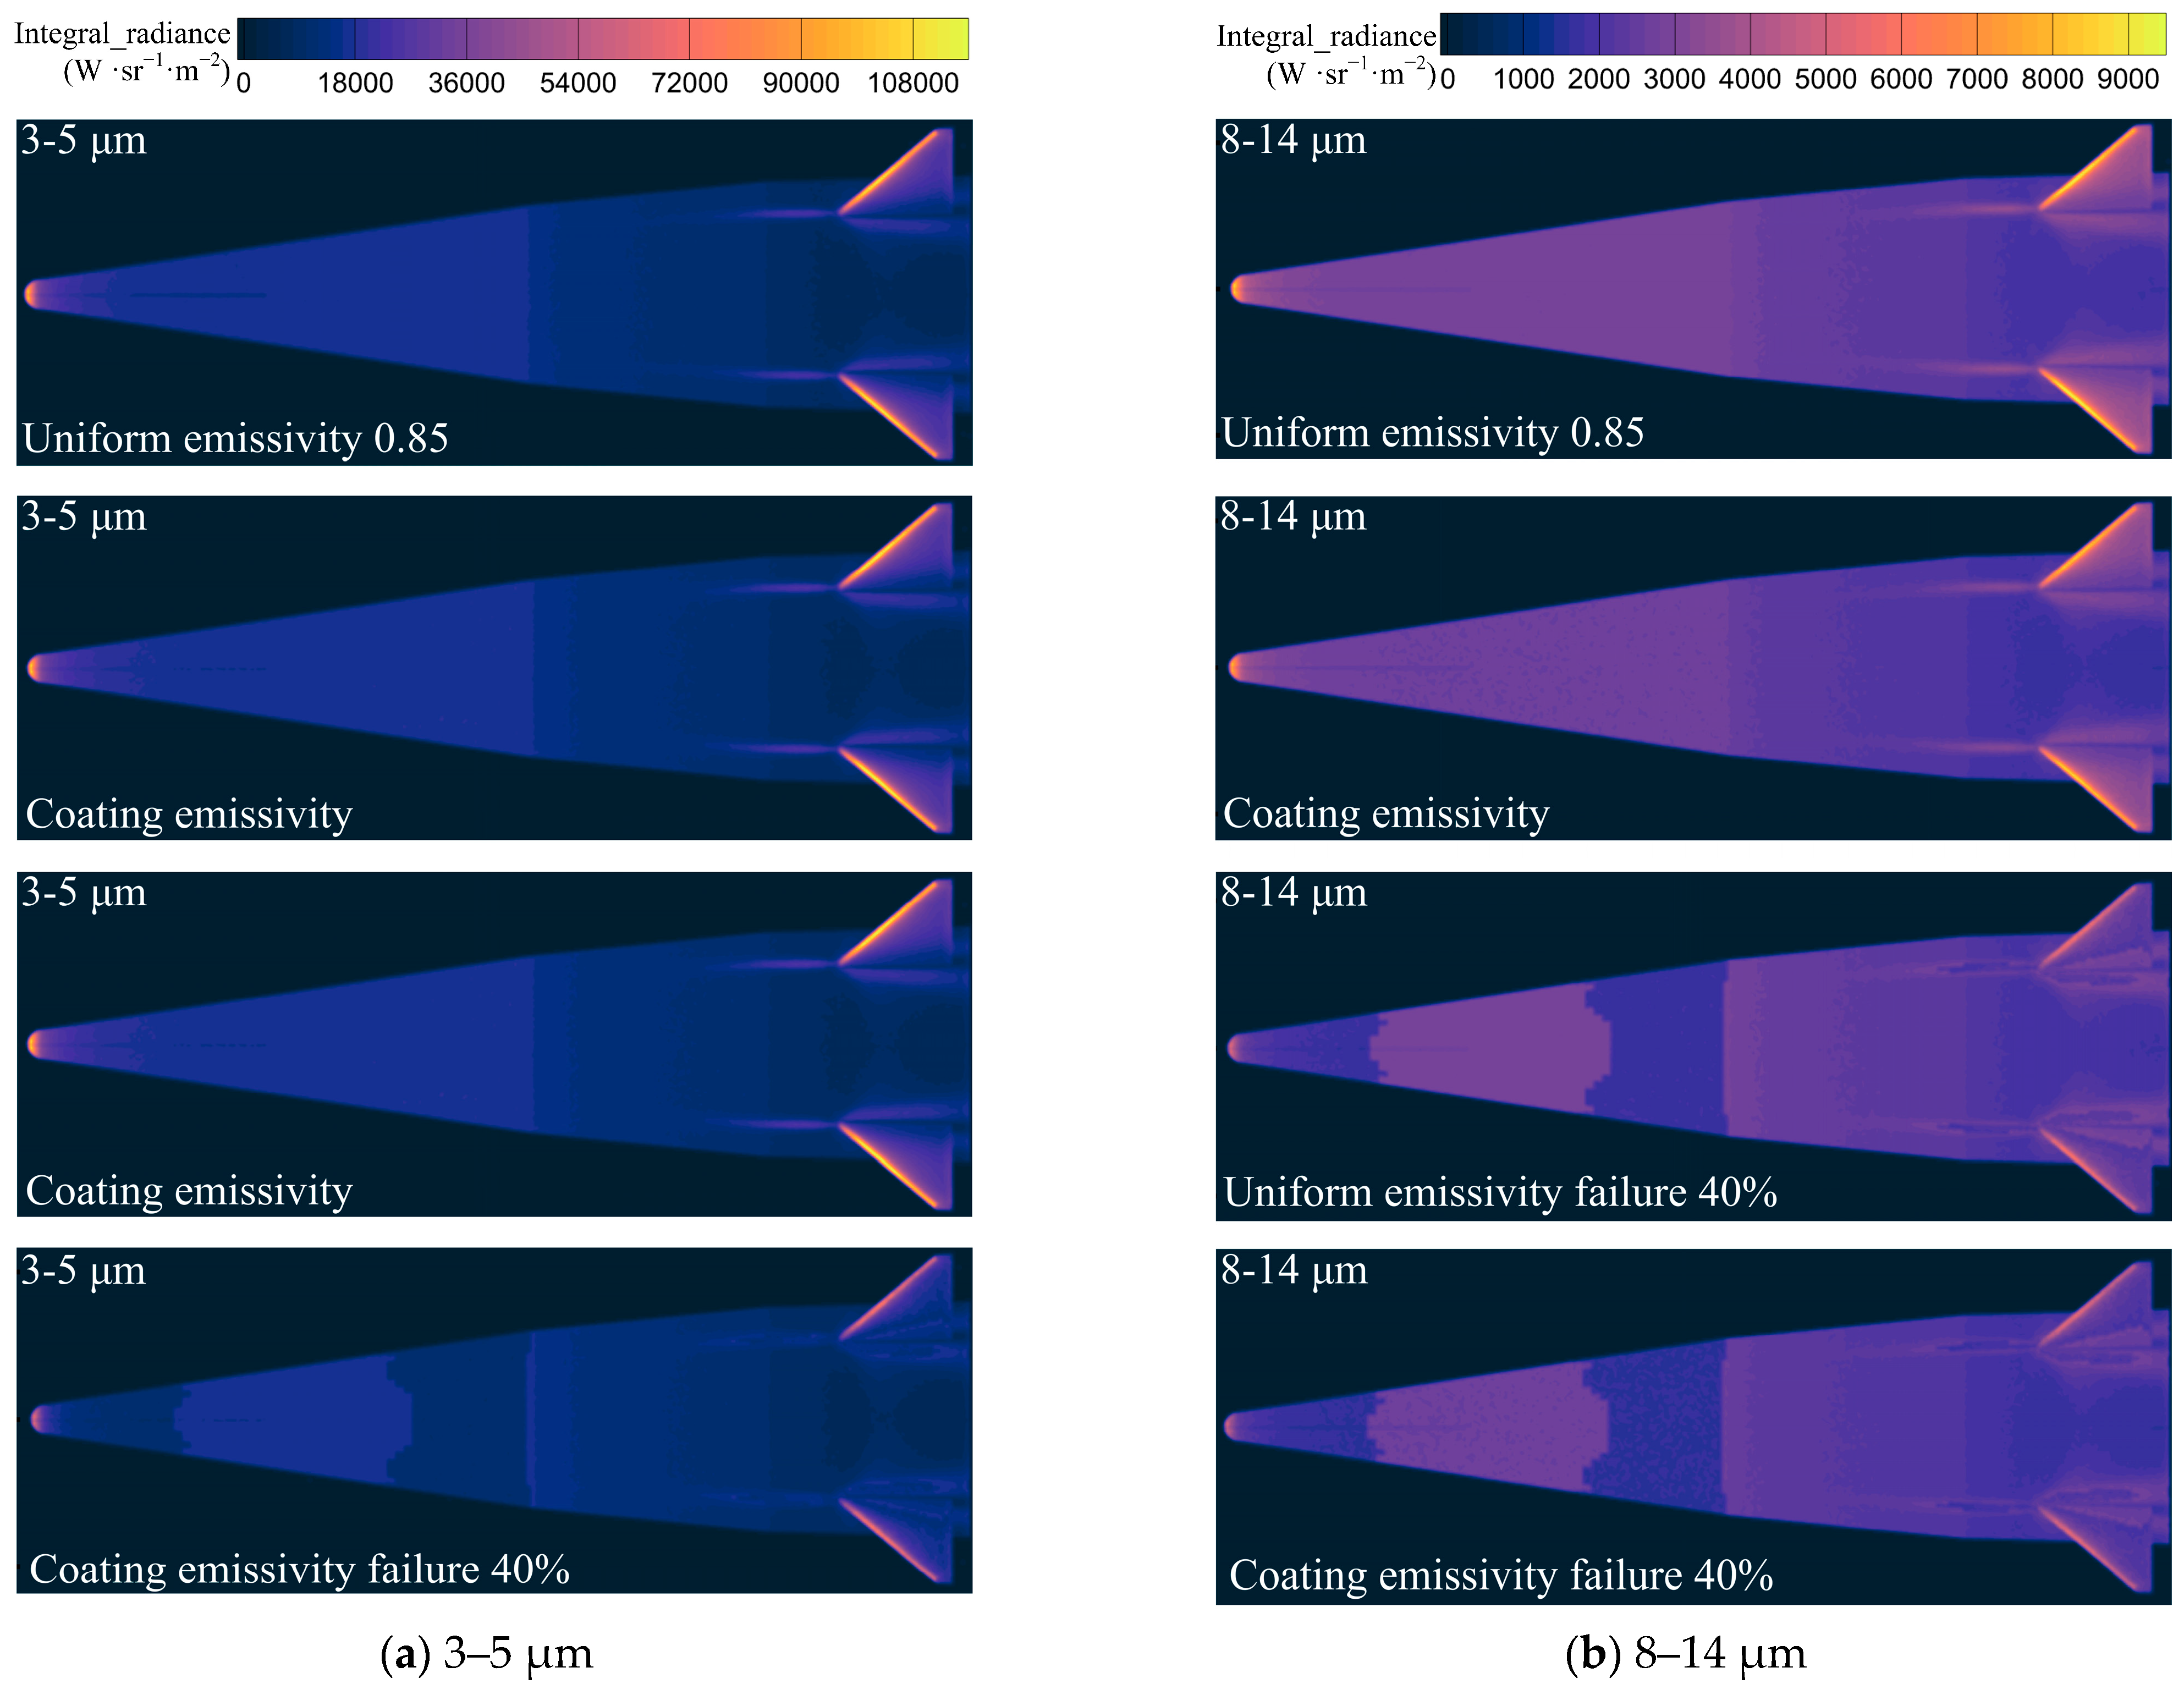
Figure 27 depicts the integrated radiance of the missile’s solid wall surface at a 90° horizontal detection angle. In the 3–5 μm detection band, the difference in infrared integrated radiance caused by the temperature variation of the wall is more pronounced than in the 8–14 μm band. A comparison between
Figure 27a,b reveals that the 3–5 μm integrated radiance of the real coating emissivity model at the missile head and fin positions slightly exceeds that of the uniform emissivity model. Conversely, in the 8–14 μm band, the situation is reversed, consistent with the analysis presented in
Figure 26. Upon comparing the integrated radiance of the four models in
Figure 27, it becomes evident that, under the coating failure assumption, the primary failure locations are the missile head and fin. After a 40% failure in emissivity, both the uniform emissivity and the integrated radiation intensity of the real coating emissivity model significantly decrease at the missile head and fin positions.
