Review

Physical Modeling of Structure and Dynamics of Concentrated, Tornado-like Vortices (A Review)

by
Aleksey Yu. Varaksin
1 and
Sergei V. Ryzhkov
2,*
1
Joint Institute for High Temperatures, Russian Academy of Sciences, Moscow 125412, Russia
2
Power Engineering Faculty, Bauman Moscow State Technical University, Moscow 105005, Russia
*
Author to whom correspondence should be addressed.
Aerospace 2024, 11(10), 800; https://doi.org/10.3390/aerospace11100800
Submission received: 25 July 2024 / Revised: 21 September 2024 / Accepted: 26 September 2024 / Published: 29 September 2024
(This article belongs to the Section Aeronautics)

Abstract

:
Physical modeling is essential for developing the theory of concentrated, tornado-like vortices. Physical modeling data are crucial for interpreting real tornado field measurements and mathematical modeling data. This review focuses on describing and analyzing the results of a physical modeling of the structure and dynamics of tornado-like vortices, which are laboratory analogs of the vortex structures observed in nature (such as “dust devils” and air tornadoes). This review discusses studies on various types of concentrated vortices in laboratory conditions: (i) wall-bounded, stationary, and tornado-like vortices, (ii) wall-free, quasi-stationary, and tornado-like vortices, and (iii) wall-free, non-stationary, and tornado-like vortices. In our opinion, further progress in the development of the theory of non-stationary concentrated tornado-like vortices will determine the possibility of setting up the following studies: conducting experiments in order to study the mechanisms of vortex generation near the surface, determining the factors contributing to the stabilization (strengthening) and destabilization (weakening) of the generated vortices, and to find methods and means of controlling vortices.

1. Introduction

Vortical motion is one of the most common states of a moving continuous medium [1,2,3,4]. To date, a colossal amount of material has been accumulated related to the study of various vortical structures in jet flows, turbulent boundary layers, separation flows around bodies, the flows of conducting fluids in electromagnetic fields, etc. Among the wide variety of vortical structures, concentrated vortices stand out—compact spatial areas characterized by high vorticity values, surrounded by a flow with significantly lower vorticity (in the case of ideal fluid—zero vorticity) [2,3,4]. Concentrated vortices are widely spread in the Earth’s atmosphere [5,6,7,8] and on the Sun [9,10,11].
The main problems in studying destructive atmospheric vortices (hurricanes, tornadoes, etc.) are the following:
(i)
Estimation of the probability of a natural disaster occurring in a specific area of space within a certain time period;
(ii)
Prediction of the characteristics (structure) of a formed natural disaster;
(iii)
Prediction of the changes in characteristics over time (dynamics) along the path of the natural disaster propagation;
(iv)
Investigation of the possibilities for changing the path of propagation, as well as the weakening and destroying (decaying) of the vortical structure [12,13].
Based on the main problems in studying the atmospheric vortices described above, it is not difficult to formulate the main tasks of physical modeling of laboratory vortex analogs:
(i)
Determining the conditions for vortex generation (air temperature values, temperature gradients, etc.);
(ii)
Studying their stability (vortex characteristics and their change over time);
(iii)
Searching for the possibility to control their parameters (changing of the propagation path, weakening, and destruction).
Physical modeling is an essential tool in building the theory of concentrated, tornado-like vortices. The results of laboratory research are necessary for interpreting existing natural observations and measurements [14,15,16,17,18], as well as for providing a reliable foundation for improving new methods of mathematical modeling of vortices [19,20,21,22,23,24,25,26,27].
The subject of this review is the description and analysis of the results of a physical modeling of the structure and dynamics of tornado-like vortices, which are laboratory analogs of the vortical structures observed in nature (dust devils, air tornadoes, etc.).
In general, the same methods of classical gas dynamics are used to study (visualization and diagnostics) tornado-like vortices. Note that, in comparison with the study of coherent vortex structures in the boundary layer, there is one complicating feature associated with the fact that the place of generation of the convective vortex is a priori unknown.
The main dimensionless parameter that determines the vortex structure is the swirl parameter. There are several approaches to determining this parameter (they are described in the text of our paper). The authors of the analyzed works used different approaches—specific values of the swirl parameter in different works are given in the text of the paper. Moreover, in early studies, the authors often defined the degree of swirl—either a weak swirl or strong swirl.
This review is structured as follows. Section 2 is dedicated to the early research on vertical, concentrated air vortices. Section 3 presents and analyzes the results of studies on bounded, wall stationary air vortices. Section 4 focuses on the analysis of works studying unbounded, quasi-stationary air vortices. Section 5 presents and analyzes the results of research on free, non-stationary air vortices. In conclusion, the main findings and directions for further research on tornado-like vortices are summarized.

2. Early Studies of Concentrated, Tornado-like Vortices

To generate a vortex flow, it is necessary to create two conditions: (1) the presence of an ascending flow; and (2) the presence of swirl (circulation).
Let us explain the meaning of the main terms used below. Concentrated vortices are compact regions characterized by increased vorticity and surrounded regions with significantly lower vorticity (zero in the case of an ideal fluid). Wall-bounded vortices are vortices created in chambers with walls. Wall-free vortices are vortices created in large-volume rooms (the walls do not affect the formation of the vortex and are located at a large distance). Stationary vortices are vortices in which the distributions of all time-averaged velocity components do not depend on time, and they do not move in space. Quasi-stationary vortices are vortices whose movement is carried out in a forced manner. Non-stationary vortices are vortices characterized by a significant non-stationarity of averaged and fluctuation parameters, and they are also moving in space.
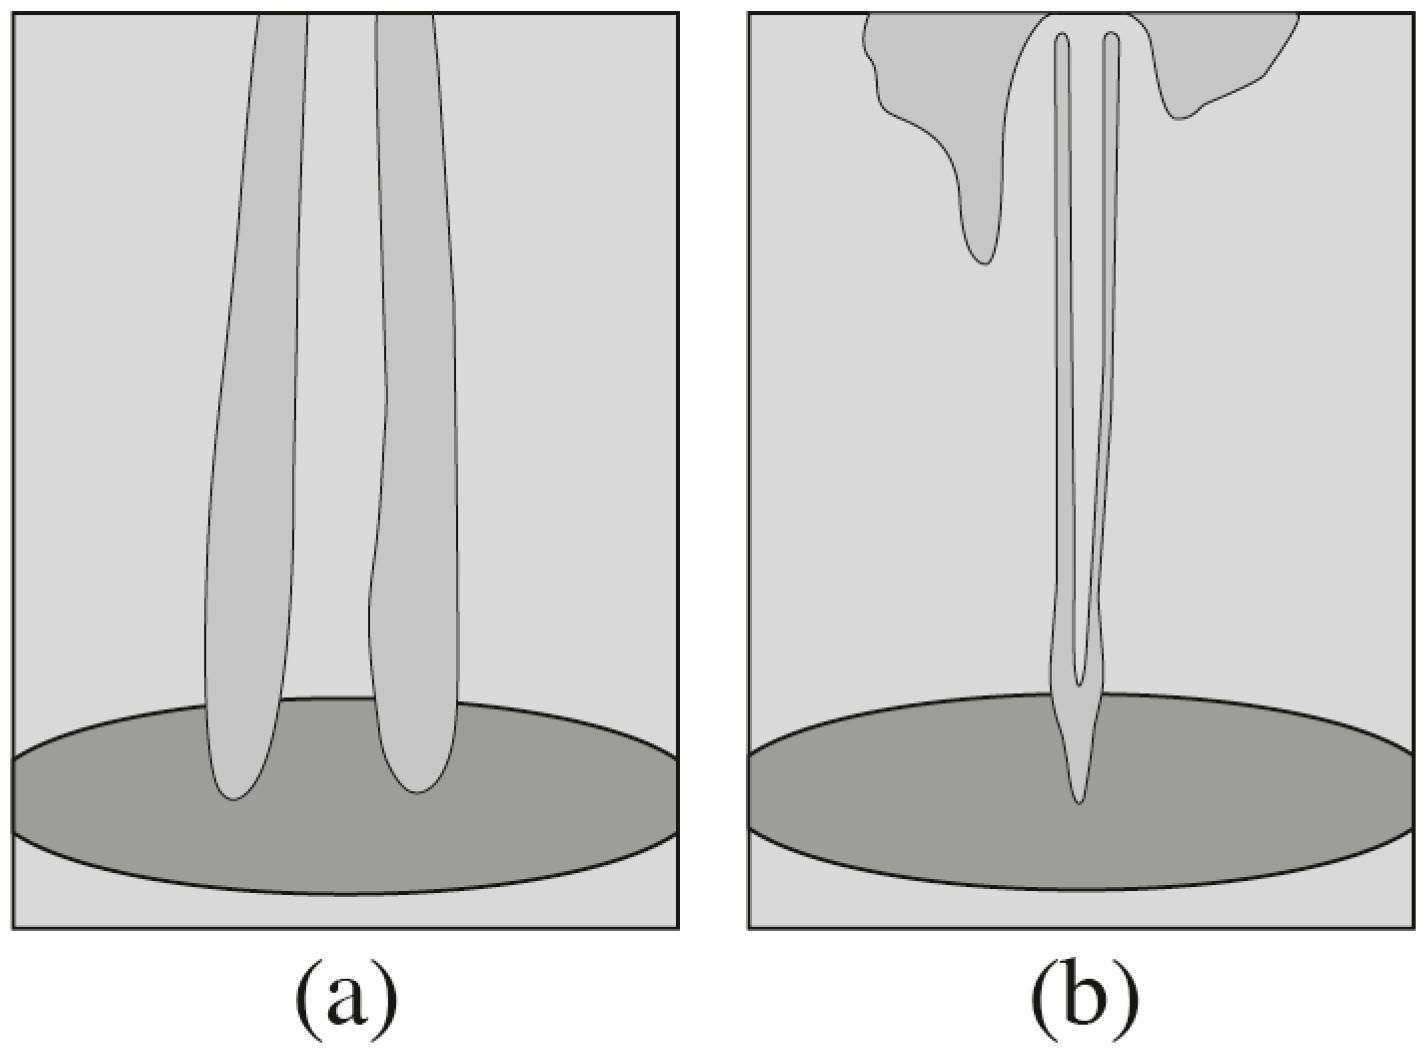
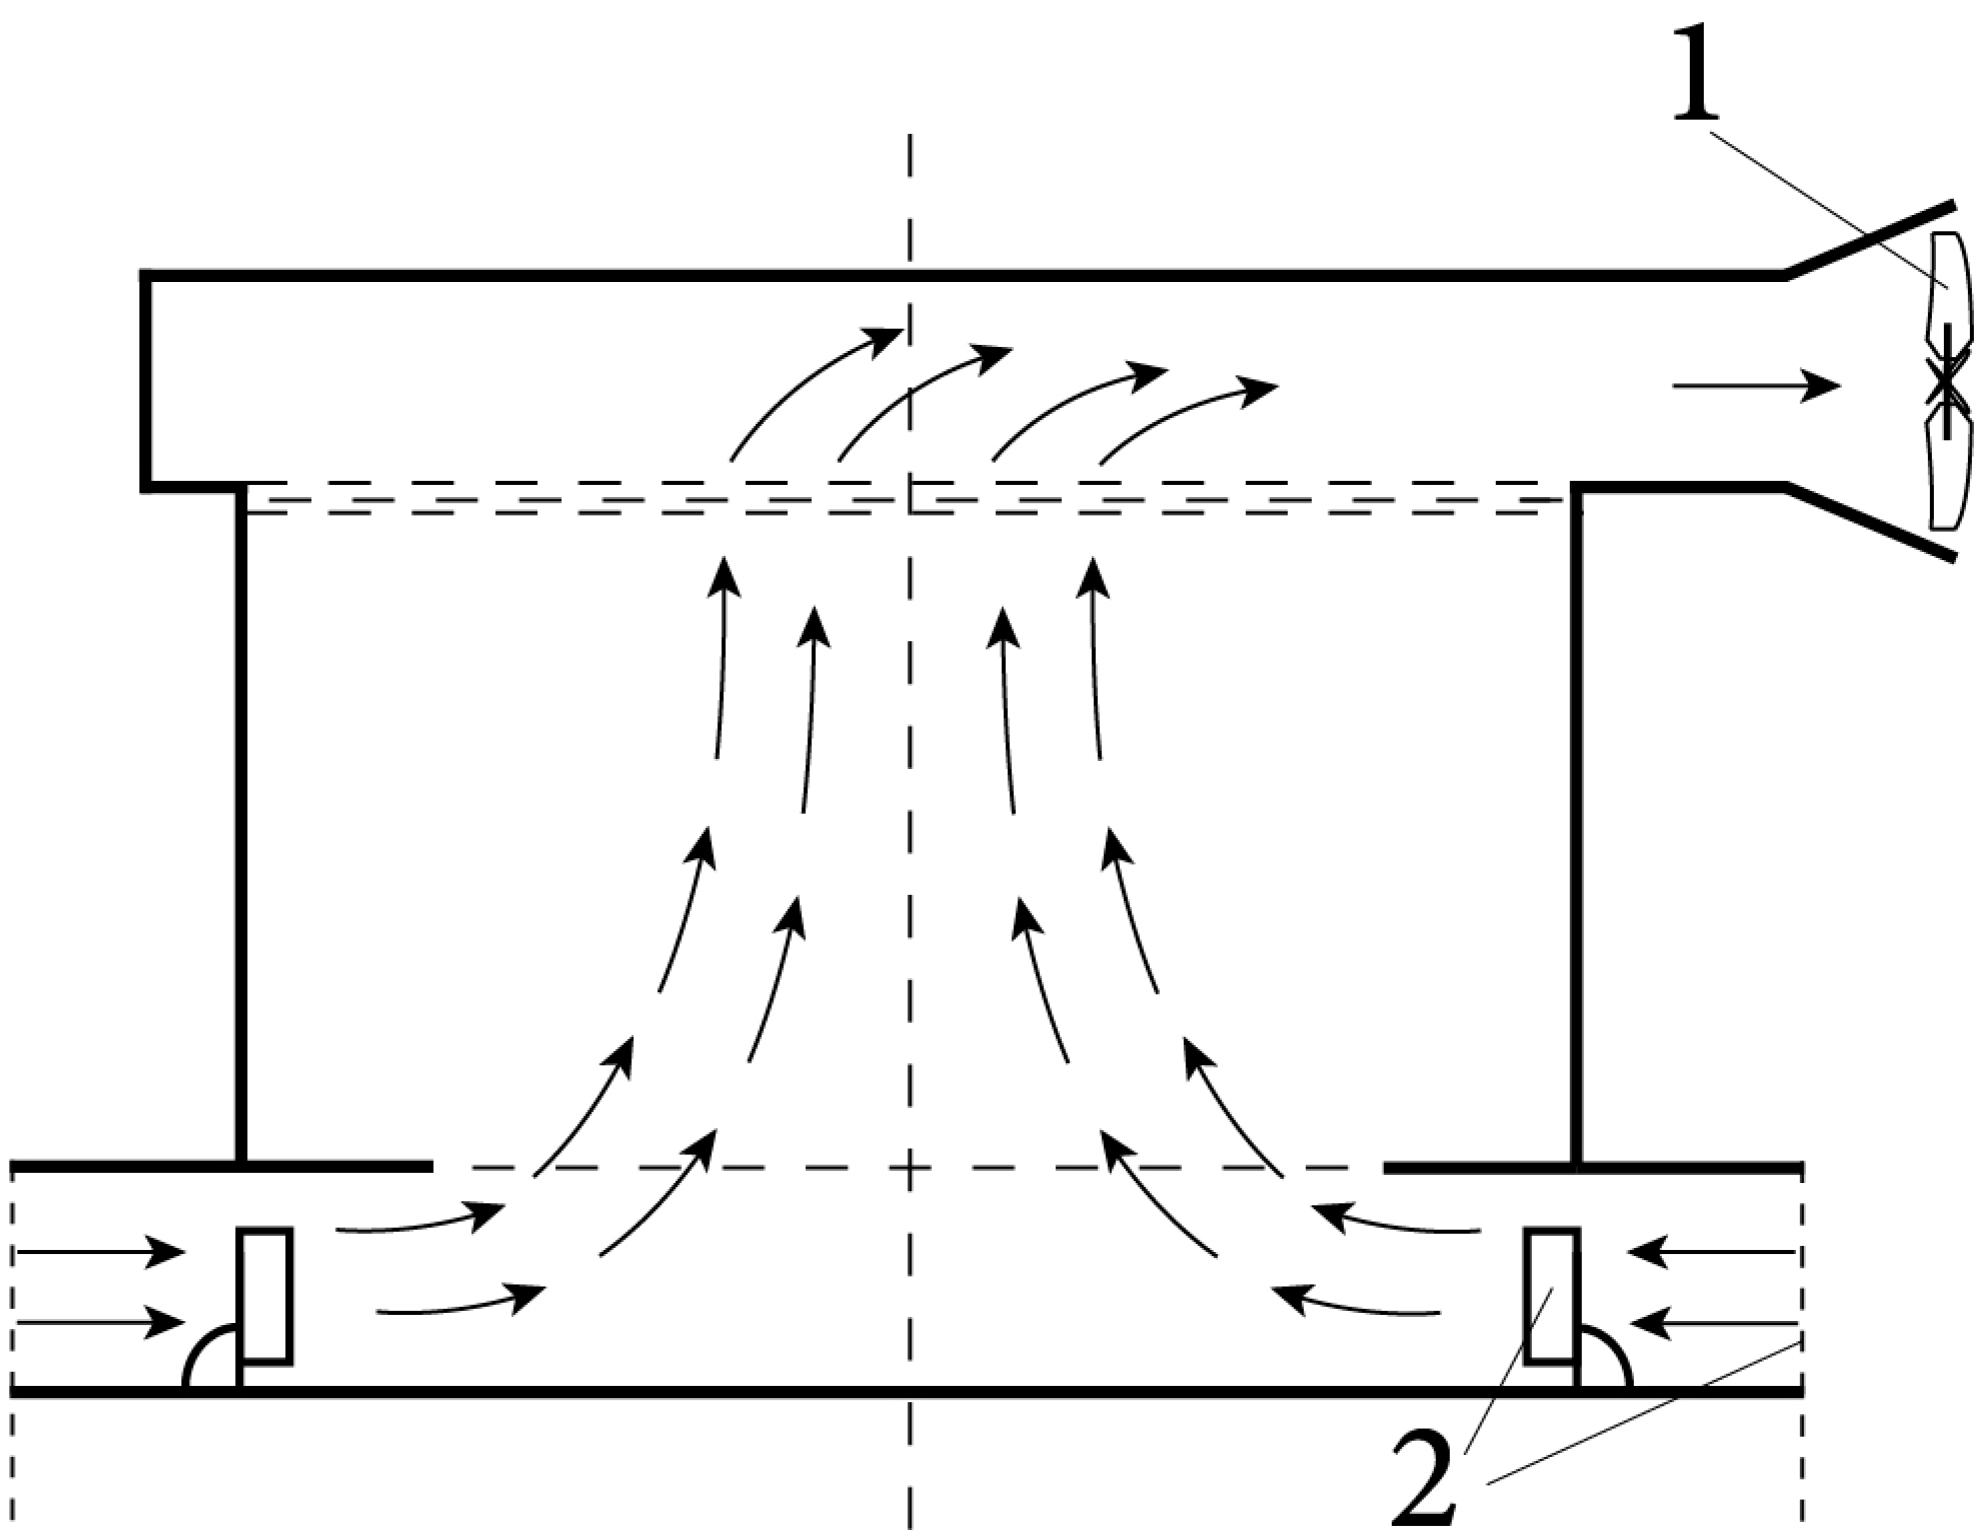
The early work on experimental modeling of tornado-like vortices was carried out in 1969–1971 at the Catholic University of America in Washington [28,29]. These studies focused on a confined vortex flow in a chamber (TVC—tornado vortex chamber), which was formed using a top-mounted fan and a rotating mesh screen (Figure 1 and Figure 2). The mesh screen had the following dimensions: diameter—1.98 m, height—2.44 m, and cell size—12 × 12 mm. One major advantage of the TVC used was the ability to independently adjust the speed of the ascending airflow and circulation. The flow rate of the ascending flow was determined by the fan rotation frequency, while the circulation (rotation intensity) was determined by the angular speed of the rotating screen.
Measurements of the pressure gradients in radial and axial directions were conducted for three different angular speeds of the screen (4, 8, and 12 rpm). An increase in pressure losses with increasing rotation speed was observed, as well as a pressure minimum near the bottom wall (at a distance of approximately 1 cm). Tangential and radial velocity distributions for different levels of circulation were also measured using a thermoanemometer. It is worth noting that the obtained azimuthal velocity distributions closely resembled those in natural vortices. However, the relative values of radial and axial velocities were much lower than those observed in real tornadoes.
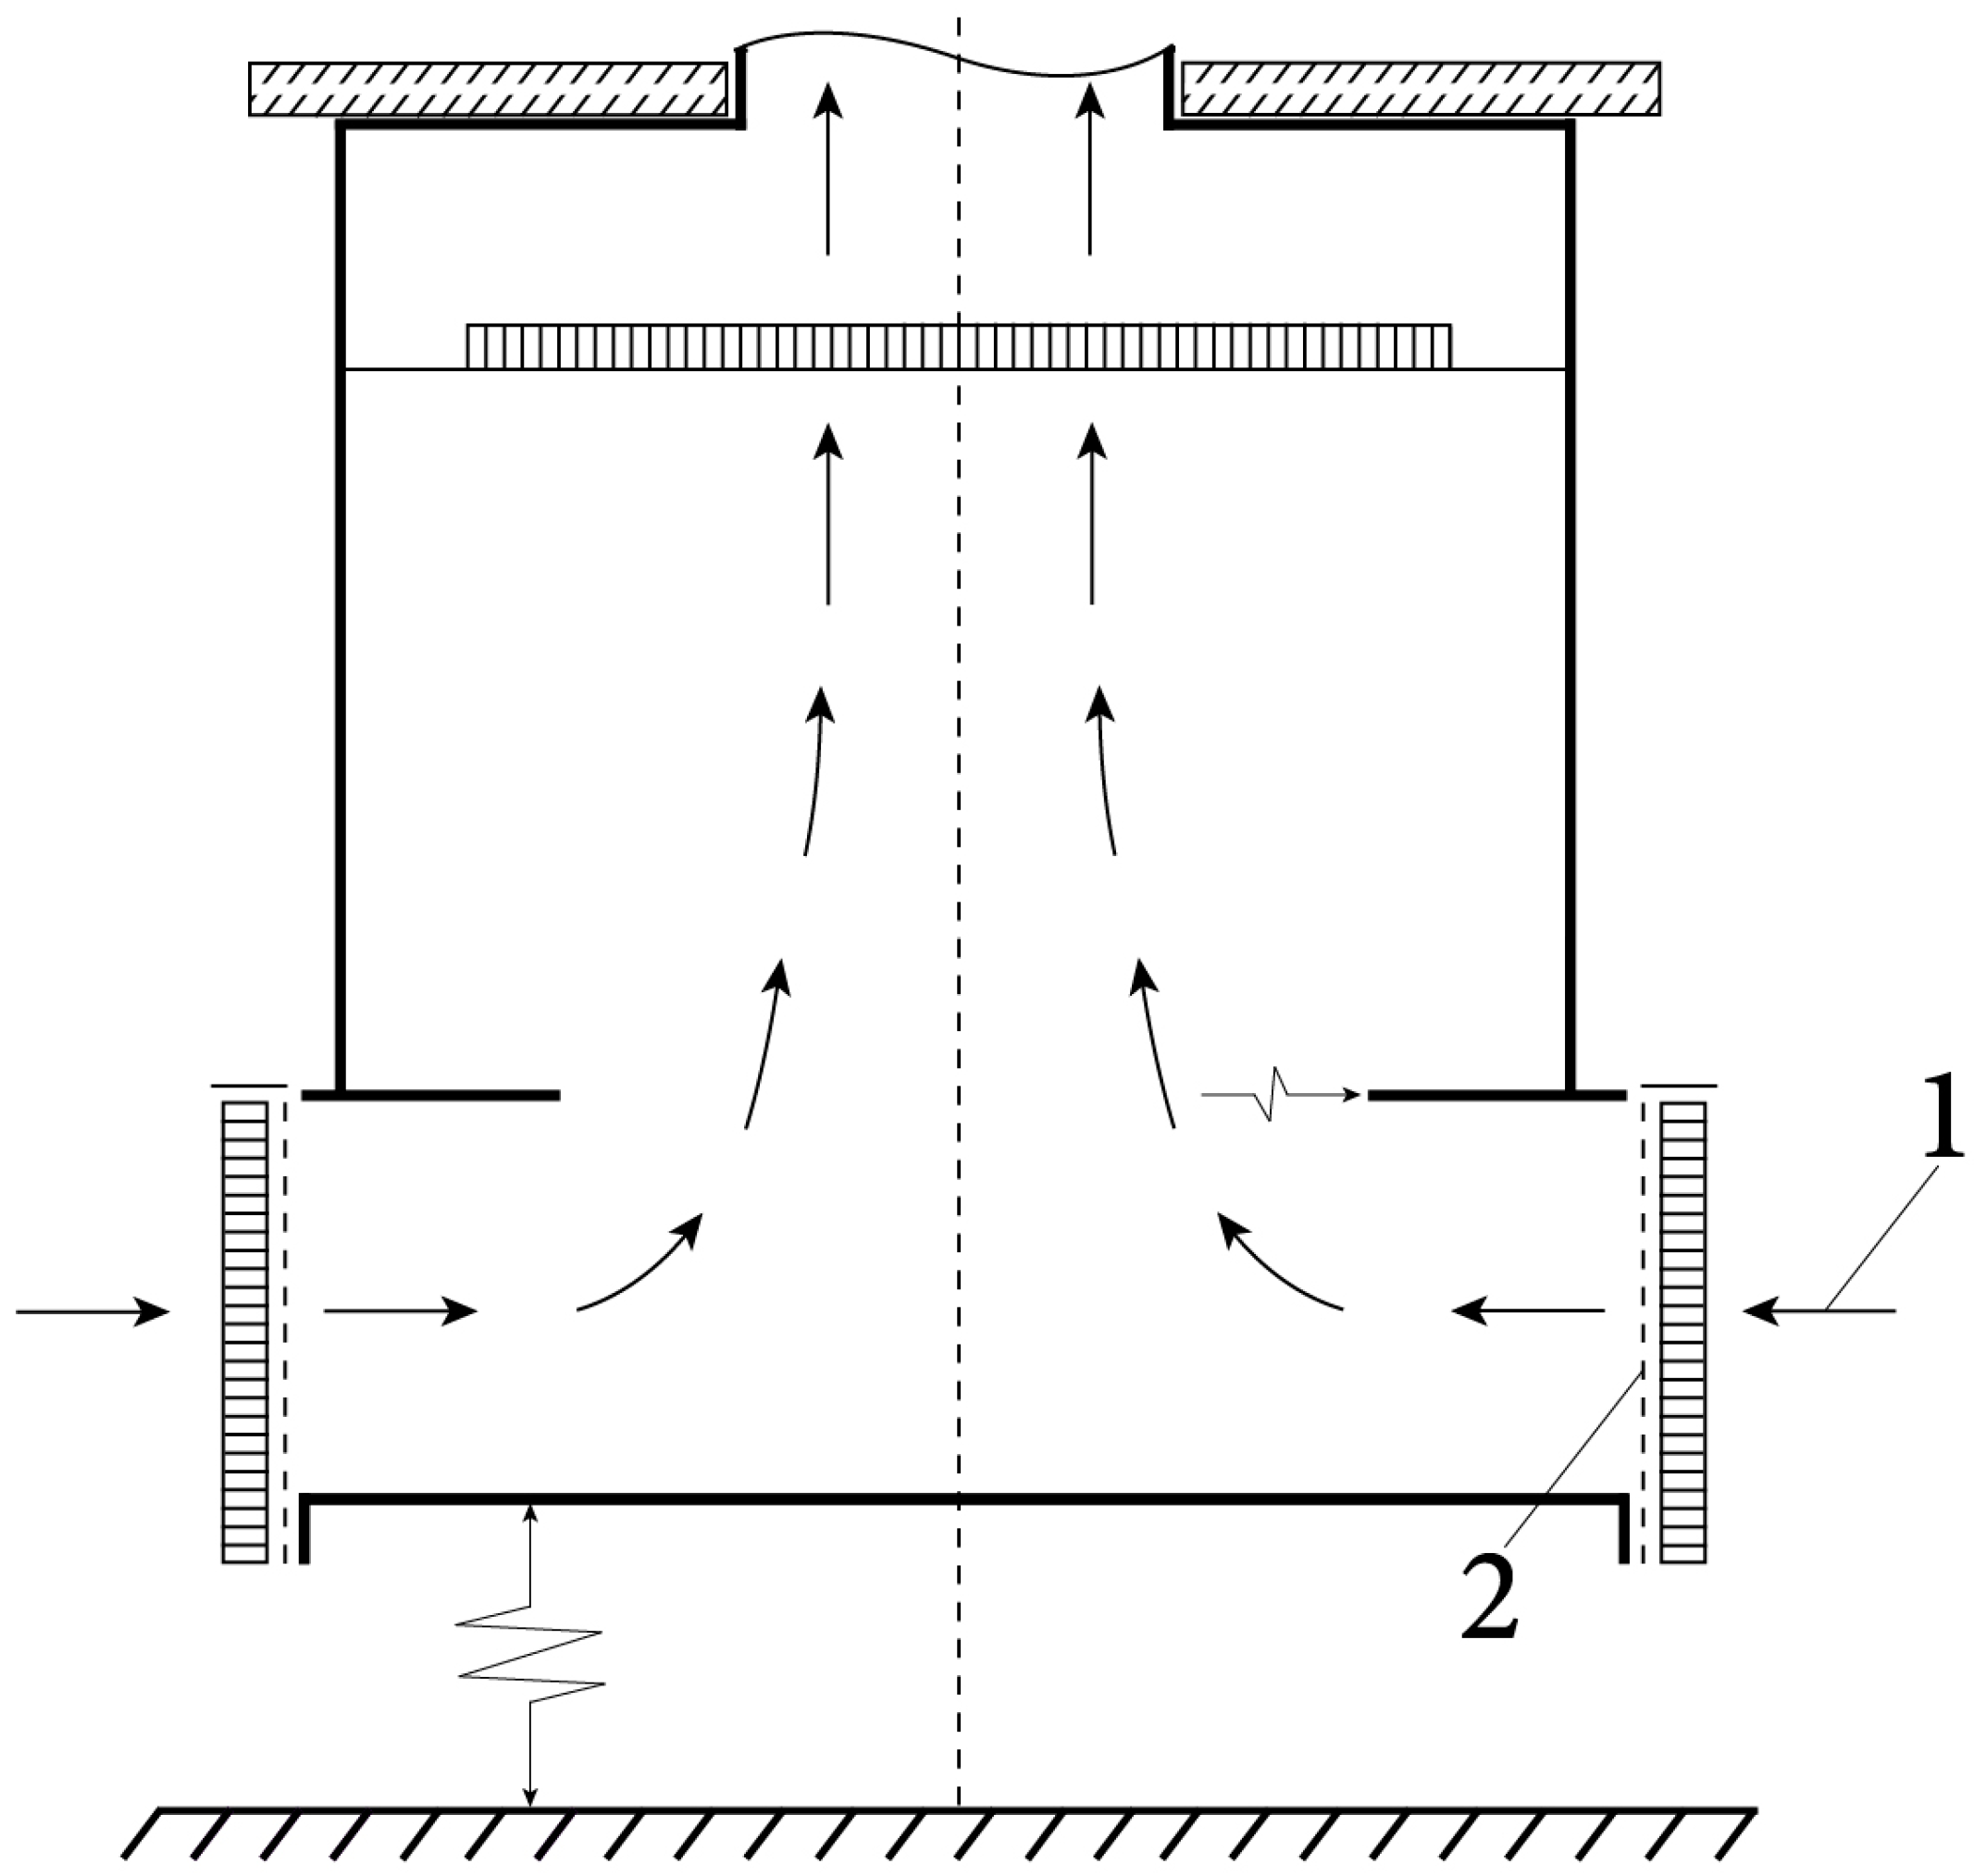
The next work was performed and published in 1972 by N.B. Ward at the National Severe Storms Laboratory at the University of Oklahoma (NSSL, Oklahoma University) [30]. This work had a significant impact on the development of tornado vortex chambers (TVCs) of various designs. The vortex generator used by N.B. Ward was named the Ward-type simulator. The experimental setup used in this work also included an exhaust fan to create an ascending flow (Figure 3). To generate circulation, a rotating screen with guide vanes was employed. The setup had several structural differences (e.g., a taller convective zone, presence of a honeycomb structure, etc.). A key difference was the inclusion of a mesh structure with a fine cell size (honeycomb) located directly before the air flow outlet. This allowed the suppression of circulation initiated by the fan, which was considered parasitic in this case as the main (working) circulation was created by the rotating screen at the inlet of the setup. This design element enabled N.B. Ward to achieve pressure distributions, vortex funnel geometry, and to identify modes in which two or more vortices are formed (similar to real tornadoes) [30,31].
In the research of [31], a dependence was also found for the relative size (radius) of the vortex core r = r 0 / r 1 = tg 2 ϕ = S 2 . Here, r 0 —radius of the core of the vortex structure; r 1 —the radius of the entrance to the cylindrical chamber in which the upward convective flow is realized; ϕ —the angle of rotation of the airflow entering the convergence zone (mixing zone) relative to the radial direction; and S —the swirling parameter (the ratio of tangential and radial velocities at the entrance to the rotating screen). The experimental data obtained on the size of the vortex core were satisfactorily described by the above dependence for converging sections of various sizes. At relatively small turning angles ϕ 10 ° , the vortex core was relatively narrow ( r 0.05 ), while at ϕ 30 35 ° , the vortex core thickened significantly ( r 0.25 0.30 ). Experiments [31] have revealed the presence of a critical angle of rotation, at which the split of the single-vortex structure into a two-vortex structure occurs. It has been found that the magnitude of this critical angle decreases with increasing volumetric air flow and decreasing convergent zone height.
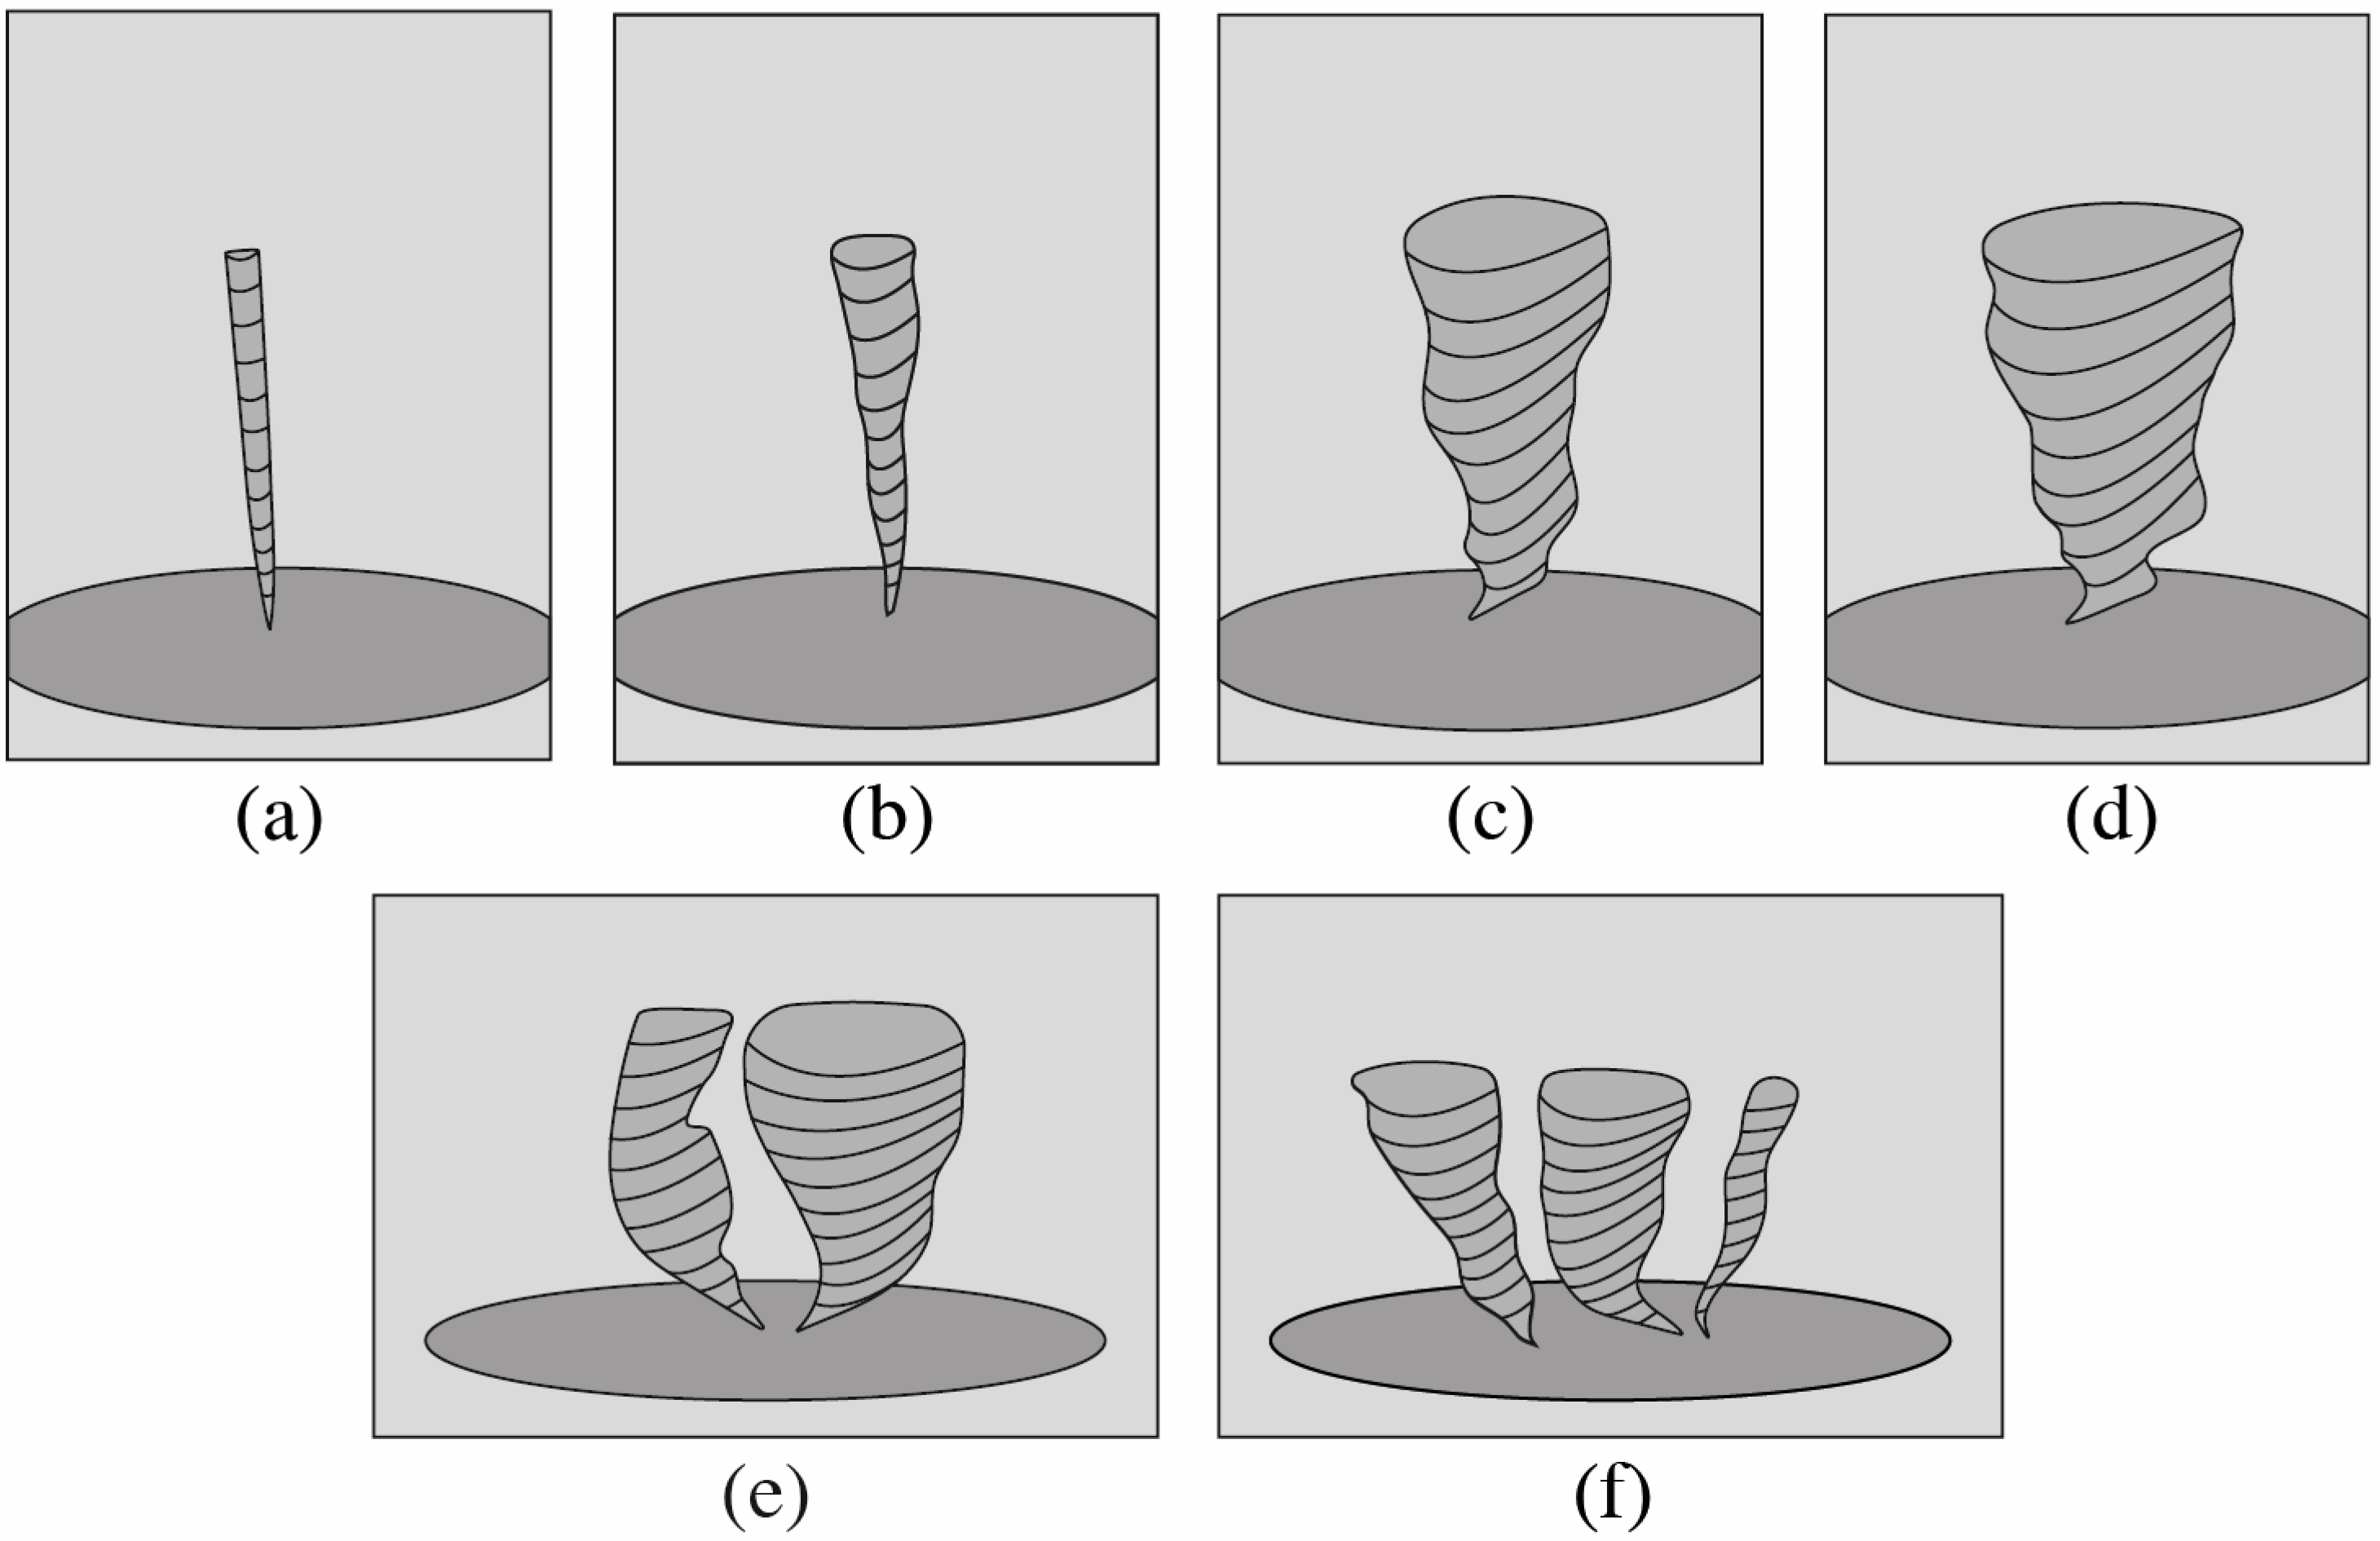
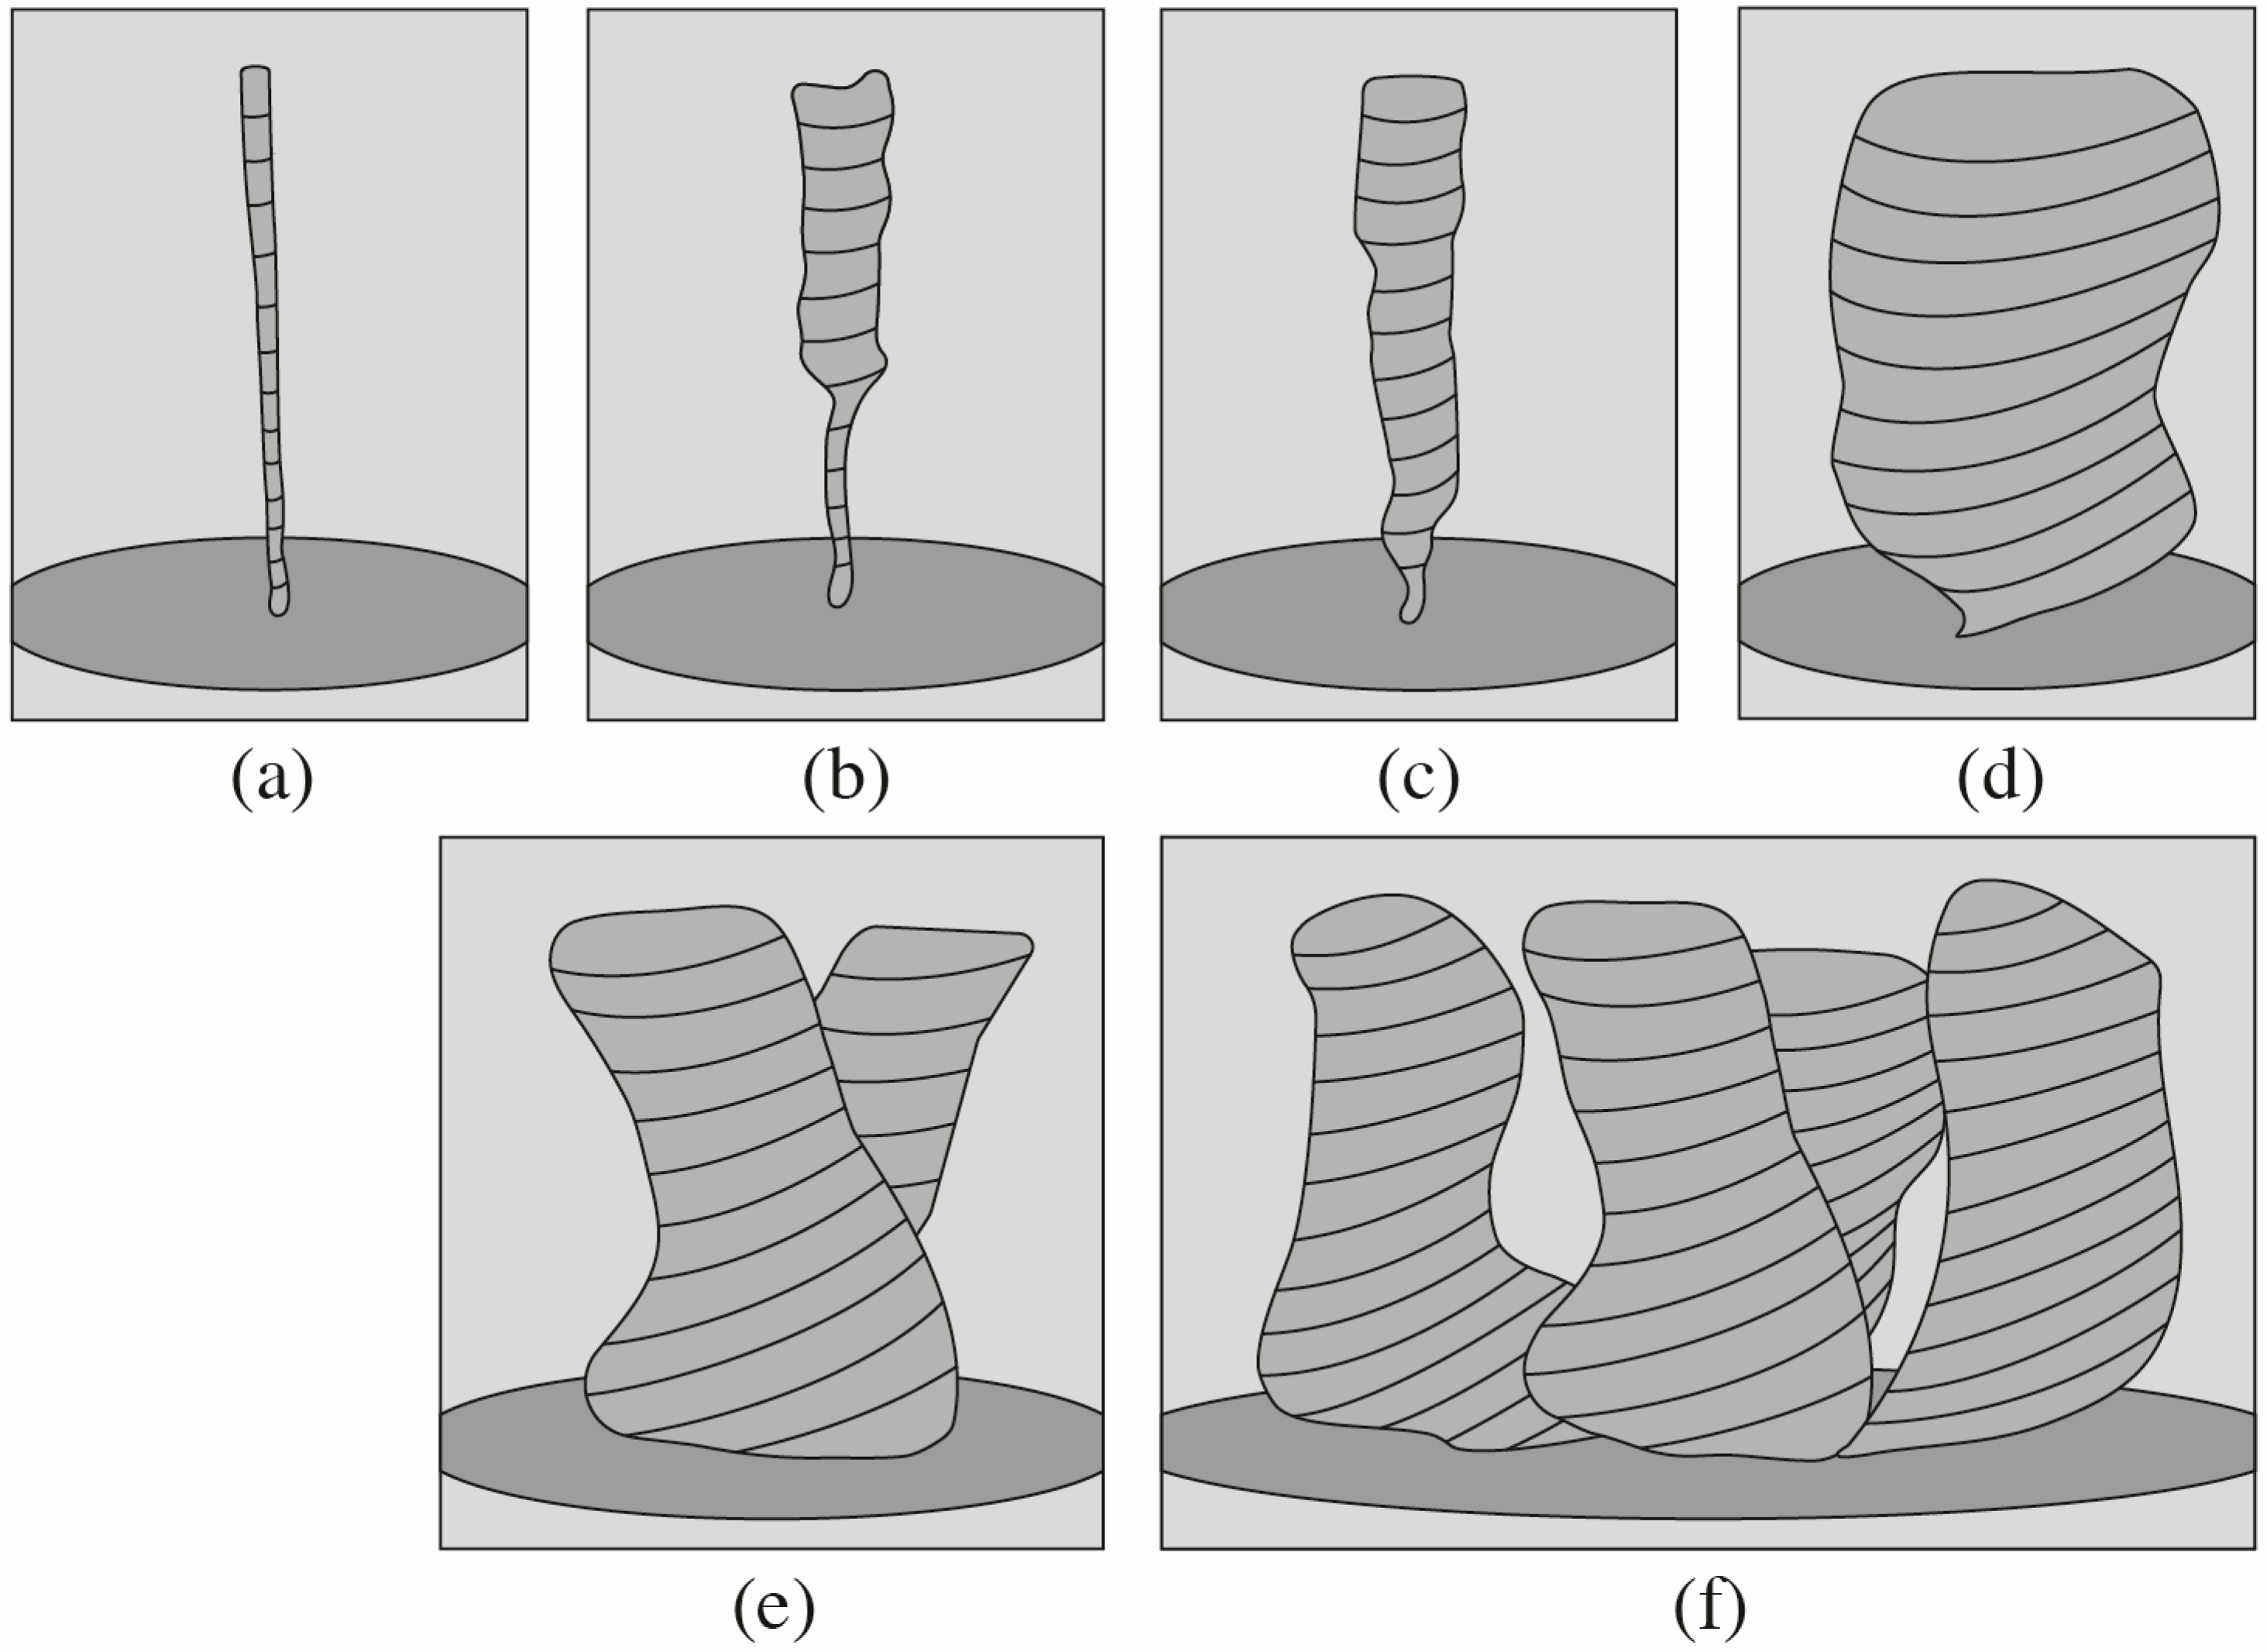
The work of [30] served as an impetus for the creation of a number of TVCs similar in design (Figure 4). Therefore, in paper [32], the design of the output channel was changed. In this study, using the thermoanemometry method, the effect of the surface roughness on the value of the critical value of the swirling parameter, at which there is a transition from the generation of a single-vortex to the generation of a multi-vortex (consisting of two, three, and four vortices) structure, was studied. It is shown that the swirling parameter is a key characteristic that determines the size of the vortex core and the transition from a single-vortex to a multi-vortex structure. In these experiments, the angular velocity of the screen varied from 0.5 to 7 rpm, and the volumetric air flow rate was maintained at 0.123 m3/s. The most intense single vortex was recorded at an angular screen speed of 0.57 rpm and a swirling parameter of S = 0.127 . The apparent radius of the vortex core (which corresponds to the radius where the tangential velocity takes the maximum value) was 2.7 cm. The maximum measured speed was 3.12 m/s (at a distance of 2 cm from the bottom wall).
The increase in the swirling parameter led first to the transition from a single-vortex to a two-vortex ( S = 0.227 ), then to a three-vortex ( S = 0 . 898 ) and, finally, to a four-vortex ( S = 1 . 79 ) structure. Next, the effect of roughness, which was formed by placing a mat with inch fibers on the bottom of the convergent zone, was studied. It was noted that, in the case of increased roughness, the vortex structures become more blurred (turbulent) and the distinguishability of individual vortices in a large vortex structure was reduced. Nevertheless, it was found that the critical values of the swirling parameters increased and equaled S = 0 . 313 , S = 1 . 09 , and S = 3 . 17 for transitions to two-vortex, three-vortex, and four-vortex structures, respectively.
To create generators and analyze the results, you need to use some dimensionless criteria. Most of the experimental studies described and analyzed here used conclusions [33]. In this work, by analyzing the complete system of equations in the variables “dimensionless circulation—current function” for a laminar, incompressible, and axisymmetric vortex flow in a closed (bounded by walls) cylinder, three-dimensionless parameters were obtained [33]:
(i)
The radial Reynolds number Re r , which is defined as
Re r = Q ν .
(ii)
The swirling parameter S, which is defined as
S = Γ   r 1 2 Q h .
(iii)
The geometric aspect ratio a, which is defined as
a = h   r 1 ,
where Q is the volumetric air flow rate through a unit length of the chamber in the axial direction, Γ is the circulation at the entrance to the lower chamber (to the rotating screen), r 1 is the radius of the ascending flow area, and h is the depth (height) of the incoming flow.

3. Studies of Wall-Bounded, Stationary, and Concentrated Tornado-like Vortices

The results of a study of wall-confined, stationary vortices were followed up in [34,35,36,37]. These studies were performed during 1977–1980 at Purdue University, Indiana. During the experiments, a Ward-type simulator was used to generate vortices [30].
Expression (2) can be rewritten taking into account the real geometry of the installation used in the studies [34,35,36,37] as follows:
S = Γ s   r 1 2 Q s h ,
where r 1 is the radius of entry into the cylindrical chamber (the radius of the upper opening of the lower chamber); Γ s is the circulation value at the inlet to the rotating screen; Q s is the volumetric air flow rate related to screen height unit; and h is the height of the screen (lower camera).
Next, we used expressions for circulation Γ s = 2 π   r s   U ϕ s and relative volume rate Q s = 2 π   r s   U rs . Here, r s is the rotating screen radius (lower chamber radius); U ϕ s is the value of tangential (azimuth) velocity at the screen inlet; and U rs is the value of radial velocity at the screen inlet.
Using the above expressions for Γ s and Q s of (4), it is easy to obtain
S = U ϕ s   2 a U rs ,
where a = h / r 1 is the aspect ratio.
Further, we took into account that U ϕ s r s = U ϕ ( r 1 , h )   r 1 is due to the law of conservation of the moment of rotation, and 2 a U rs = U z   r 1 / r s is due to the flow equation ( U z   is the axial speed in the section of the upper hole of the lower chamber). Then, of (5), we have
S = U ϕ ( r 1 , h )   U z .
Expression (6) indicates that the value of the swirl parameter largely determines the structure of the vortex formed.
A distinctive feature of the TVC [34,35,36,37] used was that all the main geometric (inlet flow zone height and outlet radius) and modal (volumetric air flow rate and tangential velocity value) parameters varied over a very wide range (Figure 5). For example, the height of the screen (inlet air zone) varied in the range of h = 0 . 17 0 . 61 m; the radius of the upper (outlet) hole in the lower chamber varied in the range of r 1 = 0.2 0 . 61 m; the volumetric air flow ranged from 0.24 to 2.03 m3/s; and the angular speed of screen rotation ranged from 0 to 11 rpm. Thus, the swirling parameter S , which is one of the key characteristics of vortex structures, varied in the range from 10−2 to 30, which significantly overlaps the area that is most interesting for modeling in laboratory conditions (from 10−1 to 1). The primary task of these studies (like many similar ones) was to obtain the most stationary vortices. For this purpose, anti-turbulent panels were used at the inlet to the vortex generator. The created installation made it possible to simulate various types of vortices due to the ability to control basic parameters, such as the air flow and tangential velocity value.
At Texas Tech University (TTU), a Ward-type simulator was manufactured in 2001. The radius of the upward flow was 0.19 m, and the height of the incoming flow ranged from 0.064 m to 0.19 m [38]. The TVC described above was modified in 2008 [39,40]. It was named the Vor TECH simulator. In this vortex generator, the upward flow was created by a fan installed at the top of the convective channel. Circulation was provided using 16 slotted orifices at the generator inlet. Three-dimensional velocity fields were studied, as well as the distribution of static pressure on the surface. The data obtained in the laboratory experiment were compared with the data of full-scale field measurements of tornadoes in Manchester, South Dakota (Manchester, SD) in May 1998 [41] and the tornadoes in Spencer, South Dakota (Spenser, SD) in June 2003 [14,15]. A good correspondence of measured pressure distributions and corresponding data for field vortices was shown. The scale of the length of the laboratory vortex and full-scale tornado was estimated at 1:3500.

4. Studies of Wall-Free, Quasi-Stationary, and Concentrated Tornado-like Vortices

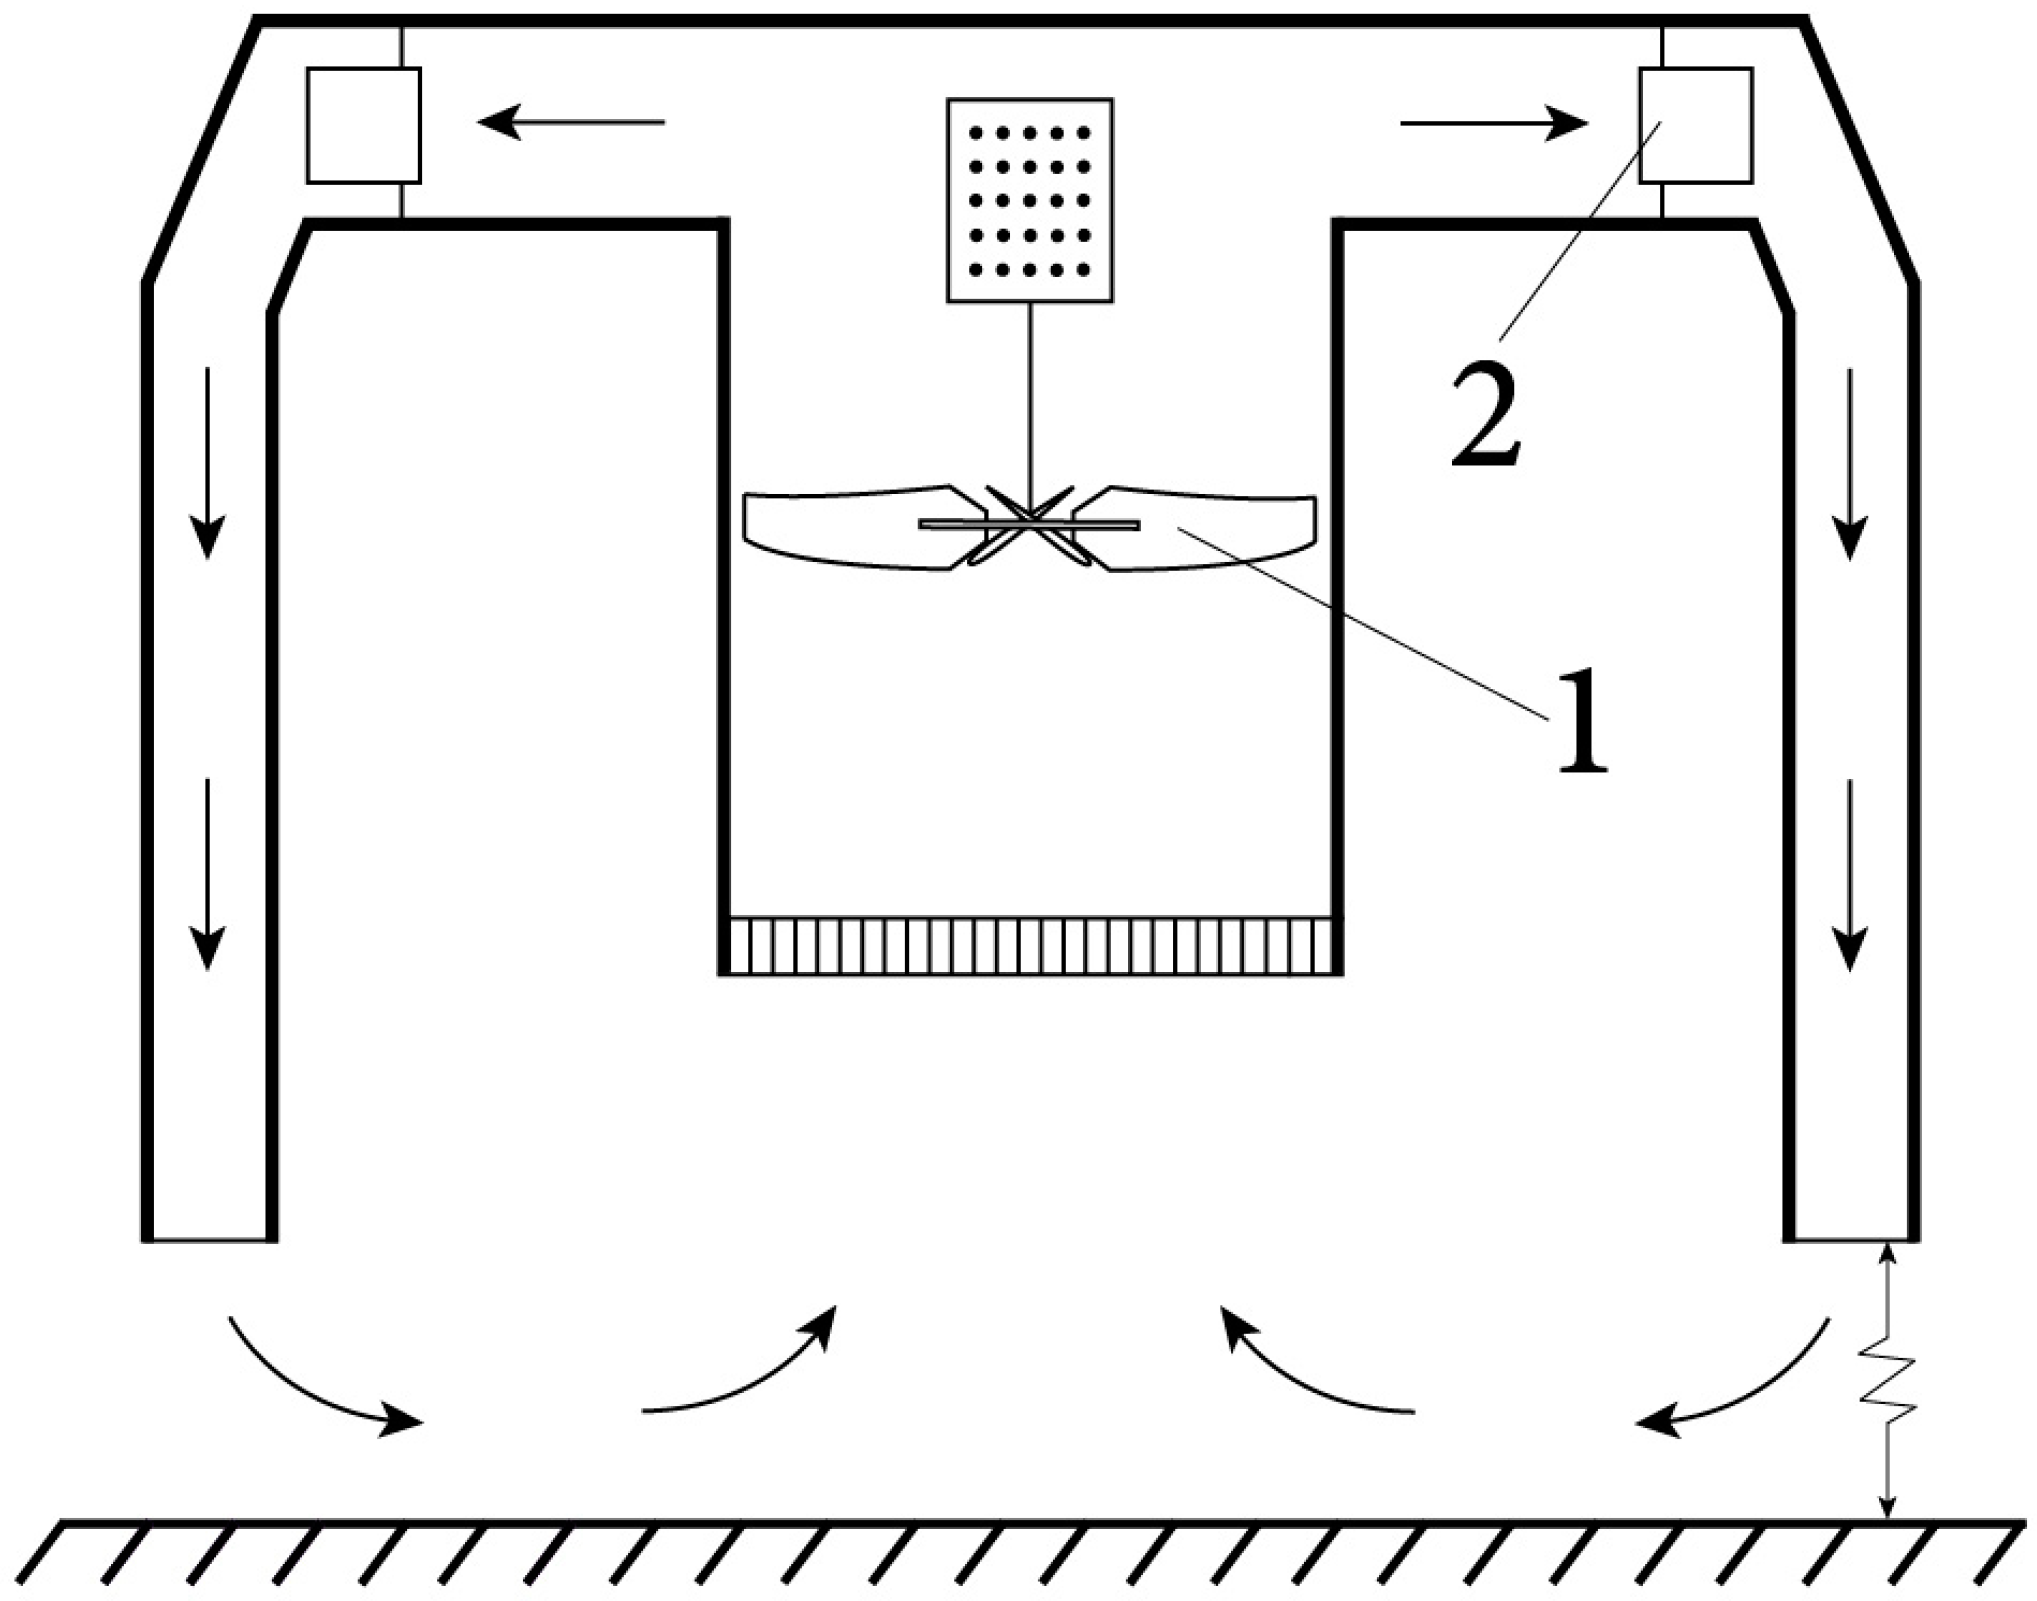
Attempts to create a moving tornado-like vortex began in 1997. In the period from 2001 to 2003, five proposed design concepts were tested [42]. A generator of tornado-like vortices [42,43], not limited by walls, was created at the Iowa State University (ISU). It was named the ISU tornado simulator. To create a vortex structure, it also used a fan and guide vanes (Figure 6 and Figure 7). It should be noted that the described generator allows you to create sufficiently large structures with a diameter of up to 1.12 m and a height of 1.2 to 2.4 m. The maximum value of the tangential speed reached 14.5 m/s, and the swirling parameter was 1.14. The vortex structure was visualized using dry ice. It should be noted that the design of the ISU tornado simulator made it possible to simulate the phenomenon of the downward flow on the rear flank of the tornado (rear flank downdraft (RFD)) by organizing a forced downward flow (“rotating forced downdraft”). There are a number of hypotheses according to which it is thanks to RFD that the tornado is so destructive.
In addition to the absence of limiting side walls, the generator had another distinctive feature. The generator was fixed on guides, which allowed its movement and, therefore, the movement of the created vortex structure with a linear speed of up to 0.8 m/s. This mechanical movement of the vortex made it possible to study its effect on models of the buildings that were located on the way.
In paper [44], the influence of tornado-like vortex movement on velocity fields was investigated. Two velocities of 0.15 m/s and 0.5 m/s were selected, which correspond to the velocities of slow-moving tornadoes. The movements of the tornado-like vortex led to a change in horizontal velocities, an earlier reversal of radial inflow, and a broadening of the core radius. Increasing the speed of movement led to a decrease in horizontal speeds at all altitudes.
In article [45], the surface structure of tornado-like vortices was studied in detail. It is the knowledge of the surface distribution of speeds that is of the greatest interest in order to develop measures and means of protecting civilian buildings. To conduct the study, the so-called Mini ISU tornado simulator (scale 1:3) was created. The structure of tornado-like vortices was studied when the swirling parameter changed in the S = 0 . 03 0.3 range, which corresponds to the rotation angles of the blades θ v = 15 ° 60 ° range. The structure of the complex flow in the near-surface layer was studied in several horizontal sections (at a distance of 11, 26, and 53 mm from the surface) and in the meridional section. Particle image velocimetry (PIV) was used to measure velocities. The existence of two different vortex structures was revealed: one-cell vortices at low swirling parameters ( S = 0.03 and θ v = 15 ° ) and two-cell vortices at high swirling parameters ( S = 0.1 0.3 and θ v = 30 ° 60 ° ). A strong effect of vortex traveling on the average flow was found, and it was especially significant at low values of the swirl parameter. The results showed that the tangential component of speed was the dominant component, and its maximum value exceeded the maximum value of the radial speed by about three times, regardless of the value of the swirling parameter.
The strength of [45] was the acquisition of the important data on the turbulence pattern of a tornado-like vortex. Measurements of the distributions of the intensity of the velocity fluctuations were established as σ r φ = 1 2 ( v r 2 ¯ + v φ 2 ¯ ) / U φ max 2 and σ r z = 1 2 ( v r 2 ¯ + v z 2 ¯ ) / U φ max 2 . Much attention was paid to taking into account the effect of the vortex walk (precession) on the measured parameters. In particular, it was noted that the value of the maximum azimuthal velocity U ϕ max was underestimated by about 15%, and the radius of the core r 0 , on the contrary, was overestimated by 20–30% if the effect of vortex precession was not eliminated.
Experiments have shown that the maximum values of the intensity of pulsations lie in the σ r ϕ max = 0 . 06 0 . 12 ( θ v = 15 ° ) and σ r ϕ max = 0 . 15 0 . 23 ( θ v = 45 ° ) ranges. Larger fluctuations σ r ϕ max correspond to smaller distances from the wall. At θ v = 15 ° , the maximum of fluctuations was located at a distance of r / r 0 = 1.1 1.2 and at θ v = 45 ° at a distance of r / r 0 = 0.5 0.7 . Experiments have shown that high values σ rz are observed in close proximity at the center of the vortex ( θ v = 15 ° ), and these then quickly decrease when moving away from it. The values σ rz gradually decrease with increasing altitude. At θ v = 45 ° , the maximum values σ rzmax occur above the surface, where the radial incoming flow interacts with the outgoing (where the maximum vertical velocity gradients are realized).
In paper [46], experimental modeling of tornado-like vortices was performed in a small vortex simulator (a modified version of ISU) in order to study the effect of the swirling degree on turbulent flow characteristics. Particle image velocimetry (PIV) was used to quantify the tornado vortex velocity field for swirling factors ranging from 0.08 to 1. It was revealed that the radial and tangential components of the speed, as well as the radius of the tornado core, increase with the degree of swirling. The location of the maximum radial and tangential velocities was adjacent to the ground, where a tornado-like vortex interacted with the surface. Normal and shear turbulent stresses indicated the existence of a laminar core at low swirling. As expected, shear stresses increased with increasing swirling as the vortex became turbulent.
In the work of [47], the effect of the surface roughness on the tornado-like vortex current was studied and compared with the case of vortex development over a smooth surface. The studies were conducted on a Mini ISU tornado simulator. Velocity field measurements for the stationary vortex were made using a 2D-PIV system and a moving vortex anemometer. The influence of roughness led to the growth of a boundary layer along the radial direction in the direction of the axis of the tornado-like vortex, and it also led to an increase in radial velocity for the stationary vortex at all heights studied. In the case of a moving tornado-like vortex, the effect of roughness was significant at all altitudes, with the exception of a distance that was 4.7 times the height of the roughness elements.
The radial flow transmitting angular momentum toward the center of the vortex reached its maximum at shorter distances from the center of the vortex, thereby reducing the magnitude of its core. In [47], it was noted that the above effect, although it differed from many previous studies, corresponded to the conclusions of the work of [48]. In this study, it was assumed that there is a competition of two factors: the ratio between tangential and radial moment and the intensity of turbulence leads to either an increase or decrease in the radius of the nucleus on rough terrain. The first factor is the swirling parameter of the local angular current, which decreases on irregularities (roughness) and, thereby, leads to a decrease in the tornado core. The second factor is the intensity of turbulence, which increases with roughness and leads to the growth of the tornado core. It was concluded that, for the experimental conditions [47], although the turbulence intensity increased by almost two times, this factor did not become dominant, which was expressed in a decrease in the vortex core.
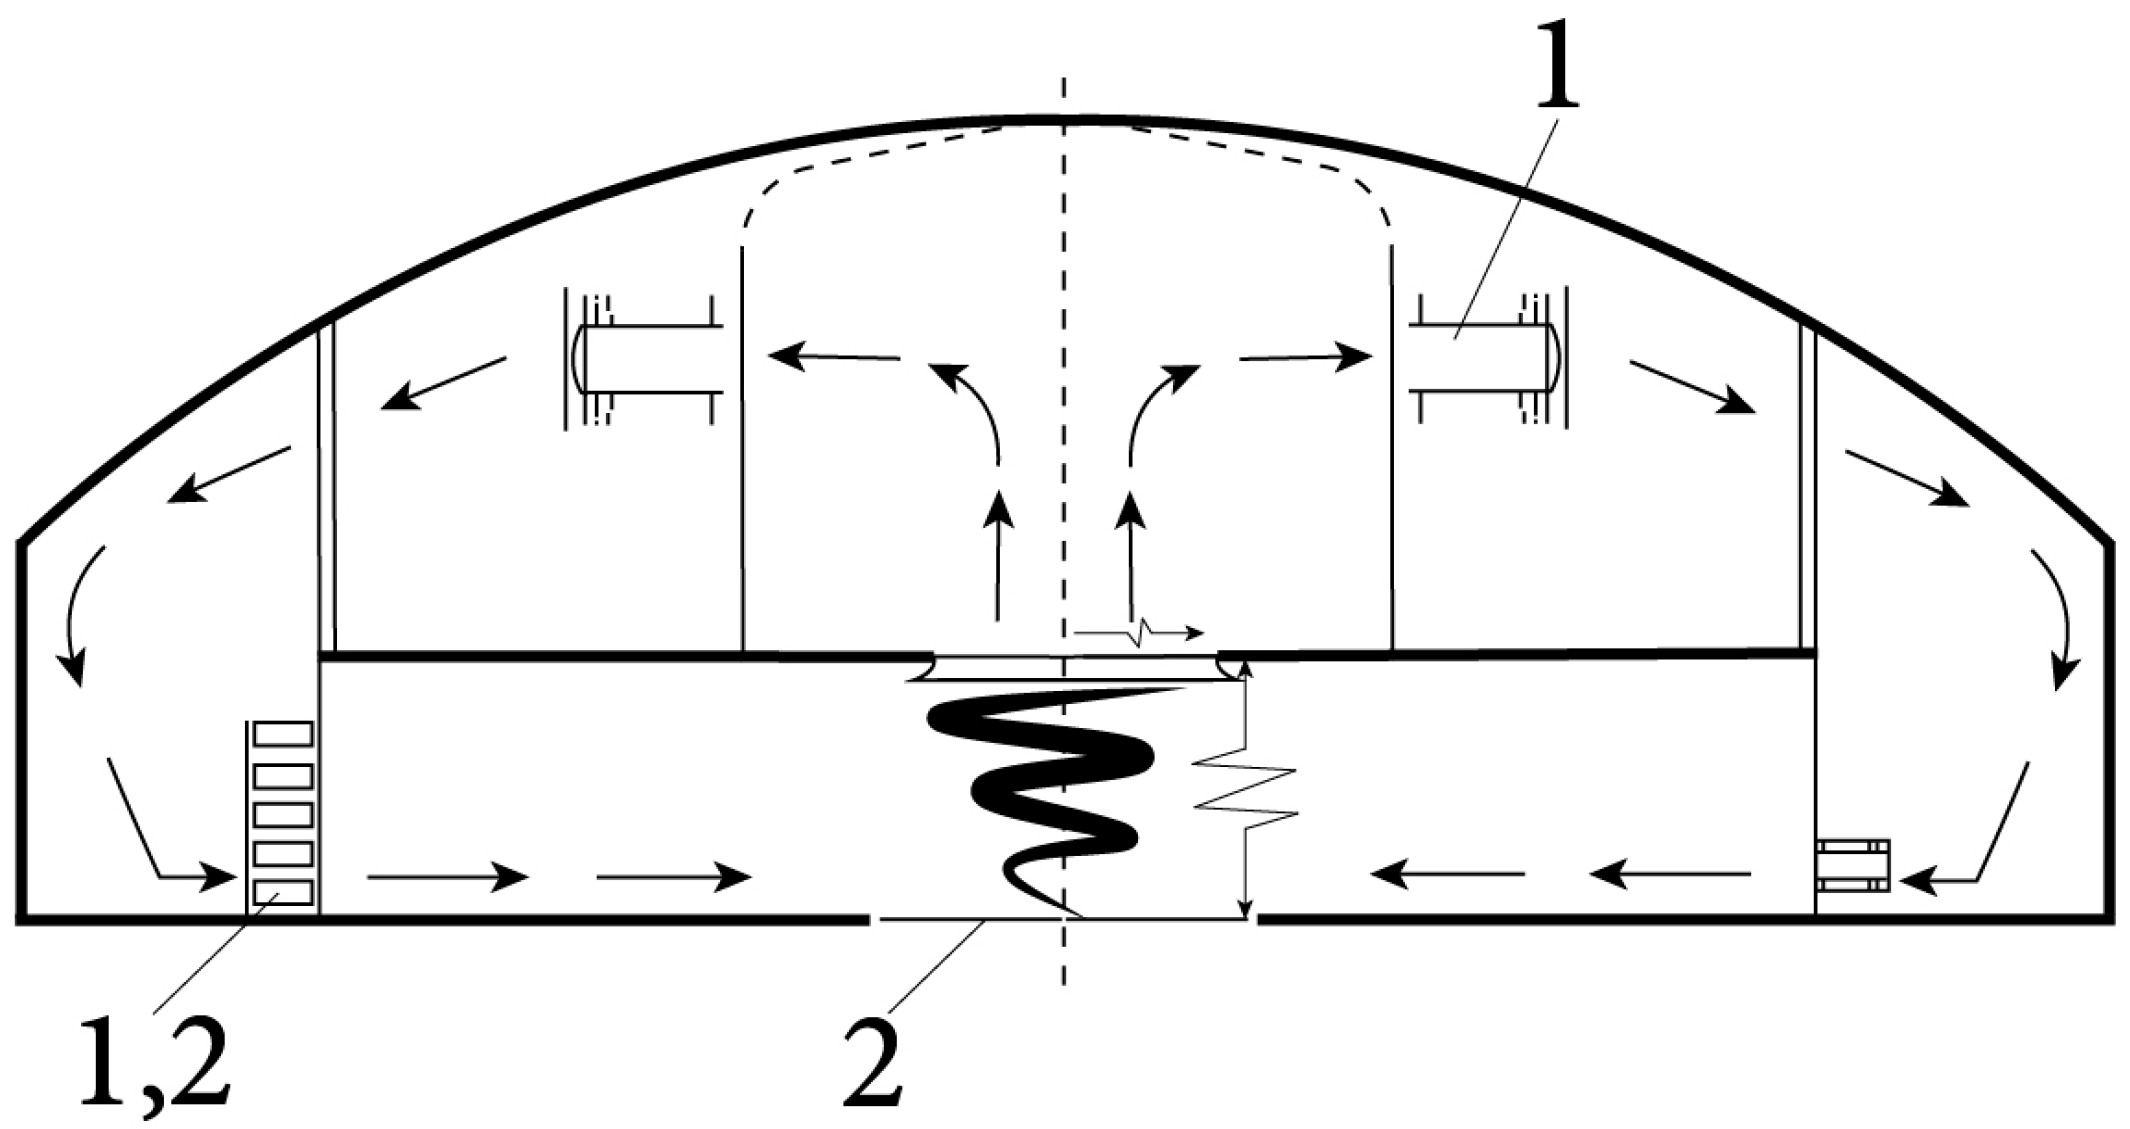
The works of [49,50,51] described the design of the Wind Engineering, Energy and Environment (WindEEE) Dome tornado vortex simulator created at Western University (Figure 8). This unique large installation (25 m internal diameter and 40 m external diameter) is a hexagonal wind test chamber capable of simulating direct flows in the boundary layer of the atmosphere, tornado vortices (up to 4 m in diameter), gust fronts, and downward gusts. The generator uses a large number of fans (100 fans on 6 peripheral walls and 6 more powerful fans at the top at ceiling level). One of the peripheral walls had a matrix of 60 fans arranged in 4 rows. In addition to this wall, there were 8 fans at the base of each of the other 5 peripheral walls. Such a complex system of fans allows one to vary horizontal and vertical velocity gradients. Fans have the ability to turn on at a frequency of 1 Hz, which also allows one to create fluctuations of velocity, thereby simulating turbulent flow. Circulation is created and changed by placing blades at different angles in front of each of the peripheral fans of the lower level. In addition, the use of a special guillotine and bell made it possible to move the generated tornado-like vortices at a distance of 5 m with a maximum speed of 2 m/s.
In order to test the design concepts and create a large-scale generator of the tornado-like vortices described above, its model was previously created (on a scale of 1:11) [49,52,53], which has been in operation since 2010. It was named Model WindEEE Dome (MWD) and reproduced most of the characteristics of WindEEE Dome. The model had the same distribution of 100 fans on the peripheral walls. Instead of using 6 larger fans in the upper chamber, 18 fans of the same type, as those used on the peripheral walls, were used. Thus, the flow rate (and thus the radial Reynolds number) was adjusted by varying the speed of the upper fans. To create the required swirling, adjustable blades were installed in front of all the lower fans. The height of the incoming flow in the MWD was fixed at h = 0 . 07 m. At the same time, the radius of the upstream flow varied in the r 1 = 0 . 07 0.2 m range, which led to a change in the aspect ratio in the a = 0 . 35 1 range. The measurements showed that, at Re r > 4.5 × 10 4 , the radius of the core and the characteristics of the near-surface flow were practically insensitive to the radial Reynolds number but depended on the swirling parameter [49]. Using imaging methods, the process of evolution of a tornado-like vortex depending on the magnitude of the swirling parameter was studied. Therefore, at S = 0 . 12 , there was a single-cell columnar vortex, at S 0 . 35 the process of decay of the vortex breakdown bubble formation began, at S 0 . 57 there was a touch-down, and at S 0 . 96 there was a two-cell vortex.
The effect of vortex core precession on the measured characteristics was studied in article [53]. The precession of the vortex core causes velocity fluctuations that can affect the velocity fields measured by PIV, and the vortices themselves become more blurred. The following data correction procedure is well established. First, the instantaneous position of the center of the vortex is determined. The time-averaged velocity field is then corrected by re-centering the velocity vector maps with the instantaneous center of the vortex. Correction of vortex precession was shown to be more important for lower swirling cases. The correction of the PIV data eliminated spurious velocity fluctuations that had previously been perceived as turbulent fluctuations.
Let us draw some preliminary conclusions. As has been the case for many years with simulations of atmospheric boundary layer winds, there is a clear need for physical simulations of specific winds occurring in tornadoes that are characterized by controllability and repeatability. The purpose of all the experimental work described in Section 2, Section 3 and Section 4 was to create stationary (as far as possible), tornado-like vortices using certain swirling devices (see Table 1, Positions 1–5). At the same time, all the main tasks of a physical modeling of the laboratory vortex analogs formulated in the introduction (Section 1) remain out of consideration.

5. Studies of Wall-Free, Non-Stationary, and Concentrated Tornado-like Vortices

At the beginning of this section, it should be noted that, in addition to the experimental works described in Section 2, Section 3 and Section 4 concerning the study of tornado-like vortices, there is a separate line of research devoted to the study of dusty devils. Dust devils (studied in, for example, [55,56,57,58,59,60,61]) are one of the small–scale representatives of a wide range of columnar, atmospheric vortices, including tornadoes, water tornadoes, snow vortices, steam devils, fire vortices, etc. Already, in the classical work [62], the main difference between dust devils, tornadoes, and water tornadoes was noted, which consists in the fact that their formation does not depend on the process of the condensation of water vapor. From the point of view of hydrodynamics, dust devils are, in many ways, similar to tornadoes and other atmospheric vortices. There are quite frequent cases [63] when the convective dust vortices formed under cumulus clouds eventually turn into tornadoes that are not related to supercells (non-supercell tornadoes).
The interest in a separate study of dust devils is mainly due to their widespread distribution on the surface of Mars. Among the works devoted to the laboratory modeling of dust devils, one can single out a series of studies [64,65,66,67]. It should be strictly noted that the generation of unlimited wall-mounted analogs of dusty devils (wall-free, dusty, and devil-like vortices) was carried out using forced spinning: a fan is used to create an upward flow and guide vanes to create rotation.
There are studies in which the authors tried to abandon, for example, the use of a fan to organize an updraft. For example, in the work [68] conducted at the Meteorological Department of the University of California (Department of Meteorology, University of California), the generation of model vortex structures was based on a convective mechanism—a uniformly heated aluminum plate was used in combination with 20 windows made of plexiglass and installed at some angle in order to give the emerging updraft a twist. Using the methods of laser Doppler anemometry and thermometry, measurements of one component of velocity and vertical temperature distribution were carried out. The measurement results allowed us to draw conclusions about the similarity of the convective, thermal vortices generated in this work (vortices of the “dust devil” type) and non-convective vortices (vortices of the tornado type) obtained earlier in the works of [28,29,30].
According to conventional wisdom, the formation of the largest and strongest tornadoes overwhelmingly begins with the generation of so-called supercells. Supercells are characterized by strong rotation at an average level [69]. The formation of small and weaker tornadoes occurring in North America is not accompanied by strong circulation at the average level. Such tornadoes have been called “non-supercell tornadoes” [63] or “non-mesocyclone tornadoes” [70]. To date, much is known about the environmental conditions necessary for “supercell tornadogenesis” [3,8,71,72,73,74,75,76,77]. At the same time, the dynamics of surface vorticity in the process of tornadogenesis itself has not yet been sufficiently studied.
There are many potential mechanisms by which horizontal vorticity can be reoriented to vertical at low levels (at short distances from the Earth’s surface). But there is still no consensus on which of these mechanisms dominates in specific conditions. Yes, indeed, vertical vorticity occurs as a result of a sharp tilt of the horizontal vorticity and simultaneous stretching. In the literature, one can find a very large number of seemingly contradictory mechanisms responsible for high values of surface vertical vorticity. All these mechanisms can be divided into two main classes [78].
The first class of mechanisms is based on the upward tilt of a horizontal vortex, which is mainly created baroclinically in a downward flow. This mechanism is called the downdraft mechanism. Recent works presenting this approach include the research of [24,79,80,81,82].
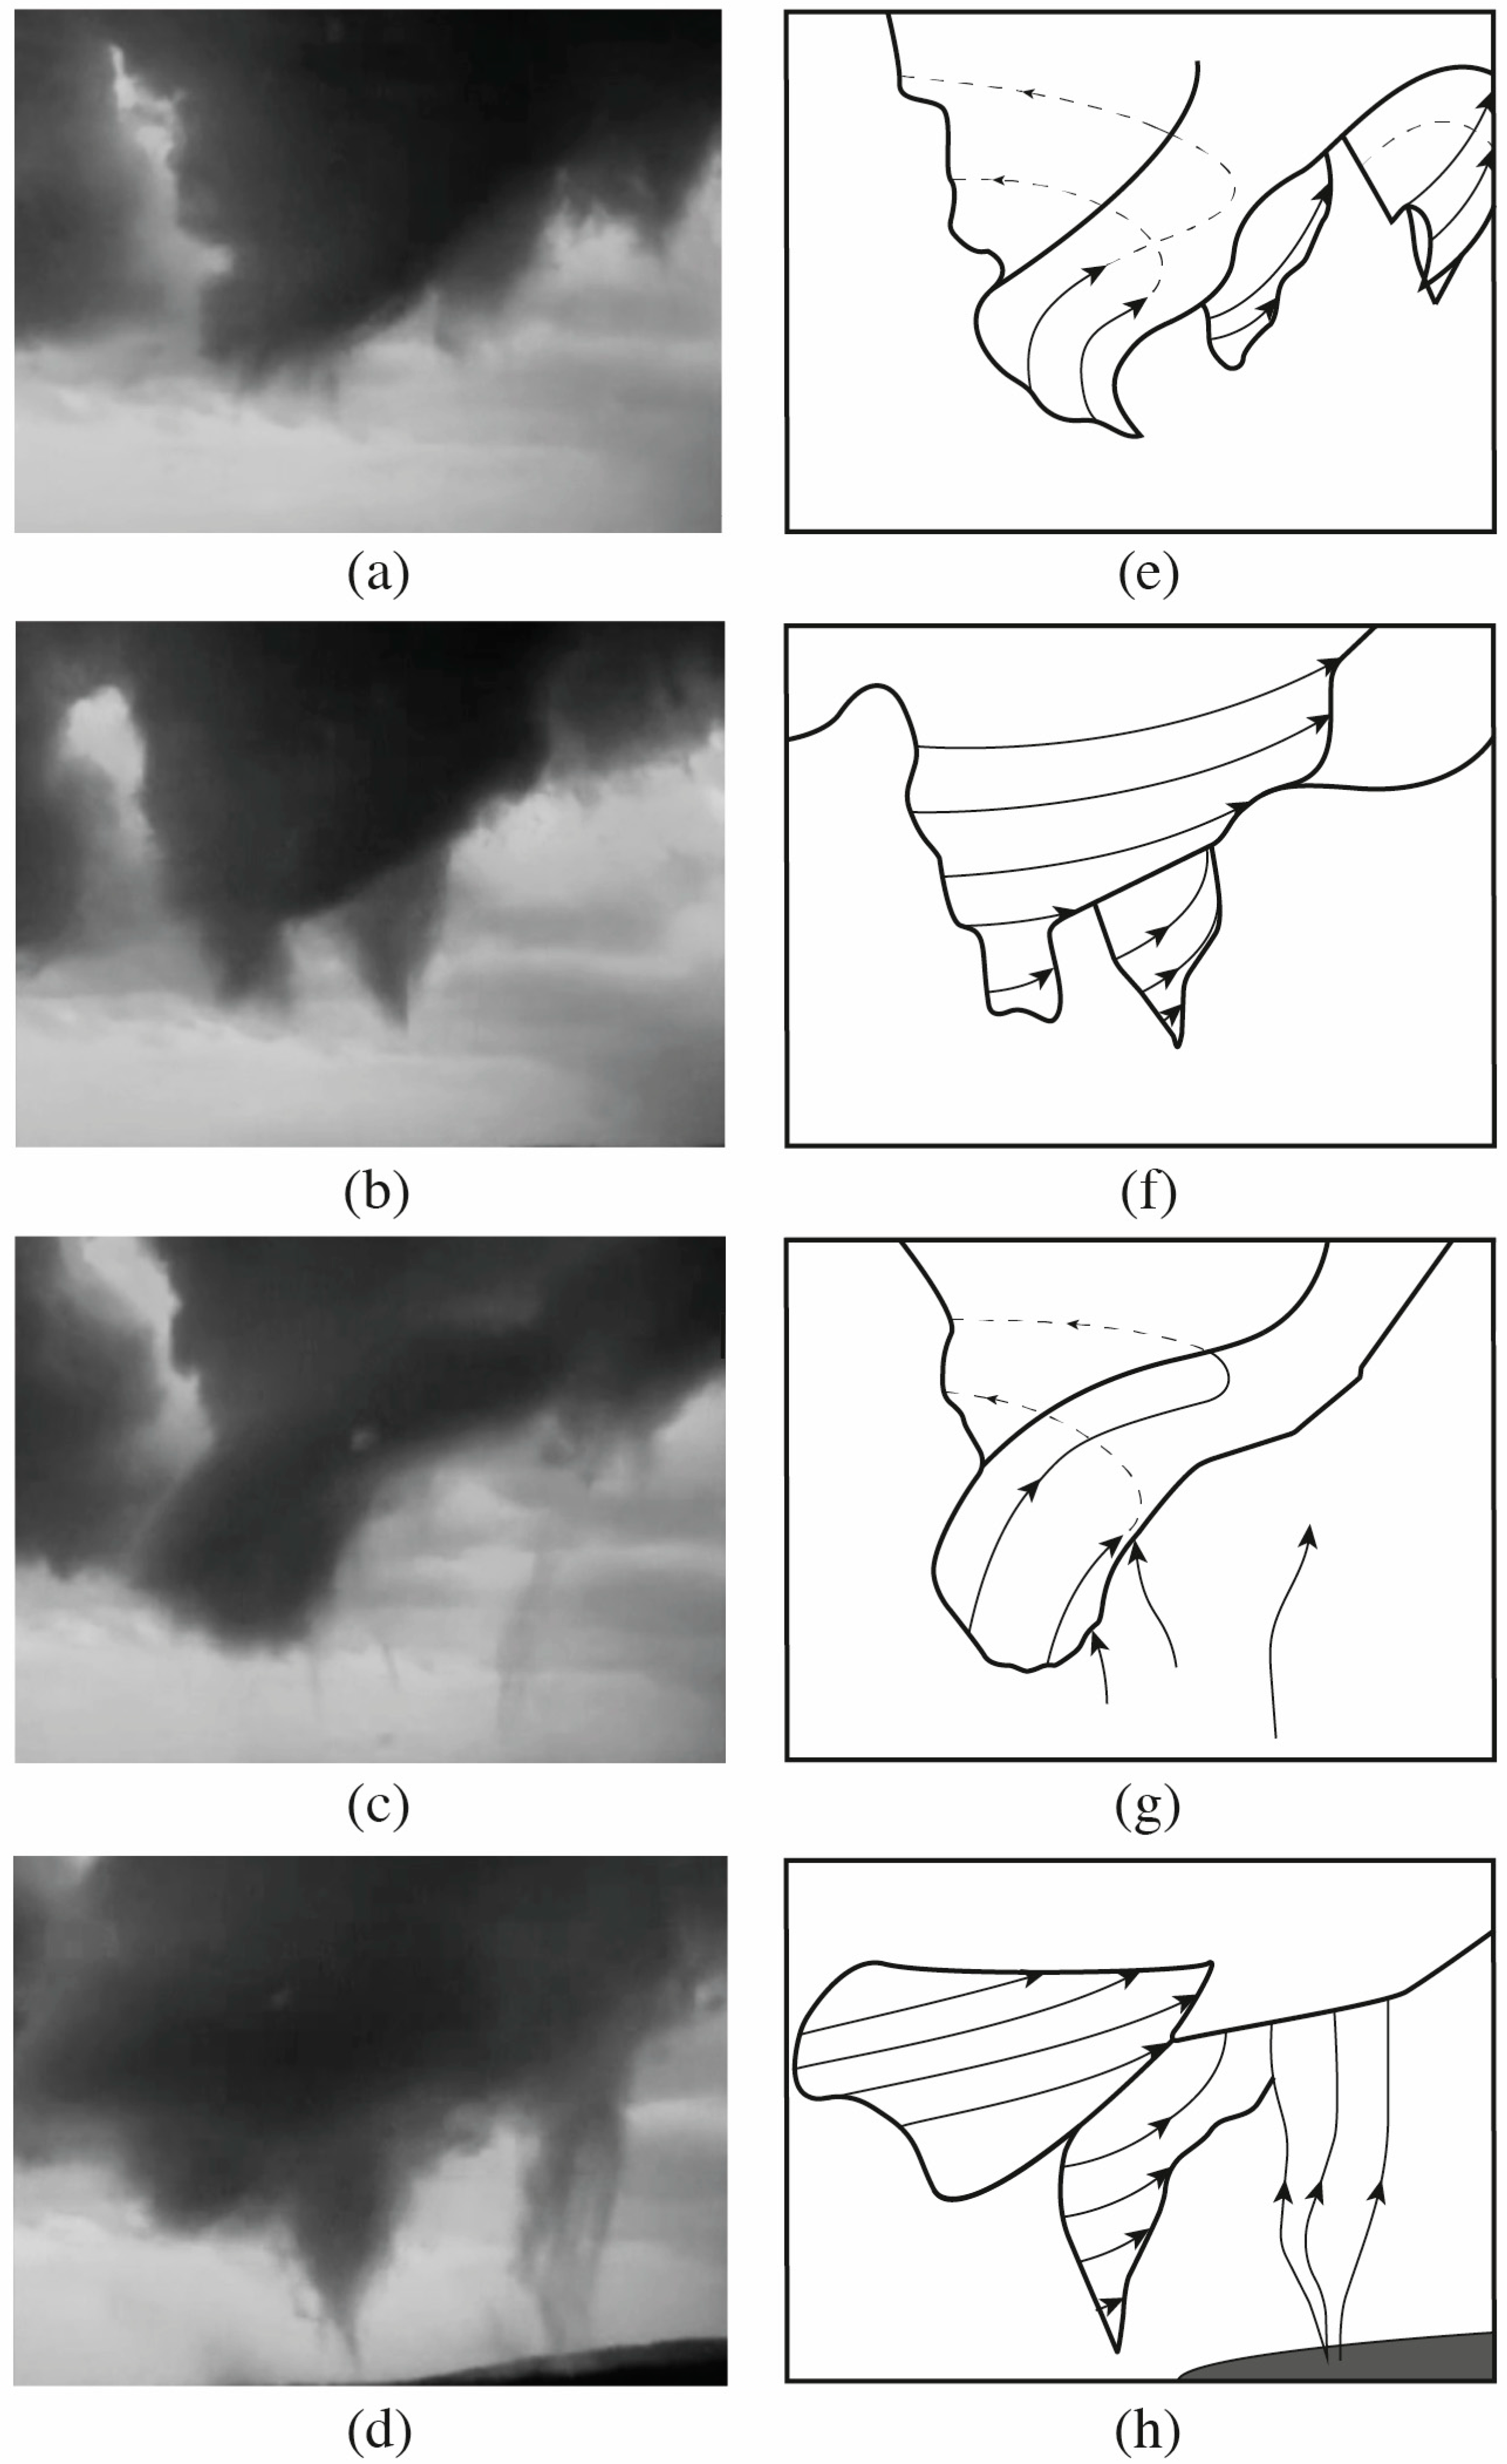
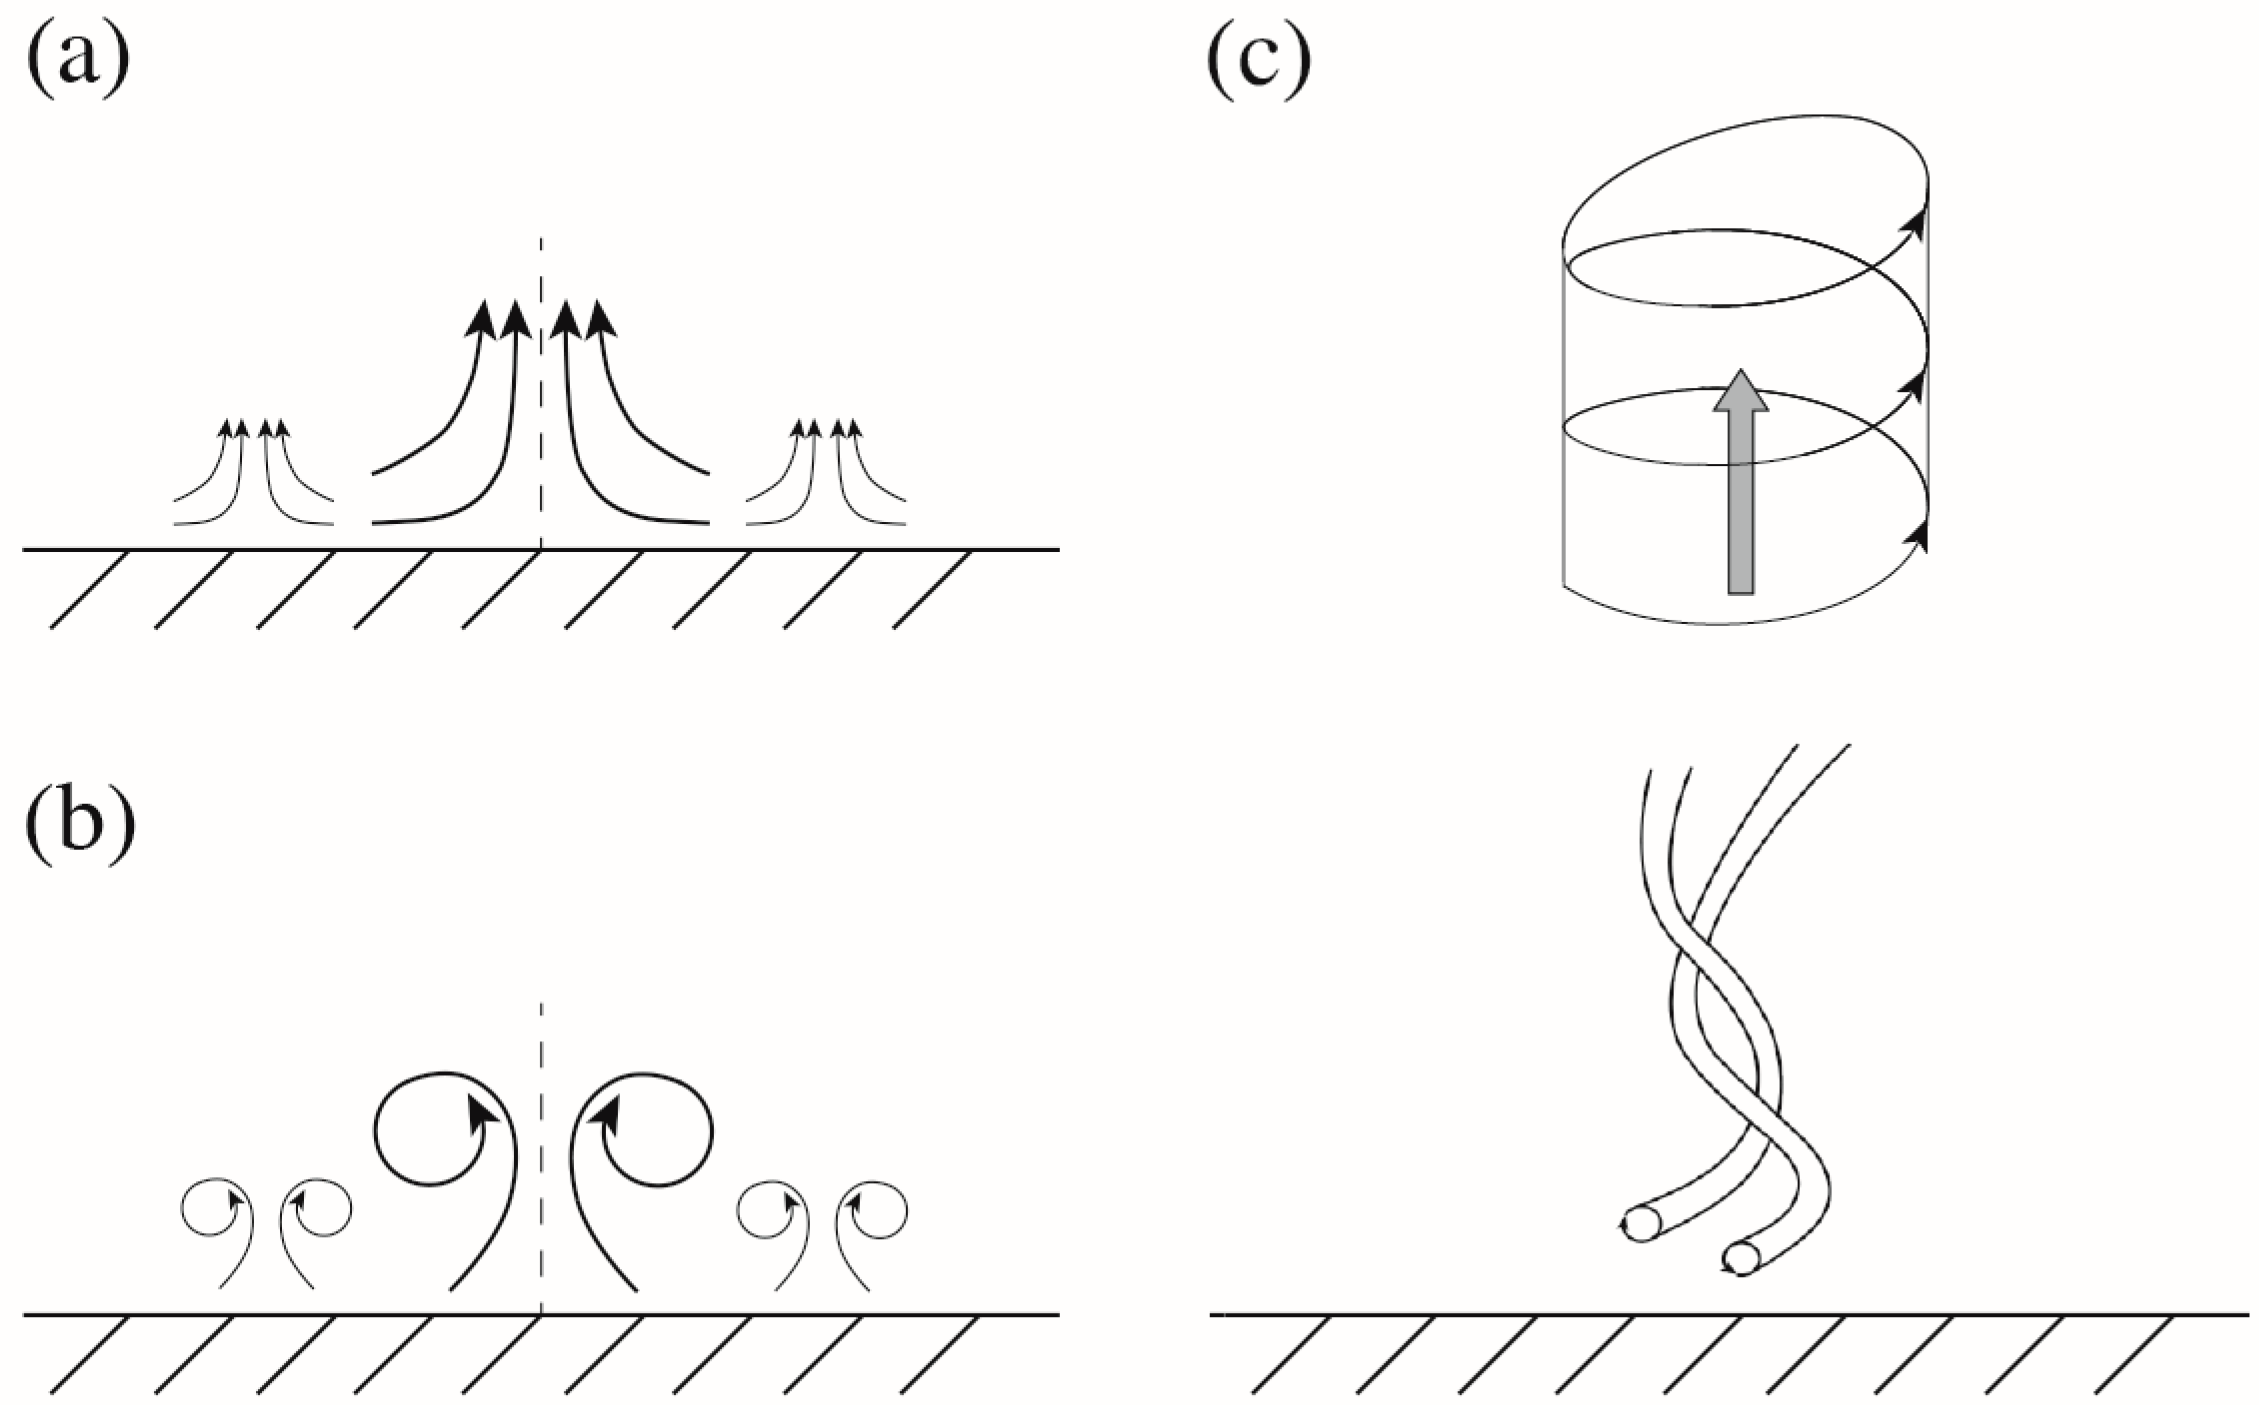
One of the interpretations of the downdraft mechanism is shown in Figure 9. Initially, there is vertical vorticity in the mesocyclone. The presence of vorticity causes a decrease in pressure, which contributes to the involvement of new portions of air. The funnel is formed from the influxes of ascending air, which are involved in the vortex motion. It should be noted that the decrease in pressure contributes to the fact that the condensation level decreases. This leads to the visual perception of ascending air flows that form a funnel as its descent. In this case, the vertical vorticity spreads lower and lower.
The second class of mechanisms is based on the upward tilt of the horizontal vorticity that is almost at the surface of the earth, and it is created by a strong horizontal gradient of the updraft (“in-and-up mechanism”). One of the interpretations of an «in-and-up mechanism» is shown in Figure 10. Recently published works [83,84,85,86,87,88,89] have illustrated this approach well.
In research [78], an important conclusion was made that there is a transition between the two mechanisms, which occurs just during tornadogenesis. This transition is the result of the axisymmetrization of the pre-tornado vortex “spot” and amplification due to vertical stretching. These processes facilitate the development of an angular flow (corner flow), the presence of which contributes to the generation of vertical vorticity by tilting up the horizontal vorticity almost at the earth’s surface, i.e., through the mechanism of an upward flow («in-and-up mechanism»). Let us also mention the works [18,90] in which the authors tried to take into account the influence of both mechanisms (“downdraft mechanism” and (“in-and-up mechanism”) on the generation and dynamics of tornadoes in their calculations.
Further in this section, the results of this work will be described, in which an attempt is made to study wall-free (not limited by walls), unsteady, and concentrated tornado-like vortices generated without the use of forced twisting. It should be noted that the study of wall-free concentrated non-stationary vortices is complicated due to a number of reasons—spontaneity of formation, spatio-temporal instability, practical impossibility of controlling characteristics, etc.
In the works described below, the features of visualization and diagnostics of wall-free, non-stationary, and concentrated vortices are considered, as well as the issues of their generation, stability, and control.
In the papers of [54,91], the fundamental possibility of a physical modeling of wall-free, concentrated air vortices without the use of forced twisting (mechanical twisting devices) was shown for the first time. Model vortex structures were produced by heating the surface of a metal sheet from below (Figure 11). The simple installation shown in the figure allowed for a controlled heating of an aluminum sheet (diameter—1100 mm and thickness—1.5 mm), leading to the generation of non-stationary vortex structures due to the creation of unstable air stratification.
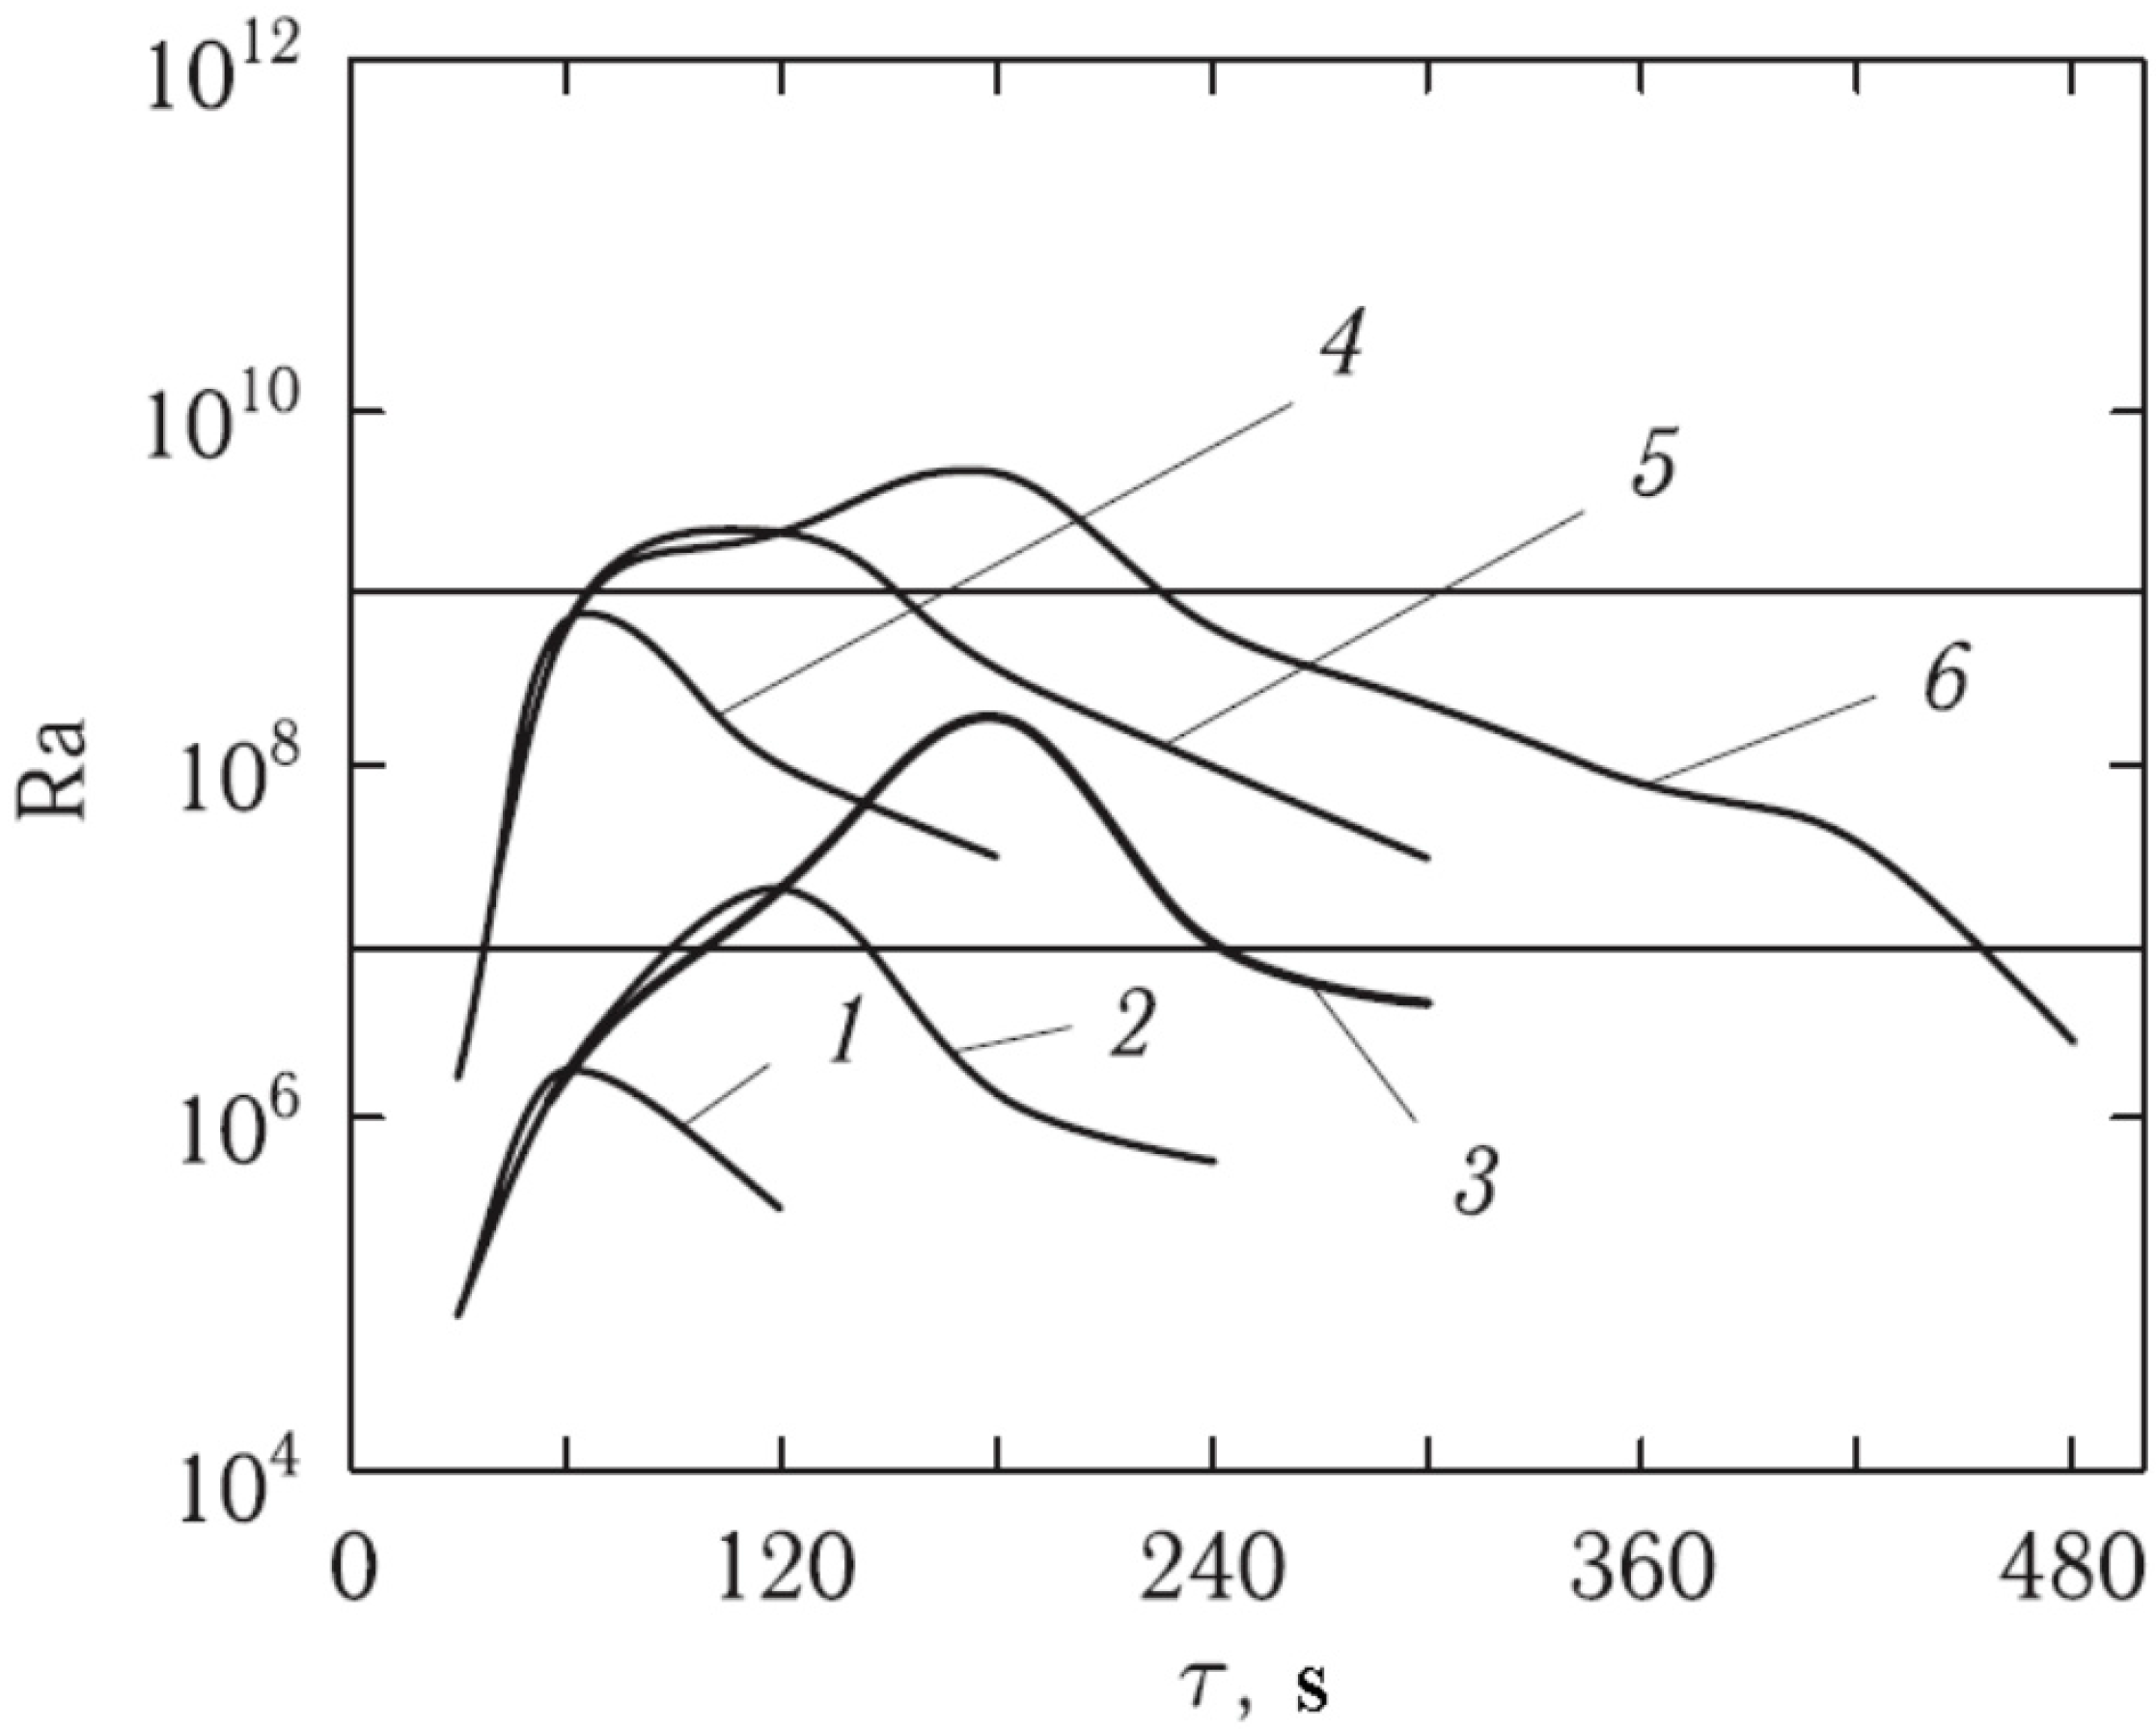
Further studies have demonstrated the possibility of stable generation (in a statistical sense [92,93,94]) of non-stationary vortices. In the research of [91,95], the thermal regimes of heating (cooling) of the underlying surface, as well as the spatio-temporal field of air temperatures, under which unstable stratification led to the formation of wall-free, concentrated vortices, were studied. The generalization of experimental data (Figure 12) obtained under various thermal regimes for the generation of non-stationary vortices was performed using the Rayleigh number Ra = ( g h 3 β Δ T ) / ( ν   a t ) . The main conclusions of these studies are the following:
(i)
The values of temperatures and the heating rates of aluminum sheet (underlying surface) and air, as well as their temperature gradients in the vertical and horizontal directions, leading to a stable (in a statistical sense) generation of wall-free vortices of varying intensity, were found;
(ii)
The ranges of Rayleigh numbers at which the generation of vortices of various intensities occurred were revealed.
Frame-by-frame analysis of the video recordings in various thermal modes allowed us to obtain important statistical information about the numerous parameters of the vortex generation process and the characteristics of the latter: (1) the temperature values at which vortices are generated; (2) the area of the underlying surface where vortices are formed; (3) the direction of rotation of the vortex structure; (4) the number of observed vortices in one experiment; (5) the trajectory of movement of the base of the vortex structure; (6) the length of the trajectory of the base of the vortex; (7) the velocity of movement of the base of the vortex; (8) the lifetime (existence) of the vortex structure; (9) the height of the vortices; (10) the diameter of the vortices, etc.
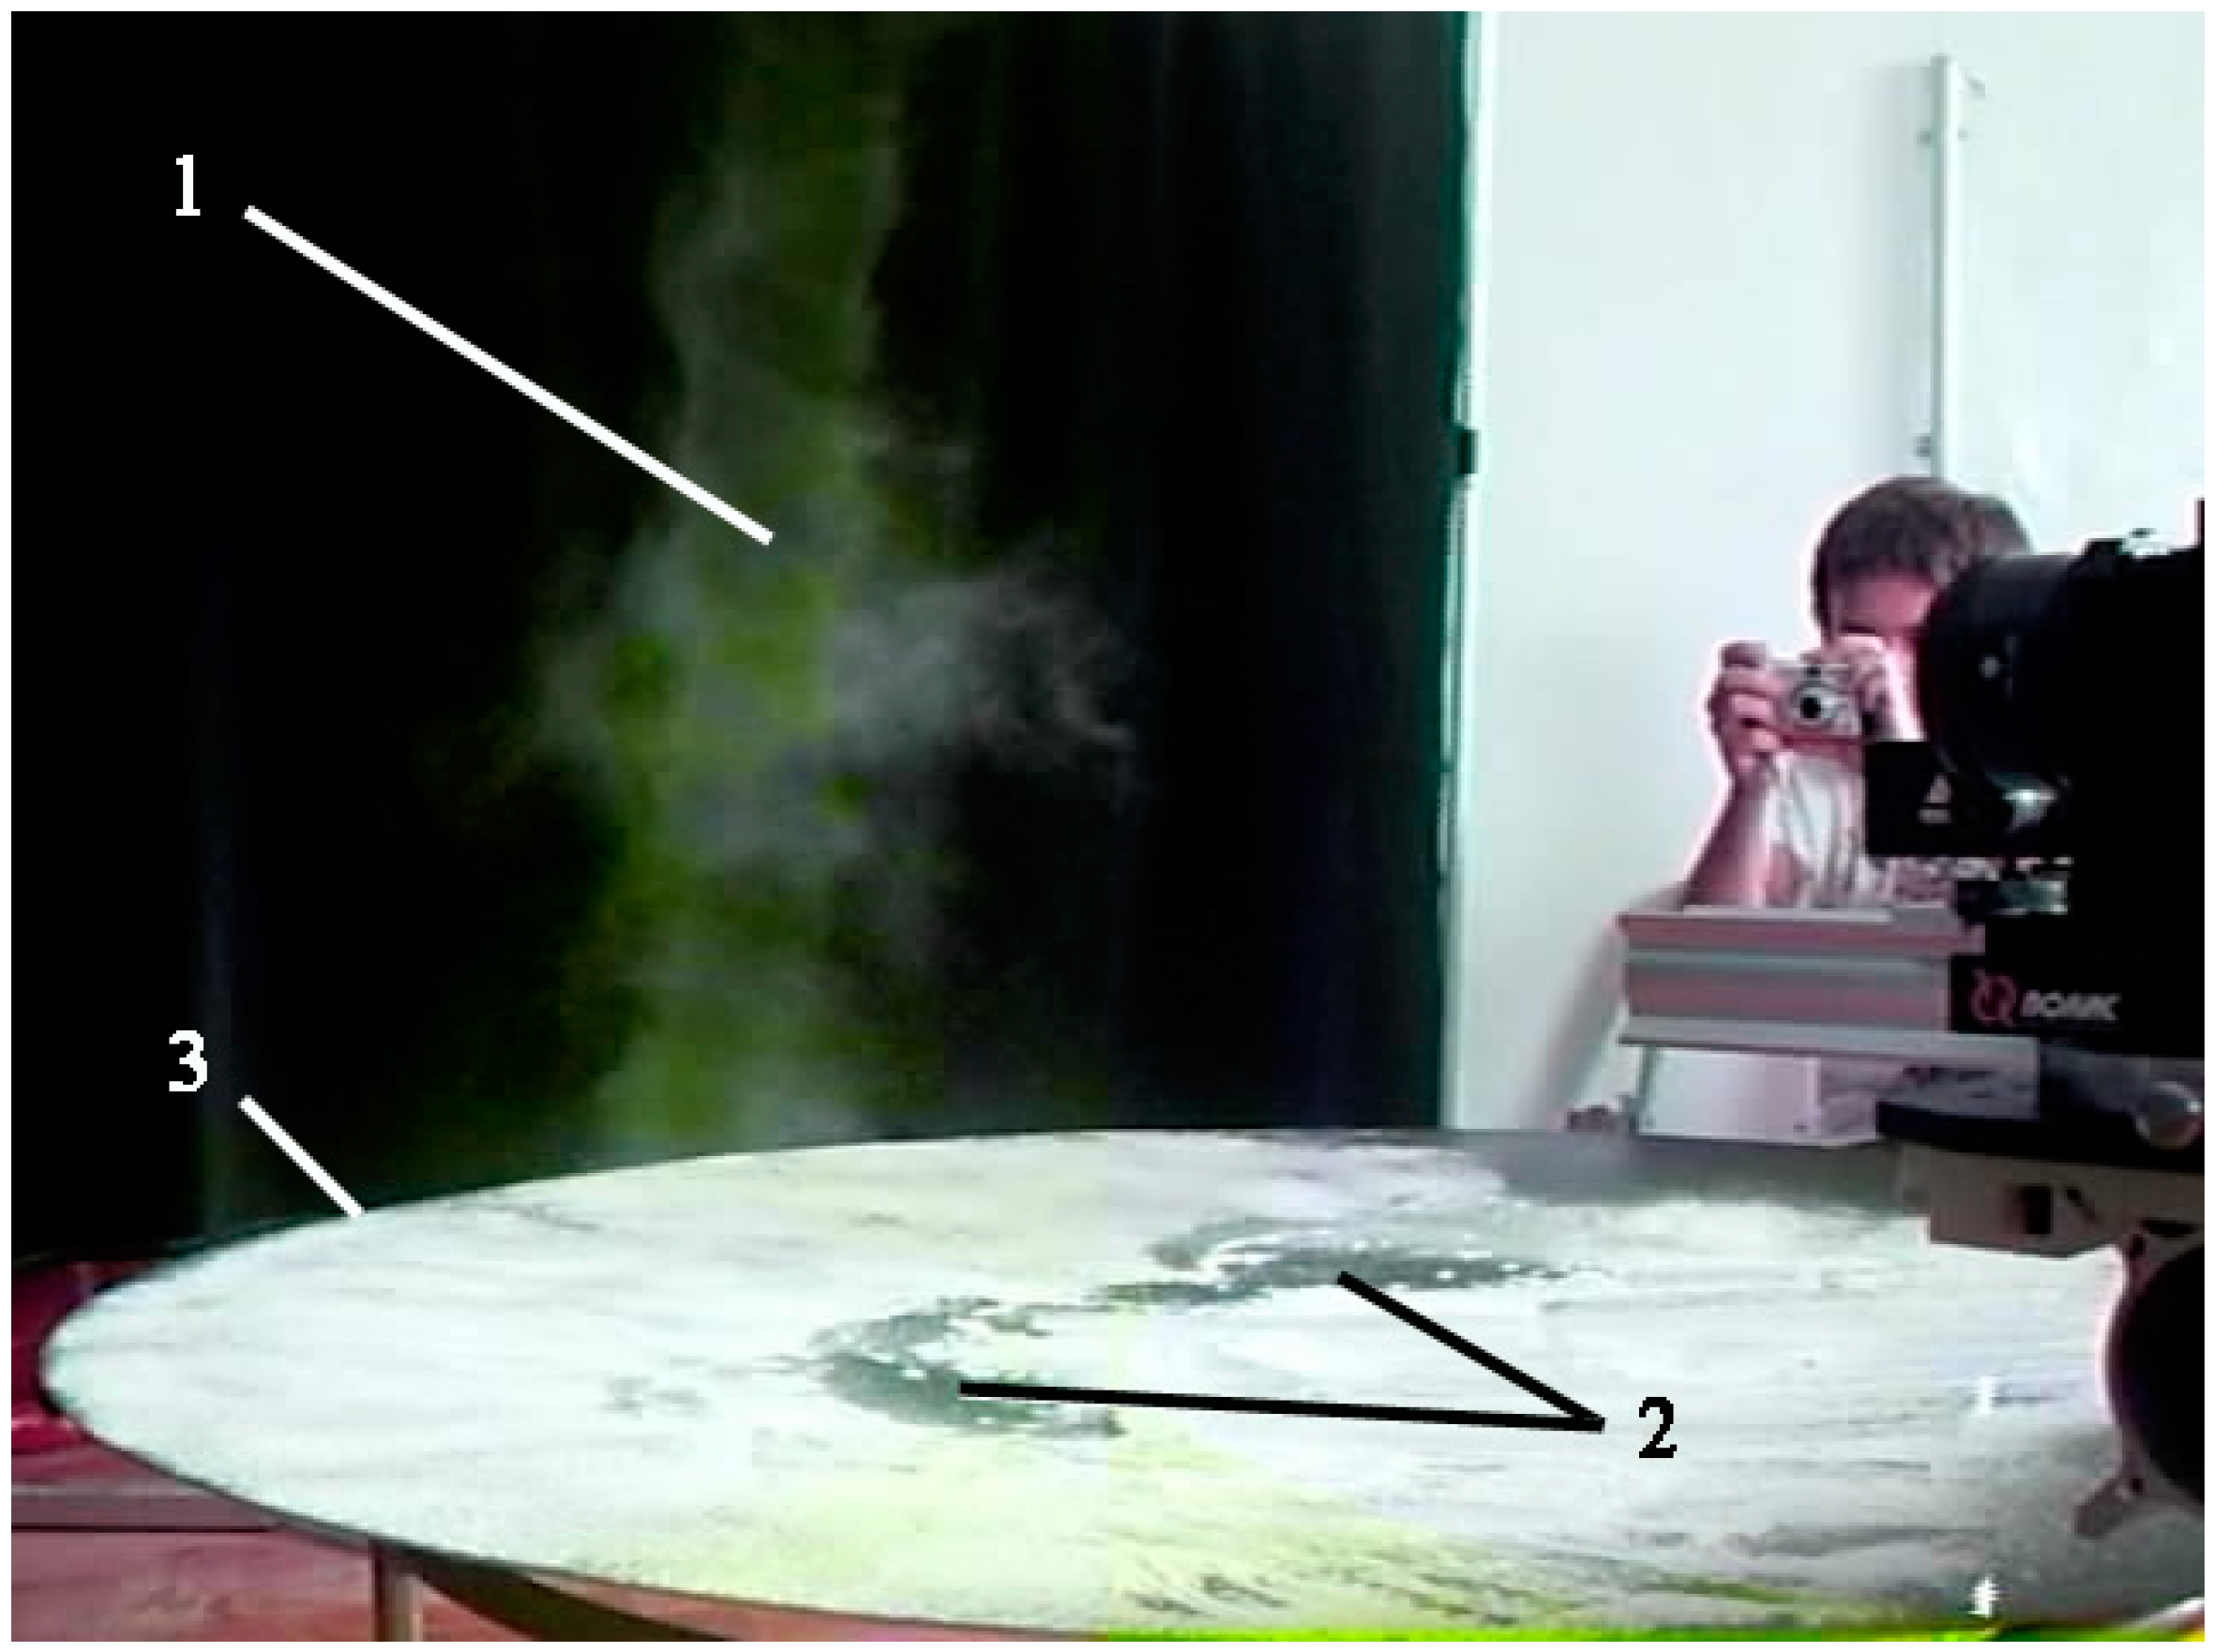
Two types of trajectories of motion of the vortex base have been found [96]. Most of the vortex structures moved along spiral trajectories (trajectories of the first type) within the annular region where their generation took place. Some vortices moved along almost the shortest and rectilinear trajectories (trajectories of the second type) from the generation region to the edge of the underlying surface, which is where they disintegrated. The maximum length of the trajectory of the base of the vortex structures was 50–100 cm at a displacement velocity of 3–7 cm/s. Thus, the maximum lifetime of the observed vortices was about 30 s. The maximum visible height of the generated vortex structures reached 1.5 m, and their maximum diameter was 0.2 m (Figure 13).
The most important problems to study are issues related to the two-phase nature of atmospheric vortices (the presence of water vapor, droplets, solid particles, debris, etc.), its effect on the vortex generation process, and its structure and dynamics [97,98,99,100,101,102,103,104,105].
In the works of [106,107], the features of visualization and diagnostics of wall-free, unsteady air vortices were studied. In [106], the visualization of vortices was carried out by means of magnesia particles applied to the underlying surface and smoke particles, as well as through using a flat light knife (laser knife). The issues of formation and development of the internal cavity of free air vortices, which is an analog of the “eye of the storm” or “eye of the hurricane”, were studied. In [107], the problem of choosing inertia parameters (density, size) of particles for visualization and diagnoses of free vortices of various intensities (characteristic velocity, funnel diameter) was considered. A dimensionless criterion was used—the Stokes number—which helps to determine the features of the behavior of solid particles in concentrated vortex structures. An example of the choice of particle characteristics for visualization of a funnel and a cascade of an air laboratory vortex was described.
In paper [108], the possibility of evaluating some dimensionless criteria (twist parameter, Rossby number) important for the physical modeling of atmospheric vortex formations (tornadoes, cyclones) in laboratory conditions was demonstrated. Knowledge of the characteristic values of the tangential velocity ( U φ O (1 m/s)) and the spatial scale for the generated laboratory vortices ( L O (0.1 m)) allowed us to estimate the Rossby number, for which ( Ro O (105) was obtained, which is close to the corresponding value for real air tornadoes ( Ro O (103–105). A non-trivial conclusion was made: the lower the velocity of the laboratory vortex of the above size (spatial scale), the closer it is (in terms of the Rossby number) to air tornadoes.
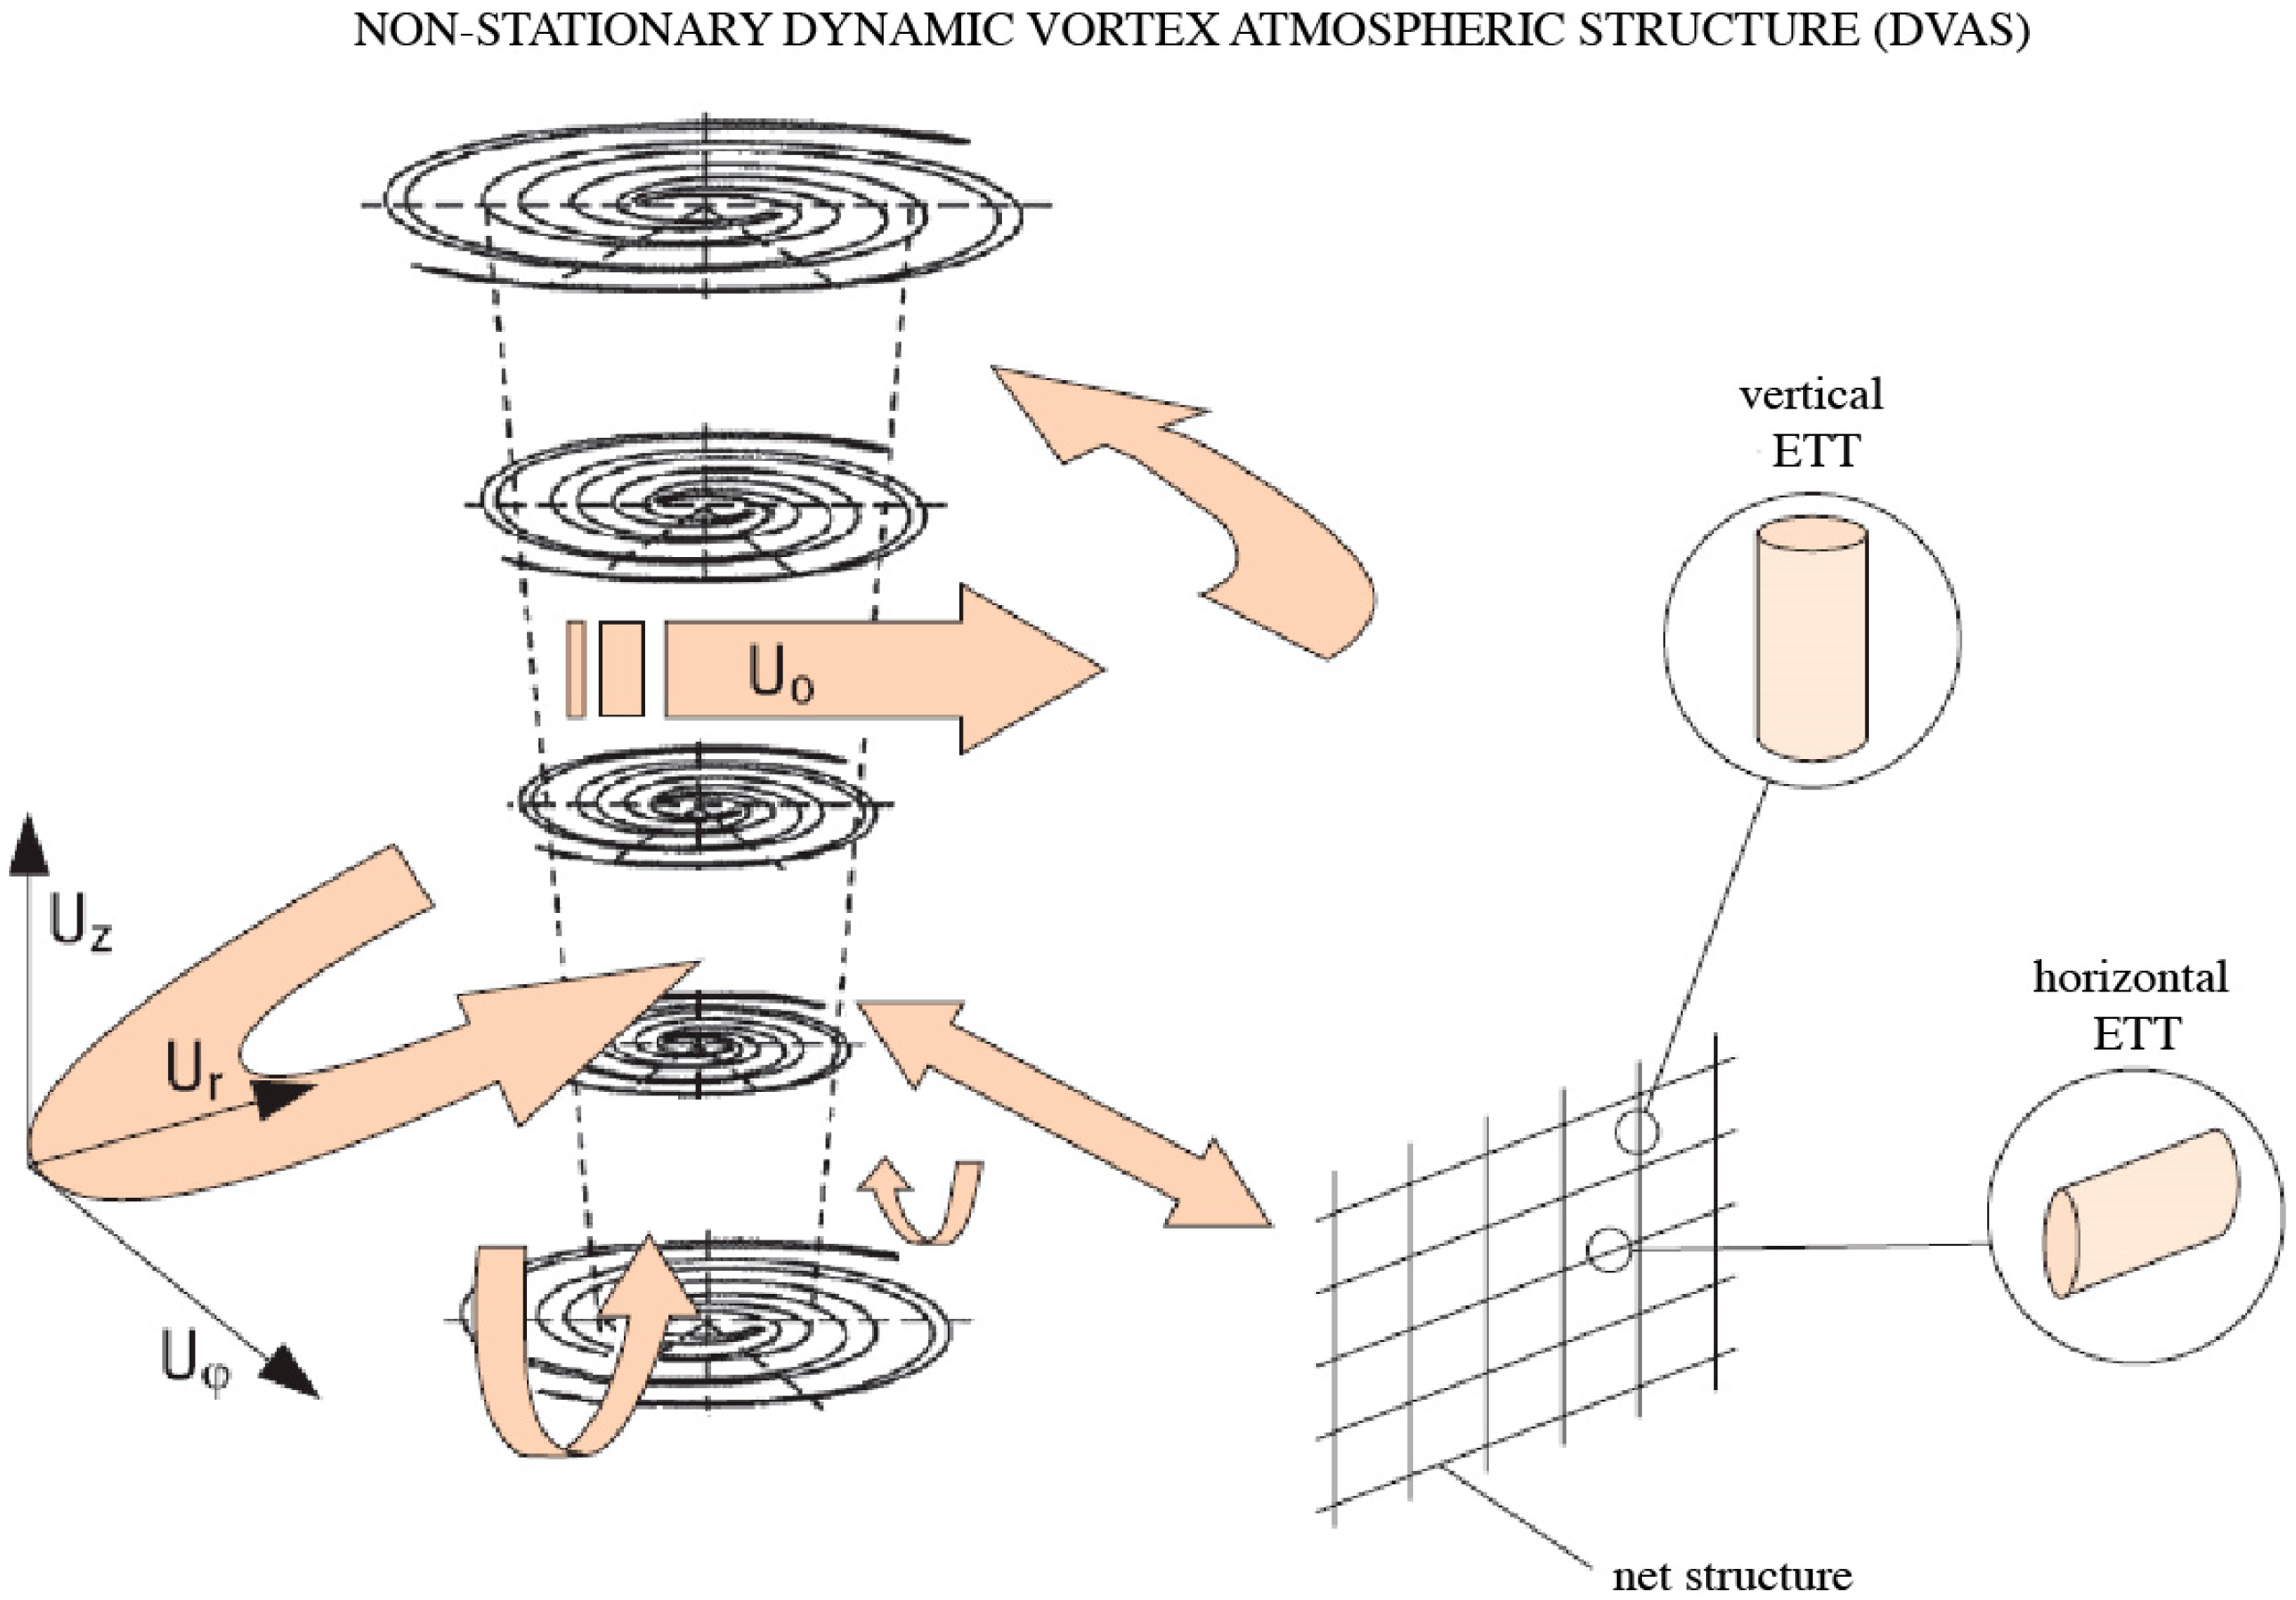
In articles [109,110,111,112,113,114,115,116,117,118,119,120], the task of studying various methods of controlling wall-free, non-stationary, and concentrated vortices, similar in structure to natural vortex formations, was formulated. A passive–active method of influencing air tornadoes was proposed, which consists in placing obstacles in the form of vertical grids on the path of their propagation (Figure 14). Experiments have been conducted to establish the influence of the vertical grids located along the path of the vortex on its dynamics.
As a result of the conducted research, six main variants of the behavior of vortices in interaction with a grid obstacle were identified. It was concluded that the use of grid barriers solves (to one degree or another) the problem of controlling the characteristics of a free vortex, leading to a change in the path of its propagation and to weakening and disintegration, although with some probability of repeated generation.
Several basic physical mechanisms of the grid’s effect on the vortex structure were highlighted. Among these mechanisms were the interactions of the small–scale turbulence generated behind the grid with the large-scale turbulent structure of the vortex, leading to a violation of its symmetry (Figure 15); to the viscous friction of air against the grid; and to the acoustic influence of vibrations coming from the grid toward the vortex.

6. Conclusions

In the last few decades, there has been considerable interest in the experimental study of tornado-like vortices in the laboratory. The analysis of works in which various types of concentrated vortices are studied in laboratory conditions has been carried out: (i) wall-bounded, stationary, and tornado-like vortices; (ii) wall-free, quasi-stationary, and tornado-like vortices; and (iii) wall-free, non-stationary, and tornado-like vortices.
Tobacco smoke, dry ice, smoke produced by boiling liquid, and tracer particles of micrometer sizes have been used to visualize the generated vortex structures. In early works, photo and video shooting, pressure sensors for measuring the distribution of static pressure on the surface, and different hot-wire anemometers for the distribution of various velocity components were used for diagnostics. In later studies, various modifications of PIV were added to them, allowing for the measurement of fields of time-averaged and fluctuation velocities, as well as for turbulent stresses.
The purpose of the vast majority of experimental studies performed was to create stationary (as far as possible), tornado-like vortices using various twisting devices. Along with the main advantage of the convenience of studying stationary and wall-bound, tornado-like vortices, there are a number of disadvantages in this formulation. Let us list them:
(i)
All the main problems of studies of unsteady atmospheric vortices unlimited by walls (generation conditions, stability studies, the possibility of control) remain out of consideration;
(ii)
The impossibility of modeling the two main mechanisms of tornadogenesis, namely the convective instability of the atmosphere at the lower level (“in-and-up mecha-nism”), as well as the occurrence of a supercellular at the upper level («downdraft mechanism»);
(iii)
The inability to study important issues related to the two-phase nature of an atmospheric vortex (the presence of water vapor, droplets, solid particles, debris, etc.) and its effect on the vortex generation process, its structure, and its dynamics.
The results of works in which an attempt was made to study free (not limited by walls), non-stationary, concentrated, and tornado-like vortices generated without the use of forced swirl have been described. The study of free, concentrated, and non-stationary vortices is complicated due to a number of reasons—spontaneity of formation, spatiotemporal instability, practical impossibility of controlling characteristics, etc. The above significantly complicates the physical modeling of such vortices.
In our opinion, further progress in the development of the theory of non-stationary, concentrated, and tornado-like vortices (non-stationary, concentrated, and tornado-like flows) will determine the possibility of setting up the following studies:
(i)
Conducting experiments with higher spatial and temporal resolution in order to study the mechanisms of vortex generation in the surface layer (near the surface);
(ii)
Conducting experiments to determine the factors contributing to the stabilization (strengthening) and destabilization (weakening) of the generated vortices;
(iii)
Conducting experiments in order to find methods and means of controlling (combating) vortices.
In conclusion, the authors express the hope that this work will give some additional impetus to the continuation of further research in order to build a theory of non-stationary, concentrated, and tornado-like vortices, which is important for solving a number of applied aerospace problems. This review will give impetus to the study of vortices, as well as to vortex burners and cyclone separators [121,122,123,124,125].

Author Contributions

Conceptualization, A.Y.V.; formal analysis, S.V.R.; data curation, A.Y.V.; writing—original draft preparation, A.Y.V.; writing—review and editing, S.V.R.; visualization, A.Y.V. All authors have read and agreed to the published version of the manuscript.

Funding

This work was supported by the Ministry of Science and Higher Education of the Russian Federation (State Assignment Nos. FSFN-2024-0022 and 075-00270-24-00).

Data Availability Statement

Not applicable.

Acknowledgments

The authors express their sincere gratitude to Varaksina V.A. for her great help in editing the figures and preparing the graphic materials of the manuscript.

Conflicts of Interest

The authors declare no conflicts of interest.

Nomenclature

r Distance from axis in radial direction, m
r 0 Vortex radius, m
r 1 Radius of updraft region (radius of entrance to upper chamber), m
r s Radius of rotating screen (radius of the lower chamber), m
h Depth of the inflow layer and the typical vertical dimension, over which the temperature difference is observed, m
L Spatial scale, m
U z Axial velocity at the entrance to upper chamber, m/s
U r Radial velocity, m/s
U r s Radial velocity at the screen input, m/s
U φ Azimuthal velocity, m/s
U φ s Azimuthal velocity at the screen input, m/s
v r Radial fluctuation velocity, m/s
v z Axial fluctuation velocity, m/s
v φ Azimuthal fluctuation velocity, m/s
g Gravity acceleration, m/s2
ν Kinematic viscosity, m2/s
a t Thermal diffusivity, m2/s
Γ Circulation, m2/s
Q Volume flow rate per unit axial length through the chamber, m2/s
τ h Time of heating, s
T c max Maximal temperature at the center, K
Δ T The temperature difference that causes the convection, K
β Coefficient of volumetric expansion, K−1
a Geometric aspect ratio
S Swirl ratio
σ r z Intensity of turbulent fluctuations (meridian plane)
σ r φ Intensity of turbulent fluctuations (horizontal plane)
Ra Rayleigh number
Re r Radial Reynolds number
Re φ Vortex Reynolds number
Ro Rossby number
Superscripts
( ) Deviation from the mean
( ¯ ) Average (over time) value
Subscripts
max Maximum value

References

  1. Saffman, P.G. Vortex Dynamics; Cambridge University Press: Cambridge, UK, 1992. [Google Scholar]
  2. Alekseenko, S.; Kuibin, P.; Okulov, V. Theory of Concentrated Vortices: An Introduction; Spinger: Berlin/Heidelberg, Germany, 2007; 506p. [Google Scholar]
  3. Bluestein, H.B. Severe Convective Storms and Tornadoes: Observations and Dynamics; Spinger Science & Business Media: Berlin/Heidelberg, Germany, 2013; 456p. [Google Scholar]
  4. Varaksin, A.Y.; Romash, M.E.; Kopeitsev, V.N. Tornado; Begell House: New York, NY, USA, 2015; 394p. [Google Scholar]
  5. Davies-Jones, R.P.; Kessler, E. Tornadoes. In Weather and Climate Modification; Hess, W.N., Ed.; Jon Wiley and Sons: New York, NY, USA, 1974; pp. 552–595. [Google Scholar]
  6. Lewellen, W.S. Theoretical Models of the Tornado Vortex. In Proceedings of the A Simposium on Tornadoes Assessment of Knowledge and Implications for Man; Hess, W.N., Ed.; Weather and Climate Modification. Texas Tech University: Lubbock, TX, USA, 1976; pp. 107–143. [Google Scholar]
  7. Shuleikin, V.V. Calculation of Development, Movement, and Attenuation of Tropical Storms and Major Waves Produced by Hurricanes; Gidrometeoizdat: Leningrad, Russia, 1978; 96p. (In Russian) [Google Scholar]
  8. Rotunno, R. The fluid dynamics of tornadoes. Annu. Rev. Fluid Mech. 2013, 45, 59–84. [Google Scholar] [CrossRef]
  9. Finley, A.J.; Brun, A.S.; Carlsson, M.; Szydlarski, M.; Hansteen, V.; Shoda, M. Stirring the base of the solar wind: On heat transfer and vortex formation. Astron. Astrophys. 2022, 665, A118. [Google Scholar] [CrossRef]
  10. Barczynski, K.; Schmieder, B.; Peat, A.W.; Labrosse, N.; Mein, P.; Mein, N. Spectro-imagery of an active tornado-like prominence: Formation and evolution. Astron. Astrophys. 2021, 653, A94. [Google Scholar] [CrossRef]
  11. Vasheghani Farahani, S.; Ghanbari, E.; Ghaffari, G.; Safari, H. Torsional wave propagation in solar tornadoes. Astron. Astrophys. 2017, 599, A19. [Google Scholar] [CrossRef]
  12. Agee, E.; Taylor, L. Historical analysis of U.S. tornado fatalities (1808–2017): Population, science and technology. Weather. Clim. Soc. 2019, 11, 355–368. [Google Scholar] [CrossRef]
  13. Anderson-Frey, A.K. Tornado fatalities: An environmental perspective. Weather Forecast. 2019, 34, 1999–2015. [Google Scholar] [CrossRef]
  14. Alexander, C.R.; Wurman, J. The 30 May 1998 Spencer, South Dakota, storm. Part I: The structural evolution and environment of the tornadoes. Mon. Weather Rev. 2005, 133, 72–96. [Google Scholar] [CrossRef]
  15. Wurman, J.; Alexander, C.R. The 30 May 1998 Spencer, South Dakota, storm. Part II: Comparison of observed damage and radar-derived winds in the tornadoes. Mon. Weather Rev. 2005, 133, 97–119. [Google Scholar] [CrossRef]
  16. Kosiba, K.A.; Wurman, J.; Richardson, Y.; Markowski, P.; Robinson, P.; Marquis, J.N. Genesis of the Goshen county, Wyoming, tornado on 5 june 2009 during VORTEX. Mon. Weather Rev. 2013, 141, 1157–1182. [Google Scholar] [CrossRef]
  17. Trapp, R.J.; Kosiba, K.A.; Marquis, J.N.; Kumjian, M.R.; Nesbitt, S.W.; Wurman, J.; Salio, P.; Grover, M.A.; Robinson, P.; Hence, D.A. Multi-platform and multiple-doppler radar observations of a supercell thunderstorm in South America during RELAMPAGO. Mon. Weather Rev. 2020, 148, 3225–3241. [Google Scholar] [CrossRef]
  18. Flournoy, M.D.; Coniglio, M.C. Origins of vorticity in a simulated tornadic mesovortex observed during PECAN on 6 July. Mon. Weather Rev. 2019, 147, 107–134. [Google Scholar] [CrossRef]
  19. Lewellen, D.C.; Lewellen, W.S. Near-surface intensification of tornado vortices. J. Atmos. Sci. 2007, 64, 2176–2194. [Google Scholar] [CrossRef]
  20. Lewellen, D.C.; Lewellen, W.S. Near-surface vortex intensification through corner flow collapse. J. Atmos. Sci. 2007, 64, 2195–2209. [Google Scholar] [CrossRef]
  21. Kuzenov, V.V.; Ryzhkov, S.V. Evaluation of hydrodynamic instabilities in inertial confinement fusion target in a magnetic field. Probl. At. Sci. Technol. 2013, 4, 103–107. [Google Scholar]
  22. Romadanov, I.; Smolyakov, A.; Raitses, Y.; Kaganovich, I.; Tian, T.; Ryzhkov, S. Structure of nonlocal gradient-drift instabilities in Hall E×B discharges. Phys. Plasmas 2016, 23, 122111. [Google Scholar] [CrossRef]
  23. Roberts, B.; Xue, M.; Dawson, D.T. The effect of surface drag strength on mesocyclone intensification and tornadogenesis in idealized supercell simulations. J. Atmos. Sci. 2020, 77, 1699–1721. [Google Scholar] [CrossRef]
  24. Fischer, J.; Dahl, J.M.L. The relative importance of updraft and cold pool characteristics in supercell tornadogenesis using highly idealized simulations. J. Atmos. Sci. 2020, 77, 4089–4107. [Google Scholar] [CrossRef]
  25. Davies-Jones, R. Invented forces in supercell models. J. Atmos. Sci. 2021, 78, 2927–2939. [Google Scholar] [CrossRef]
  26. Varaksin, A.Y.; Ryzhkov, S.V. Particle-Laden and Droplet-Laden Two-Phase Flows Past Bodies (a Review). Symmetry 2023, 15, 388. [Google Scholar] [CrossRef]
  27. Varaksin, A.Y.; Ryzhkov, S.V. Mathematical modeling of structure and dynamics of concentrated tornado-like vortices: A review. Mathematics 2023, 11, 3293. [Google Scholar] [CrossRef]
  28. Ying, S.J.; Chang, C.C. Exploratory model study of tornado-like vortex dynamics. J. Atmos. Sci. 1970, 27, 3–14. [Google Scholar] [CrossRef]
  29. Wan, C.A.; Chang, C.C. Measurement of the velocity field in a simulated tornado-like vortex using a three-dimensional velocity probe. J. Atmos. Sci. 1972, 29, 116–127. [Google Scholar] [CrossRef]
  30. Ward, N.B. The exploration of certain features of tornado dynamics using laboratory model. J. Atmos. Sci. 1972, 29, 1194–1204. [Google Scholar] [CrossRef]
  31. Jischke, M.C.; Parang, M. Properties of simulated tornado-like vortices. J. Atmos. Sci. 1974, 31, 506–512. [Google Scholar] [CrossRef]
  32. Leslie, F.W. Surface roughness effects on suction vortex formation: A laboratory simulation. J. Atmos. Sci. 1977, 34, 1022–1027. [Google Scholar] [CrossRef]
  33. Lewellen, W.S. A solution for three-dimensional vortex flows with strong circulation. J. Fluid Mech. 1962, 14, 420–432. [Google Scholar] [CrossRef]
  34. Church, C.R.; Snow, J.T.; Agee, E.M. Tornado vortex simulation at Purdue University. Bull. Am. Meteorol. Soc. 1977, 58, 900–908. [Google Scholar] [CrossRef]
  35. Baker, G.L.; Church, C.R. Measurements of core radii and peak velocities in modeled atmospheric vortices. J. Atmos. Sci. 1979, 36, 2413–2423. [Google Scholar] [CrossRef]
  36. Church, C.R.; Snow, J.T. The dynamics of natural tornadoes as inferred from laboratory simulations. J. Rech. Atmos. 1979, 12, 111–133. [Google Scholar]
  37. Snow, J.T.; Church, C.R.; Barnhart, B.J. An investigation of the surface pressure fields beneath simulated tornado cyclones. J. Atmos. Sci. 1980, 37, 1013–1026. [Google Scholar] [CrossRef]
  38. Wang, H.; James, D.L.; Letchford, C.W.; Peterson, C.; Snow, J.T. Development of a prototype tornado simulator for the assessment of fluid-structure interaction. Clemson, S.C., Ed. In Proceedings of the 1st Americas Conference Wind Engineering, Clemson, SC, USA, 4–6 June 2001. [Google Scholar]
  39. Mishra, A.R.; James, D.L.; Letchford, C.W. Physical simulation of a single-celled tornado-like vortex, Part A: Flow field characterization. J. Wind Eng. Ind. Aerodyn. 2008, 96, 1243–1257. [Google Scholar] [CrossRef]
  40. Mishra, A.R.; James, D.L.; Letchford, C.W. Physical simulation of a single-celled tornado-like vortex, Part B: Wind loading on a cubical model. J. Wind Eng. Ind. Aerodyn. 2008, 96, 1258–1273. [Google Scholar] [CrossRef]
  41. Lee, J.J.; Samaras, T.M.; Young, C.R. Pressure measurements at the ground in an F-4 tornado. In Proceedings of the AMS 22nd Conference on Severe Local Storms, Hyannis, MA, USA, 3 October 2004. [Google Scholar]
  42. Gallus, W.A.; Sarkar, P.; Haan, F.; Le, K.; Kardell, R.; Wurman, J. A translating tornado simulator for engineering tests: Comparison of radar, numerical model, and simulating winds. In Proceedings of the AMS 22nd Conference on Severe Local Storms, Hyannis, MA, USA, 3 October 2004. [Google Scholar]
  43. Haan, F.L.; Sarkar, P.P.; Gallus, W.A. Design, construction and performance of a large tornado simulator for wind engineering applications. Eng. Struct. 2008, 30, 1146–1159. [Google Scholar] [CrossRef]
  44. Razavi, A.; Sarkar, P.P. Laboratory investigation of the effects of translation on the near-ground tornado flow field. Wind Struct. 2018, 26, 179–190. [Google Scholar]
  45. Zhang, W.; Sarkar, P.P. Near-ground tornado-like vortex structure resolved by particle image velocimetry (PIV). Exp. Fluids 2012, 52, 479–493. [Google Scholar] [CrossRef]
  46. Tari, H.P.; Gurka, R.; Hangan, H. Experimental investigation of tornado-like vortex dynamics with swirl ratio: The mean and turbulent flow fields. J. Wind Eng. Ind. Aerodyn. 2010, 98, 936–944. [Google Scholar] [CrossRef]
  47. Razavi, A.; Zhang, W.; Sarkar, P.P. Effect of ground roughness on near-surface flow field of a tornado-like vortex. Exp. Fluids 2018, 59, 170. [Google Scholar] [CrossRef]
  48. Liu, Z.; Ishihara, T. Study of the effects of translation and roughness on tornado-like vortices by large-eddy simulations. J. Wind Eng. Ind. Aerodyn. 2008, 151, 1–24. [Google Scholar] [CrossRef]
  49. Refan, M.; Hangan, H. Characterization of tornado-like flow fields in a new model scale wind testing chamber. J. Wind Eng. Ind. Aerodyn. 2016, 151, 107–121. [Google Scholar] [CrossRef]
  50. Refan, M.; Hangan, H. Near surface experimental exploration of tornado vortices. J. Wind Eng. Ind. Aerodyn. 2018, 175, 120–135. [Google Scholar] [CrossRef]
  51. Ashrafi, A.; Romanic, D.; Kassab, A.; Hangan, H.; Ezami, N. Experimental investigation of large-scale tornado-like vortices. J. Wind Eng. Ind. Aerodyn. 2021, 208, 104449. [Google Scholar] [CrossRef]
  52. Refan, M.; Hangan, H.; Wurman, J. Reproducing tornadoes in laboratory using proper scaling. J. Wind Eng. Ind. Aerodyn. 2014, 135, 136–148. [Google Scholar] [CrossRef]
  53. Ashton, R.; Refan, M.; Iungo, J.V.; Hangan, H. Wandering corrections from PIV measurements of tornado-like vortices. J. Wind Eng. Ind. Aerodyn. 2019, 189, 163–172. [Google Scholar] [CrossRef]
  54. Varaksin, A.Y.; Romash, M.E.; Kopeitsev, V.N.; Taekin, S.I. The possibility of physical simulation of air tornados under laboratory conditions. High Temp. 2008, 46, 888–891. [Google Scholar] [CrossRef]
  55. Kurgansky, M.V. A simple model of dry convective helical vortices (with applications to the atmospheric dust devil). Dyn. Atmos. Ocean. 2005, 40, 151–162. [Google Scholar] [CrossRef]
  56. Balme, M.; Greely, R. Dust devils on Earth and Mars. Rev. Geophys. 2006, 44, RG3003. [Google Scholar] [CrossRef]
  57. Kurgansky, M.V. Size distriution of dust devils in the atmosphere. Izv. Atmos. Ocean. Phys. 2006, 42, 319–325. [Google Scholar] [CrossRef]
  58. Kurgansky, M.V.; Montecinos, A.; Villagran, V.; Metzger, S.M. Micrometeorological conditions for dust-devil occurrence in the Atacama Desert. Bound.-Layer Meteorol. 2010, 138, 285–298. [Google Scholar] [CrossRef]
  59. Kurgansky, M.V.; Lorenz, R.D.; Renno, N.O.; Takemi, T.; Gu, Z.; Wei, W. Dust devil steady-state structure from a fluid dynamics perspective. Space Sci. Rev. 2016, 203, 209–244. [Google Scholar] [CrossRef]
  60. Kurgansky, M.V. Statistical distribution of atmospheric dust devils on Earth and Mars. Bound.-Layer Meteorol. 2022, 184, 381–400. [Google Scholar] [CrossRef]
  61. Kurgansky, M.V. Symmetric stability of vertical baroclinic vortices with a warm core. Izv. Atmos. Ocean. Phys. 2023, 59, 211–223. [Google Scholar] [CrossRef]
  62. Fujita, T.T. Tornadoes around the world. J. Weather. 1973, 26, 56–83. [Google Scholar] [CrossRef]
  63. Wakimoto, R.; Wilson, J.W. Non-supercell tornadoes. Mon. Weather. Rev. 1989, 117, 1113–1140. [Google Scholar] [CrossRef]
  64. Greeley, R.; Balme, M.R.; Iversen, J.D.; Metzger, S.; Mickelson, R.; Phoreman, J.; White, B. Martian dust devils: Laboratory simulations of particle threshold. J. Geophys. Res. 2003, 108, 5041. [Google Scholar] [CrossRef]
  65. Neakrase, L.D.V.; Greeley, R.; Iversen, J.D.; Balme, M.R.; Eddlemon, E.E. Dust flux within dust devils: Preliminary laboratory simulations. J. Geophys. Res. 2006, 33, L19S09. [Google Scholar] [CrossRef]
  66. Neakrase, L.D.V.; Greeley, R. Dust devils in the laboratory: Effects of surface roughness on vortex dynamics. J. Geophys. Res. 2010, 115, E05003. [Google Scholar] [CrossRef]
  67. Neakrase, L.D.V.; Greeley, R. Dust devil sediment flux on Earth and Mars: Laboratory simulations. Icarus 2010, 206, 306–318. [Google Scholar] [CrossRef]
  68. Fizjarrald, D.E. A laboratory simulation of convective vortices. J. Atmos. Sci. 1973, 30, 894–902. [Google Scholar] [CrossRef]
  69. Davies-Jones, R.P. Tornado dynamics. In Thunderstorm Morphology and Dynamics, 2nd ed.; Kessler, E., Ed.; University of Oklahoma Press: Norman, OK, USA, 1986; pp. 197–236. [Google Scholar]
  70. Brady, R.H.; Szoke, E.J. A case study of non-mesocyclone tornado development in northeast Colorado: Similarities to waterspout formation. Mon. Weather Rev. 1989, 117, 843–856. [Google Scholar] [CrossRef]
  71. Lewellen, W.S. Tornado vortex theory. In The Tornado: Its Structure, Dynamics, Prediction, and Hazards; Church, C., Burgess, D., Doswell, C., Davies-Jones, R., Eds.; Geophysical Monograph Series; AGU: Washington, DC, USA, 1993; Volume 79, pp. 19–39. [Google Scholar]
  72. Davies-Jones, R.P.; Trapp, R.J.; Bluestein, H.B. Tornadoes and tornadic storms. In Severe Convective Storms; Doswell, C.A., Ed.; AMS: Boston, MA, USA, 2001; pp. 167–221. [Google Scholar]
  73. Markowski, P.; Richardson, Y. Mesoscale Meteorology in Midlatitudes; John Wiley and Sons: Hoboken, NJ, USA, 2010; 430p. [Google Scholar]
  74. Davies-Jones, R. A review of supercell and tornado dynamics. Atmos. Res. 2015, 158, 274–291. [Google Scholar] [CrossRef]
  75. Davies-Jones, R.; Wood, V.T.; Askelson, M.A. Ray curvature on a flat Earth for computing virtual WSR-88D signatures of simulated supercell storms. Mon. Weather Rev. 2019, 147, 1065–1075. [Google Scholar] [CrossRef]
  76. Davies-Jones, R.; Markowski, P.M. Circulation around a constrained curve: An alternative analysis tool for diagnosing the origins of tornado rotation in numerical supercell simulations. J. Atmos. Sci. 2021, 78, 2895–2909. [Google Scholar] [CrossRef]
  77. Davies-Jones, R. Theory of parcel vorticity evolution in supercell-like flows. J. Atmos. Sci. 2022, 79, 1253–1270. [Google Scholar] [CrossRef]
  78. Fischer, J.; Dahl, J.M.L. Transition of near-ground vorticity dynamics during tornadogenesis. J. Atmos. Sci. 2022, 79, 467–483. [Google Scholar] [CrossRef]
  79. Parker, M.D.; Wicker, L.J. Imported and storm-generated near-ground vertical vorticity in a simulated supercell. J. Atmos. Sci. 2014, 71, 3027–3051. [Google Scholar]
  80. Dahl, J.M.L. Near-ground rotation in simulated supercells: On the robustness of the baroclinic mechanism. Mon. Weather Rev. 2015, 143, 4929–4942. [Google Scholar] [CrossRef]
  81. Parker, M.D.; Dahl, J.M.L. Production of near-surface vertical vorticity by idealized downdrafts. Mon. Weather Rev. 2015, 143, 2795–2816. [Google Scholar] [CrossRef]
  82. Markowski, P.M. An idealized numerical simulation investigation of the effects of surface drag on the development of near-surface vertical vorticity in supercell thunderstorms. J. Atmos. Sci. 2016, 73, 4349–4385. [Google Scholar] [CrossRef]
  83. Mashiko, W.; Niino, H.; Kato, T. Numerical simulation of tornadogenesis in an outer-rainband minisupercell of Typhoon Shanshan on 17 September. Mon. Weather Rev. 2009, 137, 4238–4260. [Google Scholar]
  84. Mashiko, W. A numerical study of the 6 May 2012 Tsukuba City supercell tornado. Part II: Mechanisms of tornadogenesis. Mon. Weather Rev. 2016, 144, 3077–3098. [Google Scholar] [CrossRef]
  85. Roberts, B.; Xue, M.; Schenkman, A.D.; Dawson, D.T. The role of surface drag in tornadogenesis within an idealized supercell simulation. J. Atmos. Sci. 2016, 73, 3371–3395. [Google Scholar] [CrossRef]
  86. Rotunno, R.; Markowski, P.M.; Bryan, G.H. “Near ground” vertical vorticity in supercell thunderstorm models. J. Atmos. Sci. 2017, 74, 1757–1766. [Google Scholar] [CrossRef]
  87. Yokota, S.; Niino, H.; Seko, H.; Kunii, M.; Yamauchi, H. Important factors for tornadogenesis as revealed by high-resolution ensemble forecasts of the Tsukuba supercell tornado of 6 May 2012 in Japan. Mon. Weather Rev. 2018, 146, 1109–1132. [Google Scholar] [CrossRef]
  88. Tao, T.; Tamura, T. Numerical study of the 6 May 2012 Tsukuba supercell tornado: Vorticity sources responsible for tornadogenesis. Mon. Weather Rev. 2020, 148, 1205–1228. [Google Scholar] [CrossRef]
  89. Boyer, C.H.; Dahl, J.M.L. The mechanisms responsible for large near-surface vertical vorticity within simulated supercells and quasi-linear storms. Mon. Weather Rev. 2020, 148, 4281–4297. [Google Scholar] [CrossRef]
  90. Markowski, P.M.; Richardson, Y.P. The influence of environmental low-level shear and cold pools on tornadogenesis: Insights from idealized simulations. J. Atmos. Sci. 2014, 71, 243–275. [Google Scholar] [CrossRef]
  91. Varaksin, A.Y.; Romash, M.E.; Kopeitsev, V.N.; Gorbachev, M.A. Experimental study of wall-free non-stationary vortices generation due to air unstable stratification. Int. J. Heat Mass Transf. 2012, 55, 6567–6572. [Google Scholar] [CrossRef]
  92. Navarro, M.C.; Herrero, H. Vortex generation by a convective instability in a cylindrical annulus non-homogeneously heated. Phys. Rev. E 2011, 240, 1181–1188. [Google Scholar] [CrossRef]
  93. Castano, D.; Navarro, M.C.; Herrero, H. Evolution of secondary whirls in thermoconvective vortices: Strengthening, weakening, and disappearance in the route to chaos. Phys. Rev. E 2016, 93, 013117. [Google Scholar] [CrossRef]
  94. Castano, D.; Navarro, M.C.; Herrero, H. Secondary whirls in thermoconvective vortices developed in a cylindrical annulus locally heated from below. Commun. Nonlinear Sci. Numer. Simulat. 2015, 28, 201–209. [Google Scholar] [CrossRef]
  95. Varaksin, A.Y.; Romash, M.E.; Kopeitsev, V.N. The parameters of unstable stratification of air leading to generation of free vortexes. High Temp. 2010, 48, 251–255. [Google Scholar] [CrossRef]
  96. Varaksin, A.Y.; Romash, M.E.; Taekin, S.I.; Kopeitsev, V.N. The generation of free concentrated air vortexes under laboratory conditions. High Temp. 2009, 47, 78–82. [Google Scholar] [CrossRef]
  97. Gu, Z.; Zhao, Y.; Li, Y.; Yu, Y.; Feng, X. Numerical simulation of dust lifting within dust devils—Simulation of an intense vortex. J. Atmos. Sci. 2006, 63, 2630–2641. [Google Scholar] [CrossRef]
  98. Lewellen, D.C.; Gong, B.; Lewellen, W.S. Effect of finescale debris on near-surface tornado dynamics. J. Atmos. Sci. 2008, 65, 3247–3262. [Google Scholar] [CrossRef]
  99. Varaksin, A.Y.; Zaichik, L.I. The effect of a fine divided impurity on the turbulence intensity of a carrier flow in a pipe. High Temp. 1998, 36, 983–986. [Google Scholar]
  100. Zaichik, L.I.; Varaksin, A.Y. Effect of the wake behind large particles on the turbulence intensity of carrier flow. High Temp. 1999, 37, 655–658. [Google Scholar]
  101. Lebedeva, N.A.; Osiptsov, A.N. Structure of inertial-admixture accumulation zones in a tornado-like flow. Fluid Dyn. 2009, 44, 68–79. [Google Scholar] [CrossRef]
  102. Maruyama, T. Simulation of flying debris using a numerically generated tornado-like vortex. J. Wind Eng. Ind. Aerodyn. 2011, 99, 249–256. [Google Scholar] [CrossRef]
  103. Varaksin, A.Y.; Ryzhkov, S.V. Vortex flows with particles and droplets (a review). Symmetry 2022, 14, 2016. [Google Scholar] [CrossRef]
  104. Varaksin, A.Y.; Ryzhkov, S.V. Turbulence in two-phase flows with macro-, micro- and nanoparticles: A review. Symmetry 2022, 14, 2433. [Google Scholar] [CrossRef]
  105. Neakrase, L.D.V.; Balme, M.R.; Esposito, F.; Kelling, T.; Klose, M.; Kok, J.F.; Marticorena, B.; Merrison, J.; Patel, M.; Wurm, G. particle lifting processes in dust devils. Space Sci. Rev. 2016, 203, 347–376. [Google Scholar] [CrossRef]
  106. Varaksin, A.Y.; Romash, M.E.; Kopeitsev, V.N. The possibilities of visualization in the case of simulation of air tornados. High Temp. 2010, 48, 588–592. [Google Scholar] [CrossRef]
  107. Varaksin, A.Y.; Protasov, M.V.; Teplitskii, Y.S. About choice of particle parameters for visualization and diagnostics of free concentrated air vortices. High Temp. 2014, 52, 554–559. [Google Scholar] [CrossRef]
  108. Varaksin, A.Y.; Romash, M.E.; Kopeitsev, V.N.; Gorbachev, M.A. Physical simulation of air tornados: Some dimensionless parameters. High Temp. 2011, 49, 310–313. [Google Scholar] [CrossRef]
  109. Varaksin, A.Y.; Romash, M.E.; Kopeitsev, V.N. Controlling the behavior of air tornados. High Temp. 2009, 47, 836–842. [Google Scholar] [CrossRef]
  110. Varaksin, A.Y.; Romash, M.E.; Kopeitsev, V.N. The possibility of influencing vortex atmospheric formations. High Temp. 2010, 48, 411–415. [Google Scholar] [CrossRef]
  111. Kuzenov, V.V.; Ryzhkov, S.V.; Varaksin, A.Y. Computational and Experimental Modeling in Magnetoplasma Aerodynamics and High-Speed Gas and Plasma Flows (A Review). Aerospace 2023, 10, 662. [Google Scholar] [CrossRef]
  112. Varaksin, A.Y.; Ryzhkov, S.V. Mathematical Modeling of Gas-Solid Two-Phase Flows: Problems, Achievements and Perspectives (A Review). Mathematics 2023, 11, 3290. [Google Scholar] [CrossRef]
  113. Varaksin, A.Y.; Romash, M.E.; Kopeitsev, V.N. Effect of net structures on wall-free non-stationary air heat vortices. Int. J. Heat Mass Transf. 2013, 64, 817–828. [Google Scholar] [CrossRef]
  114. Bulychev, N.A. Obtaining Nanosized Materials in Plasma Discharge and Ultrasonic Cavitation. High Temp. 2022, 60 (Suppl. 1), S98–S126. [Google Scholar] [CrossRef]
  115. Azarova, O.A.; Kravchenko, O.V. The Use of Spatially Multi-Component Plasma Structures and Combined Energy Deposition for High-Speed Flow Control: A Selective Review. Energies 2024, 17, 1632. [Google Scholar] [CrossRef]
  116. Kuzenov, V.V.; Ryzhkov, S.V.; Varaksin, A.Y. Development of a Method for Solving Elliptic Differential Equations Based on a Nonlinear Compact-Polynomial Scheme. J. Comput. Appl. Math. 2024, 451, 116098. [Google Scholar] [CrossRef]
  117. Bizyaev, I.A.; Mamaev, I.S. Qualitative Analysis of the Dynamics of a Balanced Circular Foil and a Vortex. Regul. Chaotic Dyn. 2021, 26, 658–674. [Google Scholar] [CrossRef]
  118. Bulychev, N.A.; Ioni, Y.V.; Dimitrieva, S.E.; Chebotarev, S.N.; Rabinsky, L.N. Plasma-Chemical Synthesis of Nanosized Bactericidal Particles under the Action of Ultrasonic Cavitation. High Temp. 2022, 60 (Suppl. S2), S263–S266. [Google Scholar] [CrossRef]
  119. Bizyaev, I.A.; Mamaev, I.S. Dynamics of a Circular Foil and Two Pairs of Point Vortices: New Relative Equilibria and a Generalization of Helmholtz Leapfrogging. Symmetry 2023, 15, 698. [Google Scholar] [CrossRef]
  120. Youvan, D.C. Vortex Dynamics in Nonequilibrium Thermodynamic Systems: A Multidisciplinary Approach. 2024; preprint. [Google Scholar] [CrossRef]
  121. Lillek, S.; Barfuß, C.; Sattelmayer, T. Experimental study of the interaction of water sprays with swirling premixed natural gas flames. J. Eng. Gas Turbines Power 2017, 139, 021506. [Google Scholar] [CrossRef]
  122. Minakov, A.V.; Kuznetsov, V.A.; Anufriev, I.S.; Kopyev, E.P. Numerical analysis of a pre-chamber vortex burner with a steam blast atomizer. Fuel 2022, 323, 124375. [Google Scholar] [CrossRef]
  123. Gao, Z.; Wang, J.; Wang, J.; Mao, Y. Time-frequency analysis of the vortex motion in a cylindrical cyclone separator. Chem. Eng. J. 2019, 373, 1120–1131. [Google Scholar] [CrossRef]
  124. Wasilewski, M.; Brar, L.S.; Ligus, G. Experimental and numerical investigation on the performance of square cyclones with different vortex finder configurations. Sep. Purif. Technol. 2020, 239, 116588. [Google Scholar] [CrossRef]
  125. Brar, L.S.; Wasilewski, M. Investigating the effects of temperature on the performance of novel cyclone separators using large-eddy simulation. Powder Techol. 2023, 416, 118213. [Google Scholar] [CrossRef]
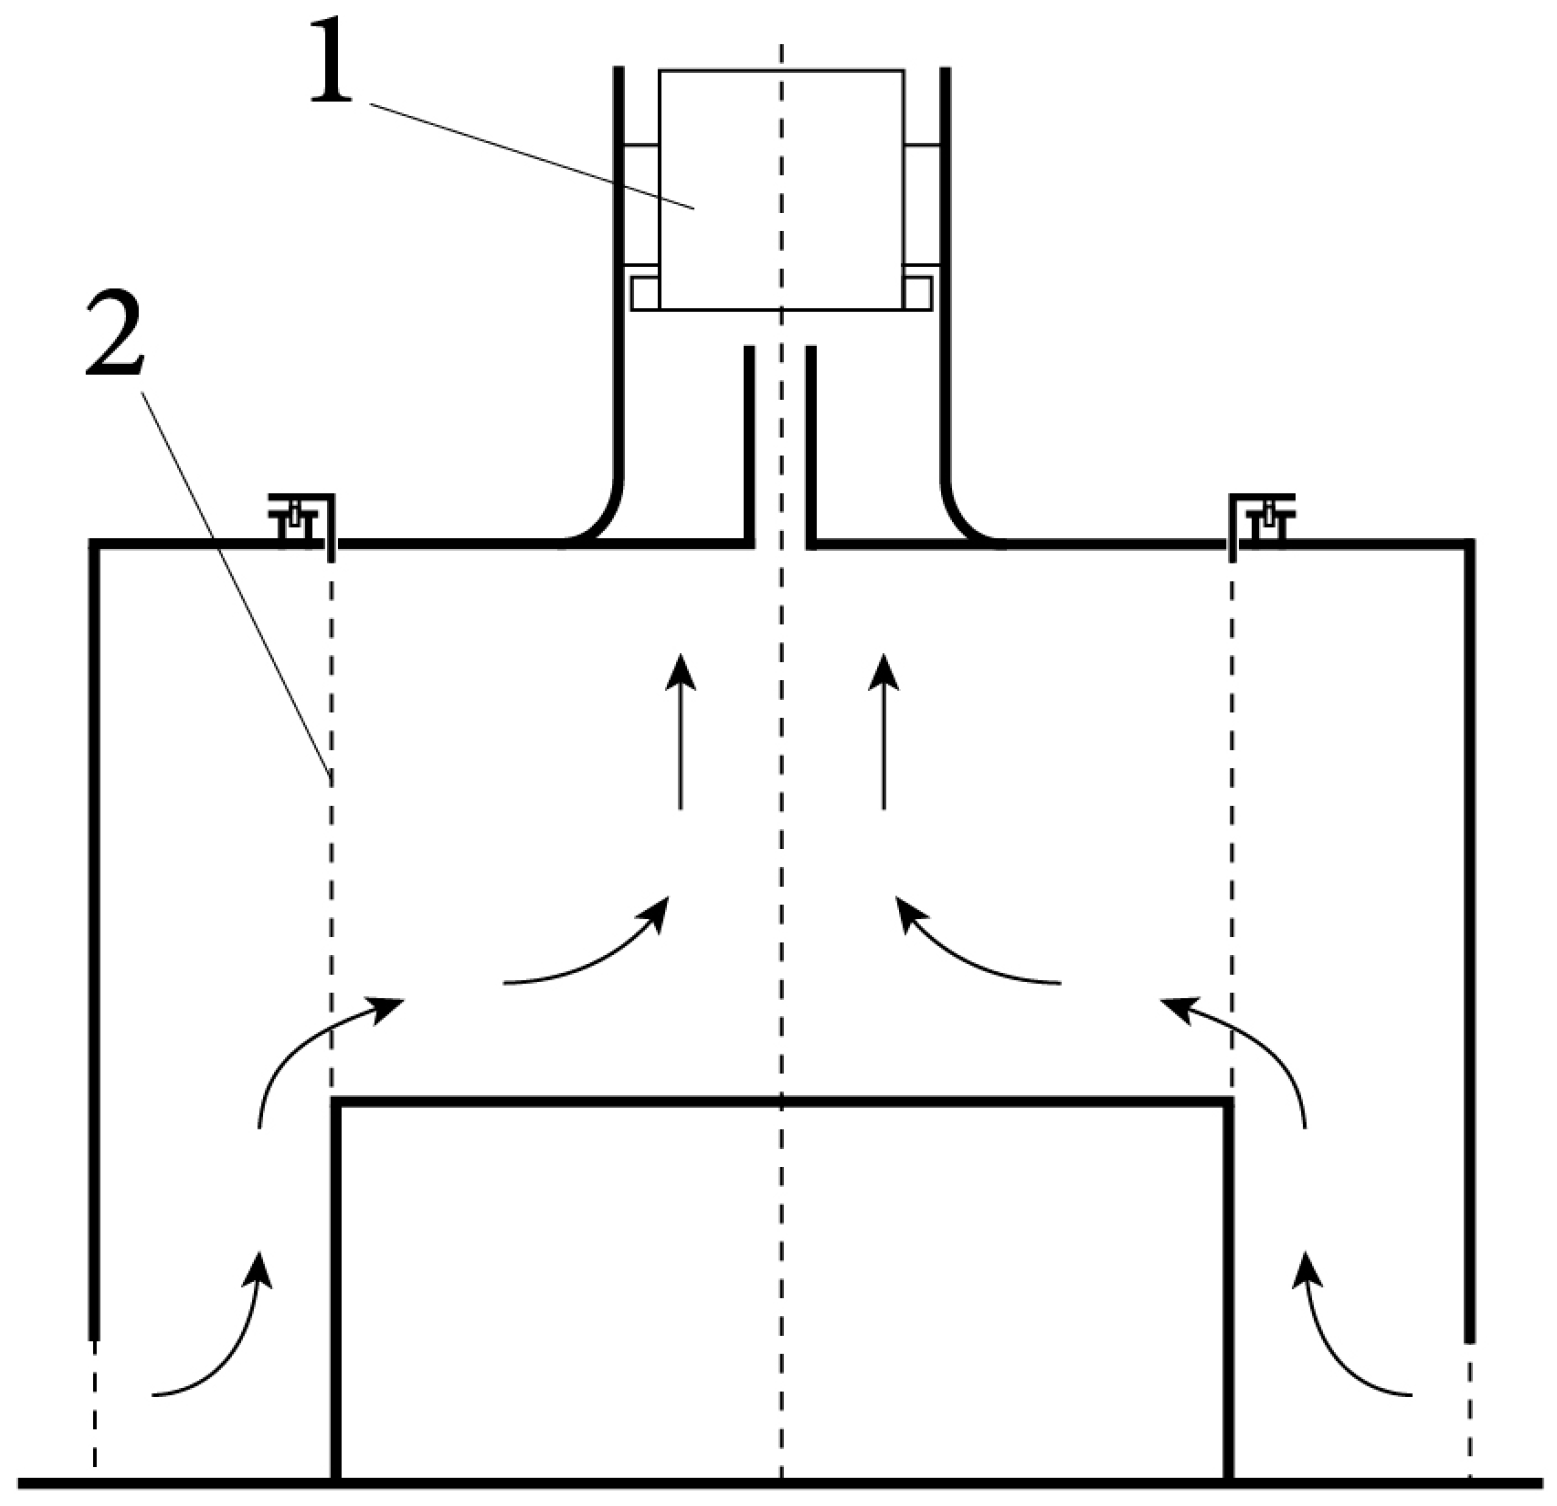
Figure 1. A simplified scheme of a wall-bounded, tornado-like vortex generator (Catholic University of America): 1—fan, 2—rotating screen.
Aerospace 11 00800 g001
Figure 2. A schematic representation of the results of the work of [29] concerning the cross-sectional view of smoke patterns: (a) two-celled vortex structure, strong twist; (b) one-celled vortex structure, weak twist.
Aerospace 11 00800 g002
Figure 3. Simplified scheme of the wall-bounded, tornado-like vortices simulator by N.B. Ward (Oklahoma University): 1—fan, 2—direction vane and rotating screen.
Aerospace 11 00800 g003
Figure 4. Schematic representation of the results of the work of [30] concerning the variation of a core diameter with an inflow angle and multiple vortex generation: (a) an inflow angle of 5°, (b) 12°, (c) 26°, and (d) 32°, as well as (e,f) a pair and triple vortex family at a large value of angles and configuration ratios (2r1/h).
Aerospace 11 00800 g004
Figure 5. Simplified scheme of the Ward-type wall-bounded, tornado-like vortex simulator (Purdue University): 1—flow input, 2—rotating ring and screen.
Aerospace 11 00800 g005
Figure 6. Schematic representation of the results of the work of [34] concerning the variation of the core diameter and shape and multiple vortex generation: (a) single laminar funnel obtained under the conditions of a weak swirl, (b) a free stagnation point separating an upper turbulent core from the lower laminar vortex core, (c) a turbulent core that results when the stagnation point moves all the way down to the bottom of the chamber, (d) a turbulent core that has undergone radial expansion as a result of a further increase in the swirl ratio, (e) two intertwined helical vortices in a transitional stage between a vortex breakdown and the formation of a multiple vortex system in the convergence region, and (f) a configuration of four vortices.
Aerospace 11 00800 g006
Figure 7. Simplified scheme of a wall-free, tornado-like vortex simulator (Iowa State University): 1—fan, 2—direction vane.
Aerospace 11 00800 g007
Figure 8. Simplified scheme of the WindEEE Dome simulator (Western University): 1—different fans, 2—fans with rotating blades and a turntable.
Aerospace 11 00800 g008
Figure 9. Schematic representation of the downdraft mechanism of tornado formation at different moments in time. (ad) The selected frames of a video recording of a real tornado (3 June 2009, Moscow region, Krasnozavodsk). (eh) Drawn sketches: (a,e) 10 s; (b,g) 20 s; (c,f) 42 s; and (d,h) 52 s. Arrows show the streamlines of the rotating air and ascending air, visualized due to condensation.
Aerospace 11 00800 g009
Figure 10. Schematic representation of an “in-and-up mechanism” of tornado formation: (a) generation of an ascending flow by a buoyancy horizontal gradient, (b) generation of a horizontal vorticity by a buoyancy horizontal gradient, and (c) the inclination of an initially horizontal vortex filaments becoming a surrounding vertical flow. The arrows show the streamlines of the upward swirling flow and the vertical vorticity (large arrow) that is introduced by the downdraft mechanism.
Aerospace 11 00800 g010
Figure 11. Schematic of a setup for wall-free, non-stationary, and tornado-like vortex generation.
Aerospace 11 00800 g011
Figure 12. The Rayleigh number as a function of time for different thermal modes ( r = 0 ): 1—mode no. 1 ( T c max = 420 K, τ h = 60 s); mode no. 2 (470 K, 120 s); mode no. 3 (500 K, 180 s); mode no. 4 (500 K, 60 s); mode no. 5 (580 K, 120 s); and mode no. 6 (610 K, 180 s). Three characteristic regions were found: (i) there is no vortex generation ( Ra < 10 7 ); (ii) generation of weak vortices ( 10 9 > Ra > 10 7 ); and (iii) generation of strong vortices ( Ra > 10 9 ).
Aerospace 11 00800 g012
Figure 13. Photograph of the model laboratory vortex (the visible height of the vortex is 1.5 m), mode no. 6, τ h = 150 s: 1—vortex, 2—vortex trail, and 3—edge of the underlying surface.
Aerospace 11 00800 g013
Figure 14. Schematic illustration of a non-stationary, dynamic vortex atmospheric structure (DVAS) and net structure.
Aerospace 11 00800 g014
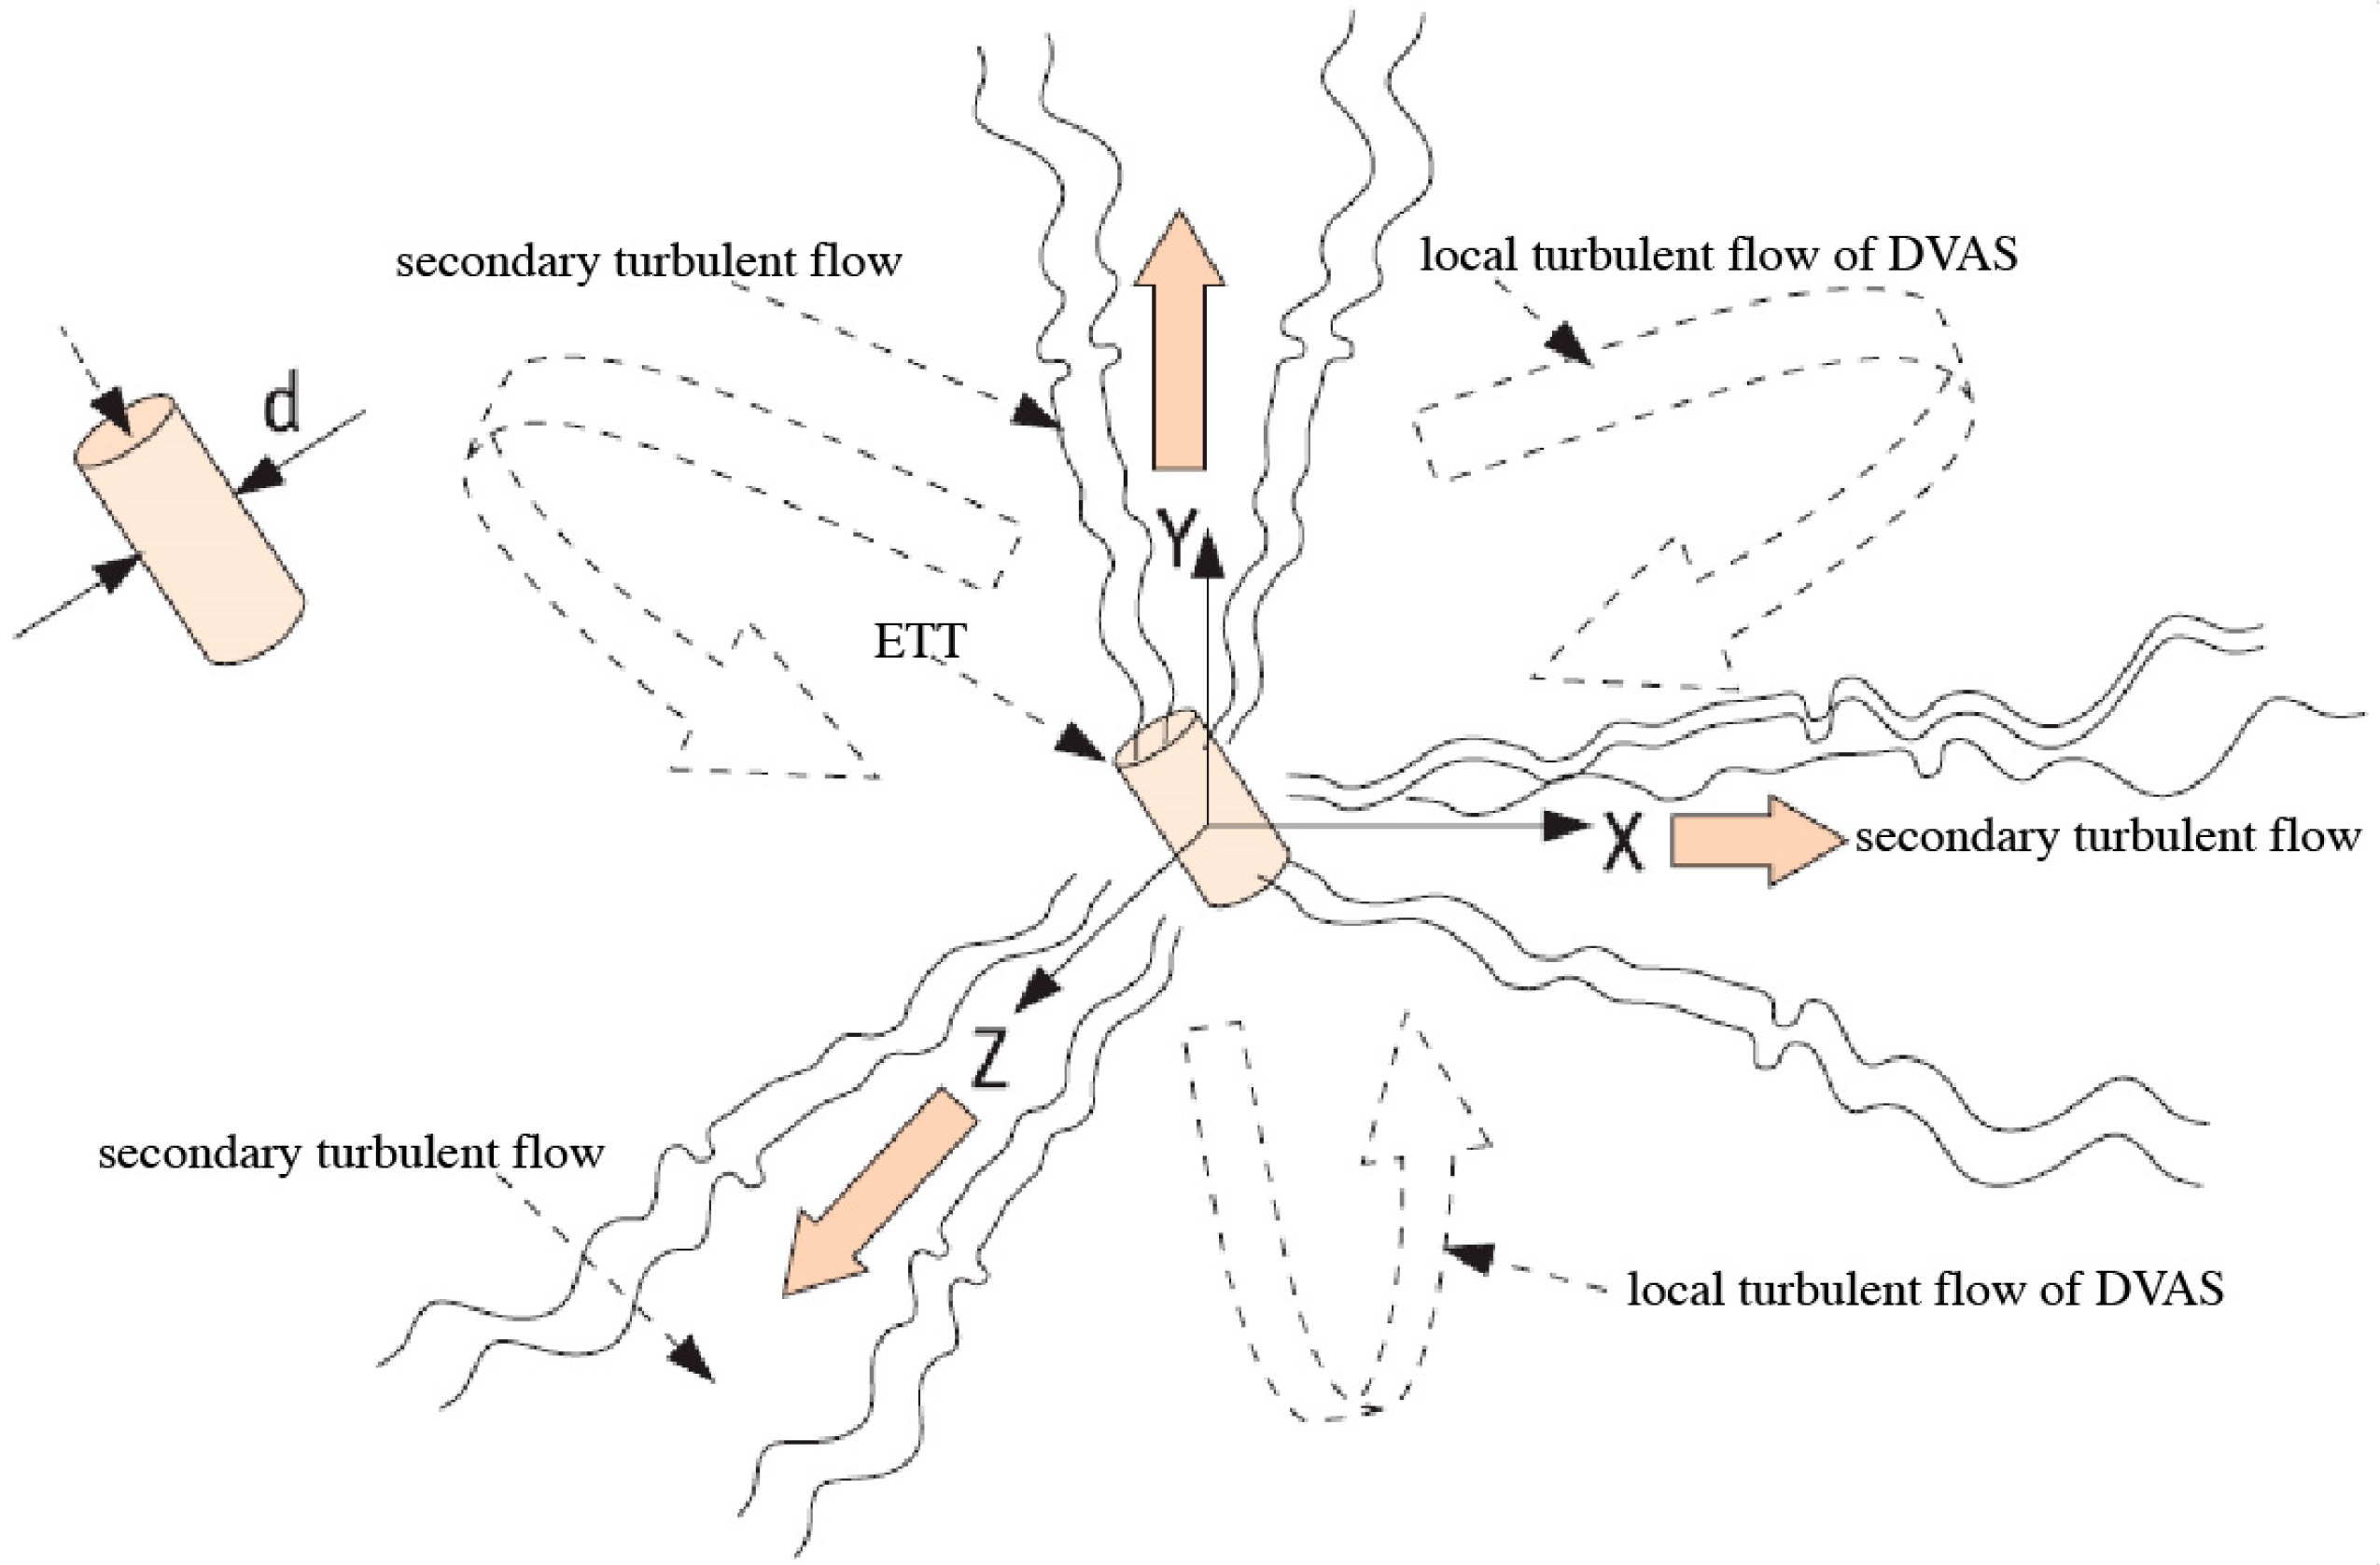
Figure 15. Schematic illustration of the directions of small-scale turbulent fluctuations (secondary turbulent flow (STF)) by a single mechanical element of a net structure (elementary turbulent transformer (ETT)) interaction with the local turbulent flow of DVAS.
Aerospace 11 00800 g015
Table 1. A brief summary of previous experimental work.
No.Author(s)Vortex TypeAscending Flow CreationCirculation CreationAdvantages
1Wan and Chang (1972) [29]Wall-bounded, stationary vortexTop-mounted fanRotating mesh screenIndependent velocity and circulation control
2Ward (1972) [30]Wall-bounded, stationary vortexFanRotating screen with guide vanesSuppression of fan circulation by mesh structure
3Church et al. (1977) [34]Wall-bounded, stationary vortexIncoming flowRotating ring and screenAdjustment of geometric and working parameters
4Gallus et al. (2004) [42]Wall-free, quasi-stationary vortexTop-mounted fanGuide vanesCreation of forced downward flow and vortex structure movement
5Refan and Hangan (2016) [49]Quasi-wall-free, quasi-stationary vortexLarge number of fansAdjustable bladesCreation of required velocity gradients and vortex structure movement
6Varaksin et al. (2008) [54]Wall-free, non-stationary vortexBuoyancy-driven convectionAbsentPossibility to study of non-stationary vortex generation, stability, etc.
Disclaimer/Publisher’s Note: The statements, opinions and data contained in all publications are solely those of the individual author(s) and contributor(s) and not of MDPI and/or the editor(s). MDPI and/or the editor(s) disclaim responsibility for any injury to people or property resulting from any ideas, methods, instructions or products referred to in the content.