


Abstract
The goal of this paper is to investigate the aerodynamic and aerothermodynamic behavior of the Schiaparelli capsule after the deployment of a supersonic disk-gap-band (DGB) parachute during its re-entry phase into the Martian atmosphere. The novelty of this work lies in the investigation by LES (large-eddy simulations) of the coupled interaction of the flow field generated behind the capsule and that in front of the flexible DGB parachute. These simulations are performed at an altitude of 10 km and a Mach number around 2, i.e., a regime in which large canopy-area oscillations are observed. LES results have shown a strong interaction between the bow shock, the recompression and expansion waves, high pressure, density and temperature gradients, heat flux towards the airstream and the body implying turbulence generation, ingestion, and amplification through the shock waves. Vortices released from the capsule at a frequency of about 52 Hz and 159 Hz, corresponding to Strouhal numbers of ~0.2 and 0.75, respectively, are the main factors responsible for the instabilities of the hypersonic re-entry capsule and the disk-gap-band parachute coupled system. The nonlinear turbulence flow field generated at the capsule back is amplified when passing the parachute bow shock, and this is responsible for the non-axisymmetric behavior around and behind the parachute that caused the uncontrolled capsule oscillations and the Schiaparelli mission failure. In fact, an LES of the parachute without the capsule, for the same conditions, show a completely axisymmetric field, varying in time, but axisymmetric. In order to avoid this turbulence amplification, dampening of the vortex shedding is critical. Different techniques have been already proposed for other applications. In the case of capsule re-entry, due to the high temperatures in front of the capsule behind the bow shock since air plasma is generated, damping of the vortex shedding could be achieved by means of magnetohydrodynamic (MHD) control.
1. Introduction
For a period of over 60 years, both experimental and computational studies have been conducted on the aerothermodynamics of re-entry vehicles [1,2]. The Mercury and Apollo programs forged a path for experimental studies on blunt-body hypersonics, while computational studies began with the Apollo and Space Shuttle programs. Preliminary designs of atmospheric re-entry vehicles require in-depth knowledge of hypersonic flow characteristics [3]. In his book Experimental and Computational Aerothermodynamics of a Mars Entry Vehicle [4], Brian R. Holli presents a rapid history of studies on hypersonic flows around a 70° sphere cone geometry. Although this book was written in 1996 regarding the Mars Pathfinder Mission, the experimental and computational methods that are illustrated there are still used today, since the shape of the capsule is almost unchanged. Viking 1, Viking 2, Pathfinder, Spirit, Opportunity, Phoenix, Curiosity, and other successful spacecraft have been launched on Mars. In addition, the European Space Agency (ESA), in collaboration with Russia’s Roscosmos space agency, launched an ExoMars program consisting of two phases. The first phase of the ExoMars mission, including the TGO (trace gas orbiter) satellite with scientific equipment and the ESA Schiaparelli descent module in the second phase, was launched in 2016. The Schiaparelli descent module’s mission was to test the method of a controlled landing using the propulsion system. Schiaparelli, however, crashed into the surface of Mars due to onboard computer errors.
The entry, descent and landing (EDL) phase plays a crucial role during the re-entry phase of the capsule into the planet’s atmosphere and undergoes complex interactions that are not yet completely understood: the entrance, beginning at an attitude of 200 km, where the aerodynamic resistance of the capsule is being used to decelerate; the descent, about 10 km from the surface, where the parachute/canopy is deployed; and the landing. An intense shock wave is desired during the re-entry into the atmosphere, as the vehicle uses aerodynamic drag to control its speed. The shock layer near the nose is subjected to high temperatures as the kinetic energy in the hypersonic flow is converted into internal energy of the gas through the shock waves. Due to this loss of kinetic energy, this results in the deceleration of the vehicle. Allen and Eggers’s discovery shows that an intense heating is observed due to the creation of very strong waves from the blunt body, and is mostly carried away into the stream while the originating boundary layer acts as an insulator [5].
Due to their low mass and high packing efficiency, DGB (disk-gap-band) parachutes provide a very efficient aerodynamic method of decelerating an incoming vehicle from supersonic to subsonic speeds [6]. The primary uncertainty associated with the deceleration performance of a DGB parachute is inflation in a supersonic environment [7]. For the supersonic deceleration process, the parachute setup must be specially designed to achieve high aerodynamic efficiency. Parachute performance depends on Mach number, capsule shape and size, capsule-to-parachute distance, canopy shape and size, material properties, cables, and capsule angle of attack [8].
Modeling the dynamics of the parachute accurately is difficult due to its complexity in the descent phase, as these dynamics are governed by a coupling between the structural dynamics of the parachute and the surrounding flow during both the inflation process and the terminal descent phase. While the parachute is in its steady state, the air flowing around the decelerator will separate at some point on the canopy. The shedding of vortices from the canopy can affect stability, causing both the parachute and payload to oscillate on a regular basis. The wake of a porous parachute is made up of air flowing around and through the canopy.
In the operating speed range of the parachute, part of the flow entering the parachute is turbulent in nature and must be accounted for in the aerodynamic performance of the parachute [9] as the payload fairing produces a very turbulent wake.
Even at low speeds, the prediction of parachute aerodynamic properties is difficult due to the nonlinear nature of structural deformations, especially for parachutes with complex arrangements such as slots or gaps [10,11]. The supersonic behavior of these parachutes involves complex, interdependent phenomena in fluid–structure interaction (FSI) studies which includes bluff and porous body aerodynamics, nonlinear structural dynamics, and the fully coupled interaction between compressible flow and shocks and a membrane structure undergoing large deformations.
The structural integrity and drag characteristics of the parachutes are impacted due to the rapid oscillatory movement of the inflated parachute in some flight regimes, which is due to the inevitability of a close coupling between the parachute structure and the surrounding flow. These complex dynamics observed are related to the oscillatory axial motion of the bow shock originating in front of the parachute canopy. This is due to over/under-pressurization, an imbalance in the tension and compression stiffness of the suspension lines that are connected between the parachute and the capsule (re-entry vehicle), expansion instability caused by the imbalance of fluid forces with structural forces, which is exacerbated by the parachute’s very low inertia, and contact forces [12].
In recent advances, Karagiozis et al. [13,14,15] used structural membrane-coupled large-eddy simulations (LESs) to investigate the supersonic performance of a flexible DGB parachute. In this paper, the effects of the turbulent wake behind the capsule on a rigid DGB parachute at Mach 2, the causes of fluid instabilities in a supersonic capsule/rigid DGB parachute system have been investigated, and solutions to dampen the oscillations and consequently to avoid system failure have been proposed.
2. Numerical Simulations of the Schiaparelli Capsule and Parachute
In LESs, the conservation of mass, momentum, and energy governing equations are expressed as [16,17].
- Equation of mass conservation:
- Transport equation of momentum:
- Transport equation of total energy (internal + mechanical):
- Transport equations for the Ns species mass fractions:
- Thermodynamic equation of state:
These equations must be coupled with the constitutive equations that describe the molecular transport. In the above equations, t is the time variable, ρ the density, uj the velocities, tij the viscous stress tensor, and the total filtered energy per unit of mass, which is sum of the filtered internal energy , the resolved kinetic energy, , and the sub-grid one, , qi is the heat flux, p the pressure, and T the temperature.
The stress tensor and the heat-flux are, respectively:
Dn is the nth-species diffusion coefficient, Wn the nth species molecular weight, Yn the mass fraction, and ωn the production/destruction rate of species n, diffusing at velocity Vi,n and resulting in a diffusive mass flux Jn. Finally, Ru is the universal gas constant. Summation of all species transport equations yields the total mass conservation equation. Therefore, the Ns species transport equations and the mass conservation equation are linearly dependent and one of them is redundant. Furthermore, to be consistent with mass conservation, the diffusion fluxes ) and chemical source terms must satisfy:
In particular, the constraint on the summation of chemical source terms derives from mass conservation for each of the Ns chemical reactions of a chemical mechanism. A density-based (coupled), implicit, third-order upwind scheme with an AUSM (advection upstream splitting method) flux vector has been implemented for LESs. The sub-grid scales are modeled using the Smagorinsky–Lilly model. The eddy viscosity being modeled is , where is the size of the grid and C is a constant.
2.1. Geometry and Boundary Conditions of the Schiaparelli Capsule and Parachute
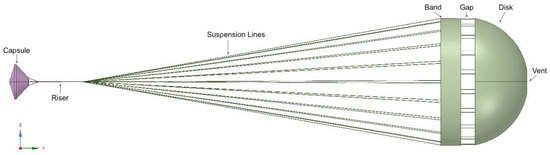
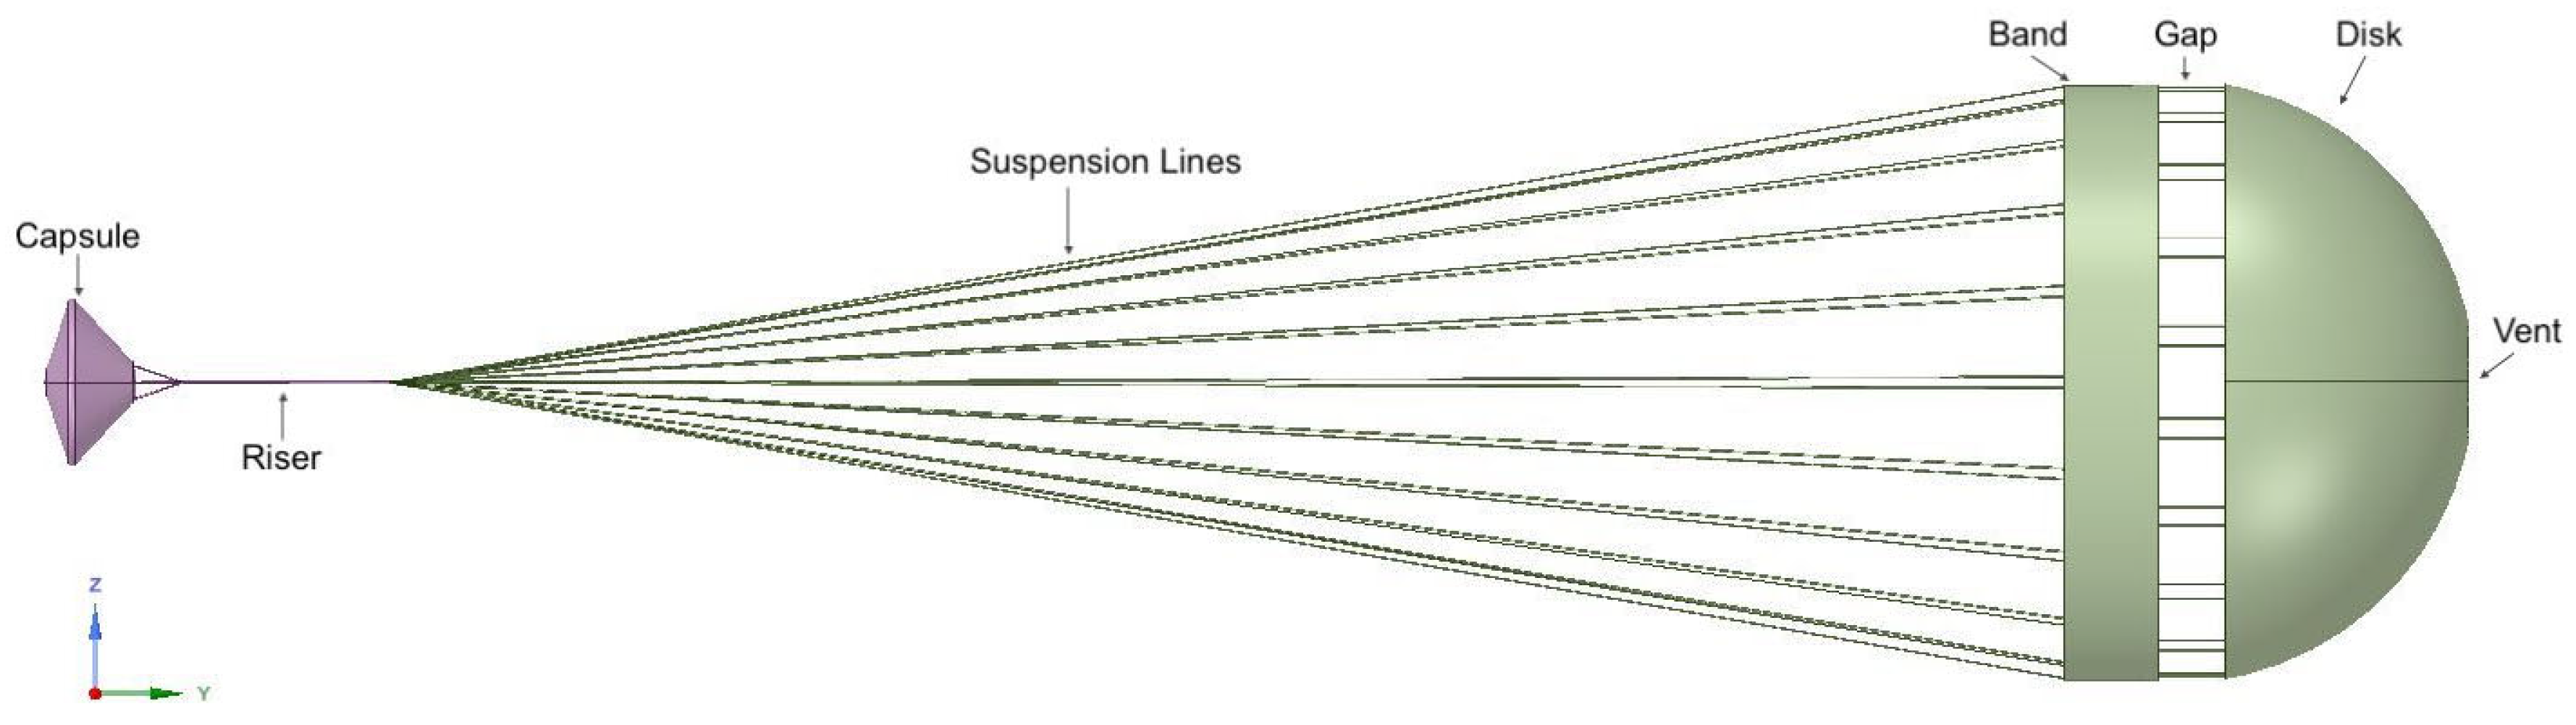
The sketch of the Schiaparelli capsule blunt body along with the DGB supersonic parachute is shown in Figure 1.
Figure 1.
Geometric configuration of a rigid disk-gap-band (DGB) supersonic parachute along with the Schiaparelli capsule.
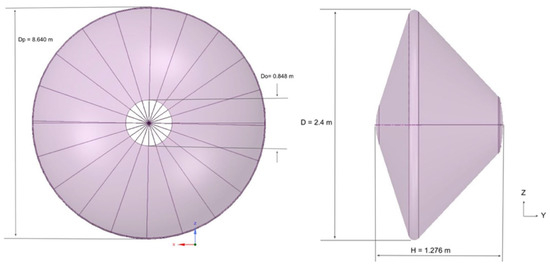
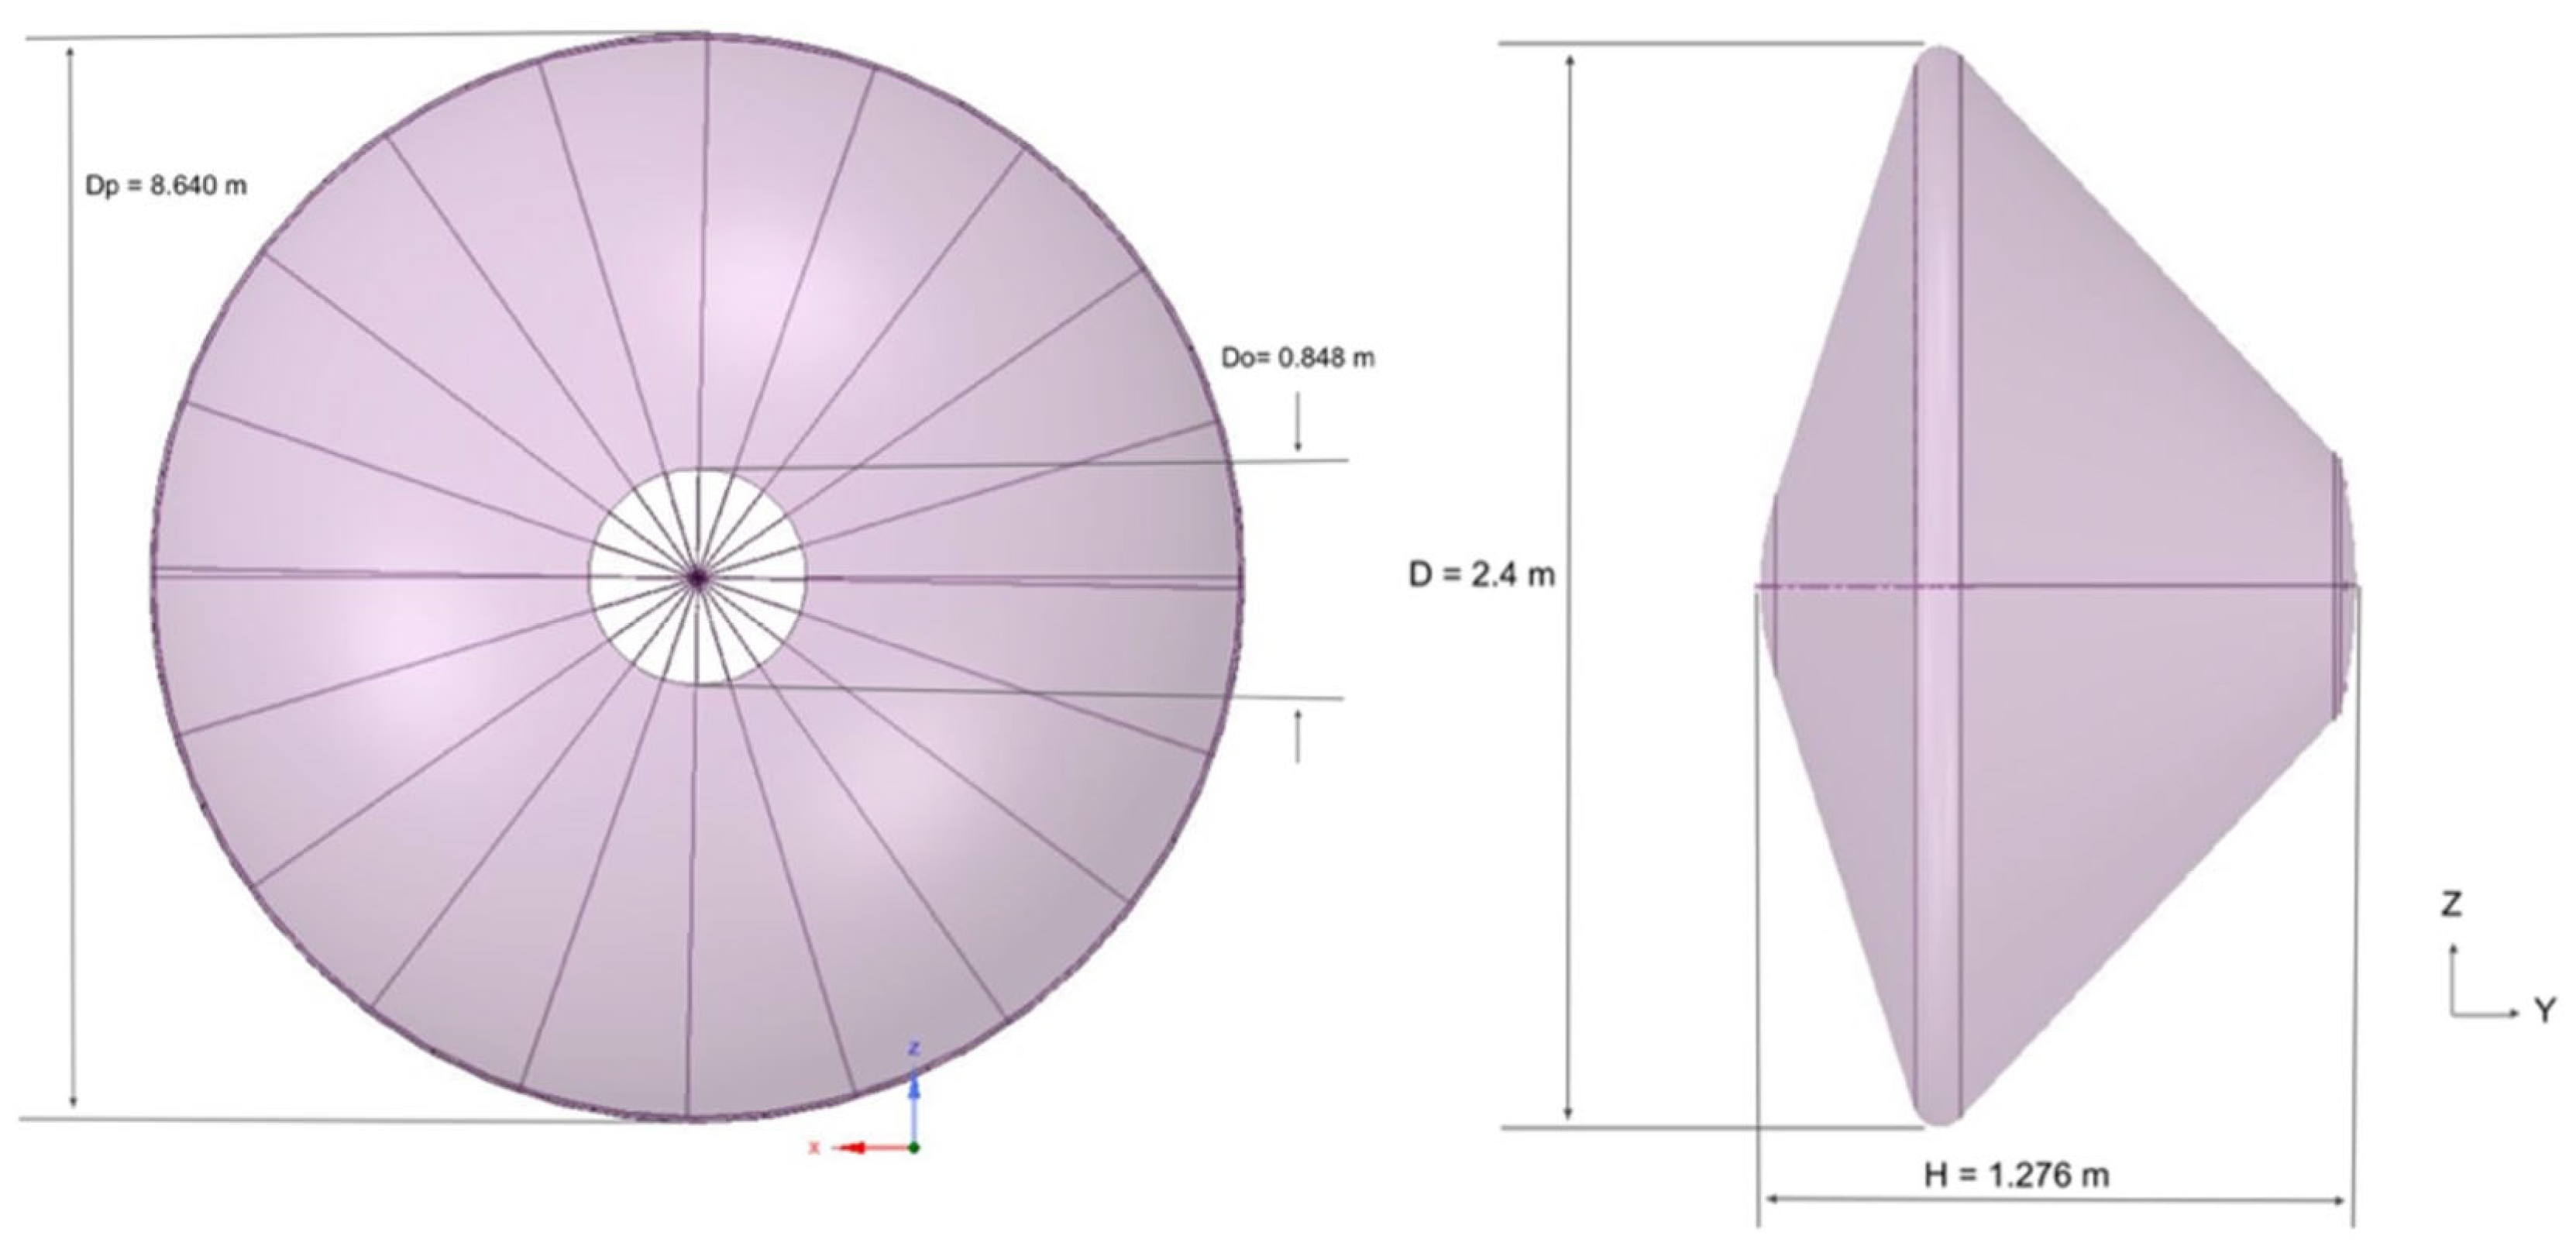
The capsule (see Figure 2, right) consists of a diameter of D = 2.4 m, a front body cone angle of 70°, a rear cone angle of 47° and an overall height of H = 1.276 m. The projected diameter of the parachute is Dp = 8.640 m, the disk diameter is Dd = 8.223 m, the gap height is of Hg = 0.957 m, the band height is of Hb = 1.357 m, and the vent diameter is of Do = 0.848 m.
Figure 2.
Geometry of the parachute (left) and Schiaparelli capsule (right).
The rigid DGB parachute (see Figure 2, left) is suspended at a length of 24 m from the rear end of the capsule. The bridle, raiser and bridle attachment lengths combined are 4.011 m.
A three-dimensional structured grid has been generated by the ANSYS Workbench to simulate the flow field inside the computational domain. Due to computational capacity limitations, the suspension lines were neglected. The boundary conditions [18] are summarized in Table 1.
Table 1.
Boundary conditions.
The time step is 1.0 × 10⁻⁴ s and the overall runtime of numerical simulations conducted is 0.126 s.
Grid-Independence Analysis
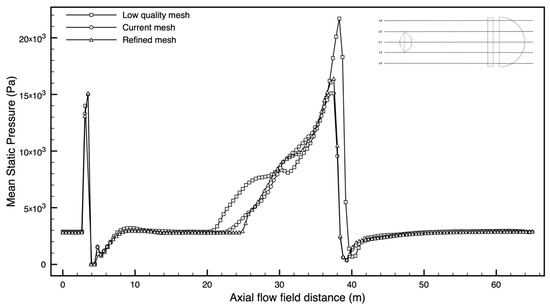
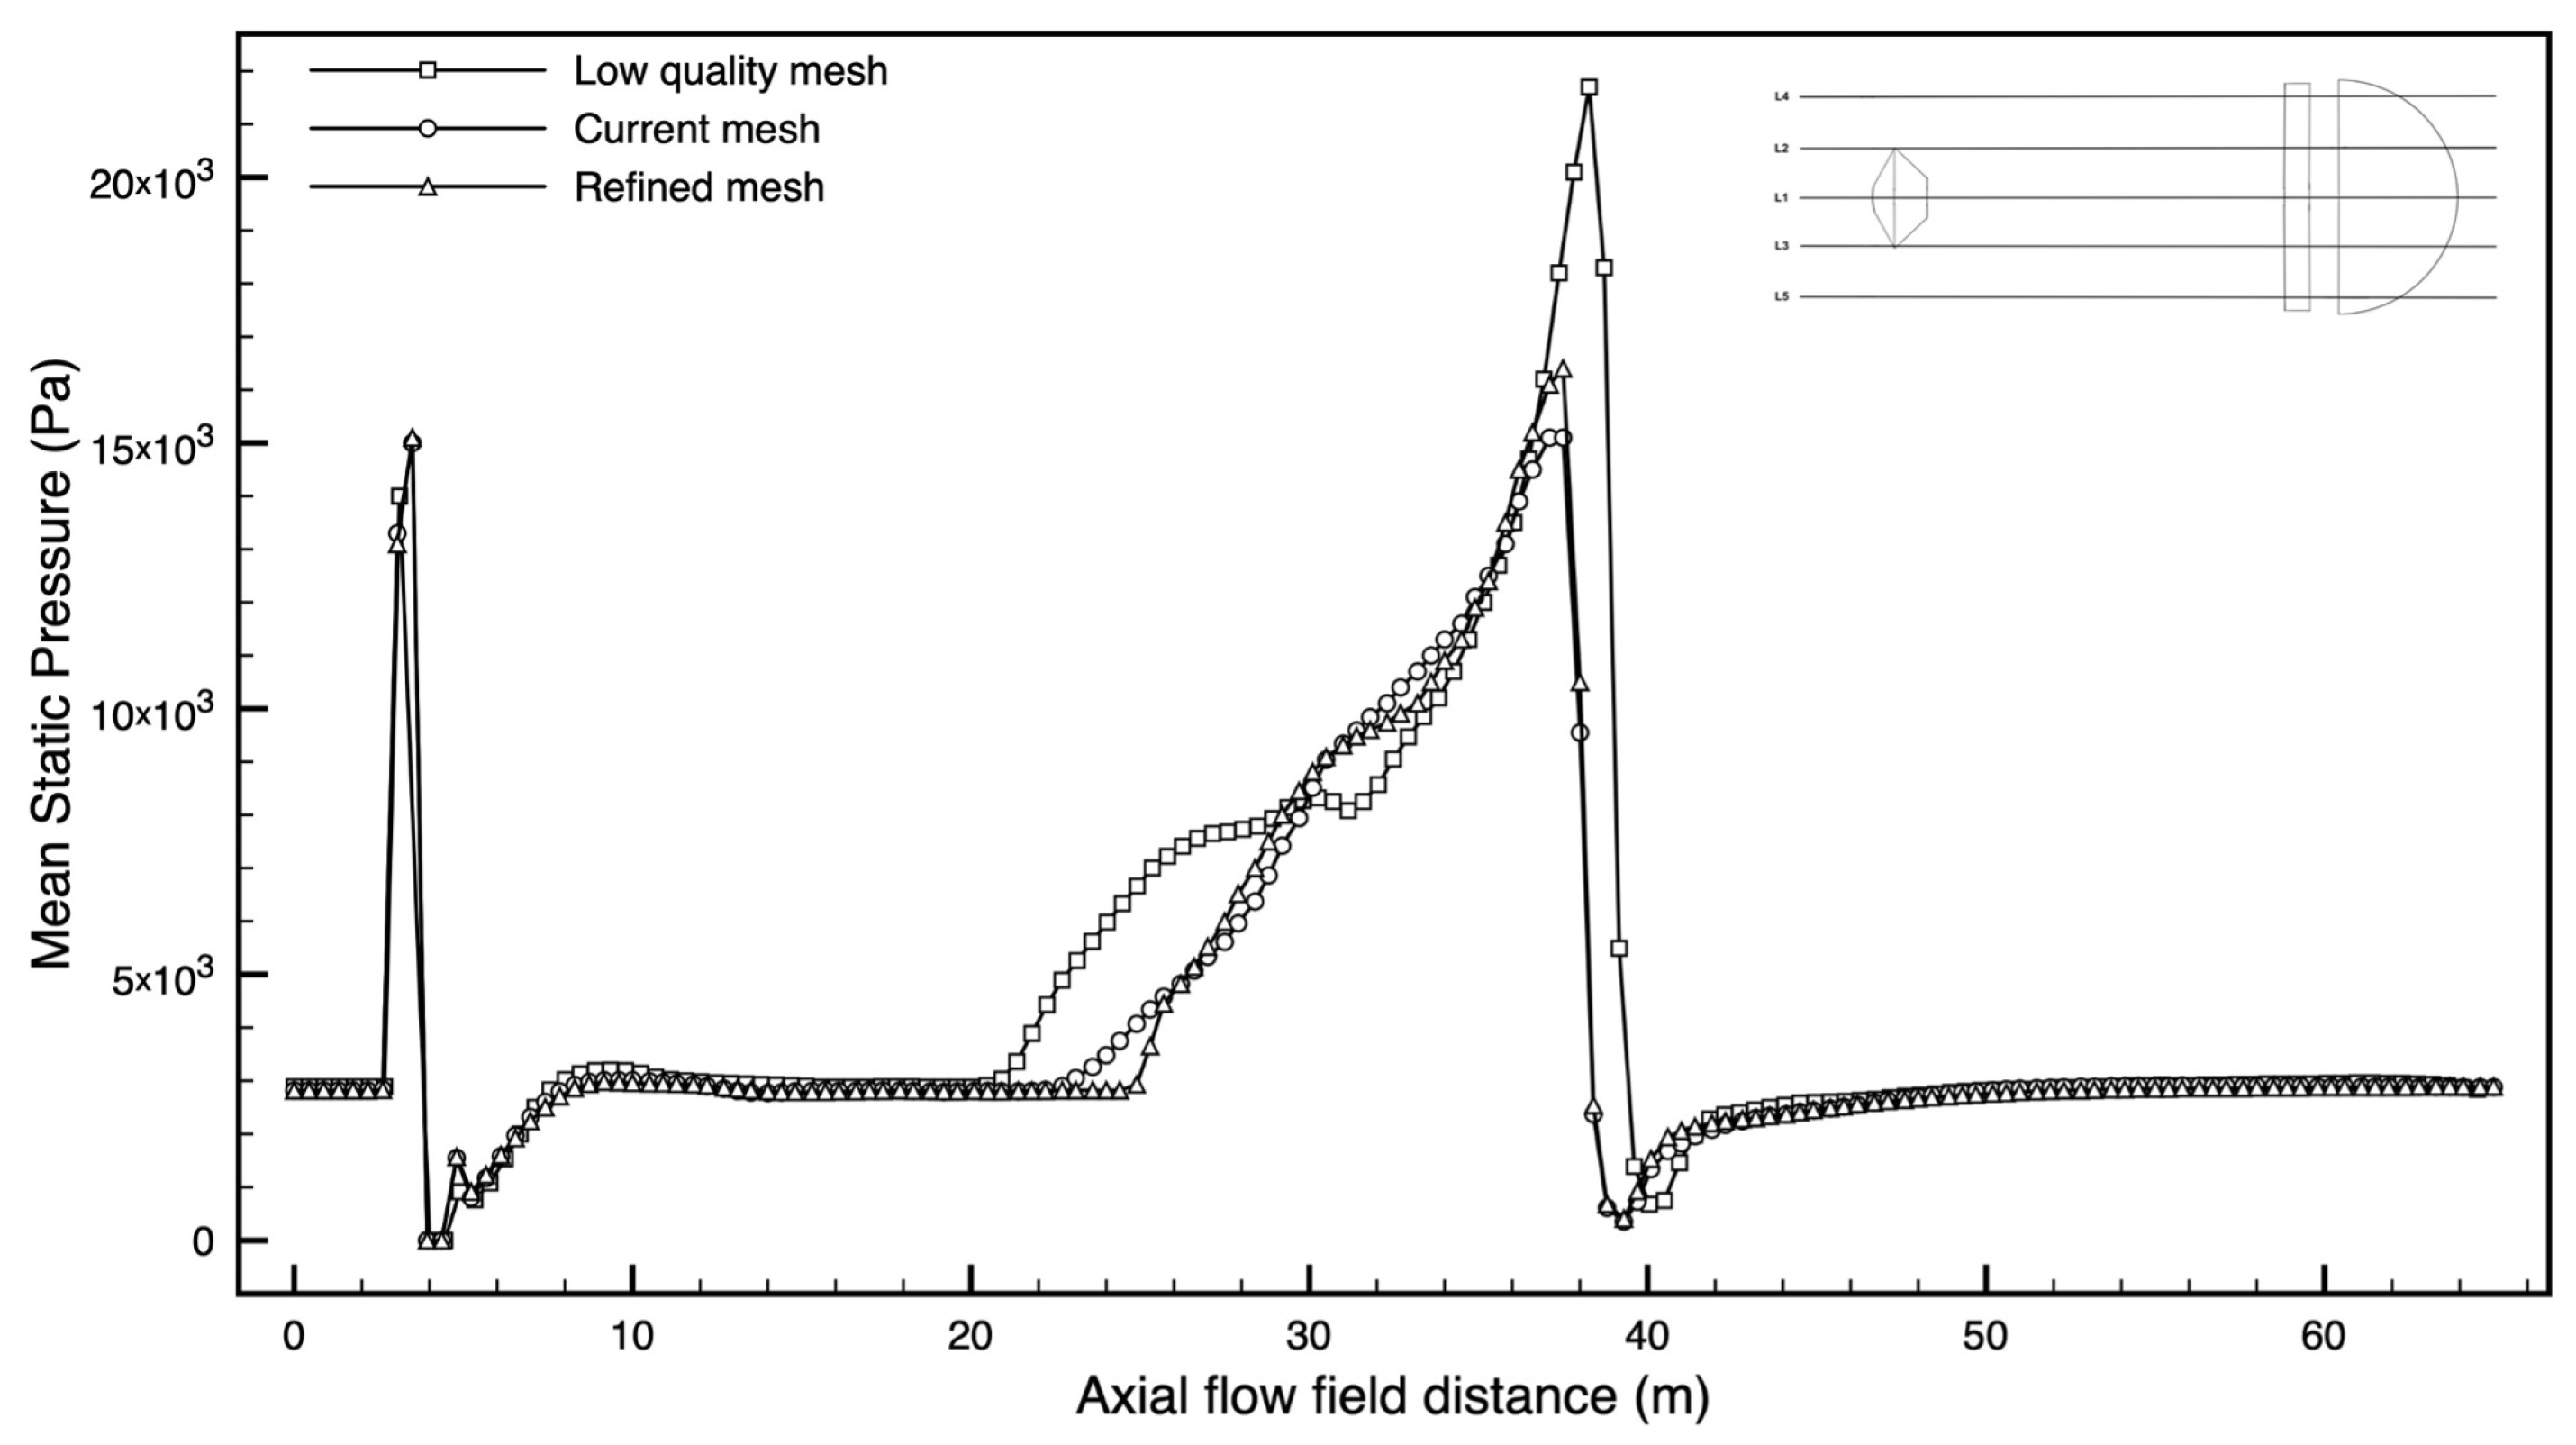
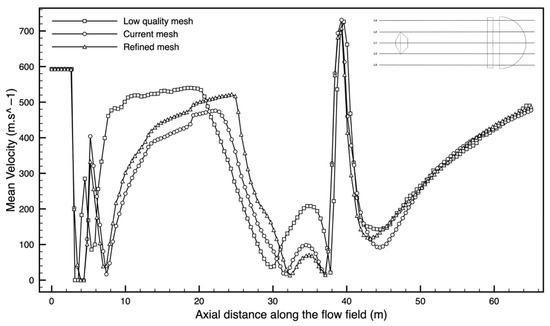
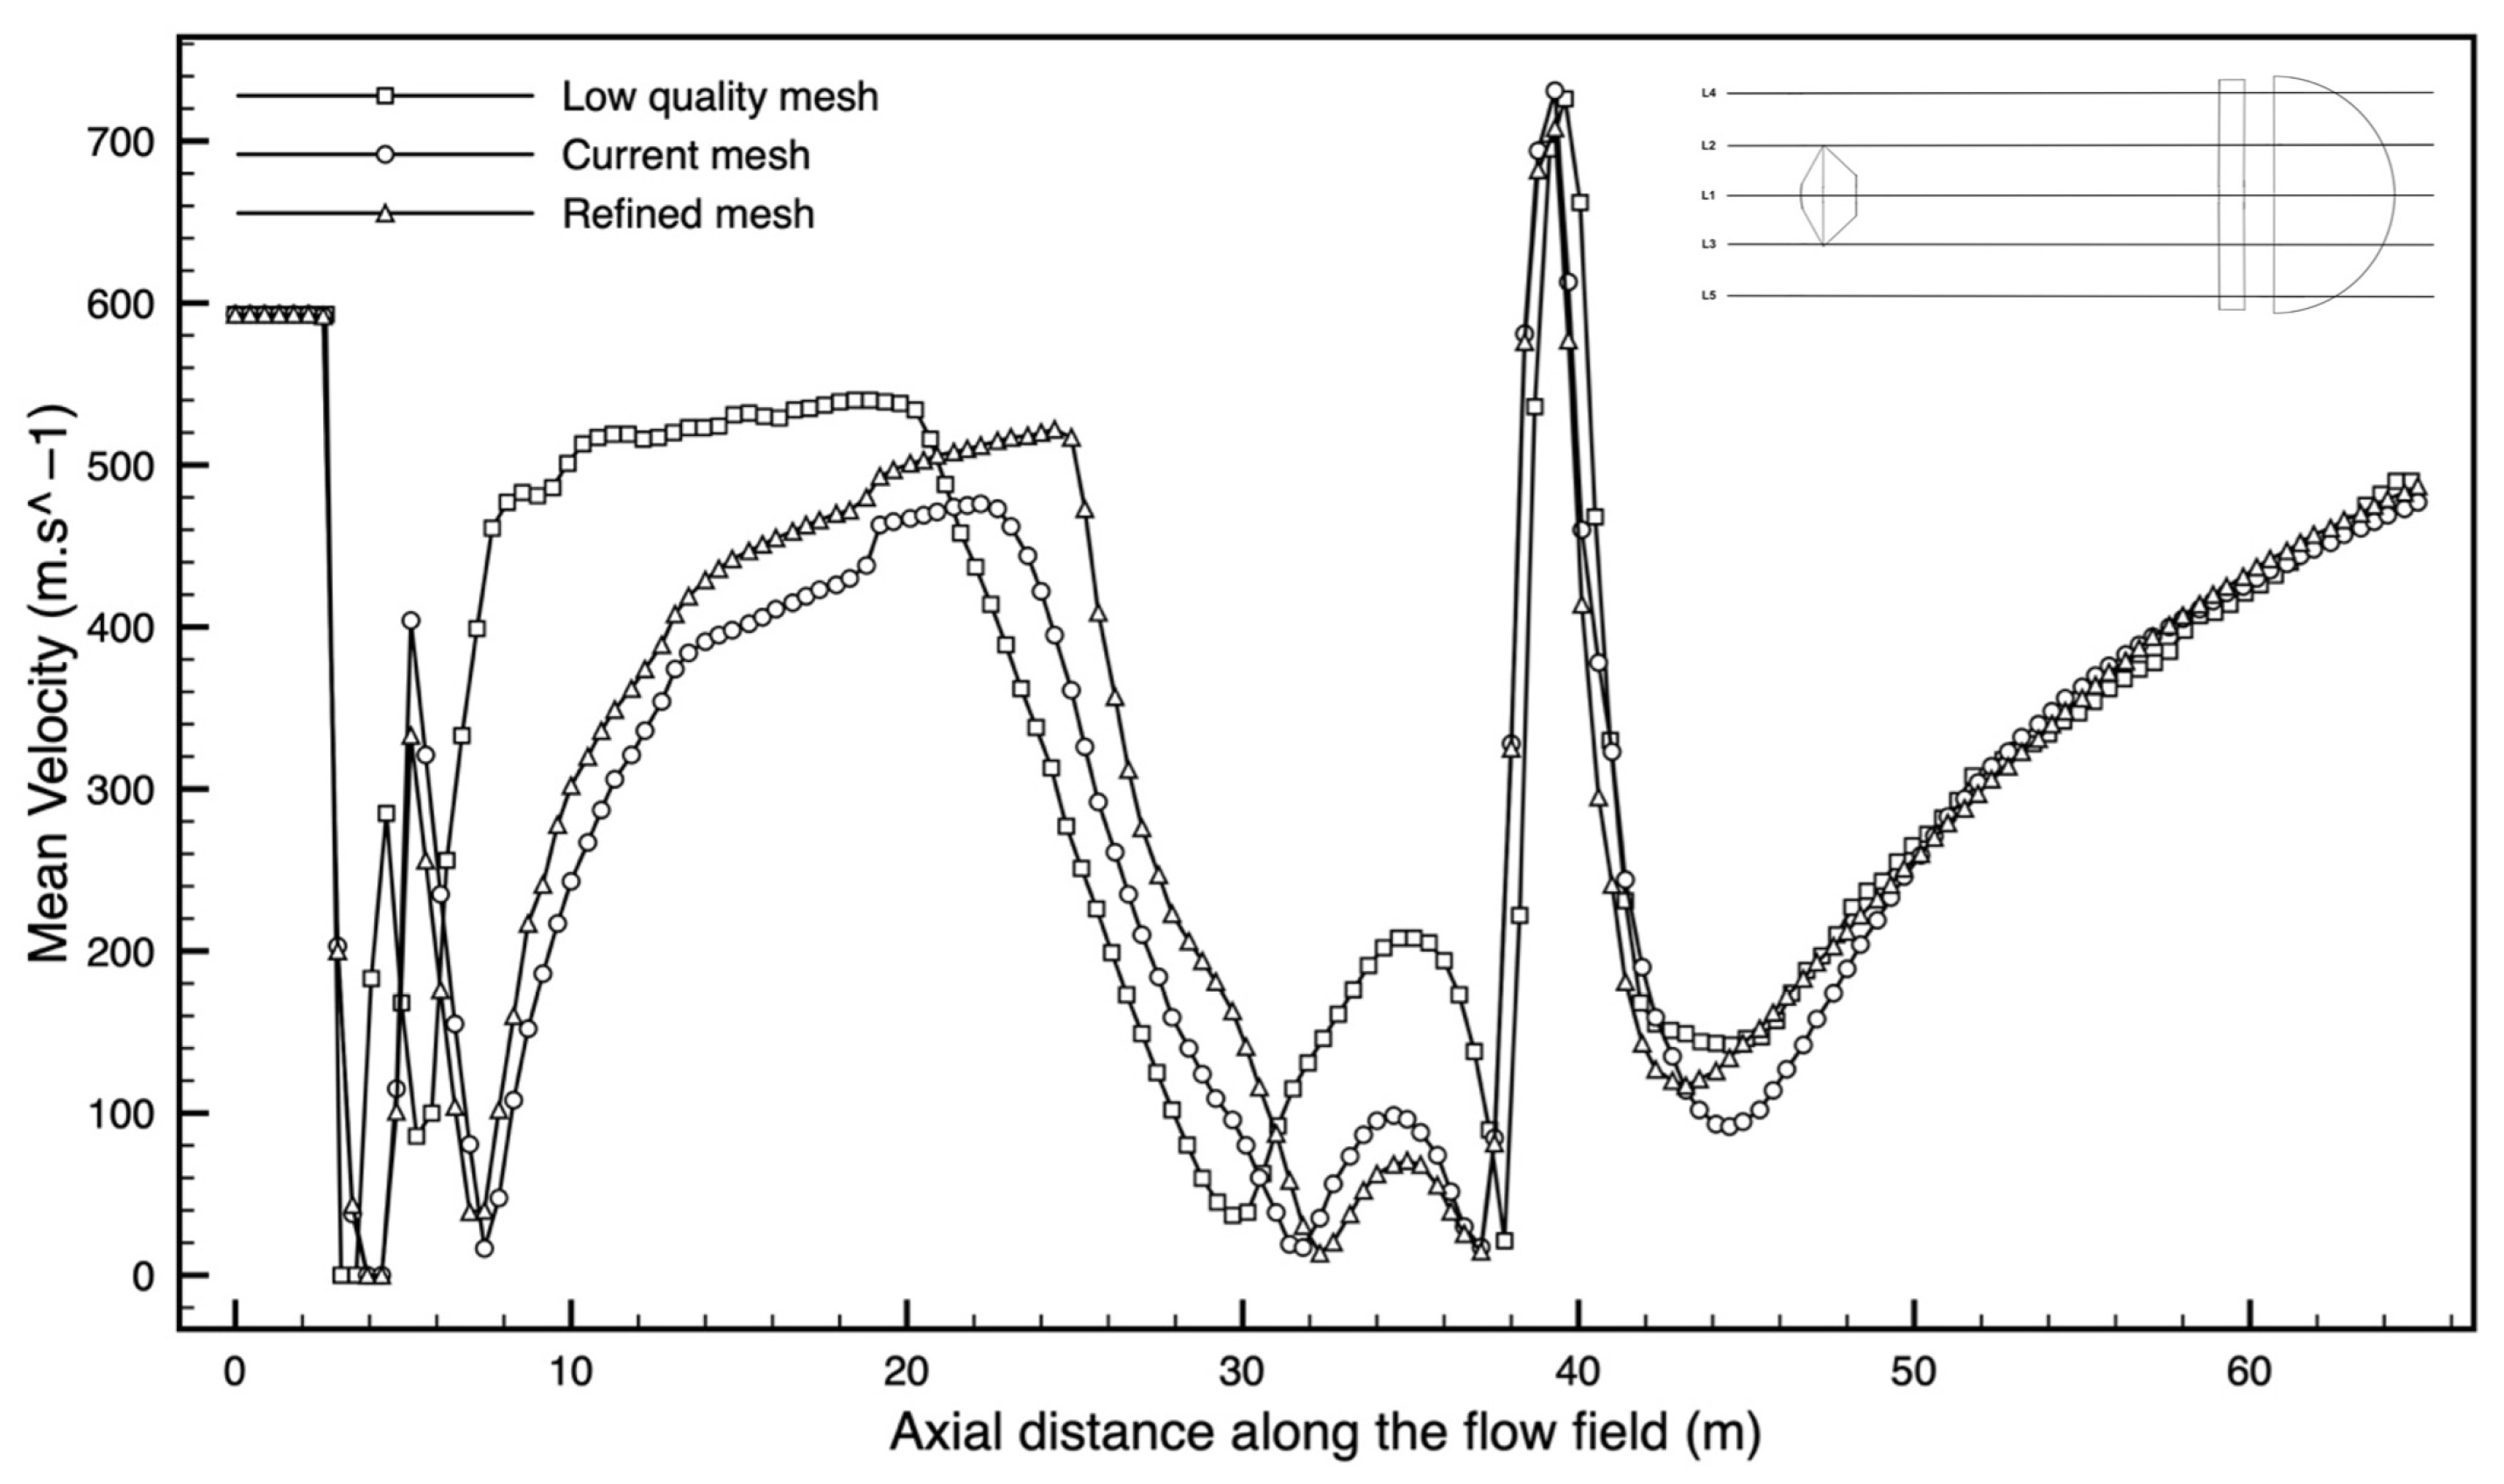
In order to select a suitable computational domain, a grid-independence study was conducted to validate that the resulting solution is invariant as the mesh is refined (see Figure 3 and Figure 4). In particular, three different levels of mesh refinement were selected, starting from 1.5 million nodes to 2.94 million nodes, an increase of 40%.
Figure 3.
Mean static pressure for three different grids.
Figure 4.
Mean velocity for three different grids.
The comparison between the three different grids shows that increasing refining by 40%, from low-quality to medium-quality mesh, and therefore to higher-quality mesh, affects the difference in peak pressure by reducing it in front of the capsule from 6.6% to 0.6% (see Figure 3) and downstream of the parachute from 43% to 8.3%.
Figure 4 shows that for the mean velocity, the variation is negligible in front of the capsule, and it decreases by 13% to 9.6% in front of the parachute. A comparison between the peak values for the three different grids is shown in Table 2, accounting for the values upstream of the capsule and the parachute. This analysis shows that the medium grid of about 2.1 million nodes is a good compromise in terms of computational times and goodness of the numerical results.
Table 2.
Comparison between the peak values of the three grids upstream of the capsule and the parachute.
3. Numerical Validation with Reference Work and Theoretical Results
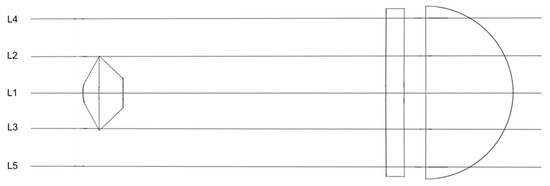
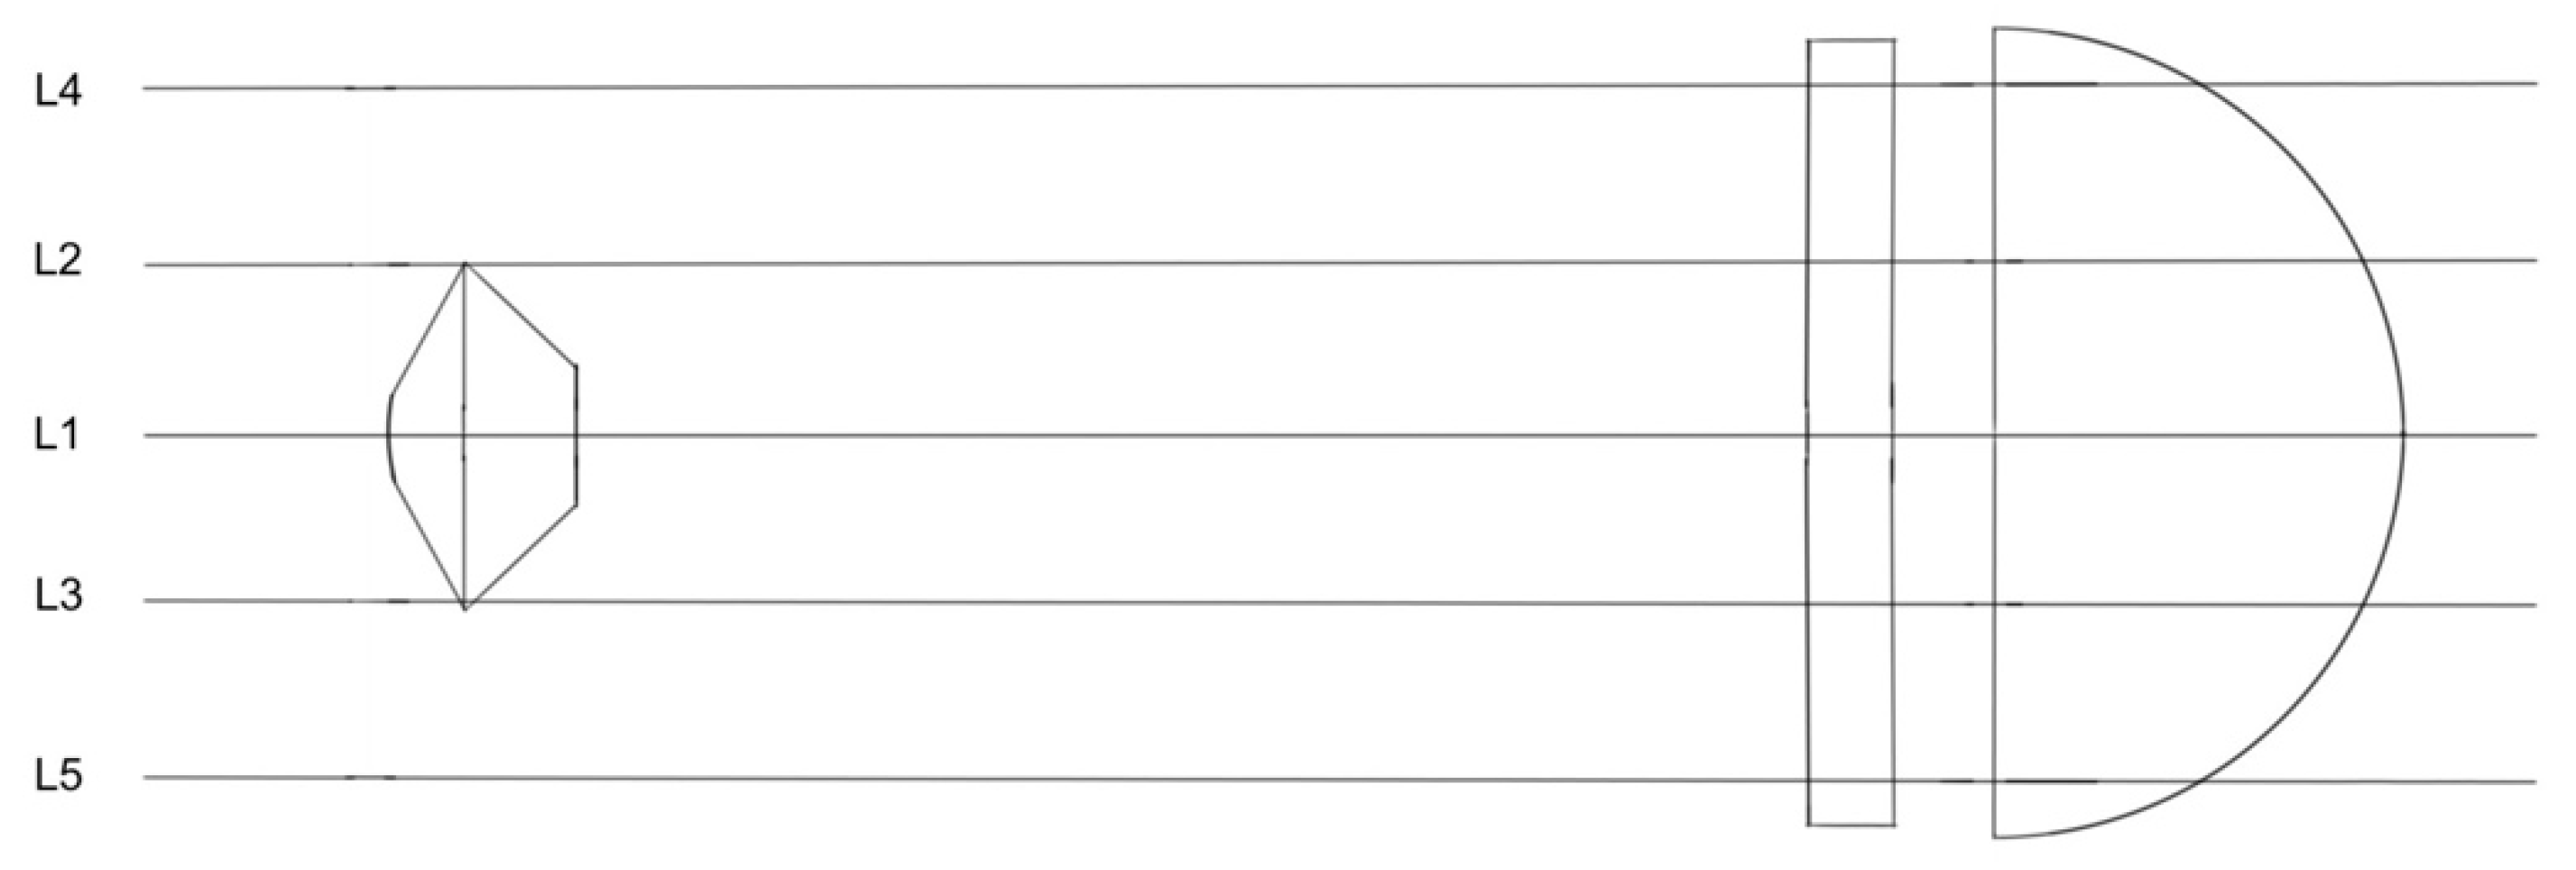
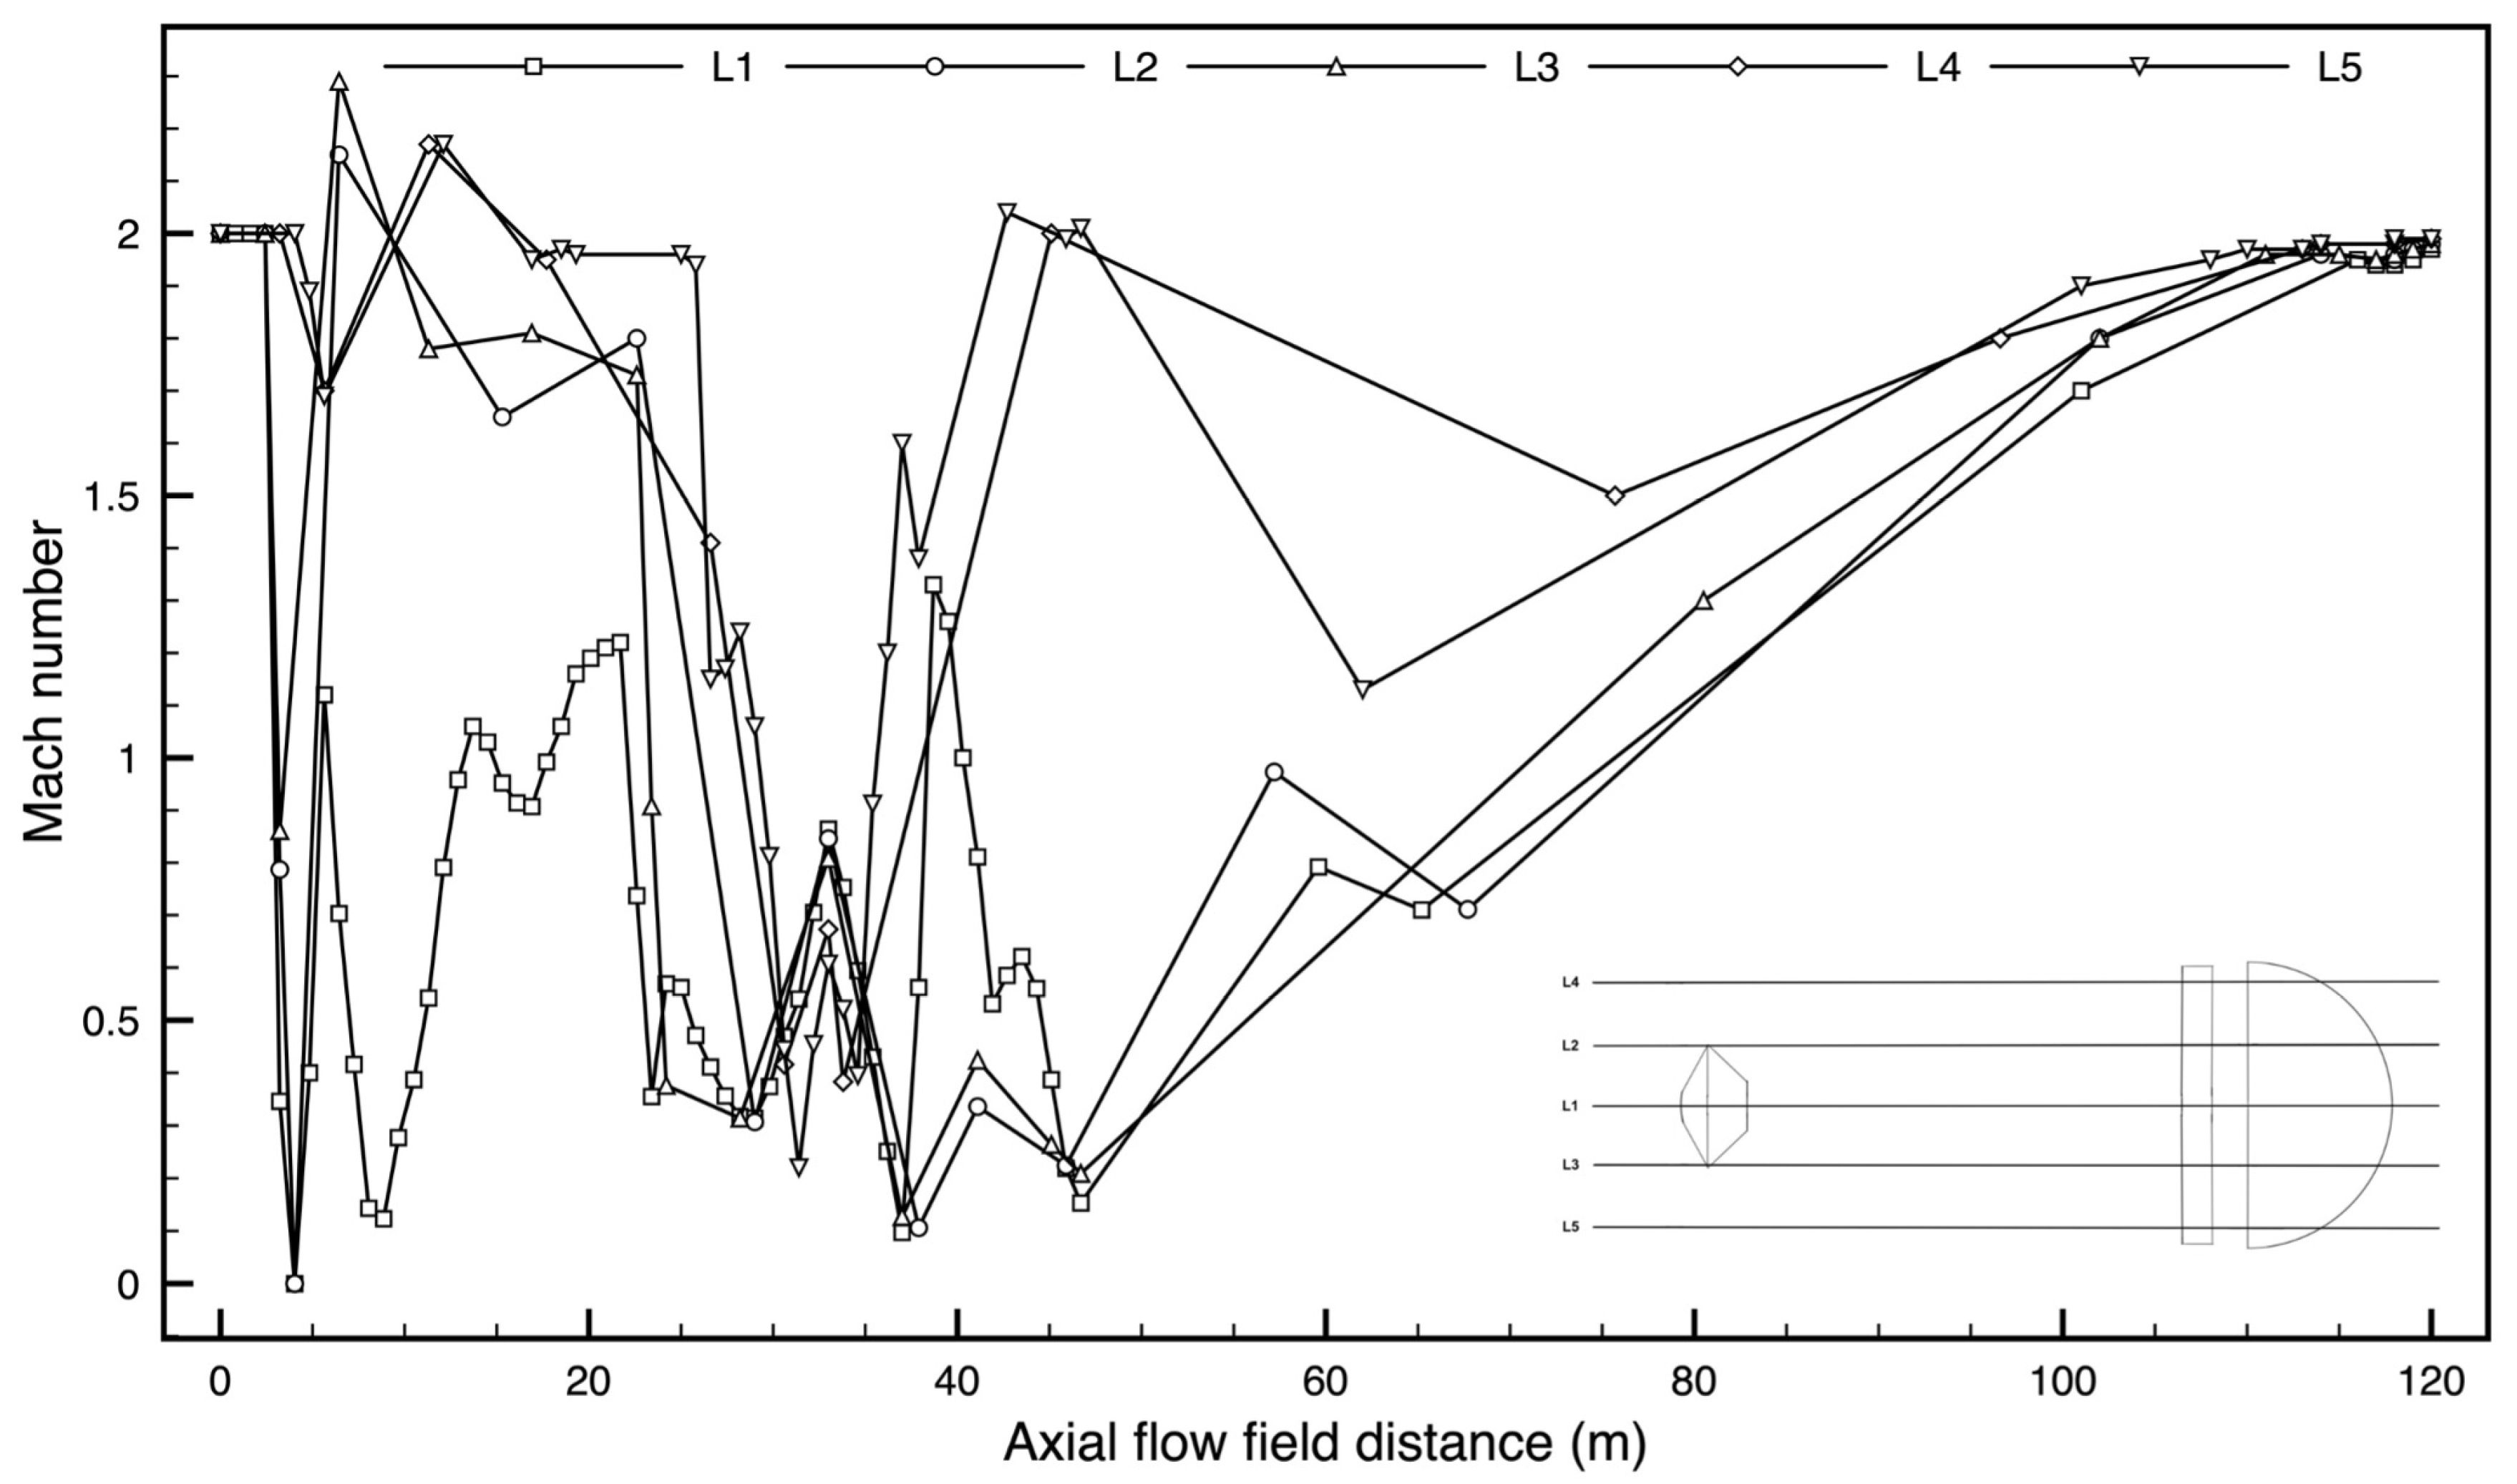
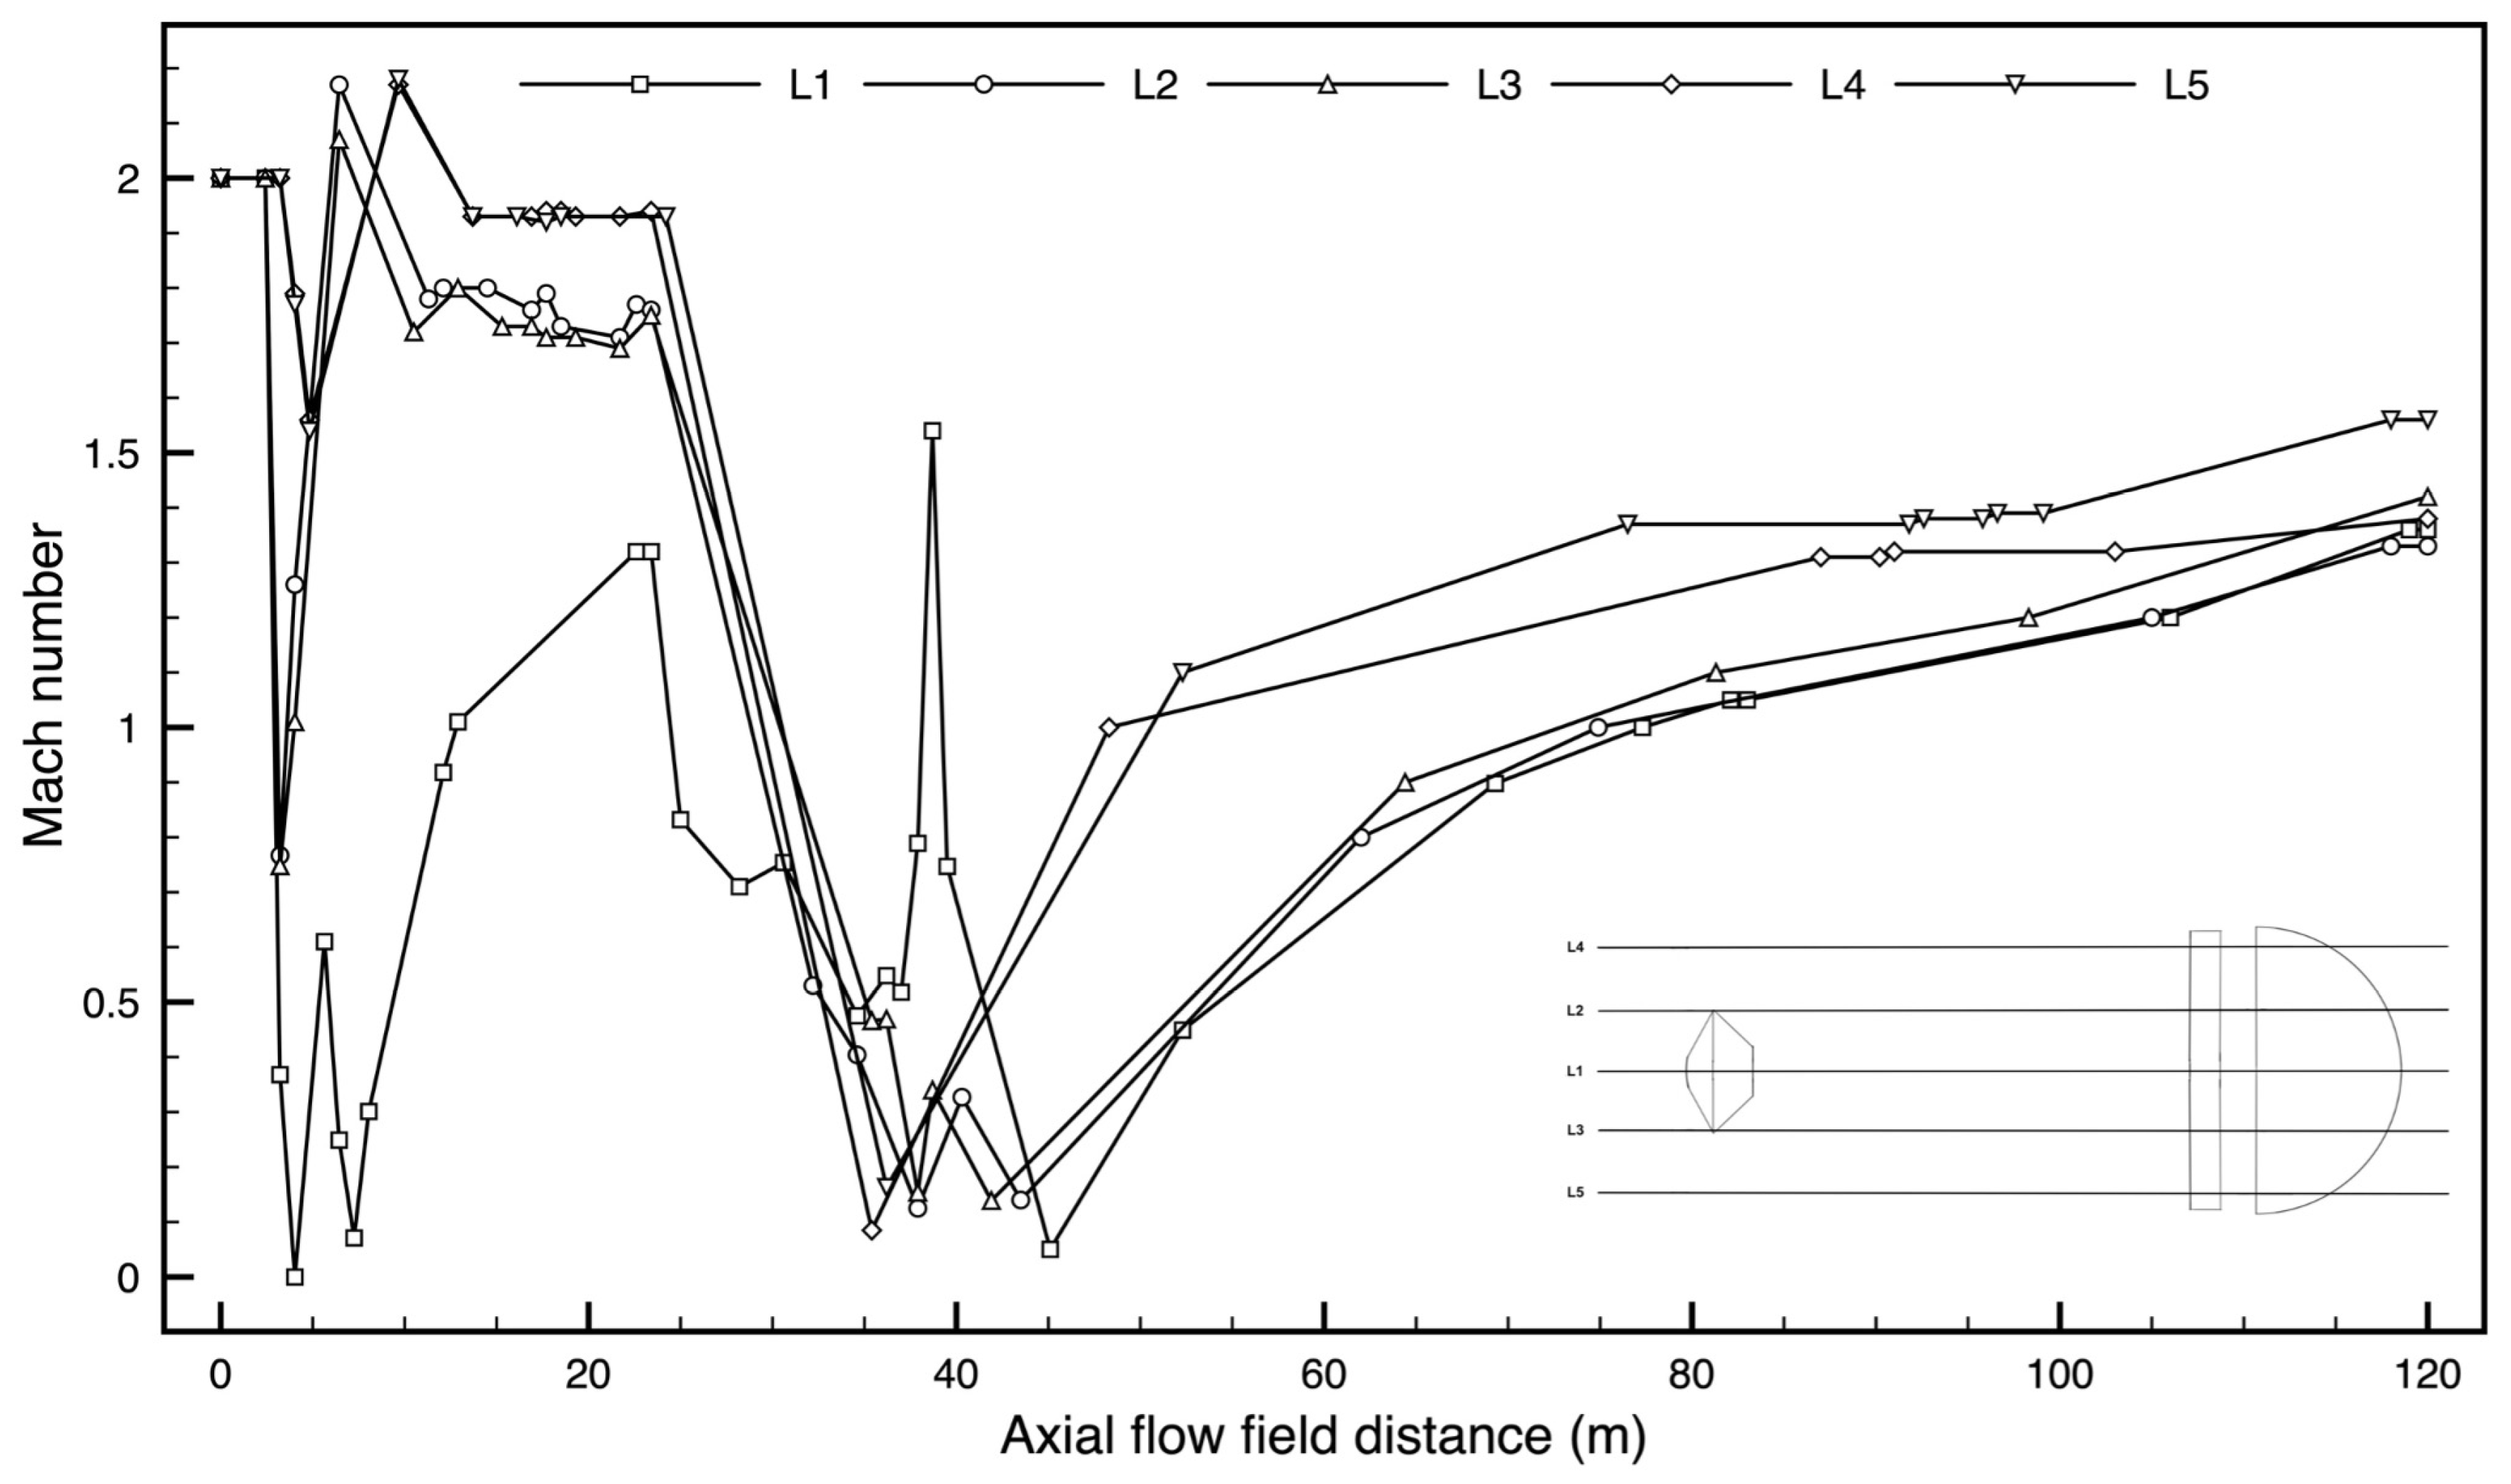
In order to investigate the pressure distribution along the Schiaparelli capsule and parachute, data are collected and processed at five different locations (L1, L2, L3, L4, L5), as shown in Figure 5.
Figure 5.
Dataset locations L1, L2, L3, L4, L5 along the computational domain symmetric plane.
L1 is the axisymmetric line of the domain. L2 and L3 are equidistant from L1 and pass through the shoulders of the capsule. L4 and L5 are still equidistant from L2 and L3, and axisymmetric with respect to L1.
Validation of numerical simulations has been performed theoretically and numerically by comparing these results with those in [15]. Results are reported in Table 3. Theoretical data have been calculated by implementing the normal shock equations:
Table 3.
Analytical and simulated values of flow variables downstream of the capsule bow shock. Upstream values are computed from the simulation.
Table 4 shows the comparison between the experimental and simulated results of the coefficient of aerodynamic drag from the literature and the current study.
Table 4.
Aerodynamic performance of the supersonic capsule–DBG parachute system.
The experimental results from [23,24,25,26] involved tests on a 2% scale rigid parachute configuration over the MSL deployment range and a 4% scale flexible DGB parachute system within the Mach number range of 2.0–2.5. In these experiments, it was observed that the aerodynamic drag coefficient (CD) for the flexible DGB parachute was approximately 0.48. In the current numerical investigation, the aerodynamic drag coefficient of the rigid DGB parachute is found to be 0.399 at a Mach number of 2.0, with a dimensionless canopy displacement, d/D0, of 0.2.
The discrepancy in the drag coefficient between the current study and the referenced works [19,20,21,22] could be attributed to the utilization of a rigid DGB parachute system in the present analysis. The rigid model neglects the structural interactions between the parachute surface and the atmosphere, as well as the cyclic behavior of inflation and deflation of the parachute.
The differences in the aerodynamic drag coefficients highlight the importance of considering the flexibility and structural dynamics of the parachute system, as these factors significantly influence its aerodynamic performance. The rigid model used in the current study simplifies the analysis, while the flexible models in the references capture more complex interactions, leading to variations in the observed drag coefficients.
4. Numerical Results
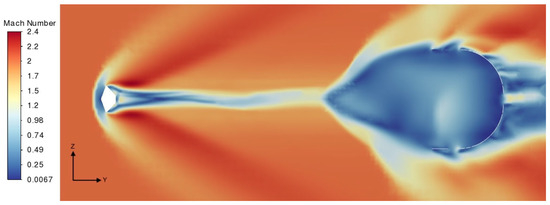
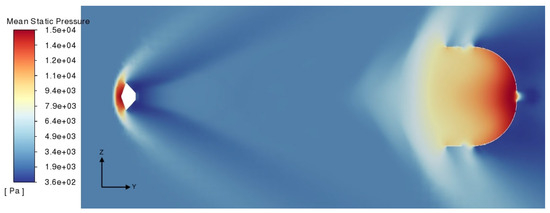
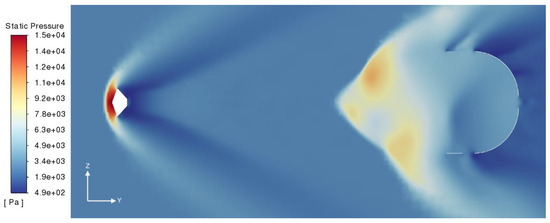
Figure 6 and Figure 7 show the mean and instantaneous Mach number flow field around the capsule and the rigid DGB parachute at the axisymmetric section of the computational domain. A strong bow shock is detached in front of the capsule at a distance of 0.7 m, and another in front of the canopy at a distance of approximately 1.8 m. Due to the strong bow shock ahead of the capsule and ahead of the canopy, there is a sudden decrease in the Mach number to subsonic values and increase in the pressure to 14,400 Pa (see Figure 8 and Figure 9).
Figure 6.
Mean Mach number contour of capsule and rigid DGB parachute system.
Figure 7.
Instantaneous Mach number contour of capsule and rigid DGB parachute system.
Figure 8.
Mean static pressure contours of capsule and rigid DGB parachute system.
Figure 9.
Instantaneous static pressure contours of capsule and rigid DGB parachute system.
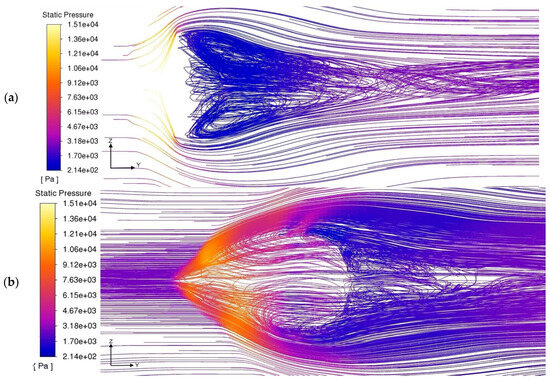
Because of the large deflection angle of the afterbody, the flow begins to expand after the shoulder; due to pressure decrease at the leeside of the afterbody to 1170 Pa, the flow separates, and recirculating flow is generated at the back of the vehicle (see Figure 10). When the separating shear layer merges, this forms a “neck,” which compresses the flow, causing a pressure increase. Figure 7 shows that when the expansion waves intersect at the back of the capsule, recompression waves are produced. Behind the neck, there is a far wake that extends several body diameters downstream. Figure 6 and Figure 7 show that the parachute canopy’s inner and outer flow fields are low-velocity regions, i.e., the Mach number is subsonic. When the supersonic flow enters the parachute canopy and reaches the saturation, it over-pressurizes the canopy (see Figure 8) and part of the flow moves in the opposite direction (see Figure 9), interacting with the shock wave ahead of the canopy.
Figure 10.
Path lines colored by the static pressure: (a) around the capsule; (b) around the parachute.
Figure 10 shows that eddies are axisymmetric behind the capsule, while these are non-axisymmetric in the front and behind the parachute. The instantaneous pressure at the bottom inner wall of the canopy is higher than that at the upper inner walls of the canopy (see Figure 9), while the mean pressure field (Figure 8) is shown to be axisymmetric, this explaining the oscillatory movement of the system and its failure.
The maximum averaged pressure (see Figure 8) is approximately 14,400 Pa in front of the capsule and approximately 14,900 Pa at the inner surface of the canopy. The maximum instantaneous pressure, at t = 0.126 s, is nearly 14,800 Pa in front of the capsule and nearly 6300 Pa near the inner surface of the canopy (see Figure 7). Thereafter, the pressure drops drastically from 14,800 Pa to 1170 Pa immediately downstream of the capsule and to 1370 Pa downstream of the canopy and tends to rise due to the vortex structures in the flow. A pressure variation of 5130 Pa within the canopy (as shown in Figure 9) confirms the inflation behavior observed experimentally. Another portion of the flow ejects from the parachute band structure, forming an expansion wave that gradually merges with the bow shock in front of the canopy. The remaining fluid flows through the gap and along the disk structure into the turbulent wake region behind the canopy: there, the flow is characterized by complex and turbulent structures, containing eddies, and the supersonic jet flow. Figure 11 shows that downstream of the capsule, the instantaneous field of the Mach number has an oscillatory behavior in the wake region, while in the same region, the mean field is completely axisymmetric (see Figure 12). This means that in the wake, the flow field is not steady, but it starts to oscillate with a radius of oscillation of the order of the capsule diameter. Within the neck downstream of the capsule, as shown in Figure 11, due to the eddies’ structures, the flow alternates between sonic and supersonic regions. In front of the parachute, the velocity of the flow again drops drastically due to the second bow shock. Downstream of this shock, in front of the canopy, the Mach number is not axisymmetric both in the instantaneous and in the mean flow field: the Mach number at the wind side of the body is 50% higher than in the leeside (see Figure 12).
Figure 11.
Instantaneous Mach number along the computational domain.
Figure 12.
Mean Mach number along the computational domain.
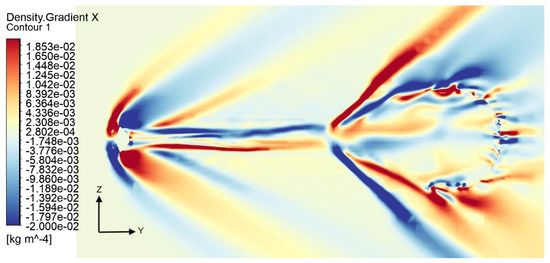
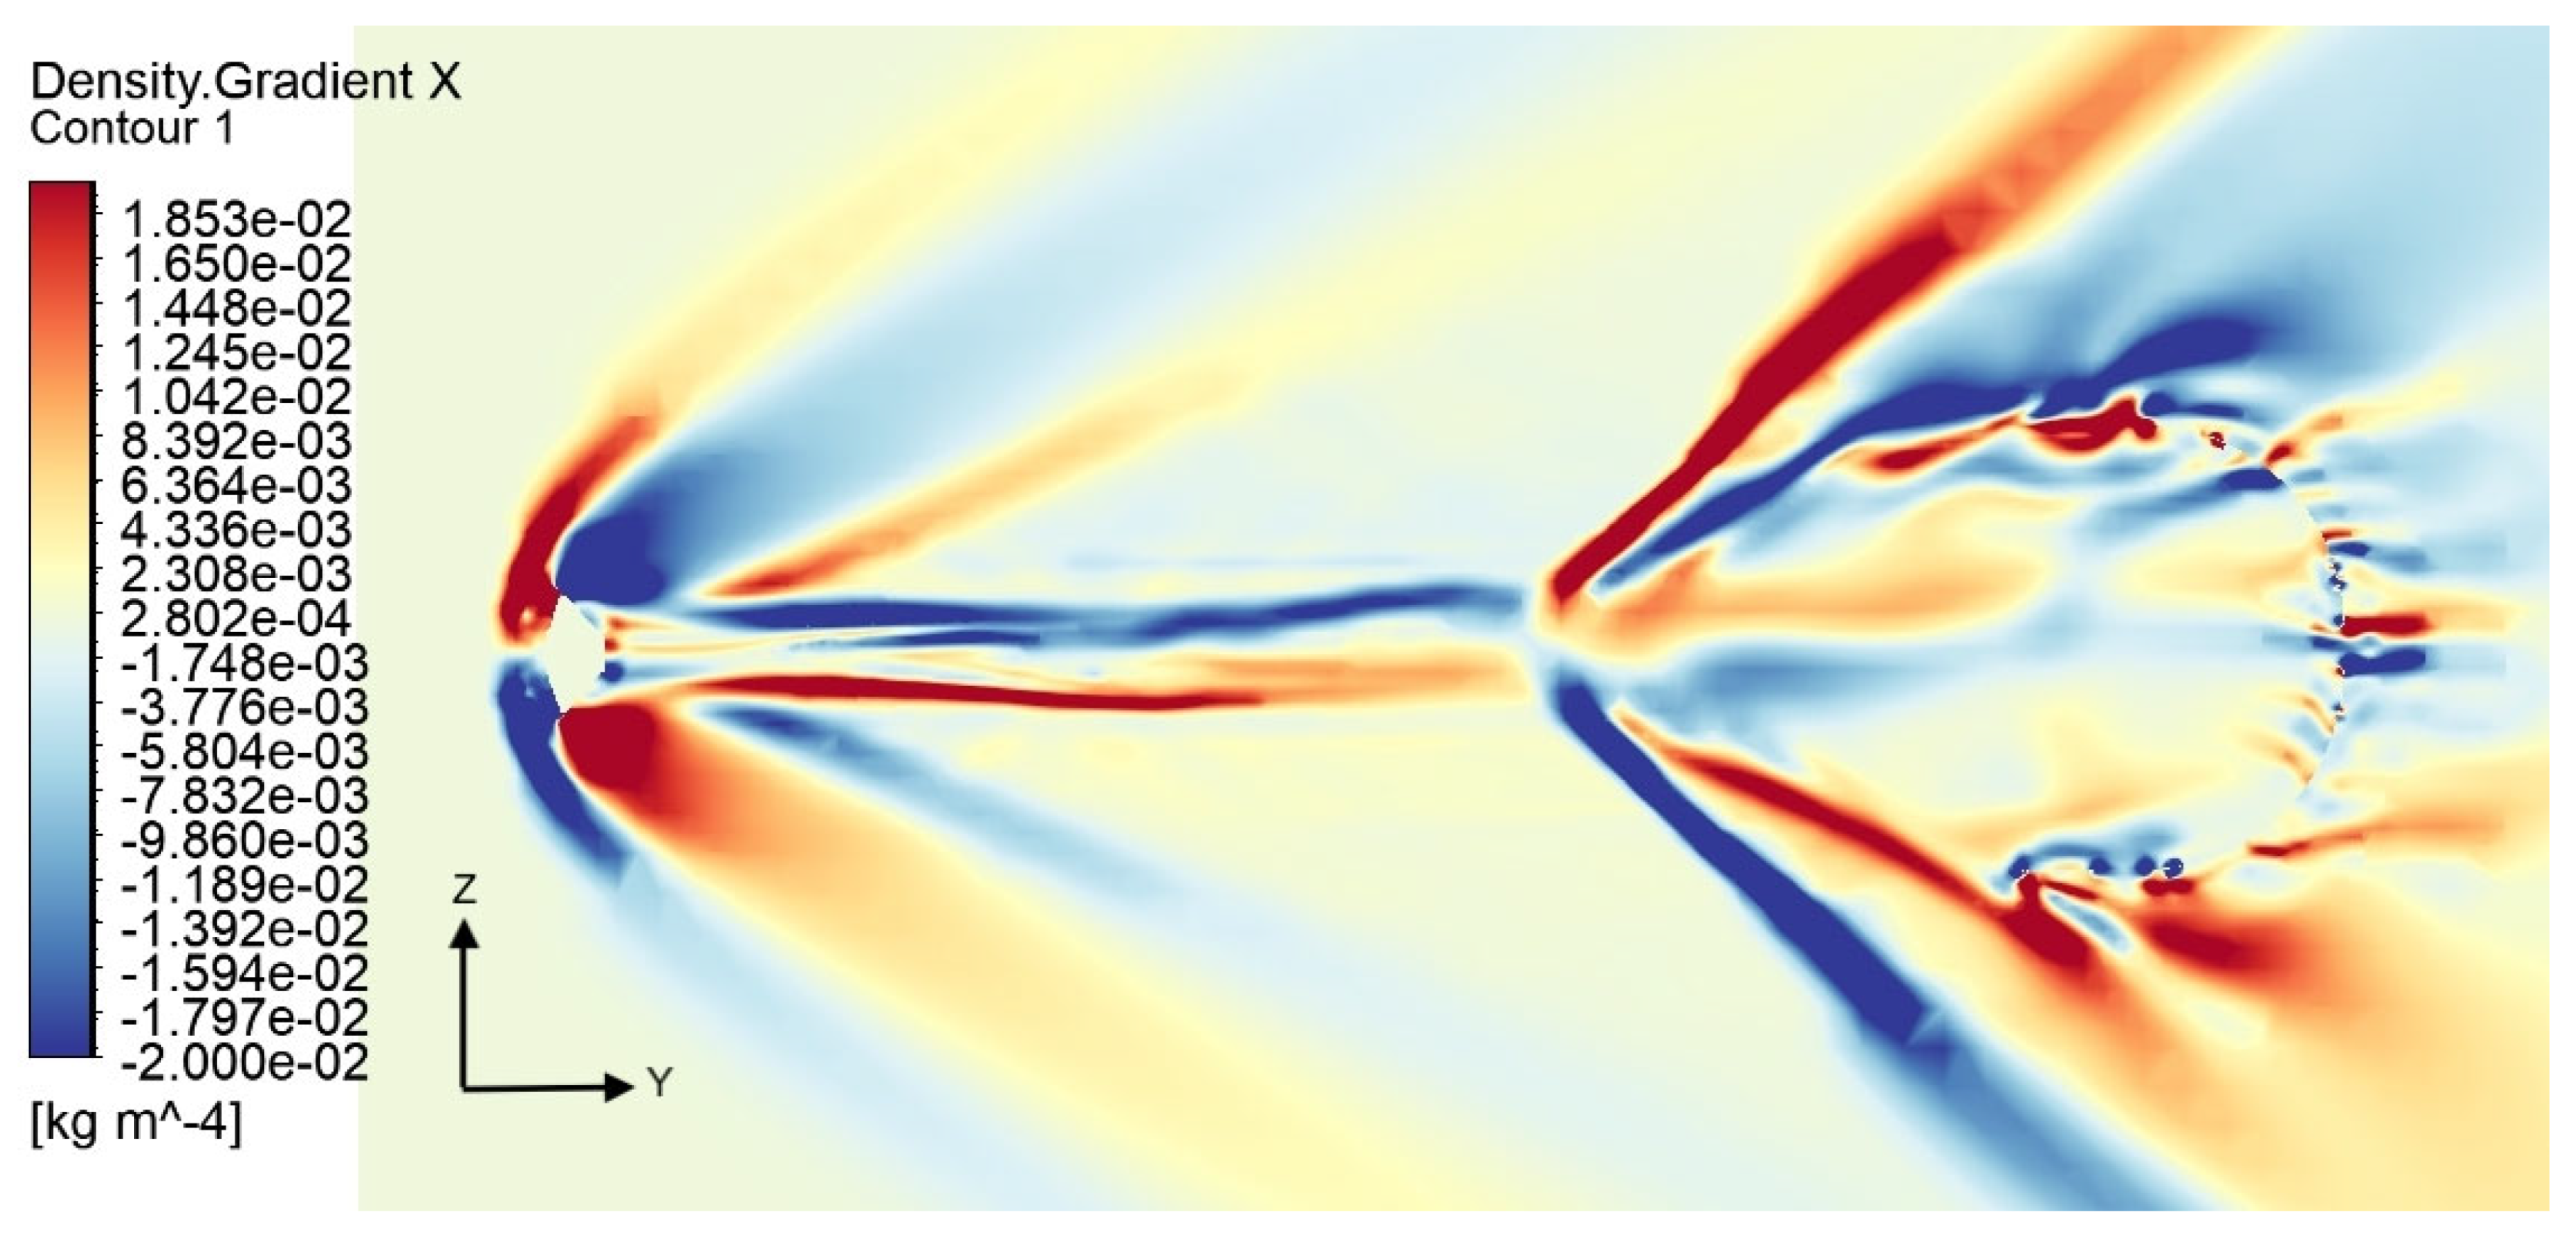
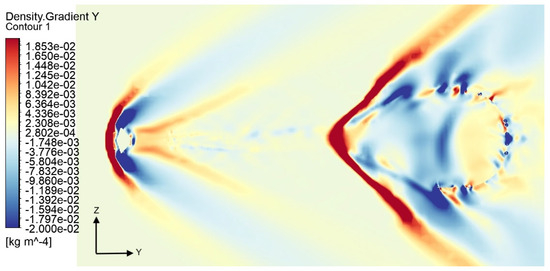
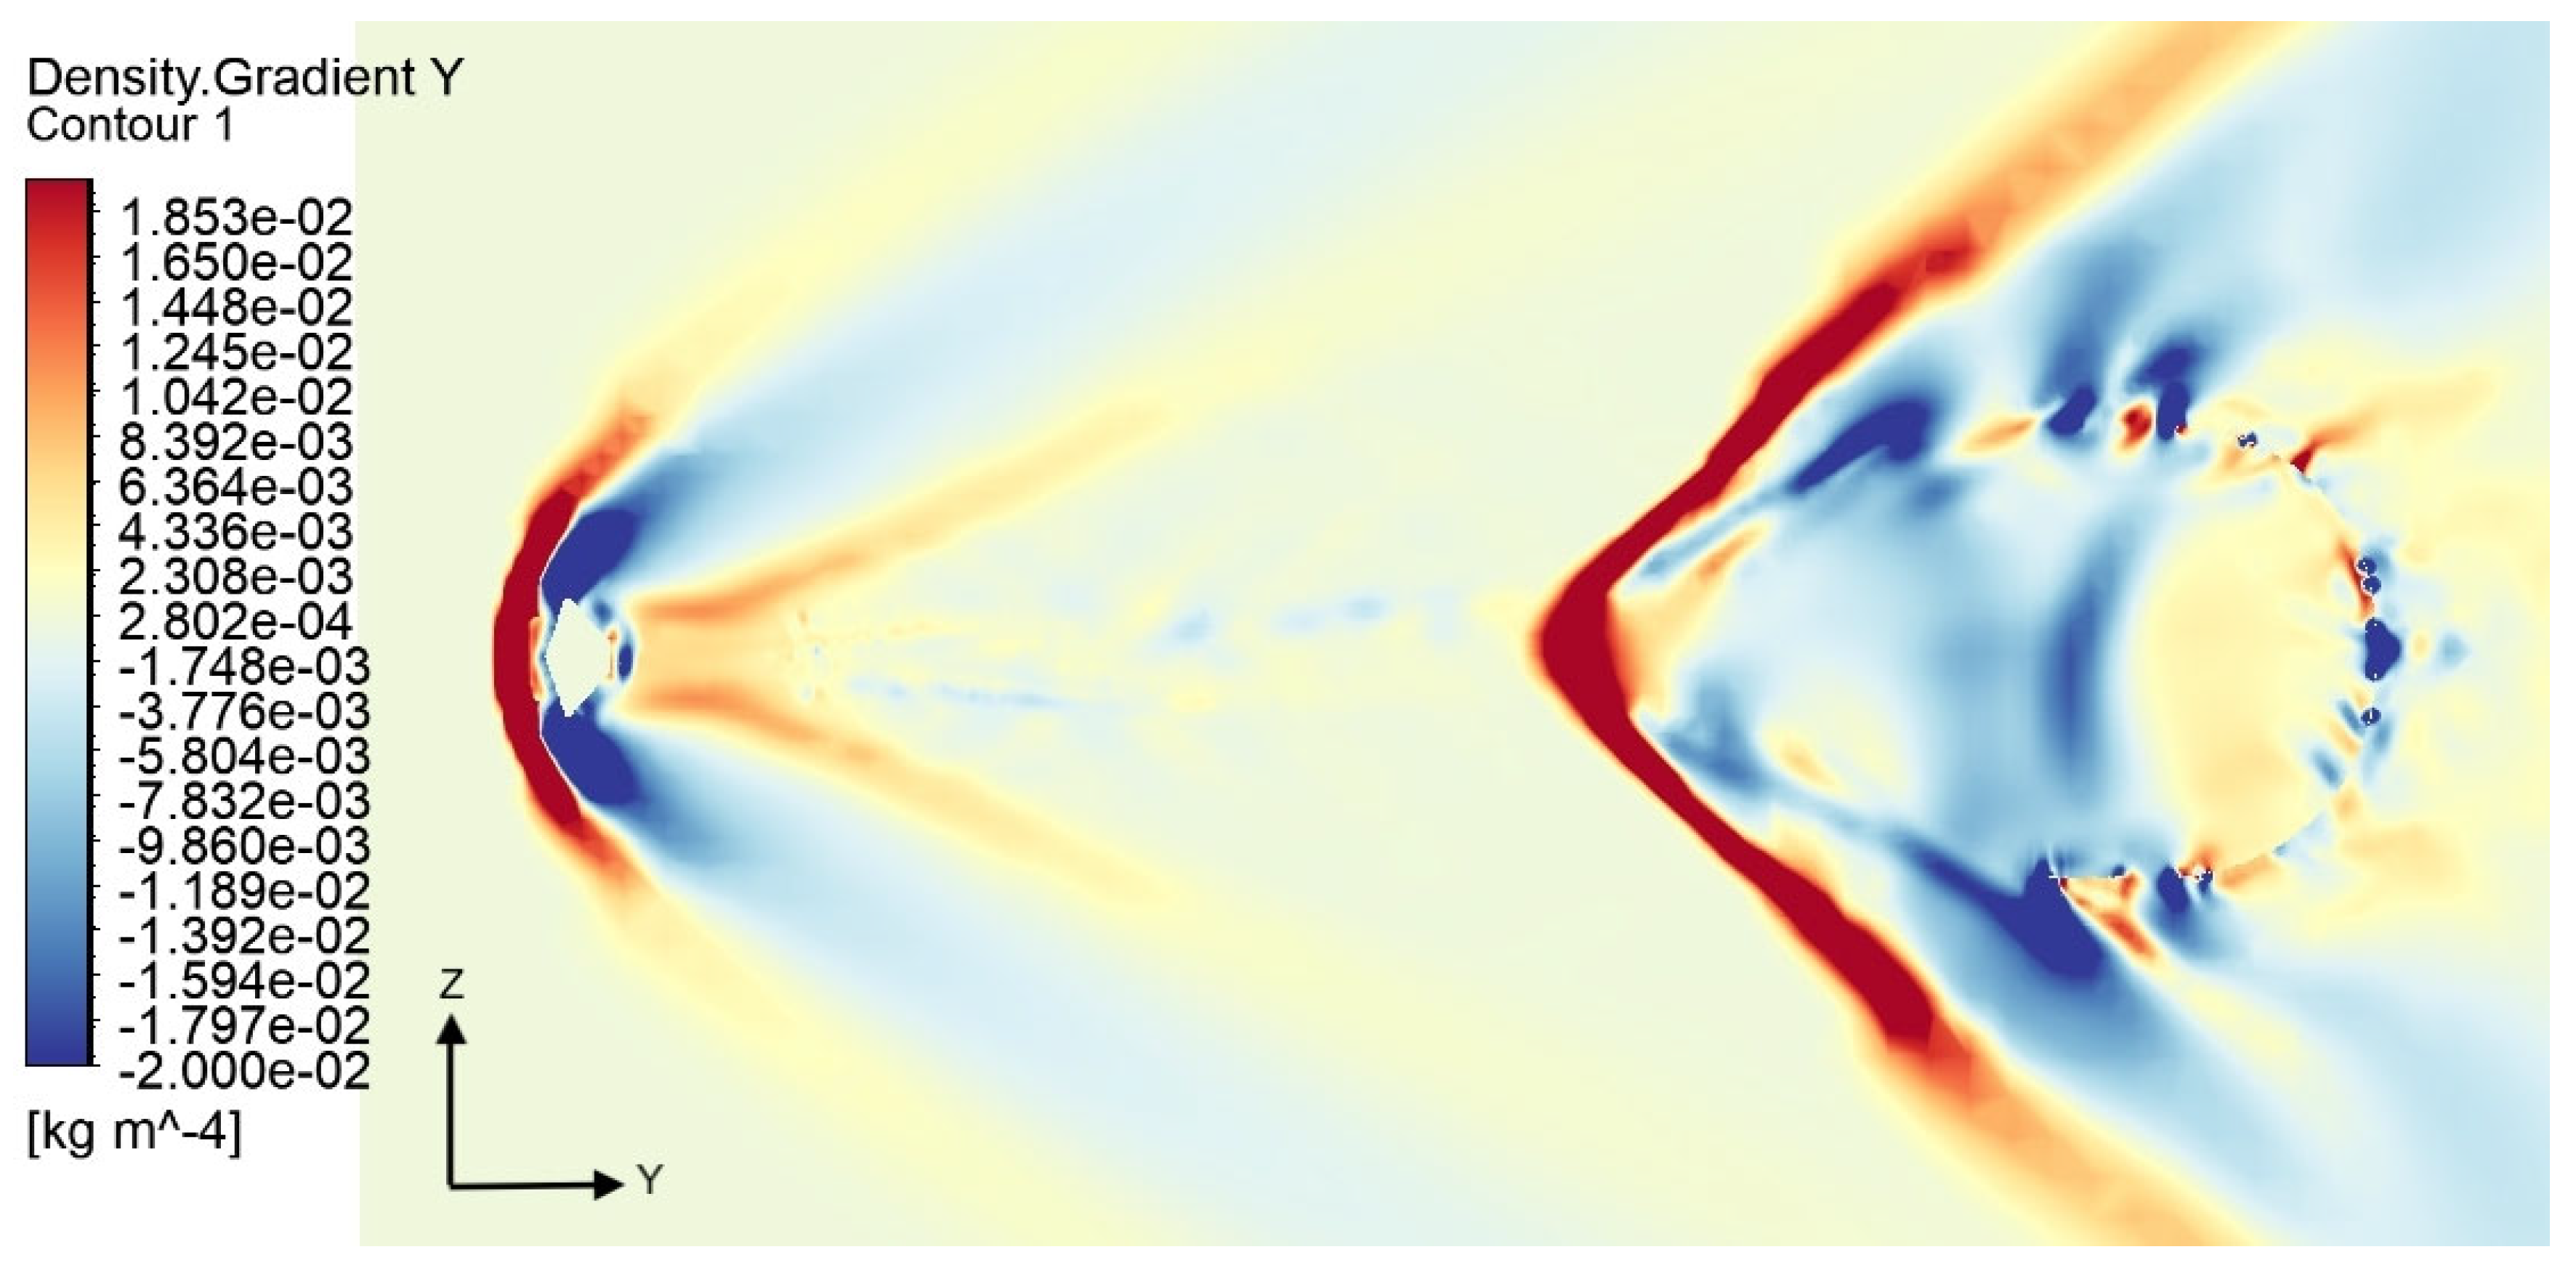
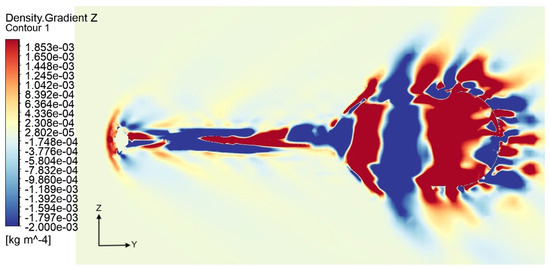
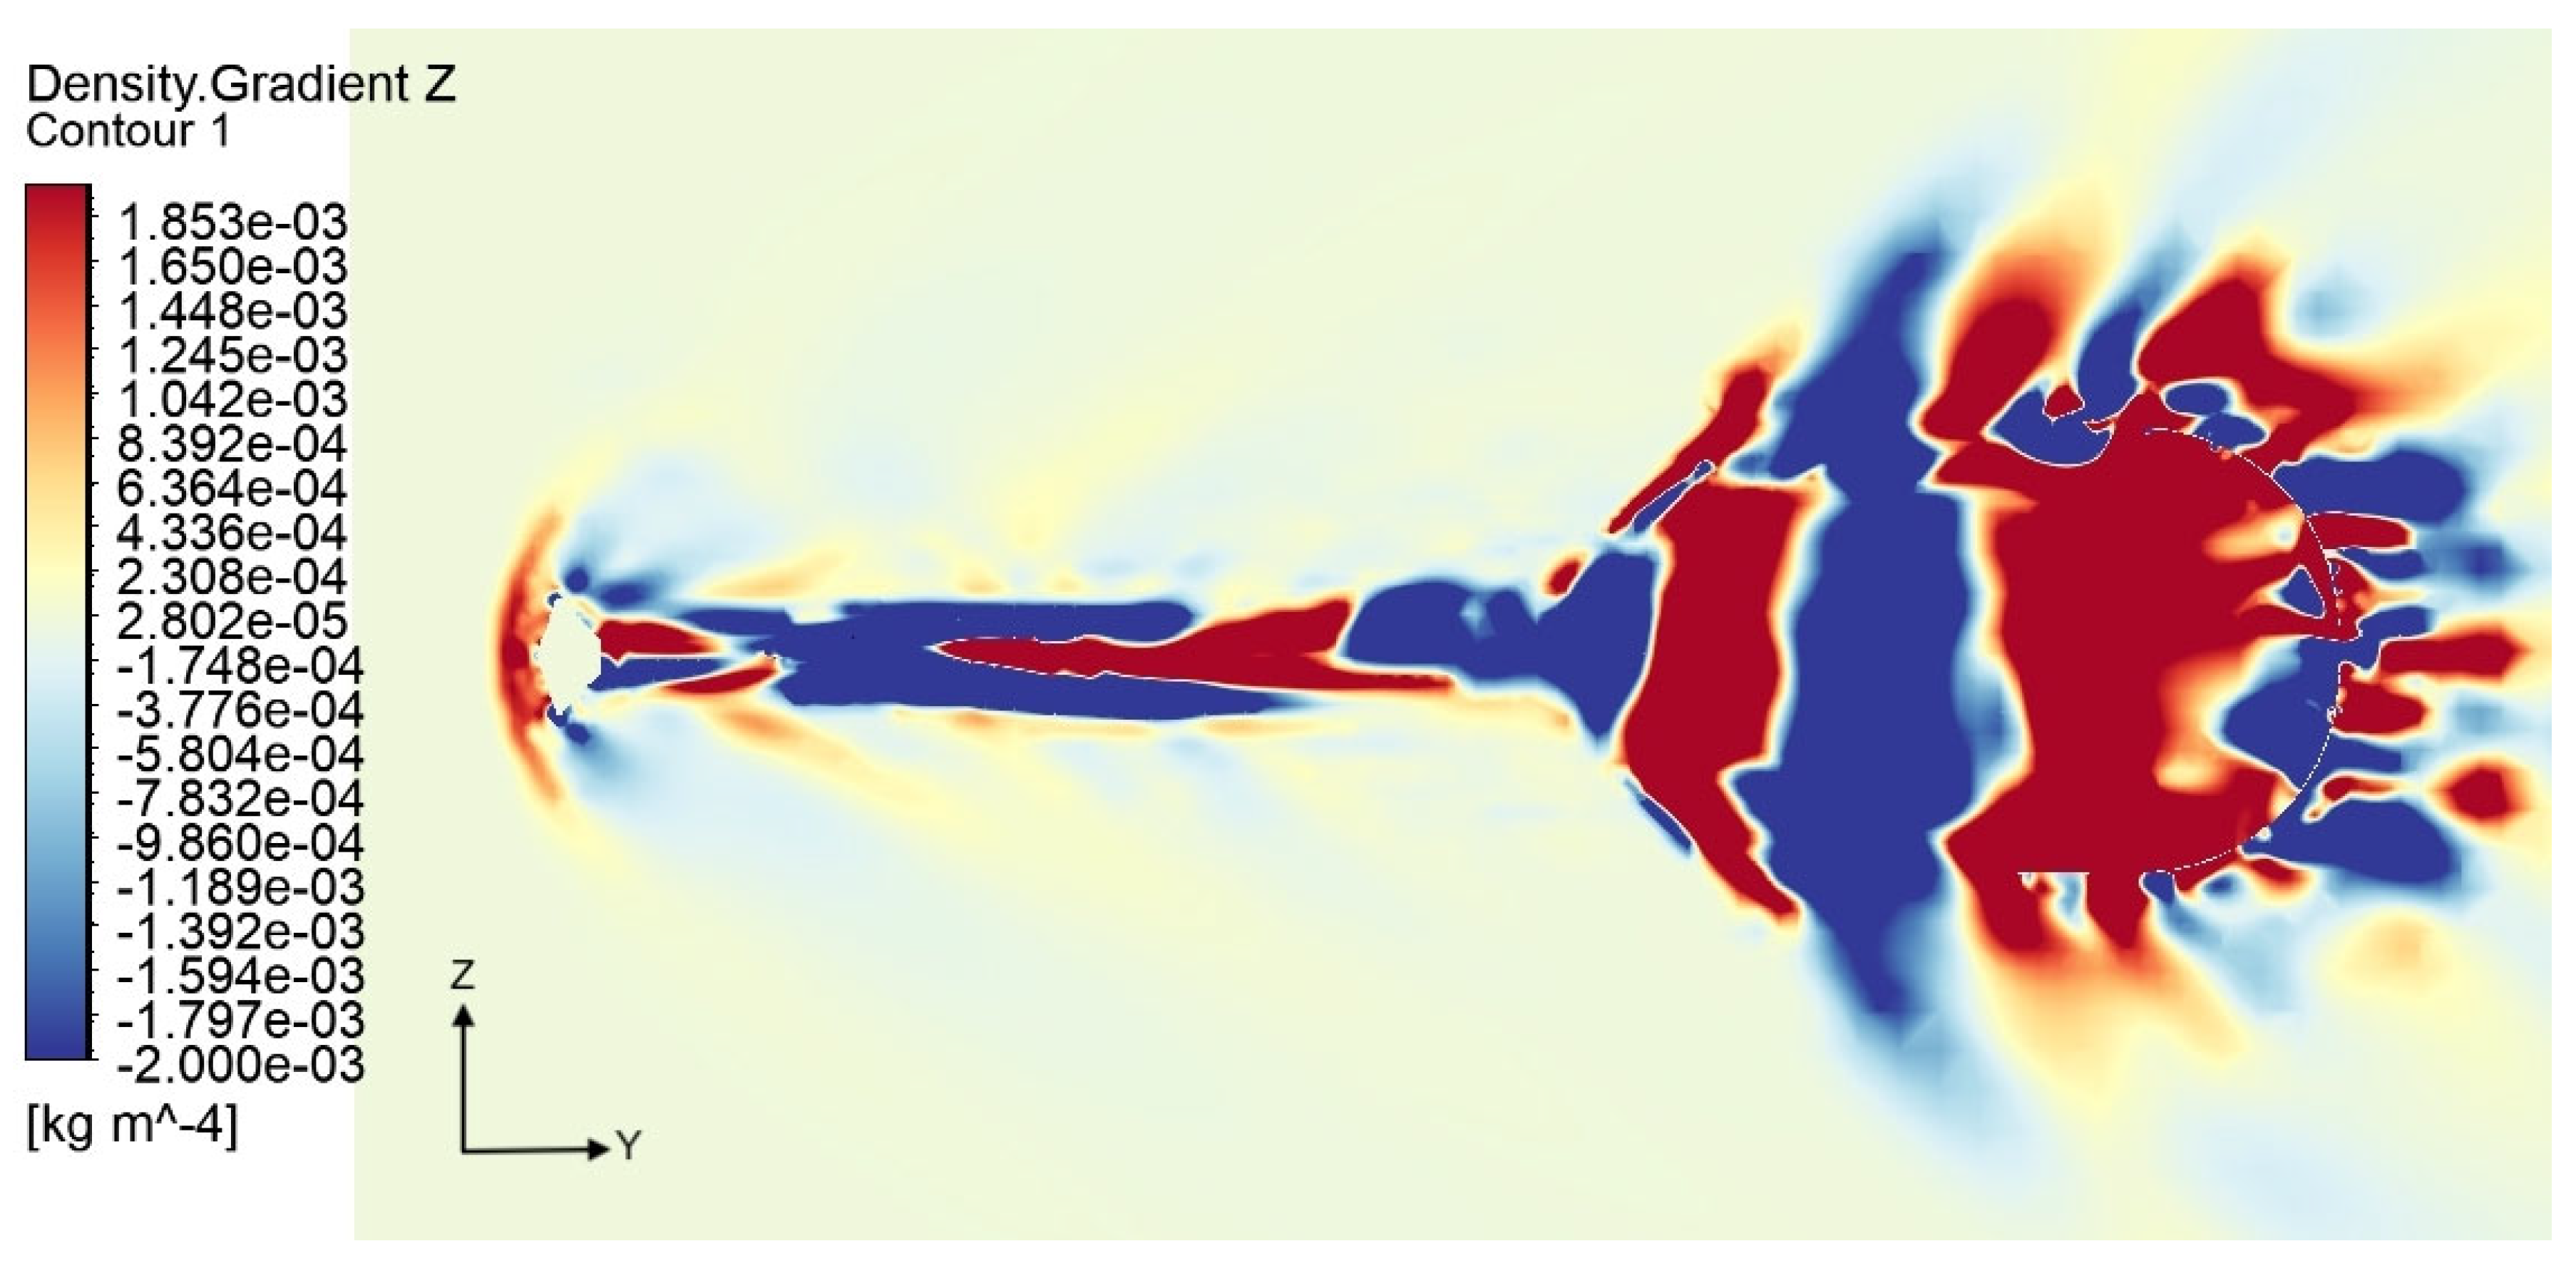
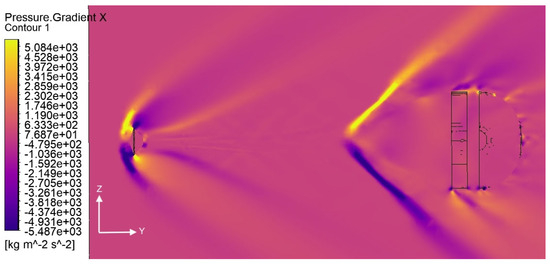
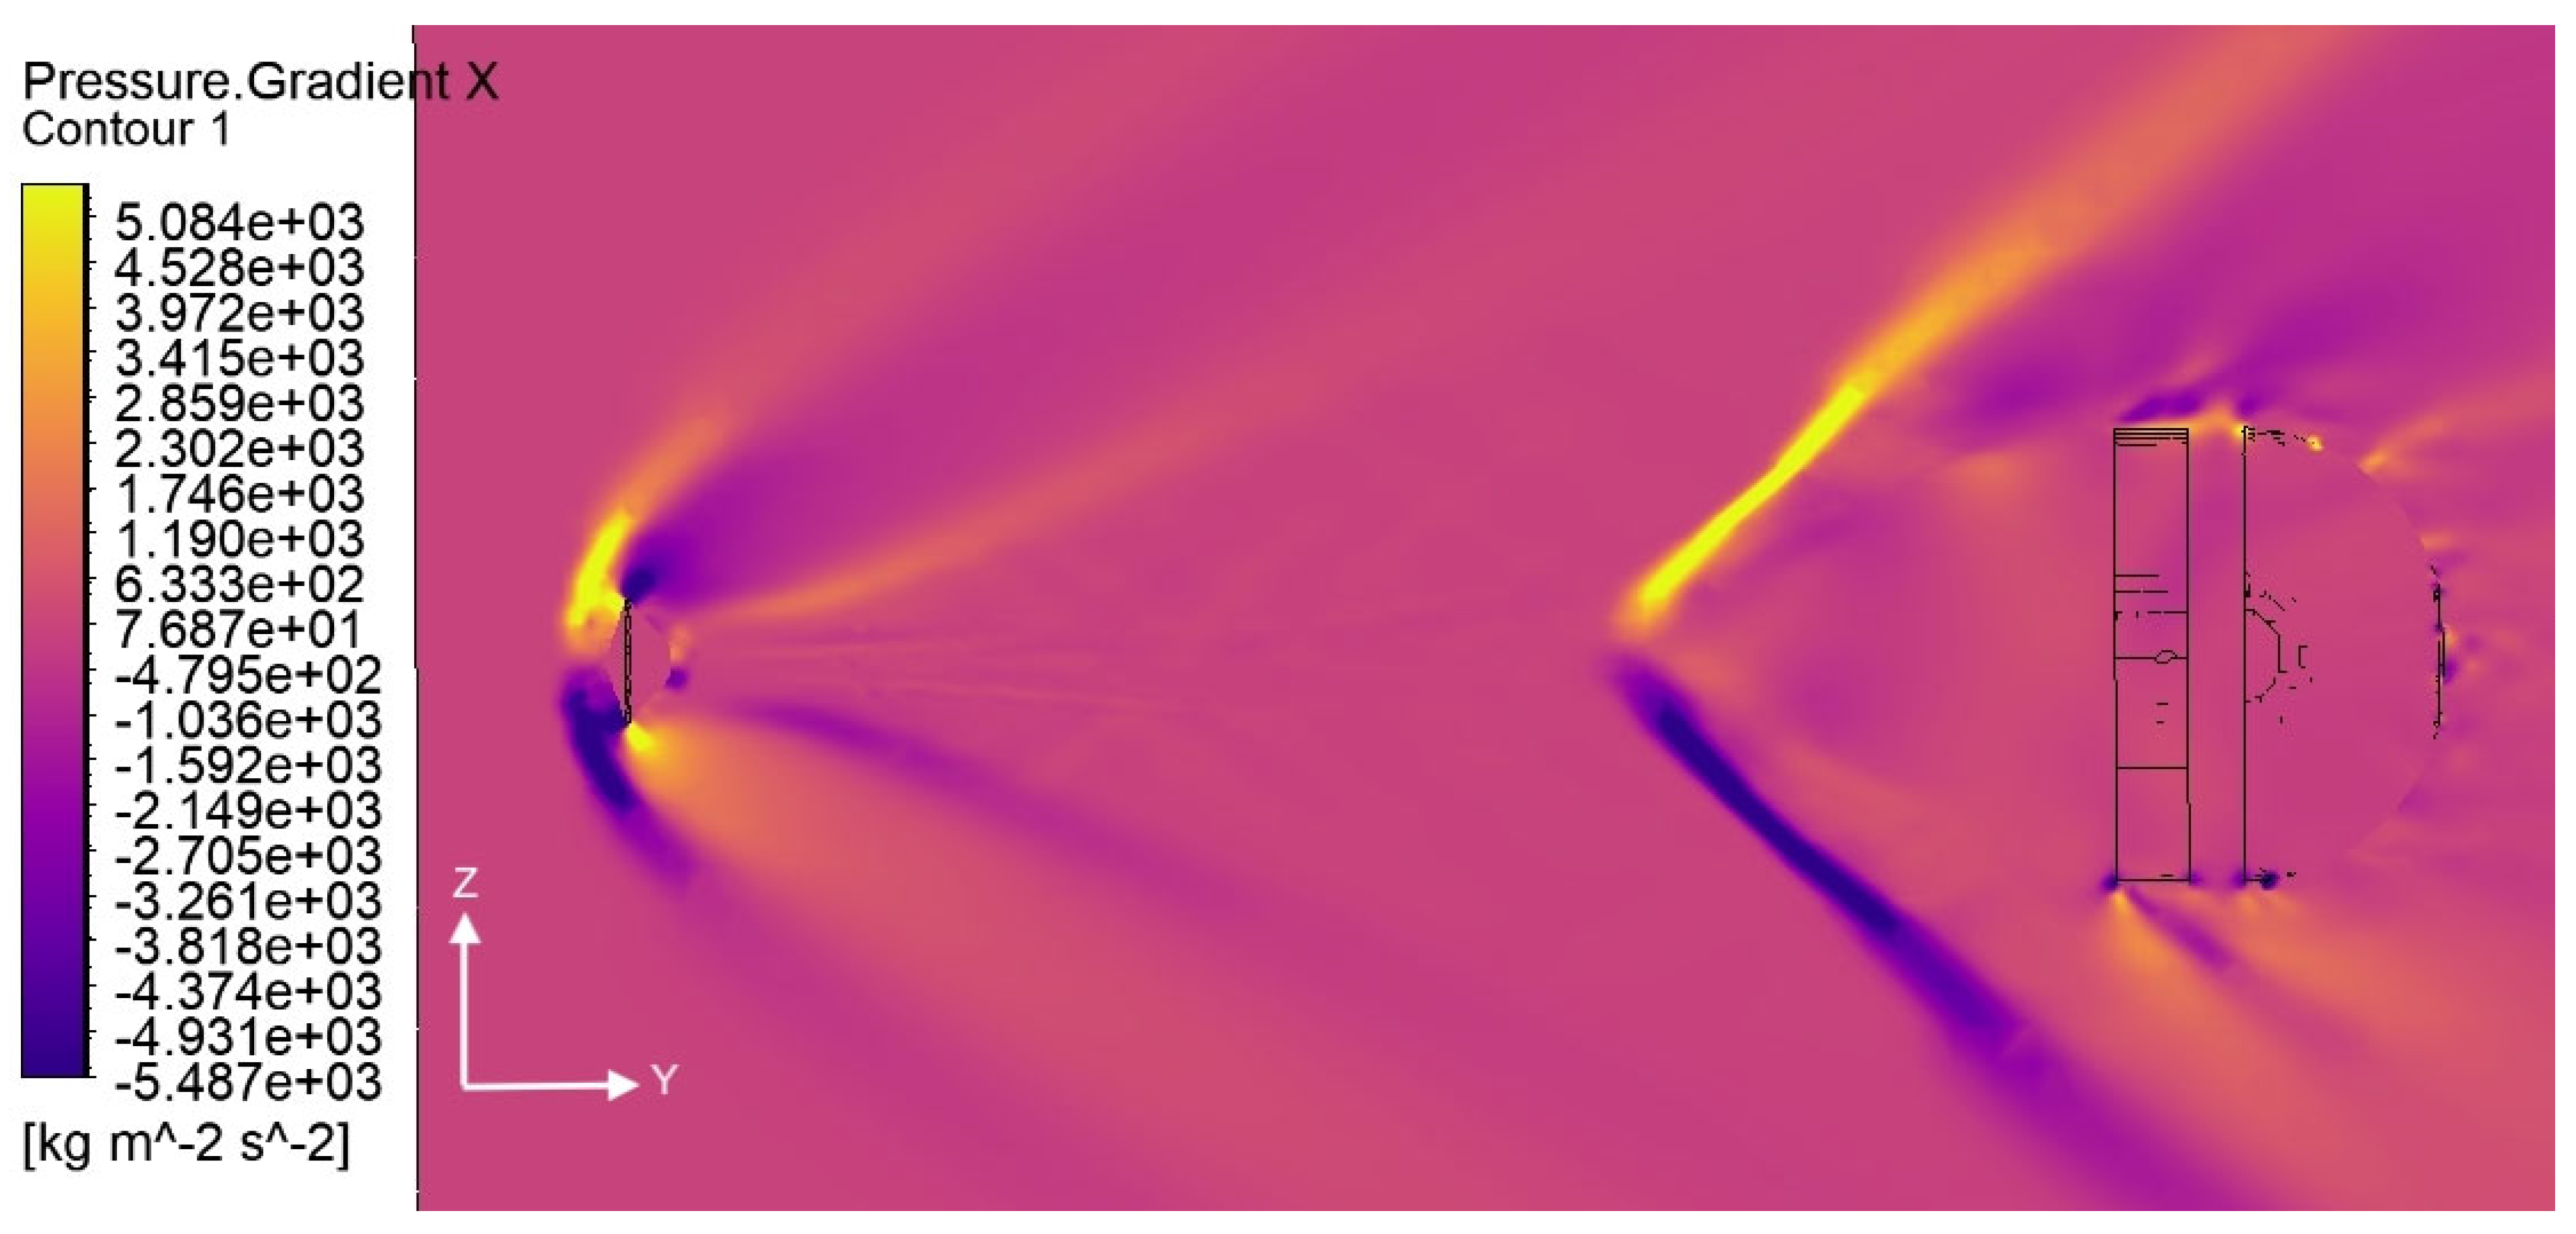
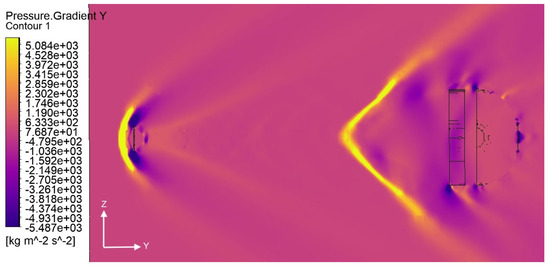
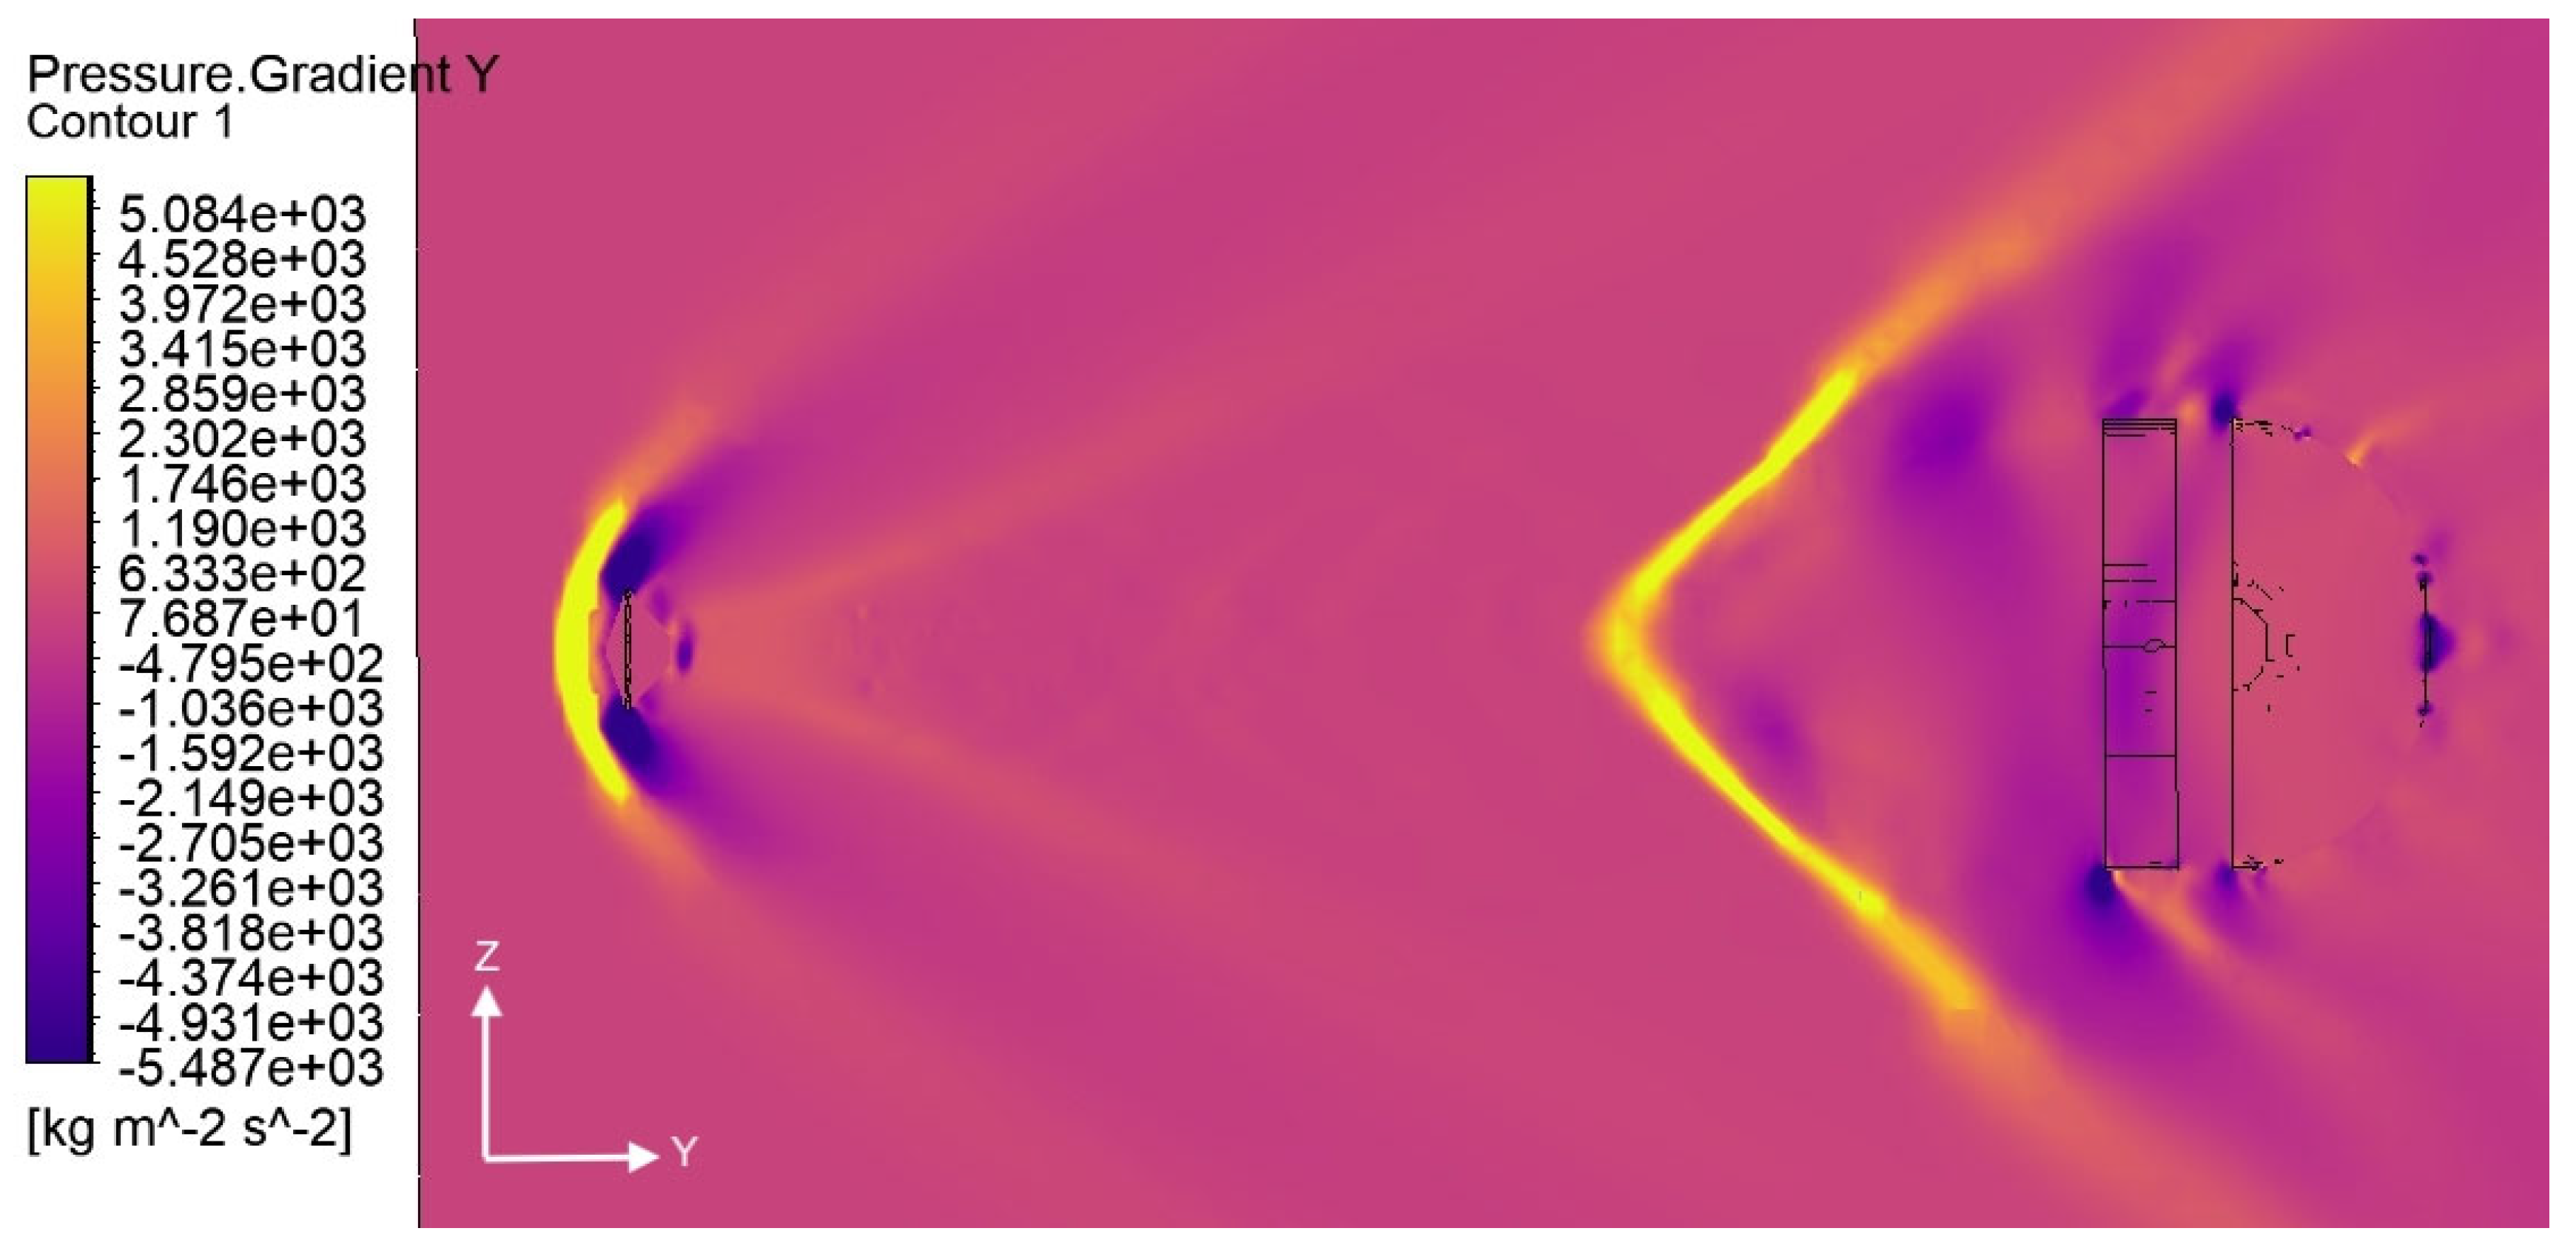
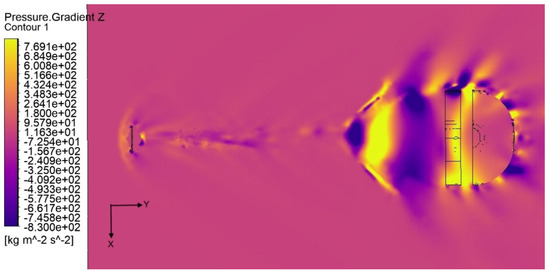
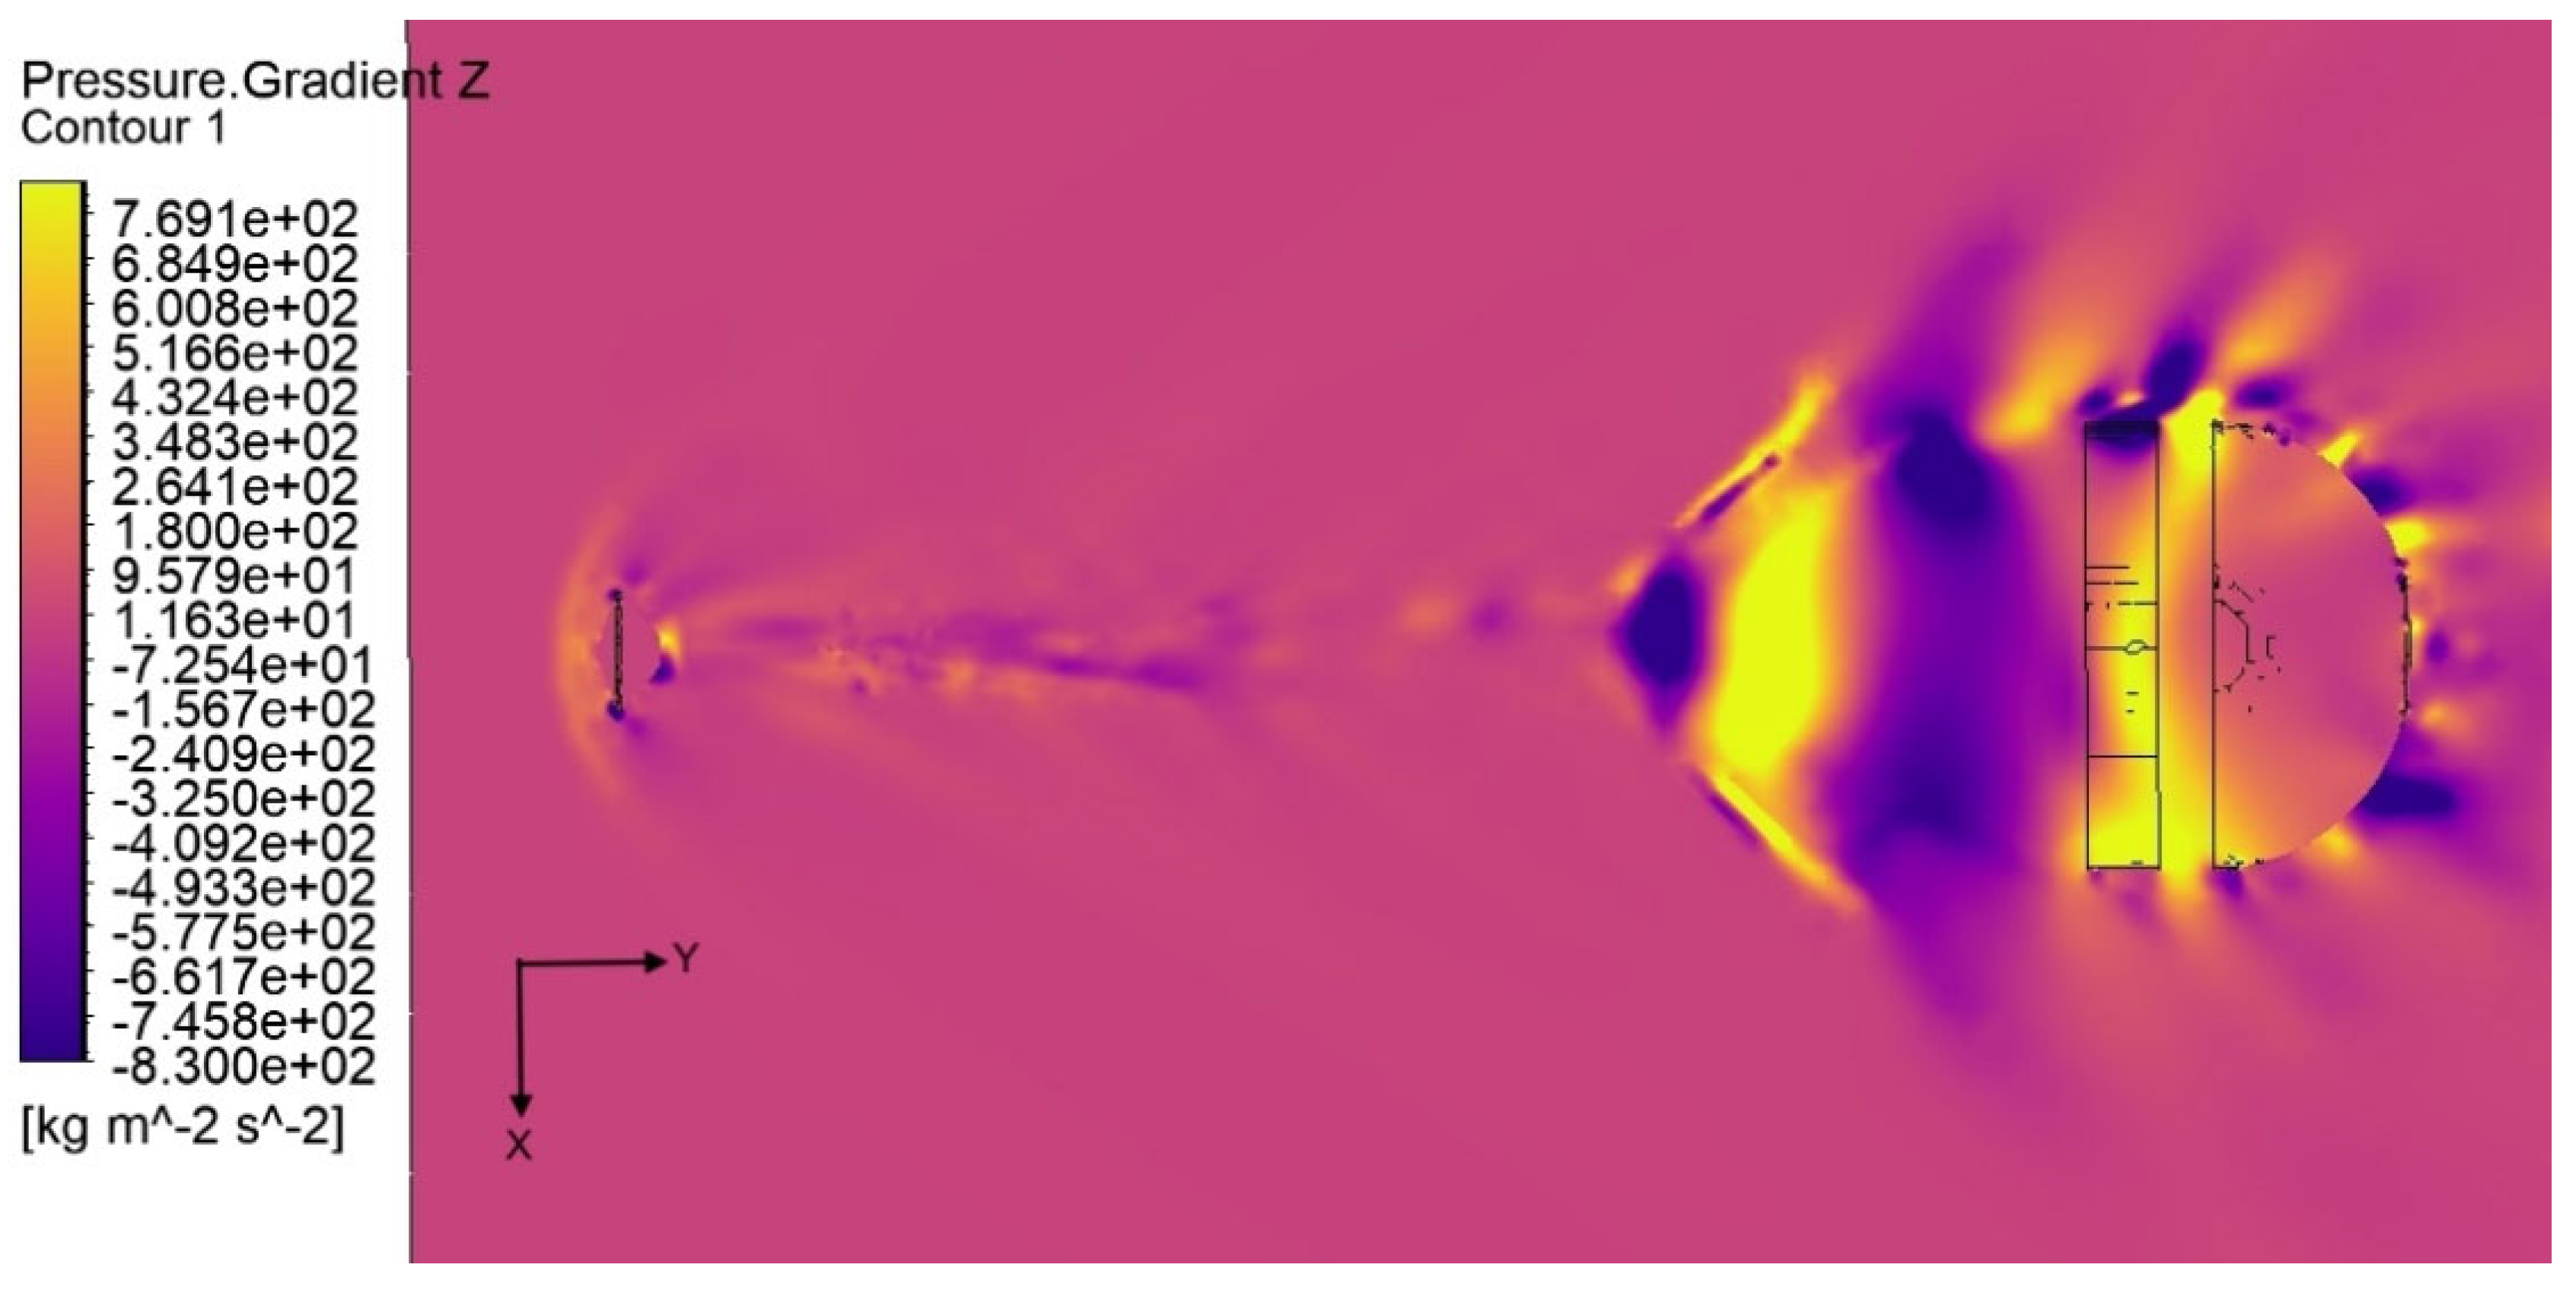
The non-dimensional equation of vorticity (Equation (14)) shows that if the vorticity is zero, it remains nil unless there are strong density and pressure gradients (See Figure 13, Figure 14, Figure 15, Figure 16, Figure 17 and Figure 18), which cause the baroclinic term (proportional to M2) to inject eddies into the flow.
Figure 13.
Instantaneous x-density gradient contour.
Figure 14.
Instantaneous y-density gradient contour.
Figure 15.
Instantaneous z-density gradient contour.
Figure 16.
Instantaneous x-pressure gradient contour.
Figure 17.
Instantaneous y-pressure gradient contour.
Figure 18.
Instantaneous z-pressure gradient contour.
Once these vortex structures are created, they are transported downstream and they are amplified through the bow shock upstream of the canopy, due to the compressibility term, i.e., .
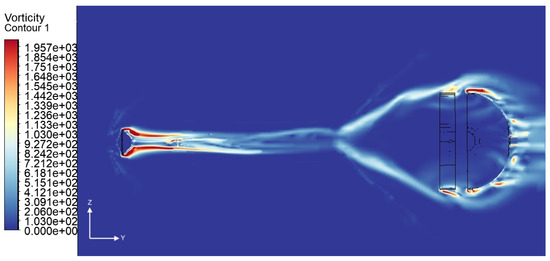
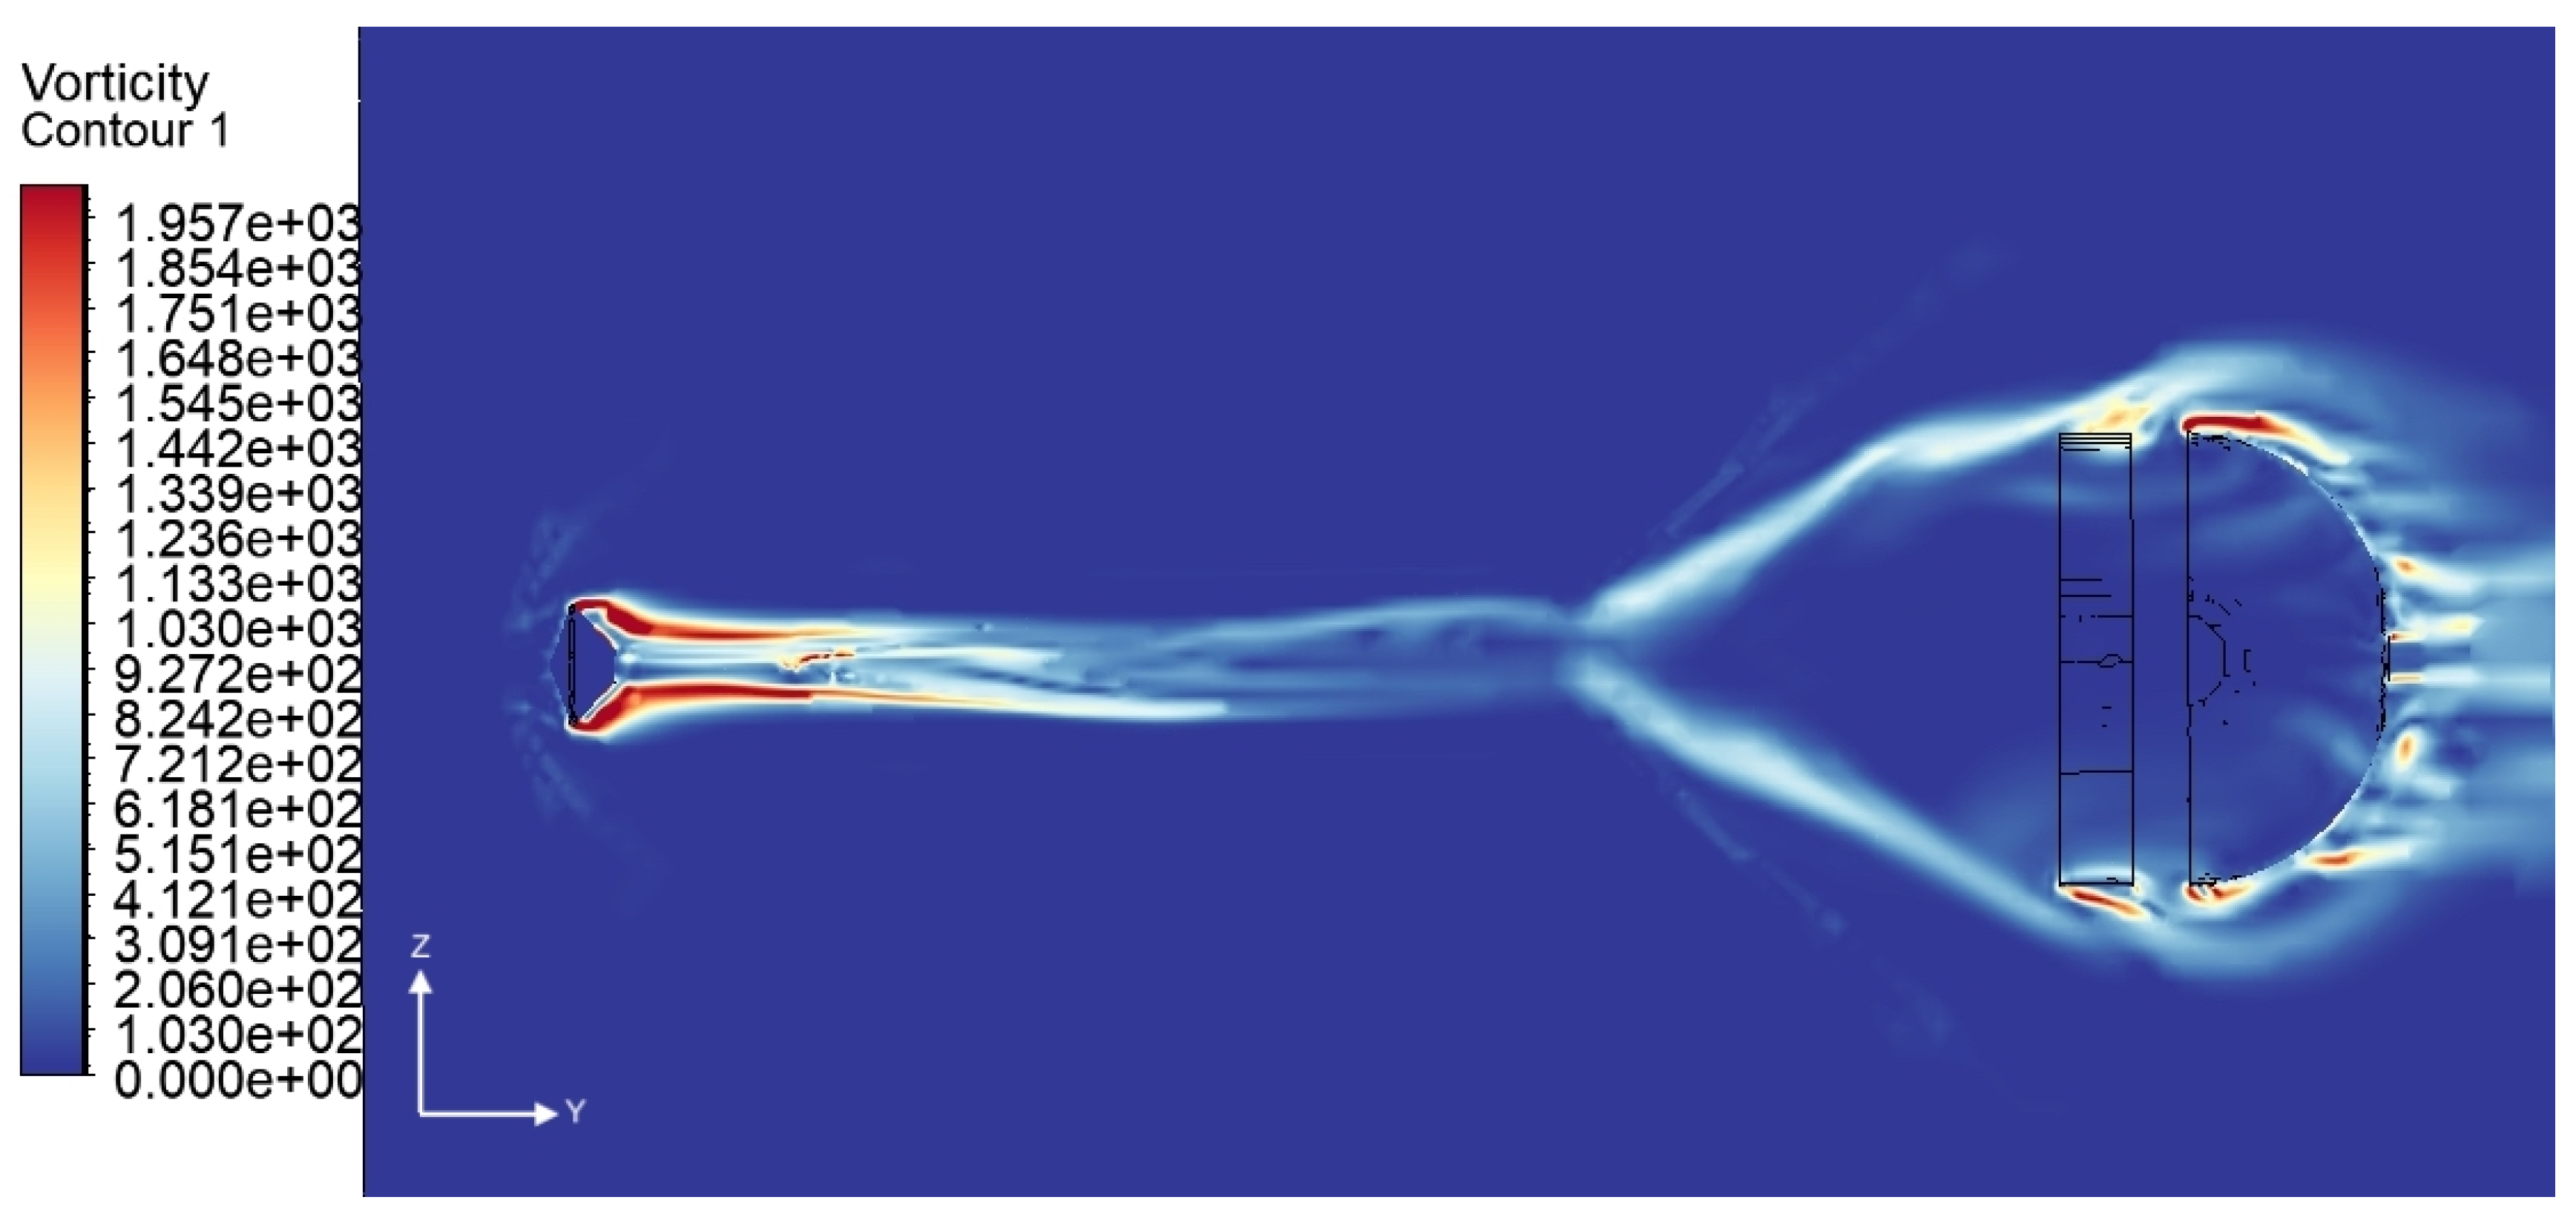
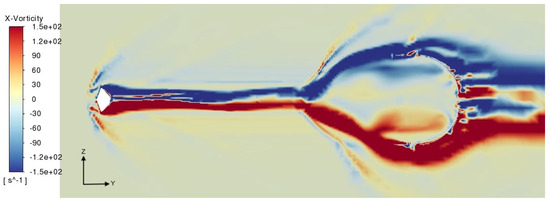
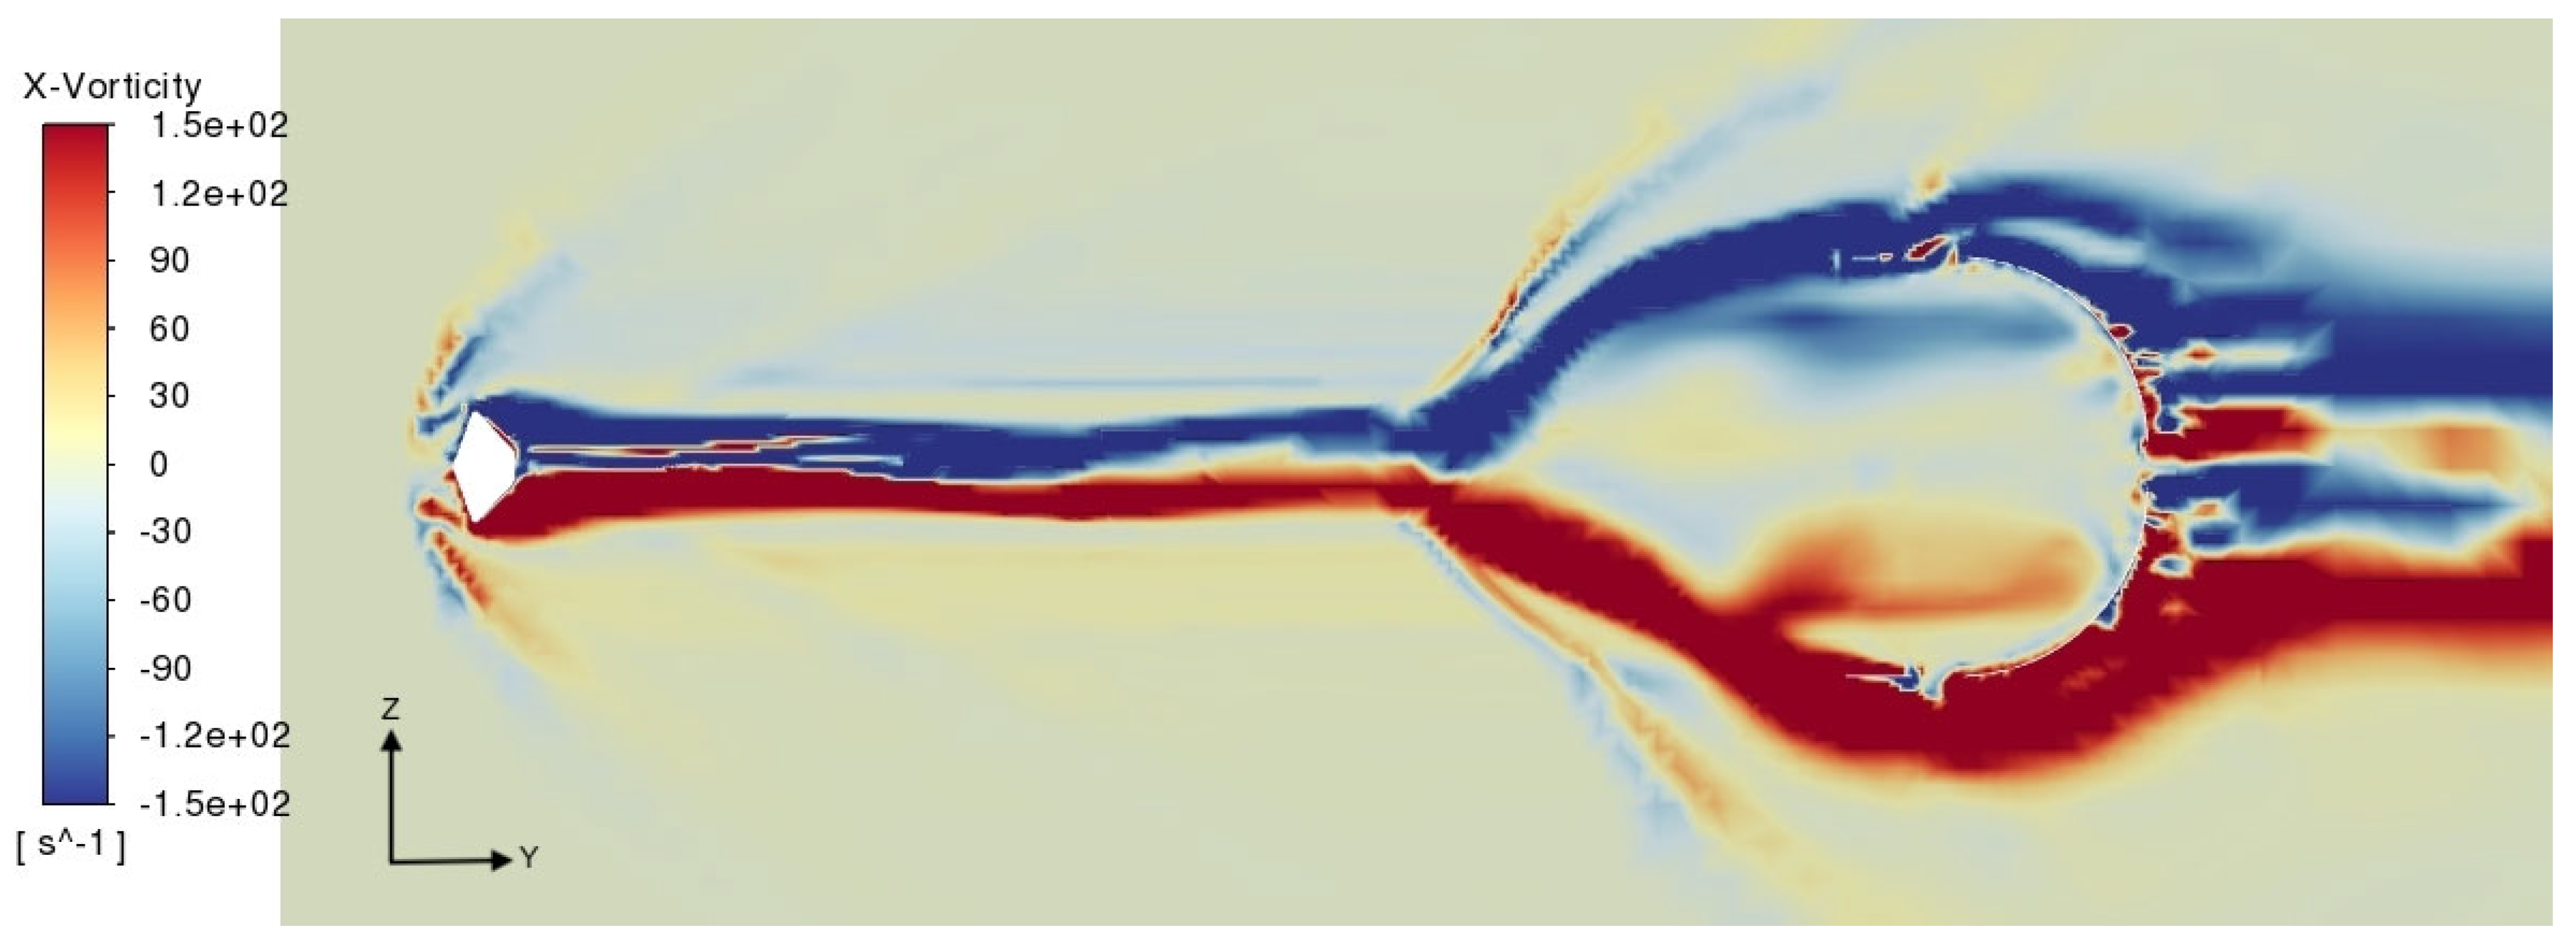
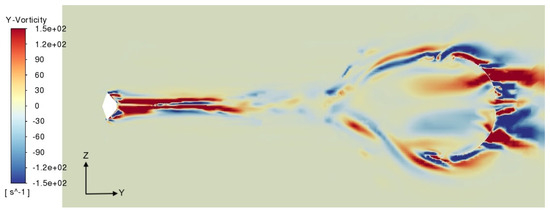
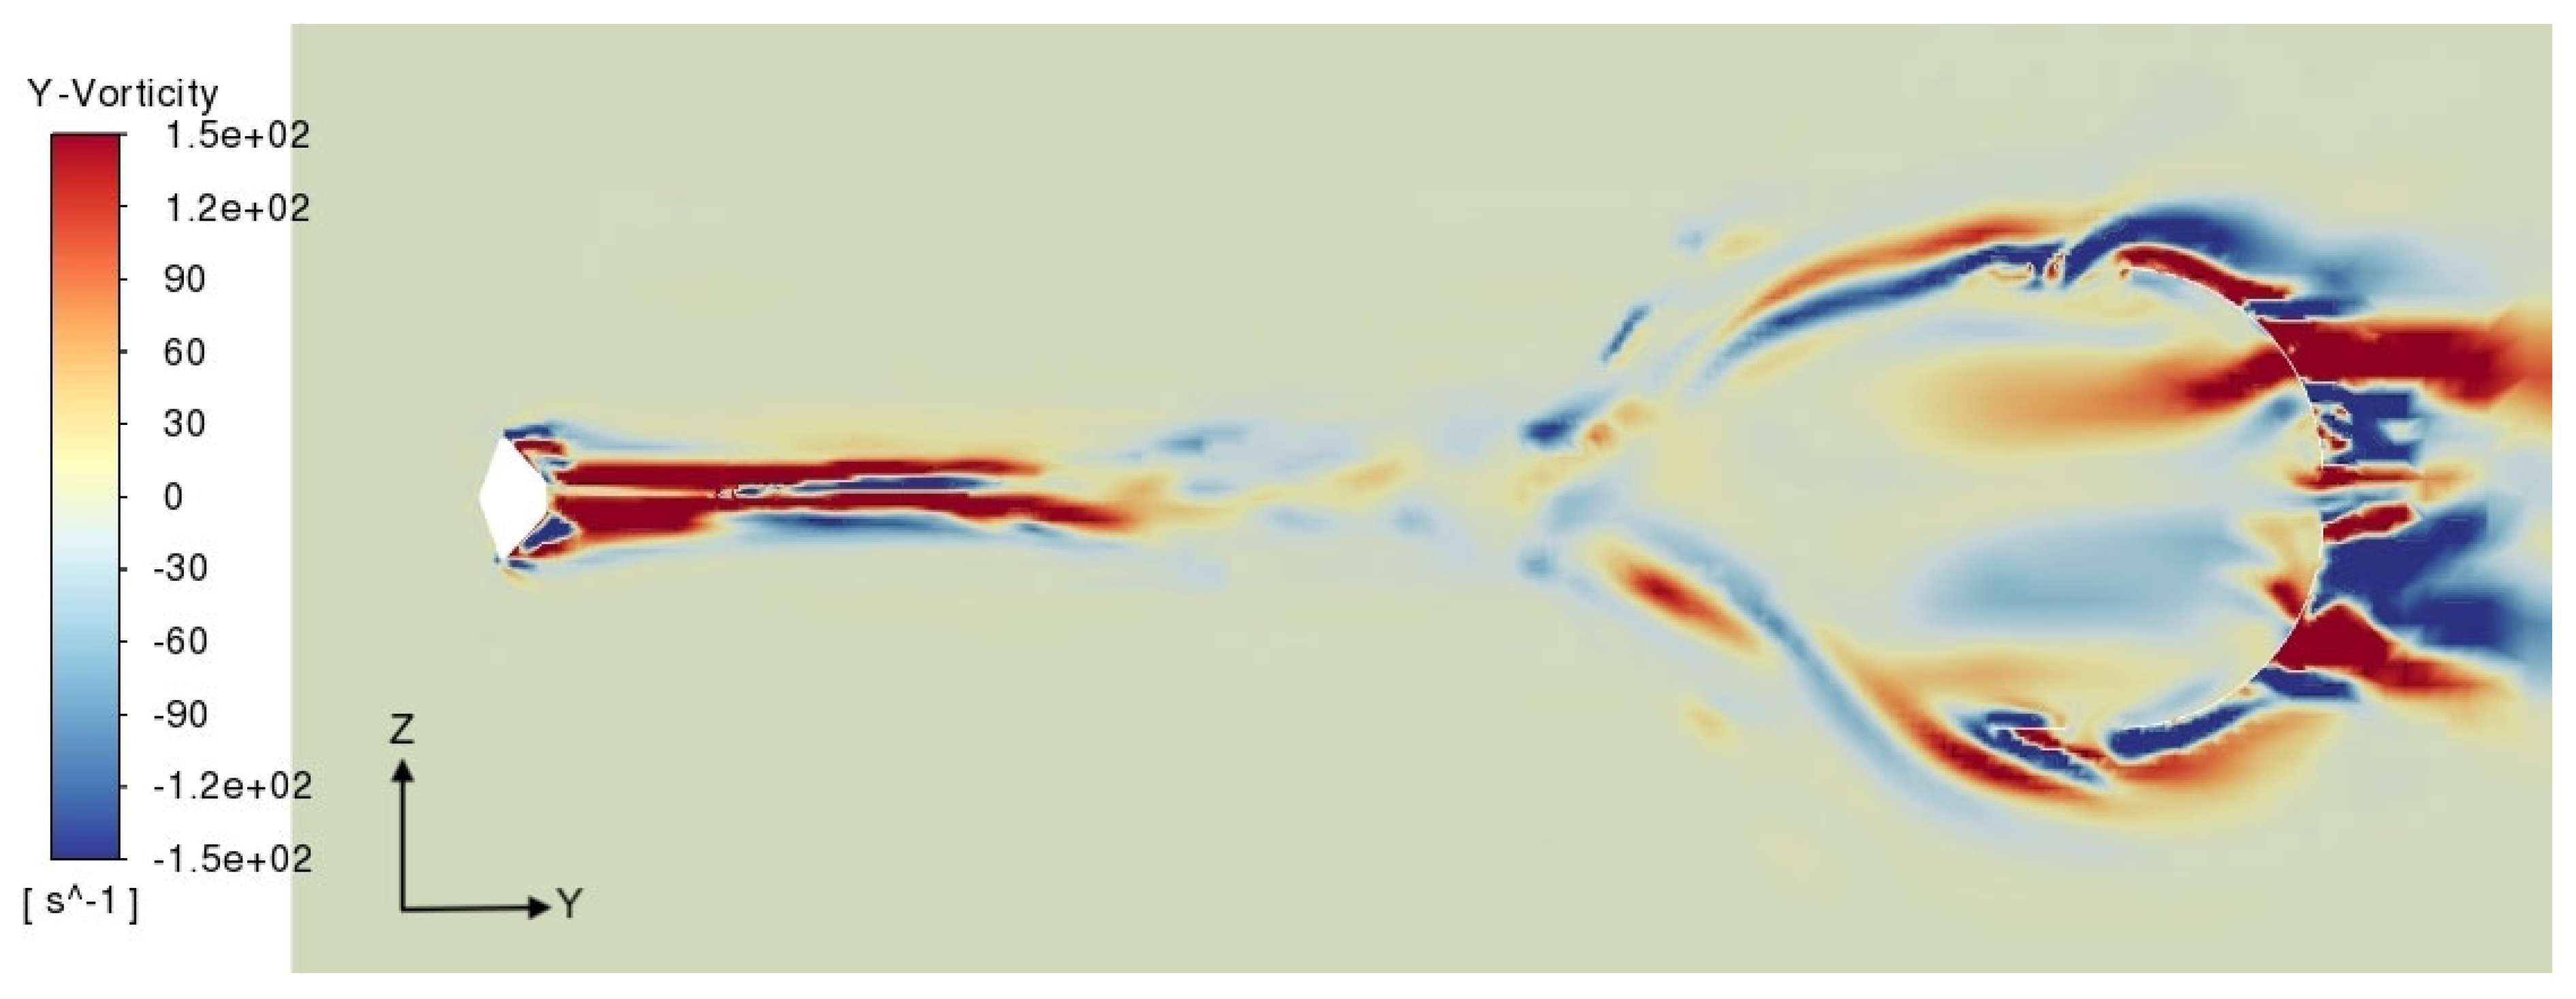
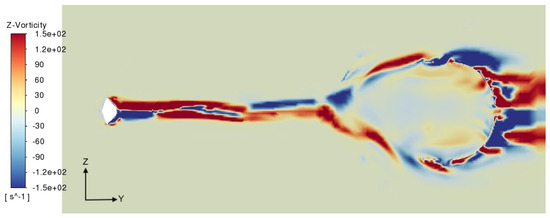
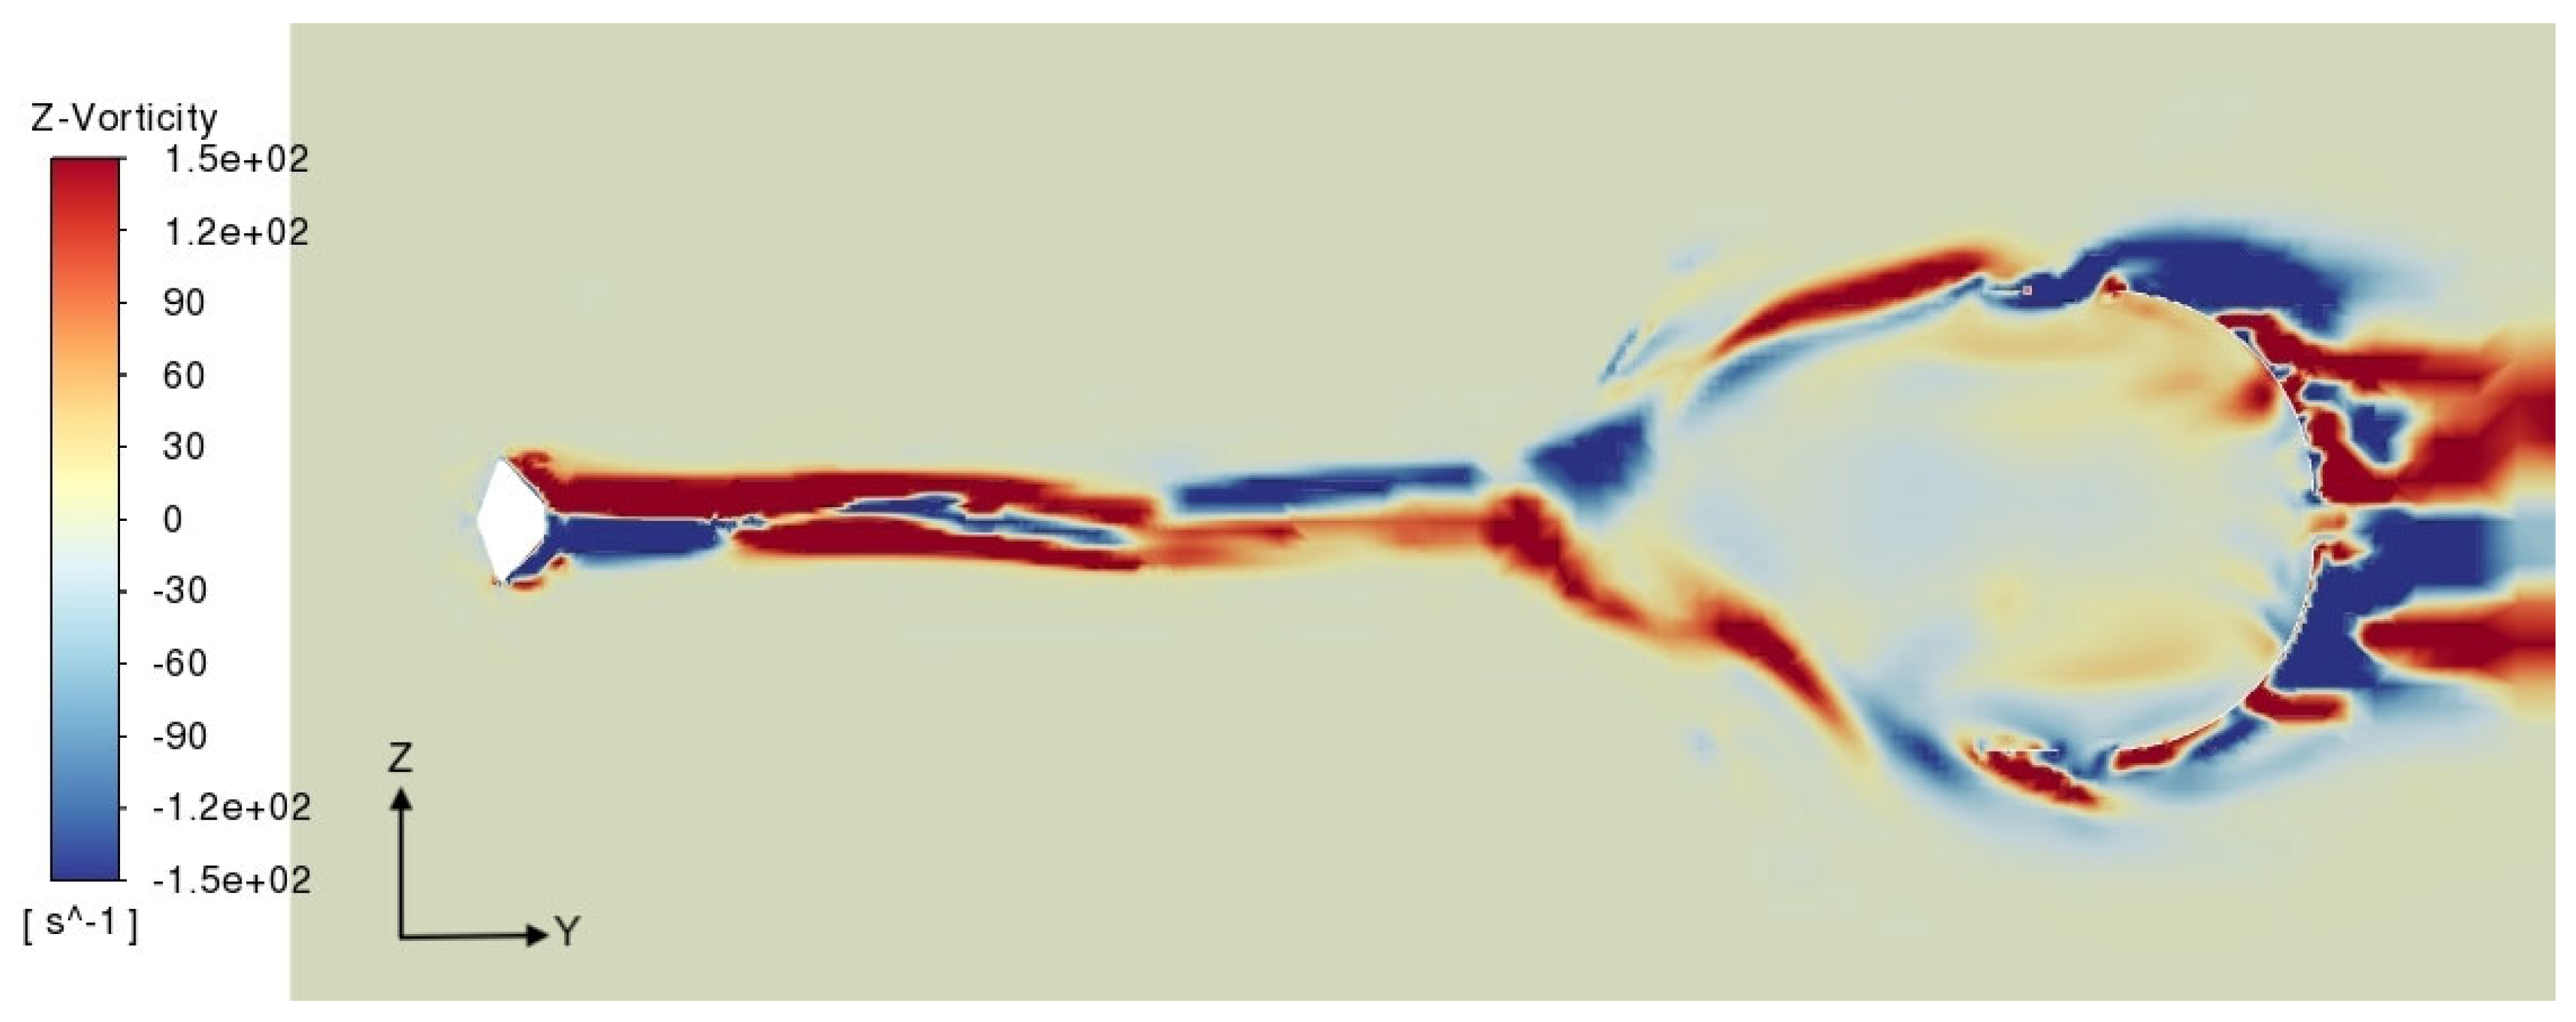
Figure 19, Figure 20, Figure 21 and Figure 22 show the vorticity and the x, y, z vorticity components contours, respectively.
Figure 19.
Instantaneous contours of vorticity.
Figure 20.
Instantaneous contours of x-vorticity.
Figure 21.
Instantaneous contours of y-vorticity.
Figure 22.
Instantaneous contours of z-vorticity.
Figure 19, Figure 20, Figure 21 and Figure 22 show that the flow field is completely laminar at the inlet of the computational domain, i.e., the vorticity is nil. Downstream of the bow shock, it suddenly rises to 1500 Hz. The x-vorticity field shows that two counter-rotating structures generate just upstream of the capsule and are transported downstream for about three capsule radii. The spanwise x and z components of the vorticity are the highest, respectively 640 Hz and 1800 Hz. The streamline component is negligible with respect to the others, being 40 Hz. Figure 13, Figure 14, Figure 15, Figure 16, Figure 17 and Figure 18 show that the strong interaction of the flow field with the bow shock is responsible for the pressure and density gradients, which in turn are responsible for the vorticity generation by means of the baroclinic term [27]. Peaks of x-density gradients are of order of 3 × 10⁻² kg/m3/m in the x direction, 1.7 × 10⁻¹ kg/m3/m in the y direction and 2 × 10⁻² kg/m3/m in the z direction. The density gradients are axisymmetric in the x and y direction, and not in the z direction, where these are higher on the leeside and lower on the wind side.
As for the pressure gradients, the peaks are of order of 9800 Pa/m in the X-direction, 23,000 Pa/m in the Y direction and 2000 Pa/m in the Z direction.
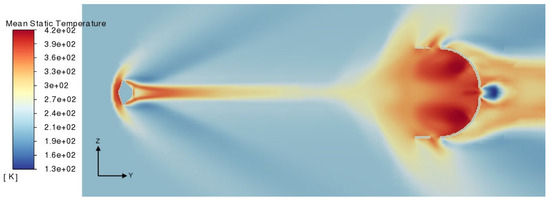
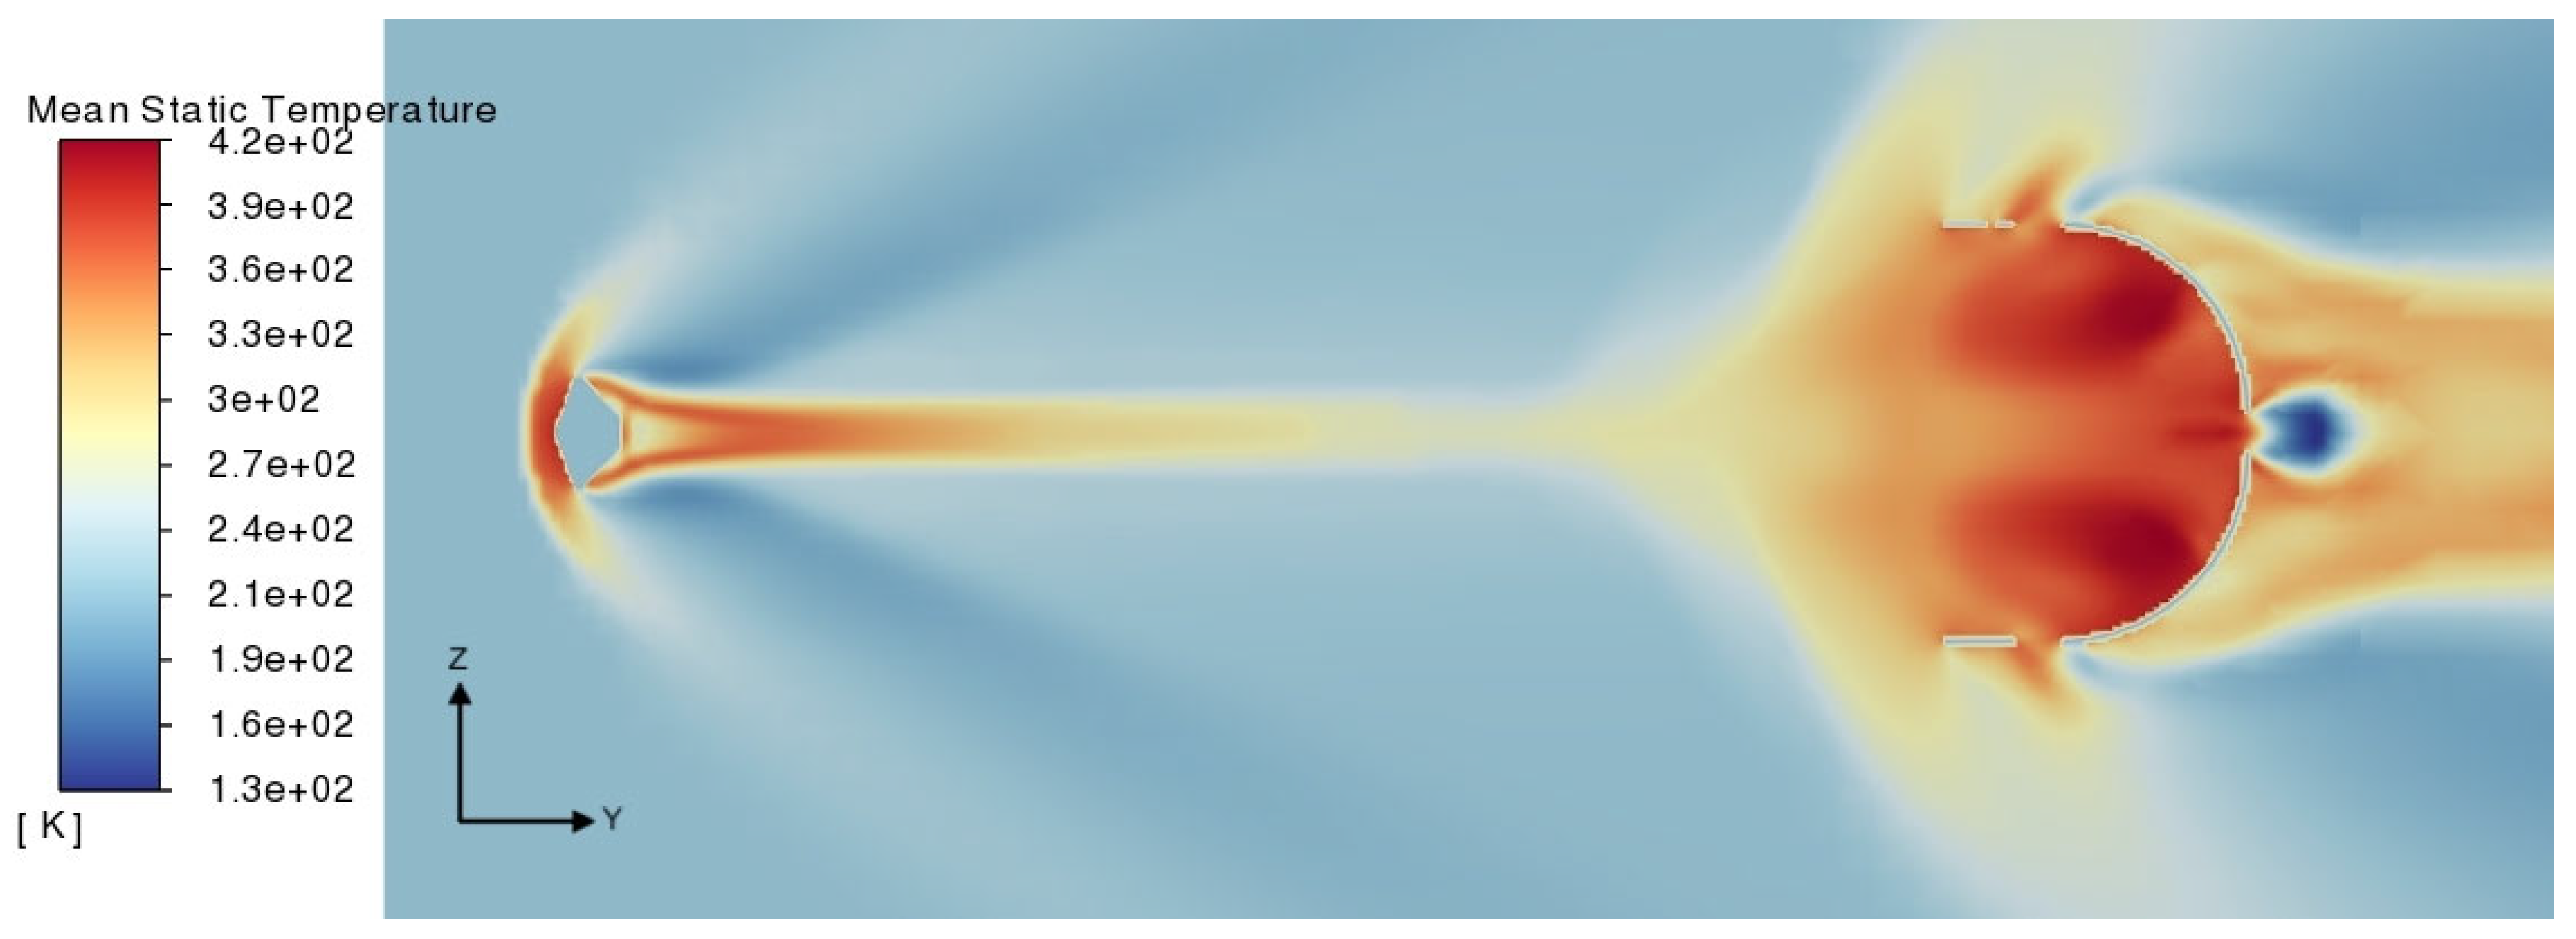
Figure 23 shows the mean static temperature contour. Due to the sudden decrease in Mach number and rise in the pressure around the vehicle body, a sudden rise in the temperature from 219 K to an approximate value of 382 K can be observed in front of the capsule. The temperature of the flow drops to an average approximate value of 222 K in the wake region, and it again raises at a distance of 0.7 m in front of the parachute, reaching the maximum value of 404 K inside the canopy region.
Figure 23.
Mean static temperature contour.
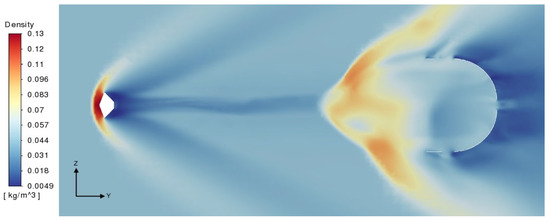
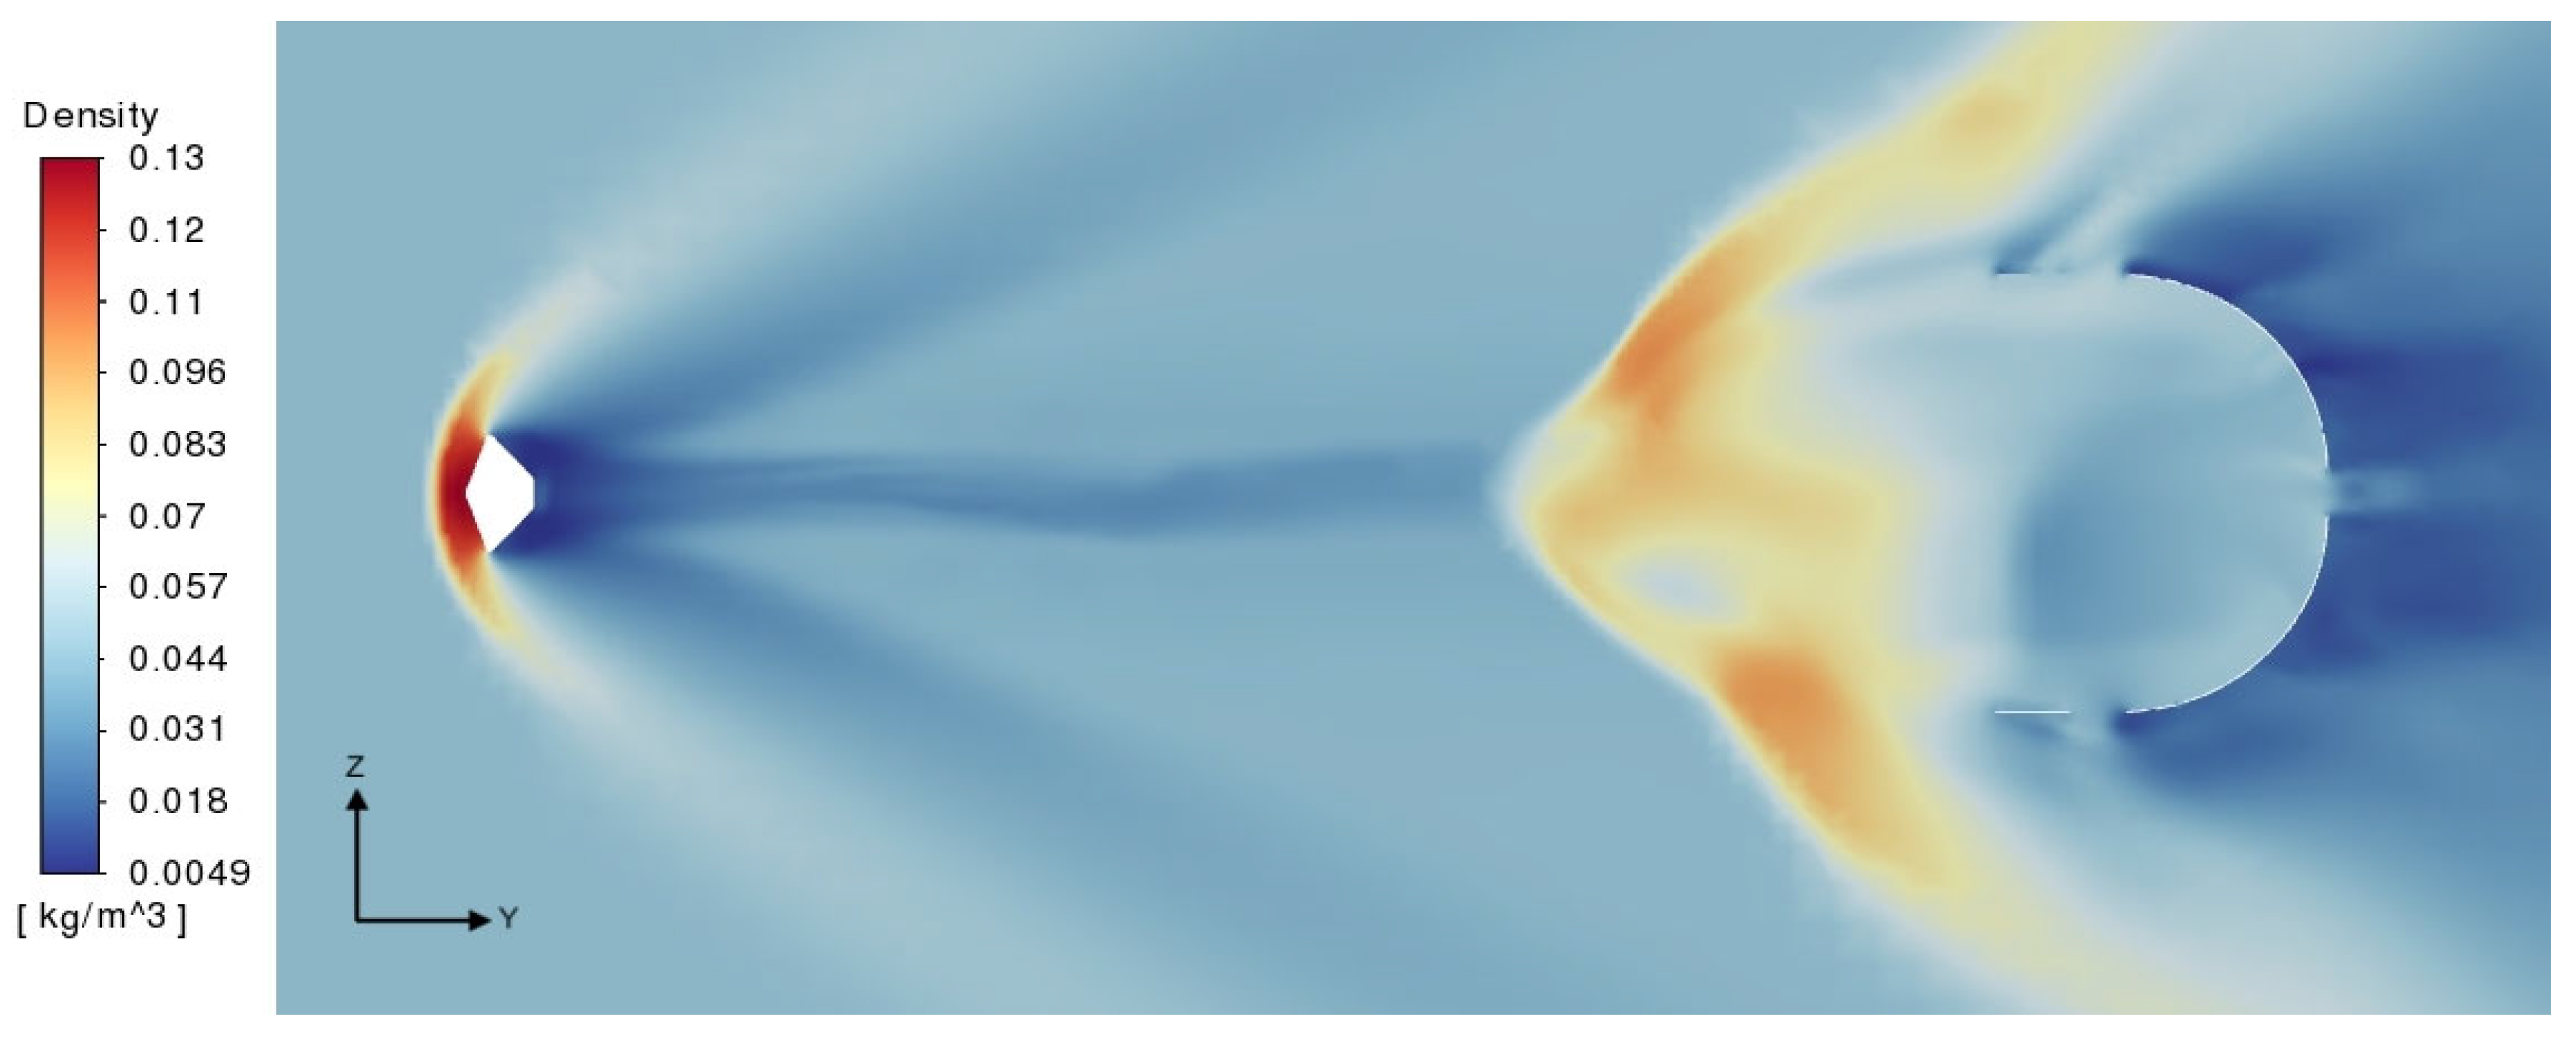
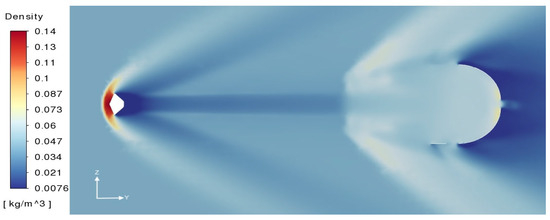
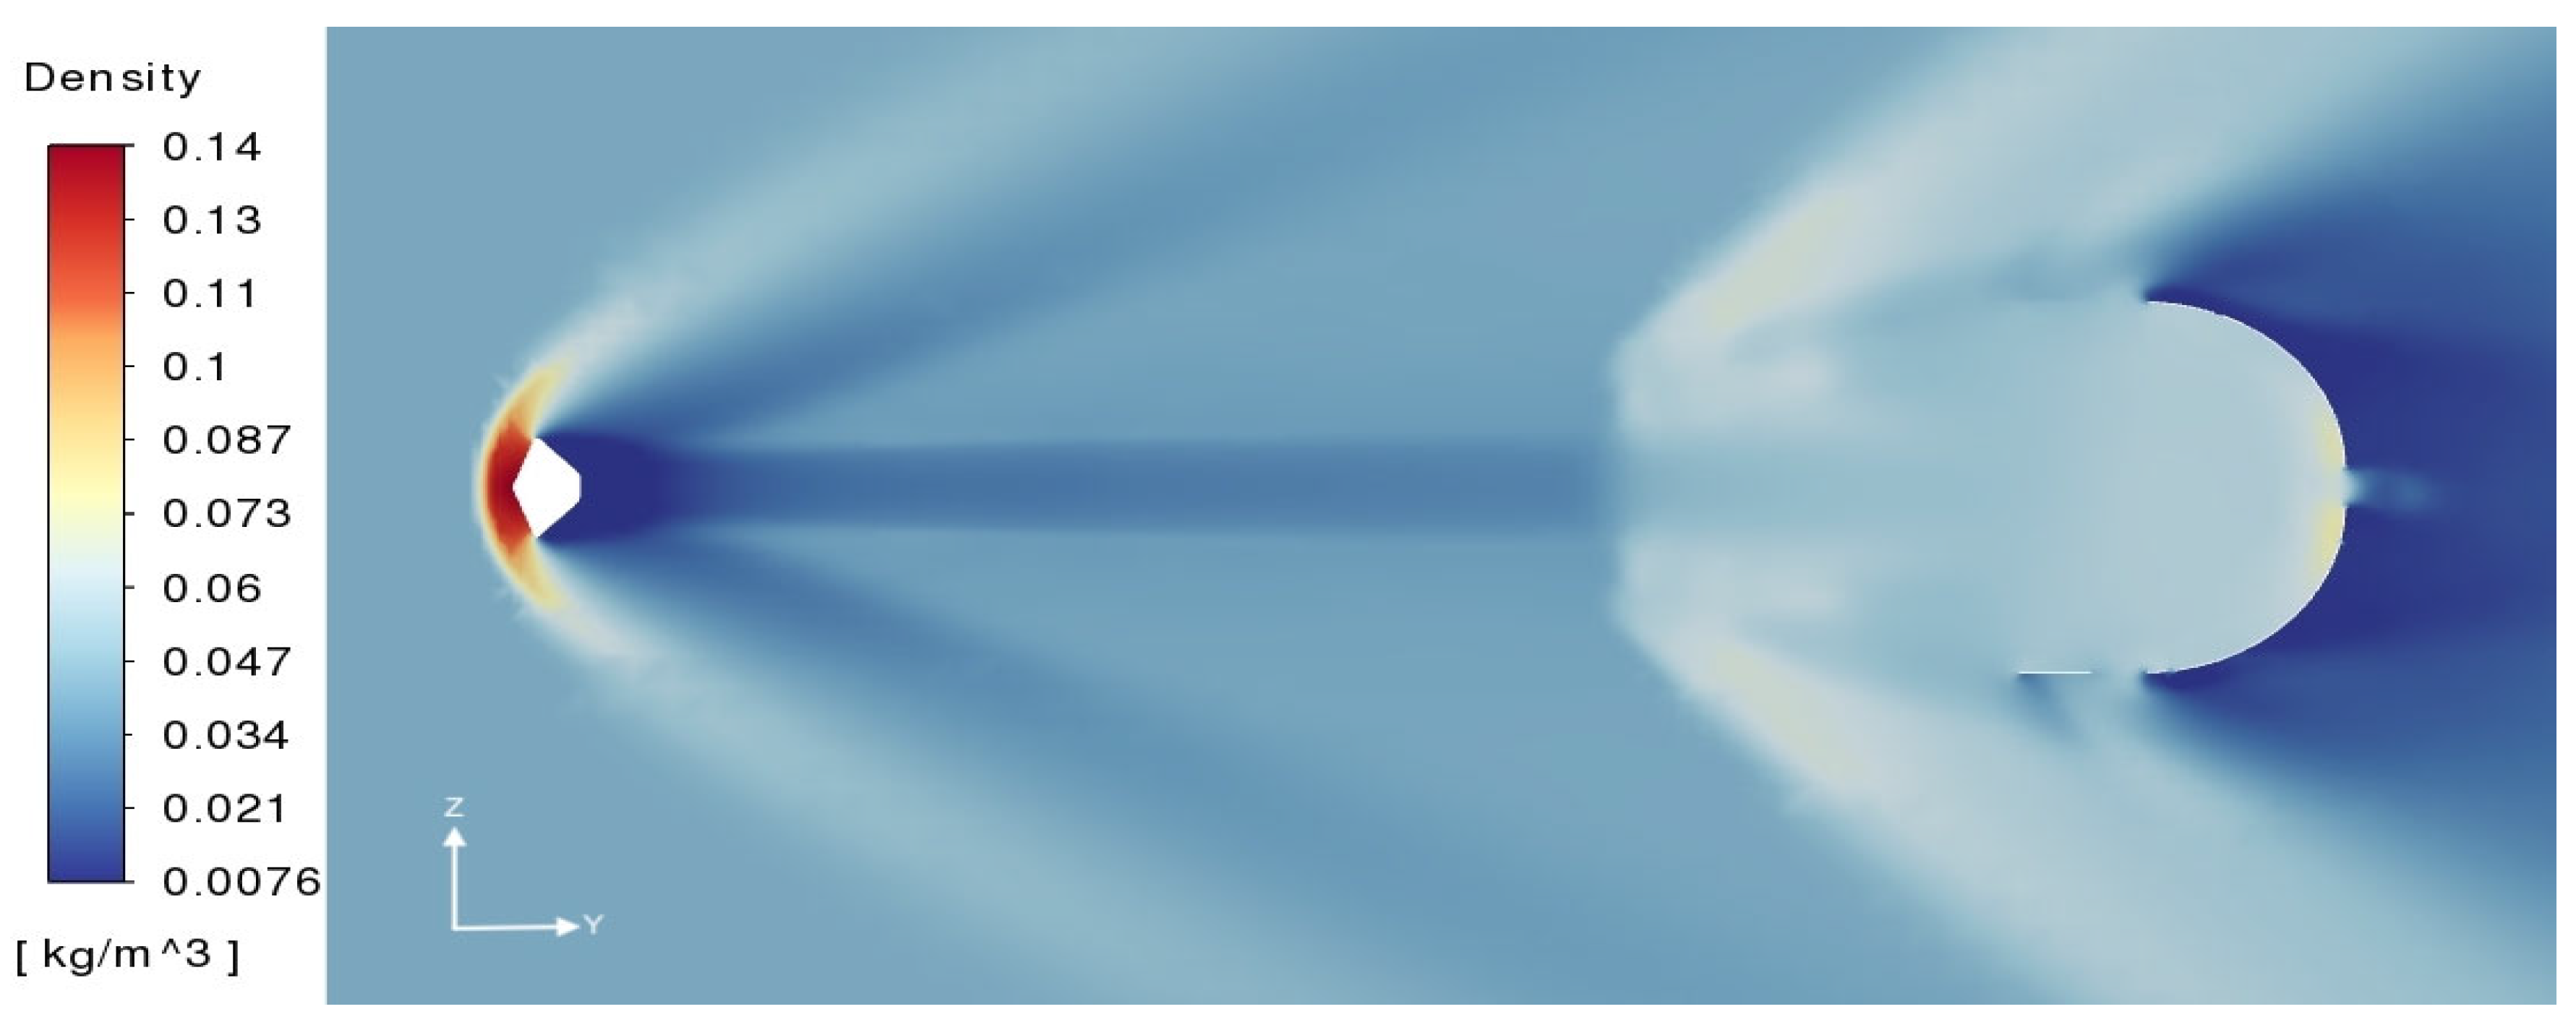
Figure 24 and Figure 25 show that density reaches the maximum at the nose of the vehicle, with a mean value of 0.1304 kg/m3 and an instantaneous value of 0.1342 kg/m3, which immediately drops at the leeside of the afterbody. In the wake region, the instantaneous density flow field has a non-axisymmetric behavior, while it is axisymmetric in the mean field. In the wake, the density keeps low for several body diameters, and it rises when approaching the parachute. The instantaneous density contour shows that the density gradually decreases inside the canopy increasing the drag area behind the canopy and accordingly the turbulence.
Figure 24.
Instantaneous density contours.
Figure 25.
Mean density contours.
Investigation of the Oscillation Amplitude Divergence of the Capsule–Parachute System
The critical point to avoid mission failure is to propose new approaches to dampen the instabilities related to the turbulence generated downstream of the capsule and amplified through the bow shock upstream of the coma, as already explained in Section 2.1, because of the contribution of compressibility within the vorticity equation. This unsteady flow exerts fluctuating forces which may cause structural damage to the body due to induced vibrations. The control of flow-inducted vibrations is achievable through the control of vortex shedding, which leads to the reduction in unsteady forces acting on the body, thus significantly reducing unwanted vibrations. Recalling the Strouhal number, defined as St = fD/U∞, where D is the characteristic length, i.e., the capsule diameter, U∞ is the flow velocity and f is the frequency of the vortex shedding, it can be asserted that in flows characterized by a periodic motion, as, for example, in vortex shedding, the Strouhal number is associated with the oscillations of the flow due to the inertial forces relative to the local changes in velocity and the inertial forces due to the convective acceleration of the flow field. For large Strouhal numbers of order of unity, oscillations dominate the flow, while at low Strouhal numbers, oscillations are moved away by the high flow velocity.
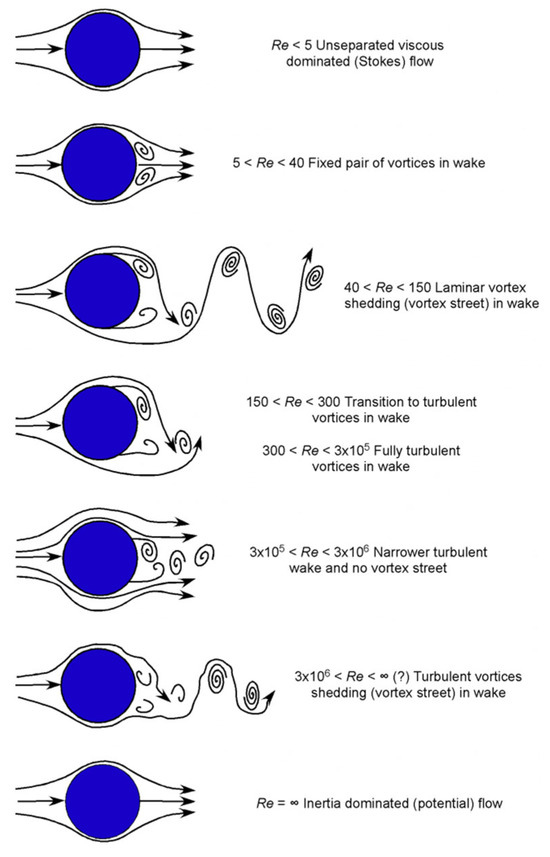
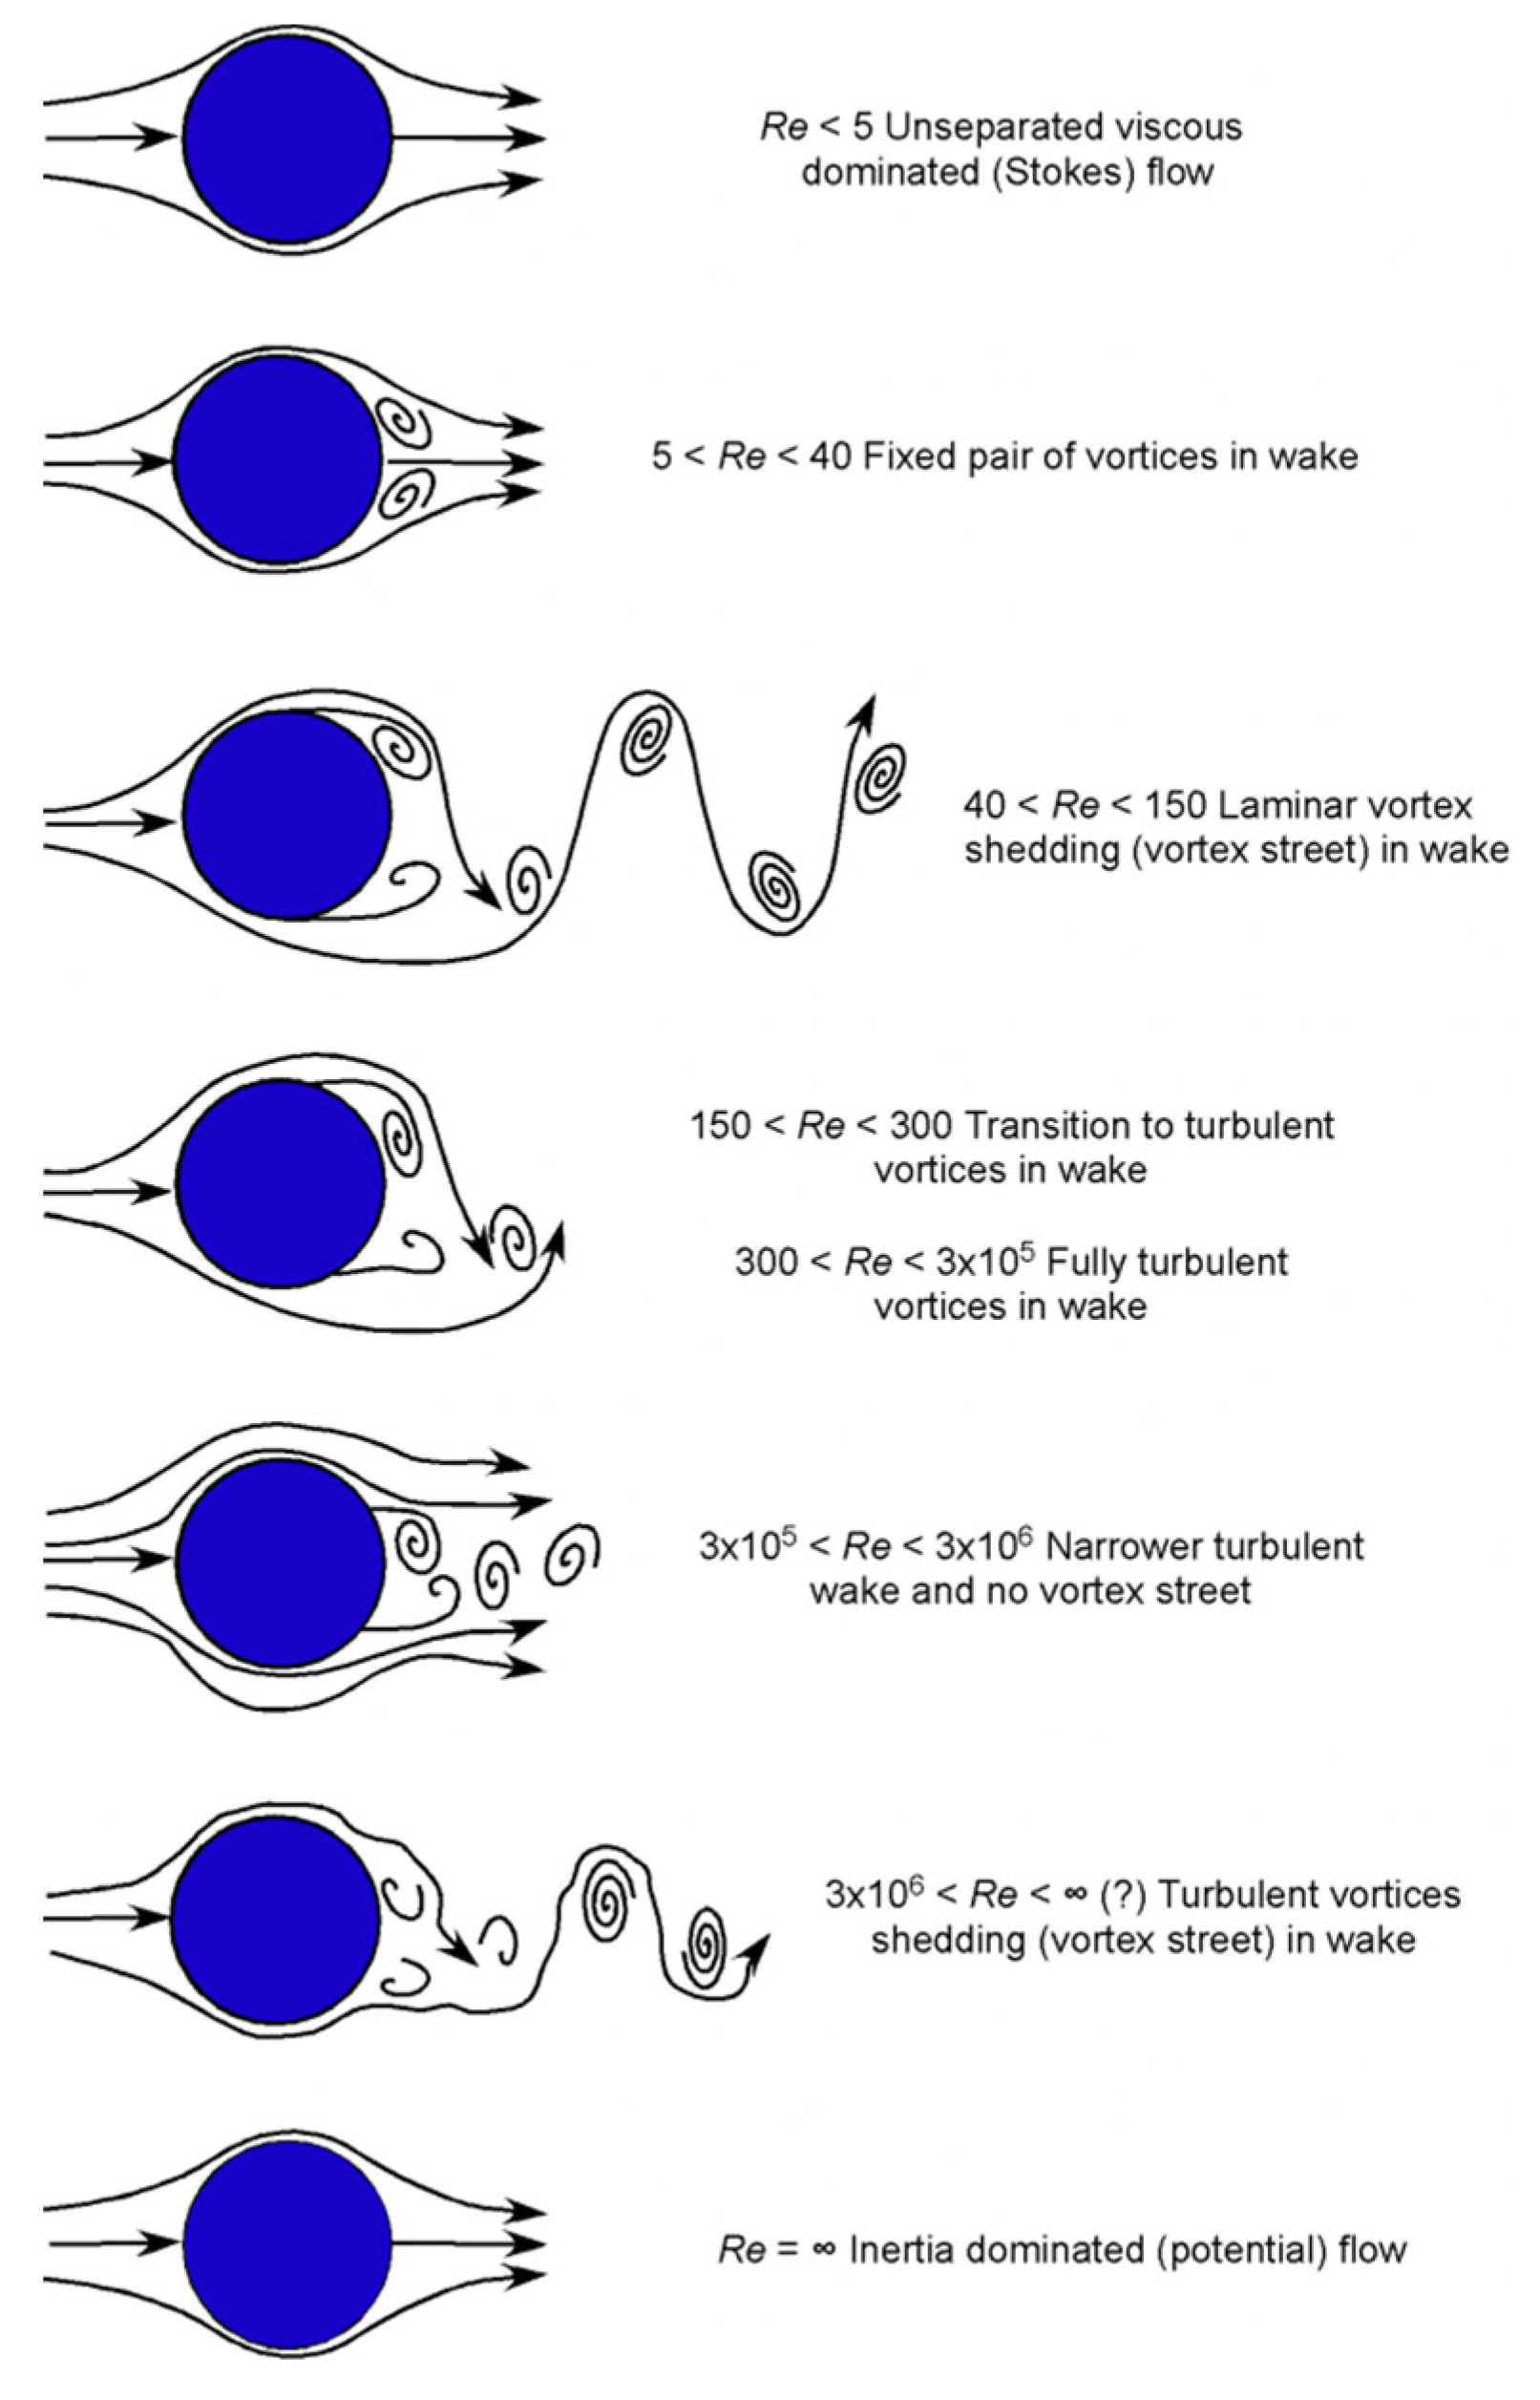
Several researchers have already investigated the dependence of the Strouhal number, and consequently the behavior of the flow, with the Reynolds number. Refs. [23,28,29] investigated this correlation for a sphere invested by a flow for different Reynolds numbers, as shown in Figure 26.
Figure 26.
Flow behavior for different Re.
These studies showed that depending on the Reynolds number, it is possible to establish a different range of Strouhal numbers. In particular, at Re < 5, the flow behavior is influenced much more by viscosity than by inertia effects. At Reynolds numbers slightly higher but less than 40, a stable pair of symmetric vortices form in the wake of the cylinder. The flow is mostly constant, but a high drag coefficient is produced.
As the Reynolds number increases, i.e., at 150 < Re < 300, in the wake, vortices move further downstream. generating alternative vortex shedding, with two rows of counter rotating vortices: an unsteady flow with unsteady drag and periodic pressure variation is established.
As the Reynolds number further increases, the flow in the wake becomes turbulent. Still increasing the Re, i.e., Re > 300,000, the flow is fully turbulent, the boundary layer separates further down the surface, and a narrower wake is produced with a consequence of lower drag. Still increasing Re, Above Re = 3,000,000 to a certain high value (?), turbulent cortices shedding are released in the wake. As the Reynolds number continues to increase, the flow behaves as an inviscid flow, where inertia effects dominate over viscous effects and the flow becomes attached everywhere with a much smaller wake downstream of the cylinder. Over a large range of the Reynolds number, the Strouhal number keeps almost constant at 0.2 [22].
At high Reynolds numbers, the vortex shedding does not occur at a single distinct frequency, but rather over a narrow band of frequencies. In this range, there coexist two values of the Strouhal number. The lower frequency is attributed to the large-scale instability of the wake, is independent of the Reynolds number Re and is approximately equal to 0.2. The higher-frequency Strouhal number is caused by small-scale instabilities from the separation of the shear layer.
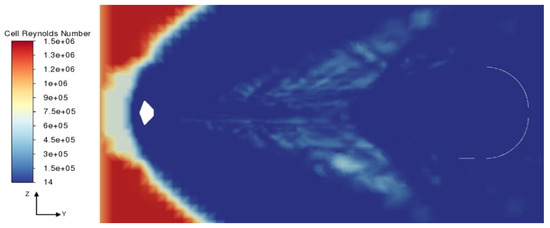
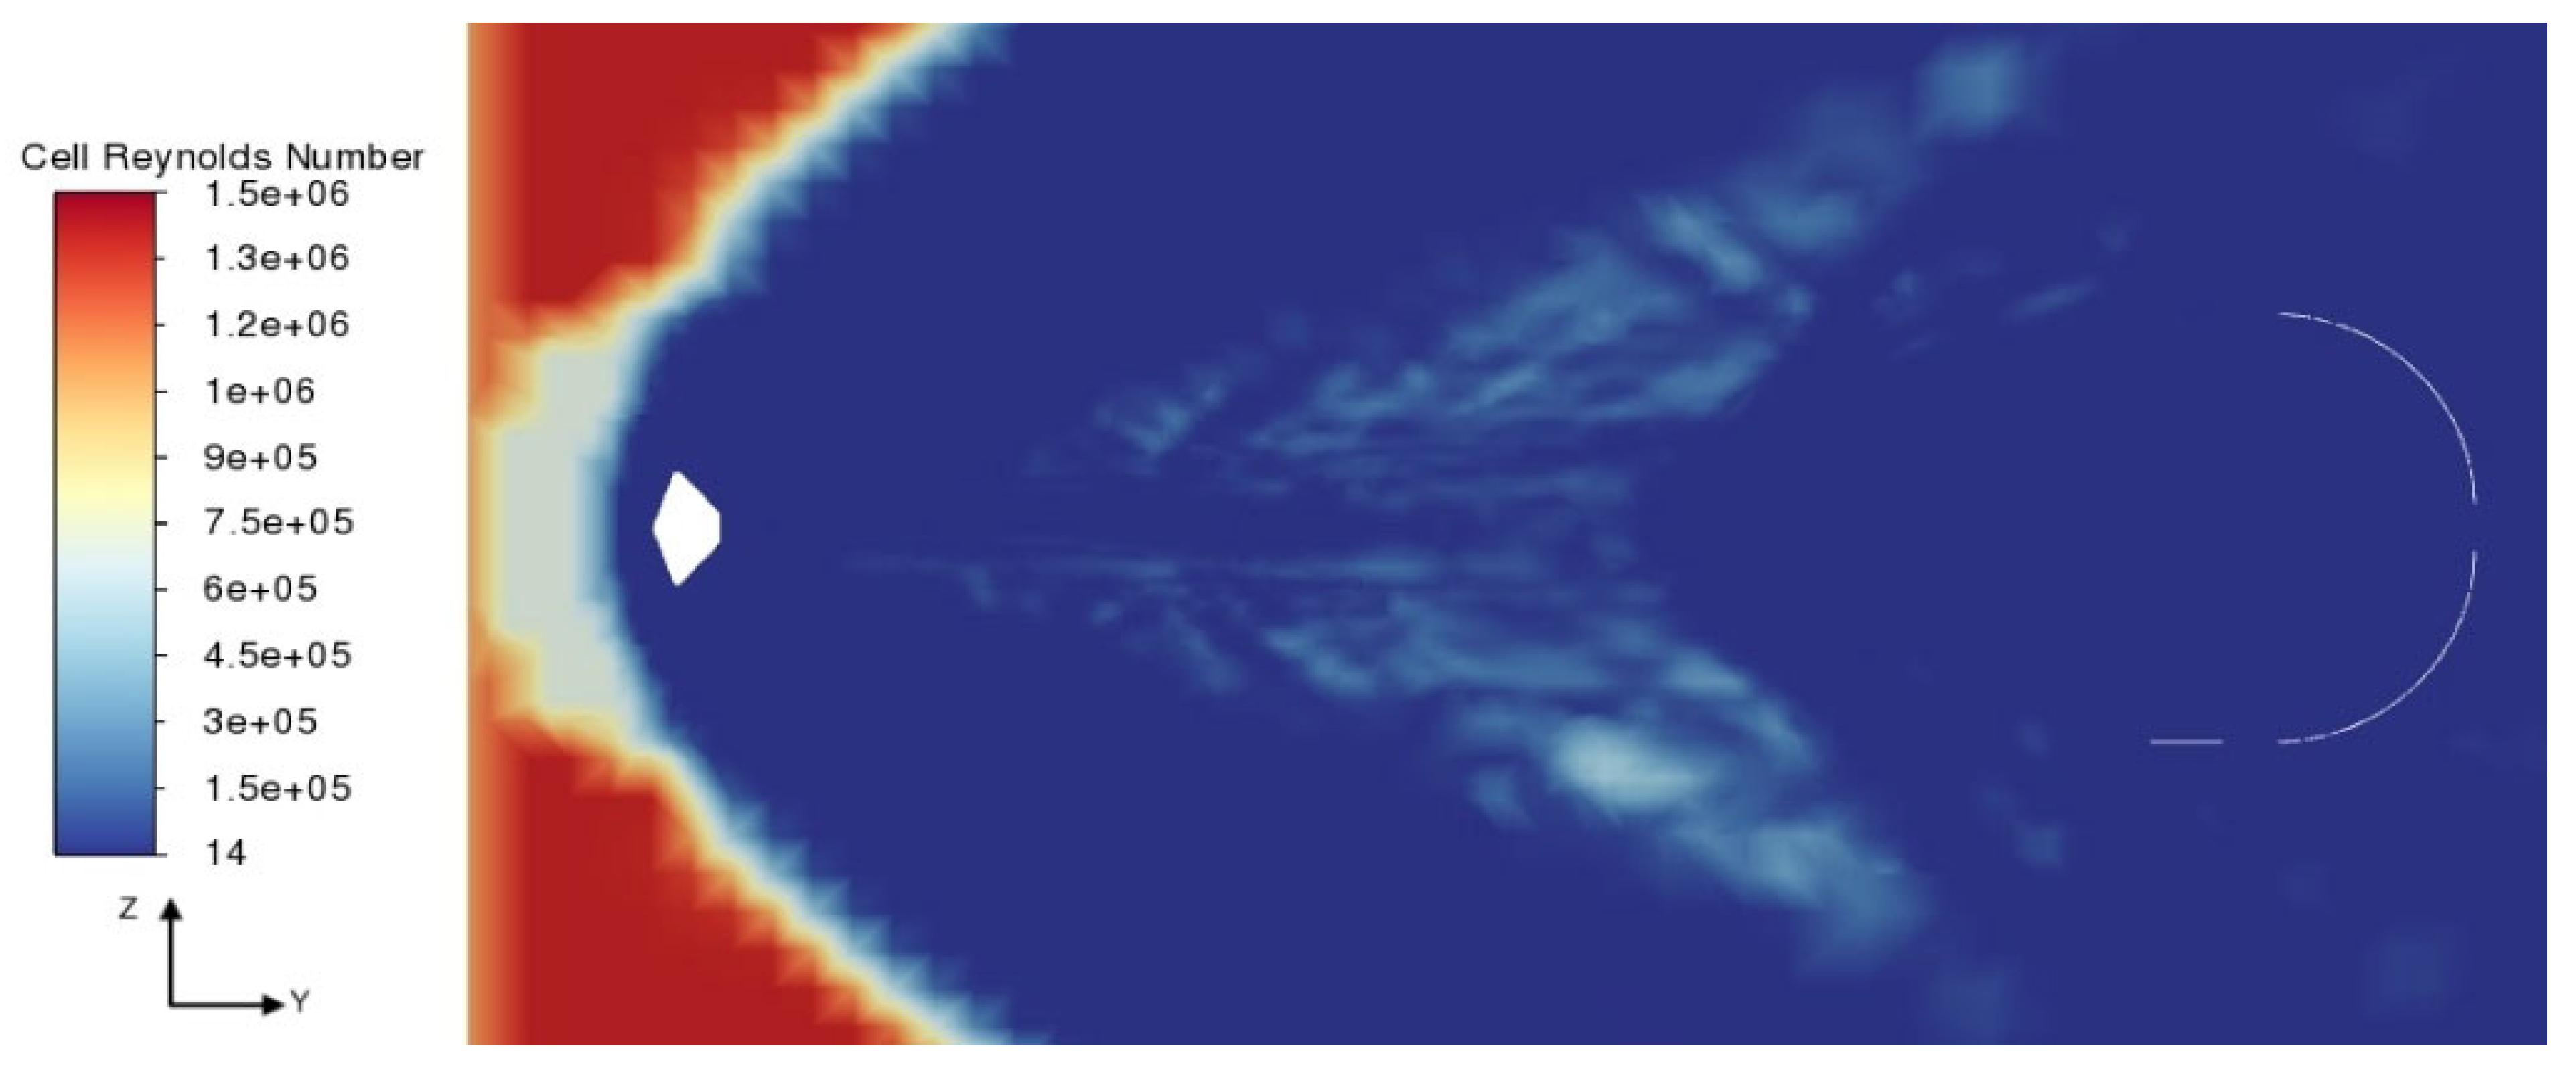
Figure 27 and Figure 28 show the instantaneous cell Reynolds number contour. The maximum Reynolds number is 1.439 × 10⁶ upstream of the capsule, then it suddenly reduces approximately to 40 downstream of the bow shock: in this range, the flow behind the capsule is laminar, and the two counter rotating vortices remain distinctly shaped even at large distances from the capsule and are transported downstream. There, the vorticity is 330 Hz, corresponding to a frequency of 52 Hz, and consequently a St = 0.2. Upstream of the second bow shock, the Reynolds number increases to an approximate value of 4 × 10⁴. Passing through the second bow shock, the eddies are strengthened, and the viscous terms are not sufficient to dissipate the turbulence structures. Within the parachute, the Reynolds number increases to 8 × 10⁵, generating the second unstable vortex shedding release, with a frequency of about 159 Hz, corresponding to a Strouhal number of 0.7.
Figure 27.
Instantaneous cell Reynolds number contour of the capsule and parachute along the computational domain center plane.
Figure 28.
Instantaneous cell Reynolds number contour of the capsule and parachute along the computational domain center plane.
In order to dampen this vortex unstable release generated by the interaction with the turbulence produced by the capsule, some researchers introduced methods for controlling the wake turbulence behind an obstacle. Rashidi provided a comprehensive review of several active and passive control methods implemented for vortex suppression [19], angular momentum injection, blowing and suction methods, electrical control, use of thermal effects, etc.
Even the application of a magnetic field is an option. In fact, because of the high temperatures, the flow around the capsule is ionized [24]. If a magnetic field is applied above the capsule, the electrically conducting flow flowing under the presence of an external magnetic field induces an electric current, which in turn interacts with the magnetic field to produce the Lorentz force. This force acts as a damping force that can weaken or completely eliminate the periodic vortex shedding and the flow-induced vibrations. Investigation of the critical magnetic field required to convert the flow from unsteady to a steady flow has been conducted [28] by introducing the Hartmann number, Ha, i.e., the ratio of electromagnetic force to the viscous force:
where B0 is the magnetic field, d is the diameter of the capsule, σ is the electrical conductivity and µ0 is the dynamic viscosity. In [29], the critical Ha number has been found in the range of 3–10. Assuming a viscosity of µ = 9.82 × 10⁻⁶ kg/ms, electrical conductivity σ = 100 S/m and capsule diameter of 2.4 m, the required magnetic field is 0.9 mTesla.
Ha = B0 d/(σ/µ)1/2
5. Conclusions
In this article, the aerothermodynamic flow characteristics of the rigid capsule–DGB parachute system for Mach number 2.0 are investigated in order to explain the failure of Schiaparelli’s re-entry. Numerical LESs are performed to compare the instantaneous and mean flow field. The simulations showed that the turbulence generated by the baroclinic term due to the first shock is transported downstream, where it is then swallowed and strengthened by the second bow shock. Due to the generation of these vortices, the wake exhibits non-axisymmetric behavior in the instantaneous contours, which explains the beginning of capsule fluctuations. The instantaneous pressure, density and velocity flow fields are symmetrical in front of the capsule, while they are not axisymmetric downstream of the capsule, in particular in the wake. The mean field, on the other hand, is axisymmetric also in the wake region behind the capsule, confirming the oscillatory behavior of these variables that is responsible for the oscillatory motion of the capsule and the parachute system. Simulations showed the importance of LESs with respect to RANS in order to predict non-stationary flow behavior. LESs are therefore mandatory to explain the reason for the oscillations and to predict this behavior in order to propose solutions to dampen them. As future work, large eddy numerical simulations applying different Hartmann numbers will be performed in order to investigate the benefits of this effect for future space missions.
Author Contributions
Conceptualization, P.T.; Methodology, A.I., P.T. and L.N.P.P.; Software, L.N.P.P.; Validation, A.I. and L.N.P.P.; Formal Analysis, L.N.P.P.; Investigation, A.I., P.T. and L.N.P.P.; Resources, P.T.; Data Curation, L.N.P.P.; Writing—Original Draft Preparation, L.N.P.P.; Writing—Review & Editing, A.I.; Visualization, L.N.P.P.; Supervision, A.I. and P.T. All authors have read and agreed to the published version of the manuscript.
Funding
This research received no external funding.
Data Availability Statement
Data are contained within the article.
Conflicts of Interest
The authors declare no conflicts of interest.
Nomenclature
| DGB | disk-gap-band |
| LESs | large-eddy simulations |
| TGO | trace gas orbiter |
| ESA | European space agency |
| EDL | entry, descent, and landing |
| FSI | fluid–structure interactions |
| k | turbulent kinetic energy |
| ω | specific dissipation rate |
| SST | shear stress transport |
| Li; (1,2,3,4,5) | data points |
References
- NASA. Mars Planet Facts News & Images | NASA Mars Rover + Mission Info. 2017. Available online: https://mars.nasa.gov/ (accessed on 15 May 2017).
- Pezzella, G.; Viviani, A. Aerodynamic Analysis of a Manned Space Vehicle for Missions to Mars. J. Thermodyn. 2011, 2011, 857061. [Google Scholar] [CrossRef] [Scilit]
- Hamilton, H.H., II. Approximate Method of Predicting Heating on the Windward Side of the Space Shuttle Orbiter and Comparisons with Flight Data. In Entry Vehicle Heating and Thermal Protection Systems: Space Shuttle, Solar Starprobe, Jupiter Galileo Probe, Progress in Astronautics and Aeronautics; Bauer, P., Collicott, H., Eds.; American Institute of Aeronautics and Astronautics: New York, NY, USA, 2000; pp. 21–53. [Google Scholar] [CrossRef] [Scilit]
- Hollis, B.R. Experimental and Computational Aerothermodynamics of a Mars Entry Vehicle; North Carolina State University: Raleigh, NC, USA, 1996. [Google Scholar]
- Anderson, J.D., Jr. Hypersonic and High-Temperature Gas Dynamics; American Institute of Aeronautics and Astronautics, Inc.: Reston, VA, USA, 2006. [Google Scholar]
- Sengupta, A.; Steltzner, A.; Witkowski, A.; Rowan, J. An overview of the Mars science laboratory parachute decelerator system. In Proceedings of the 2007 IEEE Aerospace Conference, Big Sky, MT, USA, 3–10 March 2007; pp. 1–8. [Google Scholar]
- Li, S.; Peng, Y. Mars entry trajectory optimisation using DOC and DCNLP. Adv. Space Res. 2011, 47, 440–452. [Google Scholar] [CrossRef] [Scilit]
- Accorsi, M.L.; Leonard, J.W.; Benney, R.J.; Stein, K.R. Structural modeling of parachute dynamics. AIAA J. 2000, 38, 139–146. [Google Scholar] [CrossRef] [Scilit]
- Accorsi, M.L.; Benney, R.J.; Kalro, V.; Leonard, J.W.; Stein, K.R.; Tezduyar, T.E. Parachute fluid-structure interactions: 3-D computation. Comput. Methods Appl. Mech. Eng. 2000, 190, 373–386. [Google Scholar]
- Accorsi, M.L.; Benney, R.J.; Leonard, J.W.; Stein, K.R.; Tezduyar, T.E. Fluid-structure interactions of a round parachute: Modelling and simulation techniques. J. Aircr. 2001, 38, 800–808. [Google Scholar]
- Gao, X.L.; Zhang, Q.B.; Tang, Q.G.; Li, J.H. Numerical study on fluid-structure interaction of slot-parachute’s inflation process. Acta Aeronaut. Astronaut. Sin. 2013, 34, 2265–2276. [Google Scholar]
- Tezduyar, T.E.; Kenji, T.; Creighton, M.; Wright, S.; Christopher, J. Space–time finite element computation of complex fluid–structure interactions. Int. J. Numer. Methods Fluids 2010, 64, 1201–1218. [Google Scholar] [CrossRef] [Scilit]
- Peterson, C.; Strickland, J. The fluid dynamics of parachute inflation. Annu. Rev. Fluid Mech. 1996, 28, 361–387. [Google Scholar] [CrossRef]
- Karagiozis, K.; Kamakoti, R.; Criak, F.; Pantano, C. A computational study of supersonic disk-gap-band parachutes using large-eddy simulation coupled to a structural membrane. J. Fluids Struct. 2011, 27, 175–192. [Google Scholar] [CrossRef] [Scilit]
- Giulio, S. Numerical Investigation of the Parachute-Capsule Aerodynamics in a Mars Atmosphere Reentry. Master’s Thesis, Università Degli Studi di Padova, Padova, Italy, 2022. [Google Scholar]
- Zhiyin, Y. Large-eddy simulation: Past, present and the future. Chin. J. Aeronaut. 2015, 28, 11–24. [Google Scholar] [CrossRef] [Scilit]
- Schlatter, P.; Örlü, R. Assessment of direct numerical simulation data of turbulent boundary layers. J. Fluid Mech. 2010, 659, 116–126. [Google Scholar] [CrossRef] [Scilit]
- Raj, C.A.S.; Narasimhavaradhan, M.; Vaishnavi, N.; Arunvinthan, S.; Al Arjani, A.; Pillai, S.N. Aerodynamics of ducted re-entry vehicles. Chin. J. Aeronaut. 2020, 33, 1837–1849. [Google Scholar] [CrossRef] [Scilit]
- Sengupta, A. Fluid structure interaction of parachutes in supersonic planetary entry. In Proceedings of the 21st AIAA Aerodynamic Decelerator Systems Technology Conference and Seminar, AIAA, Dublin, Ireland, 23–26 May 2011. [Google Scholar]
- Sengupta, A.; Roeder, J.; Kelsch, R.; Wernet, M.; Kandis, M.; Witkowski, A. Supersonic disk-gap-band parachute performance in the wake of the Viking-type entry vehicle from Mach 2 to 2.5. In Proceedings of the AIAA Atmospheric Flight Mechanics Conference and Exhibit, AIAA, Honolulu, HI, USA, 18–21 August 2008. [Google Scholar]
- Sengupta, A.; Kelsch, R.; Roeder, J.; Wernet, M.; Witkowski, A.; Kandis, M. Supersonic performance of disk-gap-band parachutes constrained to a 0-degree trim angle. J. Spacecr. Rocket. 2009, 46, 1155–1163. [Google Scholar] [CrossRef] [Scilit]
- Sengupta, A.; Steltzner, A.; Comeaux, K.; Candler, G.; Barnhardt, M.; Pantano, C. Results from the Mars Science Laboratory parachute decelerator system supersonic qualification program. In Proceedings of the 2015 IEEE Aerospace Conference, Big Sky, MT, USA, 1–8 March 2015. [Google Scholar]
- Otsu, H. Aerodynamic Characteristics of Re-Entry Capsules with Hyperbolic Contours. Aerospace 2021, 8, 287. [Google Scholar] [CrossRef] [Scilit]
- Feng, L.-H.; Wang, J.-J. Modification of a circular cylinder wake with synthetic jet: Vortex shedding modes and mechanism. Eur. J. Mech.—B/Fluids 2014, 43, 14–32. [Google Scholar] [CrossRef] [Scilit]
- Sen, U.; Sarkar, S.; Bagchi, S.; Mukhopadhyay, A.; Sen, S. Dynamics of Non-Reacting and Reacting Flows Past Bluff Bodies. In Innovations in Sustainable Energy and Cleaner Environment. Green Energy and Technology; Part of the Green Energy and Technology Book Series (GREEN); Springer: Singapore, 2019. [Google Scholar]
- Takahashi, Y.; Nakasato, R.; Oshima, N. Analysis of Radio Frequency Blackout for a Blunt-Body Capsule in Atmospheric Reentry Missions. Aerospace 2016, 3, 2. [Google Scholar] [CrossRef] [Scilit]
- Johari, H.; Desabrais, K.J. Vortex shedding in the near wake of a parachute canopy. J. Fluid Mech. 2005, 536, 185–207. [Google Scholar] [CrossRef] [Scilit]
- Rashidi, S.; Hayatdavoodi, M.; Esfahani, J.A. Vortex shedding suppression and wake control: A review. Ocean. Eng. 2018, 126, 57–80. [Google Scholar] [CrossRef] [Scilit]
- Berger, E.; Scholz, D.; Schumm, M. Coherent vortex structures in the wake of a sphere and a circular disk at rest and under forced vibrations. J. Fluids Struct. 1990, 4, 231–257. [Google Scholar] [CrossRef] [Scilit]

Disclaimer/Publisher’s Note: The statements, opinions and data contained in all publications are solely those of the individual author(s) and contributor(s) and not of MDPI and/or the editor(s). MDPI and/or the editor(s) disclaim responsibility for any injury to people or property resulting from any ideas, methods, instructions or products referred to in the content. |
© 2024 by the authors. Licensee MDPI, Basel, Switzerland. This article is an open access article distributed under the terms and conditions of the Creative Commons Attribution (CC BY) license (https://creativecommons.org/licenses/by/4.0/).