Abstract
Extensive research in predicting annual passenger throughput has been conducted, aiming at providing decision support for airport construction, aircraft procurement, resource management, flight scheduling, etc. However, how airport operational throughput is affected by convective weather in the vicinity of the airport and how to predict short-term airport operational throughput have not been well studied. Convective weather near the airport could make arrivals miss their positions in the arrival stream and reduce airfield efficiency in terms of the utilization of runway capacities. This research leverages the learning-based method (MB-ResNet model) to predict airport hourly throughput and takes Hartsfield–Jackson Atlanta International Airport (ATL) as the case study to demonstrate the developed method. To indicate convective weather, this research uses Rapid Refresh model (RAP) data from the National Oceanic and Atmospheric Administration (NOAA). Although it is a comprehensive and powerful weather data product, RAP has not been widely used in aviation research. This study demonstrated that RAP data, after being carefully decoded, cleaned, and pre-processed, can play a significant role in explaining airfield efficiency variation. Applying machine learning/deep learning in air traffic management is an area worthy of the attention of aviation researchers. Such advanced artificial intelligence techniques can make use of big data from the aviation sector and improve the predictability of the national airspace system and, consequently, operational efficiency. The short-term airport operational throughput predicted in this study can be used by air traffic controllers and airport managers for the allocations of resources at airports to improve airport operations.
1. Introduction
Airport operational throughput describes actual arrivals/departures in unit time for a specific airport. It is affected by supply (airport capacity) and demand (arrivals that intend to land at the airport). When airport operational throughput is reported as the annual number of aircraft movements or of passengers, it is mostly demand-driven [1]. The existing literature predicts annual passenger throughput at airports to provide decision support for airport construction, aircraft procurement, and route planning [2,3,4]. The prediction of passenger throughput in a smaller time unit is also needed for coordinating the operational management of terminal buildings and landside facilities. Furthermore, given predicted airport operational throughput and airport capacity, airport capacity utilization rates can be predicted and underused airport capacity can be identified for triggering traffic management initiatives to improve the utilization of airport capacity. This study focused on airport operational throughput in a small-time unit, e.g., one hour. By taking different constraints into consideration, such as airport capacity, arrival demand, weather conditions, etc., a multi-branch convolutional neural network was developed to predict airport operational throughput. Note that there is a trade-off between airport congestion and capacity utilization. This study focused on posterior data processing but not on exploring the relationship between capacity utilization and congestion level.
Many busy airports worldwide are coordinated airports participating in slot coordination, a process of allocating airport slots to airlines following the guidelines published by the International Air Transport Association (IATA), the Airports Council International (ACI) and the Worldwide Airport Coordinators Group (WWACG). Slot coordination is usually conducted in advance of every scheduling season via semi-annually slot conferences. The first step in slot coordination is to set up declared capacities of coordinated airports, which is an agreed benchmark after considering the trade-off between airport capacity utilization and airport congestion/flight delay [5]. For coordinated airports, airport operational throughput could be capped by planned scheduling constrained by the declared capacity. The majority of airports in the U.S., however, do not participate in slot coordination. Instead, market-driven scheduling, a first-come-first-serve, ground delay program, and other traffic management initiatives are used for airport operations under different circumstances. This study is suitable for large commercial airports in the U.S. that are not slot coordinated.
There have been extensive studies on modeling and predicting airport capacity by applying analytical methods [6,7,8,9] or artificial intelligence techniques [10,11,12,13,14]. The outcomes of those studies are expected to provide better inputs for air traffic flow management programs such as ground delay programs. However, although adverse weather around an airport leads to poor visibility, a low ceiling and thus, a reduction in airport capacity, adverse weather will also affect airport arrival demand. On one hand, a significant reduction in airport capacity may trigger a ground delay program (GDP), which reduces arrival demand in the time period when the GDP is applied. Also, convection in airspace close to the airport (e.g., within a 250-mile radius) may lead to rerouting of arrivals and reduce the arrival demand of the airport. Overall, weather is a major factor influencing aviation operations, both capacity and demand, and eventually airport operational throughput. To evaluate if airport capacity has been used efficiently, short-term (hourly) airport operational throughput—the result of the interaction between airport capacity and demand—is an important metric and needs to be studied for strategizing air traffic management initiatives to improve airport capacity utilization. Disregarding the importance of potential implementation, the existing literature lacks studies on hourly airport operational throughput modeling and prediction. This study fills the gap by developing advanced learning models to model and predict short-term airport operational throughput.
Most convective weather-related research uses the Meteorological Aviation Routine Weather Report (METAR), the Terminal Aerodrome Forecast (TAF) [15,16], or the Localized Aviation MOS Program (LAMP) [16]. The comprehensive weather forecast product Rapid Cycle (RUC, now called Rapid Refresh or RAP) from the National Oceanic and Atmospheric Administration (NOAA) is another weather product used in aviation research. Although it was shown by Wang et al. [11,12] that using surface weather elements from RUC to predict the airport acceptance rate (AAR) could achieve better accuracy than using METAR, RUC (now RAP) data have not been extensively used. Furthermore, RAP includes weather elements beyond the surface and covering different altitude ranges. These are valuable resources but are not used in the existing literature, perhaps because of the computational challenges of decoding and processing RAP data.
This study hypothesizes that leveraging advanced machine learning techniques and detailed weather data can significantly improve short-term throughput predictions, an area that has seen limited exploration. By addressing this gap, our research aims to contribute to the enhancement of operational efficiency and decision-making in the complex realm of air traffic control.
The major contributions of this study are the follows. First, a method was developed to identify RAP weather features that indicate convection and to determine thresholds of these features leading to unflyable airspace. Second, this study developed a multi-branch convolutional neural network (CNN) model, which is a type of deep learning algorithm primarily used for processing data with a grid-like structure, for predicting airport hourly throughput that was tested with historical data from Hartsfield–Jackson Atlanta International Airport (ATL) and that demonstrated excellent prediction performance.
The rest of this paper is organized as follows. Section 2 describes the data source and digitalization of airspace network and explains how to decode and process RAP weather data. Section 3 introduces learning models and elaborates on the architecture and loss functions. Section 4 compares the performance of the proposed learning model and other commonly used predictive learning models. Section 5 concludes this study.
2. Research Approach and Data Preparation
The research approach of this study includes data acquisition and processing, convection weather feature extraction, the development of a learning model and experiments of the case study airport. Acknowledging the gaps in the existing literature, the first step of the study is to acquire and decode RAP weather data and to obtain historical flight trajectory data. In the first step, an open-source NoSQL database known for its high scalability and flexibility called MongoDB is used to construct the data structure and establish a fused database for discretized airspace. Secondly, flight trajectory data were processed to obtain traffic flows going through cells in the discretized airspace. Connections between flow and convection weather features were analyzed to determine unflyable thresholds of the weather features. Thirdly, a multi-brunch ResNet model was developed to model to the airport operational throughput with tensor data generated with the outcomes from the previous two steps, including convective weather features, a convection indicator, a normal path indicator, and unit traffic flow.
This section focuses on presenting the first two steps. The learning model will be elaborated in Section 3 and followed by Section 4, which describes the experiments and results.
2.1. NOAA RAP Forecasted Weather Data
TAF and METAR are two main aviation weather products used to describe airport weather in aviation research. TAF provides hourly summaries of forecast airport weather and METAR provides hourly summaries of observed weather data. Comparably, METAR has a more comprehensive historical archive online because historical observations of weather conditions are used more in aviation analysis [17].
As emphasized by Kuhn [17], researchers have limited access to airspace weather data used for air traffic flow management, e.g., the corridor-integrated weather System (CIWS) and the integrated terminal weather system (ITWS) are controlled-access tools, and National Convective Weather Detection/Forecast (NCWD/NCWF) data from the National Center for Atmospheric Research, Significant Meteorological Information (SIGMET), Airman’s Meteorological Advisory (AIRMET), and Graphical AIRMET (G-AIRMET) data are real-time only.
Fortunately, historical RUC data, latterly replaced by RAP data, are available online and are useful databases for aviation researchers. Thus, in this study, forecasted weather data were retrieved from NOAA by using the RAP model, a mathematical climate model maintained by the National Centers for Environmental Prediction (NCEP). The model covers the continental U.S. domain, including surface observations, radar-detected data, and satellite-obtained data as generation sources. Forecasts are produced each hour with a forecast horizon of up to 23 h from the current hour. RAP has two data versions; one generates a weather forecast on a 13 × 13 km (7 × 7 nautical miles) resolution horizontal grid and the other on a 3 × 3 km (1.6 × 1.6 nautical miles) resolution horizontal grid. Although the 3 km version shows a higher rapid refresh resolution measurement, it is not archived by the NOAA. Thus, in this study, the RAP 13km resolution version was requested and downloaded from the NOAA NCEP server and is called RAP data hereafter. RAP data are a comprehensive dataset with many aloft weather elements and collected from tens of thousands of locations across North America. They include 58 weather forecast variables valid for different altitude ranges. For example, PWAT_0 represents precipitable water with an altitude range of 0–30,000 ft, and CIN_90, a feature representing convective inhibition, has an altitude range of 1000–2329.13 ft. After discretizing the study airspace into 7 nm × 7 nm × 1000 ft cells, as described in next subsection, the altitude range can be converted into different number of cells vertically in the discretized study airspace.
2.2. Discretization of Study Airspace
For a study airport, the focus was on airspace within a 250 nm radius from the airport, which is the metering arc distance for extended metering (EM), and up to 30,000 ft. Given that the RAP weather forecast was generated for a 7 nm resolution horizontal grid, the airspace was discretized into cells of 7 nm × 7 nm × 1000 ft. In total, there were 187,230 such cells in the study airspace. Figure 1 is an illustration of the study’s discretized airspace.

Figure 1.
Research area and discretization of airspace.
2.3. Flight Trajectory Data and Method for Computing Cell-Level Traffic Flow
Historical flight trajectory data were collected and analyzed for two purposes. From the trajectory data, here, we can obtain the traffic flow going through the cells in the discretized airspace. Firstly, by mapping the flow with values of weather features in the RAP data, this research can determine the non-flyable thresholds of features that are used for indicating convection. Secondly, considering the temporal continuation of flight operations, lagged traffic flow is a factor that this research will test in learning model development.
Flight trajectory data used in this study were obtained from the Performance Data Analysis and Reporting System (PDARS) [18], an integrated performance measurement tool enabling a system-wide capability to monitor daily operations of the National Airspace System (NAS). A key feature of the PDARS system is performing flight trajectory synthesis., i.e., collecting flight data from multiple surveillance systems, merging track points into end-to-end trajectories, and producing quality-controlled, analysis-ready data. It also has the analytic capability to measure the service performance of ATCs and help improve the safety and efficiency of NAS.
The method of obtaining traffic flow going through each of the cells in the discretized airspace is described as follows. First, for one trajectory point, shown in red in Figure 2, the centroids of cells within a 7 nm radius around that point were determined, e.g., cells 4, 5, 7, and 8 for the red trajectory point. Second, the distance between that point and each centroid was calculated. Third, the point was assigned to the cell where the distance between the point and the centroid of the cell was the minimum, i.e., cell 5, in this case. Fourth, the altitude of the point was checked to determine the level of the cell into which this point falls. Finally, the flow going through each cell was obtained by counting the number of unique flight IDs going through the cell. Following this method, the number of flights going through a cell in a specific hour could be calculated.
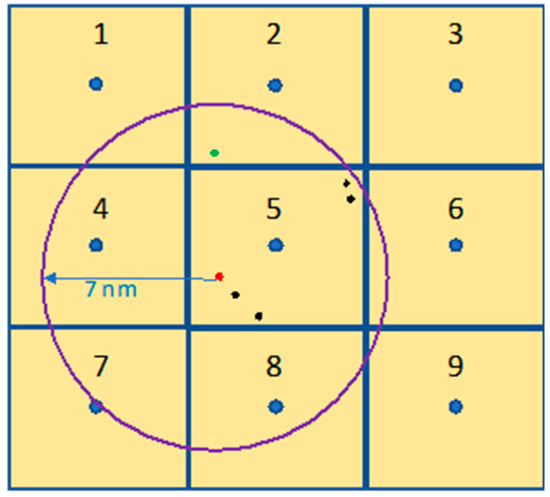
Figure 2.
Illustration of calculating cell-level traffic flow.
2.4. Identification of Weather Features Indicating Convection and Their Unflyable Thresholds
There are 58 features in RAP data. Many weather features do not indicate convection, e.g., temperature (TMP), frozen precipitation (ASNOW), and relative humidity (RH). To include appropriate factors in the learning model, the weather features indicating convection and unflyable thresholds of the features need to be identified. For selecting weather features, in a consultation with aviation meteorologists, they pointed out nine features. With such information, this research first obtained a nominal trajectory by analyzing the historical trajectory on good weather days with the clustering method. Then, for cells where nominal trajectories were going through, this research analyzed the historical trajectory when weather conditions occurred and plotted the relationship between the flow and the value of each of the 10 features (see Figure 3). Furthermore, this research applied the clustering method (with clustering groups equal to 2) to determine the flyable thresholds of the features (see Table 1).
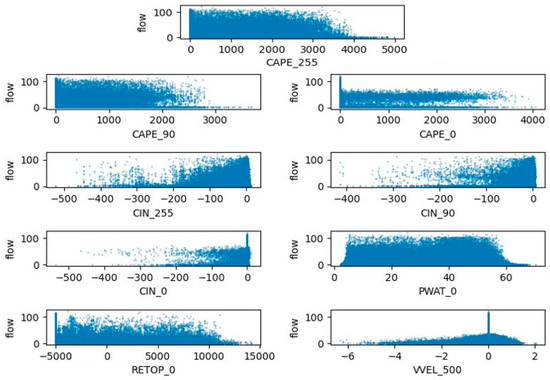
Figure 3.
Correlation between weather features and traffic flow.

Table 1.
Weather features indicating convection and their unflyable ranges.
2.5. Data Fusion
The throughput data analyzed in this study, i.e., hourly arrivals and departure, were acquired from the Aviation System Performance Metrics (ASPM) database, the Federal Aviation Administration (FAA) Operations & Performance Data database that contains flight information to and from the 75 ASPM airports and all flights by ASPM carriers, including flights by carriers to international and domestic non-ASPM airports. In addition, ASPM contains information on airport weather, runway configuration, and airport arrival and departure acceptance rates.
For the studied airport, hourly throughput data from ASPM for the time period of 1 April–30 September 2019 were combined with RAP weather information and air traffic flow data from the analysis of historical aircraft trajectories. The dataset provides comprehensive inputs for the learning models that will be described in the next section.
3. Development of Learning Models
An end-to-end trained encoder–decoder convolutional neural network was developed for modeling and predicting airport operational throughput, which includes a multi-branch down-sampling path as the encoder and a multi-scale feature fusion and multi-scale up-sampling blocks as the decoder. Modeling details are described in the following subsections.
3.1. Tensor Data Preparation
This section presents tensor data preparation for the case study airport ATL. For ATL, the airspace was divided into 79 × 79 × 30 cubes, called cells. Each cell has a feature vector with 12 elements, 9 of which are weather features and the other 3 of which are flow data, a nominal path indicator, and a convection indicator. These 12 elements were grouped into 4 tensors, as shown in Figure 4.
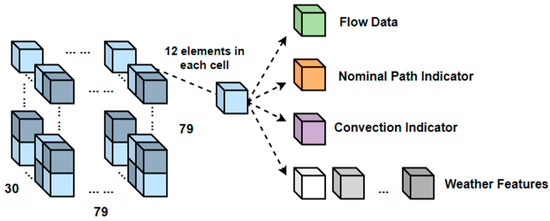
Figure 4.
Visual illustration of input data used for throughput prediction.
- The weather tensor includes the nine selected convective weather features. The tensor is 9 × 79 × 79 × 30.
- The convection indicator tensor indicates if the cell encounters convection or not, which is determined by comparing the weather features with corresponding convection thresholds of the features. It is a binary variable of 1 and 0, and the tensor is 1 × 79 × 79 × 30.
- The flow data tensor represents the amount of flow going through each cell calculated from trajectory data. The tensor is 1 × 79 × 79 × 30.
- The nominal path indicator tensor indicates if the cell belongs to the path of nominal trajectories. It is a binary variable of 1 and 0, and the tensor is 1 × 79 × 79 × 30.
In the learning model, this research included both the convection indicator and the values of different weather features. This is not redundant because trials show that learning model performance is not promising if only a convection indicator is included. The underlying logic is that some values of convection weather features, although not leading to an unflyable situation, also affect flight operations to certain extent.
3.2. Neural Network Architecture
The study airspace contains highly structured three-dimensional cells, for a total of 79 × 79 × 30. The literature review [19] shows that a multi-branch residual network (MB-ResNet) is suitable for capturing spatial correlations of the cells. Several advantages of this method are its capability to learn features at multiple scales or resolutions concurrently, offering better generalization, attaining superior accuracy in different tasks compared to those attained in single-path counterparts, and so forth. Thus, in this study, the neural network architecture of MB-ResNet was adopted, and the performance of this proposed method was compared with that of other methods used widely for predictive analysis, such as multilayer perceptron (MLP) and ResNet.
The proposed MB-ResNet integrates four residual networks with feature fusion layers to process multi-source tensor data (see Figure 5 for an illustration of the general architecture). The proposed MB-ResNet consists of three modules: Module 1 extracts features from different information sources (feature extraction layer); Module 2 fuses extracted features from multiple sources (multi-branch feature fusion layer); and Module 3 predicts airport operational throughput (prediction layer).
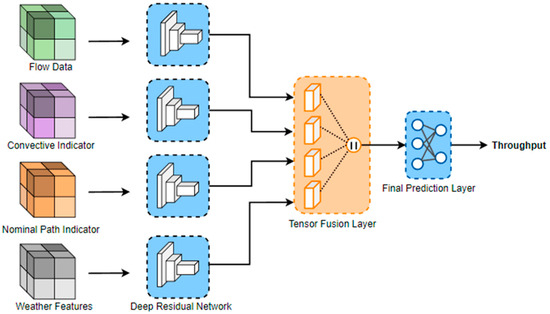
Figure 5.
Architecture of proposed MB-ResNet.
In the feature extraction layer, four parallel deep residual networks with individual weights (no weight sharing across different networks) are used to extract multi-source information from the preprocessed tensor data. Each individual deep residual network is associated with a specific source of data, i.e., flow data, a convection indicator, binary nominal path data, and weather features. More specifically, this research applied the standard residual network with 34 convolutional layers for each feature extraction network for optimal performance.
The standard residual network has 34 layers in total, including 3 residual units of 64 feature maps, 4 residual units of 128 feature maps, 6 residual units of 256 feature maps, and 3 residual units of 512 feature maps unit. Since each residual unit has two convolutional layers, the above layers needed to be multiplied by two. Counting the initial convolutional layer and fully connected output layer, the total number of ResNet-34 layers is 34 ((3 +4 + 6 + 3) × 2 + 1 + 1 = 34).
After the feature extraction layer, four feature tensors of the same size are fed into the tensor fusion layer, as illustrated in Figure 6. The tensor fusion layer consists of four convolutional layers with individual weights, and each convolutional layer is composed of a convolution operation, a batch normalization operation, and a rectified linear unit (ReLU) activation layer. Then, the four adapted feature tensors are concatenated and fed into another convolutional layer, followed by an adaptive average pooling operation to obtain the final feature vector for throughput prediction.
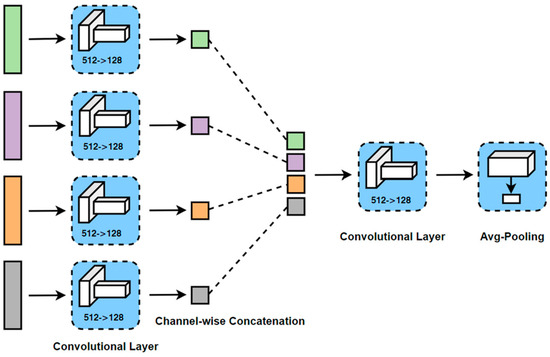
Figure 6.
Tensor fusion layer of MB-ResNet.
Finally, the throughput predication layer applies an MLP with a linear layer mapping the features from 512 to 128, a ReLU activation layer, a dropout layer, and a linear layer mapping the features from 128 to 1.
3.3. Loss Function and Evaluation Metrics
To effectively train the throughput prediction model, the loss function of the summation of mean absolute error loss (L1 loss) and mean square error loss (L2 loss) was used; see Equation (1) below:
where n is the number of testing samples, is the prediction output from MB-ResNet, and is the ground truth throughput value.
To evaluate the performance of the prediction model, two different evaluation metrics were used. The root mean square Error (RMSE) quantifies the dispersion of prediction errors, representing the standard deviation of these residuals. In essence, it gauges the extent to which the data points cluster around the optimal fit line. RMSE is described through the following Equation (2):
The second metric is relative absolute error (RAE), i.e., the total absolute difference between predicted and true value divided by the total of the true value. The RAE can be described through the following Equation (3):
4. Experiments
4.1. Case Study Airport
For many years, ATL has been recognized as the world’s busiest airport in terms of passenger traffic and aircraft movement. The high volume of operations offers a wealth of data and make the airport a microcosm for understanding large-scale operations and their associated challenges. Insights derived from research in a major hub like ATL can often be generalized or adapted to understand other large airports worldwide, making findings more broadly applicable. Hence, this research chose ATL as the case study airport. As noted, the RAP 13 km resolution GRID data were queried by using the latitude and longitude of ATL as the center, and then three circles (40 nm, 120 nm, 250 nm as the radius, respectively) were drawn based on this center. Finally, the circumscribed square of the outermost circle was downloaded as the GRID data area, as shown in Figure 7.
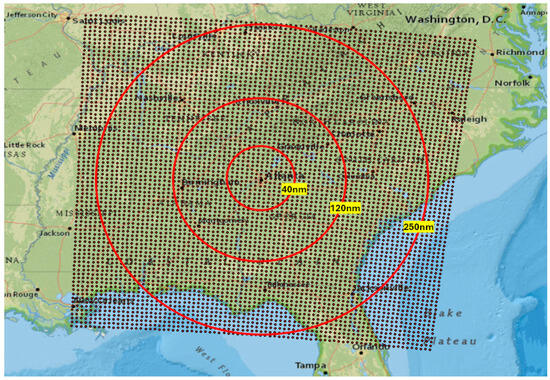
Figure 7.
Research area (ATL case study).
4.2. Performance Comparison of Different Learning Methods
This study used MB-ResNet to tackle the multi-task throughput prediction problem. The MB-ResNet uses a multi-branch convolutional neural network to handle multi-modality input (flow data, flyable locations, convection data, and weather features). To demonstrate the efficiency and effectiveness of the proposed MB-ResNet, it was compared with two other methods, MLP and ResNet.
- Multi-layer perceptron (MLP) is an important type of deep, artificial neural network with input and output layers and one or more hidden layers with many neurons stacked together. The output function of MLP does not have to be linear. MLPs are used primarily for supervised learning such as regression and classification. A recent study of MLP application in transfer passenger flow prediction in the Istanbul transportation system showed that MLP outperformed kNN (k-nearest neighbors), LR (linear regression), RF (random forest), SVM (support vector machine), and XGBoost while using MSE, RMSE, MAE, and R-square parameters to evaluate the performance of the models [20].
- The residual network (ResNet) is a recently developed neural network that has been proven to have extraordinary performance for various tasks such as image recognition and image segmentation [21]. With residual blocks added to a residual connection (a shortcut connection), inputs can forward-propagate faster through the residual connections across layers; thus, networks with a large number of layers can be trained easily without increasing the training error percentage. Also, ResNets help to tackle the vanishing gradient problem using identity mapping.
4.3. Experiment Design
To better compare the performance of the methods, a five-fold cross validation scheme was applied. Also, input data were separated into subsets to demonstrate the effect of operation types and directional consideration on the performance of learning methods. One way of separating input data is to analyze arrivals only, and departures only, of the total throughputs. In addition, flight operations at ATL follow different procedures under various weather conditions going through either the eastern or the western portal of the airport. Figure 8 shows the distribution of the throughput values for western only, eastern only, and western and eastern. The total operation hours in this study were 4629, 53.8 percent of which went through the eastern portal and 46.2 percent of which went through the western portal. Thus, the data can be separated into western only, eastern only, and both portals. In total, this research tested nine different models while combining operation types and directional consideration.
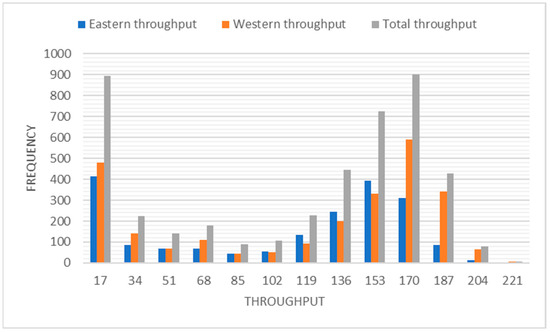
Figure 8.
Distribution of directional hourly throughputs.
4.4. Training Configuration and Implementation Details for MB-ResNet
ResNet-34 was used as the backbone network architecture for MB-ResNet in this study. To train the models, the Adam optimizer was used, which is an alternative algorithm to classical stochastic gradient descent, which updates network weights iteratively. This research uses an initial learning rate of 3 × 10⁻⁴ (weight decay of 1 × 10⁻⁶) and a batch size of 64. The learning rate was halved at 25, 50, and 75 percent of the total training epoch (20) for optimal convergence. PyTorch was used for implementation, and the experiments were run on a machine equipped with a NVIDIA Titan XP GPU with 12 GB of memory. PyTorch is an open-source machine learning library that is widely used for applications in deep learning and artificial intelligence. It provides a flexible platform for building deep learning models and offers dynamic computation graphs that allow for the more intuitive coding of complex architectures.
4.5. Experiment Results
This section presents results of throughput prediction for the nine models and combinations of operation types and directional consideration, with the proposed MB-ResNet and the benchmark MLP and ResNet. As shown in Table 2, overall, the proposed MB-ResNet outperformed the MLP and ResNet. For each of the learning methods, the performance metrics for all nine models are close, with MB-ResNet showing a much lower RMSE and RAE compared to those of other methods. The superiority of the proposed MB-ResNet is based on the fact that it can efficiently fuse tensor data from different sources and have a better chance of capturing the variability and connections of the data.

Table 2.
Performance comparison among proposed MB-ResNet and other methods.
Figure 9 and Figure 10 visualize the comparison of model performance for different scenarios, with Figure 9 focusing on RMSE and Figure 10 focusing on RAE. It is easy to see that the proposed learning method, MB-ResNet, outperforms the MLP and ResNet. The MLP and ResNet performed better when predicting arrival throughput and departure throughput separately but not so good with pooled data. However, the proposed MB-ResNet performed better for pooled data. For RMSE, no matter the different ways of dividing the data, either by arrival or departure, or by directions, the values from the MB-ResNet are consistent. However, for RAE, pooling arrivals and departures leads to better RAE values, while directions do not matter too much.

Figure 9.
RMSE comparison of proposed MB-ResNet and other methods.

Figure 10.
RAE comparison of proposed MB-ResNet and other methods.
Figure 11 presents a comparative analysis of prediction accuracy across three machine learning models—MLP, ResNet, and MB-ResNet—as a function of RAE (relative absolute error) threshold levels. These thresholds are quantitatively set at 0.1, 0.2, 0.3, and 0.4 for the purpose of this evaluation. The prediction accuracy, as defined in this context, refers to instances where the calculated RAE falls below the predetermined threshold, thus deeming the prediction to be accurate. The MB-ResNet model outperforms the other two models at different RAE threshold levels. Notably, the accuracy of MB-ResNet climbs more steeply than do its counterparts with the increase in the RAE threshold and reaches a pivotal point at an RAE threshold of 0.15, achieving approximately 85% accuracy while the accuracy rates of the MLP and ResNet are between 55 and 58%. Although the accuracy rates of the MLP and ResNet increase faster given larger RAE thresholds (e.g., from 10.15 to 0.4), the accuracy rates with the 0.4 RAE threshold are still about 10% lower than that of the MB-ResNet. This suggests that the MB-ResNet is not only more accurate at lower thresholds but also benefits more from a relaxed RAE threshold, a trend that merits consideration for applications where higher tolerance for error is permissible.
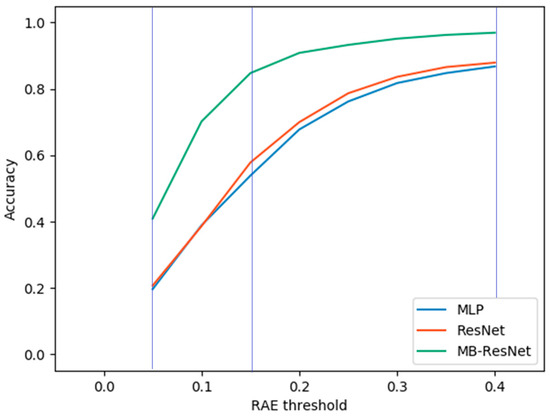
Figure 11.
Increase in accuracy with relaxation of acceptable RAE threshold.
5. Conclusions
In this study, a MB-ResNet learning model was developed to predict airport hourly throughput for non-coordinated busy airports by taking discretized airspace information in the vicinity of the airport as the input. Such information includes convective weather features, a convection indicator, a normal path indicator, and unit traffic flow. The methodology encompassed data acquisition, processing, and the integration of convective weather features to enhance the model’s predictive accuracy. The research steps include the following: first, collecting and decoding Rapid Refresh (RAP) weather data from NOAA; second, developing a multi-branch convolutional neural network (MB-ResNet) model to integrate weather data with airport operational metrics; third, performing rigorous testing and validation of the model using historical data from Hartsfield-Jackson Atlanta International Airport (ATL). The implementation of the developed learning model for the ATL case study demonstrated that the MB-ResNet model, by leveraging RAP weather data and advanced neural network architecture, significantly outperforms traditional predictive models, offering a more accurate and efficient approach to forecasting airport throughput.
Although it is a comprehensive and powerful weather data product, RAP data have not been widely used in aviation research. This study demonstrated that RAP data, after being carefully decoded, cleaned, and pre-processed, can play a significant role in explaining airfield efficiency variation. It was also proven that a few variables can lead to powerful predictiveness if advanced learning models are applied.
ATL was taken as the case study airport, but the learning model can be applied to other busy airports that are not subject to slot coordination as well. Note that for airports in a multi-airport system, interactions among airports must be taken into consideration while developing the MB-ResNet model. Some techniques in the authors’ previous study may be implemented to capture the interactions [13].
The research contributes significantly to air traffic management by improving the predictability and efficiency of the national airspace system. Applying machine learning/deep learning in air traffic management is an area worthy of the attention of aviation researchers. Such advanced artificial intelligence techniques can make use of big data from the aviation sector and improve the predictability of NAS and, consequently, operational efficiency.
Author Contributions
Conceptualization: Y.Z.; methodology, H.F. and Y.Z.; formal analysis: H.F.; data curation: H.F.; writing—original draft: H.F.; writing—review and editing: H.F. and Y.Z.; supervision: Y.Z. All authors have read and agreed to the published version of the manuscript.
Funding
This research received no external funding.
Data Availability Statement
The authors do not have permission to share data.
Acknowledgments
The authors thank the FAA NextGen Office for sponsoring this research through the National Center of Excellence for Aviation Operations Research (NEXTOR III). The views and opinions presented in this publication are solely those of the authors and should not be interpreted as a reflection of those of the FAA or its employees.
Conflicts of Interest
The authors declare no conflicts of interest.
References
- Jacquillat, A.; Odoni, A.R. A roadmap toward airport demand and capacity management. Transp. Res. Part A 2018, 114, 168–185. [Google Scholar] [CrossRef]
- Zhu, R.; Yang, L.; Jiang, Y. Airport Passenger Throughput Forecasting by Using Multi-features Long Short-Term Memory Neural Network. In Proceedings of the 2021 IEEE 3rd International Conference on Civil Aviation Safety and Information Technology (ICCASIT), Changsha, China, 20–22 October 2021. [Google Scholar]
- Li, Y.; Jiang, X. Airport passenger throughput forecast based on PSO-SVR model. IOP Conf. Ser. Mater. Sci. Eng. 2020, 780, 062006. [Google Scholar] [CrossRef]
- Xu, J.; Tian, J.G.; Ma, H.T. New Regional Airport Passenger Throughput Forecast Model Based on Airport Groups. In Proceedings of the 2011 International Conference on Management and Service Science, Wuhan, China, 12–14 August 2011. [Google Scholar]
- Odoni, A.R. A Review of Certain Aspects of the Slot Allocation Process at Level 3 Airports under Regulation 95/93; MIT International Center for Air Transportation (ICAT): Cambridge, MA, USA, 2021. [Google Scholar]
- Kicinger, R.; Chen, J.-T.; Steiner, M.; Pinto, J. Airport capacity prediction with explicit consideration of weather forecast uncertainty. J. Air Transp. 2016, 24, 18–28. [Google Scholar] [CrossRef]
- Cox, J.; Kochenderfer, M.J. Probabilistic airport acceptance rate prediction. In Proceedings of the AIAA Modeling and Simulation Technologies Conference, San Diego, CA, USA, 4–8 January 2016. [Google Scholar]
- Cunningham, J.; Cook, L.; Provan, C. The Utilization of Current Forecast Products in a Probabilistic Airport Capacity Model; Mosaic ATM: Leesburg, VA, USA, 2012. [Google Scholar]
- Kicinger, R.; Cross, C.; Myers, T.; Krozel, J.; Mauro, C.; Kierstead, D. Probabilistic airport capacity prediction incorporating the impact of terminal weather. In Proceedings of the AIAA Guidance, Navigation, and Control Conference, Portland, OR, USA, 8–11 August 2011. [Google Scholar]
- Choi, S.; Kim, Y.J. Artificial neural network models for airport capacity prediction. J. Air Transp. Manag. 2021, 97, 102146. [Google Scholar] [CrossRef]
- Wang, Y. Prediction of weather impacted airport capacity using ensemble learning. In Proceedings of the 2011 IEEE/AIAA 30th Digital Avionics Systems Conference, Seattle, WA, USA, 16–20 October 2011. [Google Scholar]
- Wang, Y. Prediction of weather impacted airport capacity using RUC-2 forecast. In Proceedings of the 2012 IEEE/AIAA 31st Digital Avionics Systems Conference (DASC), Williamsburg, VA, USA, 14–18 October 2012. [Google Scholar]
- Wang, Y.; Zhang, Y. Prediction of runway configurations and airport acceptance rates for multi-airport system using gridded weather forecast. Transp. Res. Part C 2021, 125, 103049. [Google Scholar] [CrossRef]
- Hunter, G. Probabilistic forecasting of airport capacity. In Proceedings of the 29th Digital Avionics Systems Conference, Salt Lake City, UT, USA, 3–7 October 2010. [Google Scholar]
- Buxi, G.; Hansen, M. Generating probabilistic capacity profiles from weather forecast: A design-of-experiment approach. In Proceedings of the USA/Europe Air Traffic Management Research & Development Seminar, Berlin, Germany, 14–17 June 2011. [Google Scholar]
- Provan, C.A.; Atkins, S.C. Tactical airport configuration management. In Proceedings of the 2011 Integrated Communications, Navigation, and Surveillance Conference, Herndon, VA, USA, 10–12 May 2011. [Google Scholar]
- Kuhn, K.D. A methodology for identifying similar days in air traffic flow management initiative planning. Transp. Res. Part C 2016, 69, 1–15. [Google Scholar] [CrossRef]
- Federal Aviation Administration. Performance Analysis Tools. Available online: https://www.faa.gov/about/office_org/headquarters_offices/ato/service_units/systemops/perf_analysis/perf_tools (accessed on 28 December 2023).
- Bayerl, S.P.; Gerczuk, M.; Batliner, A.; Bergler, C.; Amiriparian, S.; Schuller, B.; Nöth, E.; Riedhammer, K. Classification of stuttering–The ComParE challenge and beyond. Comput. Speech Lang. 2023, 81, 101519. [Google Scholar] [CrossRef]
- Utku, A.; Kaya, S.K. Multi-layer perceptron-based transfer passenger flow prediction in Istanbul transportation system. Decis. Mak. Appl. Manag. Eng. 2022, 5, 208–224. [Google Scholar] [CrossRef]
- He, K.; Zhang, X.; Ren, S.; Sun, J. Deep residual learning for image recognition. In Proceedings of the IEEE Conference on Computer Vision and Pattern Recognition, Las Vegas, NV, USA, 27–30 June 2016. [Google Scholar]
Disclaimer/Publisher’s Note: The statements, opinions and data contained in all publications are solely those of the individual author(s) and contributor(s) and not of MDPI and/or the editor(s). MDPI and/or the editor(s) disclaim responsibility for any injury to people or property resulting from any ideas, methods, instructions or products referred to in the content. |
© 2024 by the authors. Licensee MDPI, Basel, Switzerland. This article is an open access article distributed under the terms and conditions of the Creative Commons Attribution (CC BY) license (https://creativecommons.org/licenses/by/4.0/).