Article

Evaluation of Mixing Effect on Coupled Heat Release and Transfer Performance of a Novel Segregated Solid Rocket Motor

1
Science and Technology on Combustion, Internal Flow and Thermo-Structure Laboratory, Northwestern Polytechnical University, Xi’an 710072, China
2
College of Aerospace Science and Engineering, National University of Defense Technology, Changsha 410073, China
*
Author to whom correspondence should be addressed.
These authors contributed equally to this work.
Aerospace 2024, 11(1), 72; https://doi.org/10.3390/aerospace11010072
Submission received: 16 June 2023 / Revised: 12 August 2023 / Accepted: 19 August 2023 / Published: 12 January 2024
(This article belongs to the Special Issue Space Propulsion: Advances and Challenges)

Abstract

:
The effect of mixing on coupled heat release and transfer performance of a novel segregated solid motor is numerically evaluated with a transient two-dimensional combustion model. The results show that vortex structures are formed and evolved in the combustion chamber. Quantitative calculation of the mixing effect shows the inhomogeneous distribution of oxidant and fuel species. The well-mixing area is located in a narrow belt-like coupled combustion region near the burning surface of the propellant. Heat transfer coefficient decreases greatly due to lower combustion reaction rate and enlarged flow channel area. Heat transfer coefficients near the two ends of the propellant grain are higher than other parts due to the influence of vortex mixing. Raising the inlet mass flow rate leads to enhanced mixing and heat transfer, which results in a lower temperature and regression rate of the propellant with combustion time. Temperature and oxidation rates of H2 and CO are unevenly distributed in the boundary layer of coupled combustion. Increasing the mass flux of inlet oxidizer gas leads to a higher combustion heat release rate. Therefore, the gas-phase temperature increases significantly. The heat release rate reaches the maximum near the ends of the propellant grain, where vortex mixing strengthens the coupled combustion process in the motor.

1. Introduction

With the fast progress of aerospace engineering and space exploration, there has been an increasing demand for rocket motors with high energy density, adjustable thrust, and reliable performance. Various rocket motors have been proposed and validated in recent decades. A novel segregated fuel and oxidizer system (SFOS) was proposed by Los Alamos National Laboratory (LANL) in 2016 that separates the solid fuel and oxidizer in a cascade structure and provides high safety for the propulsion of small satellites [1]. Zou et al. [2] proposed a segregated oxidizer/fuel solid motor (SOFSM) in 2021 that is shown in Figure 1. Different from the SFOSM system, both oxidizer and fuel in the SOFSM system are designed for self-sustained combustion. The main advantage of the SOFSM is that both flow rate and thrust regulations can be realized together with multiple starting and shutting down of the motor. Therefore, the SOFSM system provides a promising solution to adjustable and highly safe propulsion systems for space exploration. The heat release characteristics are of great significance to the design optimization and performance evaluation of the SOFSM system and thus draw increasing attention. Considering the similar working principle, the combustion processes in the hybrid rocket motor and ramjet engine provide a valuable reference for the SOFSM. Therefore, these two motors’ mixing and heat release characteristics are reviewed.
For both hybrid rocket motors and solid rocket ramjet motors, the combustion pattern in the combustion chamber and the geometry play a significant role in the combustion and heat release of the coupled combustion between oxidizer and fuel [3]. Chiaverini et al. [4,5] found that heat radiation of gaseous combustion products, e.g., CO2, H2O and CO have a vital effect on the regression rate and heat release of HTPB propellant in a hybrid rocket motor. Research studies reveal that heat release rate and combustion efficiency in solid ramjet motors are mainly affected by the oxidant inflow mode and combustion chamber geometry [6,7,8,9,10,11,12]. Some other studies showed that local heat release rates are maximized when the solid fuel is fully reacted with high-velocity inflow air [13]. Hu [14] found that for rocket-based combined cycle (RBCC), an ejecting rocket’s heat release and combustion efficiency was enhanced with more fuel injected into the front of the combustion chamber. The studies [15,16,17] on micro-combustor showed that the length of the combustion chamber affected combustion efficiency by changing the residence time and thermophysical properties of the reacting species. Some studies [18,19] found that the addition of syn-gas (i.e., H2 and CO) increased the concentration of small radicals and accelerated the propagation velocity of laminar flame. Therefore, the combustion heat release rate was greatly enhanced.
Recent studies on solid fuel ramjet engines showed that increasing the mass flow rate, swirl number, and temperature of the inlet oxidizer gas can improve the heat and mass transfer between the burning surface of the solid fuel and the gas phase region [20,21]. Oxidizer inlet conditions also significantly affect the motor’s regression rate and heat release characteristics [22,23,24]. Numerical simulation of hydrogen-fueled scramjet showed that the combustion chamber cavity caused a high-pressure gradient and significant horizontal flow and strengthened mixing between air and hydrogen, resulting in a higher combustion heat release rate [25].
In summary, the research studies on hybrid rocket motors and solid ramjet motors revealed the important effect of inflow oxidizers on combustion heat release characteristics. They provided a reference for the heat release characteristics of the SOFSM system. However, most current research studies used global reaction mechanisms and a steady combustion model. The temporal and spatial distribution characteristics of heat release of the coupled combustion process of the SOFSM system under mixing and heat transfer are rarely reported [26,27]. The coupled heat release and transfer characteristics are obtained with the dynamic mesh technique in the present study. Compared with the previous combustion model and studies, the interaction between coupled combustion and heat release and transfer is numerically investigated. A dynamic simulation of the coupled combustion process is realized with a two-dimensional transient combustion model. Better insight into the heat release and heat transfer process in coupled combustion in the SOFSM is provided.
A two-dimensional transient combustion model based on a detailed reaction mechanism is used in this study to reveal the heat release characteristics of coupled combustion in the SOFSM system. The impact of different oxidant gas inlet flow rates on the spatial and temporal distribution characteristics of the heat release rate is studied numerically. Mixing and heat release variations between gases under different operating conditions are explored. The intrinsic mechanisms for the regression of the burning surface of the fuel grain are correlated with mixing and heat release. This study aims to provide a better understanding of the micro-scale mechanisms of mixing, heat transfer, and combustion reactions in the SOFSM system.

2. Formulation of the Model

2.1. Conservation Equations

2.1.1. Equations of Gas Phase

The internal flow and heat transfer in the SOFSM is computed by solving the conservation equations using the ANSYS Fluent software. The equations are solved by the semi-implicit method for pressure-linked equations (i.e., SIMPLE) method with second-order precision. The equations of the gas phase are expressed as follows [28].
Conservation of mass equations
ρ t + div ρ U = 0
Conservation of momentum equation,
u x t + div u x u = 1 ρ div μ grad u x + S u x p x u y t + div u y u = 1 ρ div μ grad u y + S u y p y
Conservation of energy equation,
ρ T t + div ρ U T = div λ c p grad T + S T
Additional ideal gas equation of state,
p = ρ R T
where u is velocity, ux, uy are the velocities in x, y direction, respectively, p denotes the pressure, ρ and μ denote the density and dynamic viscosity of the fluid, respectively. cp is the specific heat at constant pressure. R is the gas constant, λ denotes the second molecular viscosity, T represents the temperature and Sux, Suy and ST are the source terms.

2.1.2. Gas-Solid Boundary Conditions

A coupled combustion zone is formed when diffusive mixing occurs between the inflow oxidizer and pyrolysis gas emitted from the solid propellant [29,30]. The heat released from the coupled combustion of oxidizer and fuel in the flow field is transferred to the solid propellant, and the conservation equation at the gas-solid interface is solved.
ρ s r ˙ = ρ g V g
λ g T y = λ s T y s + ρ s r ˙ h T , g h T , s
where r ˙ represents the regression rate of the propellant, ρs represents the density of the propellant, ρg and Vg are the density and velocity of the gas phase, respectively. λg and λs are the thermal conductivity of the gas and solid region, respectively. hT,g is the enthalpy of the gas at temperature T, hT,s is the enthalpy of the solid propellant at temperature T.

2.1.3. Thermal Decomposition Model of Propellant

In the present numerical simulation, the method of equivalent source term [26,27] is used to describe the thermal decomposition of the fuel-rich propellant. The pyrolysis model of the rich fuel is shown in Figure 2. The juxtaposed black rectangles in the figure are a schematic representation of the lowest layer of the grid in the computational grid at the fuel-rich burning surface, whose upper boundary is the propellant-burning surface. The axial spacing of the source term grid is uniform across the whole domain with a width of 5 mm while the total length of the computational domain is 650 mm. In the present study, the source terms of mass, momentum, energy and components are added to the first layer of the grid, pyrolysis products are injected into the combustion chamber through the lower boundary of this layer of the grid.
The source terms related to solid fuel decomposition are shown below,
Mass source term,
S m = m ˙ = ρ s r ˙ A f / V c
where r ˙ is the regression rate of the propellant, ρs represents the propellant density, Af is the surface area of the source term grid at the burning surface, and Vc represents the volume of the source term grid.
Momentum source term,
S x = m ˙ u x / V c = ρ s r ˙ A f u x / V c
S y = m ˙ u y / V c = ρ s r ˙ A f u y / V c
where the symbols have the same meanings in the above equations.
Energy source term,
S E = ρ s r ˙ A f h i / V c
where hi is the reaction heat of decomposition of the i-th species.
Component source term,
S i = ρ s r ˙ A f Y i / V c
where Yi denotes the mass fraction of the i-th gas phase component.

2.1.4. Turbulence Model

Considering the effect of the Reynolds number and the compressibility of shear flow, the standard k-ω turbulence model was widely used [31,32]. Since the present study is mainly concerned with mixing and combustion within the boundary layer, the standard k-ω turbulence model in two-equation form shown as follows is used,
t ρ k + x i ρ k u i = x j Γ k k x j + G k Y k + S k
t ρ ω + x i ρ ω u i = x j Γ ω k x j + G ω Y ω + S ω
where Gk denotes the turbulent kinetic energy; Gω denotes generated by the ω equation; Гk and Гω denote the diffusivity; Yk and Yω are the turbulence terms due to diffusion; Sk and Sω are source terms.

2.2. Combustion Reaction Model

2.2.1. Detailed Reaction Mechanism

The propellant combination used in this study includes AP oxygen-rich gas as an oxidizer and TAGN fuel-rich as fuel. The composition of the AP/TAGN propellants can be found in our previous studies [26,27]. The present study used a mechanism involving 190 elementary reactions and 37 inlet components from a previous study [26]. The mass fractions of the inlet species of the oxidizer and fuel propellant are shown in Table 1.

2.2.2. Regression Rate Model

The Arrhenius rate model is often applied to describe the regression rate in the propellant. Carro demonstrated the feasibility of determining the combustion time by changing pressure during combustion [33]. In this work, the regression rate in Arrhenius form is fitted from experimental data measured in a closed combustion chamber, shown in Figure 3. The time of combustion and the consumed thickness of the propellant are recorded in experiments. The pressure transducer measures the pressure in the high-pressure burner during propellant combustion. By dividing the propellant consumption thickness by the combustion time, the average regression rate of solid propellants is calculated. The combustion time is calculated by monitoring the pressure variation in the high-pressure closed burner during combustion. The final regression rate is obtained by taking the average of three parallel experiments under the same conditions. The burning surface temperature is measured by using a Pt/Rh micro-thermocouple. The calculated regression rates and measured temperatures of the burning surface are fitted into the regression rate model, as shown in Equation (14).
r ˙ = 48.91 exp 21 , 986.4 / R T s
where r ˙ is the regression rate; R denotes the gas constant, Ts denotes the burning surface temperature of propellant. Coupled combustion experiments are conducted under the condition of low flow velocity to modify the regression rate model. Equation (14) is modified using the measured experimental data of regression rate under the effect of inflow oxidizer gas of coupled combustion, and the Equation (15) of the coupled combustion burning surface regression rate is obtained,
r ˙ = 53.23 exp 22 , 976.98 / R T s

2.3. Model Formulation and Boundary Conditions

2.3.1. Physical Model of the Segregated Solid Motor

The physical model for the coupled combustion of TAGN-based propellant is shown in Figure 4. The combustion chamber length L = 650 mm. The TAGN-based propellant length is 400 mm. The radius of the oxidant gas phase inlet is 12 mm. The radius of the outlet of the combustion chamber is 44 mm. The source term method is used to simulate the decomposition process of TAGN-based propellant. Figure 4 shows the schematic coupled combustion process of the high-temperature inlet oxidizer and the solid propellant. TAGN-based solid propellant pyrolysis process produces fuel-rich gas mixed with a high-temperature inlet oxidizer reaction, forming a high-temperature coupled combustion region. The decomposition of the solid propellant continuously generates fuel-rich gas species. As a result of the coupled combustion, the solid phase is heated up. The heat feedback from the gas phase accelerates the propellant regression. Fuel gas species are transported from the burning surface to the gas phase region. The heat and mass transfer in the coupled combustion region are in opposite directions and are affected by flow and mixing processes.

2.3.2. Boundary Conditions for Numerical Simulation

This study considers the mixing and reaction between the AP-derived oxygen-rich gas species and the TAGN-derived fuel-rich gas species based on a two-dimensional coupled combustion model. A mass flow rate inlet with zero radial velocity is used for the oxidizer gas. The equivalent source term method describes the decomposed fuel gas entering the gas-phase mainstream. The source terms of mass, momentum, energy, and components are added by compiling and loading a user-defined function (UDF) file. A slip-free adiabatic wall surface is used for the wall boundary condition. The combustion chamber outlet is set as a pressure outlet, where pressure is calculated using a UDF file specifically written for the combustion.

2.3.3. Cases and Conditions for Numerical Simulation

Since the previous studies revealed the importance of oxidizer mass flux on the combustion of hybrid or solid ramjet motors, thus the impact of varying oxidizer inlet mass flux on combustion and heat release characteristics of the SOFSM is investigated in this study. The mass flux of oxidizer gas, Gox, is varied from 200 kg/(m2·s) to 400 kg/(m2·s), which has been used in our previous experimental study on small propulsion systems [26]. The initial temperature of the oxidant, pressure and diameter of the oxidizer inlet is kept constant in the numerical simulations.

3. Results and Discussion

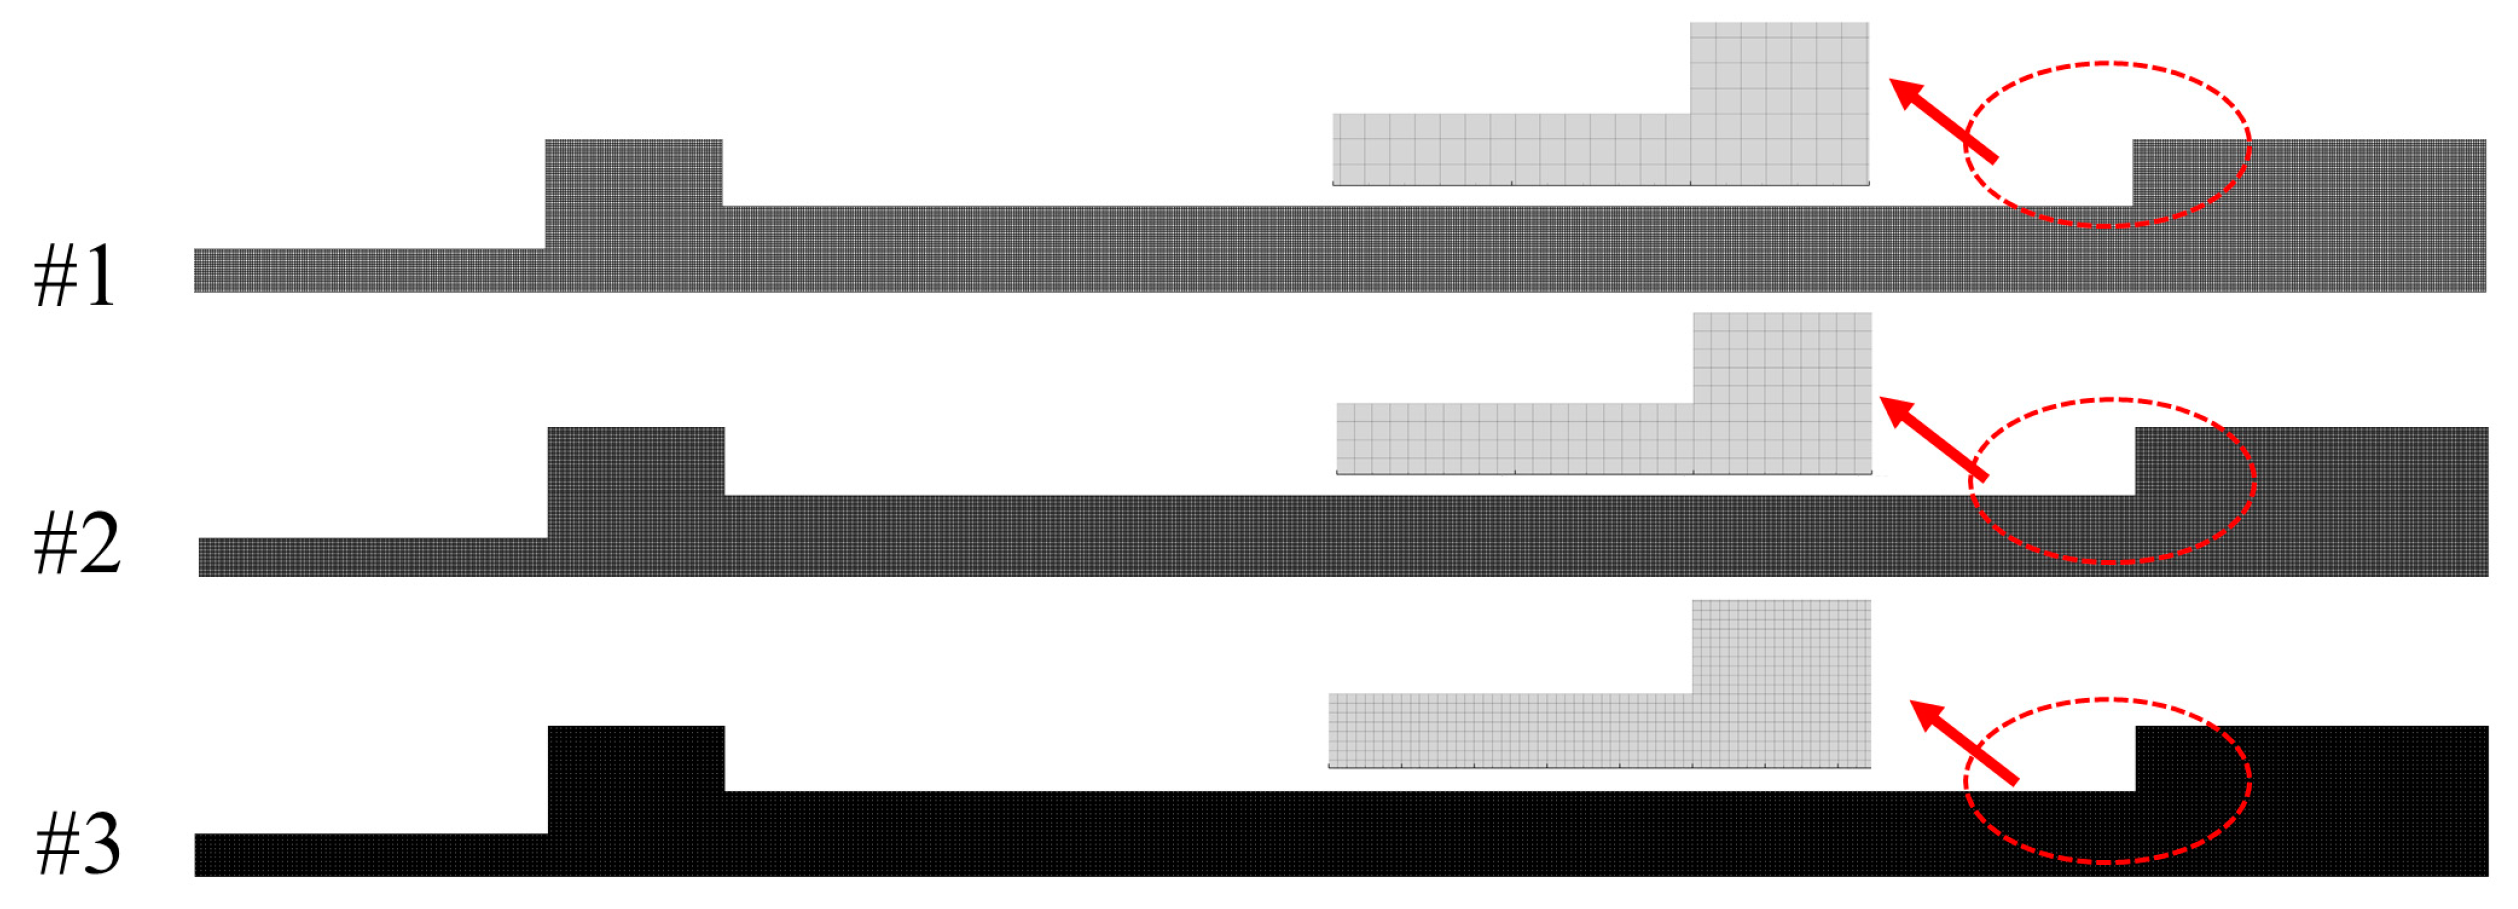
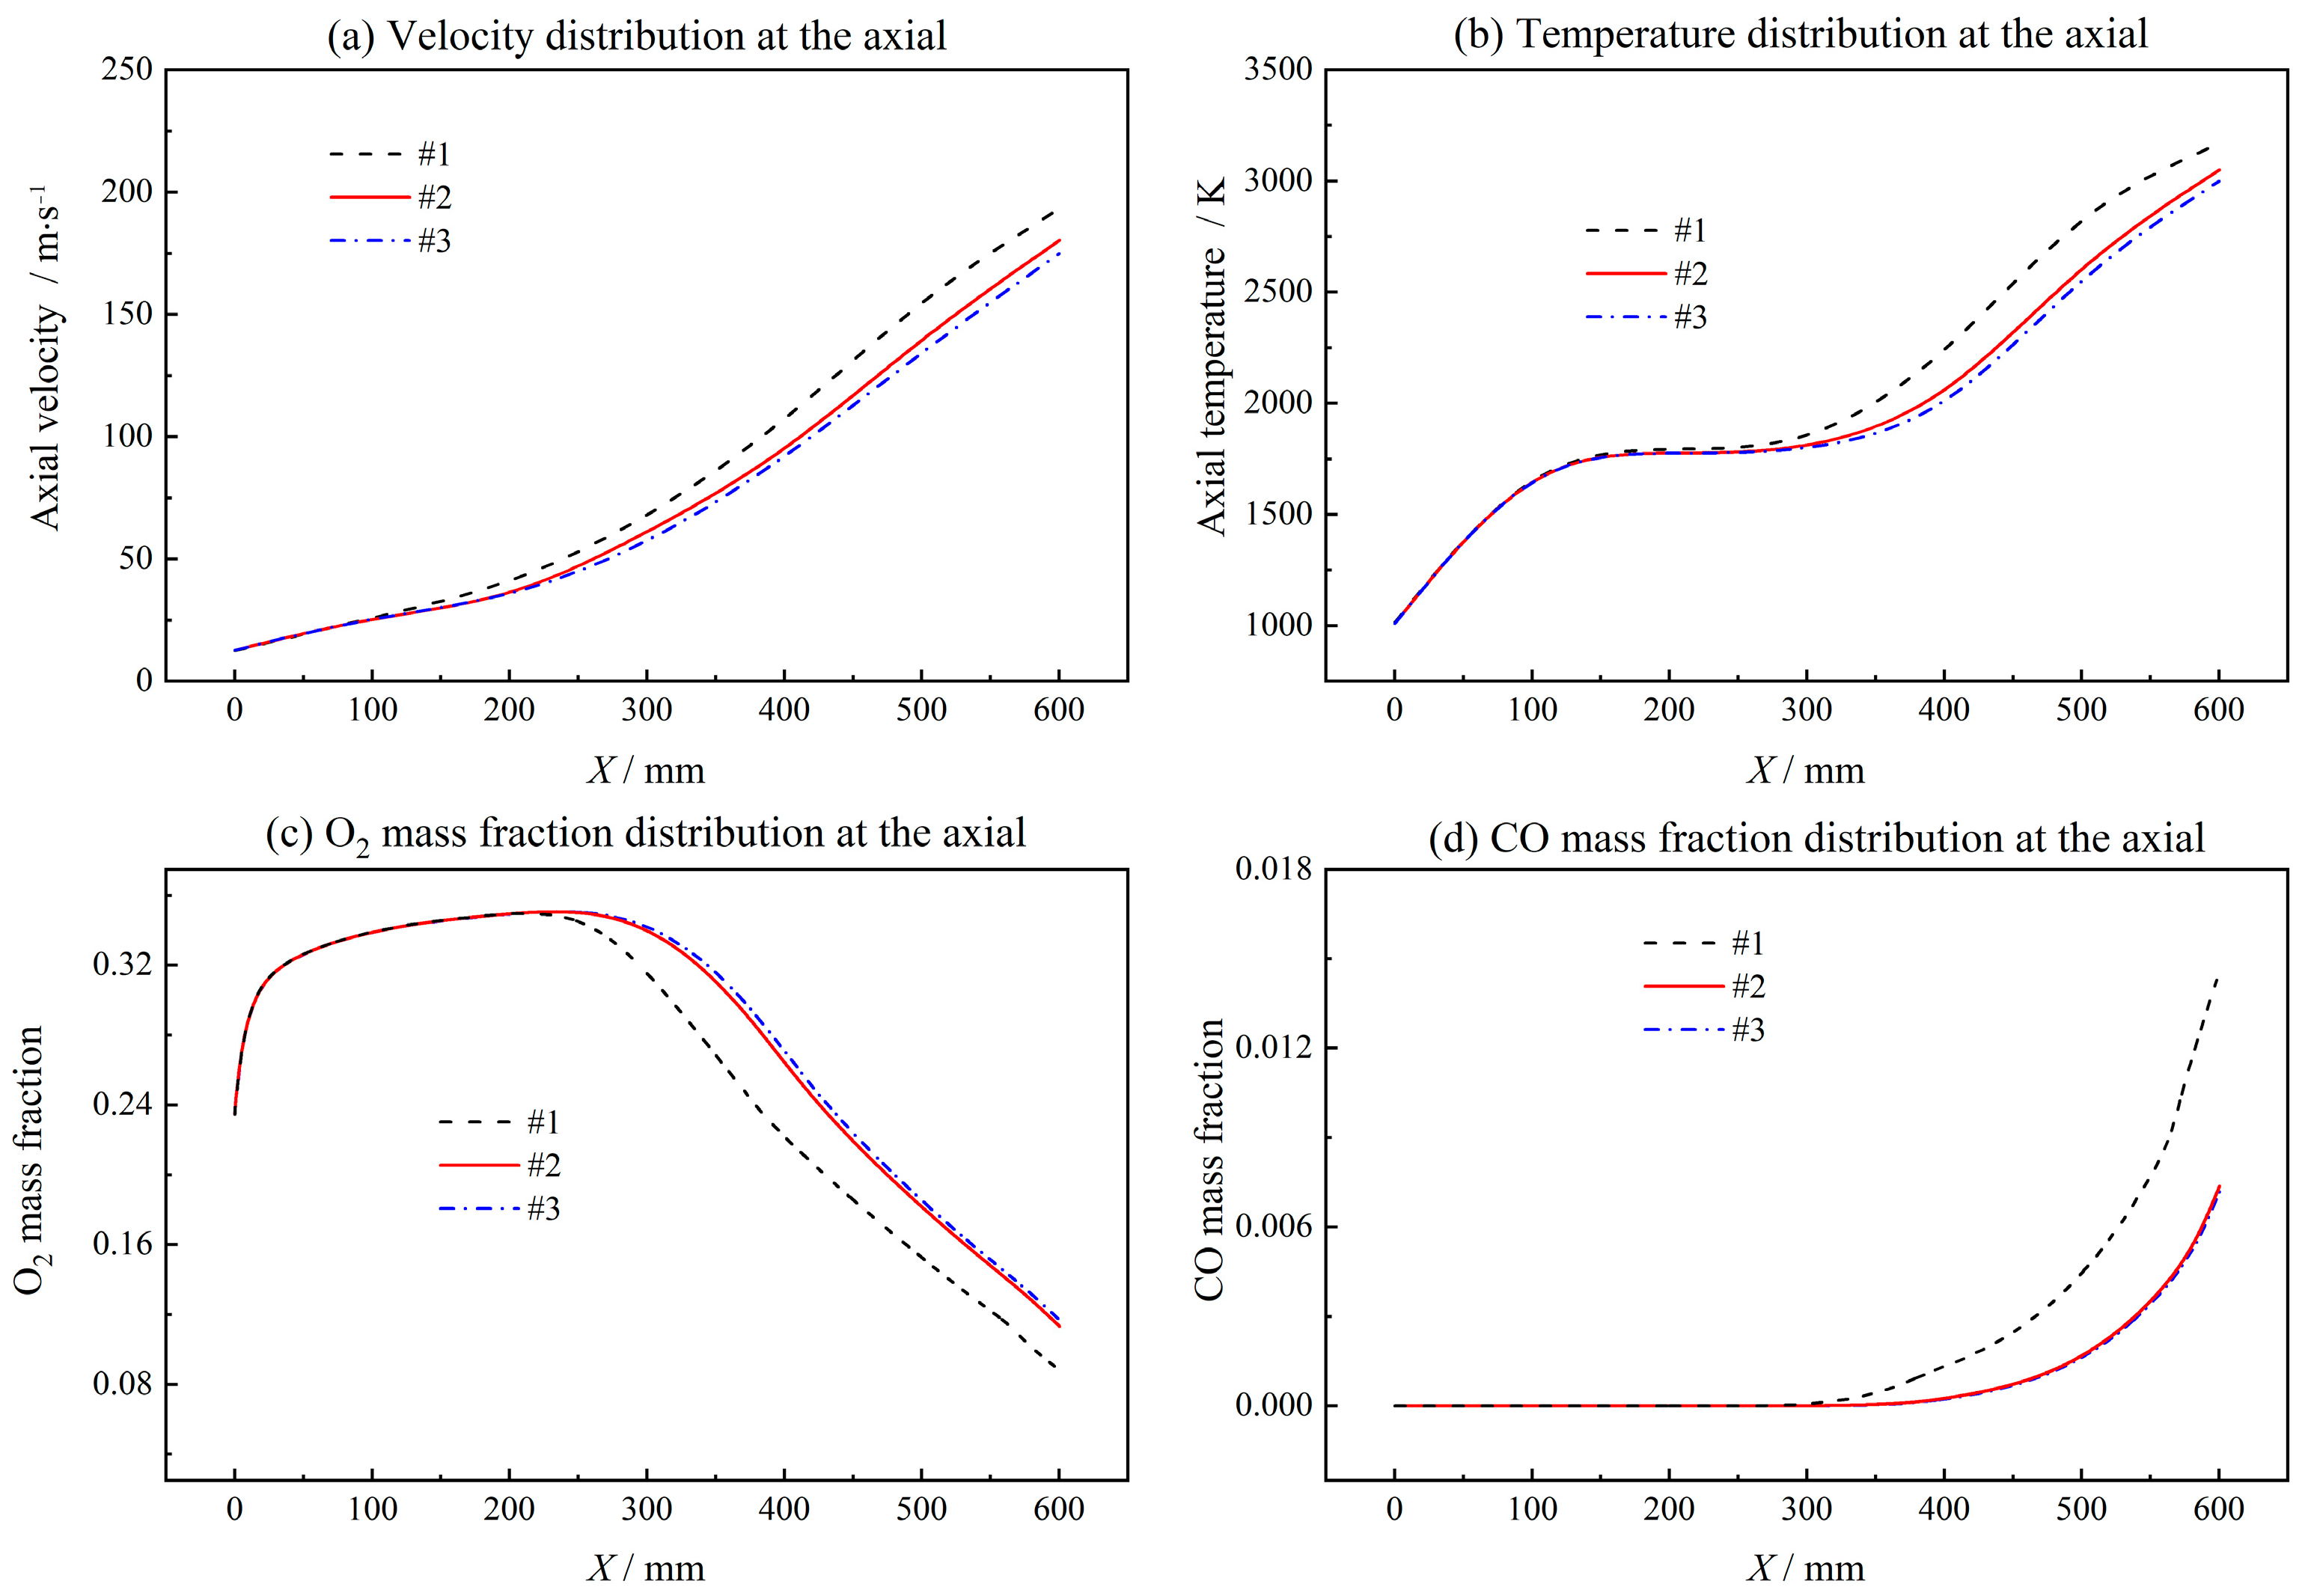
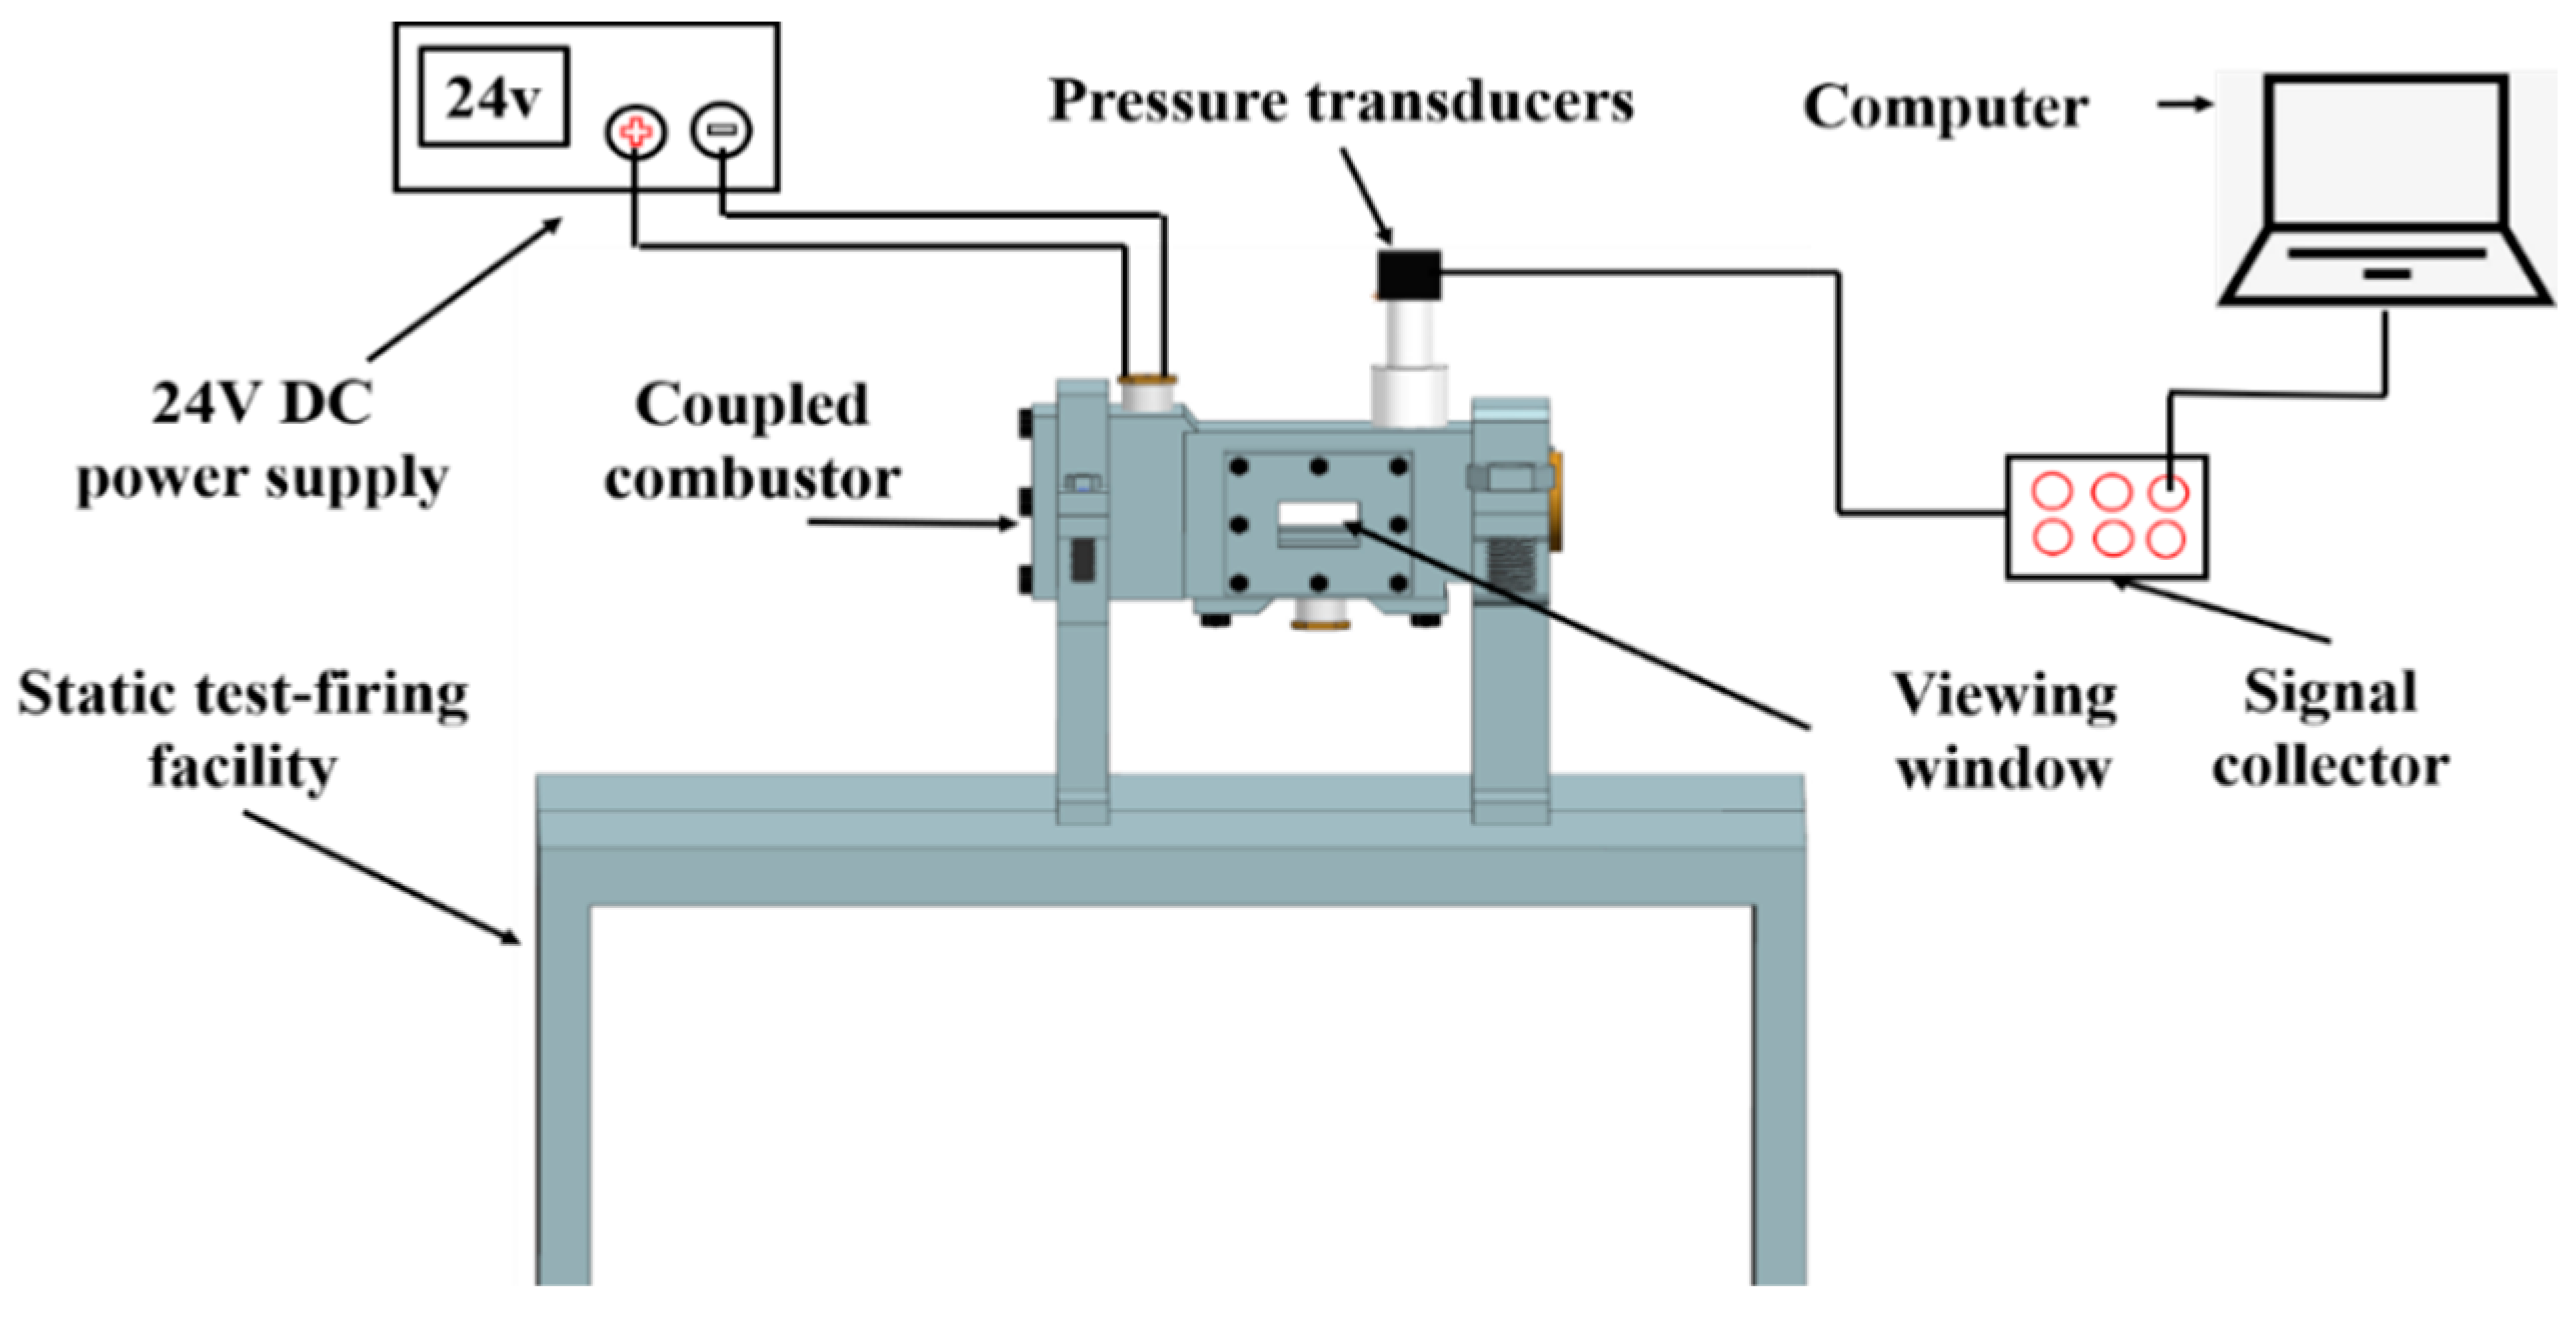
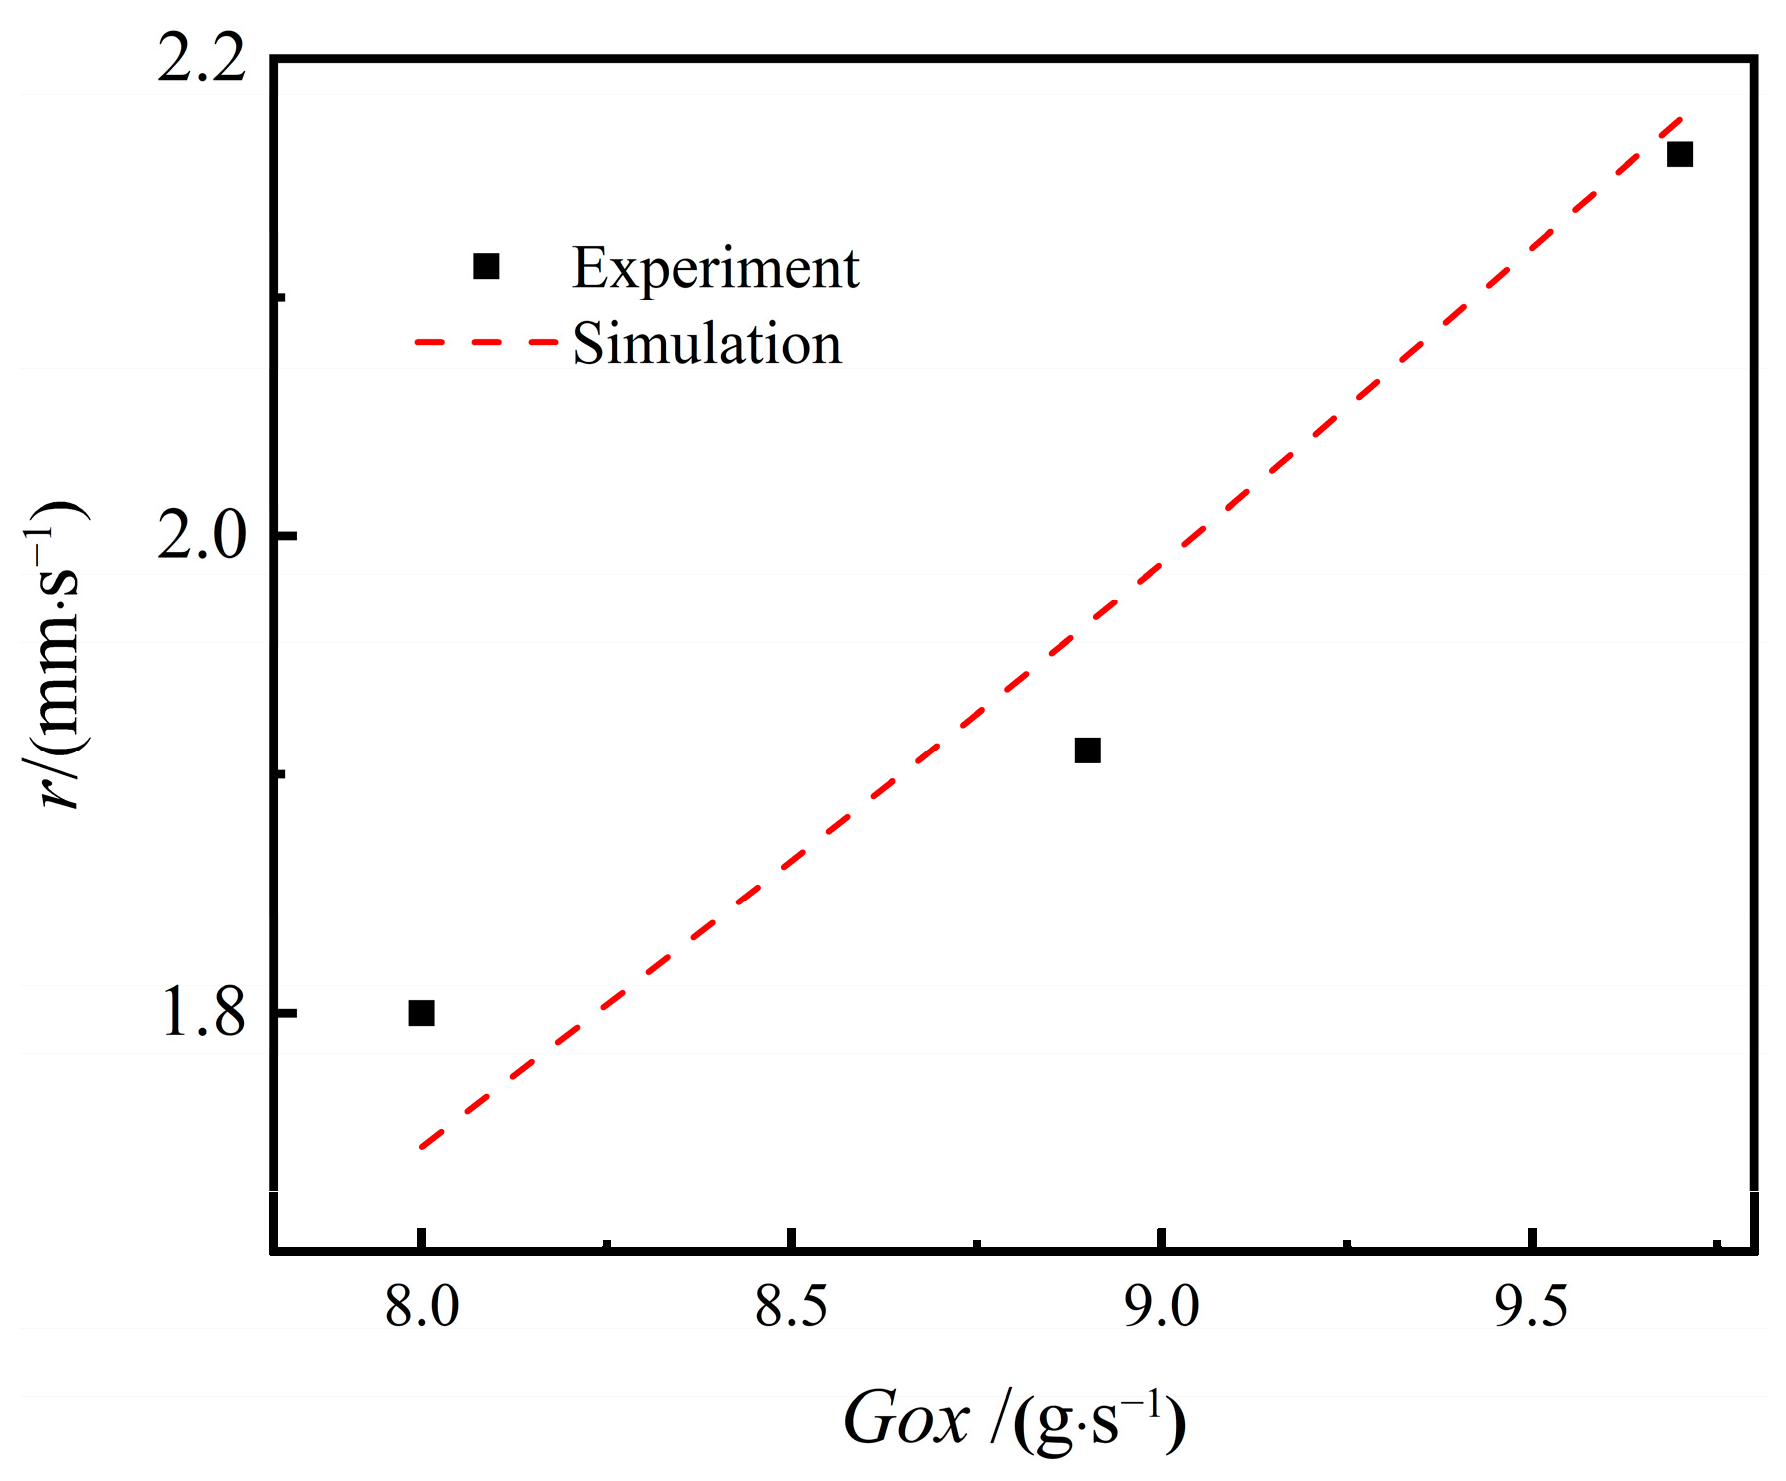
3.1. Model Verification

A two-dimensional unstructured grid is adopted in the present study. Grid independence is verified for three groups of grids shown in Figure 5 with grid numbers 33,213, 100,083, and 273,726, respectively. The flow velocity, temperature, O2 mass fraction and CO mass fraction obtained with three different grids at the symmetry axis of the combustor are shown in Figure 6. With the increase in grid number, the results are in good agreement. Grids #2 and #3 show excellent consistency in flow velocity, temperature, O2 mass fraction and CO mass fraction distribution. The maximum relative deviation is 3.4% for temperature, 4.2% for velocity, 3.5% O2 mass fraction and 2.8% CO mass fraction. Therefore, considering the calculation accuracy and efficiency, grid #2 is used as the calculation grid in the following simulations.
To test the reliability of the regression rate model, combustion tests under low flow velocity conditions were carried out on the coupled-combustion experimental facility in Figure 7. The coupled combustion reactor in Figure 7 mainly consists of an oxidizer gas generator and a fuel-rich combustion chamber. During the experiment, the AP-based propellant in the gas generator was ignited to generate a high-temperature oxygen-rich gas mixture, whose mass flow rate was regulated by adjusting the area of the burning surface and pressure of the gas generator. The mass flow rate of the high-temperature oxidizer-rich gas was determined based on mass conservation using the consumed mass of the AP-based propellant, which was calculated with the regression rate, the burning surface area and the density of the propellant based. The regression rate of the rich fuel was determined by dividing the consumed height of propellant grain by the combustion time, which was determined with the pressure plot obtained in the combustion experiments. Table 2 shows the experimental cases and results. The pressure of the combustion chamber was stable, with the inlet mass flow rate of oxidizer gas increasing from 8.00 g/s to 9.70 g/s. The simulated regression rates are compared for different oxidant inlet mass flow rates and pressures. The experimental regression rates were obtained using the method stated above in Section 2.2.2 Regression rate model. Figure 8 shows the simulated regression rates in comparison with the experimental results. The simulation and experimental results are in excellent agreement, with a maximum error of 3.11%. It is found that the regression rate model shown in Equation (15) is sensitive to the inlet mass flow rate of the oxidizer gas. Except for the case of a mass flow rate of 8.00 g/s, the numerically predicted regression rates are slightly higher than the experimental results. For low mass flow rate, as the mixing and heat transfer is weak, the experimental results are higher than the predicted regression rate. However, by increasing the mass flow rate of the oxidizer gas, the mixing and reaction of the oxidizer gas and the fuel-rich gas are enhanced. Therefore, the regression rate of the numerical simulation is slightly higher than that obtained from experiments.

3.2. Flow and Heat Transfer Characteristics

The transient flow and mixing characteristics are analyzed for different inlet mass fluxes. Figure 9 shows the temperature distribution throughout the flow field with the inlet mass flux of the oxidizer gas varying between 200 kg/(m2·s) and 400 kg/(m2·s). At the initial stage of combustion, i.e., t = 0.6 s, the high-temperature region, i.e., the belt-like coupled combustion region, is located near the burning surface. With the regression of the burning surface, the high-temperature region gradually moves away from the propellant grain. The coupled combustion zone area expands rapidly and stabilizes after t = 1.8 s. With Gox increasing from 200 kg/(m2·s) to 400 kg/(m2·s), there is an obvious re-development region at the end of the high-temperature coupled-combustion region, which gradually moves toward the exit of the combustion chamber with time. This is because vortex structures are formed near the ends of the propellant grain as the mass flux of the oxidizer increases. The re-development region enhances mixing and combustion in the post-combustion chamber.
Figure 10 shows the effect of oxidizer gas mass flux variation on transient velocity distribution. As the burning time increases, more gaseous products are generated, which increases the volume flow rate in the internal flow field. Therefore, flow velocity increases gradually with combustion time. With the mass flux of the oxidizer increasing from 200 kg/(m2·s) to 400 kg/(m2·s), velocity near the oxidizer inlet increases significantly. In the case with Gox = 400 kg/(m2·s), the axial velocity first decreases till the middle of the burning surface. Then it increases as the coupled combustion process generates more gaseous products.
It should be noted that there exist vortex structures in both the pre- post-combustion chambers. As combustion time increases, the vortex in the pre-combustion chamber is split up into two smaller vortexes, while the vortex in the post-combustion chamber becomes larger and closer to the exit of the combustor. The formation and evolution of vortex structures strengthen local mixing and combustion near the two ends of the propellant grain. However, the inhomogeneity of the combustion and heat release characteristics of the coupled combustion process is strengthened.
In the present study, the mixing effect and the ratio of oxidant to fuel are characterized by mixing degree, Im and oxidant richness index, rO/F, respectively. Im = 1.0 means perfect mixing, while Im = 0 represents the worst mixing condition. In addition, rO/F is 0.5 representing adequate mixing of oxidizer and fuel gas. The detailed definitions of mixing degree and oxidizer richness index can be found in our previous study [27]. Either the smaller or larger value of the oxidizer richness index means incomplete combustion. Figure 11 shows the transient distribution of Im in the combustion chamber. It is found that there exists a belt zone with the highest mixing degree. In the flow direction, the mixing degree increases as the mixing process is improved. As the combustion progresses, the belt region expands but moves away from the burning surface. With oxidant mass flux increasing from 200 kg/(m2·s) to 400 kg/(m2·s), the mixing degree becomes higher.
Meanwhile, the belt-like region with the highest mixing degree moves towards the burning surface of the propellant grain. The analysis shows that the mixing between oxidizer gas and fuel gas is enhanced at a higher mass flux of oxidizer gas. The coupled combustion process is thus significantly strengthened.
Figure 12 shows the transient variation of oxidizer richness index, rO/F at different mass flux of oxidizer gas. For fixed mass flux of oxidizer gas, the region with oxidizer richness index, rO/F close to 0.5 becomes larger with the increase of combustion time. It is noteworthy that the effect of inlet oxidizer mass flux on oxidizer richness index distribution is different for different combustion stages. For the initial combustion stage, the region with ideal rO/F = 0.5 is larger for Gox = 200 kg/(m2·s) than Gox = 400 kg/(m2·s). However, for the medium to final combustion stage, increasing the inlet mass flux of oxidizer gas results in better distribution of the ideal oxidizer richness index, which means the oxidant to fuel ratio is closer to the stoichiometric value for complete combustion. The different distribution of oxidizer richness index, rO/F shows the complex interaction between flow and combustion reactions.
Based on the energy balance at the burning surface, the thermal feedback from the gas phase to the propellant grain is considered in the burning surface heat flux, calculated using Equation (16). Considering the heat flux continuity throughout the gas and solid phases, the convective heat flux is equal to the heat flux via heat conduction. Therefore, the convective heat transfer coefficient is calculated using Equation (17).
q = h(TfTs)
h = λ T f T s T y
where Tf and Ts are temperatures of fluid and solid surface, respectively, h represents the heat transfer coefficient, ∂T/∂y represents the gradient of fluid temperature normal to the burning surface, λ represents the thermal conductivity of the fluid, h is the heat transfer coefficient.
The influence of the mass flux of oxidizer gas on the axial distribution of heat transfer coefficient at different combustion times is shown in Figure 13. It is found that heat transfer coefficients at the two ends of the propellant are higher than those in the middle part of the propellant. This can be explained by the vortex structures formed at the pre-and post-combustion chambers. Observing Figure 10, it can be found that large vortex structures are formed near the ends of the propellant, which enhances the heat transfer process. As the combustion progresses (i.e., t = 0.6 s to t = 2.4 s), the heat transfer coefficient decreases substantially. In addition, Figure 13a shows that the heat transfer coefficient varies very slightly after t = 1.2 s for Gox = 200 kg/(m2·s). This is because for low inlet mass flux of oxidizer gas, the combustion reaction and heat release rate decay fast with combustion time.
For Gox = 400 kg/(m2·s), the average heat transfer coefficient is much higher than that at Gox = 200 kg/(m2·s). Particularly, the distribution of the heat transfer coefficient across the burning surface becomes highly non-uniform. Figure 11 and Figure 12 show that higher mass flux causes a better mixing effect between gaseous species. The local convective heat transfer near the vortex structures is thus enhanced. Similarly, Figure 13b shows heat transfer coefficient decreases significantly with combustion time as combustion reaction rates decay with the consumption of oxidizer gas.
Moreover, the expanding flow channel area leads to lower flow velocity near the burning surface, convective heat transfer thus decreases greatly. Figure 14 shows the average heat transfer coefficient variation at different oxidizer mass flux and times. The heat transfer coefficient is obtained by taking the average of the heat transfer coefficient along the flow direction. It can be seen that there is an intersection point at t = 1.2 s. Before t = 1.2 s, increasing oxidizer mass flux results in a higher heat transfer coefficient. However, heat transfer coefficient decreases after t = 1.2s. As mentioned above, the decreasing reaction rate and expanding flow channel area leads to heat transfer deterioration at late stage of the coupled combustion process.

3.3. Combustion and Heat Release Characteristics

In the coupled combustion process of the segregated solid motor, the fuel-rich propellant is heated up by gas-phase combustion heat and thermal decomposition heat. Therefore, the temperature and regression rate of the burning surface reflects the combustion heat release characteristics. Figure 15 shows the impact of inlet mass flux on the burning surface temperature and regression rate at different combustion times. The temperature and regression rate are obtained by taking averages along the burning surface. Figure 15a shows that for a fixed time, the burning surface temperature (Ts) increases with the mass flux of inlet oxidant gas. However, as the combustion progresses, the Ts gradually decreases as the combustion reaction rate is slowed down in the late stage of regression. Figure 15b shows the variation trend of the regression rate of the burning surface, which is similar to that of the temperature of the burning surface. Remarkably, the increase of Gox leads to a slower temperature and regression rate decrease. Since the pyrolysis of the TAGN-based fuel-rich propellant is partially driven by combustion heat from gas-phase combustion, the analysis indicates the increase of Gox is beneficial in enhancing coupled combustion processes.
Figure 16 presents the impact of oxidizer mass flux on the gas-phase temperature sampled at different four positions along the flow direction. As discussed above in Figure 9, the high-temperature region is mainly located in a belt-like coupled combustion region. The maximum gas phase region temperature is thus obtained by taking the maximum temperature in the radial direction of the belt-like region. Figure 16a shows that the maximum gas phase region temperature Tf increases rapidly before t = 1.6 s and reaches a stable value as the combustion progresses (i.e., t = 1.6 s to t = 2.4 s). Due to the entrainment effect of the vortex structure, the temperature difference is obvious at X = 150 mm, i.e., at the left end of the propellant. As the sampling distance increases from X = 150 mm to X = 550 mm, more combustion heat is released, so gas-phase reactions are accelerated. Therefore, the effect of Gox on gas phase region temperature distribution is weakened. It can also be found from Figure 16 that temperature distribution along the flow direction is quite unevenly distributed. The results agree well with the non-uniform distribution of burning surface temperature and regression rate, as shown in Figure 15. As shown in Figure 17, vortex structures are formed near the front end of the propellant grain. At the initial combustion stage, i.e., t = 0.6 s, the velocity streamlines distribution varies slightly. However, for the late combustion stage, i.e., t = 1.8 s, with the proceeding of the combustion process, the flow field varies significantly for different mass fluxes of oxidizer. With the increase of oxidizer mass flux, residence time and mixing time between oxidizer and fuel species are shortened, resulting in weakened vortex structures, as shown in Figure 17. Therefore, the flame temperature of the gas phase decreases with the increase of mass flux of the oxidizer.
The previous discussion shows that the coupled combustion in the transient flow field is stable after t = 1.6 s. Therefore, Figure 18 shows the radial distributions of O2, CO2 and maximum gas phase region temperature of gas-phase sampled at t = 1.8 s and X = 350 mm, i.e., the middle of the solid propellant grain. Due to the mixing and consumption of O2 with fuel gas species generated by the fuel-rich TAGN propellant, the mass fraction of O2 gradually decreases along the radial direction. Meanwhile, the mass fraction of CO2 and gas phase region temperature at this location first increases to the maximum and then gradually decays. With increasing inlet oxidizer mass flux, the O2 content in the bulk flow increases resulting in higher CO2 content in the gas phase. The results indicate that increasing inlet oxidizer mass flux provides more sufficient oxidizer species and better mixing with fuel gas species. The chemical reactions in this region are more intense to release more heat. Therefore, the maximum gas phase region temperature, Tf as shown in Figure 18, increases significantly with the mass flux of inlet oxidant.
Figure 19 and Figure 20 show the reaction rate distribution of two typical oxidation reactions of H2 and CO, i.e., R-8 (H2 + OH = H2O + H) and R-27 (CO + OH = CO2 + H) in Y direction with X = 350 mm. It can be seen that both R-8 and R-27 reaction rates decrease with combustion time as oxygen is consumed. With the mass flux of oxidant increasing from Gox = 200 kg/(m2·s) to Gox = 400 kg/(m2·s), the reaction rates of R-8 and R-27 increase significantly at t = 0.6 s. For t = 1.2 s to t = 2.4 s, the oxidation reaction rates hardly vary with the increase of Gox. This is because, with the progress of combustion, the oxidizer gas is consumed very fast. As shown in Figure 21, the concentration of O2 quickly decreases while the concentration of CO increases due to the lowered oxidation rate with combustion time. The variations of O2 concentration and oxidation reaction rate directly affect the heat release rate of coupled combustion. To analyze heat release characteristics of coupled combustion reactions of AP/TAGN segregated solid motor, the rate of combustion heat release of coupled combustion is defined as follows,
qr = ηQch/V
where qr represents the heat release rate, η is the fuel gas conversion, Qch is the combustion reaction heat, V is the volume of the combustion chamber.
Figure 22 indicates that the heat release rate in the coupled combustion region fluctuates greatly along the flow direction at t = 0.6 s. The maximum heat release rate appears near the left end of the propellant. In addition, oxidizer gas concentration is also high at this position. Figure 22 shows heat release rate is not evenly distributed along the flow direction due to the non-uniform temperature and O2 concentration. With the increase of combustion time (i.e., t = 0.6 s to t = 2.4 s), the heat release rate of the gas-phase reaction decays rapidly as the combustion reaction rate is slowed down.
Meanwhile, the heat release rate distribution near the left end of the propellant grain becomes flat due to the consumption of oxidizer species. For combustion time at t = 1.2 s and t = 1.8 s, the impact of vortex mixing in the post-combustion chamber is still important. Therefore, the heat release rate in the post-combustion chamber is higher than in other part of the combustor because of the enhanced mixing and combustion processes. However, for combustion time t = 2.4 s, as discussed above in Figure 15, the temperature and regression rate of the burning surface decrease to a very low level. The heat release rate thus decreases significantly with a relatively even distribution along the flow direction.
Figure 23 shows the impact of the inlet mass flux of oxidizer gas, Gox on the mass fraction of O2 and CO with combustion time t = 1.8 s. As Gox increases, the mass fraction of O2 increases throughout the combustion chamber, while the mass fraction of CO decreases greatly. The results show that the oxidation rate of CO is accelerated by enhanced mixing and higher concentration of O2. Therefore, the combustion heat release rate is also enhanced. As shown in Figure 24, with the inlet mass flux increasing from Gox = 200 kg/(m2·s) to Gox = 300 kg/(m2·s), the combustion heat release rate increases significantly, particularly in the pre- post-combustion chambers due to the formation and expansion of the vortex structures. However, with the inlet mass flux increasing from Gox = 300 kg/(m2·s) to Gox = 400 kg/(m2·s), the heat release rate varies slightly. The main difference in heat release rate for Gox = 300 kg/(m2·s) and Gox = 400 kg/(m2·s) lies near the left end of the propellant, which is mainly affected by vortex structures in the pre-combustion chamber. The combustion heat release rate is much higher in the pre-combustion chamber than in other parts. This is mainly because the concentration of O2 is higher in the pre-combustion chamber. Moreover, species mixing between oxygen and fuel gas is also better in the pre-combustion chamber.

4. Conclusions

Heat release characteristics in coupled combustion processes are numerically investigated, and the effect of the vortex structure on heat release and the effect of oxidizer flux variations on heat transfer coefficients and reaction rates are revealed. Compared with the steady combustion model proposed by previous scholars, the two-dimensional transient combustion model based on a detailed reaction mechanism is established in this paper, which provides an intuitive description of the real-time changes of the flow field during the coupled combustion process. Heat release characteristics, heat transfer coefficients and reaction rates other parameters also show different changes with the regression of the burning surface. The numerical simulation based on this model provides better insight into the dynamic coupled heat release and transfer process under the influence of coupled combustion. A better understanding of the micro-combustion mechanism of SOFSM is obtained. The main conclusions are as follows.
1.
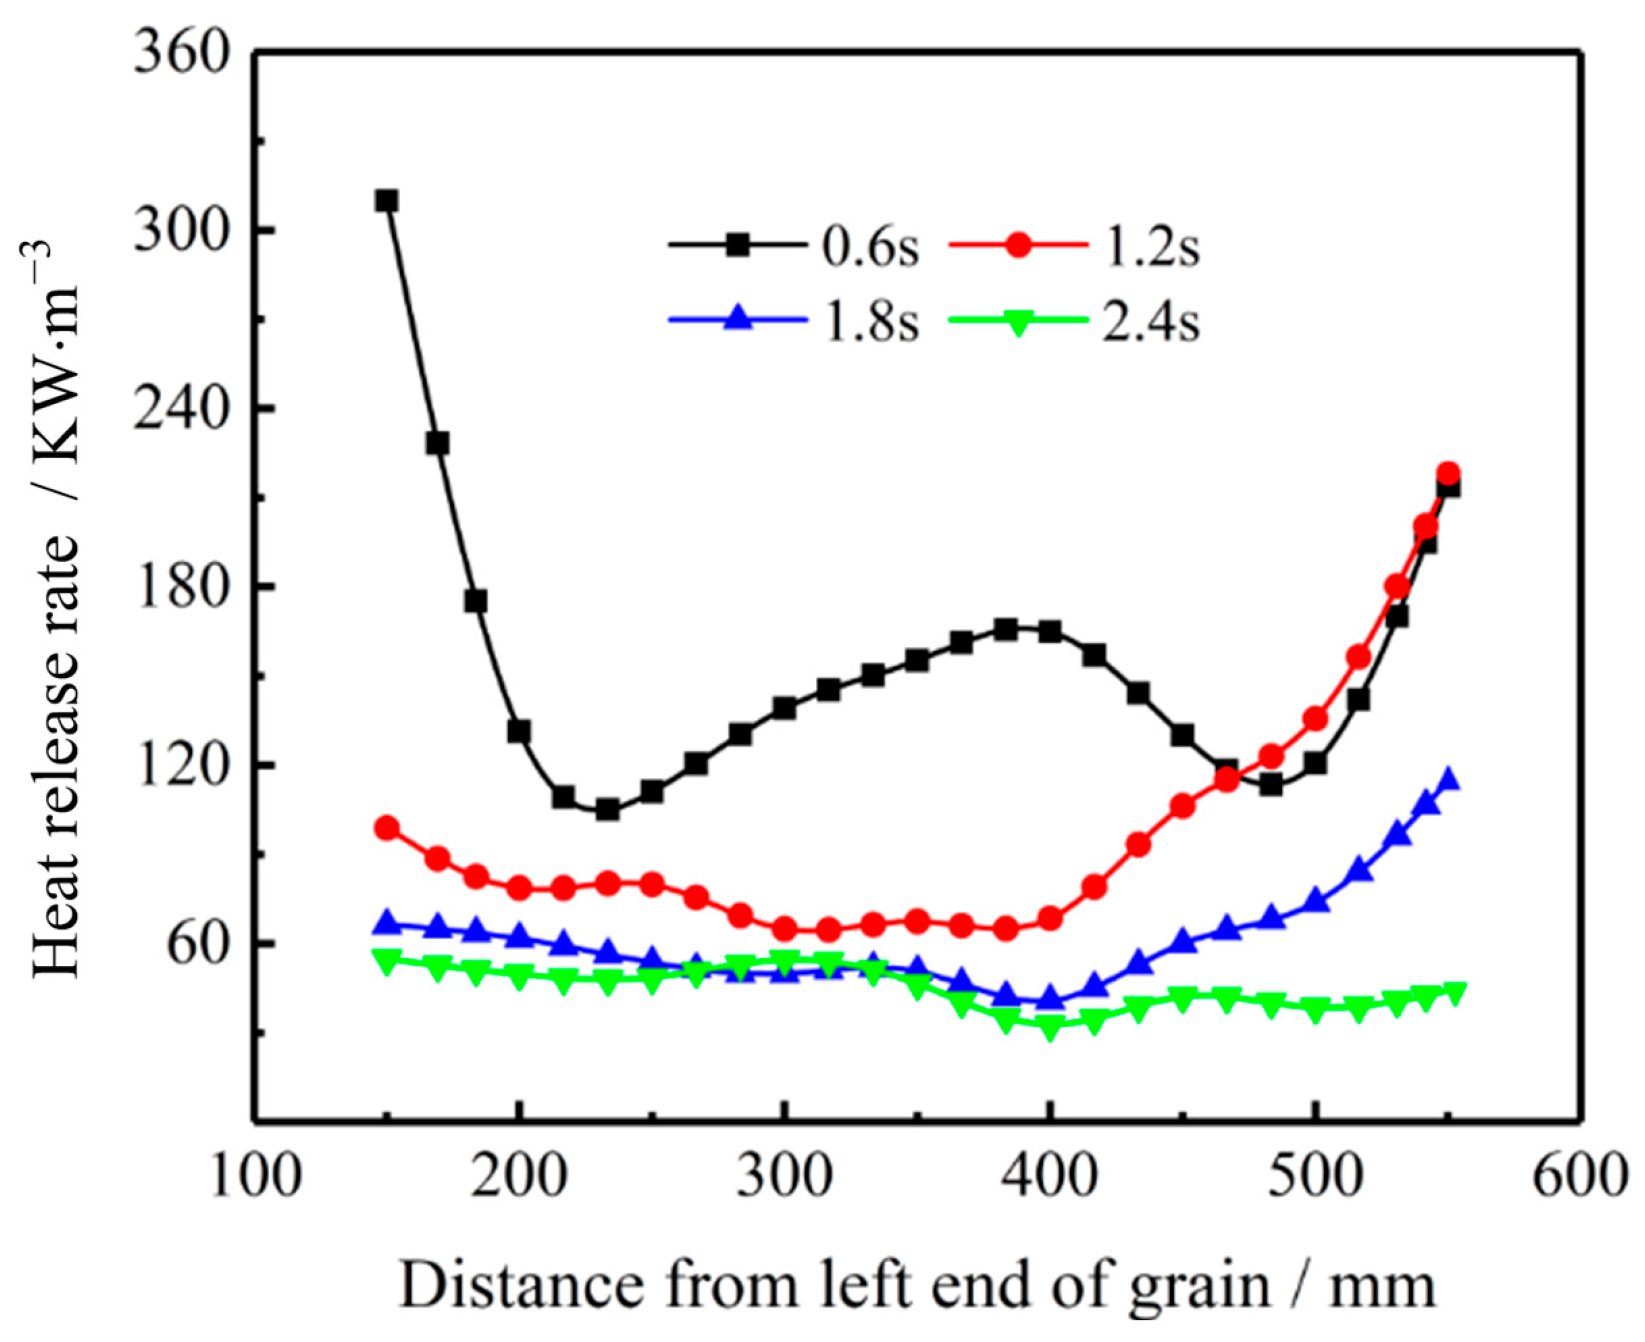
Vortex structures are formed and evolved in the pre-post-combustion chambers. The formation and evolution of the vortex structures enhance the local mixing and combustion reactions through the combustion chamber. However, the non-uniformity of heat release rate distribution is also exacerbated by the re-developed vortex structures.
2.
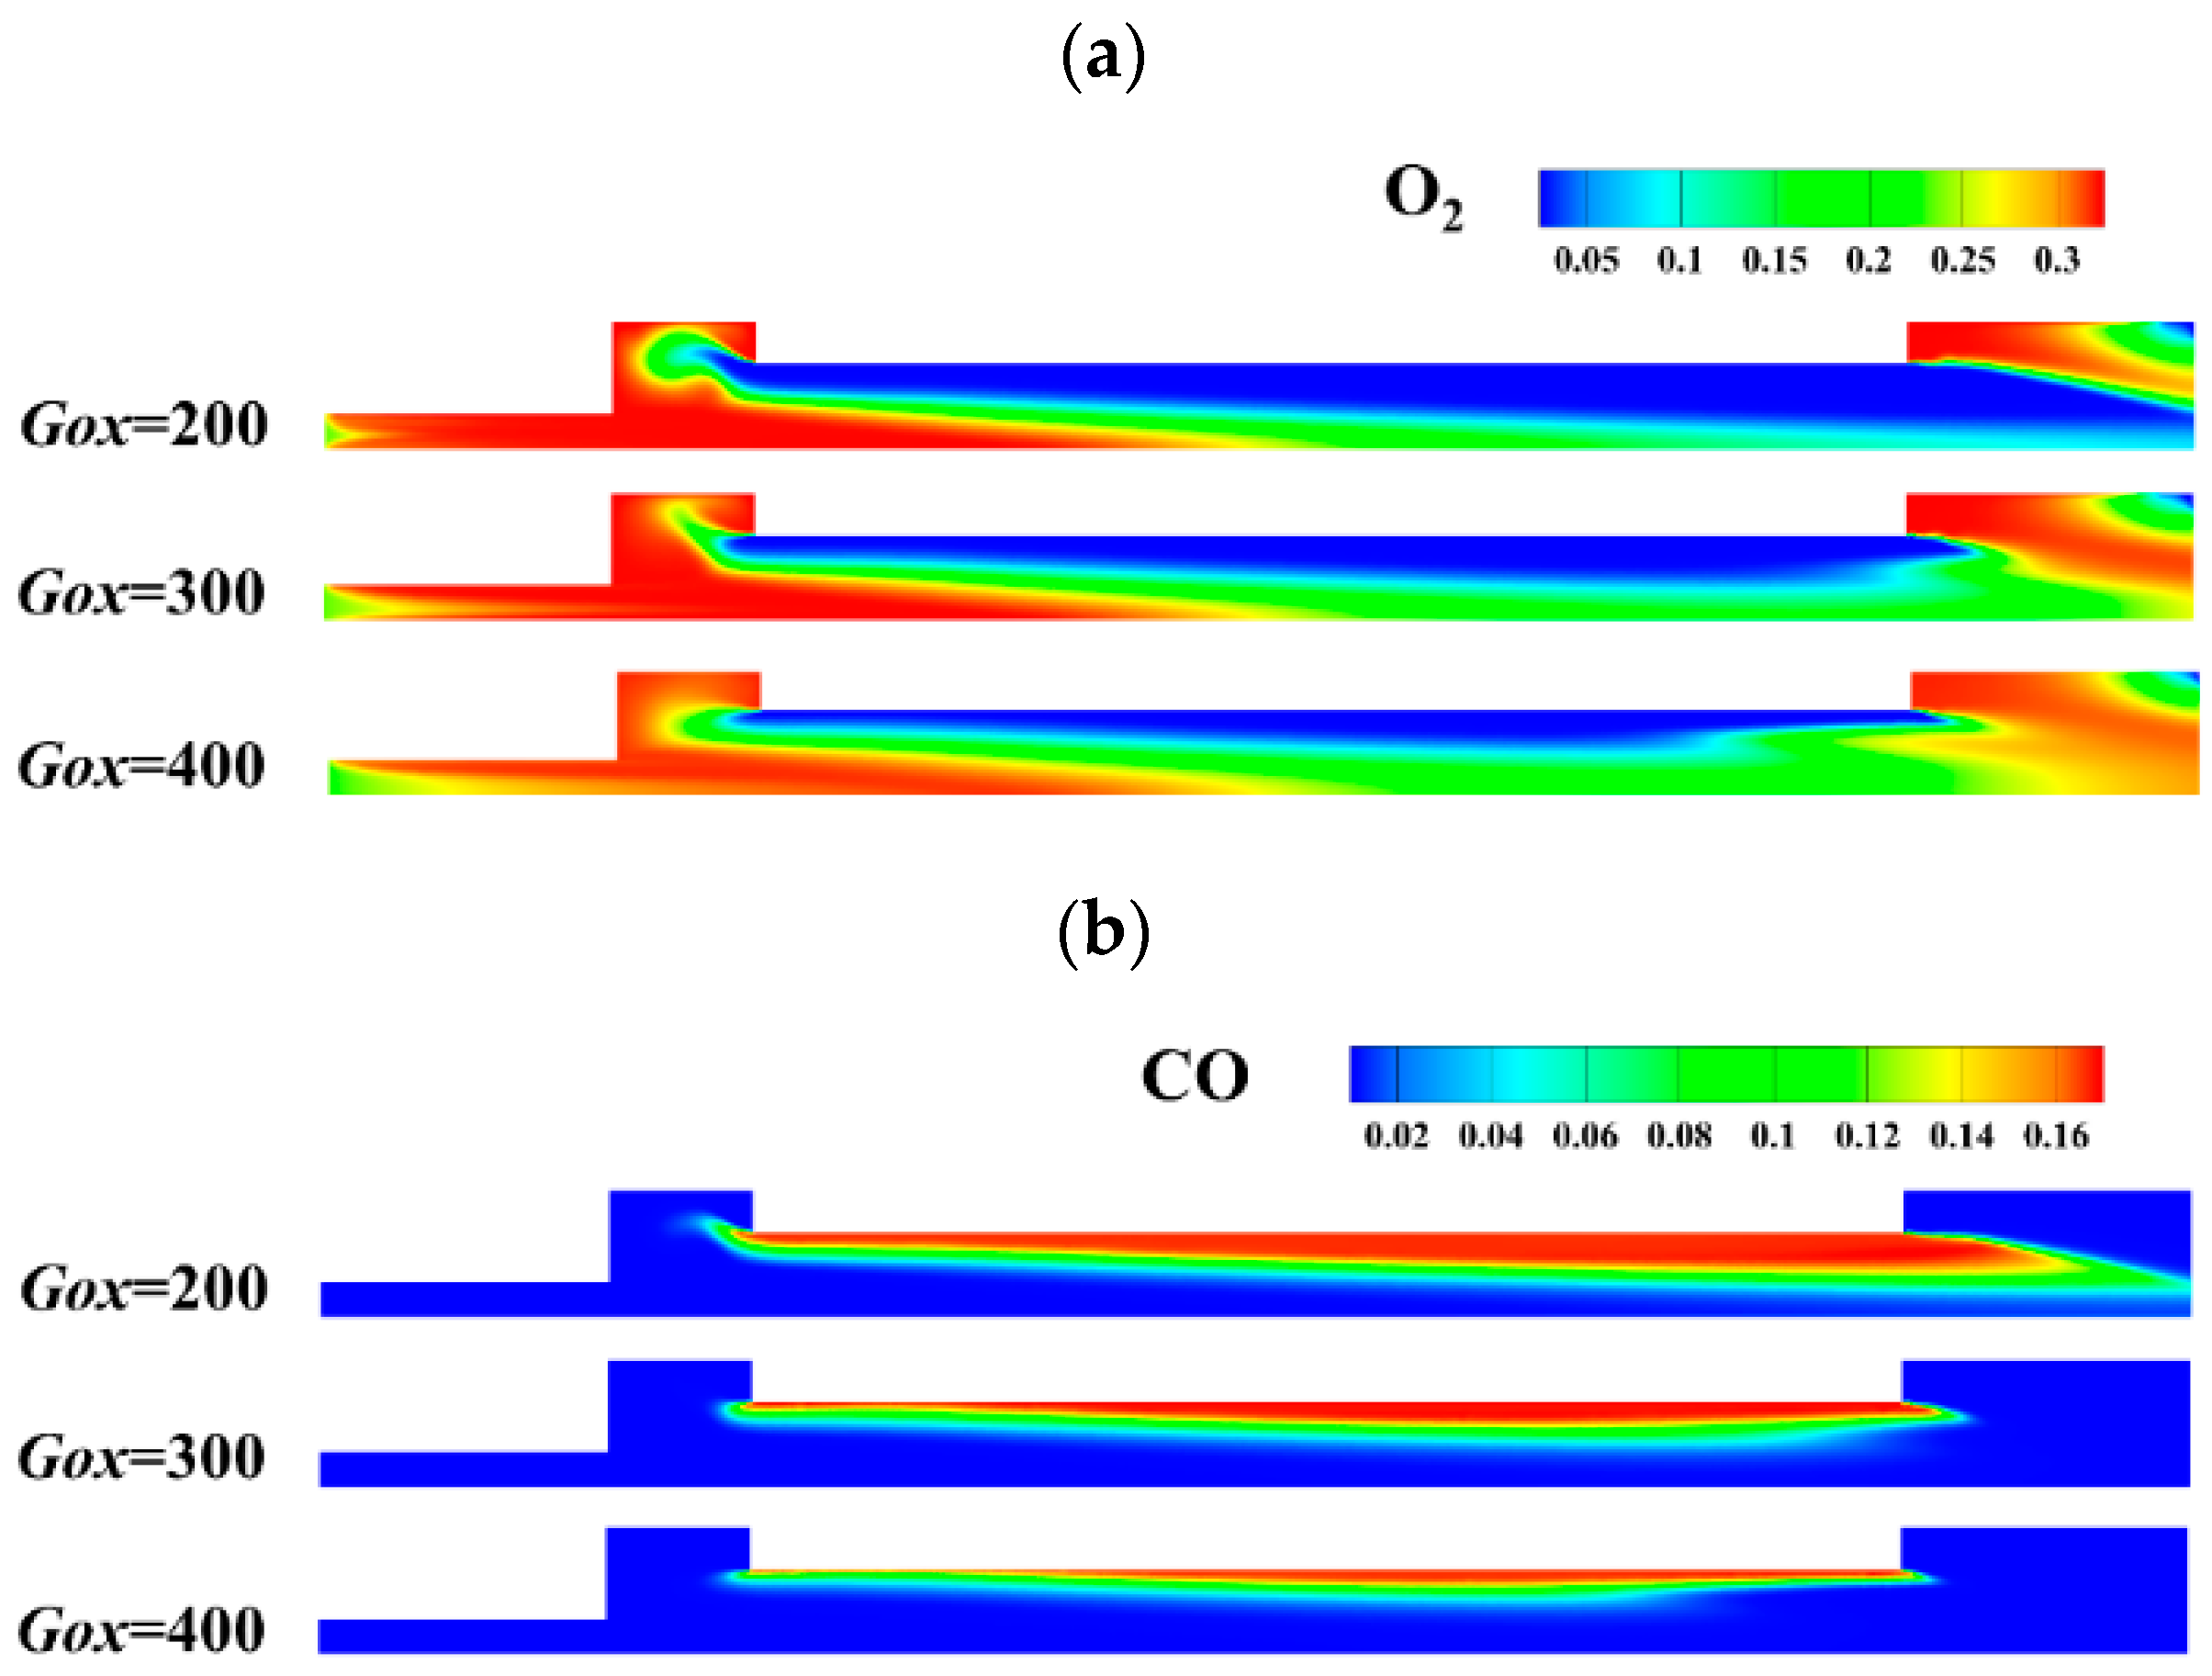
Mixing is inhomogeneous in the coupled combustion process. There exists a narrow belt-like region with an excellent mixing effect. In the flow direction, the mixing degree increases as the mixing process is improved. With the increasing mass flux of the oxidant, the mixing in the belt-like coupled combustion region is enhanced. Coupled combustion is thus significantly strengthened. As combustion proceeds, the belt-like zone expands but moves away from the propellant grain.
3.
Heat transfer coefficients at the two ends of the propellant are higher than those in the middle part of the propellant due to the vortex structures formed in the combustion chamber. The heat transfer coefficient is enhanced by increasing the mass flux of the oxidant in the initial combustion stage but is weakened in the late combustion stage. As the combustion progresses, the heat transfer coefficient decreases substantially due to decelerating reaction rate and enlarging flow channel area.
4.
As the combustion progresses, the temperature of the burning surface gradually decreases as the combustion reaction rate is decelerated. Increasing oxidizer mass flux leads to a slower decrease of temperature and regression rate with combustion time as mixing and combustion reaction are enhanced. Due to the entrainment effect of the vortex structure, temperature distribution along the flow direction is quite unevenly distributed.
5.
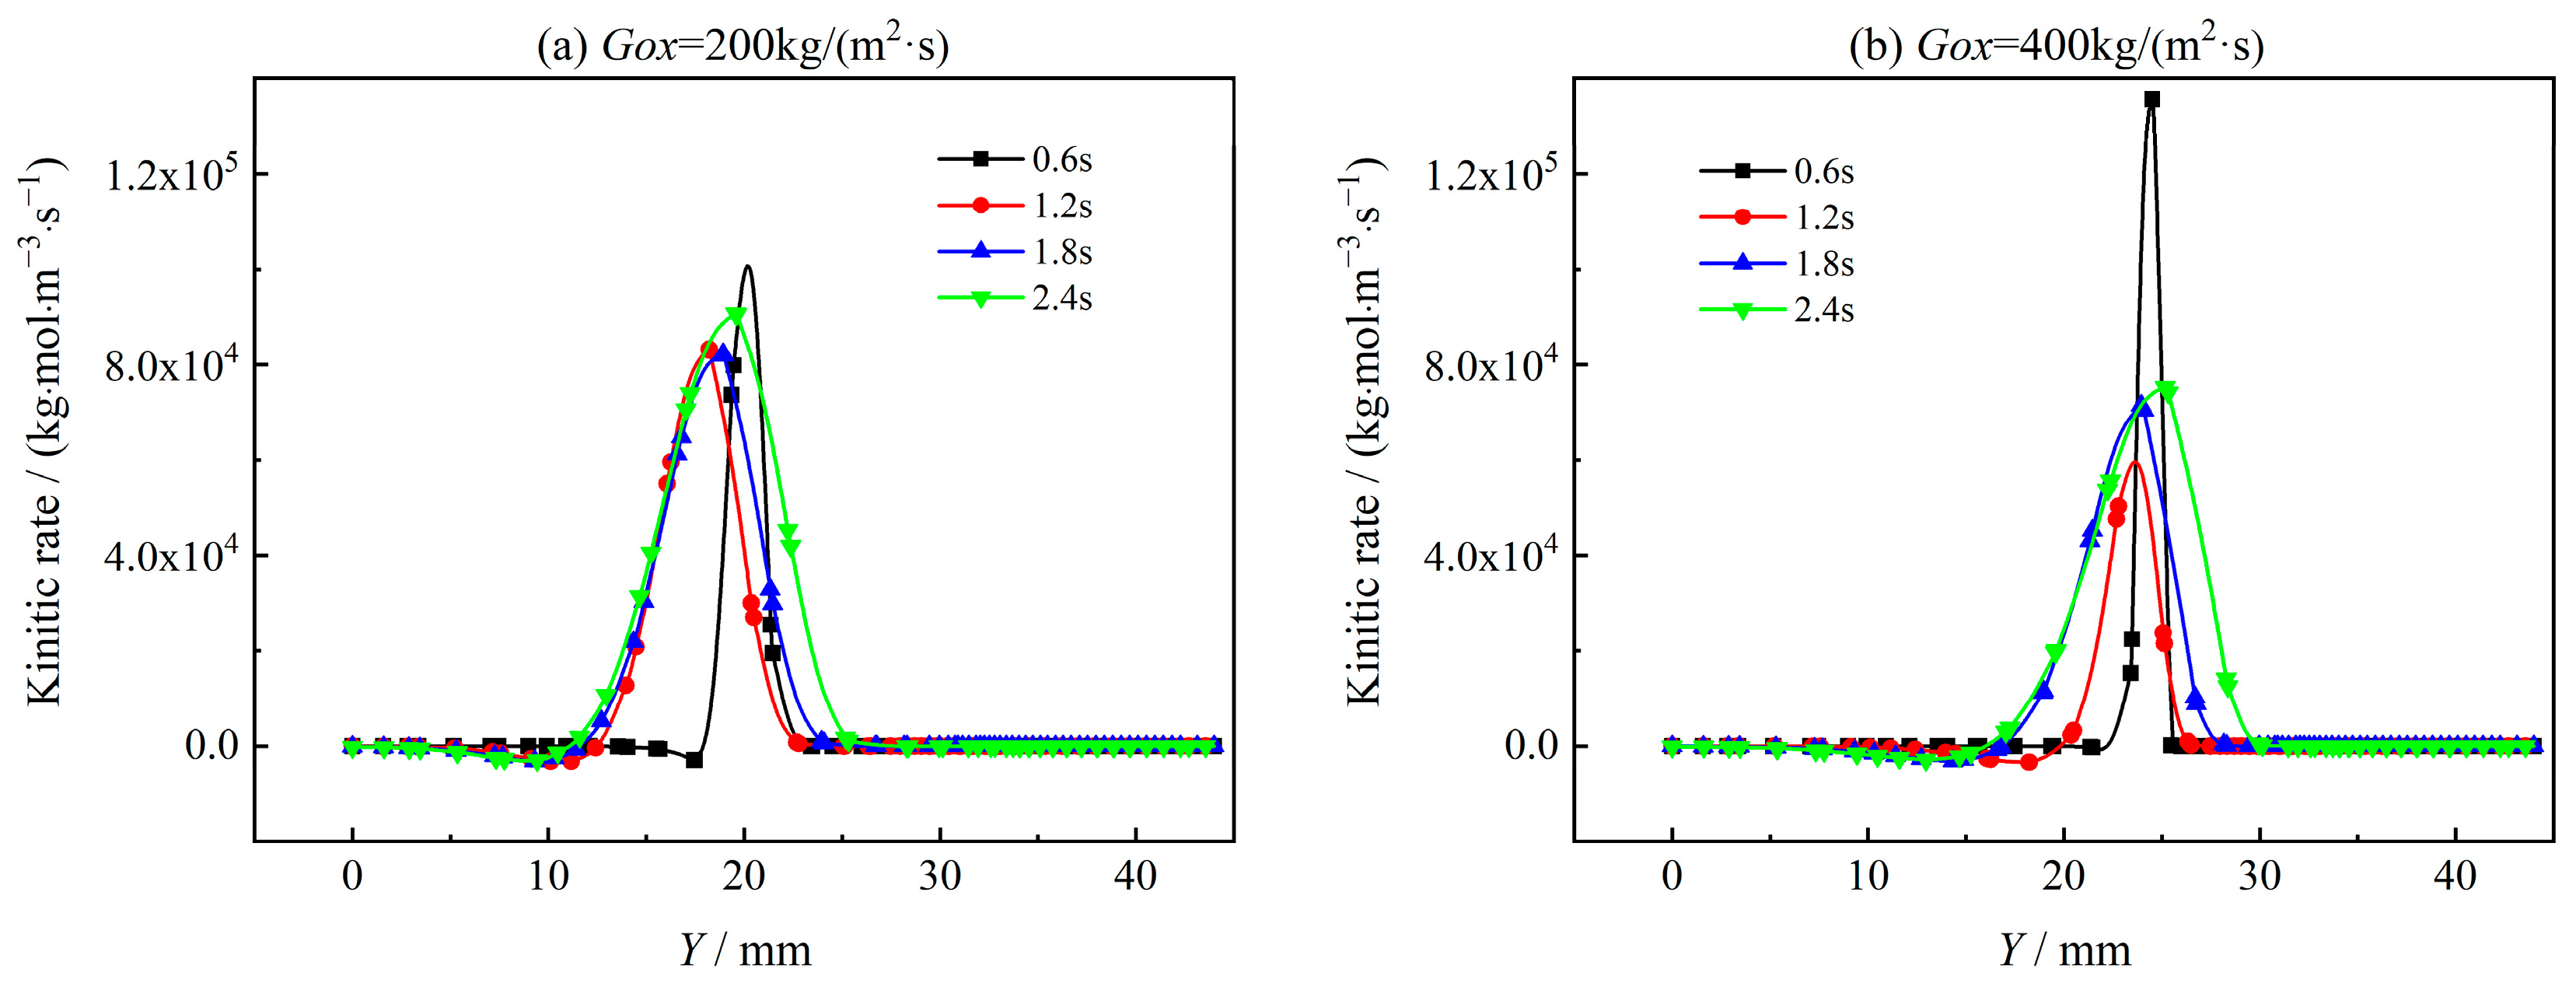
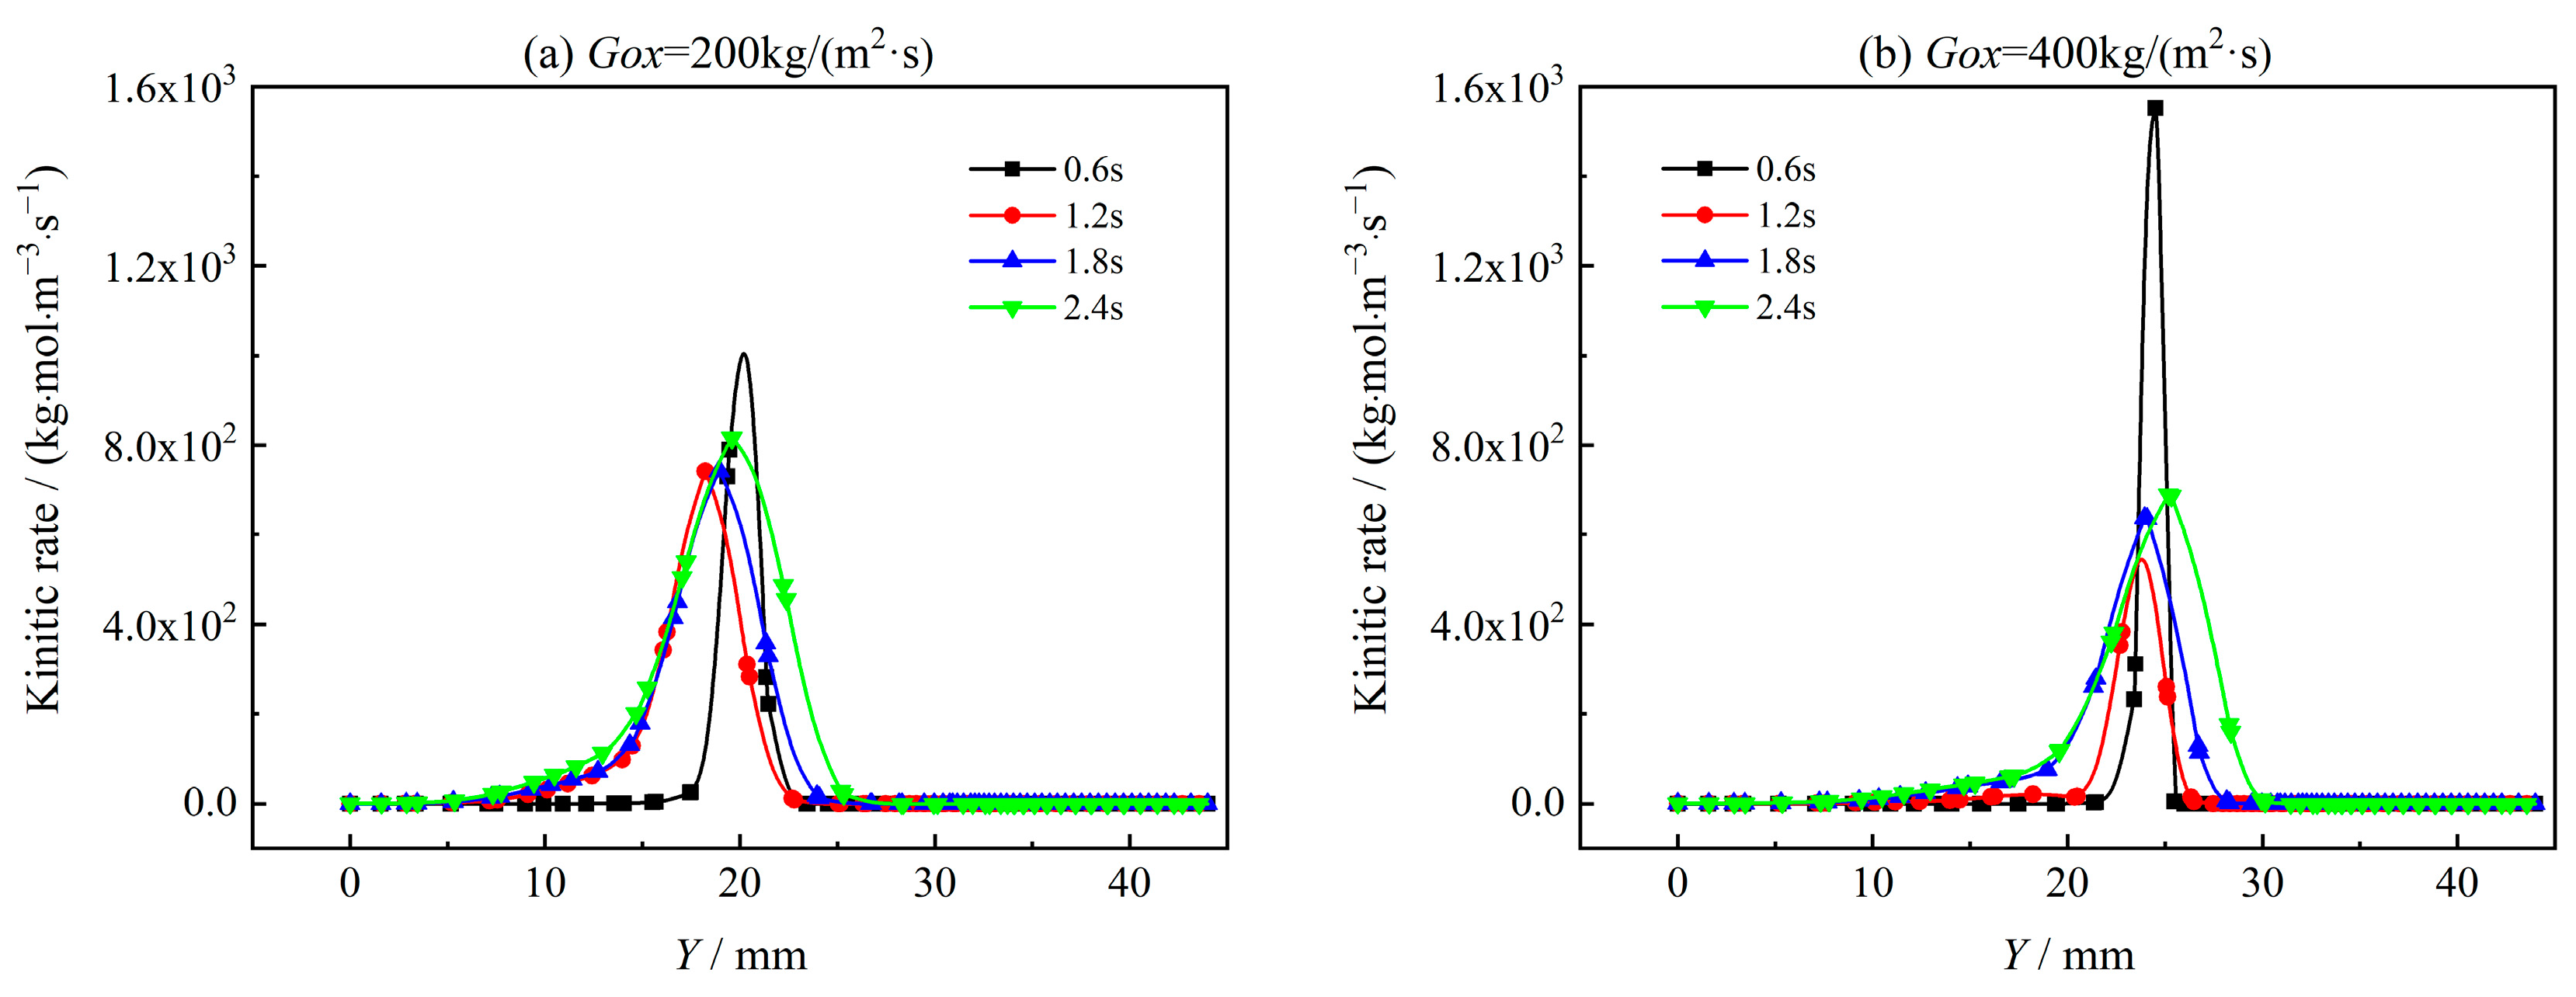
Increasing inlet oxidizer mass flux leads to a higher combustion heat release rate as the coupled combustion reactions are accelerated by higher oxygen concentration and better mixing. Therefore, the maximum gas phase region temperature increases significantly. The heat release rate in the coupled combustion region decreases significantly as oxygen is consumed. The maximum combustion heat release rate appears near the ends of the propellant, where the existence of vortex structures enhances the mixing and combustion process.

Author Contributions

Conceptualization, S.L. and Y.Z.; Methodology, Y.Z.; Software, Y.Z. and L.W.; Validation, L.W., Z.C. and S.H.; Formal analysis, L.W.; Investigation, S.L.; Resources, S.H.; Data curation, S.H.; Writing—original draft preparation, S.L. and Y.Z.; Writing—review and editing, Y.Z. and S.L.; Visualization, Z.C.; Supervision, S.H.; Project administration, S.L.; Funding acquisition, S.H. All authors have read and agreed to the published version of the manuscript.

Funding

This research was funded by National Natural Science Foundation of China (Nos. 52276087, 51806048).

Data Availability Statement

Data will be made available on request.

Conflicts of Interest

The authors declare no conflict of interest.

References

  1. Tappan, B.C.; Dallmann, N.A.; Novak, A.M.; Lichthardt, J.P.; De, N.N.; Baca, E.V.; Seitz, D.N. High deltav solid propulsion system fort small satellites. In Proceedings of the 30th Annual AIAA/USU Conference on Small Satellites, Logan, UT, USA, 6–11 August 2016. [Google Scholar]
  2. Zou, X.R.; Wang, N.F.; Han, L.; Bai, T.T.; Xie, K. Numerical investigation on regression rate and thrust regulation behaviors of a combined solid rocket motor with aluminum-based fuel. Aerosp. Sci. Technol. 2021, 119, 107102. [Google Scholar] [CrossRef]
  3. Zhang, S. Numerical Simulation Study on Working Process and Combustion Microstructure of Solid-Liquid Hybrid Rocket Engine. Ph.D. Thesis, National University of Defense Technology, Changsha, China, 2017. [Google Scholar]
  4. Chiaverini, M.; Kuo, K.; Peretz, A. Heat flux and internal ballistic characterization of a hybrid rocket motor analog. In Proceedings of the 33th Joint Propulsion Conference and Exhibit, Seattle, WA, USA, 6–9 July 1997; p. 3080. [Google Scholar]
  5. Leccese, G.; Bianchi, D.; Nasuti, F. Numerical investigation on the role of thermal radiation in hybrid rocket fuel pyrolysis. In Proceedings of the 2018 Joint Propulsion Conference, Cincinnati, OH, USA, 9–11 July 2018; p. 4924. [Google Scholar]
  6. Stowe, R.; Champlain, A.D.; Mayer, A. Modelling and flow visualization of mixing in a ducted rocket combustor. In Proceedings of the 34th AIAA/ASME/SAE/ASEE Joint Propulsion Conference and Exhibit, Cleveland, OH, USA, 13–15 July 1998; p. 3768. [Google Scholar]
  7. Jiang, Y.; Abu-Hamdeh, N.H.; Bantan, R.A.R. Mixing efficiency of hydrogen and air co-flow jets via wedge shock generator in dual-combustor ramjet. Aerosp. Sci. Technol. 2021, 116, 106846. [Google Scholar] [CrossRef]
  8. Zhang, Z.; Lin, X.; Wang, Z. Effects of swirl injection on the combustion of a novel composite hybrid rocket fuel grain. Acta Astronaut. 2022, 199, 174–182. [Google Scholar] [CrossRef]
  9. Vigot, C.; Bardelle, L.; Nadaud, L. Improvement of boron combustion in a solid-fuel ramrocket. In Proceedings of the 22th Joint Propulsion Conference, Huntsville, AL, USA, 16–18 June 1986; p. 1590. [Google Scholar]
  10. Evans, J.V.; Senior, W.C.B.; Gejji, R.M. Performance of a solid-fuel ramjet combustor with bypass air addition. J. Propuls. Power 2022, 39, 167–175. [Google Scholar] [CrossRef]
  11. Wang, S.; Liu, Y.; Wu, Y. Numerical simulation of mixing and combustion characteristics based on air turbine rocket engine rocket afterburner. Highlights Sci. Eng. Technol. 2022, 1, 163–170. [Google Scholar] [CrossRef]
  12. Cherng, D.L.; Yang, V.; Kuo, K. Numerical study of turbulent reacting flows in solid-propellant ducted rocket combustors. J. Propuls. Power 1989, 5, 678–685. [Google Scholar] [CrossRef]
  13. Li, W.; Zhao, D.; Chen, X. Numerical investigation of inlet thermodynamic conditions on solid fuel ramjet performances. Int. J. Aerosp. Eng. 2021, 2021, 8868288. [Google Scholar] [CrossRef]
  14. Hu, Y.P.; Liu, Y.S.; Wang, Y.J.; Zhou, B.Q.; Zheng, X.; Xue, R. Effect of the heat release on ejector-to-ramjet dynamic mode transition process in the rocket-based combined cycle engine. Int. Commun. Heat Mass Transf. 2023, 140, 106539. [Google Scholar] [CrossRef]
  15. Jia, E.Q.; Peng, Q.; Liu, X.; Zuo, W.; Zhao, X.; Liu, H. Numerical investigation on hydrogen/air non-premixed combustion in a three-dimensional micro combustor. Energy Convers. Manag. 2016, 124, 427–438. [Google Scholar]
  16. Jia, E.Q.; Peng, Q.; Zhao, X.; Zuo, W.; Zhang, Z.; Pham, M. Numerical investigation on the combustion characteristics of non-premixed hydrogen-air in a novel micro-combustor. Appl. Therm. Eng. 2017, 110, 665–677. [Google Scholar]
  17. Jia, E.Q.; Ding, J.; Chen, J.; Liao, G.; Zhang, F.; Luo, B. Process in micro-combustion and energy conversion of micro power system: A review. Energy Convers. Manag. 2021, 246, 114664. [Google Scholar]
  18. Chen, Q.; Zheng, Z.; Zhu, Z. Effects of syngas addition on combustion characteristics of gasoline surrogate fuel. ACS Omega 2023, 8, 3929–3944. [Google Scholar] [CrossRef] [PubMed]
  19. Wei, Z.L.; Leung, C.W.; Cheung, C.S.; Huang, Z.H. Effects of equivalence ratio, H2 and CO2 addition on the heat release characteristics of premixed laminar biogas-hydrogen flame. Int. J. Hydrogen Energy 2016, 41, 6567–6580. [Google Scholar] [CrossRef]
  20. Song, M.T.; Wang, C.Y.; Chang, C.C. Two-stream interaction problem and its application to mass transport. Int. J. Heat Mass Transf. 2022, 196, 123312. [Google Scholar] [CrossRef]
  21. Musa, O.; Xiong, C.; Zhou, C.S.; Li, W. Effect of inlet conditions on swirling turbulent reacting flows in a solid fuel ramjet engine. Appl. Therm. Eng. 2017, 113, 186–207. [Google Scholar] [CrossRef]
  22. Cai, G.; Zhao, Z.; Zhao, B.; Liu, Y.; Yu, N. Regression rate and combustion performance investigation on hybrid rocket motor with head-end swirl injection under high geometric swirl number. Aerosp. Sci. Technol. 2020, 103, 105922. [Google Scholar] [CrossRef]
  23. Tian, H.; He, L.; Zhu, H.; Wang, P.; Xu, X. Numerical and experimental investigation on hybrid rocket motor with two-hole segmented rotation grain. Aerosp. Sci. Technol. 2019, 92, 820–830. [Google Scholar] [CrossRef]
  24. Betelin, V.B.; Kushnirenko, A.G.; Smirnov, N.N.; Nikitin, V.F.; Tyurenkova, V.V.; Stamov, L.I. Numerical investigations of hybrid rocket engines. Acta Astronaut. 2018, 144, 363–370. [Google Scholar] [CrossRef]
  25. Wang, H.; Wang, Z.; Sun, M.; Qin, N. Large eddy simulation of a hydrogen-fueled scramjet combustor with dual cavity. Acta Astronaut. 2015, 108, 119–128. [Google Scholar] [CrossRef]
  26. Liu, S.Y.; Chen, Z.C.; Wang, L.M.; Li, Y.; Hu, S.Q. Numerical study on transient regression rate and combustion characteristics of segregated AP-based oxidizer/TAGN-based fuel. Fuel 2022, 337, 126893. [Google Scholar] [CrossRef]
  27. Liu, S.Y.; Zhang, Y.; Wang, L.M.; Han, L.Y.; Chen, Z.C.; Hu, S.Q. The effect of mixing and heat transfer on regression rate of TAGN-based fuel in a segregated AP/TAGN solid motor. Int. J. Therm. Sci. 2023, 186, 108133. [Google Scholar] [CrossRef]
  28. Shih, T.M. Numerical Heat Transfer; CRC Press: Boca Raton, FL, USA, 1984. [Google Scholar]
  29. Kuo, K.K.; Chiaverini, M.J. Fundamentals of Hybrid Rocket Combustion and Propulsion; American Institute of Aeronautics and Astronautics: Reston, VA, USA, 2007. [Google Scholar]
  30. Li, X.T.; Tian, H.; Cai, G.B. Numerical analysis of fuel regression rate distribution characteristics in hybrid rocket motors with different fuel types. Sci. China Technol. Sci. 2013, 56, 1807–1817. [Google Scholar] [CrossRef]
  31. Wilcox, D.C. Reassessment of the scale-determining equation for advanced turbulence models. AIAA J. 1988, 26, 1299–1310. [Google Scholar] [CrossRef]
  32. Wilcox, D.C. A half century historical review of the k-omega model. In Proceedings of the 29th Aerospace Sciences Meeting, Reno, NV, USA, 7–10 January 1991; p. 615. [Google Scholar]
  33. Carro, R.; Stephens, M.; Arvanetes, J.; Powell, A.; Petersen, E.; Smith, C. High-pressure testing of composite solid propellant mixtures: Burner facility characterization. In Proceedings of the 41st AIAA/ASME/SAE/ASEE Joint Propulsion Conference & Exhibit, Tucson, AZ, USA, 10–13 July 2005; p. 3617. [Google Scholar]
Figure 1. Schematic of the segregated oxidizer and fuel solid motor.
Aerospace 11 00072 g001
Figure 2. Pyrolysis model of fuel-rich propellant.
Aerospace 11 00072 g002
Figure 3. Combustor for burning rate measurement.
Aerospace 11 00072 g003
Figure 4. Physical model of the coupled combustion process.
Aerospace 11 00072 g004
Figure 5. Grids used for independence test.
Aerospace 11 00072 g005
Figure 6. Grid independence test.
Aerospace 11 00072 g006
Figure 7. Low flow velocity coupled-combustion experimental facility.
Aerospace 11 00072 g007
Figure 8. Model verification of the regression rate model.
Aerospace 11 00072 g008
Figure 9. Effect of oxidizer gas mass flux variation on transient temperature distribution. (a) Gox = 200 kg/(m2·s). (b) Gox = 400 kg/(m2·s).
Aerospace 11 00072 g009
Figure 10. Effect of oxidizer gas mass flux variation on transient velocity distribution. (a) Gox = 200 kg/(m2·s). (b) Gox = 400 kg/(m2·s).
Aerospace 11 00072 g010
Figure 11. Transient distribution of mixing degree at different oxidant gas mass flux. (a) Gox = 200 kg/(m2·s). (b) Gox = 400 kg/(m2·s).
Aerospace 11 00072 g011
Figure 12. Transient distribution of oxidizer richness index at different oxidant gas mass flux. (a) Gox = 200 kg/(m2·s). (b) Gox = 400 kg/(m2·s).
Aerospace 11 00072 g012
Figure 13. Temporal distribution of heat transfer coefficient at different combustion time. (a) Gox = 200 kg/(m2·s). (b) Gox = 400 kg/(m2·s).
Aerospace 11 00072 g013
Figure 14. Impact of oxidizer mass flux on average heat transfer coefficient under different combustion time.
Aerospace 11 00072 g014
Figure 15. Effect of oxidizer mass flux on coupled combustion characteristics. (a) Temperature of the burning surface. (b) Regression rate of the burning surface.
Aerospace 11 00072 g015
Figure 16. Impact of oxidizer mass flux on the maximum gas phase temperature distribution. (a) 150 mm from oxidizer inlet; (b) 250 mm from oxidizer inlet; (c) 400 mm from oxidizer inlet; (d) 550 mm from oxidizer inlet.
Aerospace 11 00072 g016
Figure 17. Contours of initial and stabilizing moments of burning surface regression for different oxidant fluxes.
Aerospace 11 00072 g017
Figure 18. Distribution of O2, CO2 and Tf along the axial direction for different oxidant fluxes.
Aerospace 11 00072 g018
Figure 19. Reaction rate of R-8 in the radial direction.
Aerospace 11 00072 g019
Figure 20. Reaction rate of R-27 in the radial direction.
Aerospace 11 00072 g020
Figure 21. Content of O2 and CO at different combustion times. (a) Content of O2. (b) Content of CO.
Aerospace 11 00072 g021
Figure 22. Variation of axial distribution of heat release rate with time for Gox = 200 kg/(m2·s).
Aerospace 11 00072 g022
Figure 23. Impact of oxidizer gas mass flux variation on O2 and CO content. (a) Content of O2. (b) Content of CO.
Aerospace 11 00072 g023
Figure 24. The impact of inlet mass flux of oxidant on heat release rate.
Aerospace 11 00072 g024
Table 1. Gas phase inlet components.
ComponentsMole FractionComponentsMole Fraction
H2O0.2945CO20.0063
O20.11CO0.049
HCl0.045H20.145
NH30.04N20.1945
NO20.03Cl20.01
N2O0.015ClO20.01
N20.2095HClO40.01
ClO0.015NO0.005
Table 2. Conditions and results of model validation.
Inlet Flow Rate/(g·s−1)Pressure/MPaRegression Rate/(mm·s−1)
ExperimentSimulation
8.001.651.801.74
8.901.651.911.96
9.701.652.162.18
Disclaimer/Publisher’s Note: The statements, opinions and data contained in all publications are solely those of the individual author(s) and contributor(s) and not of MDPI and/or the editor(s). MDPI and/or the editor(s) disclaim responsibility for any injury to people or property resulting from any ideas, methods, instructions or products referred to in the content.

