Article

A Generic Model for Benchmark Aerodynamic Analysis of Fifth-Generation High-Performance Aircraft

by
Nicholas F. Giannelis
1,*,†,
Tamas Bykerk
2,† and
Gareth A. Vio
2,†
1
School of Engineering, The University of Newcastle, Callaghan 2308, Australia
2
School of Aerospace, Mechanical and Mechatronic Engineering, The University of Sydney, Sydney 2006, Australia
*
Author to whom correspondence should be addressed.
These authors contributed equally to this work.
Aerospace 2023, 10(9), 746; https://doi.org/10.3390/aerospace10090746
Submission received: 22 June 2023 / Revised: 17 August 2023 / Accepted: 21 August 2023 / Published: 23 August 2023
(This article belongs to the Section Aeronautics)

Abstract

:
This paper introduces a generic model for the study of aerodynamic behaviour relevant to fifth-generation high-performance aircraft. The model design is presented, outlining simplifications made to retain the key features of modern high-performance vehicles while ensuring a manufacturable geometry. Subsonic wind tunnel tests were performed with force and moment balance measurements used to develop a database of experimental validation data for the platform at a freestream velocity of 20 m/s. Numerical simulations are also presented and validated by the experiments and further employed to ensure the vortex behaviour is consistent with contemporary high-performance platforms. A sensitivity study of the computational predictions from the turbulence modelling approach is also presented. This geometry is the first in a suite of representative aircraft geometries (the Sydney Standard Aerodynamic Models), in which all geometries, computational models, and experimental data are made openly available to the research community (accessible via this link: https://zenodo.org/communities/ssam_gen5/) to serve as validation test cases and promote best practices in aerodynamic modelling.

1. Introduction

Aerodynamicists have a long history of developing standardised models for wind tunnel calibration and data comparisons between facilities. Such benchmark models are useful for providing baseline data sets for the correlation of results, to assess data repeatability over time, and to verify model installation and data acquisition systems [1], as well as to certify correct wind tunnel operation following the completion of repairs or modifications. They also play roles in training wind tunnel personnel, assessing wall interference effects, and identifying problems and faults in the operation and verification of new measurement techniques or devices [2,3,4]. These test articles are not limited to aircraft and have been developed for various applications including submarines [5], automotives [6], or civil purposes [7].
A standardised reference model typically fulfils two main criteria: Firstly, such models are simplistic in shape with a precisely defined geometry, and secondly, they are representative of realistic configurations to ensure that the results are relevant. Examples of existing standard models include the AGARD-B and ONERA-M, which have been circulating for decades [8]. More recently, NASA’s Common Research Model [9] was adopted as a common test bed in a number of community efforts to ascertain state-of-the-art aerodynamic modelling, including the AIAA Drag Prediction and High Lift Prediction Workshops. Since the late 1980s, the Standard Dynamics Model (SDM) has been used as a numerical and experimental calibration model to validate predictions of static and dynamic stability derivatives of high-performance aircraft [10,11,12,13,14,15,16,17,18]. This vehicle was developed by the National Research Council of Canada’s Institute for Aerospace Research and is broadly similar in appearance to the fourth-generation F-16 but exhibits a simplified geometry to alleviate the fabrication and computational modelling complexity. However, 21st-century high-performance aircraft design has changed considerably. Stealth capabilities presently dominate the overall vehicle shape, as evidenced by the American built F-22 Raptor and F-35 Lightning as well as the Russian Su-57 and the Chinese Chengdu J-20. While fourth-generation platforms are still widely in service, the SDM is becoming less relevant as a research model for the investigation of the aerodynamics of modern high-performance aircraft.
Although mission specifications and design criteria for fifth-generation platforms are distinct relative to their predecessors, the persistence of a slender-airframe delta-wing configuration remains. For sustained manoeuvre performance throughout the flight envelope, contemporary high-performance aircraft remain reliant on the effective production of vortex lift at high angles. The understanding of vortex lift production in subsonic flows over delta-wings is well-established in the literature [19,20]. At moderate angles of attack, the roll-up of a free-shear layer is induced along the leading edge, producing vortical structures that augment the upper surface suction. These suction characteristics are further enhanced through the inclusion of wing root leading edge strakes [19,21,22]. Although the physics of these problems is well-established, the computational modelling of high-angle vortex-dominated flows remains a challenge. The Cranked Arrow Wing Aerodynamics Project (CAWAP) [23,24] is testament to this complexity. Multiple research groups employing a range of Computational Fluid Dynamics (CFD) codes have considered the F-16XL platform under high-angle conditions, with participants finding consistent discrepancies in flight test data. The complexity here lies in the highly nonlinear separation and vortex bursting [25,26,27] behaviours exhibited by these platforms under high-angle freestream conditions. Ultimately, a representative model of fifth-generation high-performance aircraft must be capable of reflecting these essential features of vortex-dominated flows over slender-wing platforms.
The purpose of this paper is to introduce a generic fifth-generation high-performance aircraft model. This model is the first in a suite of standard aircraft geometries, denoted as the Sydney Standard Aerodynamic Models (SSAM). These models form part of a broader programme, in which multiple platform geometries, computational models, and aerodynamic databases comprising wind tunnel test data will be made openly available to the research community. Herein lies the key novelty of the present work: the design, testing, and analysis of a contemporary high-performance vehicle model that is readily accessible to all researchers. It is envisioned that these models will serve as a consistent suite of standardised validation cases to promote best practices in aerodynamic modelling. The remainder of this manuscript is presented as follows: Section 2 provides an overview of the generic high-performance platform with the geometric and sizing features shown. Section 3 then follows with an overview of the model construction and details of the experimental procedure. In Section 4, the procedure for the numerical investigation is outlined, including solver numerics, turbulence modelling approaches, and grid refinement. Section 5 then critically evaluates the results found from both the experimental and computational studies with the work to-date summarised and future plans presented in Section 6.

2. Model Overview

2.1. Vehicle Geometry

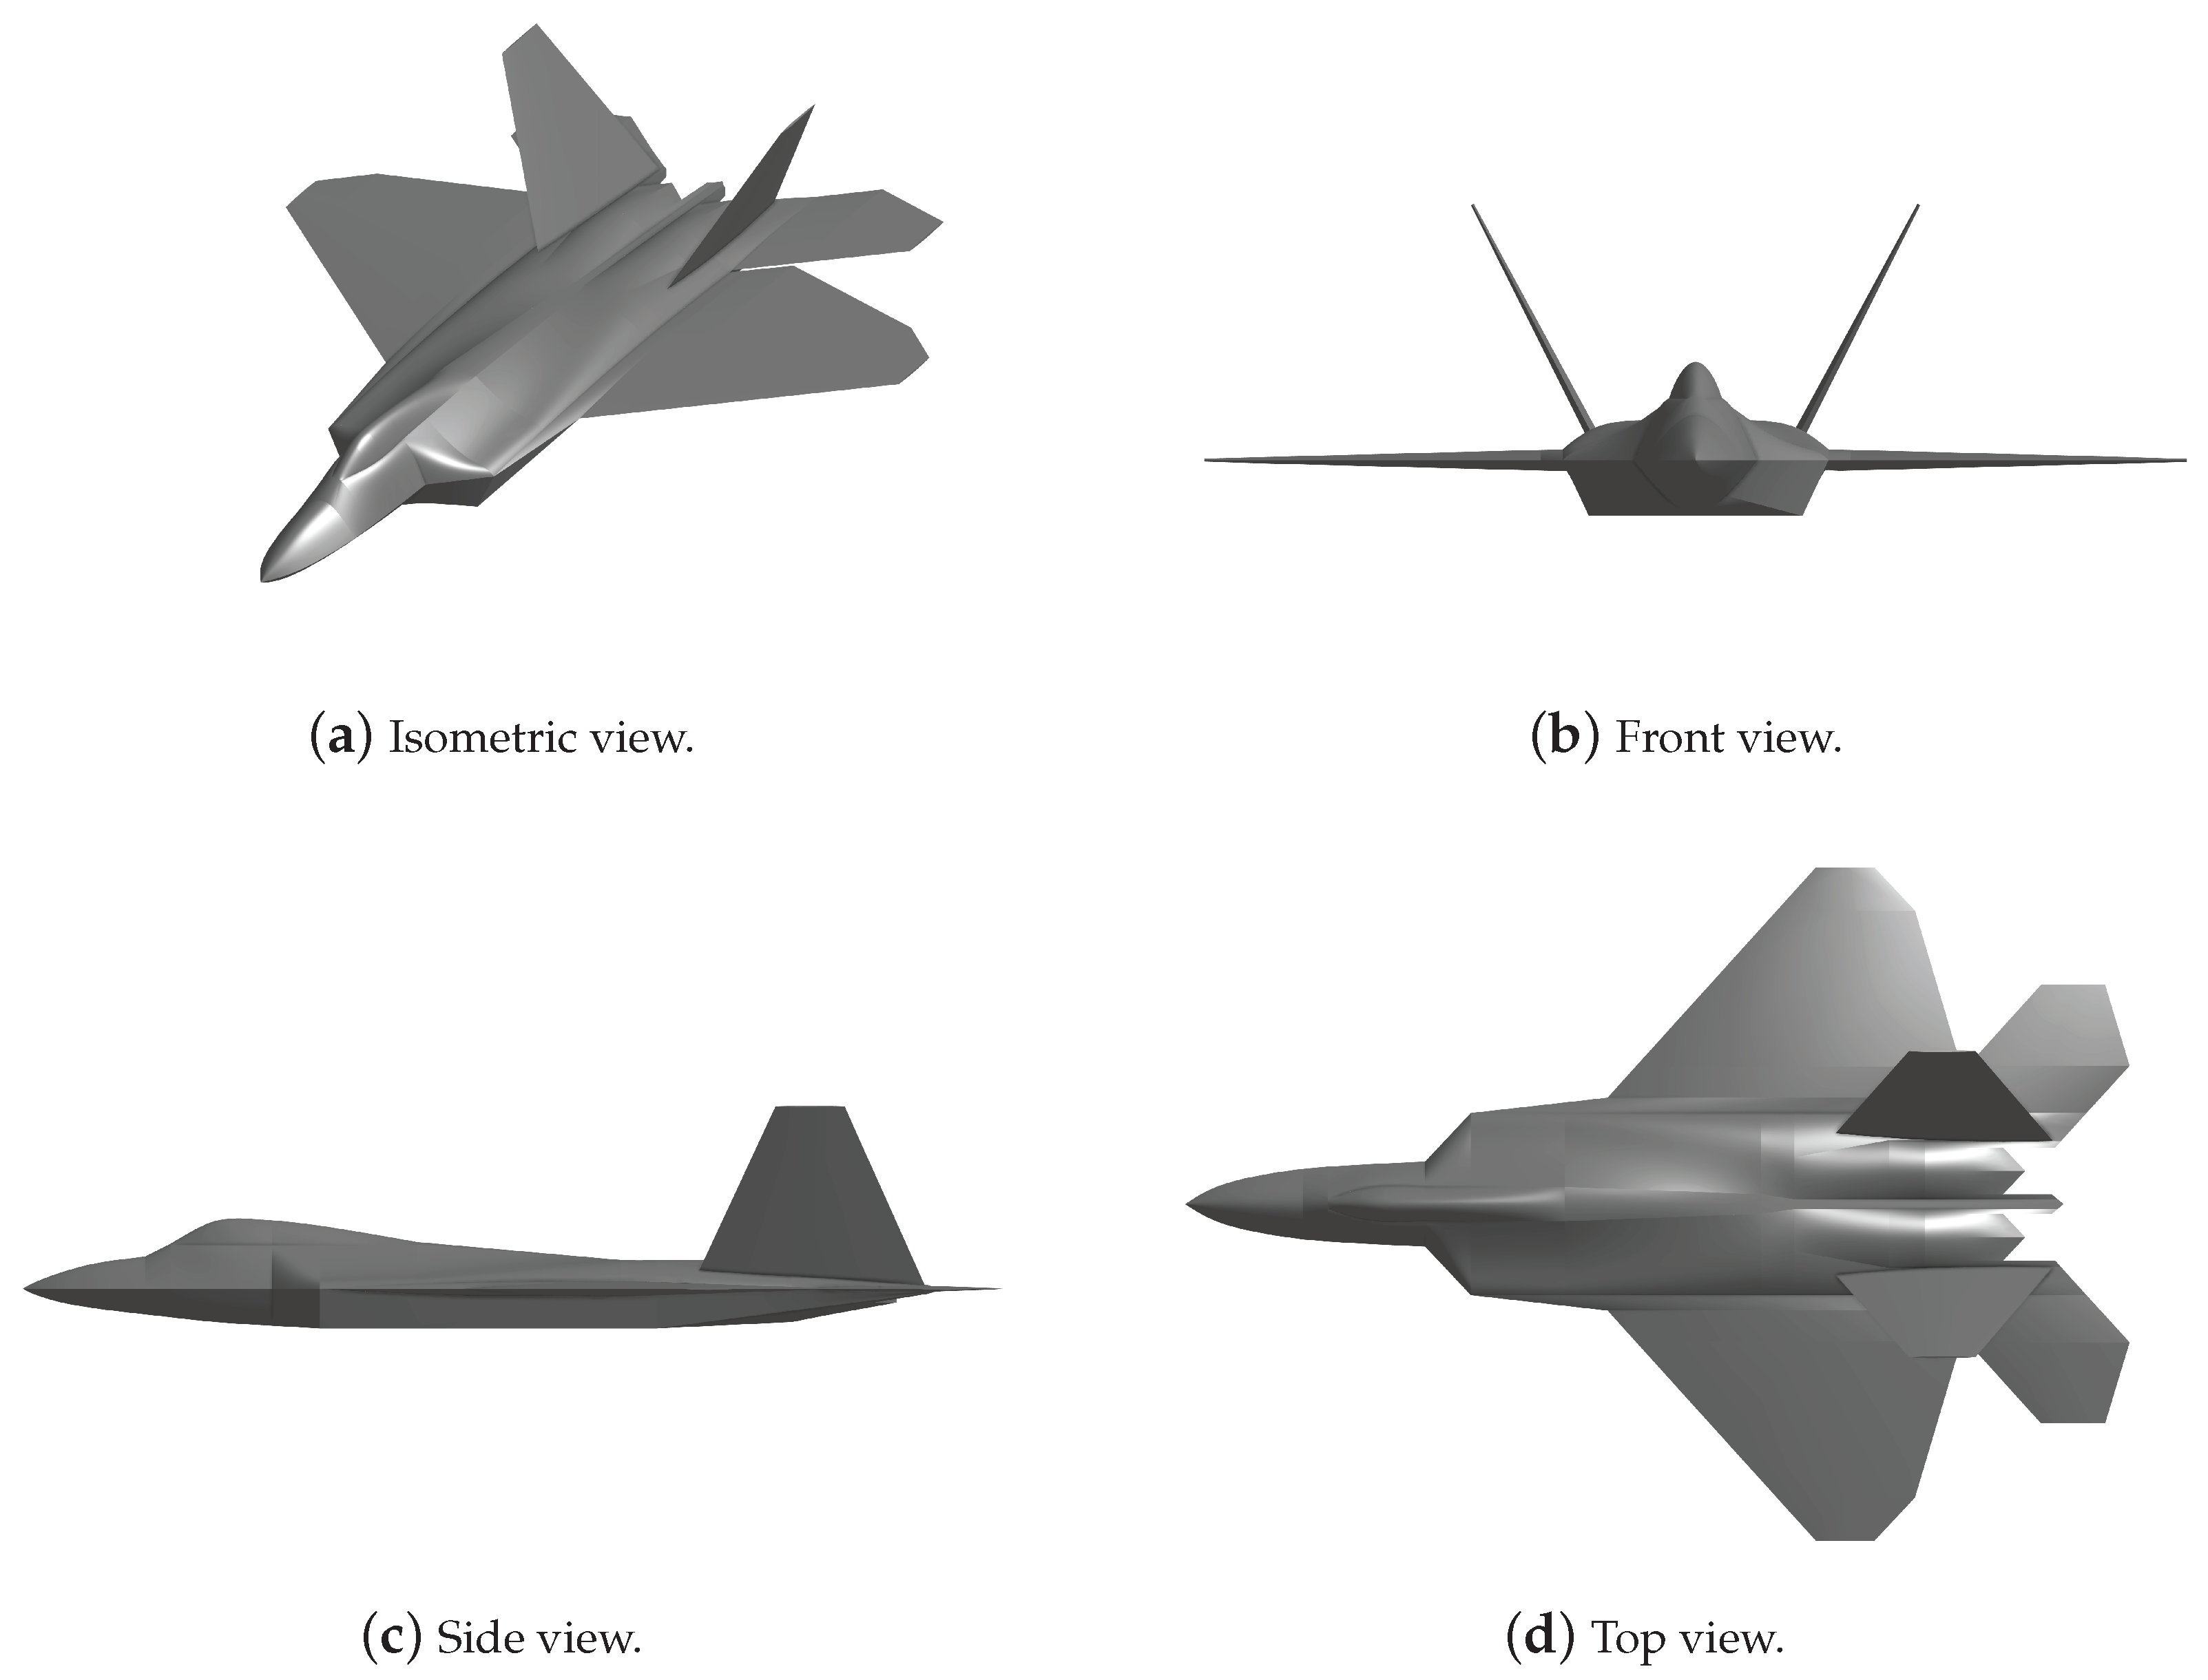
The SSAM-Gen5 model is based on the F-22 Raptor and is presented in Figure 1. This vehicle was chosen over the F-35 as the majority of in-service fifth-generation vehicles have a twin-engine configuration. The geometry was generated from drawings and images of the aircraft that are openly available on the public domain. As such, the geometry is not intended to reproduce the aerodynamic characteristics of the F-22 Raptor, but rather, to reflect the salient aerodynamic features typical of contemporary aircraft. Features such as the chordwise camber and spanwise twist were omitted to allow the vehicle geometry to remain as simple as possible while still representing the complex outer mould line of a fifth-generation platform. The wing profiles are four-percent-thick biconvex sections with sharp leading edges and no incidence angle. The sweep angle of the horizontal stabiliser and the main delta wing is approximately 42° with the twin vertical stabilisers swept back approximately 25° and canted outwards at an angle of 27.5°. The thrust nozzles are retained, while the intakes are simplified and sealed. The full-scale length of the vehicle is 19 m. The geometry can be downloaded from https://zenodo.org/communities/ssam_gen5/.

2.2. Vehicle Size and Scaling

The vehicle length was scaled to 0.75 m in length, reflecting approximately a 1:25 scale of the full-length vehicle. This was selected based on a compromise between solid blockage in the 4 ft × 3 ft test section, instrumentation requirements, and manufacturing limitations. The reference values used for this scale are summarised in Table 1 along with the mounting location of the load cell. Note that the load cell reference location is measured from the origin located at the nose tip. The axis directions are presented in Figure 2. A subsequent vehicle aerodynamic analysis was performed relative to this coordinate frame with aerodynamic data defined in a body-fixed axis system. Positive AoA (and by extension, pitching moment) is defined by a nose-up attitude, with lift and drag presented in the wind axis system as components of normal and axial forces. Lift is defined perpendicular to the oncoming flow, while drag is parallel.

3. Experimental Investigation

A static longitudinal aerodynamic and stability analysis was conducted in the 4 × 3 foot low-speed wind tunnel at the University of Sydney [28] to generate a relevant experimental data set for the validation of CFD studies related to contemporary high-performance aircraft. Data were sampled using an ATI-IA Mini45 6 component load cell attached to an actuated strut and turntable, allowing both longitudinal and lateral directional tests to be conducted. Table 2 presents the maximum sensing ranges as well as the load cell resolution for each of the six axes.
During the experiments, differential pressure measurements are obtained using an MS4535DO pressure sensor with the atmospheric pressure provided by a MS5611 barometric pressure sensor. Airspeed measurements are obtained through this data, interfaced via an Arduino Pro Mini to the in-house data acquisition software, yielding an uncertainty value in the velocity measurements of ±0.15 m/s. Angle of attack measurements are made using an accelerometer fixed to the rotating component of the wind tunnel mount, providing an average uncertainty of 0.1° in the measured AoA (and 0.25° maximum error). Further details about the uncertainty calculations and sensor calibrations are given by Anderson [29] and Lehmkuehler [30]. For a given airspeed, discrete changes in the AoA are applied in a pitch-and-pause manner within the range of interest of −5° ≤ AoA ≤ 30°. At each AoA, the flow is allowed to stabilise for 2 s prior to the load cell acquiring data for an additional 2 s at a frequency of 5000 Hz. This approach has been shown to be sufficient in comprehensive sensitivity studies conducted under analogous conditions in this facility by Anderson [29] and Lehmkuehler [30].
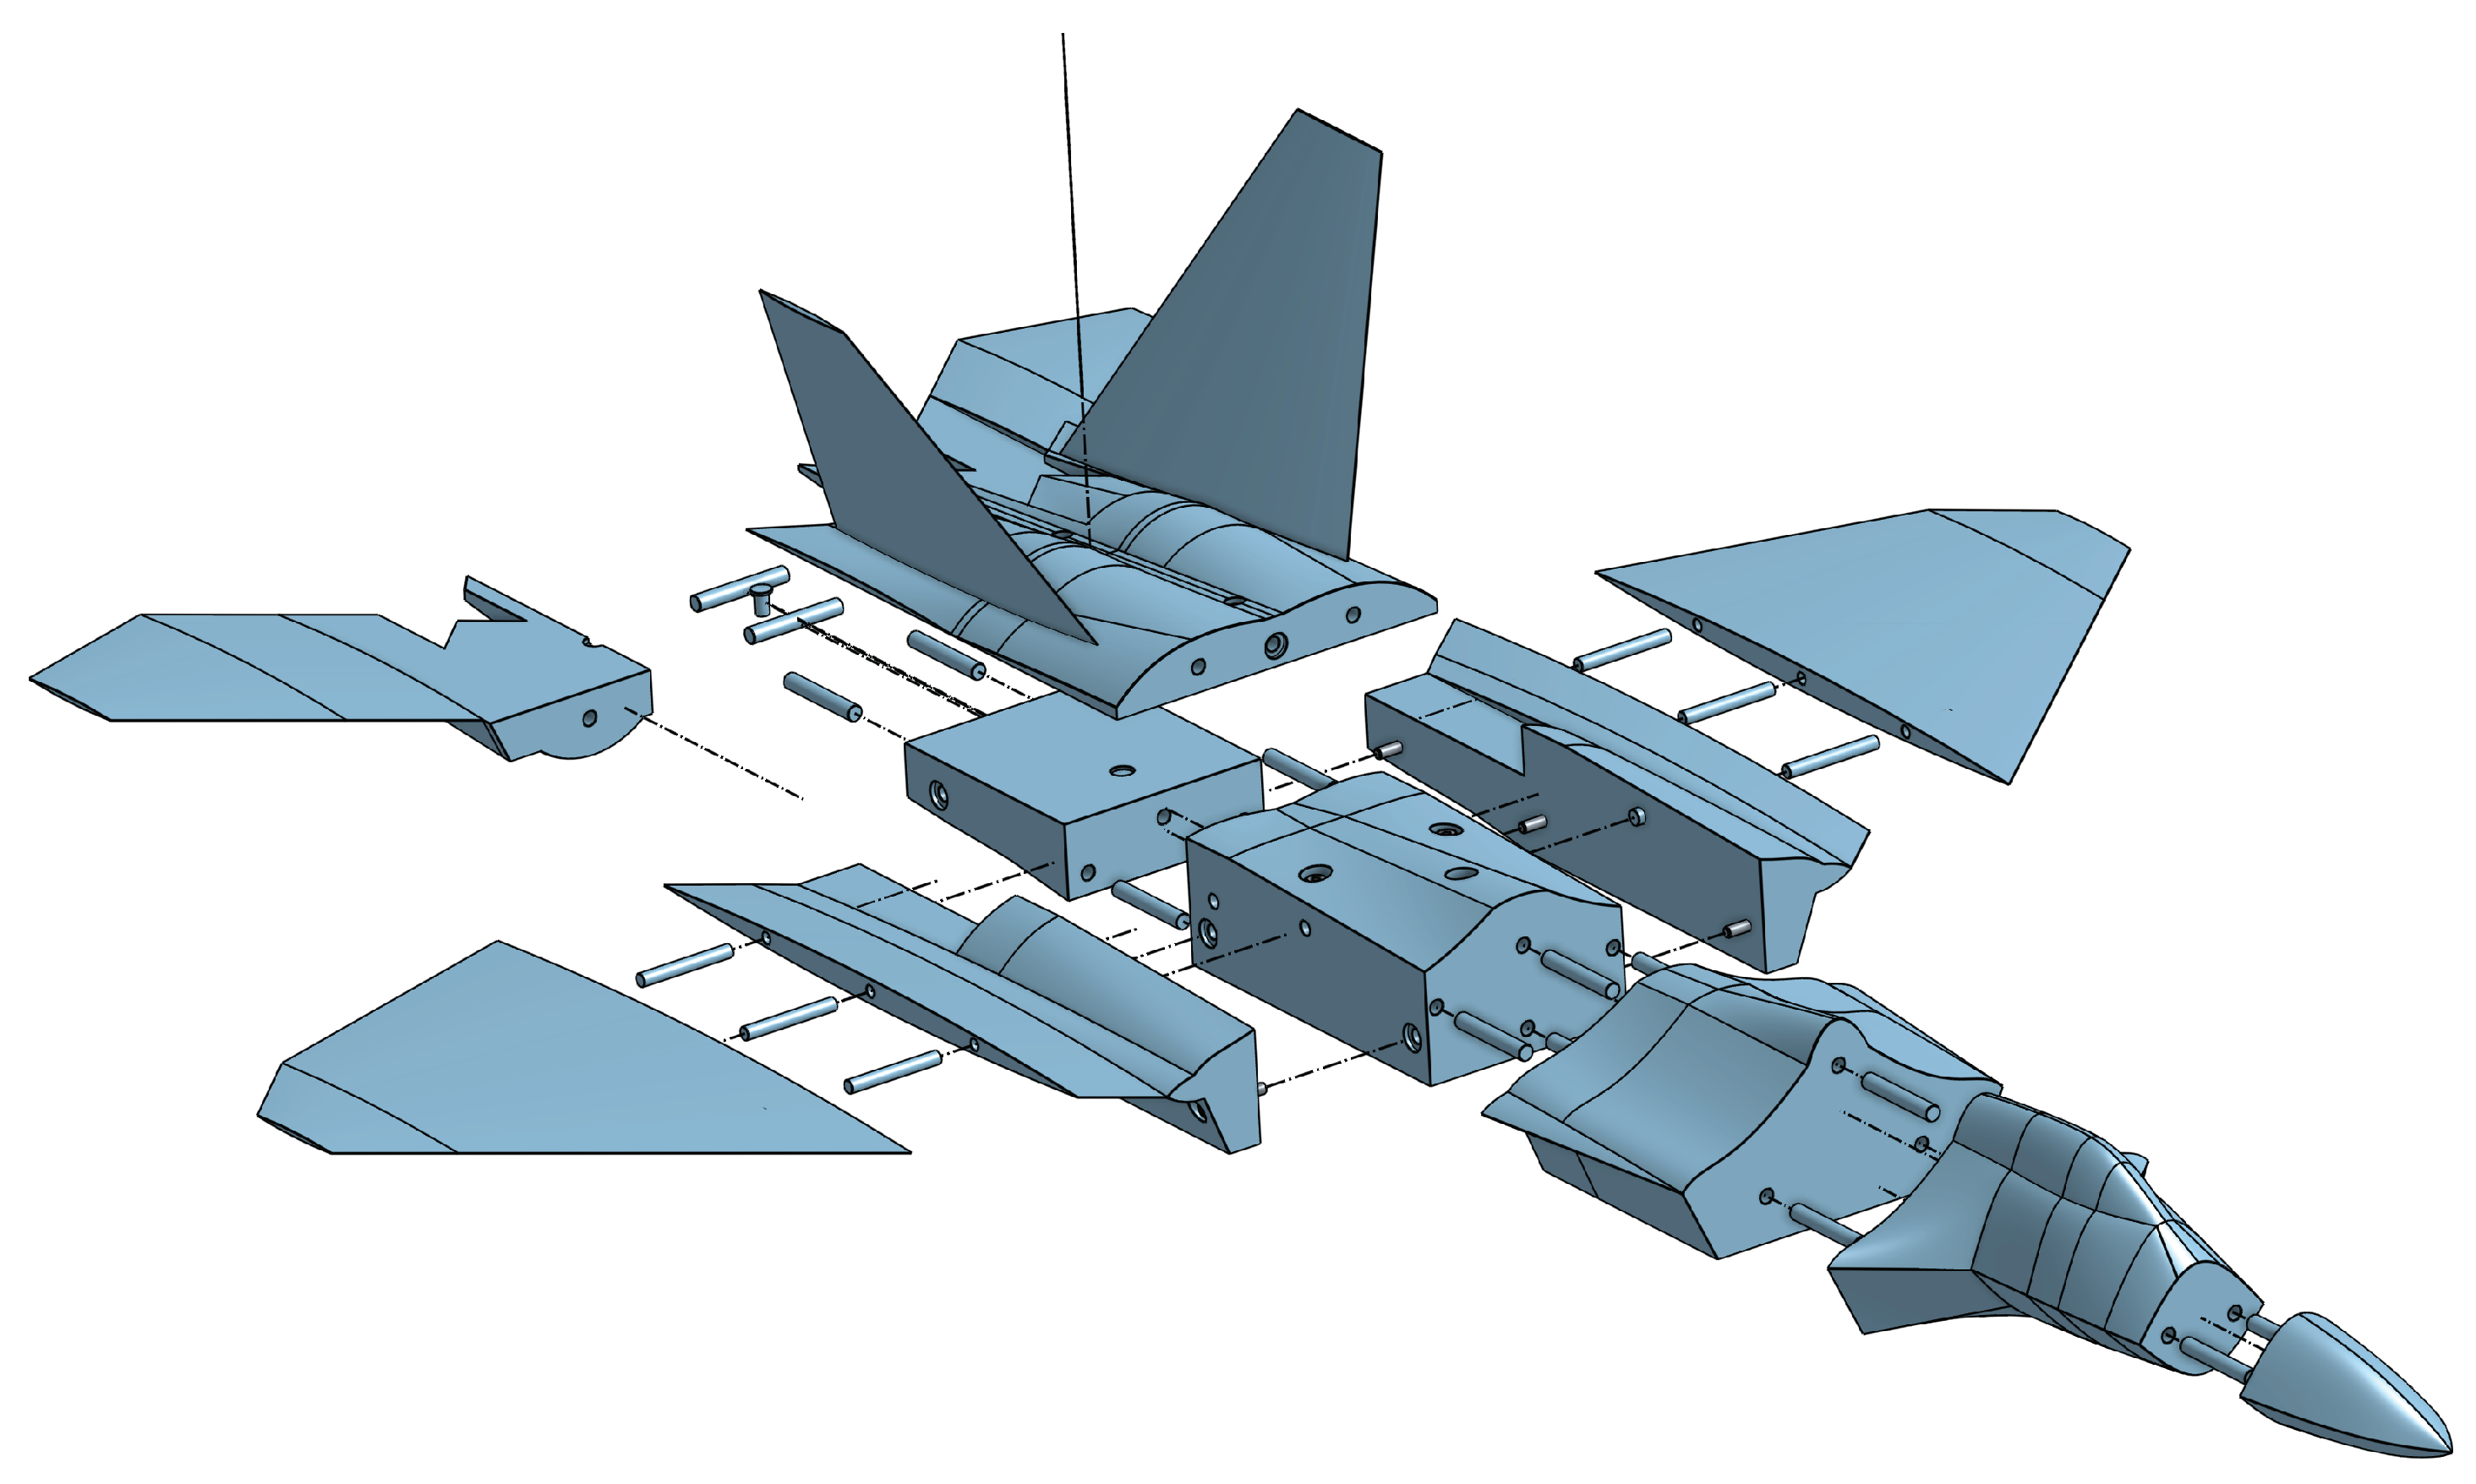
The model is fabricated using an assembly of 3D printed pieces. The model was designed to have removable wings, fins, and horizontal stabilisers to allow future investigations of various control deflection combinations [31,32] as well as flexible structures [33] and, potentially, passive aeroelastic control devices [34,35]. An exploded view of the model is presented in Figure 3.
PLA was used for the the 3D printed parts, and these are shown in Figure 4a with the fully assembled model presented in Figure 4b. Each part was sanded and sprayed for future surface and PIV measurements and coated with XTC-3D resin to provide a smooth finish. The sanding and resin application process was repeated multiple times. It should be noted that some minor warping of the model at the tail was identified. A subsequent study will apply 3D scanning to the manufactured model to determine consistency with the as-designed geometry. Owing to the relative ease of manufacturing the model, a possible future avenue of study may also involve the uncertainty quantification of a number of model assemblies, as outlined in ref [36].
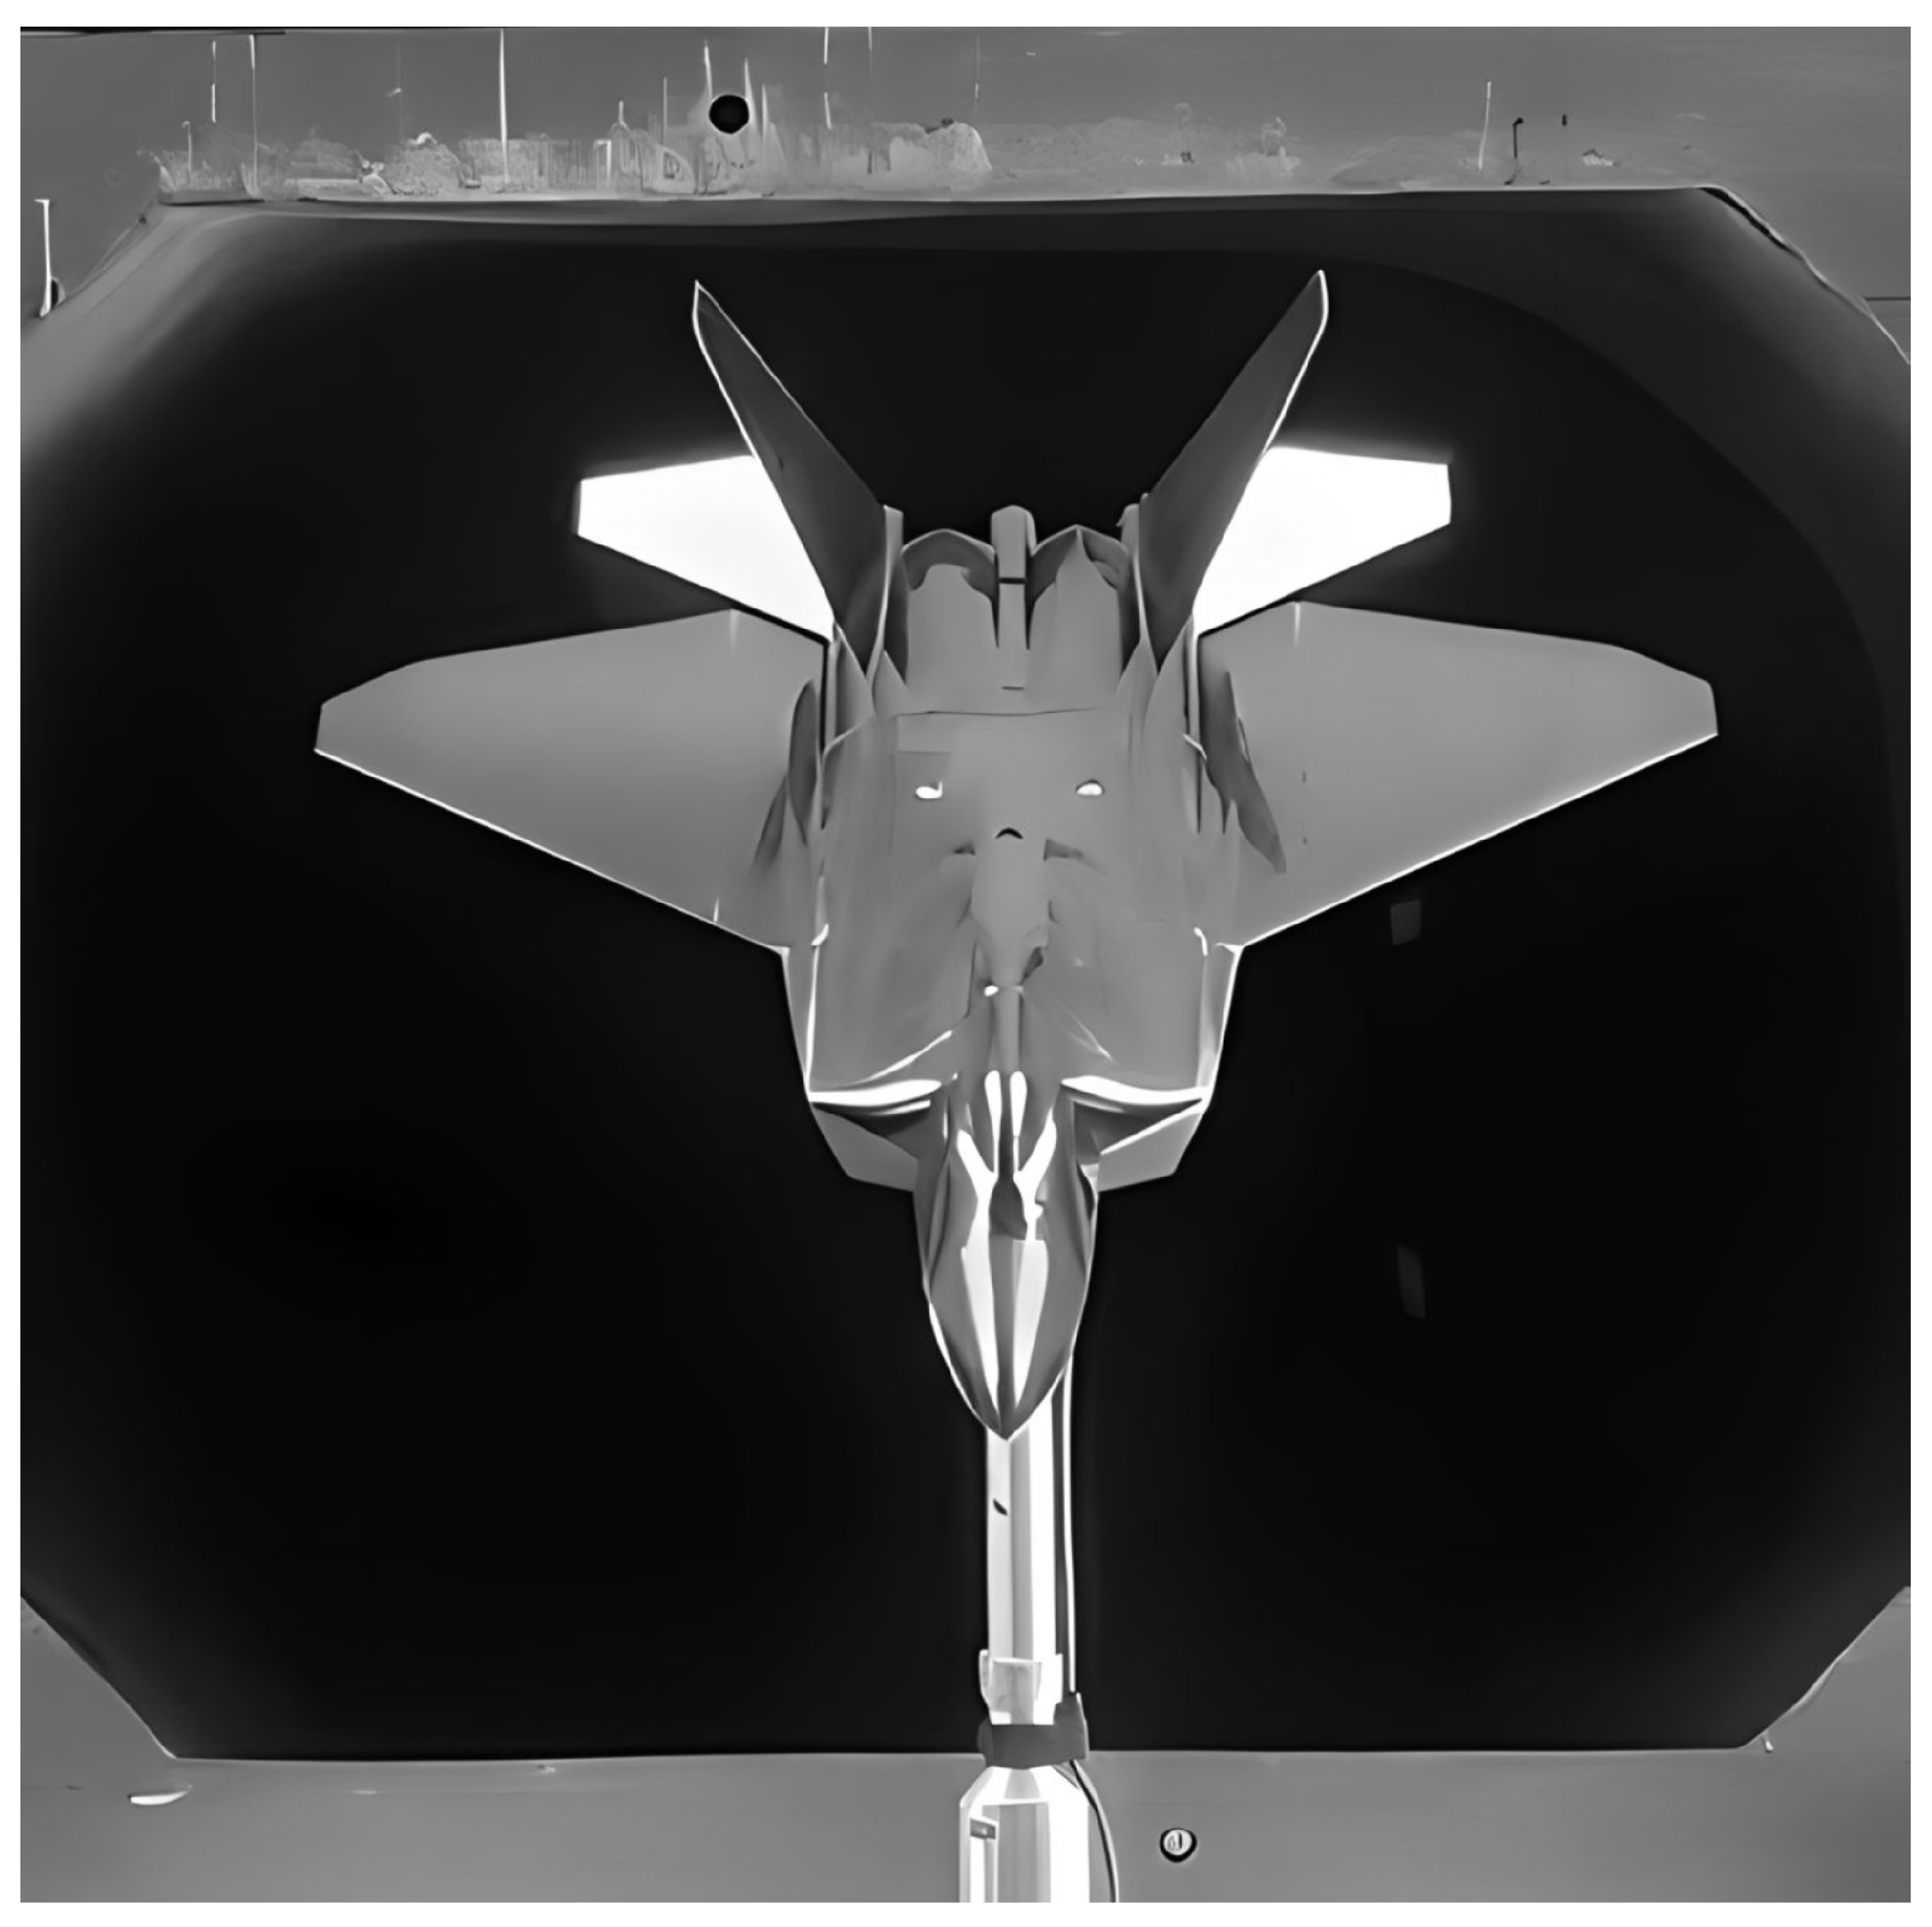
The model was installed within the test section via a strut, as shown in Figure 5. The attachment is located inside a cavity in the model where the load cell resides. The model was designed such that the centreline of the balance cavity is aligned with the model reference plane; however, the potential for a slight misalignment stemming from manufacturing tolerances does exist. While quantifying this potential misalignment is beyond the scope of the present work, the overall correlation between computations and experiments presented in Section 5.2 is reasonable, indicating that such corrections are likely unnecessary. To minimise flow interference, a cover for the cavity is used to provide a smooth surface on the bottom surface of the model. Testing was performed under constant voltage demand for the tunnel fan, i.e., with an increasing angle of attack, the test section speed was not constant due to blockage effects. The angle of attack of the model was then incremented in discrete steps across a range of angles from −5° to +30°.
At the highest AoA, the degree of blockage approaches 10%. To account for the impact of this, blockage corrections for the dynamic pressure were taken from ref. [37]. Due to the unconventional shape, the simple estimations of wake (wb) and solid (sb) blockages in Equation (1) were used. This relationship uses the projected area of the configuration at each AoA condition over the test section’s cross-sectional area. The aerodynamic coefficients were then calculated using the corrected dynamic pressure computed from Equation (2). Due to the short wingspan relative to the test section width, no tip corrections were deemed necessary.
ϵ T = ϵ w b + ϵ s b = A f r o n t a l A W T × 0.25
q c = q a 1 + ϵ T 2

4. Numerical Investigation

To supplement the wind tunnel force measurements and characterise whether the flow features of the SSAM-Gen5 model are consistent with those expected of fifth-generation aircraft, a numerical campaign of Reynolds-Averaged Navier–Stokes (RANS) CFD simulations was also undertaken in the present study. Practices for the solver numerics and spatial resolution were adopted from experience with similar configurations in prior studies by the authors [31,38,39,40] and are further detailed in subsequent sections.

4.1. Solver Numerics

Simulations performed throughout this study were conducted with the finite volume CFD solver ANSYS Fluent 2022R1 [41]. The three-dimensional, steady, incompressible, implicit, coupled pressure-based solver was used to formulate the coupled set of continuity and momentum equations. The choice of an incompressible, pressure-based solver was made, as the flow in the low-speed wind tunnel facility is limited to  M 0.2 , and further, the pressure-based approach does not tend to suffer from issues with numerical stiffness, as is often seen in density-based formulations. Second-order accurate upwind-differencing is used for all convective variables, and diffusive fluxes are treated with a second-order accurate central-difference scheme. Additionally, the gradients for both the convective and diffusive terms are computed at cell faces through a least squares reconstruction scheme.
For each steady simulation performed, solution convergence was predicated on two conditions. The first, a necessary condition, is a reduction in the L1-norm of the overall mass and momentum and scalar balance residuals of at least three orders of magnitude. The second is achieved when the relative change in the aerodynamic coefficients between iterations (averaged over the preceding 10 iterations) reduces to  10 8 . From moderate to high angles of attack, where significant flow unsteadiness is expected, this second criterion may not be achieved. In these instances, the mean value of the fluctuating aerodynamic coefficients is reported and averaged over 5000 iterations once the flow has achieved a steady state.

4.2. Turbulence Modelling

It is well-established that a key aerodynamic feature of highly-swept delta-wing aircraft is the generation of vortex lift to improve the manoeuvrability in high angles of attack during flight [19,20]. The numerical prediction of these vortex-dominated flows remains a challenge for RANS-based approaches, which may exhibit significant sensitivity in the evolution of vortical structures to the turbulence model employed [42]. To classify this sensitivity for the SSAM-Gen5 model, three common turbulence models were considered for closure of the Navier–Stokes equations in the present study: the Spalart–Allmaras (SA) [43] model, Menter’s  k ω  Shear Stress Transport (SST) [44], and the Realisable  k ϵ  (RKE) model [45]. For the SA model, the augmented turbulent production formulation of Dacles-Mariani et al. [46], which accounts for both vorticity and strain tensors, is employed. For the RKE model, an enhanced wall treatment [41] is utilised to alleviate the sensitivity of the  ϵ -equation to near-wall grid spacing. In their standard forms, each of these eddy-viscosity-based closures exhibits insensitivity to both streamline curvature and system rotation. To further assess the modelling sensitivity to the capture of these curvature-related effects in the vortex-dominated flows of interest used in the present study, simulations were also performed for each model additionally employing Spalart and Shur’s [47] rotation and curvature correction (hereafter denoted the curvature correction). This correction comprises a modification to the production term at each closure to sensitise the model to the influences of both streamline curvature and system rotation. Regarding discretisation, all turbulent transport equations are solved in a segregated manner from the coupled set of continuity and momentum equations with second-order accurate upwind discretisation of the turbulent quantities.

4.3. Computational Domain

The computational domain of SSAM-Gen5 comprises a rectangular farfield situated at 50 reference chords from the aircraft geometry in all directions. A subsonic velocity inlet is applied at the forward, starboard, and vertical boundaries of the domain with a pressure outlet at the discharge point. Standard sea-level conditions were employed at the boundaries as no significant deviation was noted during the experimental campaign. As the present investigation considers the longitudinal characteristics of the vehicle, a half-body mesh is constructed with a symmetry boundary condition employed along the fuselage centreline. Future studies assessing the lateral characteristics of the SSAM-Gen5 will, however, require a full-body grid to be analysed.
To ensure the insensitivity of the numerical study to the spatial resolution, a family of four unstructured grids was generated in Pointwise® 2022.1.2, as shown in Figure 6. Each grid is constructed through anisotropic tetrahedral extrusion of a quadrilateral-dominant unstructured surface mesh. The resulting grids are hexahedral-dominant and employ Cartesian-aligned voxel cells through the majority of the domain with a single layer of tetrahedral cells used to transition between nearfield and farfield resolution levels. A hemispherical refinement domain of radius 1 m about the aircraft geometric centre is employed for nearfield refinement. Pointwise® 2022.1.2 and Fluent® 2022R1 mesh files for each grid can be downloaded from https://zenodo.org/communities/ssam_gen5/ to facilitate future code comparison efforts by researchers.
At each level of spatial resolution, refinement is concentrated in regions of large gradients, primarily at the leading, trailing, and tip edges of the aerodynamic surfaces. Between grid levels, refinement is adopted for the reduction of the average spacing of the surface mesh ( Δ ¯ s ), average spacing in the nearfield refinement domain ( Δ ¯ r ), wall-normal spacing, and the wall-normal growth rate. In Table 3, the key metrics for each grid are summarised. It should be noted that the maximum  y +  was evaluated as being at AoA = 30° using the SST model and typically reflects extreme deviations (with the average  y ¯ + < 1  at each level of refinement).

5. Results

5.1. Experimental Study

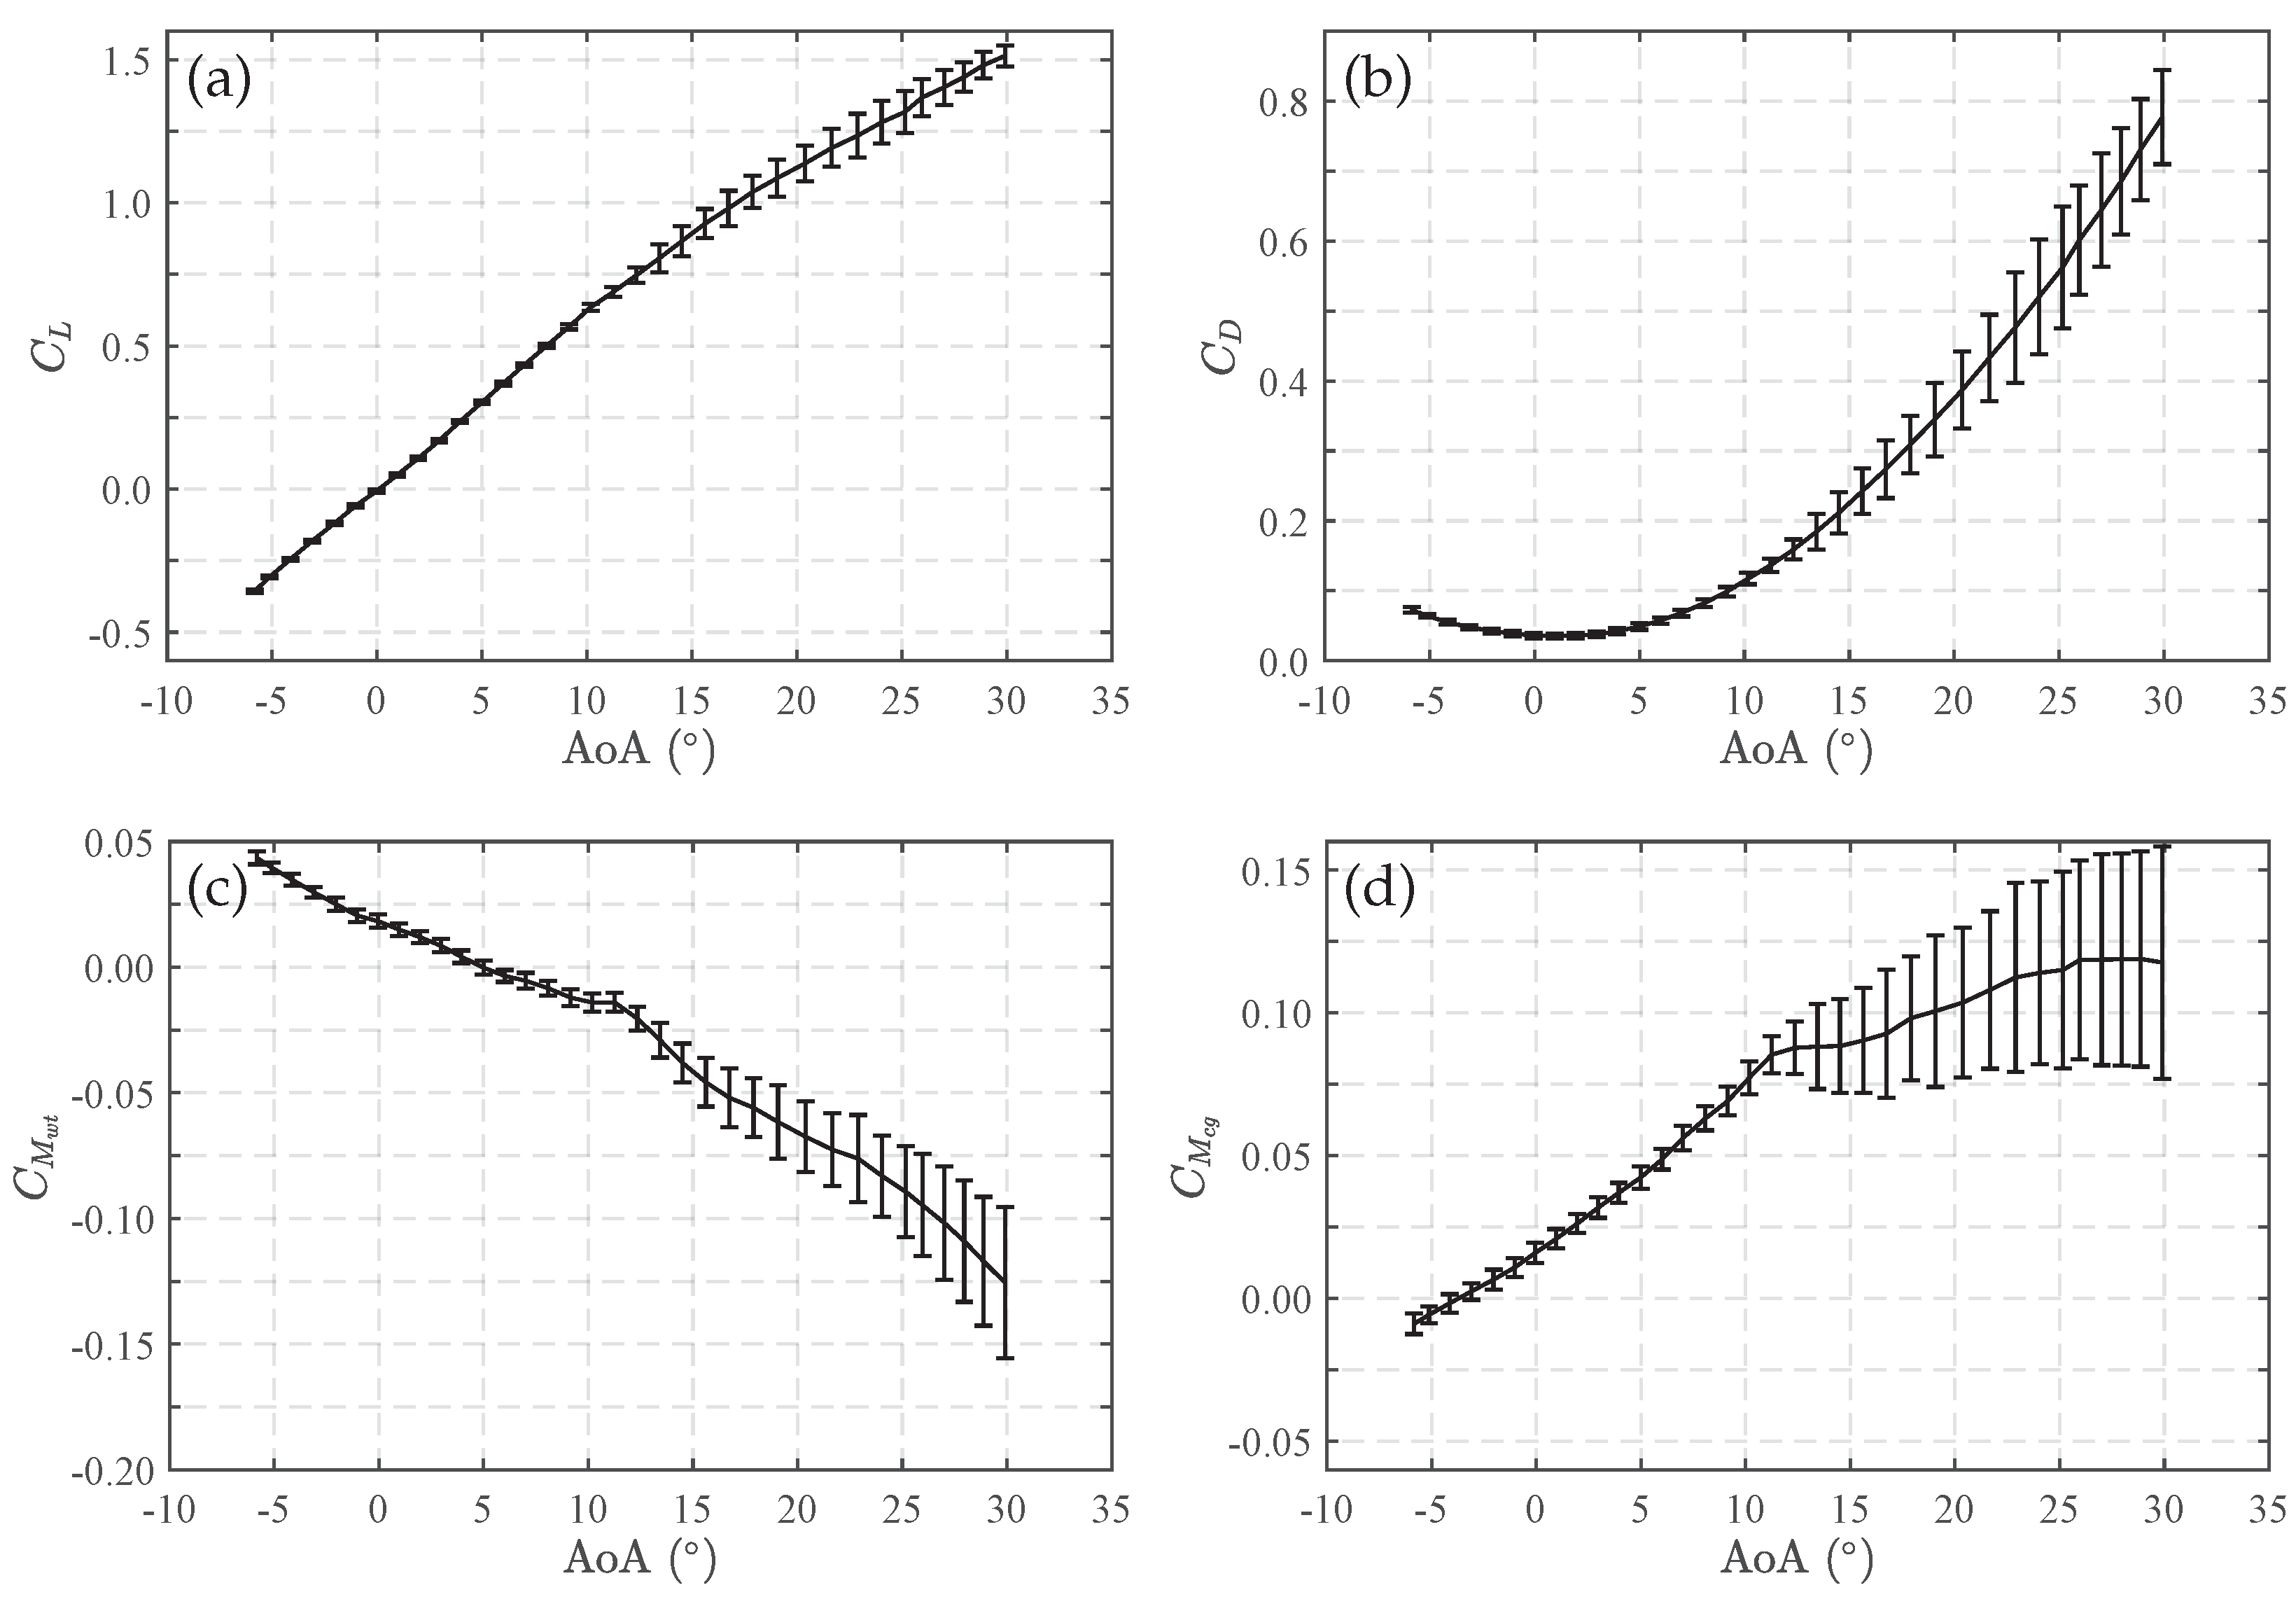
The corrected aerodynamic coefficients acquired during the discrete change in AoA from −5° to 30° at  V = 20  m/s ( R e 3 × 10 5 ) are presented in Figure 7 and can also be downloaded from https://zenodo.org/communities/ssam_gen5/. Error bars are given in the form of standard deviations from the mean values, as calculated across the 10,000 samples taken at each AoA. The lift and drag coefficients, shown in Figure 7a and Figure 7b, respectively, exhibit the typical longitudinal characteristics of slender airframe, delta-wing aircraft. Lift increases monotonically throughout the AoA range considered, contributing a significant lift-induced component to the drag coefficient at high angles. Similar trends and magnitudes in the longitudinal force coefficients have been reported for the F-18 [48], F-16XL [49], and SDM [13] under comparable low-speed incompressible conditions, verifying that the aerodynamic force characteristics of the SSAM-Gen5 are broadly consistent with existing high-performance aircraft.
In addition to the longitudinal force coefficients, Figure 7c provides the pitching moment coefficient as measured at the wind tunnel load cell location. The negative gradient observed throughout the measurement range indicates that the vehicle is statically stable in pitch across the considered AoAs. While low-speed wind tunnel tests of the F-16XL [49] indicate an approximately neutrally stable platform, high-performance configurations typically leverage the static pitch instability to augment the manoeuvrability [39,42,48]. The load cell moment centre for which  C M w t  is shown in Figure 7c is not, however, a representative location for the centre of gravity of the SSAM-Gen5. As such, the pitching moment was recalculated for the estimated CoG location provided in Table 1, which is shown in Figure 7d. Static pitch instability is evident up until approximately 12°, with the break in the pitching moment gradient at high angles and overall magnitudes consistent with existing slender airframe, delta-wing models [39,42,48,50], particularly that of the SDM [13,17,18]. For each of the aerodynamic coefficients provided in Figure 7, the uncertainty bounds are reasonably benign at low angles and begin expanding from AoA  12 ° . Considering both Figure 7a,d, this point coincides with the breaks in both the lift and pitching moment curves. At these and higher angle conditions, the flow is highly separated and unsteady, with the growth in the uncertainty bounds representing more pronounced time-dependent load fluctuations.
The lift-to-drag ratio of Figure 8a shows a peak  L / D  value of approximately 6.5 in the 4° to 6° AoA range, typical of existing low-aspect ratio high-performance platforms. Considering again the lift response of Figure 7a, rather than the typical abrupt loss of lift observed for generic wings with blunt-nosed aerofoil profiles, a break in the lift curve is seen at high AoAs. To further analyse this behaviour, the lift curve slope was calculated using a central difference scheme and is presented in Figure 8b. Somewhat erratic behaviour is noted at high-angles; however, this is expected as the owing to the increased sensitivity of the derivatives to small changes in both the AoA and coefficient values. Nevertheless, the general trend in the data demonstrates that the lift curve slope is highly nonlinear and varies consistently over the AoA range. In particular, a pronounced decline in the lift curve slope is observed at AoAs of between 10° and 25°, as also noted in Figure 7a. This break in the lift curve slope reflects a bifurcation in the vortex system that governs the nonlinear lift response at high angles. This behaviour is considered further from a computational perspective in Section 5.2.3.
Ultimately, the longitudinal aerodynamic characteristics of the SSAM-Gen5 were found to be typical of existing high-performance aircraft models. With the inclusion of twin canted fins, side-of-fuselage engine inlets, and an outer mould line constructed with the consideration of stealth characteristics, the SSAM-Gen5 appears to serve as a representative model of contemporary fifth-generation aircraft.

5.2. Numerical Study

5.2.1. Grid Convergence

To determine the appropriate level of spatial resolution for grid-independent solutions across a wide range of angles of attack, complete sweeps of  6 ° <  AoA  < 30 °  were performed at each level of grid refinement using the SST turbulence model with rotation and curvature correction (SST-CC). Figure 9 provides the resulting longitudinal static aerodynamic coefficients and lift-to-drag ratio with comparisons to the corresponding experimental data set. Below AoA =  10 ° , all longitudinal characteristics are relatively insensitive to the grid resolution for the considered levels of refinement. While the lift and drag behaviour remains consistent between grid levels through to AoA =  30 ° , differences are observed in the pitching moment from the break evident in each of the computations at AoA  10 ° . At high angles, a clear distinction is noted between the levels of refinement, where the coarser levels exhibit variation in the pitching moment with different AoAs and both the fine and extra-fine grids predict a plateau. As these two grid levels yield consistent estimates of the longitudinal aerodynamic characteristics of the SSAM-Gen5 across all angles of interest, all subsequent calculations were conducted on the fine resolution grid.
While Figure 9 indicates that grid-independent solutions were achieved, discrepancies are evident between the computed and experimental aerodynamic coefficients. The lift coefficient of Figure 9a is well-captured through to AoA =  10 ° , from which an overly aggressive break in the lift–curve slope relative to the experiments is observed, resulting in a 17% underprediction in  C L  at AoA =  30 ° . The drag coefficient shown in Figure 9b is generally well-represented by the computations, albeit with a tendency to underestimate drag at both low and high angles. Similarly, the lift-to-drag ratio of Figure 9d exhibits a reasonable correlation with the experiments, both of which display peak values of  L / D 6  in the range  4 ° <  AoA  < 6 ° . The main discrepancy evident in the  L / D  behaviour is present at negative incidence values, where the underprediction in computed  C D  overestimates  L / D  (in a negative sense). Improvement in the base-drag prediction of the SSAM-Gen5, potentially via higher-fidelity turbulence modelling that is capable of capturing transition, would likely yield better correlations to the experiments; however, this is beyond the scope of the present study.
The most pronounced differences between the SST-CC computations and the experiments are apparent in the pitching moment behaviour shown in Figure 9c. While the simulations correctly predict the static pitch instability and pitching moment break at AoA  12 ° , the low-angle slope is overestimated and high-angle behaviour deviates significantly. The discrepancies here are somewhat expected. Blockage effects become increasingly pronounced at high angles, approaching 10% at the maximum AoA considered and exceeding the 5% recommendation of Barlow et al. [37]. Future work, comprising a computational analysis of the model installed within the wind tunnel facility, will seek to determine whether blockage effects contribute significantly to the observed differences. Additionally, the pitching moment behaviour is highly sensitive to both the precise location of the moment centre and the computed pressure distribution, which is heavily reliant on the chosen turbulence model, particularly at high angles. The deviations observed in both the lift and the pitching moment originate from the vicinity of  10 ° <  AoA  < 15 ° , coinciding with the onset of flow nonlinearities indicated by the pitching moment break and abrupt decline in the lift–curve slope noted in the experiments. As nonlinear flow effects, including flow separation and vortex bursting, become more pronounced at these high angles, the predicted aerodynamic behaviours also become heavily reliant on the specific turbulence modelling approach employed. This sensitivity is explored further in Section 5.2.2.

5.2.2. Turbulence Model Sensitivity

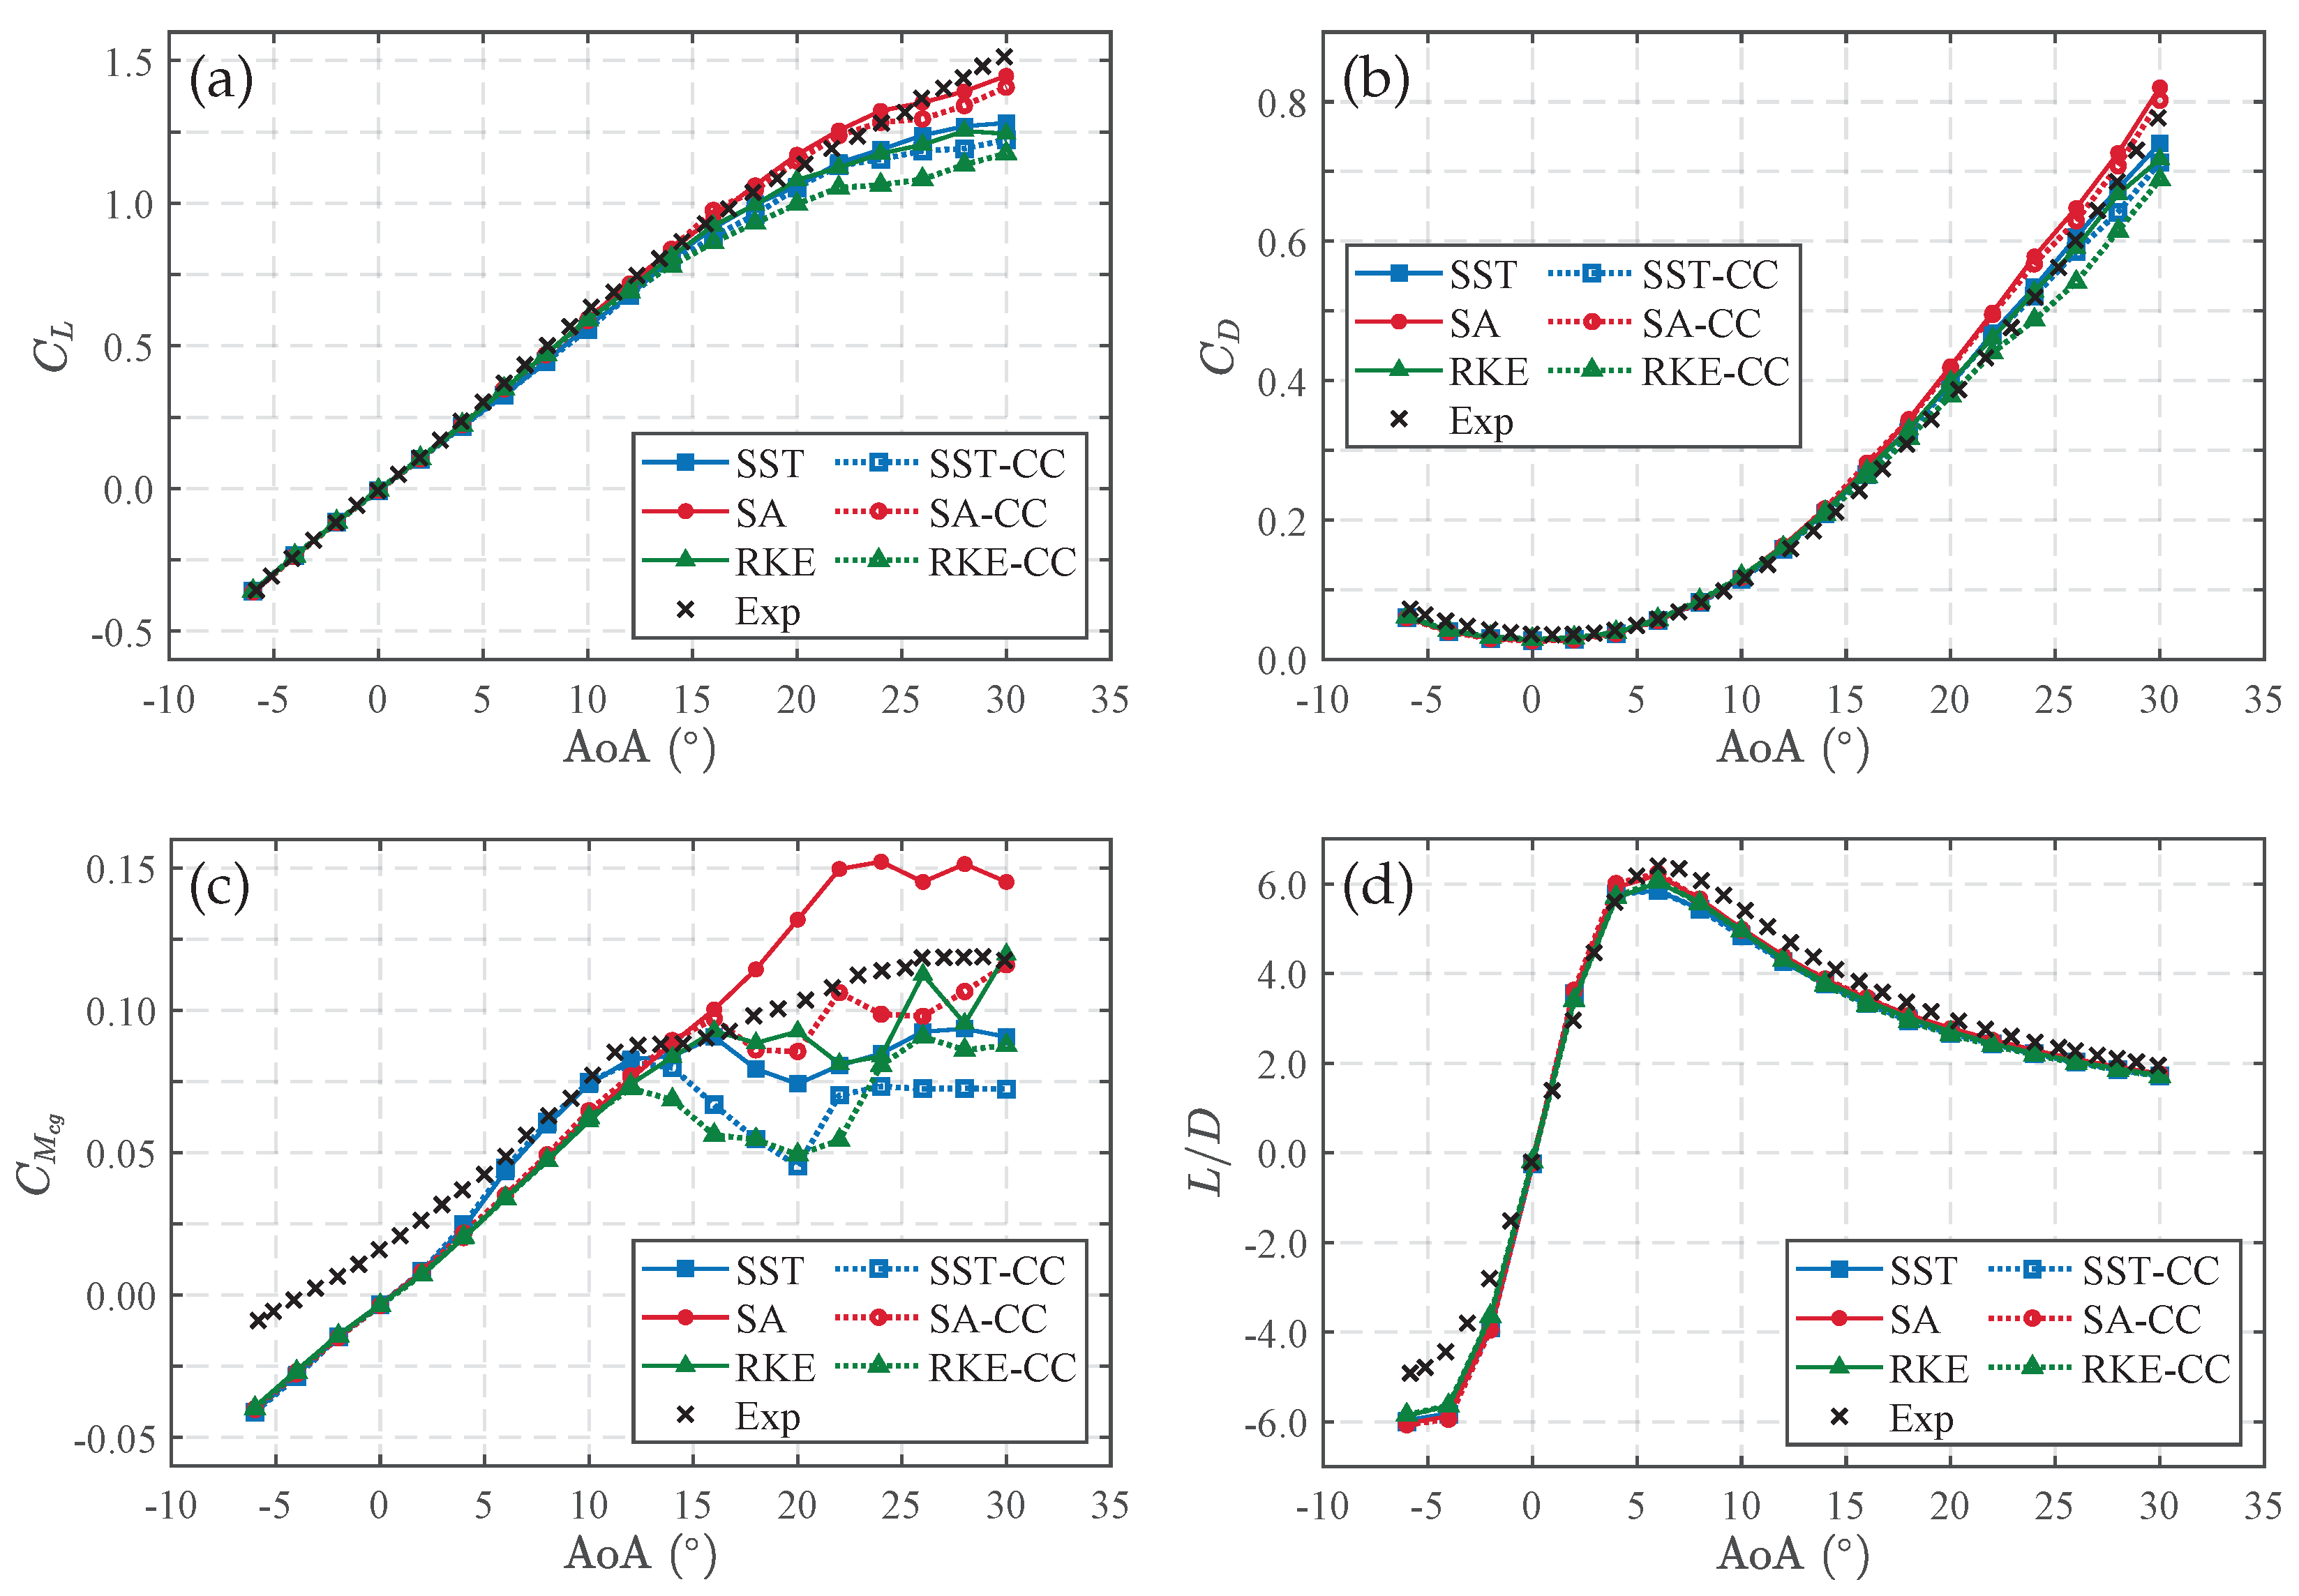
The discrepancies between the experimental and computational longitudinal coefficients at high angles detailed in Section 5.2.1 provided impetus for exploring the sensitivity of the predicted aerodynamic characteristics of the SSAM-Gen5 to the closure model employed. Figure 10 shows the resulting longitudinal coefficients computed with the SST, SA, and RKE models in both their baseline forms and with Spalart and Shur’s [47] curvature correction applied. Considering the lift and drag behaviours, the turbulence model class imparts an overt influence over the high-angle behaviour. The SA models predict the highest lift and drag with good correlation for high-angle lift and overestimation in drag. The SST models underestimate both lift and drag at high AoAs, with this underprediction further exacerbated by the RKE class. Overall, the SA class of models appears to best reproduce the high-angle characteristics of the SSAM-Gen5. This finding is interesting, as previous studies [42,51] noted the tendency of SA models to overpredict the production of eddy viscosity in vortical flows. It is proposed that the reasonable agreement found here stems from the application of the strain/vorticity formulation for turbulent production [46]; however, a dedicated study considering alternative SA variants will be required to confirm this hypothesis.
The effect of Spalart and Shur’s [47] curvature correction is also consistent across each class of closure. The lift and drag curves of Figure 10a,b, respectively, each indicate a reduction in high-angle lift and drag with the correction applied. Similar findings were also reported by Lei [52] for the influence of the rotation and curvature correction in the SA model on JAXA’s Jet-01th baseline model. It is interesting to note that for each closure considered, the inclusion of the correction to better reflect the streamline curvature and rotation effects in these vortex-dominated flows degrades the correlation to the experiments of the lift response. Such an observation is not inconceivable, as Dikbaş and Baran [53] noted analogous behaviour in their study of missile manoeuvrability as part of NATO’s AVT-316 program. Nonetheless, this effect is somewhat expected for the RKE model, which inherently incorporates rotational effects, rendering the use of the rotation and curvature correction unnecessary. Further study is required to qualify this degradation in correlation for both the SST and SA models. This will be aided by supplementary experimental data, with additional testing planned to acquire surface pressure and flowfield data.
The most pronounced differences between the closures considered are apparent in the pitching moment coefficient predictions shown in Figure 10c. For AoAs of  < 5 ° , each of the models yields equivalent variations in  C M c g , exhibiting a consistent deviation in the pitching moment slope relative to the experiments. Further study is necessary to ascertain the origins of this low-angle discrepancy. At higher angles, the SST models are found to deviate from the other closures from approximately AoA = 5°; however, each closure assessed displays a pronounced pitch break at  10 ° <  AoA  < 15 ° , as is also seen in the experiments. The high-angle behaviour is consistent with the trends noted for lift and drag; the largest pitching moment predictions are provided by the SA, followed by the SST and then the RKE, with the rotation and curvature correction acting to reduce  C M c g  at high angles. While the quantitative prediction of the high-angle pitching moments indicate significant variability owing to the high sensitivity to the computed pressure distribution, the overall qualitative trend is reasonably consistent with the experiment, particularly for the SA-CC.
Conversely, the lift-to-drag ratio shown in Figure 10d is comparatively insensitive to the turbulence modelling approach with the discrepancies at low angles discussed in Section 5.2.1 persisting. It is worth noting that each of the closures considered in this study assumes fully-turbulent flow through the entirety of the domain. As the experimental Reynolds number is in the order of  R e 3 × 10 5  based on the mean aerodynamic chord, this assumption is not necessarily valid. Although the geometric singularity induced by the leading edge imposes separation at moderate to high angles, the low-angle behaviour is likely more sensitive to Reynolds number effects. A similar reasoning applies to the deviation in computed and experimental drag coefficients in this angle of attack range. While this is beyond the scope of the present study, incorporating transition modelling through correlation- or intermittency-based RANS models or higher-fidelity scale resolving simulations may clarify whether these low-Reynolds effects have significant impacts on the low-speed flow over the SSAM-Gen5.
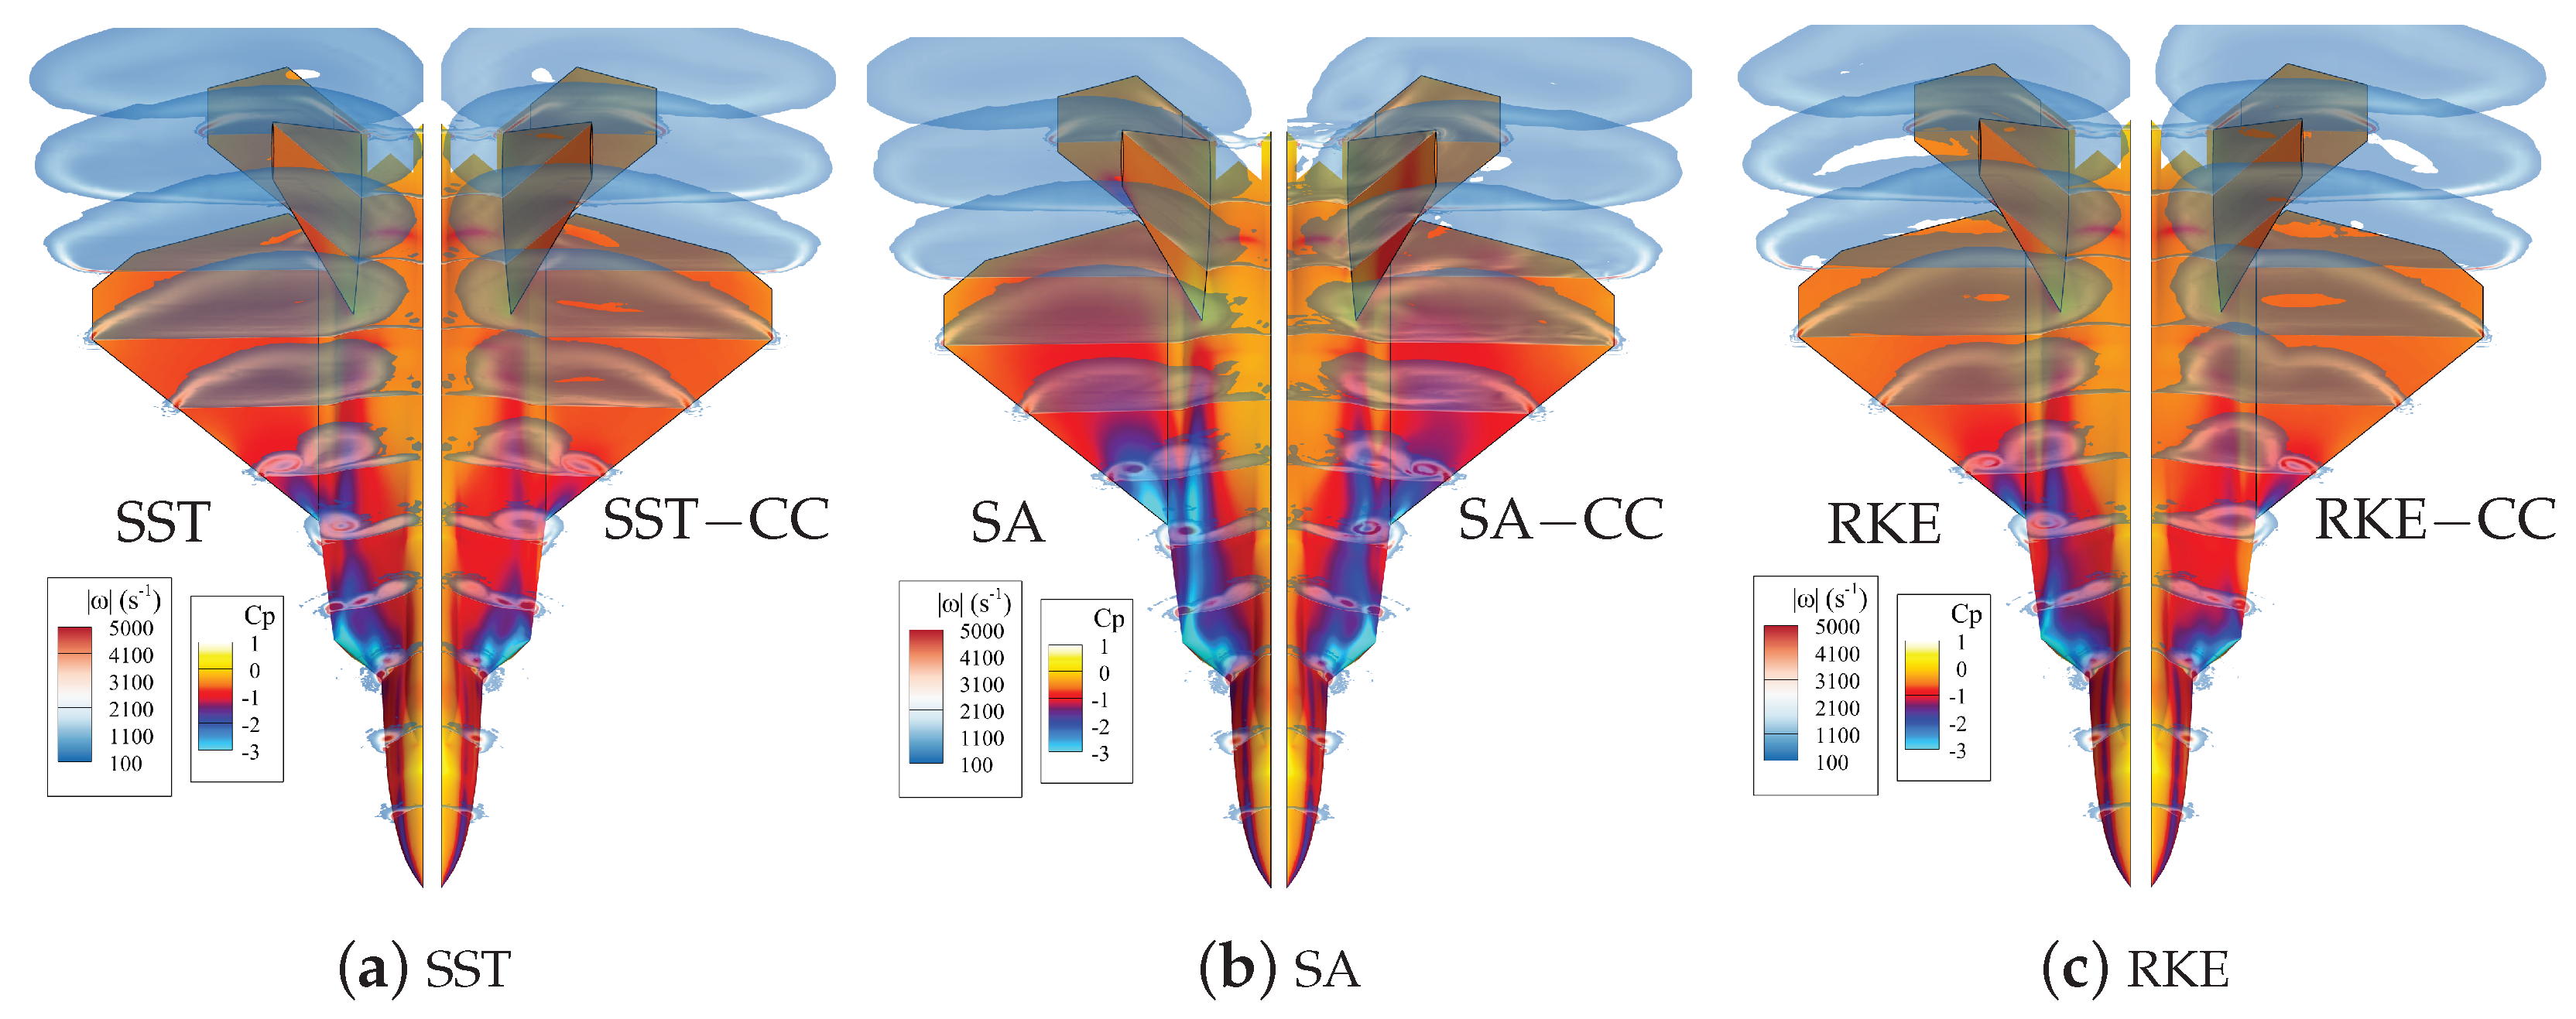
To illustrate the differences in flow topology predicted by each of the closures, Figure 11 provides the upper surface pressure contours computed by each model at AoA =  30 ° . Planar slices of vorticity magnitude  | ω |  are also superimposed at various streamwise locations. A visual inspection of the vortices for each turbulence model shows that the same structures are present with particularly good agreement between the size and  | ω |  of the vortices originating from the nose. These vortices track inboard around the cockpit in the spanwise direction, while additional regions of recirculating flow are seen to appear around the junction of the closed engine intakes with the body of the aircraft. Further flow separation is observed along the leading edge strake, causing three zones of decreasing vorticity when moving from the outboard to the inboard area of the strake. Finally, leading edge flow separation at the main delta sees the appearance of a single vortex. Comparing the surface pressure contours shown in Figure 11 with the lift response shown in Figure 10a, the trends in high-angle lift prediction are seen to stem directly from the predicted upper surface pressure distributions. The SA variants display substantially lower-pressure vortices emanating from both the strake and main wing root leading edge, correlating with the comparatively high lift. These suction peaks are less pronounced for both the SST and RKE variants. Additionally, the use of curvature correction imparts an overt influence on the flow topology, providing higher pressures in the regions of the vortex cores. This trend is consistent across each of the closures considered, where the suction strength from the vortices reduces when using the curvature correction.
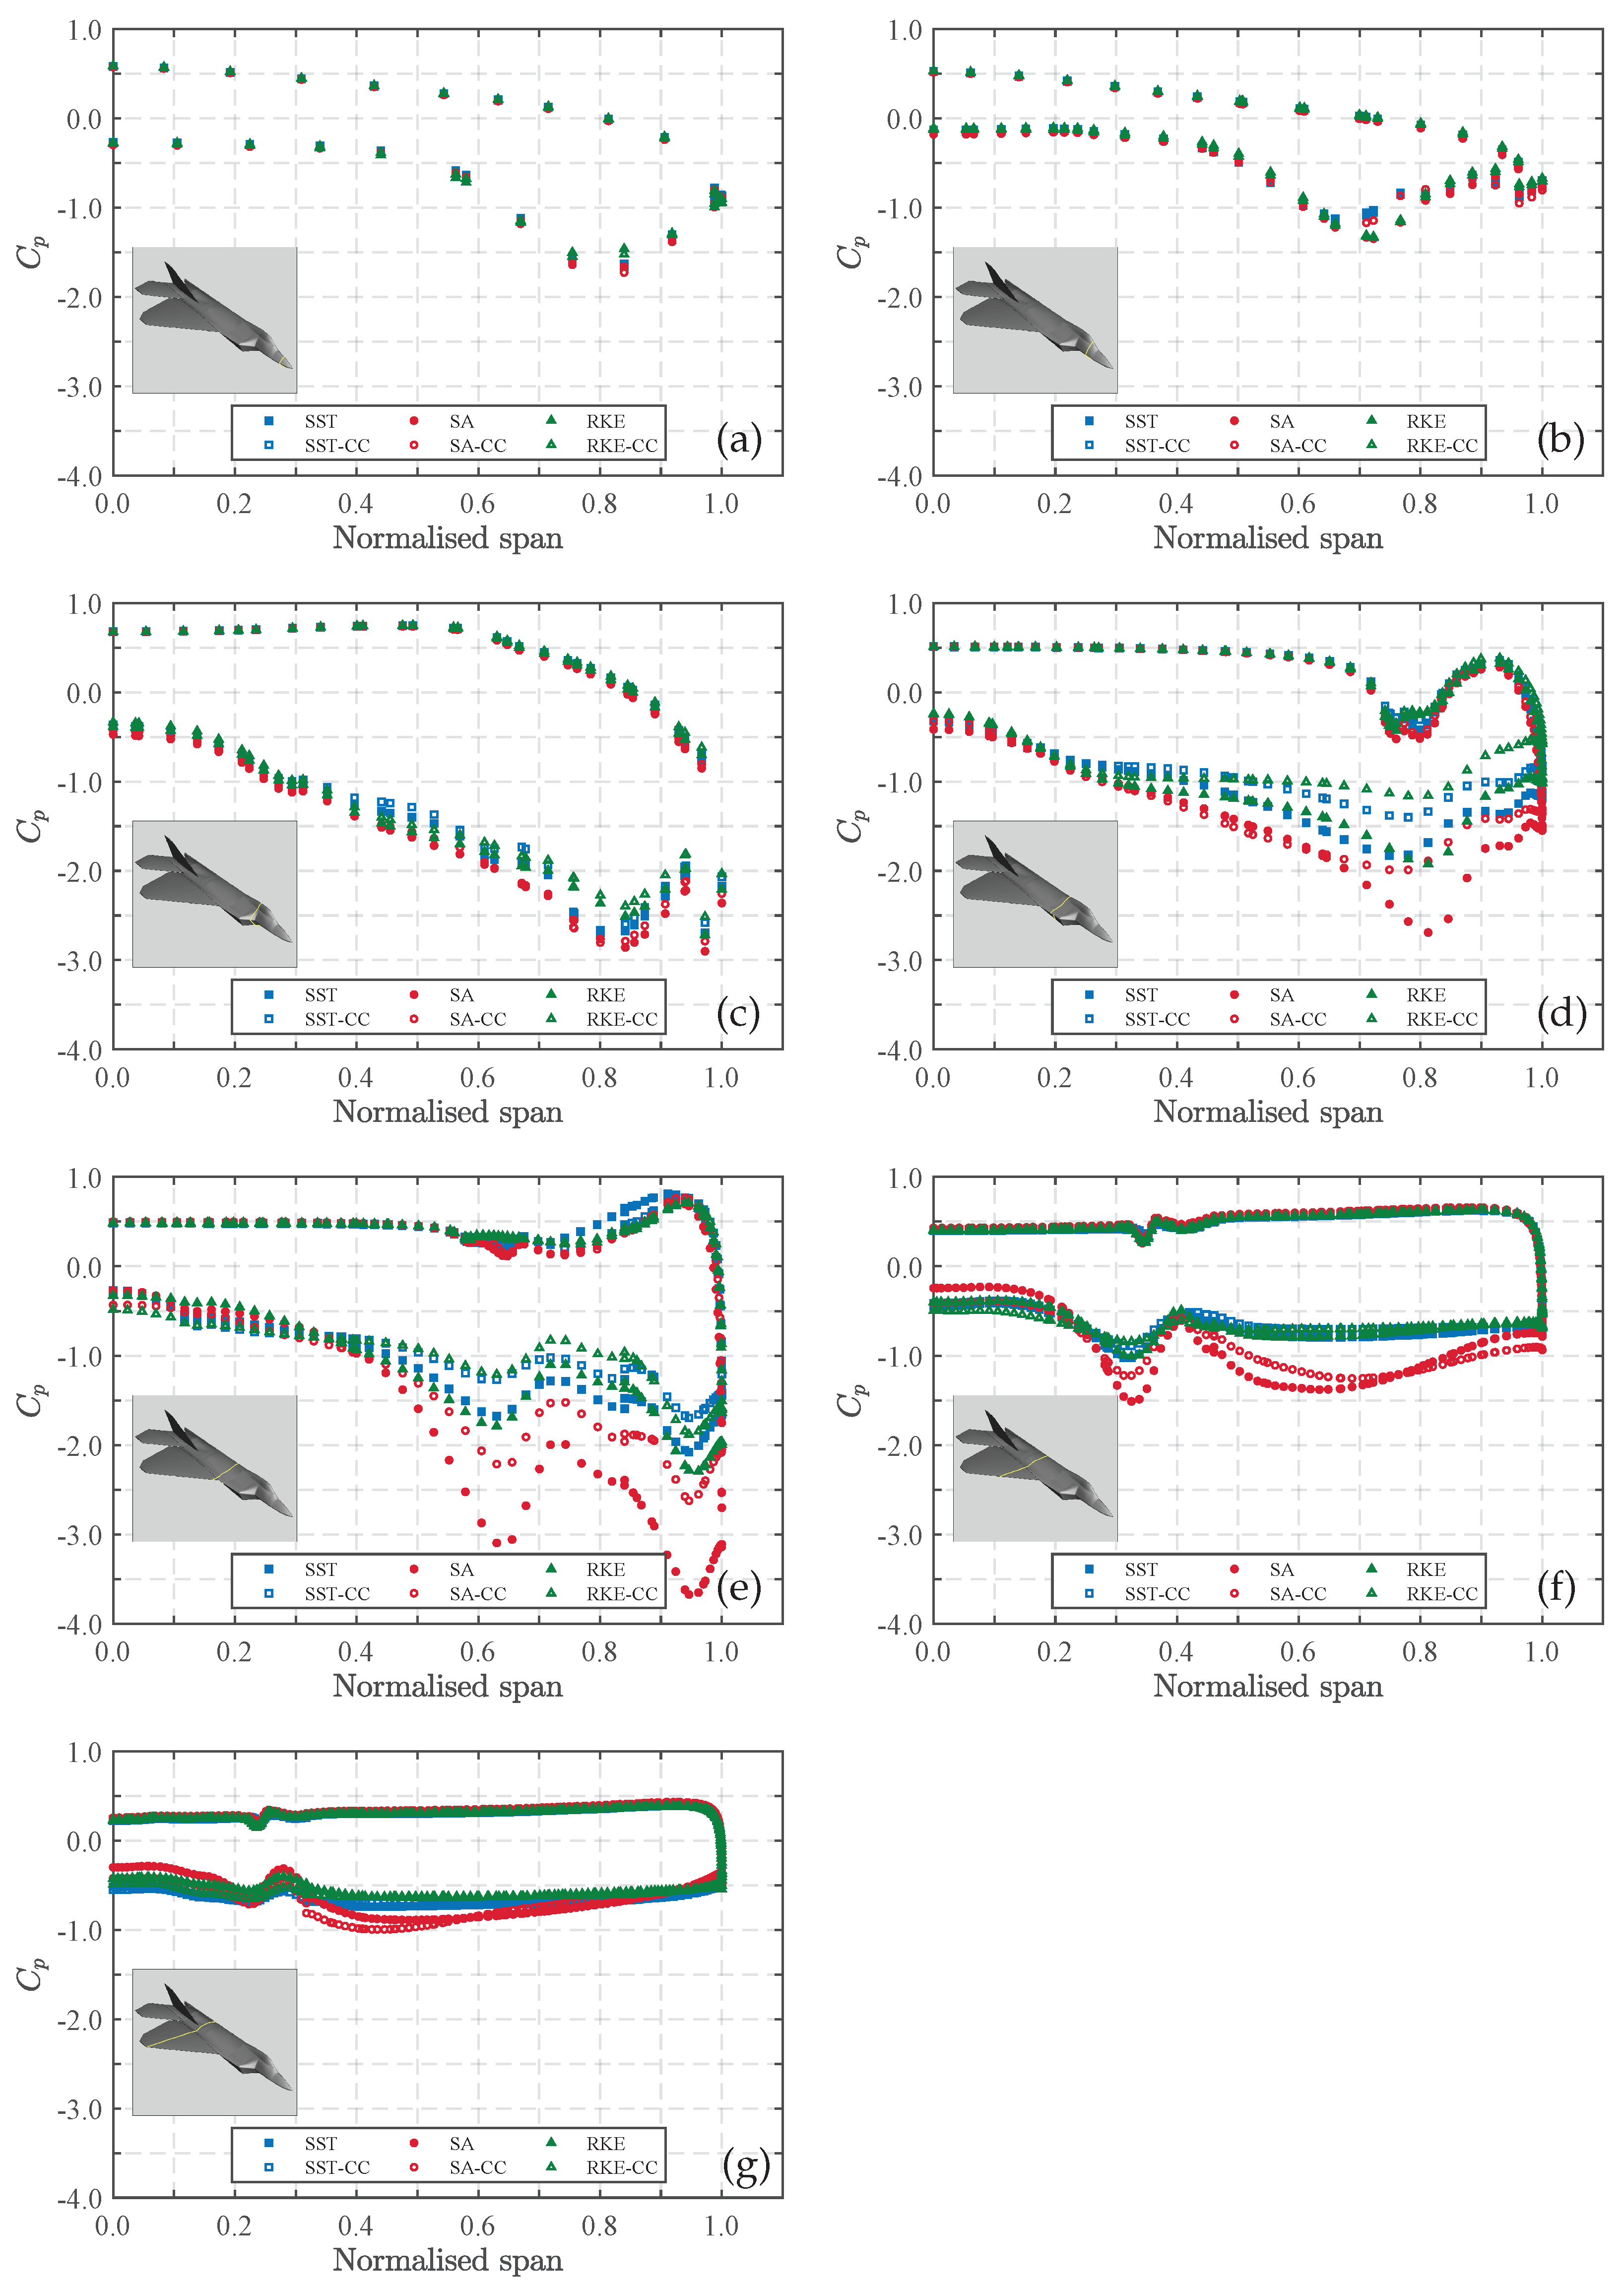
Figure 12 offers further comparisons between the various turbulence model predictions through spanwise pressure coefficient plots at various streamwise locations. Little difference is observed up until the strake leading edge in Figure 12c, where more pronounced inboard suction of the SA variants becomes apparent. This is exacerbated between the strake and main wing leading edges for the baseline SA model presented in Figure 12d with the SA-CC also exhibiting more pronounced suction near the main wing leading edge in Figure 12e. At all streamwise locations, each turbulence model indicates vortex-induced suction peaks at approximately equivalent spanwise locations, albeit with varying intensities. Farther downstream, the SST and RKE models are relatively consistent with no significant suction peak evident towards the main wing trailing edge in Figure 12g. This is contrary to the SA results, which show mild suction across the mid-span. Overall, while each closure broadly reflects the experimentally determined longitudinal characteristics of the SSAM-Gen5, the SA-CC model appears to provide the best correlation. As noted in previous studies [23,51], more complete flowfield representations may be offered through the use of Reynolds stress models and scale-resolving simulations. Owing to the increased computational expense of these simulations, the assessment of their influence remains beyond the scope of the present work.

5.2.3. Vortex Evolution

The lack of stall seen in the lift coefficient from both the CFD and experimental investigations is expected for a delta-wing geometry with sharp leading edges. As noted in Section 1, this is inherently tied to the generation of vortex lift through leading edge flow separation and the subsequent formation of vortices. While the suction created by this vortex lift is strong, the associated drag increment is high. To illustrate the evolution of this vortex behaviour, Figure 13 shows the contours of the pressure coefficient over the vehicle surface from low to high AoAs, as computed through the SA-CC closure.
For the 6° AoA case shown in Figure 13b, the initiation of flow separation is seen, while at 12, in Figure 13c, the increased strength of this vortex is characterised by the drop in pressure near the leading edge of the wings, highlighting where vortex lift is primarily active. As the AoA is increased further, the regions of low pressure do not emanate as far in the chordwise direction. The low-pressure regions increase in magnitude and become localised to the inboard sections of the wing leading edge. Between the 18° and 30° cases, it can be seen that the strake vortex core size increases, suggesting conditions close to burst. These cases also show the formation of vortices at the nose and upper body regions of the vehicle. For the high-angle cases shown in Figure 13e,f, the passage of the potentially burst vortex cores over the canted fin is also apparent. While additional experimental data comprising unsteady surface pressures at the fins are required, this serves as an indication that the SSAM-Gen5 may be a suitable benchmark model candidate for the study of the empennage buffet [54,55].

6. Conclusions

This paper presented longitudinal aerodynamic results from a generic fifth-generation high-performance aircraft, which has been made publicly available to the research community. The vehicle was tested at the University of Sydney in a 4 ft × 3 ft subsonic wind tunnel at a freestream velocity of 20 m/s, which correlates to a Reynolds number in the order of  R e 3 × 10 5 . Comparisons between the experimental data and numerical results were completed using three different turbulence models, both with and without curvature corrections. Investigations show strong correlations between aerodynamic coefficients from the two data sets up to an angle of attack of 15°, indicating that the basic experimental and computational approaches are valid. Past this point, the flowfield is dominated by unsteady effects due to separated flow, which appears to be best captured by the single-equation Spalart–Allmaras model with curvature correction activated. Recommendations for further investigations stemming from these investigations include the evaluation of the influence of Reynolds number variation on the aerodynamic coefficients, the investigation of unsteady computational methods, as well as the updating of the wind tunnel model to allow surface pressure tapping to further evaluate the ability of the RANS models to predict vortex locations. General recommendations for future work include the generation of lateral directional aerodynamics as well as the determination of static control and dynamic derivatives. The generation of aerodynamic data outside of the subsonic incompressible flow regime and at Reynolds numbers more closely representative of full-scale in-flight conditions is highly desirable but relies on collaborations with other research institutions.

Author Contributions

Conceptualisation, T.B. and G.A.V.; methodology, T.B., N.F.G. and G.A.V. and N.F.G.; software, N.F.G. and T.B.; validation, N.F.G., T.B. and G.A.V.; formal analysis, N.F.G., T.B. and G.A.V.; investigation, N.F.G., T.B. and G.A.V.; resources, G.A.V.; data curation, T.B., N.F.G. and G.A.V.; writing, N.F.G. and T.B.; review and editing, T.B., N.F.G. and G.A.V.; visualisation, N.F.G. and T.B.; supervision, G.A.V. All authors have read and agreed to the published version of the manuscript.

Funding

This research received no external funding.

Data Availability Statement

Geometry, computational meshes, and corrected experimental data can be downloaded from https://zenodo.org/communities/ssam_gen5/.

Acknowledgments

The authors acknowledge the facilities and the scientific and technical assistance of the Sydney Informatics Hub at the University of Sydney and, in particular, access to the high performance computing facility Artemis.

Conflicts of Interest

The authors declare no conflict of interest.

Abbreviations

The following abbreviations are used in this manuscript:
AIAAAmerican Institute of Aeronautics and Astronautics
AoAAngle of Attack
CAWAPCranked Arrow Wing Aerodynamics Project
CCCurvature Correction
CFDComputational Fluid Dynamics
CoGCentre of Gravity
MACMean Aerodynamic Chord
RANSReynolds-Averaged Navier-Stokes
RKERealisable k- ϵ
SASpalart-Allmaras
SDMStandard Dynamics Model
SSAMSydney Standard Aerodynamic Models
SSTShear Stress Transport

References

  1. Simms, D.; Schreck, S.; Hand, M.; Fingersh, L. NREL Unsteady Aerodynamics Experiment in the NASA-Ames Wind Tunnel: A Comparison of Predictions to Measurements; Technical Report TP-500-29494; NASA: Golden, CO, USA, 2001.
  2. Rivers, M.B.; Quest, J.; Rudnik, R. Comparison of the NASA Common Research Model European Transonic Wind Tunnel Test Data to NASA Test Data (Invited). In Proceedings of the 53rd AIAA Aerospace Sciences Meeting, Kissimmee, FL, USA, 5–9 January 2015. [Google Scholar]
  3. Daneshmand, S.; Adelnia, R.; Aghanajafi, S. Comparison between FDM Model and Steel Model as Wind Tunnel Testing Models. In Proceedings of the 6th WSEAS International Conference on Robotics, Control and Manufacturing Technology, Hangzhou, China, 16–18 April 2006. [Google Scholar]
  4. Kroll, E.; Artzi, D.; Ralbag, G. Structural design guidelines for wind tunnel models made by rapid prototyping. In Proceedings of the 27th International Congress of the Aeronautical Sciences, Nice, France, 19–24 September 2010. [Google Scholar]
  5. Quick, H.; Widjaja, R.; Anderson, B.; Woodyatt, B.; Snowden, A.D.; Lam, S. Phase I Experimental Testing of a Generic Submarine Model in the DSTO Low Speed Wind Tunnel; Technical Report DSTO-TN-1101; DST Group: Fishermans Bend, VIC, Australia, 2012.
  6. Khann, R.H.; Umale, S. CFD Aerodynamic Analysis of Ahmed Body. Int. J. Eng. Trends Technol. 2014, 17, 301–308. [Google Scholar] [CrossRef]
  7. Cermak, J.E. Wind-tunnel development and trends in applications to civil engineering. J. Wind. Eng. Ind. Aerodyn. 2003, 91, 355–370. [Google Scholar] [CrossRef]
  8. Damljanovic, D.; Vukovic, D.; Ocokoljic, G.; Ilic, B.; Rasuo, B. Wind Tunnel Testing of ONERA-M, AGARD-B and HB-2 Standard Models at Off-Design Conditions. Aerospace 2021, 8, 275. [Google Scholar] [CrossRef]
  9. Vassberg, J.; Dehaan, M.; Rivers, M.; Wahls, R. Development of a common research model for applied CFD validation studies. In Proceedings of the 26th AIAA Applied Aerodynamics Conference, AIAA-2008-6919, Honolulu, HI, USA, 18–21 August 2008. [Google Scholar]
  10. Beyers, M. Stability Derivatives due to Oscillation in Roll for the SDM at Mach 0.6; Technical Report LTR-UA-64; National Research Council Canada: Ottawa, ON, Canada, 1983.
  11. Beyers, M. Pitch and Yaw Oscillation Experiments on the SDM at Mach 0.6; Technical Report LTR-UA-76; National Research Council Canada: Ottawa, ON, Canada, 1984.
  12. Beyers, M.; Huang, X. Subsonic Aerodynamic Coefficients of the SDM at Angles of Attack up to 90°; Technical Report LTR-UA-93; National Research Council Canada: Ottawa, ON, Canada, 1990.
  13. Huang, X. Wing and Fin Buffet on the Standard Dynamics Model; Technical Report Defense Technical Information Center Compilation Part Notice ADPOI0722; Field Technology Inc.: Long Beach, CA, USA, 2000. [Google Scholar]
  14. Almosnino, D. Aerodynamic calculations of the standard dynamics model in pitch and roll oscillations. In Proceedings of the 32nd Aerospace Sciences Meeting and Exhibit, AIAA-94-0287, Reno, NV, USA, 10–13 January 1994. [Google Scholar]
  15. Alemdaroglu, N.; Iyigiin, I.; Altun, M.; Quagliotti, F.; Guglieri, G. Measurements of Dynamic Stability Derivatives using Direct Forced Oscillation Technique. In Proceedings of the ICIASF 2001 Record, 19th International Congress on Instrumentation in Aerospace Simulation Facilities, Cleveland, OH, USA, 27–30 August 2001. [Google Scholar]
  16. Alemdaroglu, N.; Uysal, H.; Nacakli, Y.; Şahin, T.; Quagliotti, F.; Guglieri, G. Roll oscillatory test in a low speed wind tunnel. In Proceedings of the 41st Aerospace Sciences Meeting and Exhibit, AIAA-2003-398, Reno, NV, USA, 6–9 January 2003. [Google Scholar]
  17. Erm, L.P. An Experimental Investigation Into the Feasibility of Measuring Static and Dynamic Aerodynamic Derivatives in the DSTO Water Tunnel. In Proceedings of the 30th AIAA Applied Aerodynamics Conference, AIAA-2012-3119, New Orleans, LA, USA, 25–28 June 2012. [Google Scholar]
  18. Guglieri, G.; Quagliotti, F. Determination of dynamic stability parameters in a low speed wind tunnel. In Proceedings of the 9th Applied Aerodynamics Conference, AIAA-91-3245, Baltimore, MD, USA, 23–25 September 1991. [Google Scholar]
  19. Polhamus, E.C. Vortex lift research: Early contributions and some current challenges. In Vortex Flow Aerodynamics; NASA: Hampton, VA, USA, 1986. [Google Scholar]
  20. Wu, J.; Vakili, A.; Wu, J. Review of the physics of enhancing vortex lift by unsteady excitation. Prog. Aerosp. Sci. 1991, 28, 73–131. [Google Scholar] [CrossRef]
  21. McKinney, L.W.; Dollyhigh, S.M. Some trim drag considerations for maneuvering aircraft. J. Aircr. 1971, 8, 623–629. [Google Scholar] [CrossRef]
  22. Ray, E.J.; McKinney, L.W.; Carmichael, J.G. Maneuver and Buffet Characteristics of Fighter Aircraft; Technical Report TN D-7131; NASA: Hampton, VA, USA, 1973.
  23. Rizzi, A.; Jirásek, A.; Lamar, J.E.; Crippa, S.; Badcock, K.J.; Boelens, O.J. Lessons learned from numerical simulations of the F-16XL aircraft at flight conditions. J. Aircr. 2009, 46, 423–441. [Google Scholar] [CrossRef]
  24. Luckring, J.M.; Rizzi, A.; Davis, M.B. Toward improved predictions of slender airframe aerodynamics using the F-16XL aircraft. J. Aircr. 2017, 54, 378–387. [Google Scholar] [CrossRef]
  25. Delery, J.M. Aspects of vortex breakdown. Prog. Aerosp. Sci. 1994, 30, 1–59. [Google Scholar] [CrossRef]
  26. Nelson, R.C.; Pelletier, A. The unsteady aerodynamics of slender wings and aircraft undergoing large amplitude maneuvers. Prog. Aerosp. Sci. 2003, 39, 185–248. [Google Scholar] [CrossRef]
  27. Gursul, I.; Gordnier, R.; Visbal, M. Unsteady aerodynamics of nonslender delta wings. Prog. Aerosp. Sci. 2005, 41, 515–557. [Google Scholar] [CrossRef]
  28. Bykerk, T. USYD AMME Wind Tunnels. 2019. Available online: https://sites.google.com/view/usyd-amme-wind-tunnels/home (accessed on 20 June 2023).
  29. Anderson, M.J.L. A Methodology for Aerodynamic Parameter Estimation of Tail-Sitting Multi-Rotors. Ph.D. Thesis, The University of Sydney, Sydney, Australia, 2017. [Google Scholar]
  30. Lehmkuehler, K. A Direct Comparison of Small Aircraft Dynamics between Wind Tunnel and Flight Tests. Ph.D. Thesis, The University of Sydney, Sydney, Australia, 2016. [Google Scholar]
  31. Bykerk, T.; Verstraete, D.; Steelant, J. Low speed longitudinal aerodynamic, static stability and performance analysis of a hypersonic waverider. Aerosp. Sci. Technol. 2020, 96, 105531. [Google Scholar] [CrossRef]
  32. Giannelis, N.F.; Vio, G.A. On the effect of control surface deflections on the aeroelastic response of an aerofoil at transonic buffet conditions. In Proceedings of the 28th International Conference on Noise and Vibration Engineering, Leuven, Belgium, 17–19 September 2018. [Google Scholar]
  33. Amprikidis, M.; Cooper, J.; Rogerson, C.; Vio, G. On the use of adaptive internal structures for wing shape control. In Proceedings of the 46th AIAA/ASME/ASCE/AHS/ASC Structures, Structural Dynamics and Materials Conference, AIAA-2005-2042, Austin, TX, USA, 18–21 April 2005. [Google Scholar]
  34. Miller, S.; Cooper, J.; Vio, G. Development of an adaptive wing tip device. In Proceedings of the 50th AIAA/ASME/ASCE/AHS/ASC Structures, Structural Dynamics, and Materials Conference, AIAA-2008-2121, Denver, CO, USA, 5–7 April 2008. [Google Scholar]
  35. Cooper, J.; Khodaparast, H.; Ricci, S.; Georgiou, G.; Vio, G.; Trawaglini, L.; Denmer, P. Rapid prediction of worst case gust loads. In Proceedings of the 52nd AIAA/ASME/ASCE/AHS/ASC Structures, Structural Dynamics and Materials Conference, AIAA-2012-2040, Honolulu, HI, USA, 23–26 April 2012. [Google Scholar]
  36. Cheema, P.; Munk, D.J.; Giannelis, N.F.; Vio, G.A. Experimental validation of polynomial chaos theory on an aircraft t-tail. In Proceedings of the 18th AIAA Non-Deterministic Approaches Conference, AIAA-2016-0953, San Diego, CA, USA, 4–8 January 2016. [Google Scholar]
  37. Barlow, J.; Rae, W.; Pope, A. Low-Speed Wind Tunnel Testing, 3rd ed.; John Wiley & Sons Inc.: New York, NY, USA, 1999; p. 728. [Google Scholar]
  38. Bykerk, T.; Verstraete, D.; Steelant, J. Low speed lateral-directional aerodynamic and static stability analysis of a hypersonic waverider. Aerosp. Sci. Technol. 2020, 98, 105709. [Google Scholar] [CrossRef]
  39. Bykerk, T.; Verstraete, D.; Steelant, J. Low speed longitudinal dynamic stability analysis of a hypersonic waverider using unsteady Reynolds averaged Navier Stokes forced oscillation simulations. Aerosp. Sci. Technol. 2020, 103, 105883. [Google Scholar] [CrossRef]
  40. Bykerk, T.; Verstraete, D.; Steelant, J. Low speed lateral-directional dynamic stability analysis of a hypersonic waverider using unsteady Reynolds averaged Navier Stokes forced oscillation simulations. Aerosp. Sci. Technol. 2020, 106, 106228. [Google Scholar] [CrossRef]
  41. ANSYS. Fluent 2022 R1 Theory Guide; ANSYS Inc.: Canonsburg, PA, USA, 2022. [Google Scholar]
  42. Werner, M.; Schütte, A.; Weiss, S. Turbulence Model Effects on the Prediction of Transonic Vortex Interaction on a Multi-Swept Delta Wing. In Proceedings of the AIAA SciTech 2022 Forum, AIAA-2022-0295, San Diego, CA, USA, 3–7 January 2022. [Google Scholar]
  43. Spalart, P.R.; Allmaras, S.R. A one-equation turbulence model for aerodynamic flows. Rech. Aerosp. 1994, 1, 5–21. [Google Scholar]
  44. Menter, F.R. Two-equation eddy-viscosity turbulence models for engineering applications. AIAA J. 1994, 32, 1598–1605. [Google Scholar] [CrossRef]
  45. Shih, T.H.; Zhu, J.; Lumley, J.L. A new Reynolds stress algebraic equation model. Comput. Methods Appl. Mech. Eng. 1995, 125, 287–302. [Google Scholar] [CrossRef]
  46. Dacles-Mariani, J.; Zilliac, G.G.; Chow, J.S.; Bradshaw, P. Numerical/experimental study of a wingtip vortex in the near field. AIAA J. 1995, 33, 1561–1568. [Google Scholar] [CrossRef]
  47. Spalart, P.; Shur, M. On the sensitization of turbulence models to rotation and curvature. Aerosp. Sci. Technol. 1997, 1, 297–302. [Google Scholar] [CrossRef]
  48. Banks, D.W.; Fisher, D.F.; Hall, R.M.; Erickson, G.E.; Murri, D.G.; Grafton, S.B.; Sewall, W.G. The F/A-18 High Angle-of-Attack Ground-to-Flight Correlation: Lessons Learned; Technical Report TM 4783; NASA: Hampton, VA, USA, 1997.
  49. Lamar, J.E. Flight, Wind-tunnel, and coMputational Fluid Dynamics Comparison for Cranked Arrow Wing (F-16XL-1) at Subsonic and Transonic Speeds; Technical Report TP-2001-210629; NASA: Hampton, VA, USA, 2001.
  50. Pfnür, S.; Breitsamter, C. Leading-edge vortex interactions at a generic multiple swept-wing aircraft configuration. J. Aircr. 2019, 56, 2093–2107. [Google Scholar] [CrossRef]
  51. Moioli, M.; Breitsamter, C.; Sørensen, K.A. Turbulence Modeling for Leading-Edge Vortices: An Enhancement Based on Experimental Data. AIAA J. 2022, 60, 1382–1399. [Google Scholar] [CrossRef]
  52. Lei, Z. Effect of RANS turbulence models on computation of vortical flow over wing-body configuration. Trans. Jpn. Soc. Aeronaut. Space Sci. 2005, 48, 152–160. [Google Scholar] [CrossRef]
  53. Dikbaş, E.; Baran, Ö.U. Towards Accurate Vortex Separation Simulations with RANS Using Improved k-kL Turbulence Model. Aerospace 2023, 10, 377. [Google Scholar] [CrossRef]
  54. Lee, B.; Brown, D. Wind-tunnel studies of F/A-18 tail buffet. J. Aircr. 1992, 29, 146–152. [Google Scholar] [CrossRef]
  55. Meyn, L.A.; James, K.D. Full-scale wind-tunnel studies of F/A-18 tail buffet. J. Aircr. 1996, 33, 589–595. [Google Scholar] [CrossRef]
Figure 1. Images showing different views of the SSAM-Gen5 model.
Aerospace 10 00746 g001
Figure 2. Vehicle aerodynamic force layout.
Aerospace 10 00746 g002
Figure 3. Exploded view of the wind tunnel model.
Aerospace 10 00746 g003
Figure 4. Three-dimensional printed model.
Aerospace 10 00746 g004
Figure 5. Model installation.
Aerospace 10 00746 g005
Figure 6. Near-wall computational grid at various levels of refinement.
Aerospace 10 00746 g006
Figure 7. Aerodynamic coefficients of the SSAM-Gen5 through the AoA range: (a) lift coefficient; (b) drag coefficient; (c) pitching moment coefficient (about wind-tunnel mount); (d) pitching moment coefficient (about CG).
Aerospace 10 00746 g007
Figure 8. Additional aerodynamic characteristics derived from the SSAM-Gen5 through the AoA range: (a) lift-to-drag ratio; (b) lift–curve slope.
Aerospace 10 00746 g008
Figure 9. Aerodynamic coefficients of the SSAM-Gen5 through the AoA range at various levels of spatial resolution: (a) lift coefficient; (b) drag coefficient; (c) pitching moment coefficient; (d) lift- to-drag ratio.
Aerospace 10 00746 g009
Figure 10. Aerodynamic coefficients of the SSAM-Gen5 throughout the AoA range: (a) lift coefficient; (b) drag coefficient; (c) pitching moment coefficient; (d) lift-to-drag ratio.
Aerospace 10 00746 g010
Figure 11. Surface pressure coefficient contours and vorticity magnitude slices for the 30° AoA case comparing baseline and rotation/curvature corrected results.
Aerospace 10 00746 g011
Figure 12. Spanwise distribution of pressure coefficients at various streamwise stations: (a X / L = 0.067 ; (b X / L = 0.167 ; (c X / L = 0.267 ; (d X / L = 0.367 ; (e X / L = 0.467 ; (f X / L = 0.567 ; (g X / L = 0.667 .
Aerospace 10 00746 g012
Figure 13. Development of vortices through the AoA range (SA–CC).
Aerospace 10 00746 g013
Table 1. Summary of reference values for the 0.75 m long vehicle and load cell location.
ParameterValueUnits
Reference Area0.1091m2
Mean Aerodynamic Chord0.2265m
Span0.5350m
X L C −0.4065m
Y L C 0.0000m
Z L C −0.0076m
X C o G −0.4385m
Y C o G 0.0000m
Z C o G 0.0000m
Table 2. Technical data for the ATI Mini 45 load cell.
Sensing Range (N)Resolution (Nm)
Fx, FyFzMx, MyMzFx, FyFzMx, MyMz
580116020200.250.250.0050.0027
Table 3. Computational grid metrics.
GridNo. Cells
(Mil)
Max.  y + Growth Rate Δ ¯ s  (% MAC) Δ ¯ r  (% MAC)
Coarse5.11.871.241.9912.42
Medium8.71.261.221.3216.55
Fine13.71.011.200.998.28
Extra Fine20.70.831.180.796.21
Disclaimer/Publisher’s Note: The statements, opinions and data contained in all publications are solely those of the individual author(s) and contributor(s) and not of MDPI and/or the editor(s). MDPI and/or the editor(s) disclaim responsibility for any injury to people or property resulting from any ideas, methods, instructions or products referred to in the content.