Article

Influence of Variable-Geometry Adjustment on the Matching Characteristics of a Medium Variable Bypass Ratio Compression System

1
Key Laboratory of Light-Duty Gas-Turbine, Institute of Engineering Thermophysics, Chinese Academy of Sciences, Beijing 100190, China
2
University of Chinese Academy of Sciences, Beijing 100049, China
3
Innovation Academy for Light-Duty Gas Turbine, Chinese Academy of Sciences, Beijing 100190, China
*
Author to whom correspondence should be addressed.
Aerospace 2023, 10(8), 707; https://doi.org/10.3390/aerospace10080707
Submission received: 7 June 2023 / Revised: 10 August 2023 / Accepted: 11 August 2023 / Published: 14 August 2023
(This article belongs to the Section Aeronautics)

Abstract

:
The research is based on a full 3D model of a medium variable bypass ratio compression system. The effects of core-driven fan stage (CDFS) VIGV adjustment and forward variable area bypass injector (FVABI) adjustment on the internal flow and component matching characteristics of the compression system during the mode transition process are investigated. The findings of the study reveal that during the mode transition period, the adjustment of variable-geometry components has a negligible impact on the aerodynamic performance of the fan. The closure of the CDFS VIGV has a significant effect on reducing the pressure ratio of the CDFS but only a minor effect on its efficiency. Additionally, the efficiency and pressure ratio of the high-pressure compressor (HPC) increase with the closure of the CDFS VIGV, particularly the second stage of the HPC. When the CDFS VIGV is closed by 30°, the efficiency of the second stage of the HPC increases by 3.4%, while that of the first stage only increases by 3.1%. Under the high bypass mode, increasing the FVABI opening will move the matching point of the CDFS towards the choke boundary. When the FVABI opening increases from 0.30 to 0.58, the efficiency of the CDFS decreases by 3.6%, while the efficiency of the HPC only increases by 0.4%. In summary, closing the CDFS VIGV and increasing the opening of the FVABI will increase the bypass ratio of the compression system, and the former has a more significant impact. When the compression system transitions from the low bypass mode to the high bypass mode, opening of the FVABI should be appropriately reduced to prevent CDFS matching in the operating condition too closely to the choke boundary, thereby maintaining the efficiency of each component of the compression system at a relatively high level.

1. Introduction

With the development of the modern military, the role of long endurance drones in combat has become increasingly important, such as the United States’ long endurance drones “Predator” and “Global Hawk,” which have shown enormous performance advantages and military application value in warfare [1]. As the altitude of long endurance drones increases, there is increasing demand for longer loiter times and greater stealth capabilities [2]. In order to achieve longer loiter times, the requirements for the fuel consumption rate of the engine are becoming increasingly high. In order to achieve strong stealth performance, strict requirements are often placed on the diameter of the engine, enabling full coverage of the inlet and outlet.
To meet the stringent requirements of these drones, the engine needs to adopt as high a bypass ratio as possible to reduce fuel consumption. However, strict size requirements limit the engine’s thrust, which can easily result in the lack of sufficient thrust for the drone to achieve high-altitude climbs. Additionally, this can also result in insufficient engine thrust to support high-speed flight operations. Therefore, significant improvements in engine thrust levels are required under both aforementioned operating conditions. To address these issues, medium bypass ratio variable cycle turbofan engines (also known as medium variable bypass ratio turbofan engines) are being developed to achieve a balance between fuel efficiency, sufficient thrust for high-altitude operations, and high-speed flight capabilities.
By adjusting the geometry of engine components to change the bypass ratio, a variable cycle engine (VCE) can alter the engine modes and effectively expand the operating envelope of the aircraft. This technology is currently a research hotspot in the field of aviation engines. In the early stages of VCE development, there was a desire to combine the respective technical advantages of turbojet and turbofan engines by utilizing both cycles simultaneously within a single engine. Typical approaches to achieve this included variable inlet pressure recovery and flexible cycle designs [3]. The second phase of VCE research began in the 1980s and was mainly based on dual-rotor turbofan engines. This phase utilized adjustable components such as the mode selection valve (MSV), core-driven fan stage (CDFS), and variable area bypass injector (VABI) to achieve variable cycle functionality with internal or external bypass or exhaust flows and variable bypass ratios. Representative design schemes during this period include the GE21 and F120 variable cycle engines [4,5,6,7]. Since the beginning of the 21st century, VCE technology has experienced another breakthrough. The engine configuration has evolved into a versatile and adaptive cycle engine, with GE’s XA100 being the most representative design. It can be said that VCEs are the preferred choice for next-generation aircraft propulsion systems [8].
A flexible and adjustable compression system is the key to achieving variable bypass ratio functionality in engines, and a multi-connected and multi-bypass aerodynamic layout is a common feature of various types of VCE compression systems [9,10,11,12]. Taking the classic small bypass ratio double outer bypass variable cycle engine compression system as an example, this compression system incorporates adjustable structures such as MSV and FVABI to control the bypass flow and merging process [13]. During the process of mode transition in the compression system, the adjustable components work together to control the required bypass ratio of the engine by changing the geometric flow area of the bypass channel. The adjustment of the bypass ratio in the variable cycle compression system is accompanied by changes in the internal bypass and merging flows of the compression system. Different bypass flow ratios can directly affect the aerodynamic performance of the various components of the compression system. The strong coupling between the components and bypass channels due to the multi-connectivity effect makes the matching law of the variable cycle compression system extremely complex, and it also gives the variable cycle compression system some unique flow characteristics. GE stated in a test report of a small bypass ratio double outer bypass variable cycle engine that during the mode transition process, the high-pressure airflow added by the inner core-driven fan stage (CDFS) may experience backflow after entering the outer bypass through the adjustable area bypass injector, which can significantly affect the matching state of the engine’s compression system [14]. In subsequent work, some researchers successively discovered the occurrence of the aforementioned backflow phenomenon. Among them, researchers such as Liu and Wang [15] conducted a thorough analysis of the mechanism and influencing factors of the outer bypass backflow process and summarized the criteria for identifying compression system backflow. In their subsequent work, they further pointed out that appropriately reducing the opening of the adjustable area bypass injector and the back pressure of the outer bypass can help suppress the occurrence of outer bypass backflow [16]. Aygun [17] discussed the energy utilization efficiency of variable cycle engines in different modes from an exergy analysis perspective. Chen et al. [18,19,20,21,22] established matching relationships between engine components by solving balance equations and sought the optimal performance of the engine through optimization algorithms. Another group of researchers focused on independent bypass adjustment mechanisms, conducting detailed studies on the flow mechanism and adjustment rules of MSV and bypass injectors, achieving fruitful results [23,24,25,26,27,28].
The aforementioned research mainly focused on the mechanism and effects of outer bypass backflow in compression systems, with the research objects mostly being small bypass ratio variable cycle compression systems. In this study, based on the requirements of long endurance drones, a new medium variable bypass ratio compression system is proposed, which has a different mode transition mechanism from the classic dual outer bypass variable cycle compression system, and its bypass ratio is larger, so some previous design methods are not applicable. Based on the new medium bypass ratio compression system, this paper focuses on the impact of geometrically adjustable components on the internal flow and matching rules of the variable bypass ratio compression system during the mode transition process, and it summarizes the matching design methods applicable to medium bypass ratio compression systems.

2. Research Object and Modeling Approach

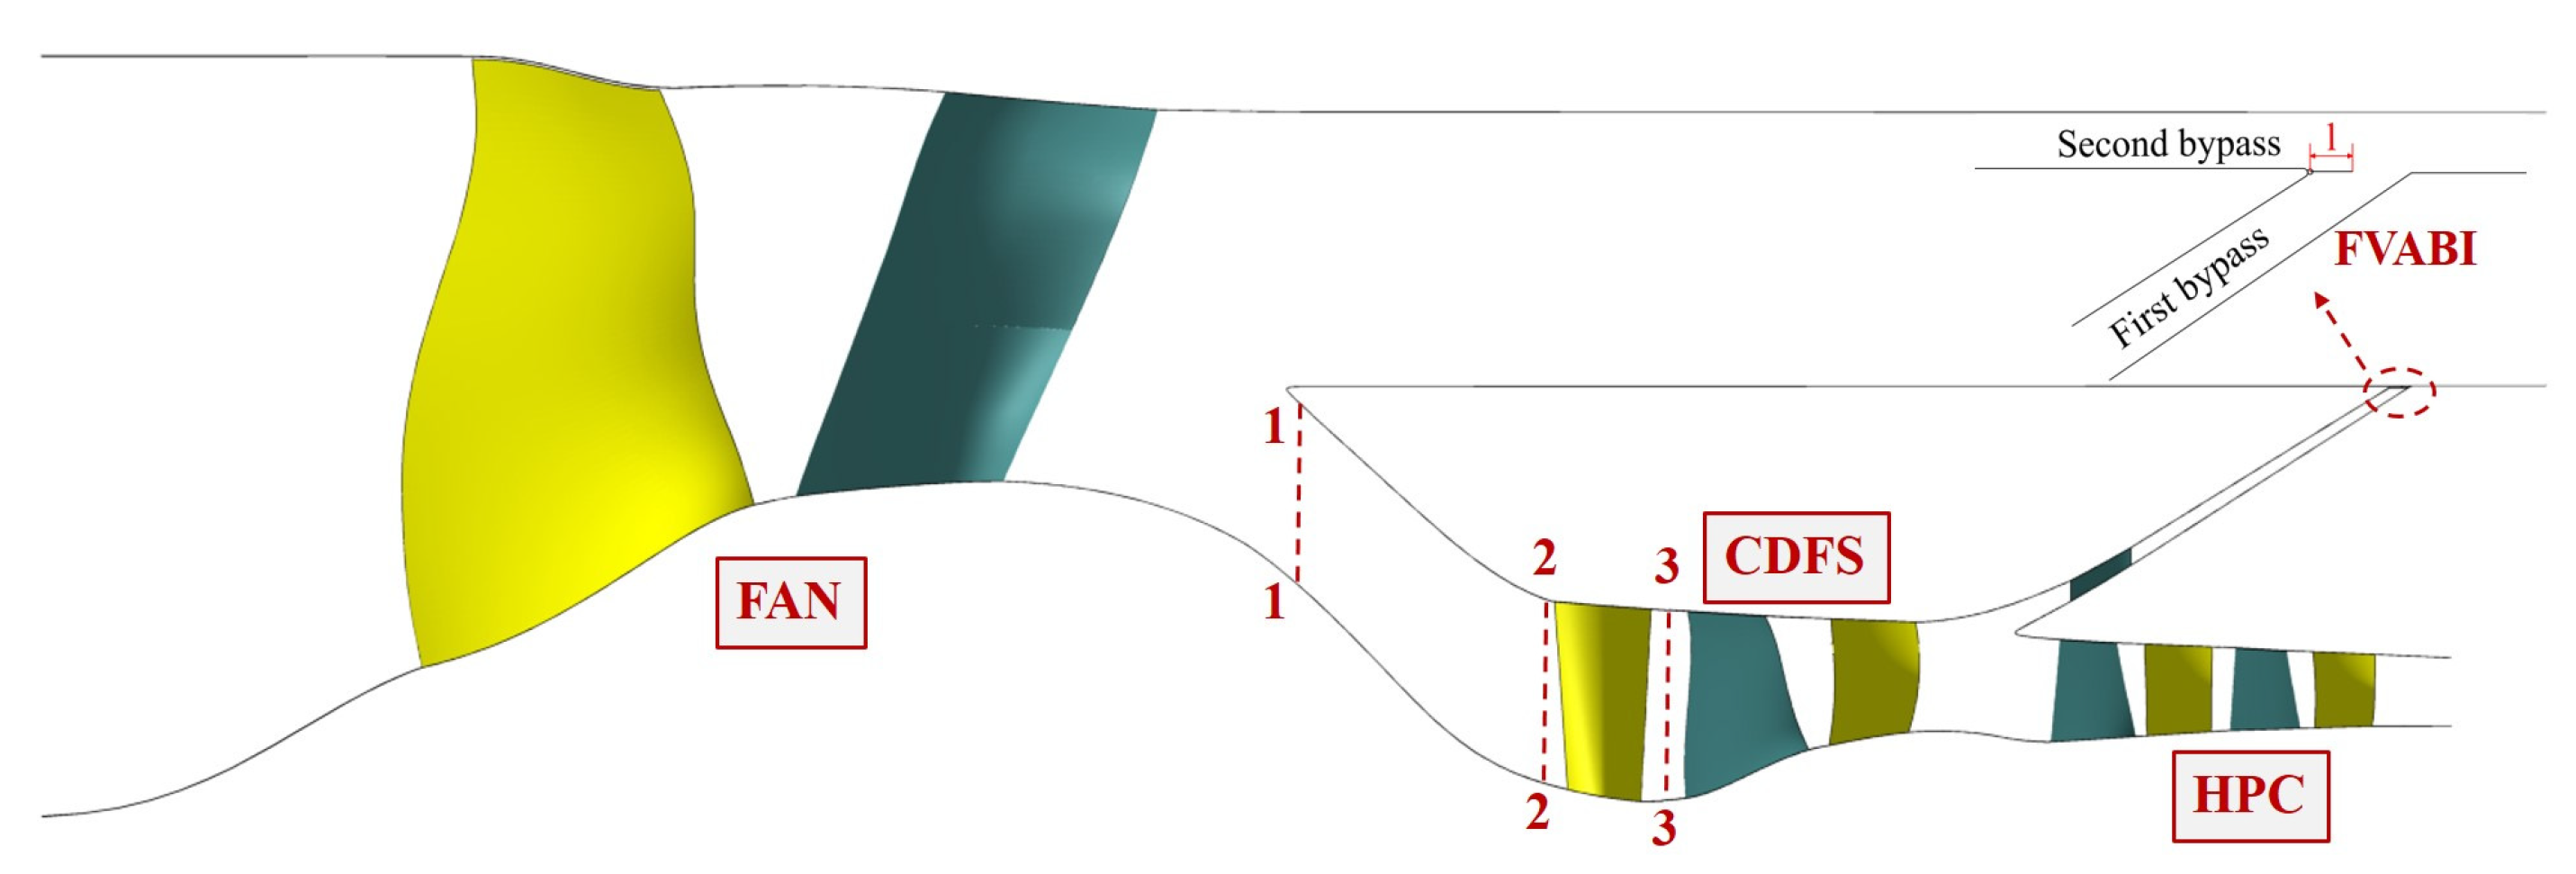
This study is based on a self-designed medium variable bypass ratio engine compression system, as depicted in Figure 1. Compared with a conventional small bypass ratio variable cycle compression system [17], the novel variable medium bypass ratio compression system eliminates the mode selection valve at the fan outlet and exhibits a distinct mode transition mechanism; moreover, it features a larger bypass ratio. By introducing the CDFS, the compression system forms an aerodynamic structure with double bypass characteristics and can regulate its bypass ratio to adapt to various actual working conditions. During high-speed cruising or acceleration, the CDFS variable inlet guide vane (VIGV) is open, and the engine operates in low bypass mode (LB) by channeling a large flow rate though the core engine to achieve sufficient thrust. Conversely, during low-speed cruising, the engine switches to high bypass mode (HB), and the CDFS VIGV is closed, resulting in a reduced load and flow rate of the CDFS. More flow passes through the second outer bypass, while the front variable area bypass inlet (FVABI) assists in adjustment. As a result, the entire engine’s bypass ratio increases, leading to reduced fuel consumption. In conclusion, the advanced medium bypass ratio engine possesses a multi-connected aerodynamic layout and numerous adjustable components, necessitating further exploration of its underlying internal flow mechanisms and corresponding matching criteria.
As shown in Figure 1, the medium variable bypass ratio compression system studied in this paper consists of three compressive components, namely the fan, CDFS, and high-pressure compressor (HPC). Both the fan and CDFS have single-stage structures, with the CDFS utilizing its VIGV to achieve a wide range of flow control. Considering that the matching of the core engine of the compression system primarily depends on the front stage of the HPC, this paper simplifies the original three-stage axial flow plus one-stage centrifugal HPC and only uses the first two stages of the HPC for the matching study between the HPC and other components.
The operational mode of the medium variable bypass ratio compression system is directly determined by the opening of the CDFS VIGV, while the bypass matching state of the compression system is influenced by the adjustment of the FVABI. These two components are pivotal in enabling the engine to attain variable bypass ratio functionality. This paper employs the CDFS VIGV to regulate the flow rate of the core engine. During the mode transition of the compression system, the inlet geometric angle of the CDFS VIGV remains constant, whereas the outlet geometric angle is adjusted based on the requirements of the component flow field matching. It should be noted that the geometric shape of the CDFS VIGV undergoes changes during this process, as portrayed in Figure 2. This paper defines the opening of the VIGV based on the adjustment angle of the VIGV αVIGV = 0°.
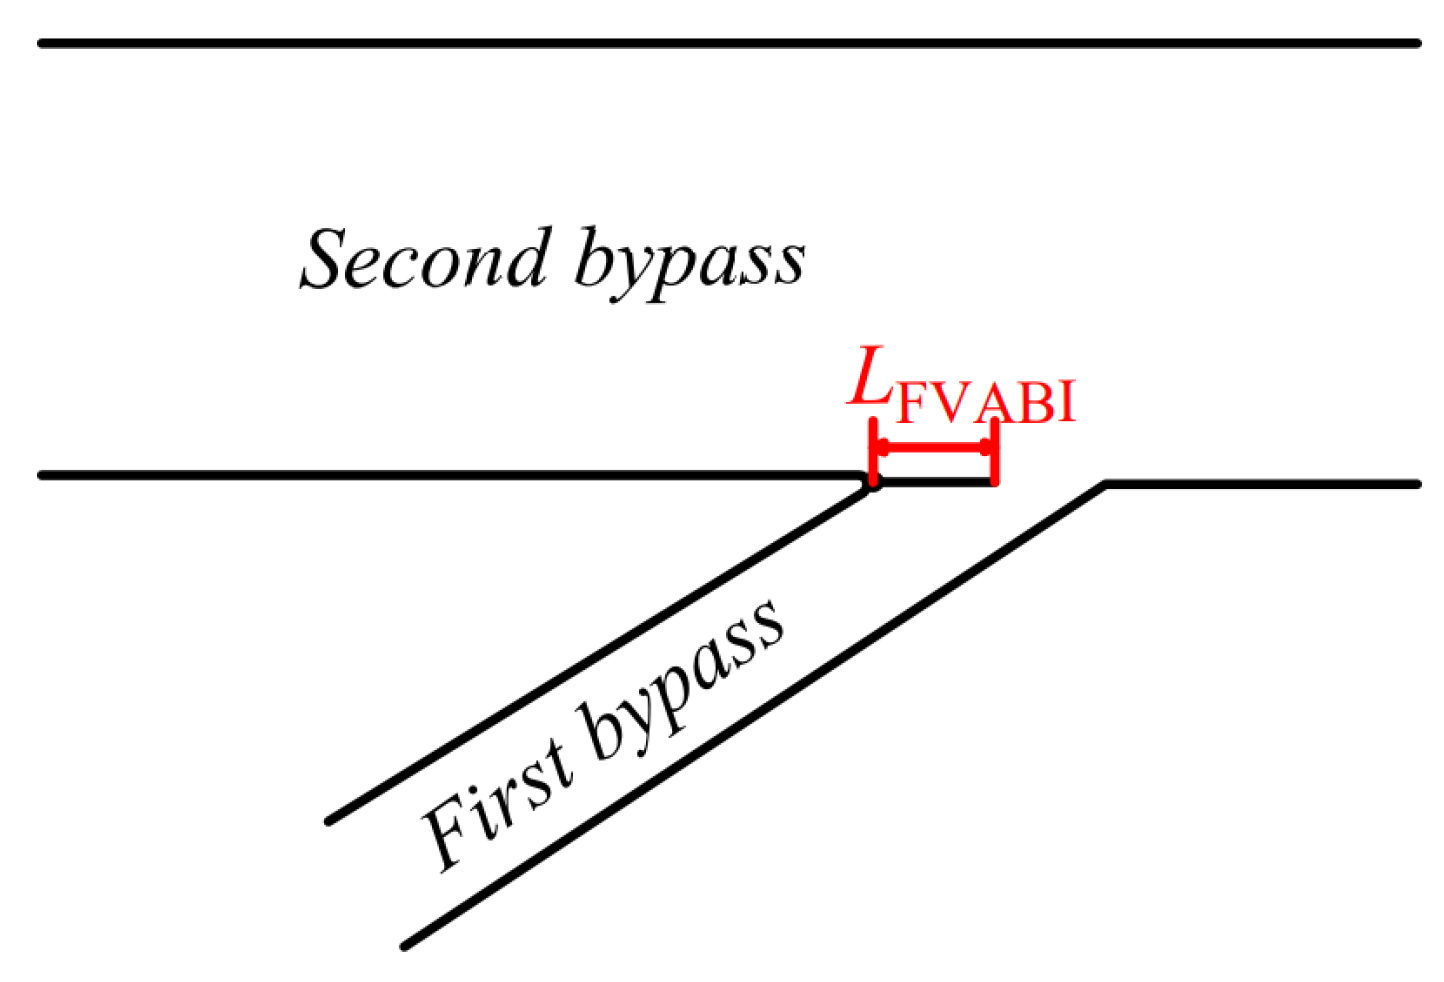
The existing literature indicates that two primary methods exist for controlling the FVABI, which are axial and pitch adjustment. Both methods function by altering the geometric shape of the duct in order to regulate the internal flow state of the bypass. In this study, an axial adjustment method is employed for the FVABI, whereby the structure and associated parameters are defined as presented in Figure 3. Specifically, via manipulation of the axial extension length ( L F V A B I ), the FVABI is able to modulate the flow area of the first outer bypass, consequently adjusting the matching relationship between the first and second outer bypasses. In this study, the exit area of the second outer bypass remains constant while the FVABI is adjusted. In the present study, it was observed that the exit area of the second outer bypass remained constant during the FVABI adjustment process. The dimensionless opening of the FVABI is defined based on the length ( L * F V A B I ) at which the adjusting plate completely covers the first outer bypass:
A F V A B I = L F V A B I L * F V A B I

3. Numerical Methods and Grid Independence Verification

In this study, the EURANUS solver in NUMECA software (https://www.numeca.de/en/, 9 August 2023) is employed to conduct steady-state simulations utilizing time-marching methods on three-dimensional Reynolds-averaged Navier–Stokes equations. The Spalart–Allmaras one-equation model serves as the selected turbulence model, while the fourth-order explicit Runge–Kutta method is employed for time discretization. Spatial discretization entails a finite volume central differencing scheme, with the CFL number set at 3.0. Various techniques, including local time stepping, multigrid methods, and implicit residual smoothing, are employed to expedite the convergence of the flow field computations. The total temperature and pressure values at the fan’s inlet (288.15 K, 101,325 Pa) are imposed with axial intake, while the corresponding stator pressure boundary conditions are prescribed at the inner and outer outlets. All solid surfaces are set as adiabatic and non-slip boundaries. The numerical approach adopted in this study was validated to possess adequate precision for evaluating the performance of multistage compressors, as evidenced by prior research [29,30,31,32].
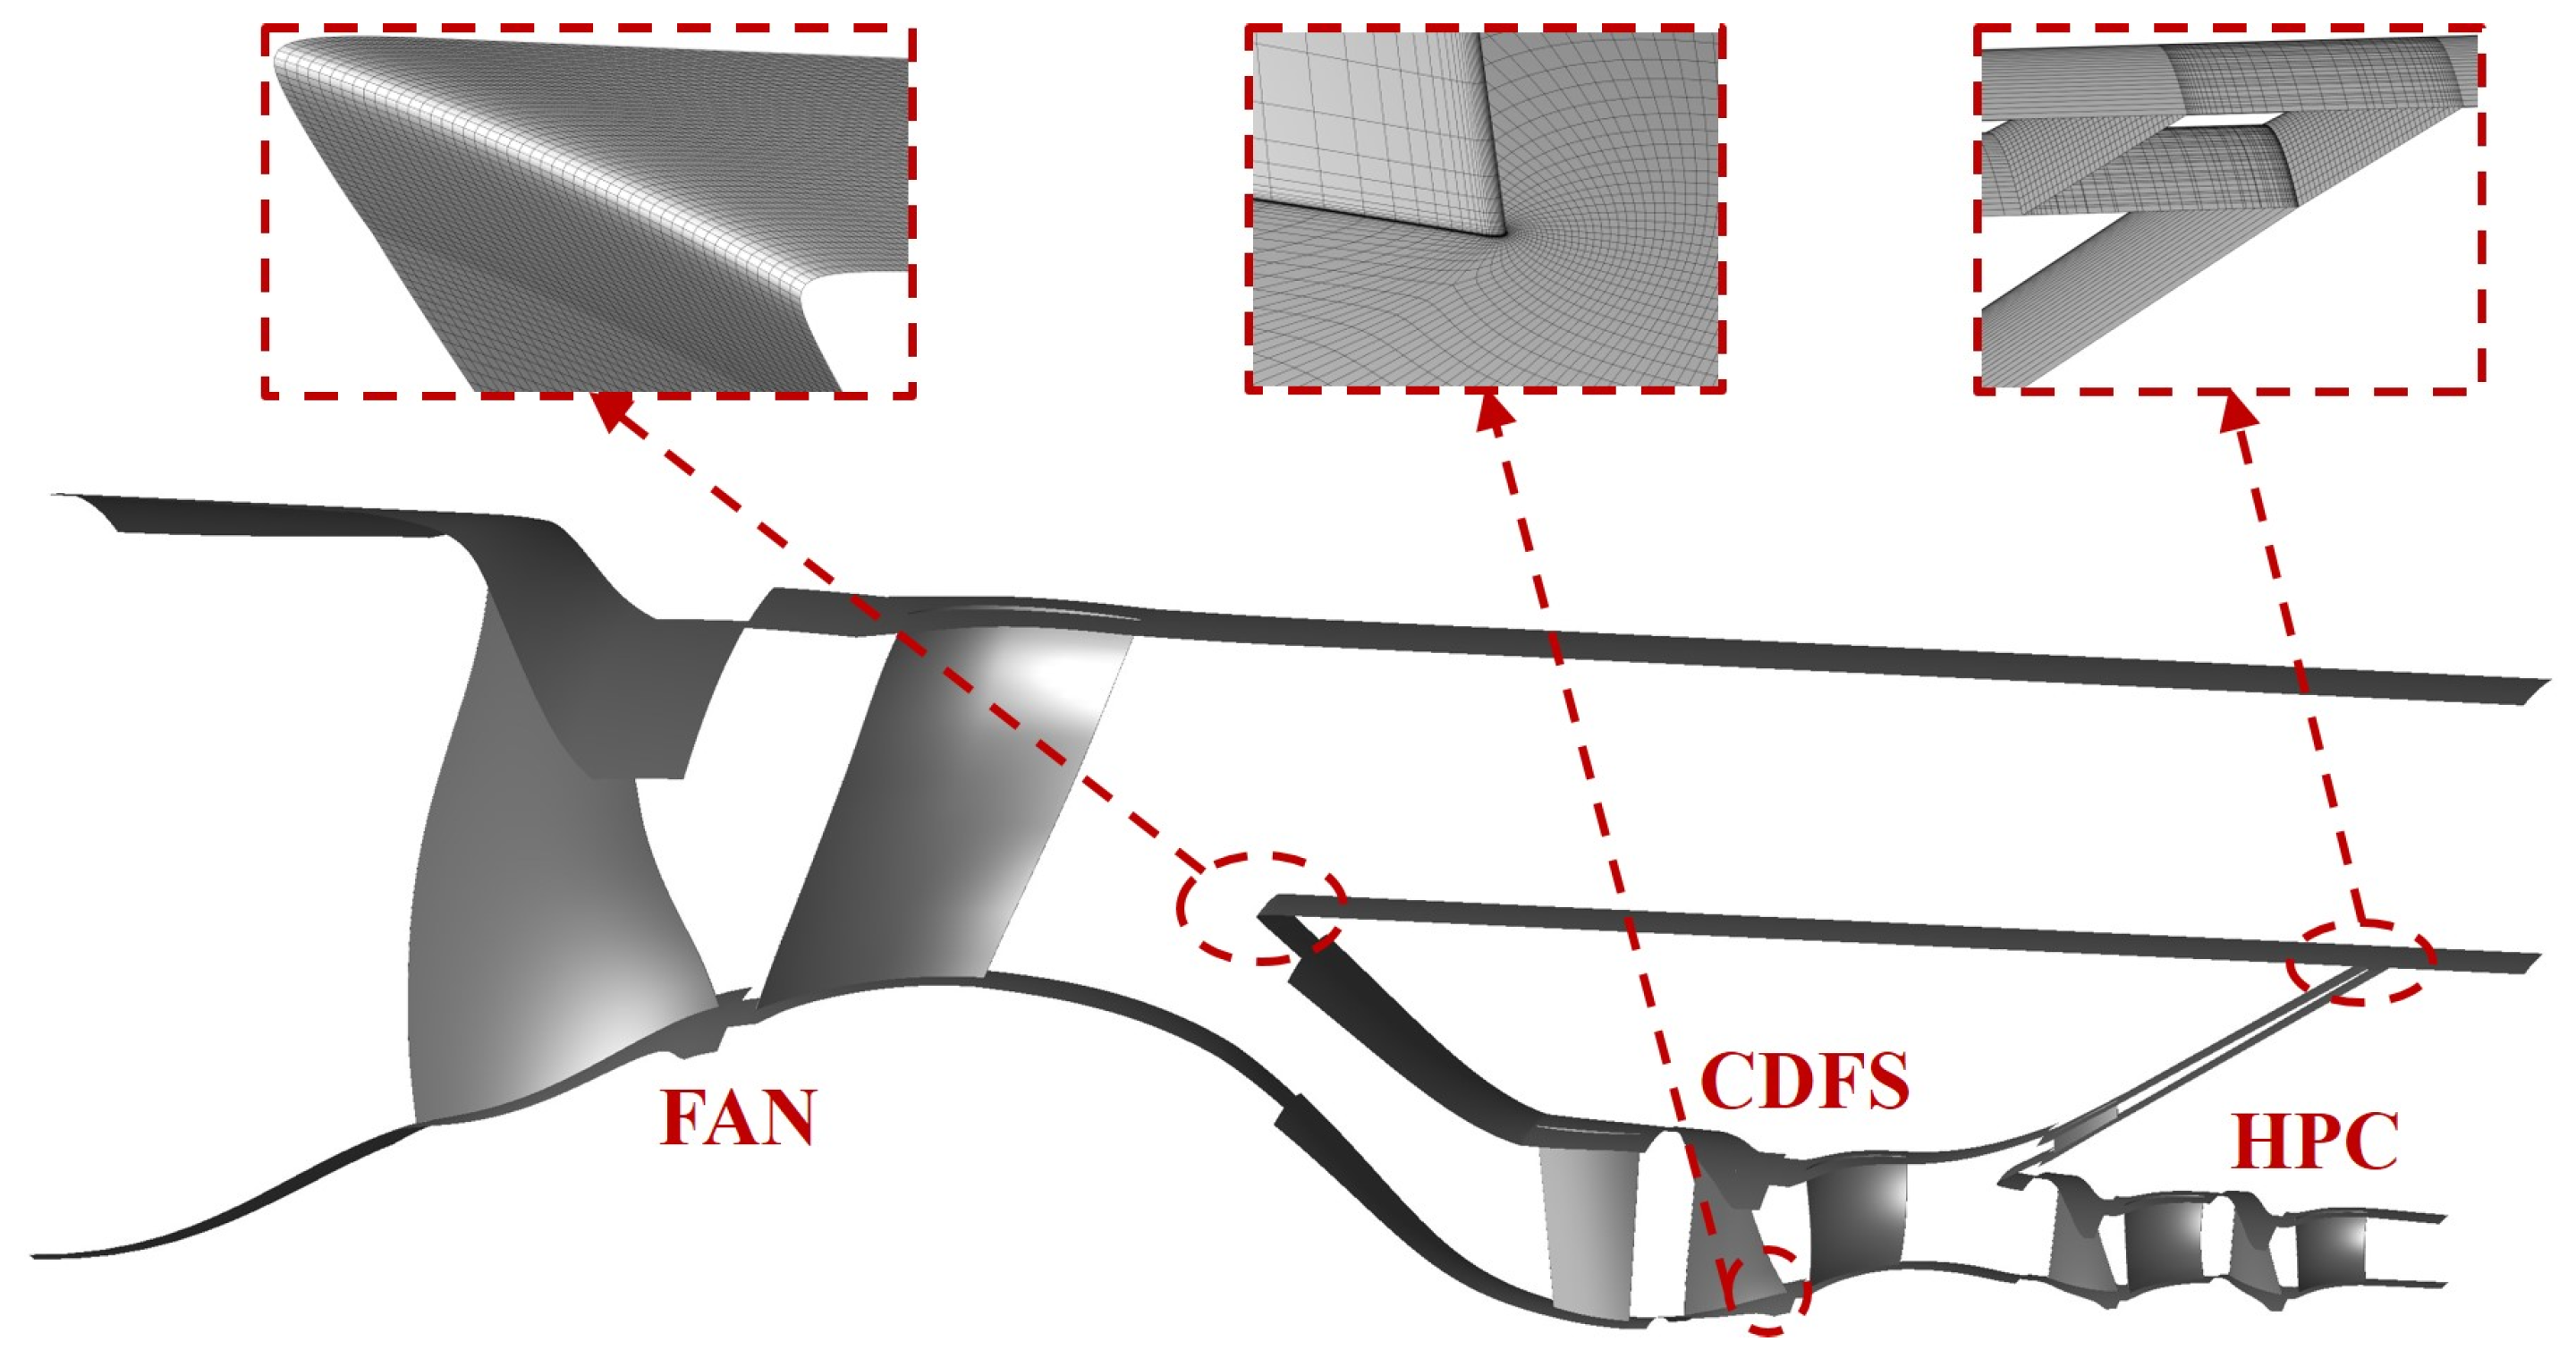
The AutoGrid module is employed to partition the grid of the blade channel region in the compression system, with the blade surface modeled using the HOH topology structure and the gap between the blade tip and casing modeled using the O4H topology structure. The first layer of grid thickness is set to 0.003 mm near the wall. For the more complex FVABI regulating mechanism, the IGG module is utilized to complete the grid of this part and splice it with the bypass grid. All grids are structured hexahedral forms, and the full three-dimensional integrated calculation model for the compression system is presented in Figure 4. Local refinement of the grid is applied to areas such as the casing, hub, diffuser, and FVABI to capture flow details in the compression system.
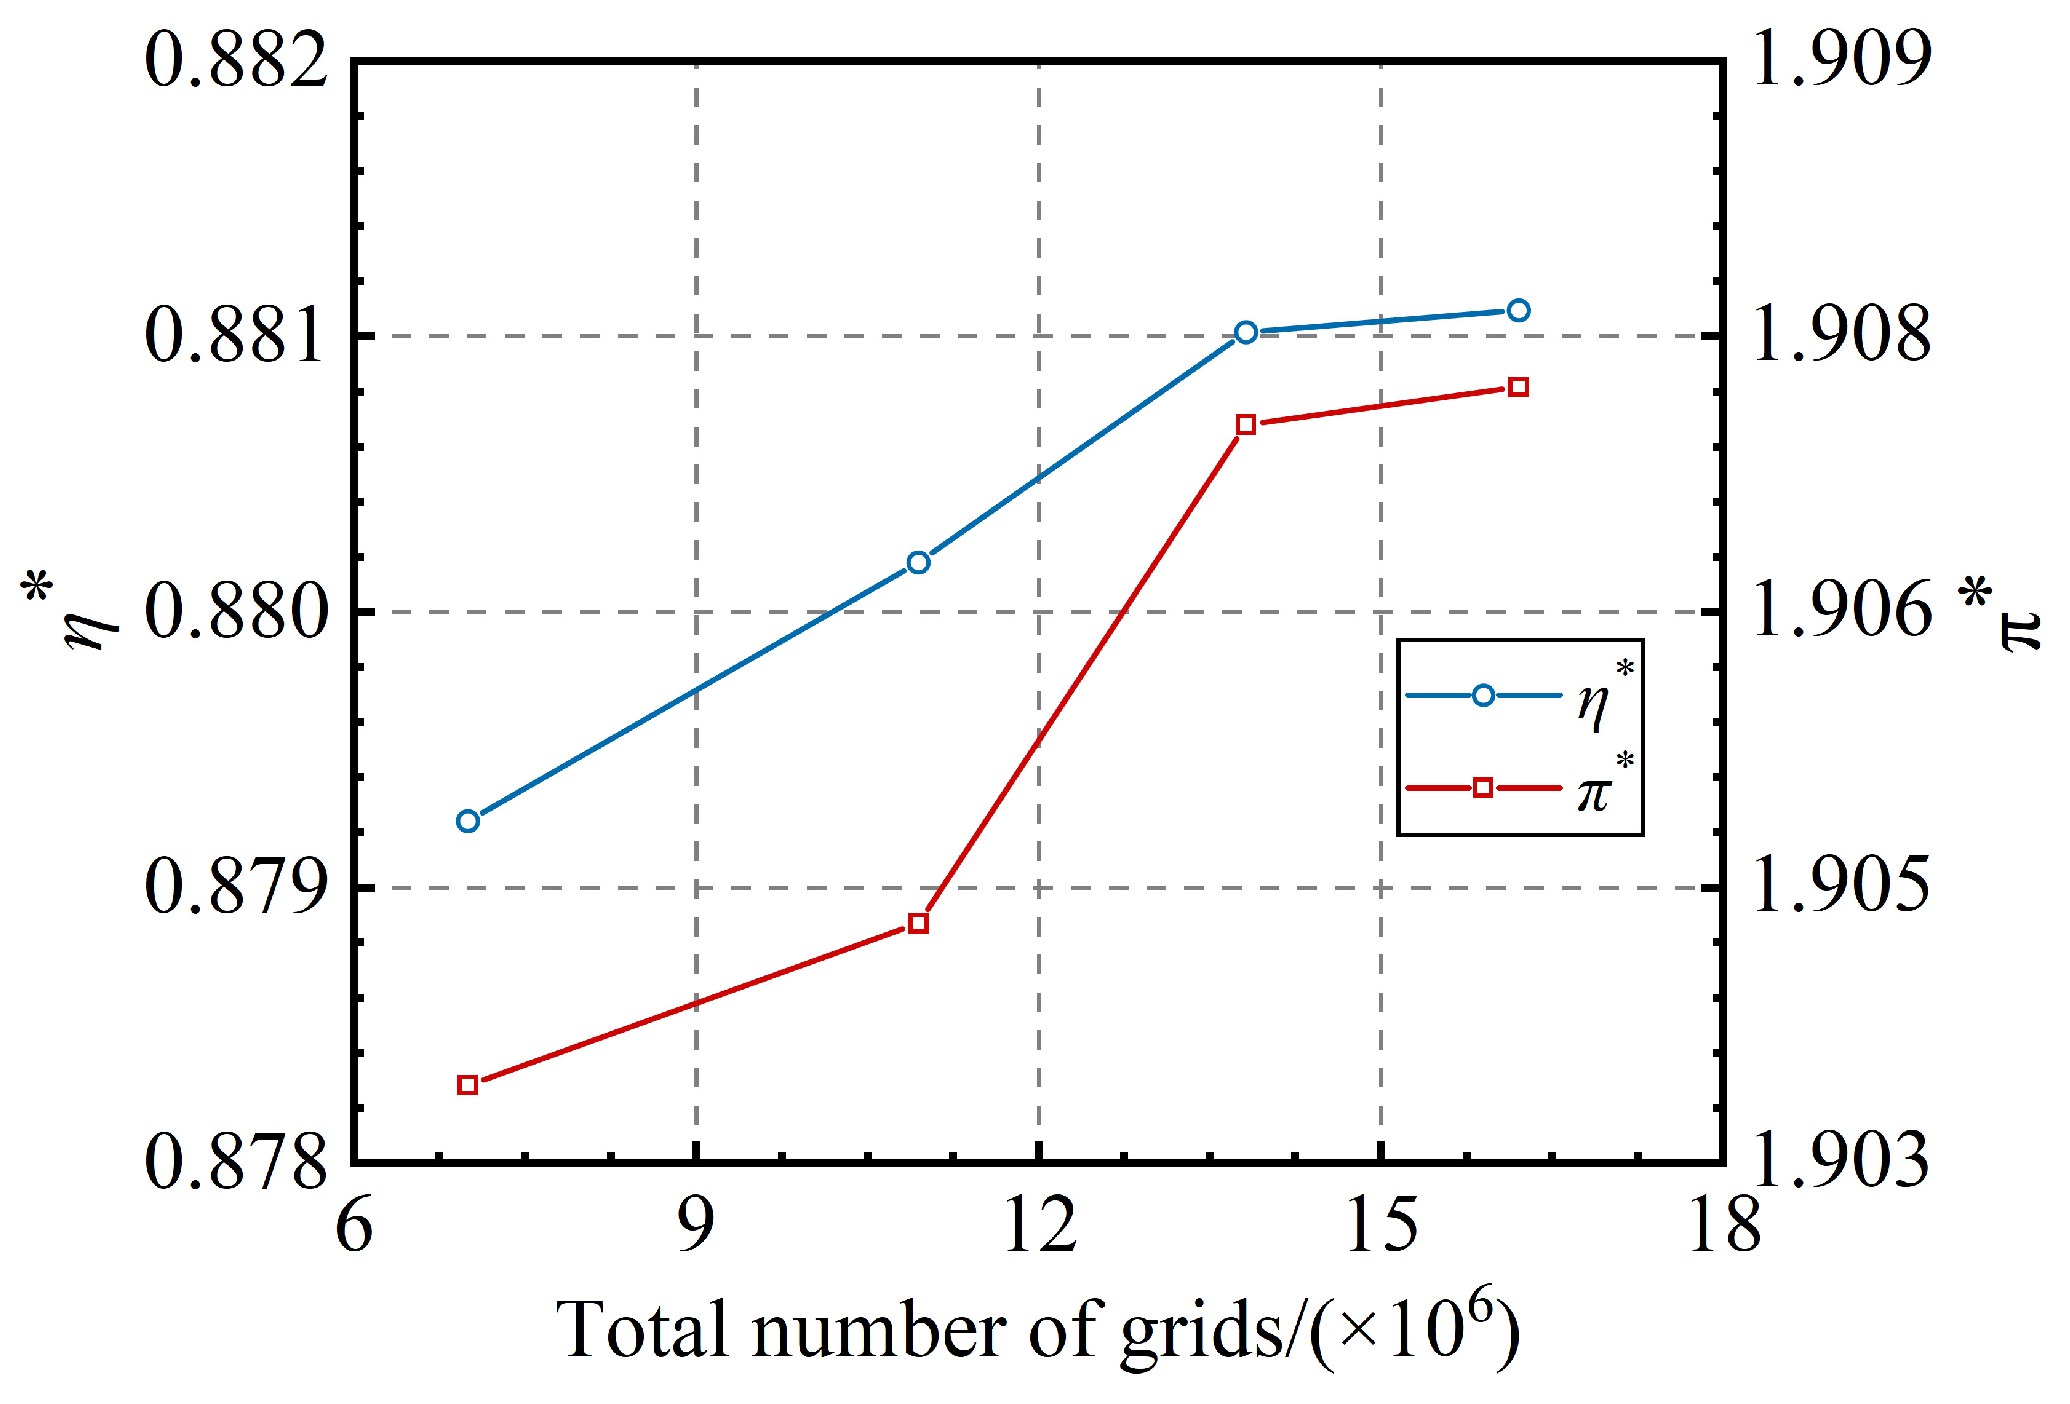
The present study employs four sets of grids with varying levels of density to verify grid independence for the calculation of the compression system, with the LB modal design point serving as the reference. Table 1 presents a summary of the relevant parameters for the four sets of computational grids employed in this study.
Figure 5 illustrates the variation of the total pressure ratio and adiabatic efficiency of the CDFS in the compression system with respect to the grid density. The computational results demonstrated that an increase in the grid density leads to an improved adiabatic efficiency and total pressure ratio of the CDFS. However, the effects of further increasing the grid density on the performance metrics become increasingly limited after the grid density exceeds 13.82 million. This trend suggests that the aerodynamic performance tends towards stabilization, and that the grid densities are sufficient for accurately solving the overall aerodynamic performance of the components in the compression system.
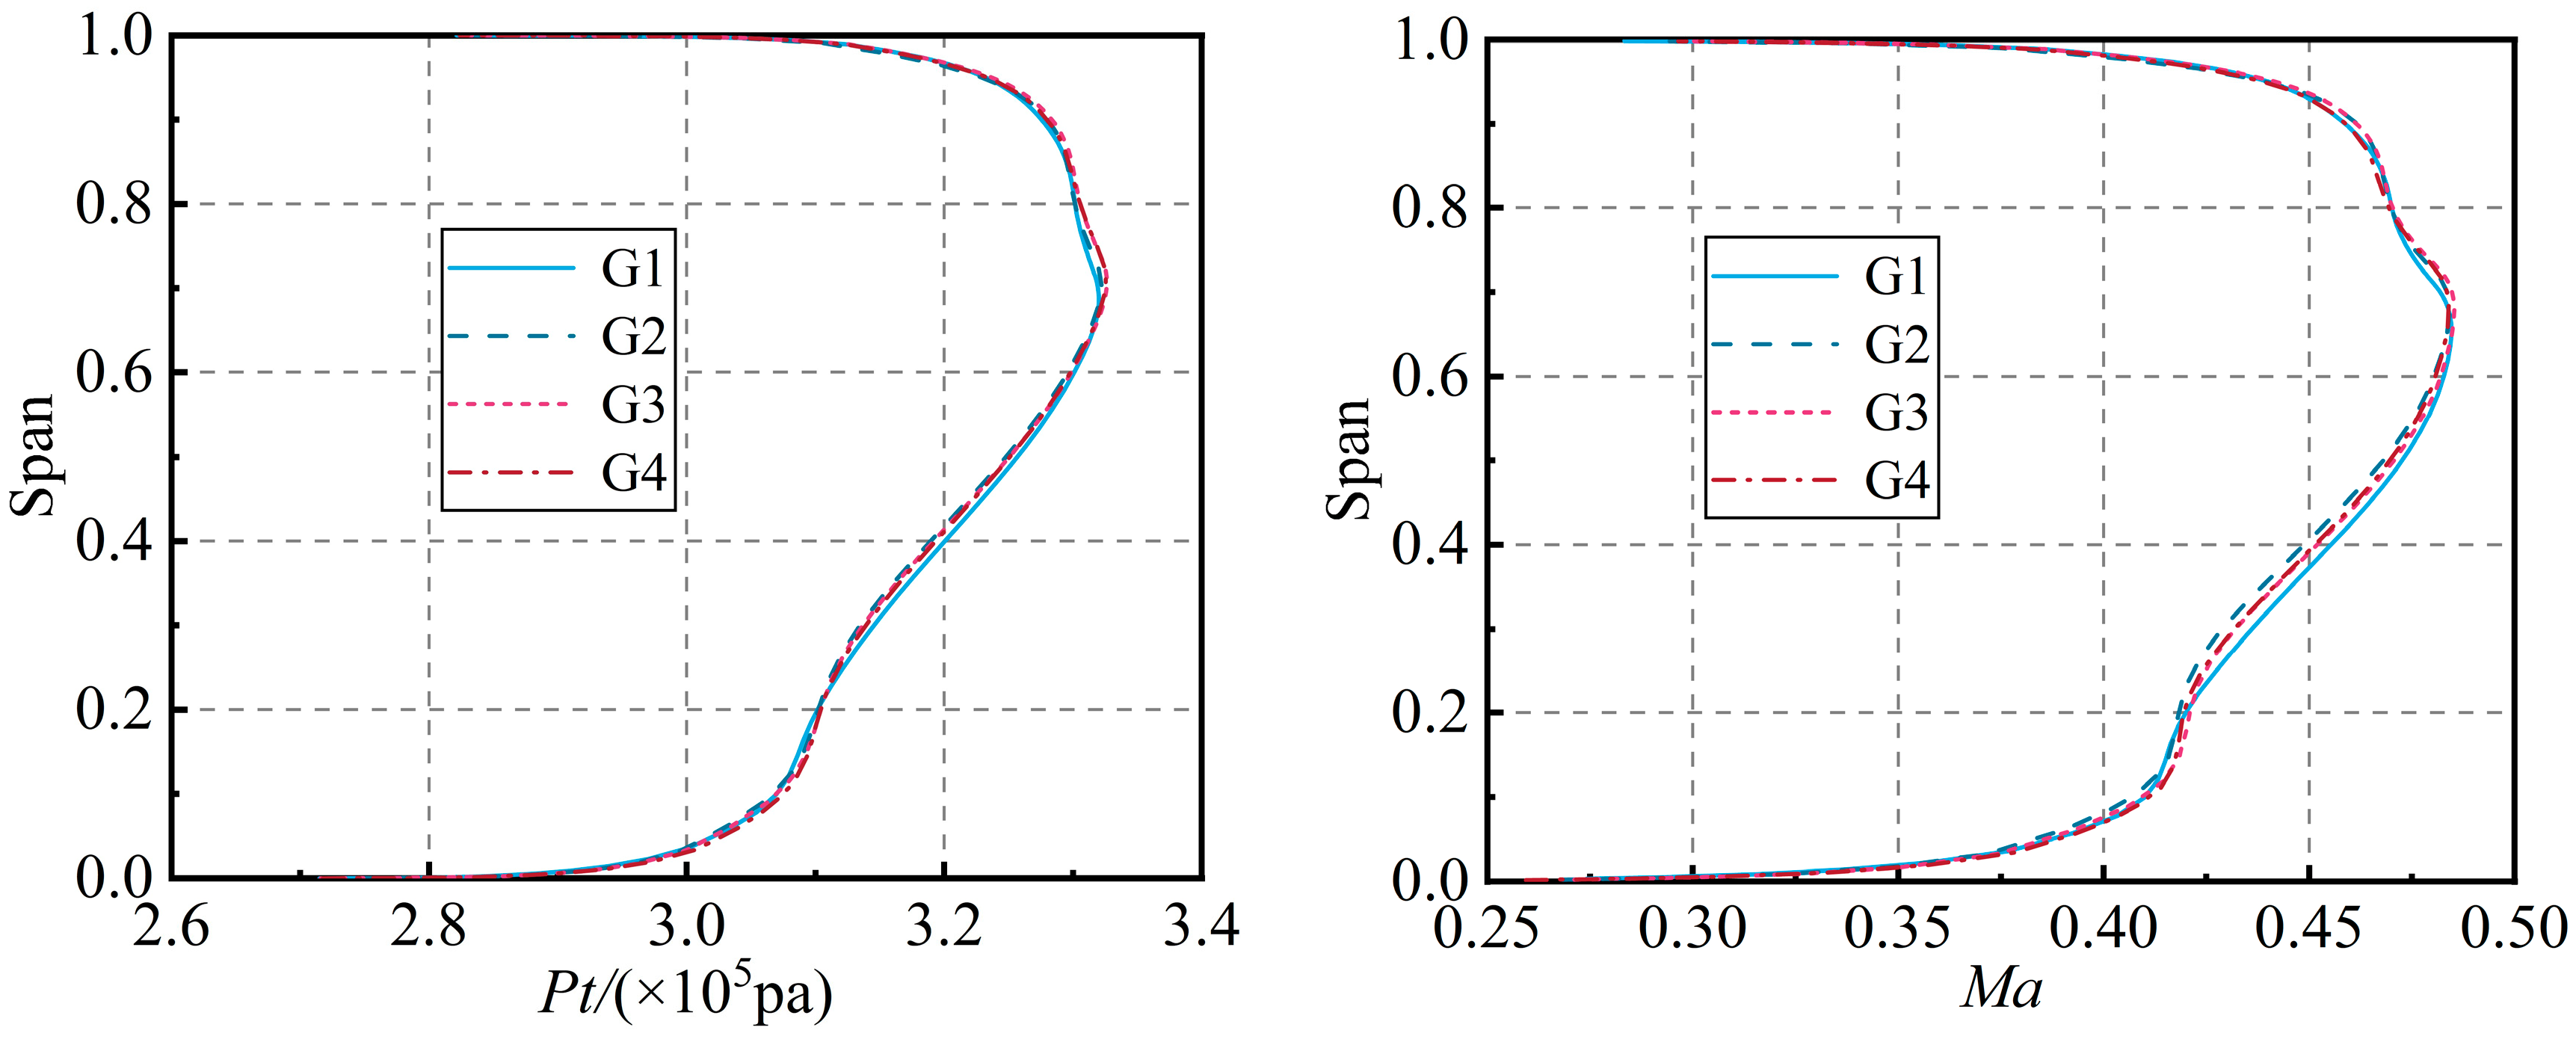
In order to investigate the inter-coupling of complex flows within the compression system and accurately determine the overall performance of the system components, it is essential to precisely capture the details of the flow field. Figure 6 compares the radial distribution patterns of the CDFS outlet total pressure and absolute Mach number for different numbers of computational grids.
Due to the relatively sparse mesh structures of G1 and G2, the outlet total pressure and absolute Mach number in the 70–80% of the blade height region of the CDFS are underestimated, while their values in the 20–60% of the blade height region are overestimated. On the other hand, the radial distribution patterns of the aerodynamic parameters obtained from G3 and G4 showed almost complete overlap, indicating that the grid resolution satisfies the independence requirement for solving the internal flow details of the compression system. Considering the balance between computational accuracy and efficiency, the grid densities in the full 3D compression system model are maintained at approximately 13.8 million for subsequent calculations.

4. Results and Discussions

4.1. The Influence of the CDFS VIGV

The mode transition process in a medium variable bypass ratio compression system is achieved by closing the CDFS VIGV opening. During this process, the bypass ratio and performance of each component in the compression system are influenced by the CDFS VIGV opening. To further analyze its impact, this section presents a series of operating conditions with different CDFS VIGV openings (αVIGV = −30° to 0°) based on a full 3D compression system model. The matching operating states of the compression system are discussed under the same component rotation speed and back pressure adjustment, and the results are computed and presented in Table 2.
To investigate the effect of CDFS VIGV adjustment on the bypass ratio and aerodynamic performance of the components in the compression system, this paper takes αVIGV = 0° as the baseline state and defines the performance variation of the compression system under different VIGV openings:
Δ B = ( B α V I G V = 5 , 10 , 15 , 20 , 25 , 30 ° B α V I G V = 0 ° 1 ) × 100 %
Δ m = ( m α V I G V = 5 , 10 , 15 , 20 , 25 , 30 ° m α V I G V = 0 ° 1 ) × 100 %
Δ π = ( π α V I G V = 5 , 10 , 15 , 20 , 25 , 30 ° π α V I G V = 0 ° 1 ) × 100 %
Δ η = ( η α V I G V = 5 , 10 , 15 , 20 , 25 , 30 ° η α V I G V = 0 ° 1 ) × 100 %
To gain a more comprehensive understanding of the mass flow allocation in the compression system, this paper defines the first stage, second stage, and total bypass ratios as follows:
B 1 = M f i r s t , b y p a s s M h p c B 2 = M sec o n d , b y p a s s M c d f s B t o t a l = M t o t a l M h p c = ( 1 + B 1 ) ( 1 + B 2 ) 1
In the equation above, B1 is the ratio of the first outer bypass flow rate to the HPC flow rate, B2 is the ratio of the second outer bypass flow rate to the CDFS flow rate, and Btotal is the ratio of the total bypass flow rate to the HPC flow rate in the compression system.
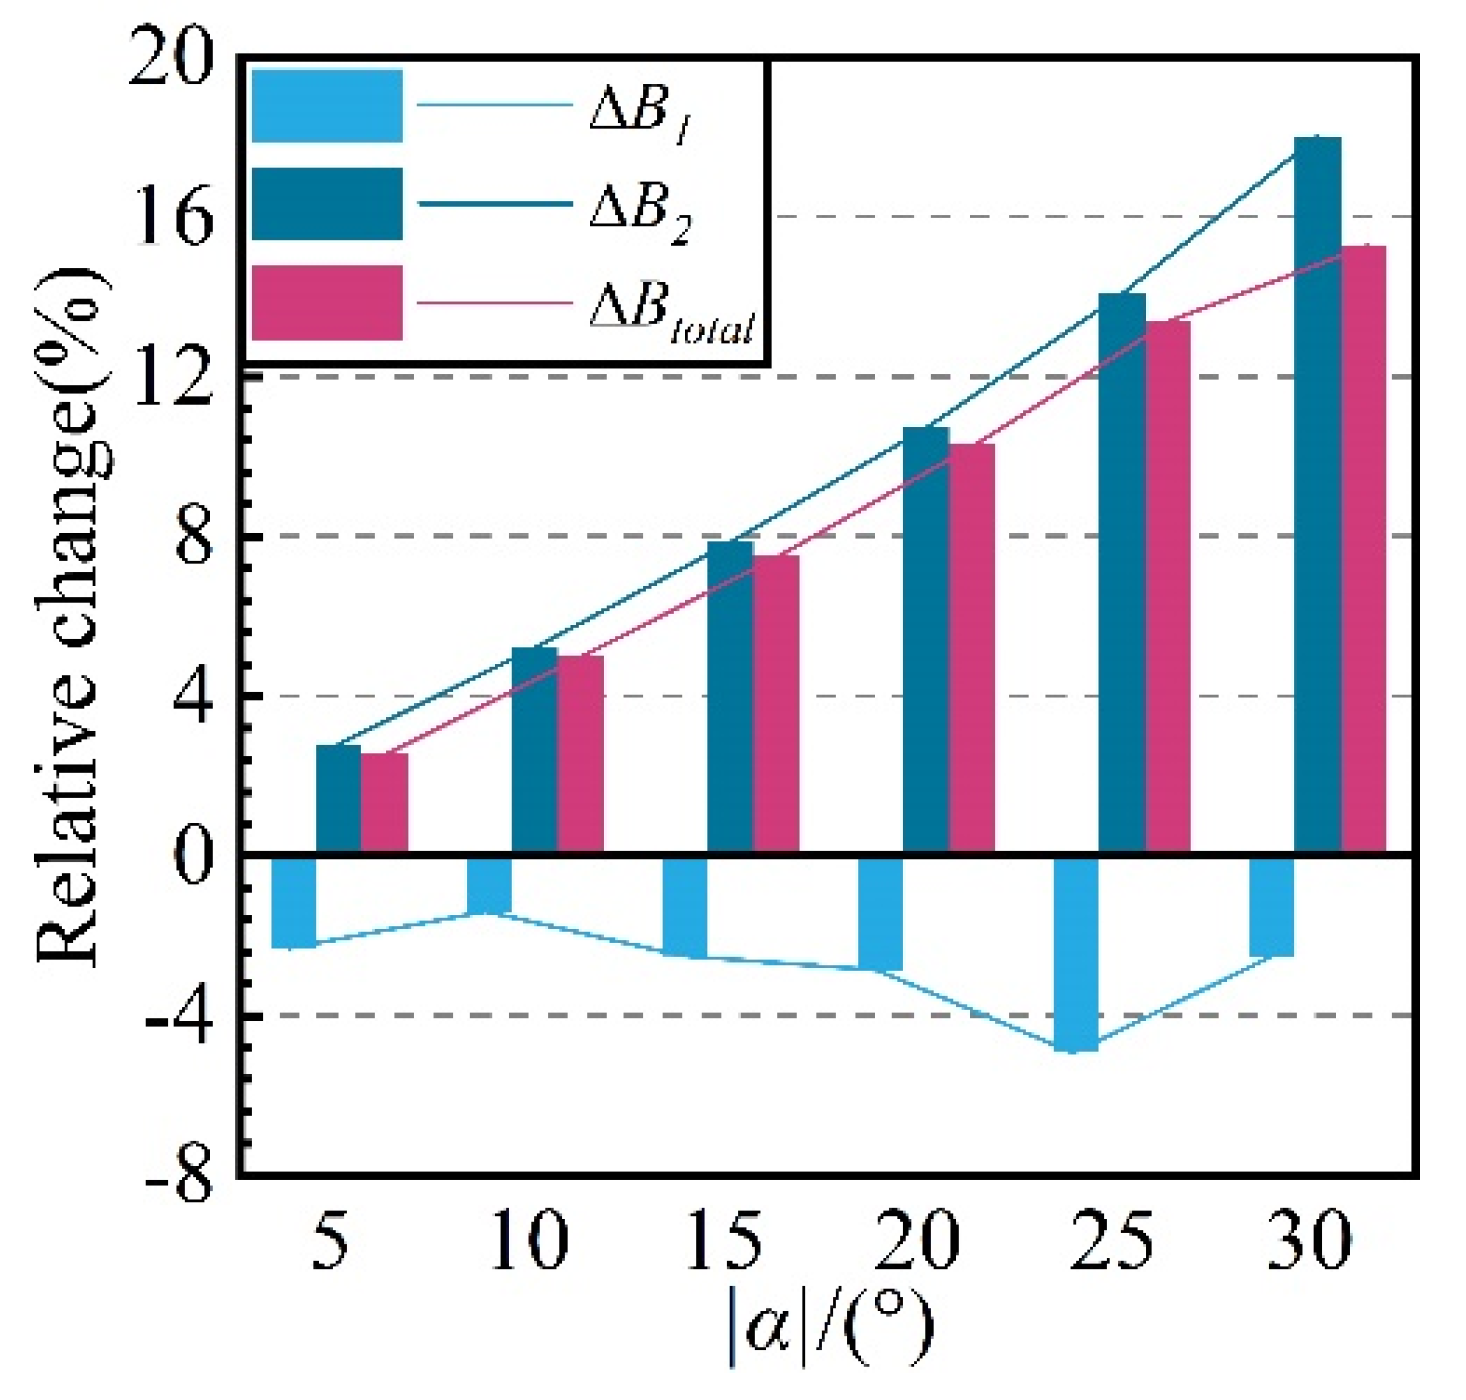
Figure 7 illustrates the variations in B1, B2, and Btotal during the adjustment process of the CDFS VIGV. As the CDFS VIGV closes, B1 exhibits an overall decreasing trend followed by an increasing trend. Meanwhile, B2 and Btotal increase with closure of the CDFS VIGV, with increases of 18.05% and 15.29%, respectively, observed when αVIGV = −30°. The growth rate of Btotal is somewhat reduced due to the influence of B1. Overall, it can be concluded that the variation in B2 plays a dominant role in the changes observed in Btotal.
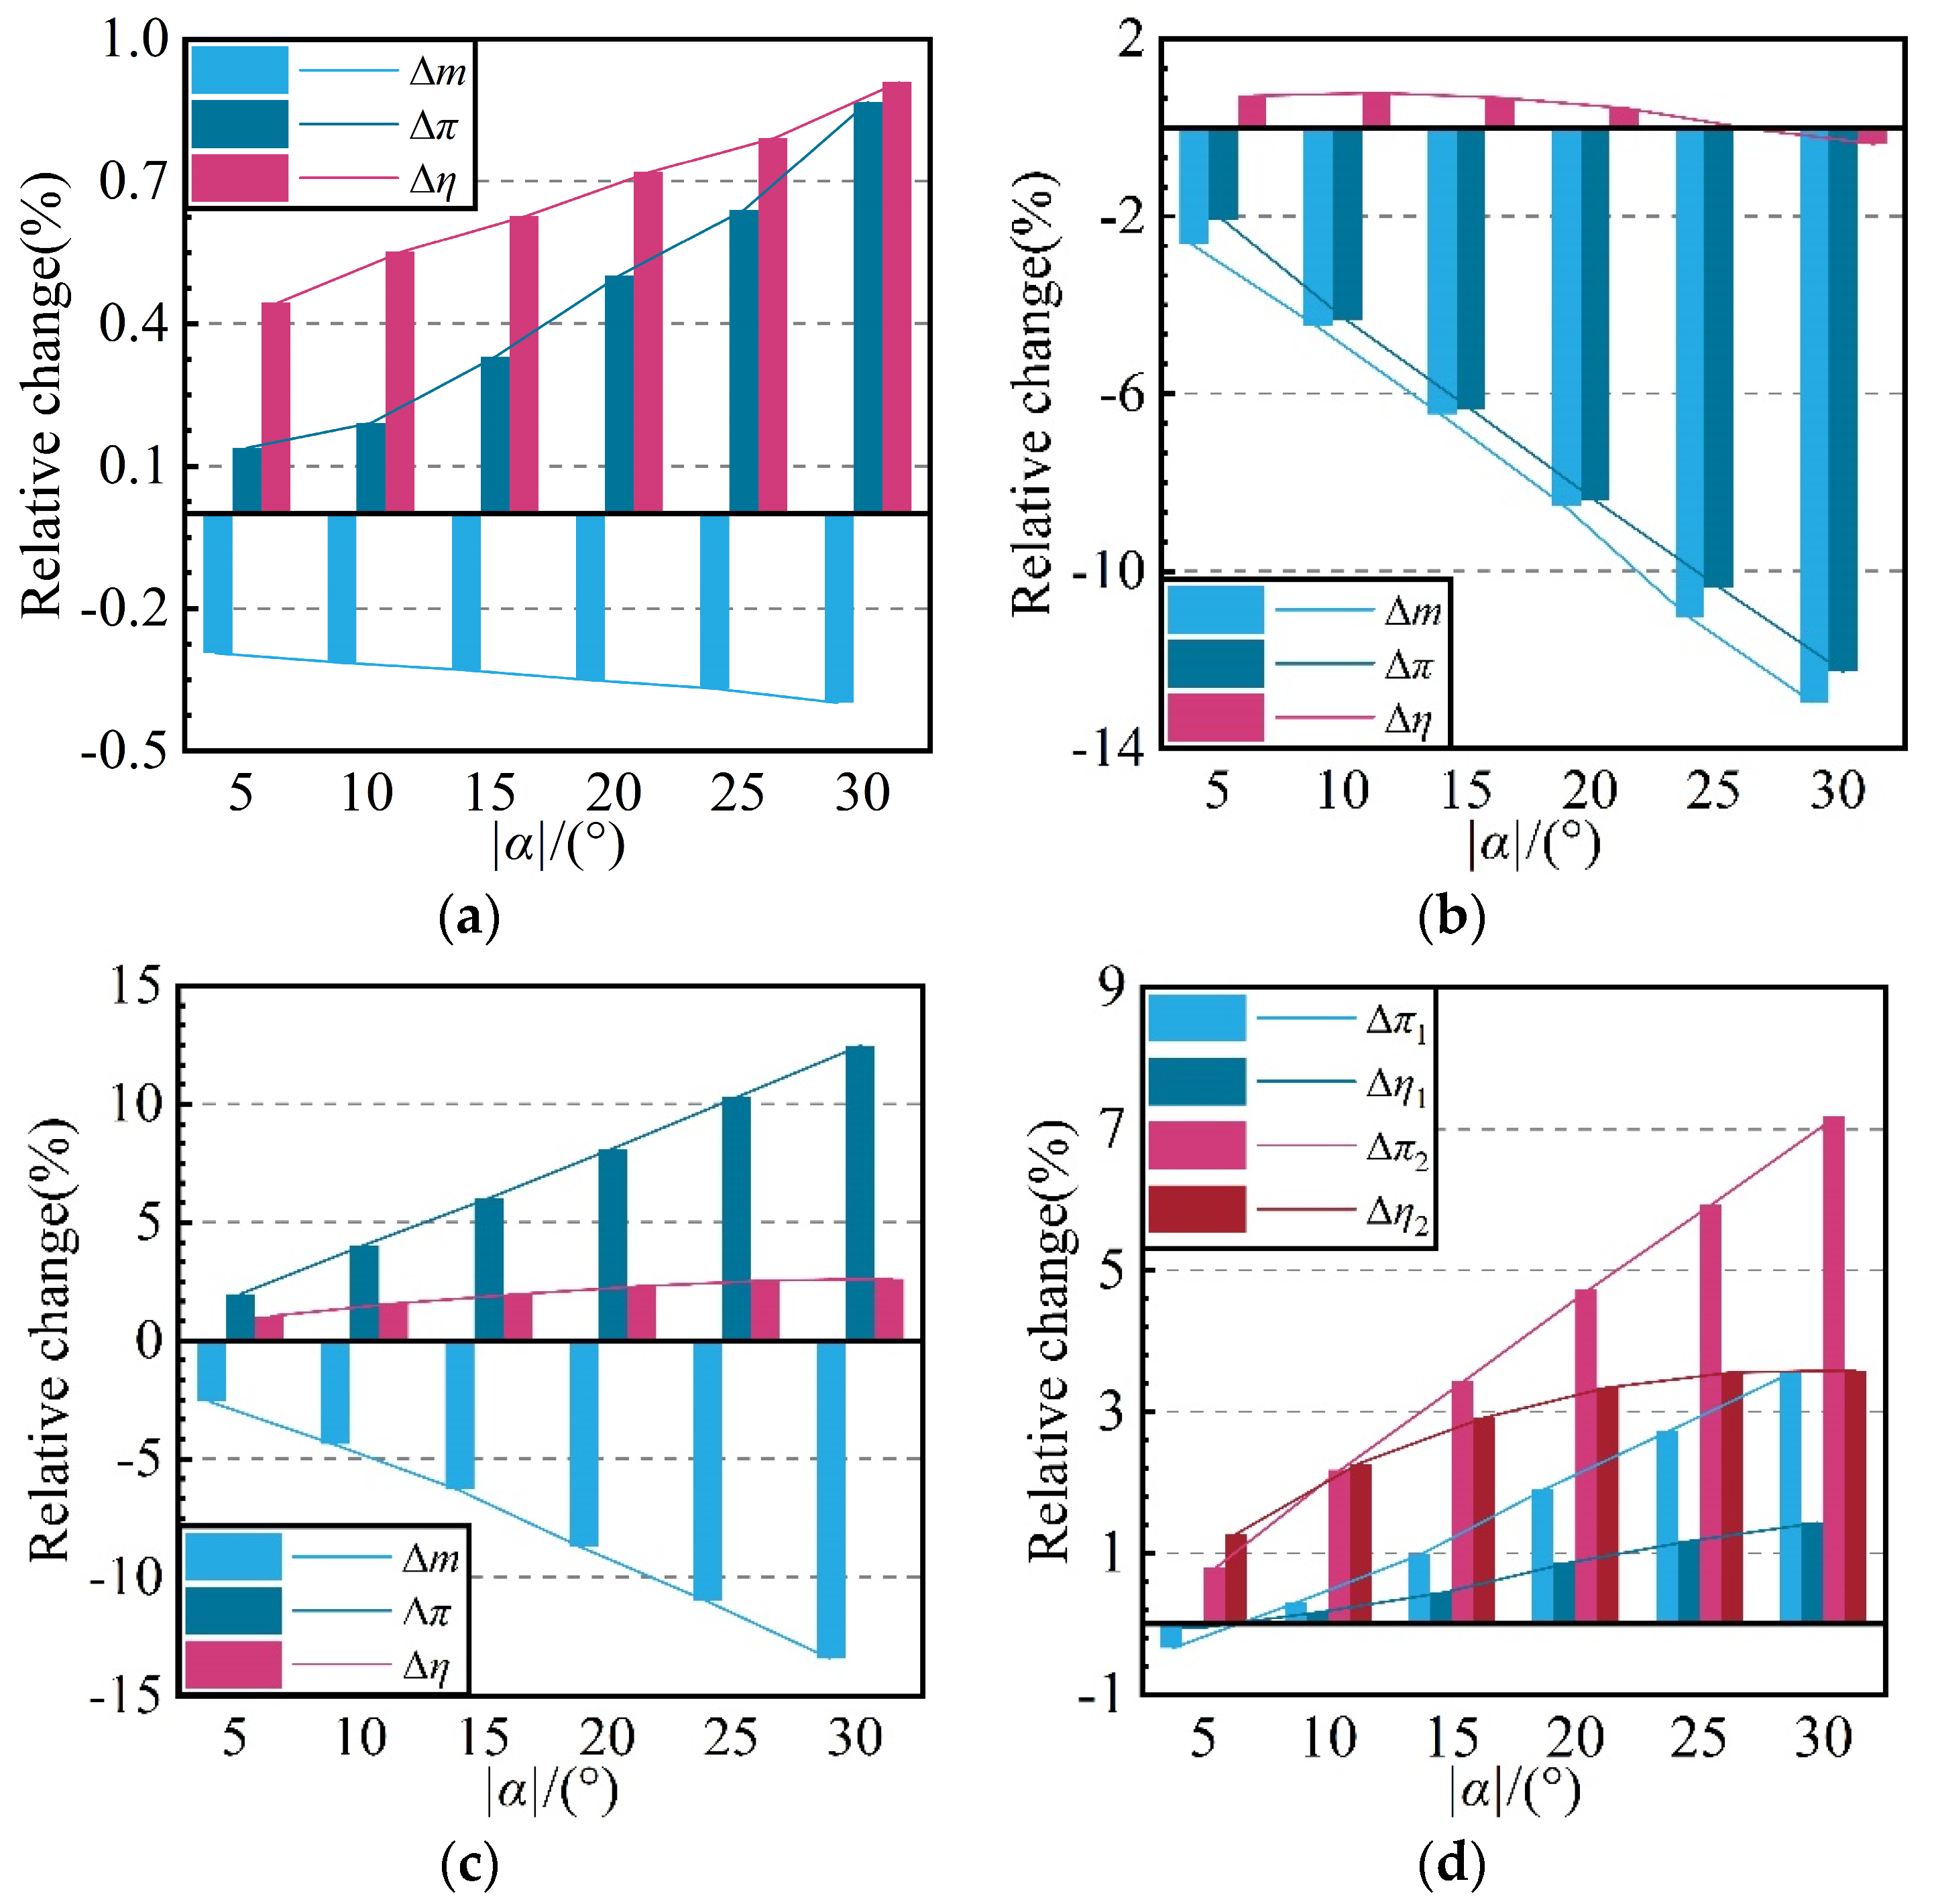
Figure 8 presents the performance variations of different components in the compression system under varying CDFS VIGV openings. With the closure of the CDFS VIGV, the flow rates of both the fan and CDFS show a decreasing trend, with the reduction in the CDFS flow rate being significantly greater than that of the fan. The efficiency and pressure ratio of the fan exhibit slight improvements, with maximum increases of no more than 1%. This is attributed to the slight movement of the fan’s operating point from the near choke state towards the near stall state. In comparison to the fan, the efficiency of the CDFS displays a trend of initial improvement followed by a decrease, but the magnitude of the change is not significant, with a maximum efficiency difference of only 1.15%.
In comparison, the magnitude of variation in the CDFS pressure ratio is significantly higher than that of its efficiency. At a value of −30° for αVIGV, a reduction in the pressure ratio of up to 12.26% is observed. In practical applications, the inlet conditions of the CDFS are influenced by the operating point of the fan and flow field of the transition section, while the outlet conditions are affected by the matching state of the HPC and first outer bypass. Hence, the performance variability mechanism of the CDFS is complex and requires a detailed examination, which will be explored further below. As evidenced by Figure 8c, a reduction in the CDFS VIGV opening leads to a reduction in the HPC flow rate. This shift causes the matching point of the HPC to move from the near choke point toward the peak efficiency point, resulting in continuing increases in both efficiency and pressure ratio. However, it is worth noting that the growth rate of efficiency is significantly lower than that of the pressure ratio. At an αVIGV value of −30°, the HPC demonstrates variations in both flow rate and pressure ratio exceeding 12%. Meanwhile, an efficiency increment of 2.63% is observed, with an increasingly flattened trend in efficiency increase.
Further insight into the variations in total pressure ratio and isentropic efficiency of the first two stages of the HPC is provided by Figure 8d. The observations reveal that with the closing of the CDFS VIGV, both the pressure ratio and efficiency of the two stages of the HPC are elevated, with the second stage experiencing a greater increase in performance than the first stage. Notably, as the opening of the CDFS VIGV decreases, the rate of increase in efficiency of the two stages of the high-pressure compressor experiences a decelerating trend.
Within the scope of CDFS VIGV opening variations examined in this study, the fan exhibits the smallest degree of aerodynamic performance alteration, with the HPC following closely. As an illustration, with regards to total pressure ratio, when the CDFS VIGV opening decreases from αVIGV = 0° to αVIGV = −30°, the increase in the total pressure ratio for the fan is merely 0.87%, whereas those for the CDFS and HPC are 12.26% and 12.48%, respectively.
In order to elucidate the impact mechanism of CDFS VIGV opening on the performance of each component in the medium variable bypass ratio compression system, three typical operating conditions were selected, with CDFS VIGV openings of 0°, 15°, and 30°. The interstage flow matching of the fan, CDFS, and HPC, as well as the flow characteristics of each component, were subjected to in-depth analysis.
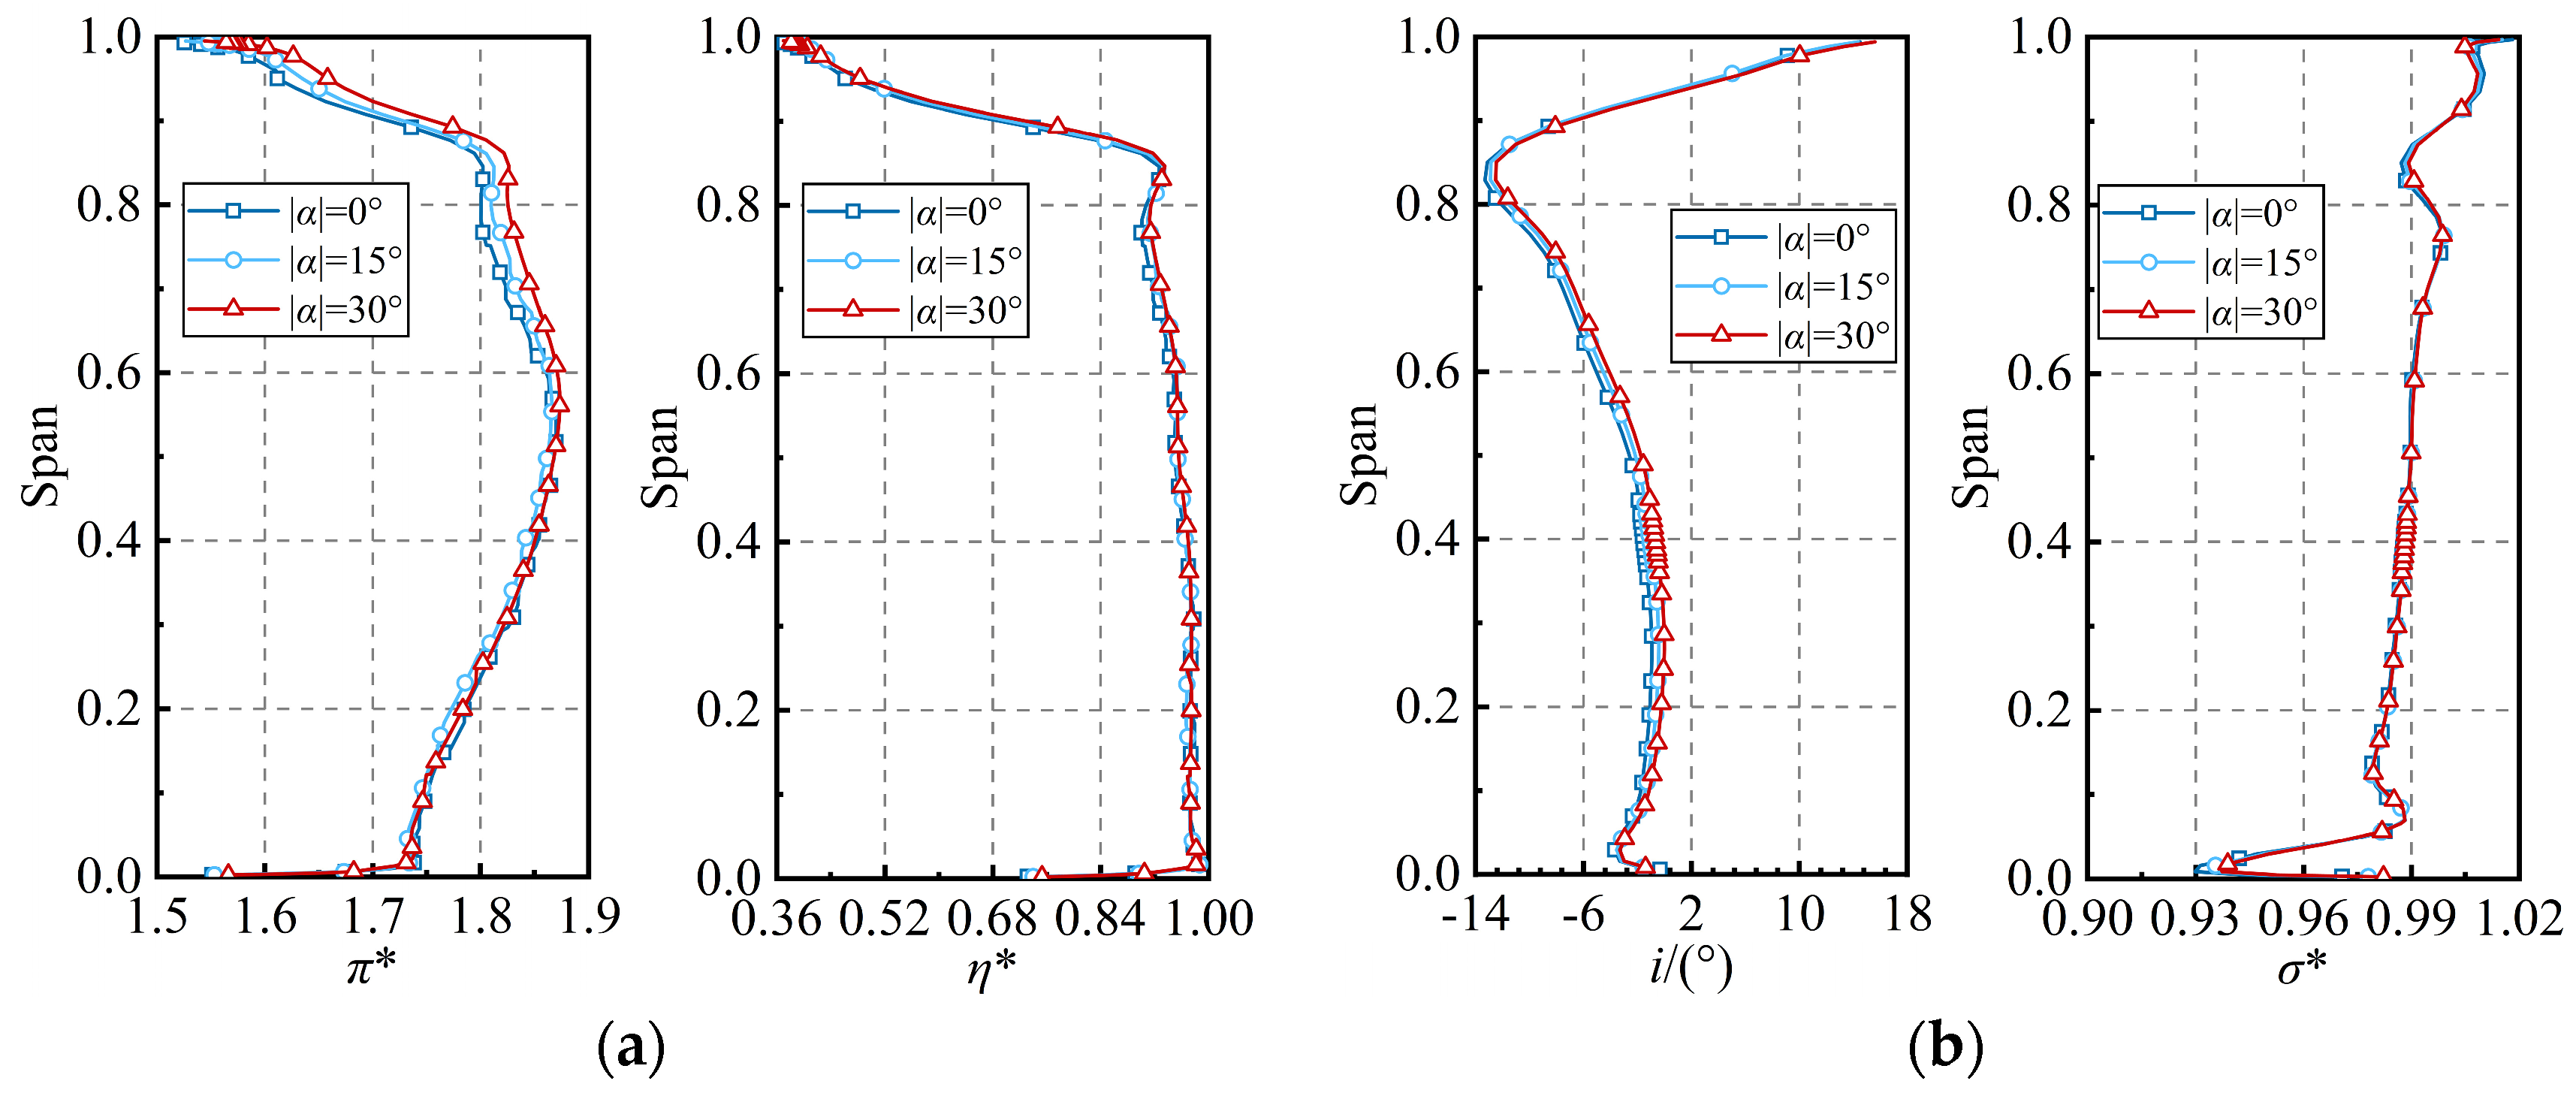
Figure 9 provides the radial distribution patterns of the average aerodynamic parameters of the fan rotor and stator under different CDFS VIGV openings. As revealed in Figure 9a, the total pressure ratio of the fan rotor in the region above 60% of the blade height increases as the CDFS VIGV is closed, while the increase in the total pressure ratio in the region below 60% of the blade height is relatively small. This aligns with the typical operational characteristics of a transonic fan. Similarly, the efficiency of the fan rotor in the region above 60% of the blade height increases slightly as the pressure ratio is increased. Moreover, the variations in inlet angle and flow coefficient of the fan rotor are minimal with the closing of the CDFS VIGV. Figure 9b illustrates the radial distribution patterns of the stator incidence angle and total pressure recovery coefficient under different CDFS VIGV openings. As shown in the figure, the fan stator operates in a largely negative incidence angle state within the range below 80% of the blade height, while it operates in a positive incidence angle state within the blade tip range. As the CDFS VIGV opening decreases, the incidence angle of the fan stator in the region below 80% of the blade height increases slightly but remains at a low level, indicating that the closing of the CDFS VIGV does not cause the stator root to leave the blocked state. Coupled with the radial distribution of the total pressure recovery coefficient, it can be inferred that the CDFS VIGV opening has little impact on the total pressure recovery coefficient of the fan stator.
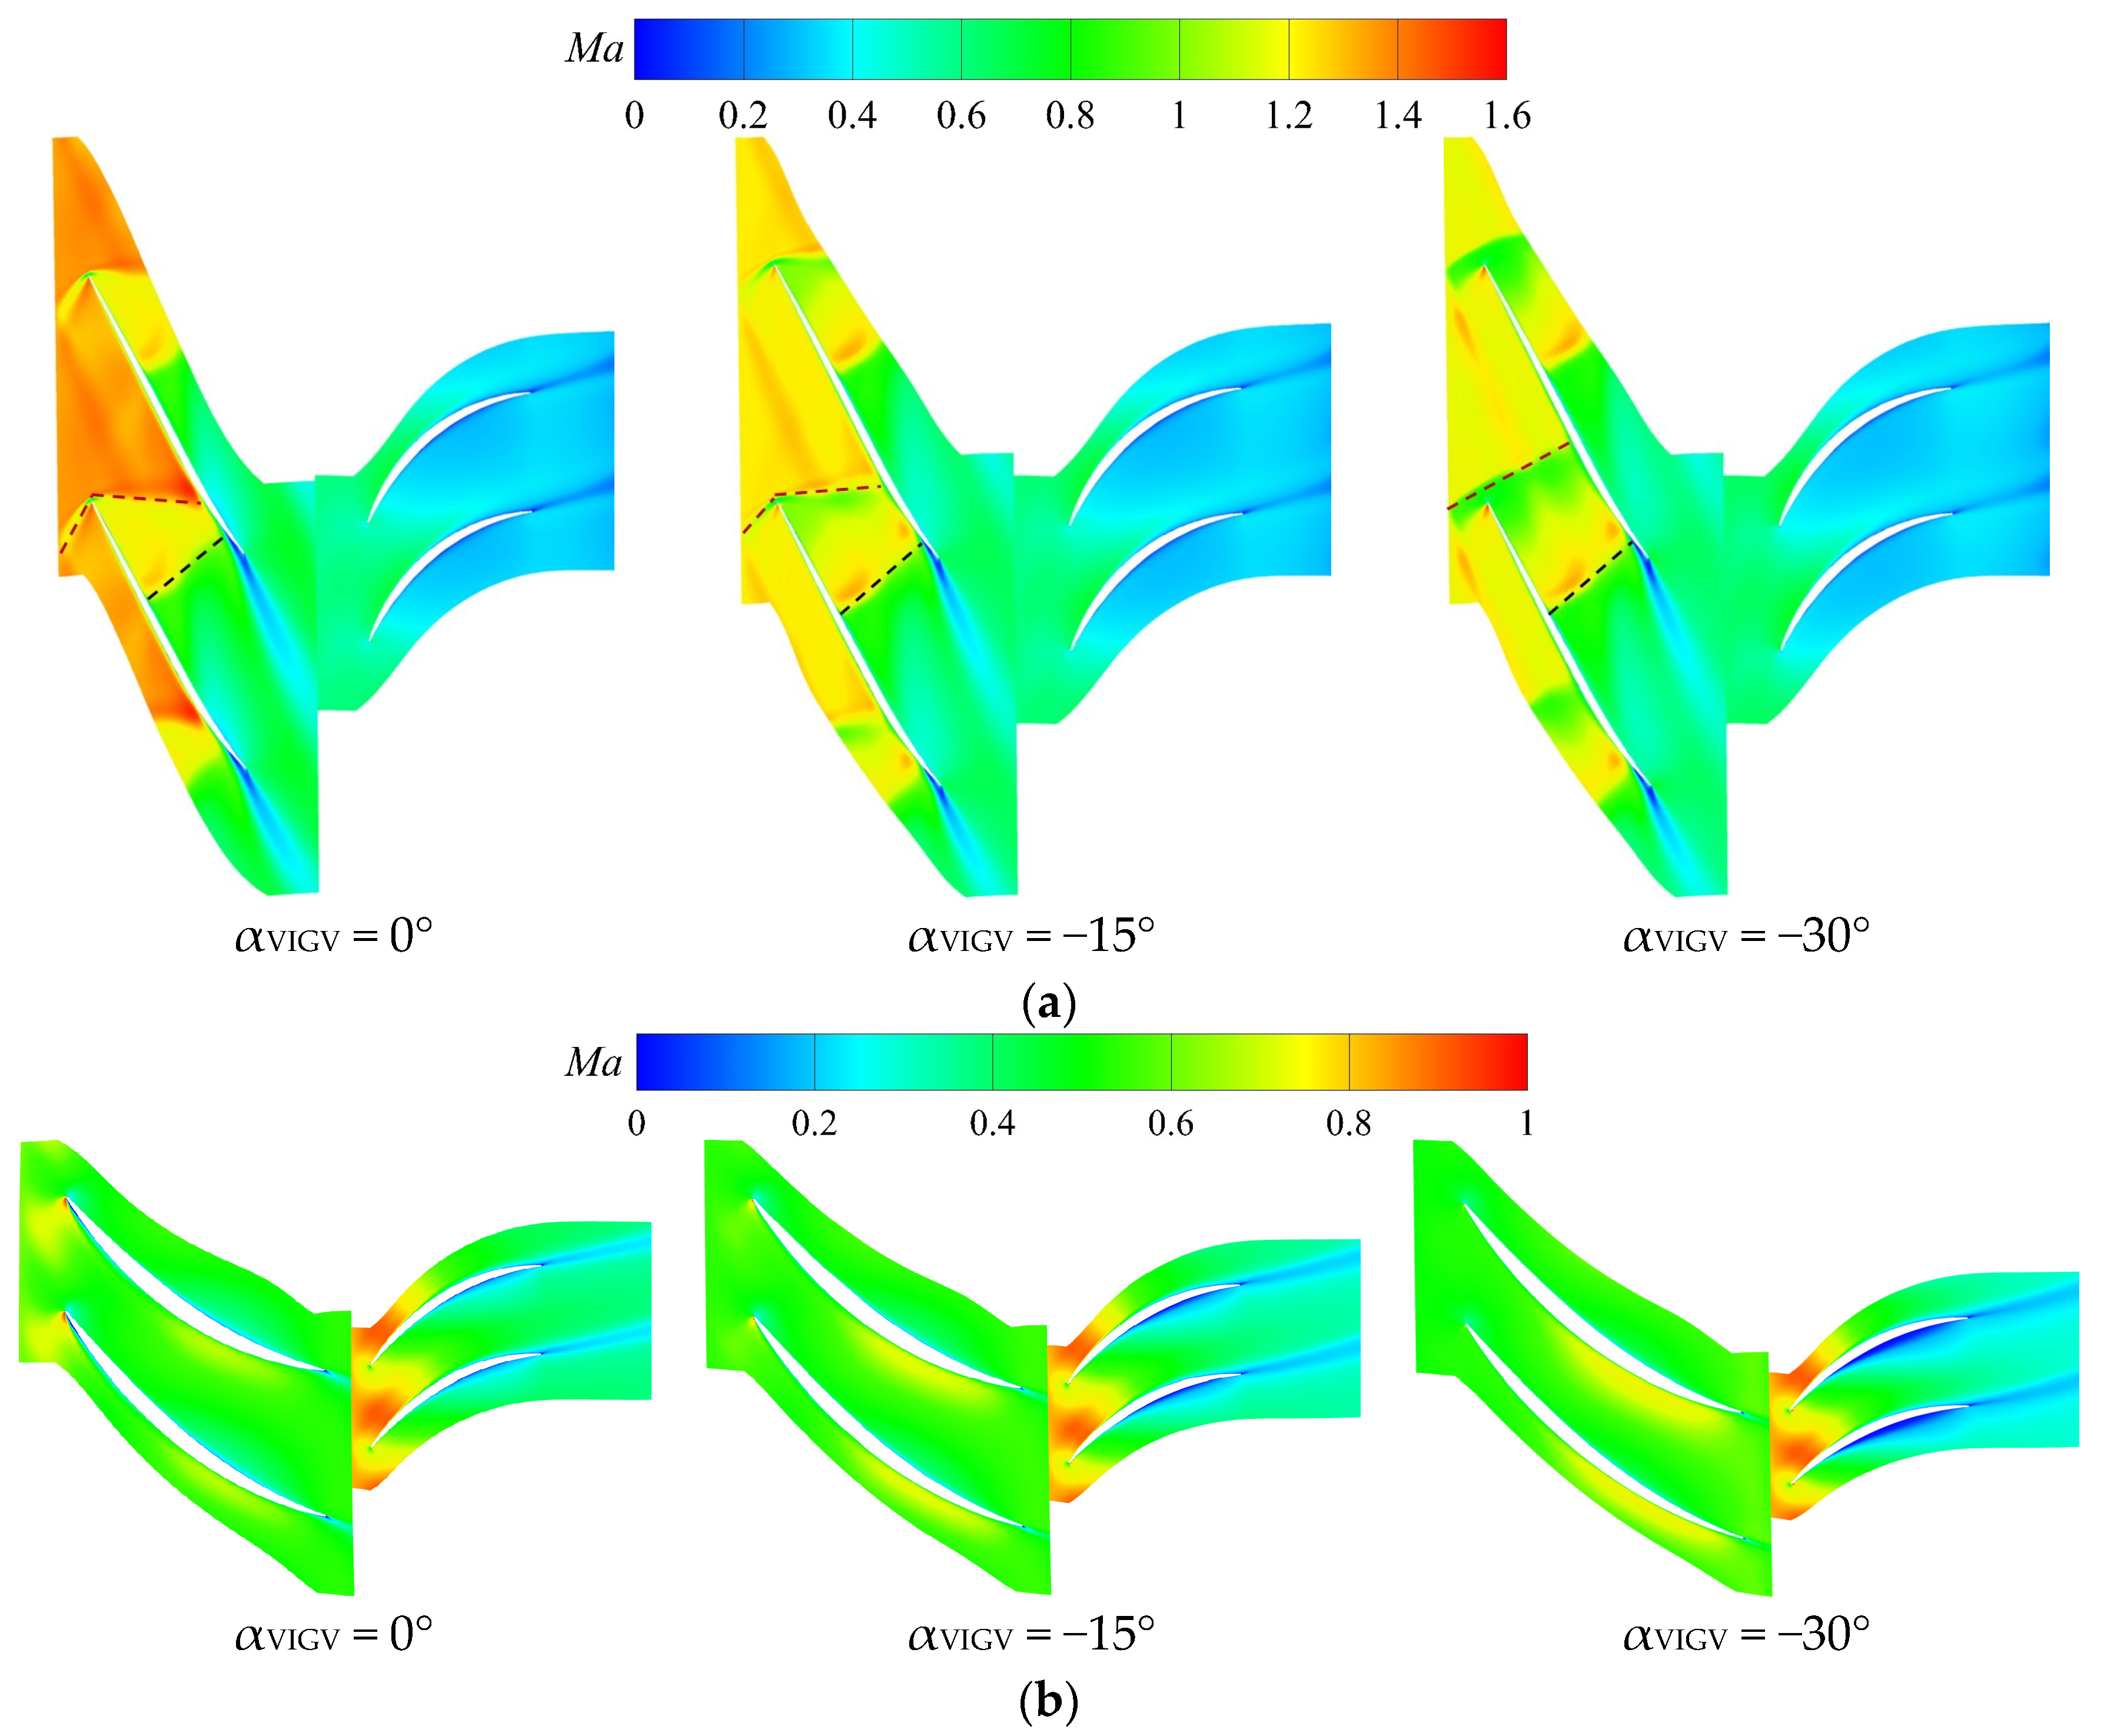
In order to gain further insight into the effect of CDFS VIGV opening on the internal flow of the fan, Figure 10 depicts the distribution patterns of the relative Mach number at the 95% of the blade height section of the fan. It is observed that under different operating conditions, the flow field structure at the tip of the fan rotor exhibits the characteristic feature of “inlet oblique shock wave plus passage normal shock wave.” The interaction between the two shock waves and the suction surface boundary layer leads to flow separation near the trailing edge of the suction surface, which is in agreement with the typical flow characteristics of transonic elements. When αVIGV = 0°, the fan rotor operates in a relatively negative incidence angle state at the tip section. Under such conditions, the position of the passage shock wave (indicated by the black dashed line) is closer to the trailing edge. It is observed that closing the CDFS VIGV does not significantly change the location of the passage shock wave at the fan rotor tip, nor does it have a significant effect on the shock wave shape and size of the separation zone. Based on the aforementioned analysis of the effect of adjusting the CDFS VIGV on the aerodynamic parameters of the fan, it can be inferred that the fan’s performance is not sensitive to changes in CDFS VIGV opening within the range of operating conditions studied in this paper.
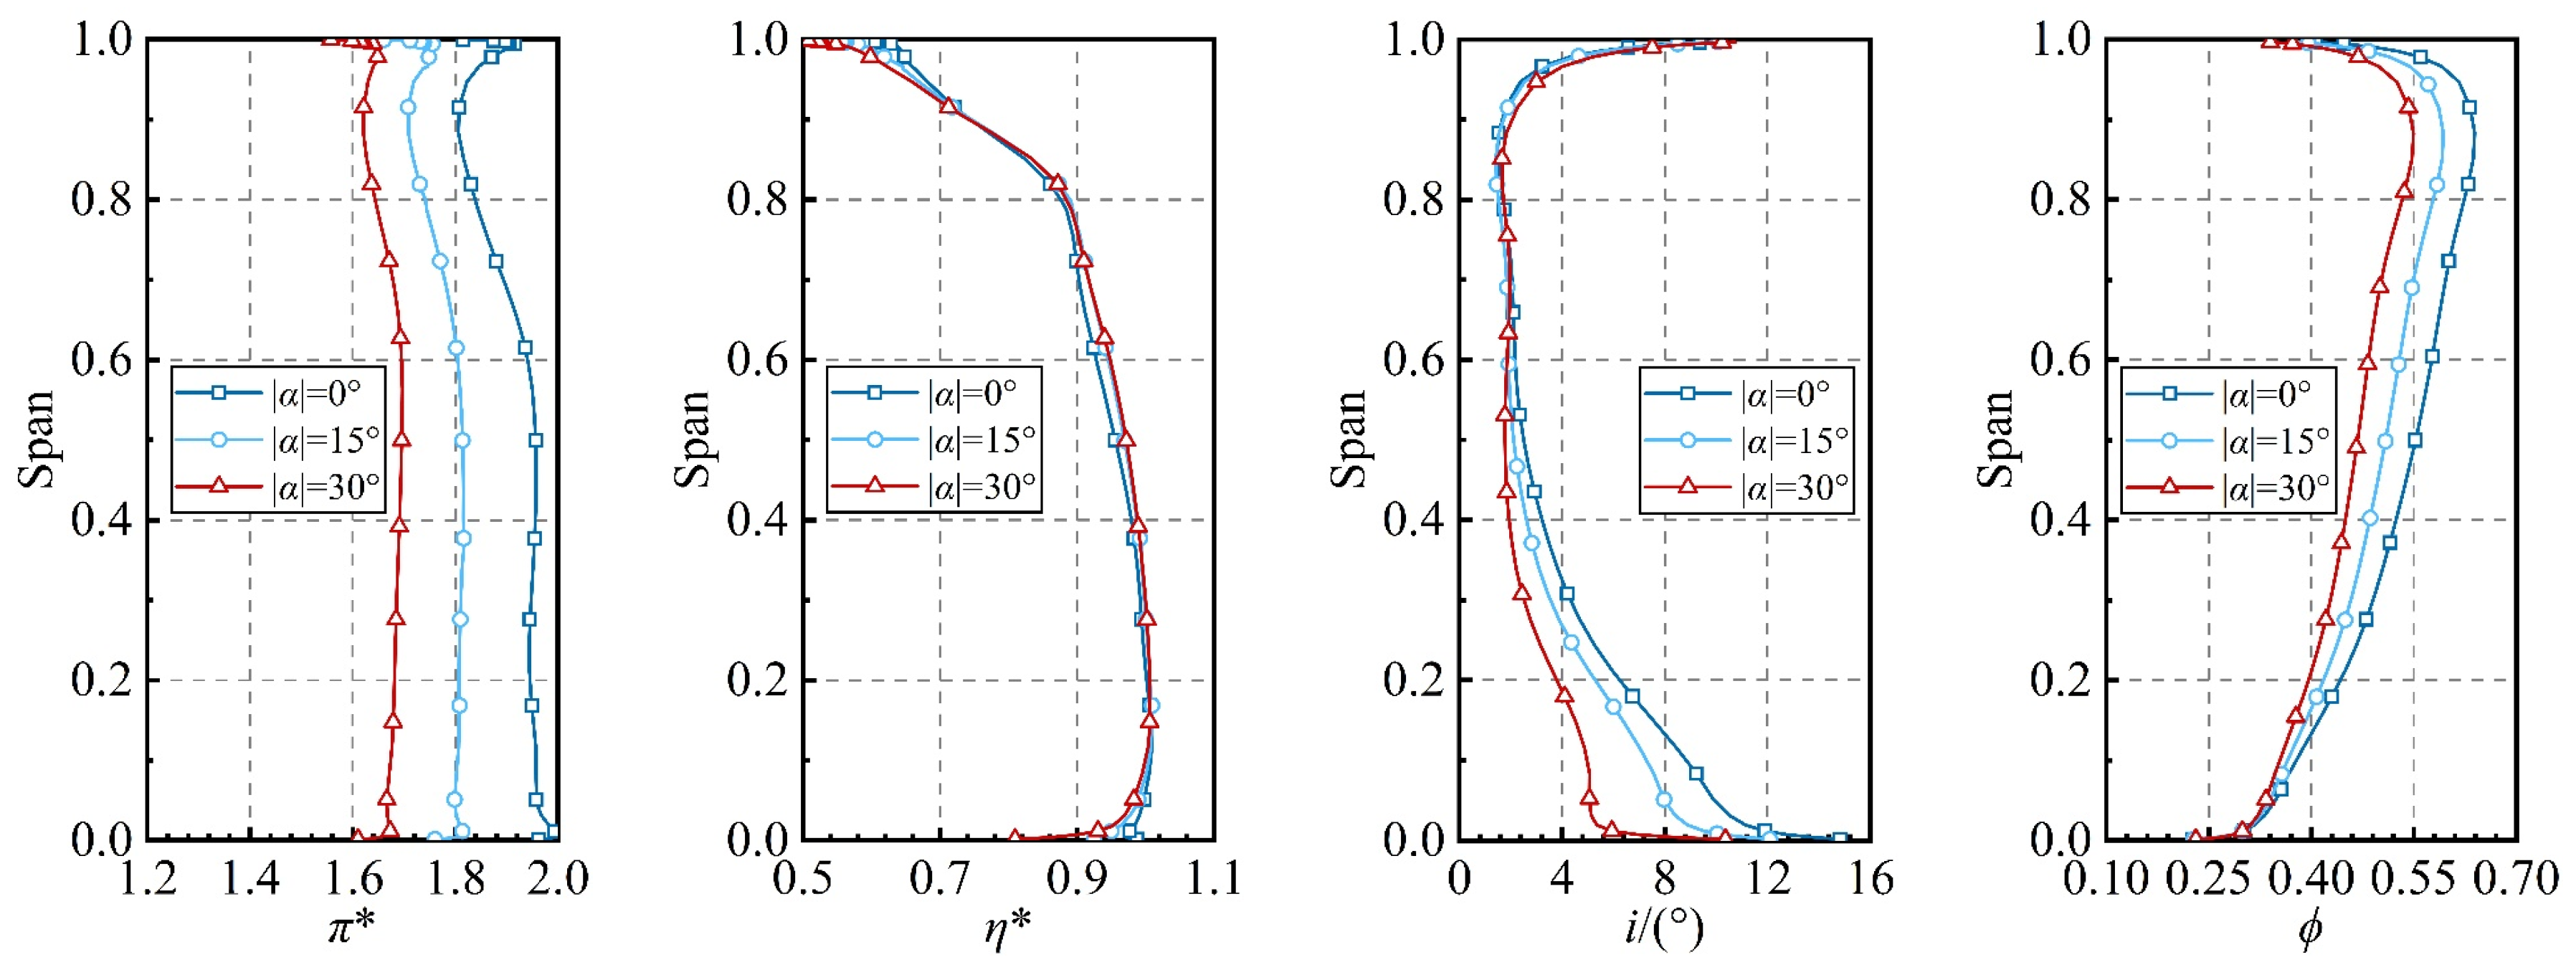
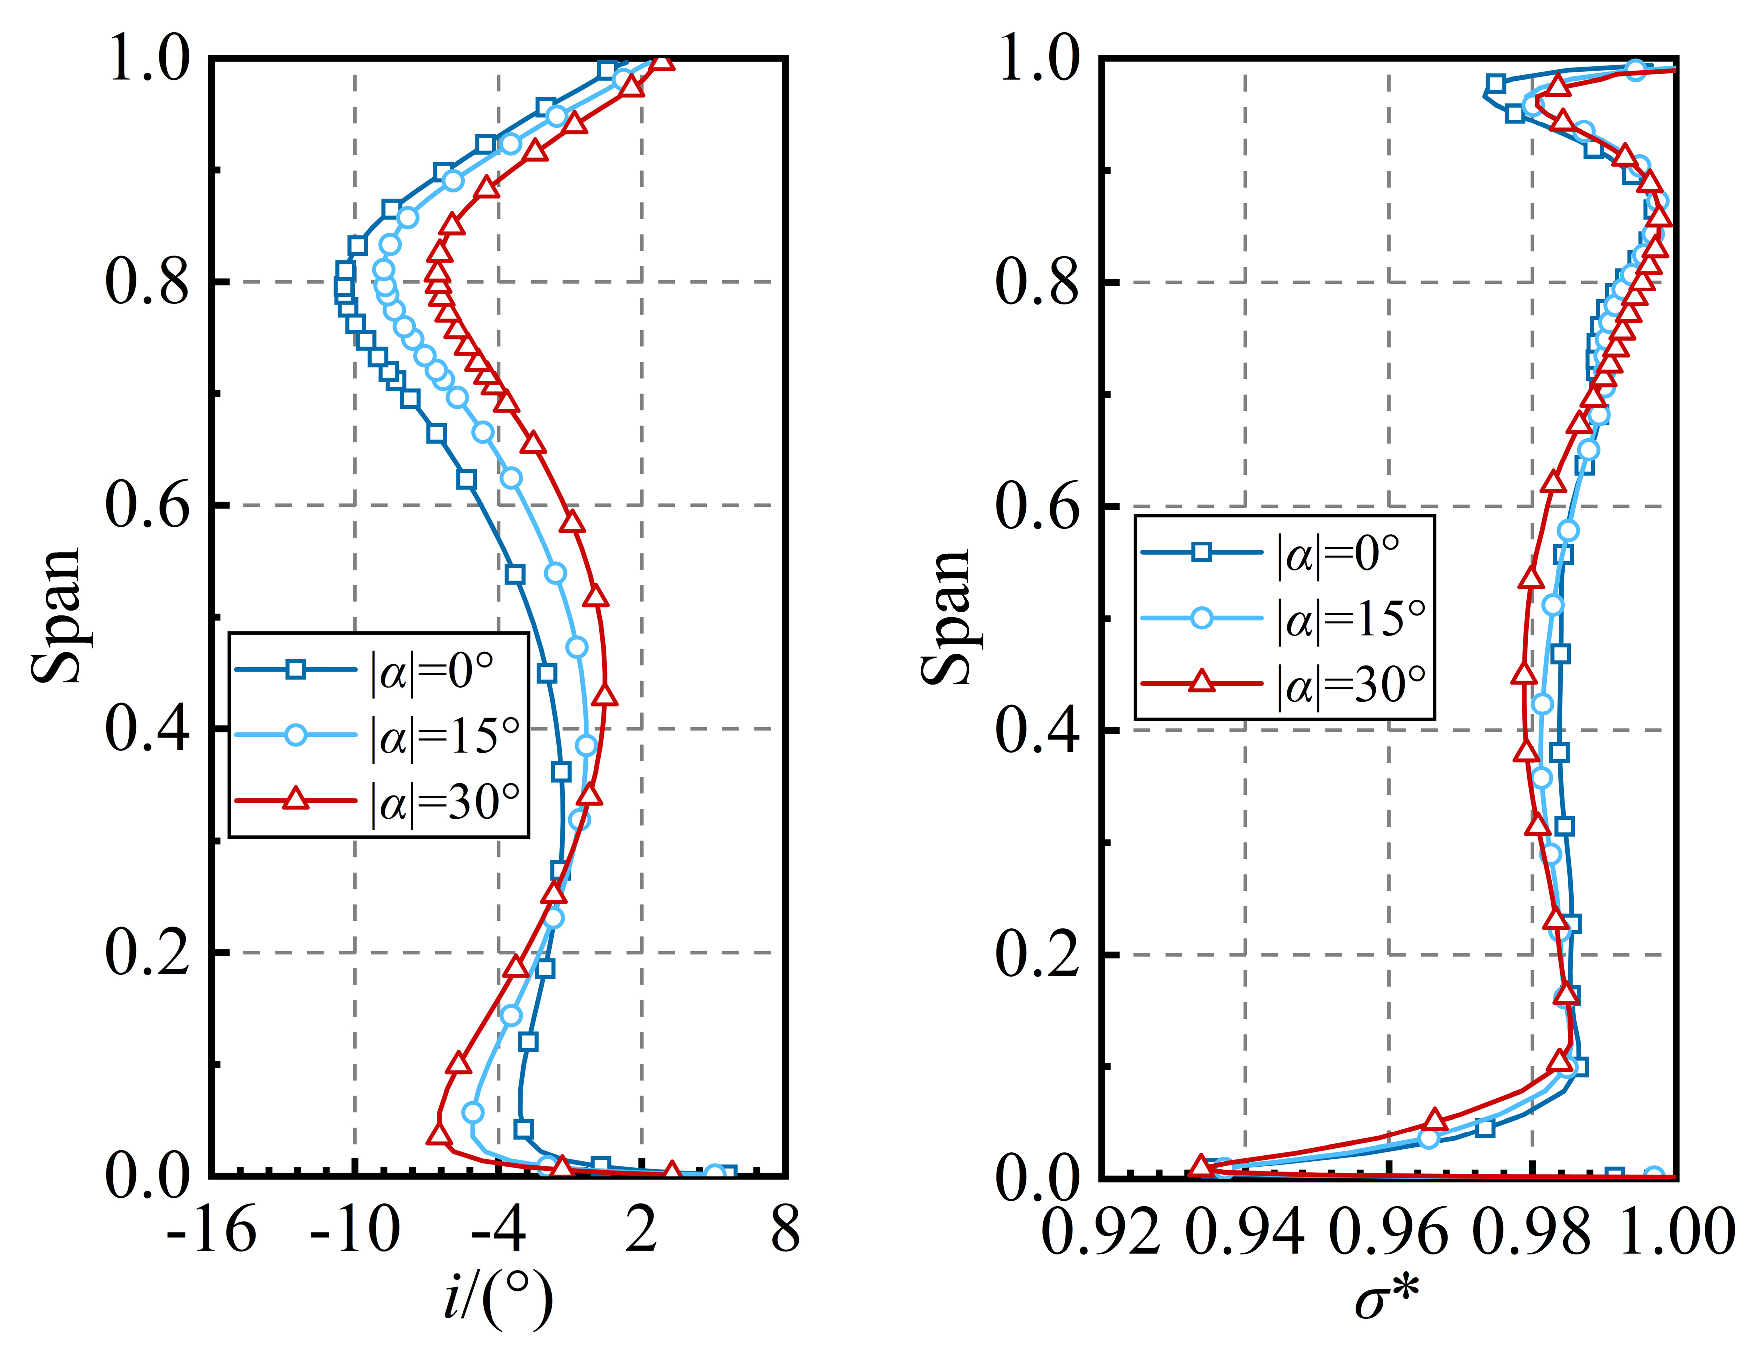
The inlet condition of the CDFS is primarily determined by the operating state of the upstream fan, while its outlet is influenced by the operating state of the HPC and flow rate of the bypass air. As a result, the matching relationship between the CDFS and the other components is complex. The radial distribution patterns of the mean aerodynamic parameters of the CDFS rotor under varying CDFS VIGV openings are shown in Figure 11. The parameters include total pressure ratio, adiabatic efficiency, incidence angle, and flow coefficient, displayed from left to right in the figure. The distribution pattern of the total pressure ratio reveals that as the CDFS VIGV closes, the pressure ratio of the CDFS rotor significantly decreases throughout the entire blade height, in accordance with the trend of pressure ratio variation depicted in Figure 8. In contrast to the significant changes in the total pressure ratio, the effect of varying the CDFS VIGV opening on the efficiency of the CDFS rotor is relatively minor. The efficiency of the rotor exhibits a slight improvement at the mid-section, while there is a slight decrease observed at both the tip and root sections. The radial variation pattern of the attack angle for the CDFS rotor indicates a slight increase in the region above 80% of the blade height and a significant decrease below that level, with the decrease becoming more pronounced closer to the root. Concurrently, the radial variation pattern of the flow coefficient at the CDFS rotor inlet exhibits an inverse trend to that of the incidence angle. As the CDFS VIGV closes, the flow coefficient experiences a decrease across the entire blade height, with the reduction becoming more pronounced closer to the tip.
Figure 12 presents the radial variation patterns of the stator incidence angle and total pressure recovery coefficient of the CDFS stator for different CDFS VIGV openings. It can be observed that the incidence angle of the CDFS stator experiences a decrease within the 25% of the blade height range as the CDFS VIGV closes, while it presents an increase in the remaining majority of the blade height range. The radial distribution pattern of the total pressure recovery coefficient of the CDFS stator reveals the existence of two regions with notable total pressure loss, located respectively at the blade tip and root sections, with the total pressure loss at the root being significantly greater than that at the tip. As the CDFS VIGV closes, there is a slight increase observed in the total pressure loss at the stator root, whereas the total pressure loss at the tip manifests an opposite trend to that at the root.
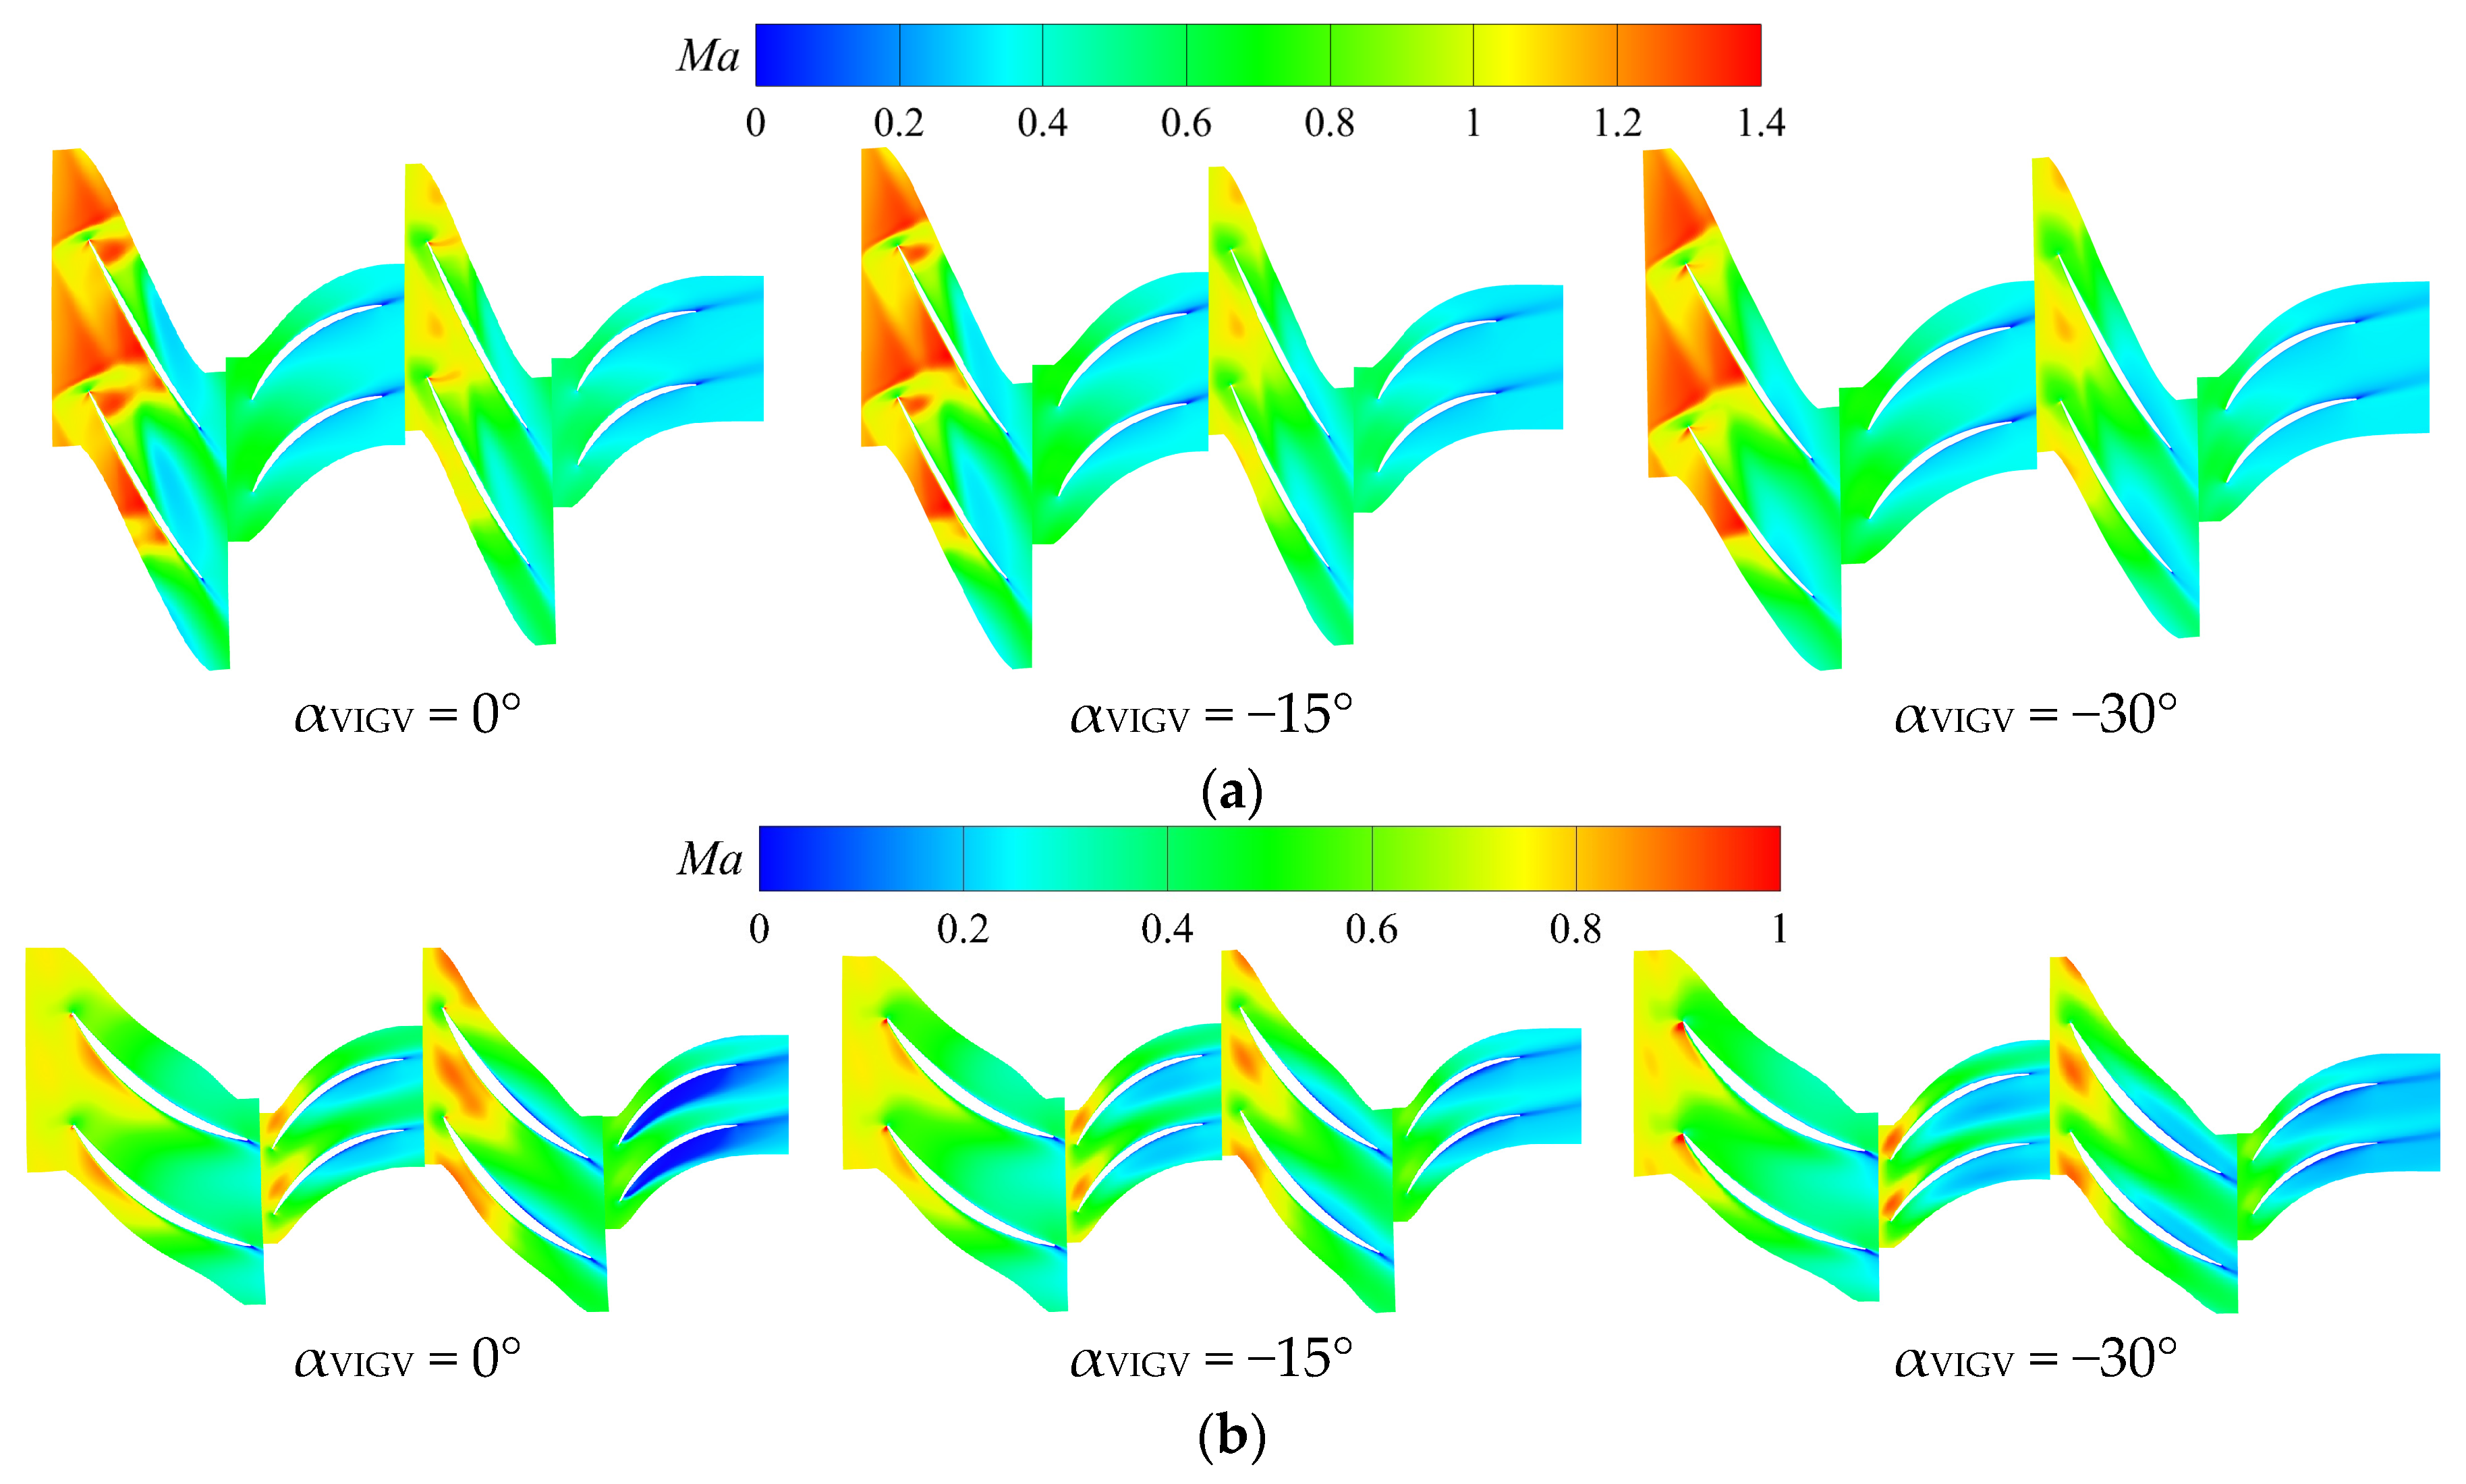
In order to provide a more intuitive reflection of the flow details inside the CDFS, Figure 13 illustrates the distribution patterns of the relative Mach number for the 95% and 5% of the blade height sections under different VIGV openings. To facilitate comparative analysis, a red dashed line is used to indicate the position of the first shock wave, while a black dashed line is used to indicate the position of the second shock wave. Based on the trend of the mass flow coefficient, as shown in Figure 11, it can be inferred that a gradual decrease in the local flow rate at the 95% of the blade height section occurs as the CDFS VIGV closes, resulting in a reduction in the incoming relative Mach number. At this juncture, the shape of the first shock wave at the inlet is transformed from an attached oblique shock wave to a detached oblique shock wave, while the location of the passage shock wave near the trailing edge remains relatively constant. Based on the evolution pattern of the relative Mach number distribution at the root, it can be inferred that the rotor at the root is subject to a larger positive incidence angle, while the stator at the root experiences a negative incidence angle when the CDFS VIGV is not closed. As the CDFS VIGV gradually shuts, the incidence angle at the rotor deviates towards the negative direction, while the negative incidence angle further amplifies at the stator root, resulting in flow separation on the pressure side of the stator.
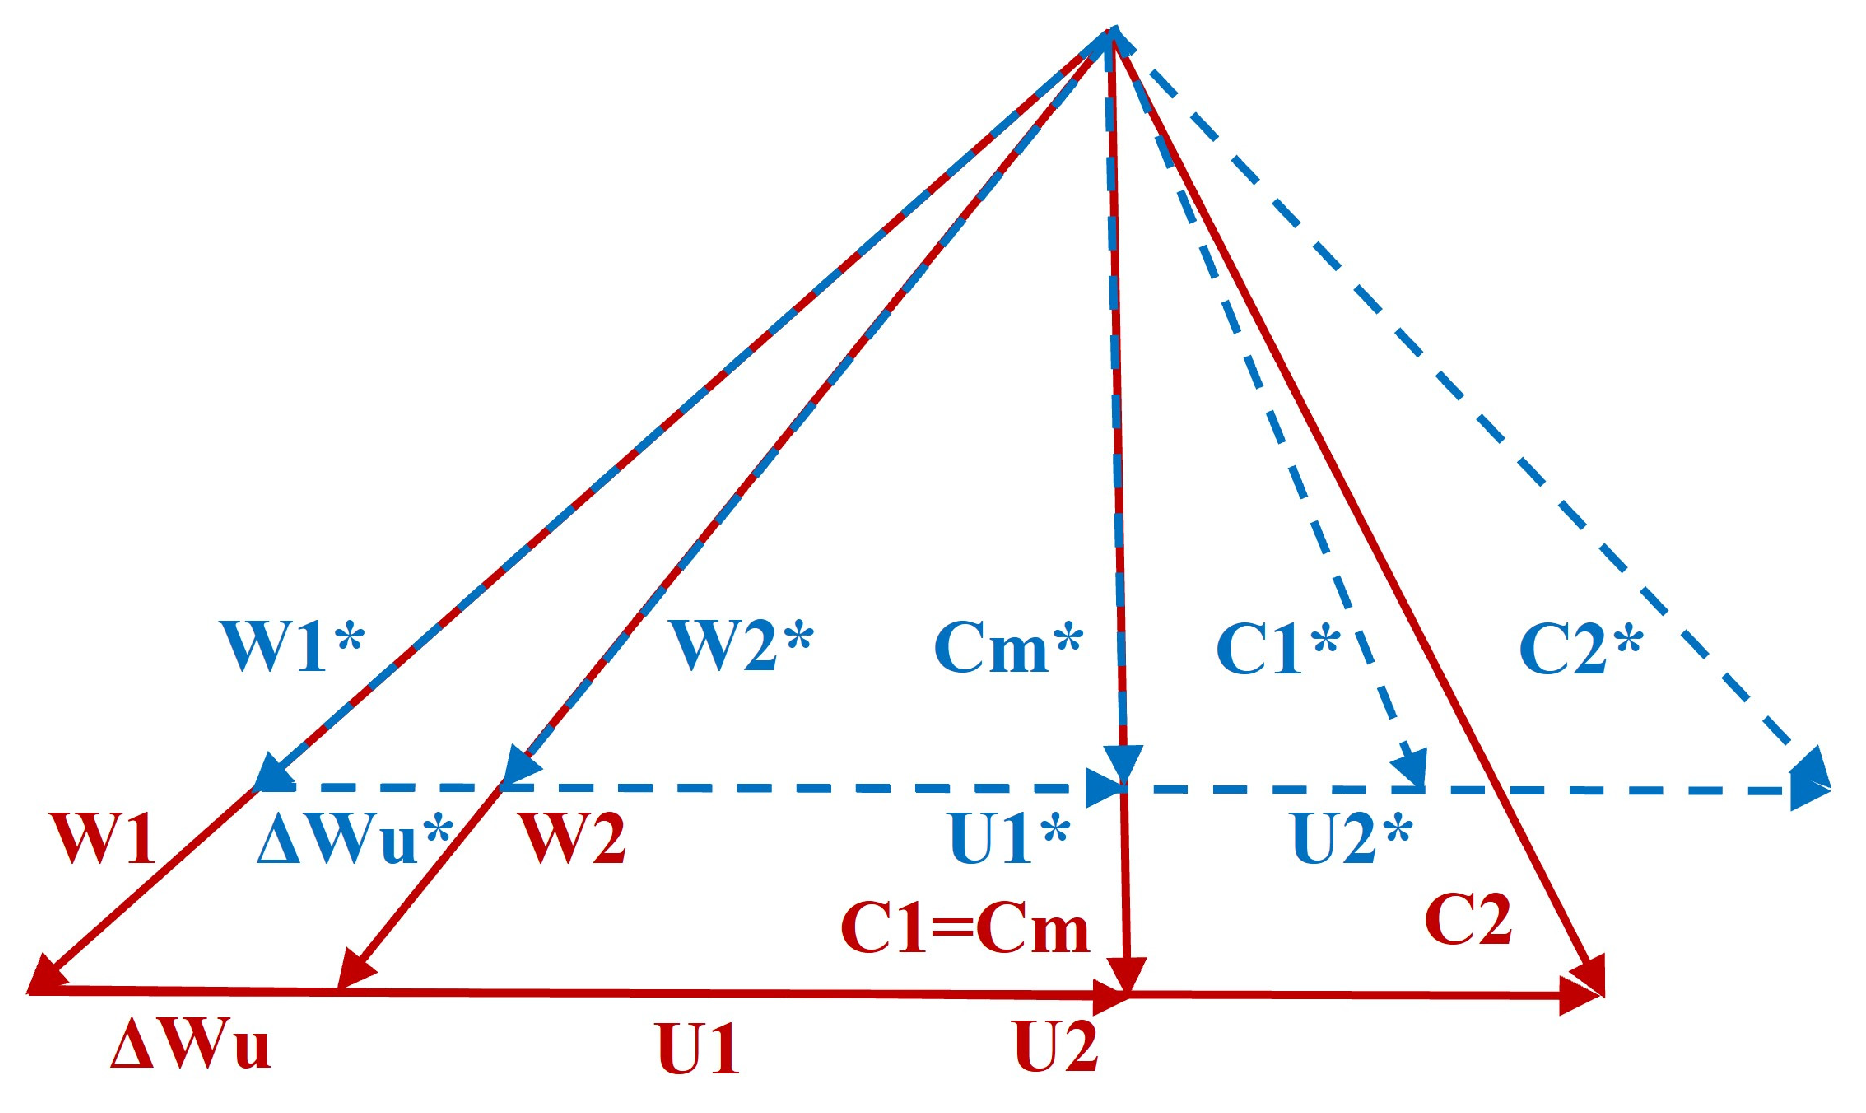
In order to elucidate the underlying mechanism by which the closure of the CDFS VIGV affects the performance of the rotor, Figure 14 affords a comparison between the velocity triangles at the elemental stages of the rotor before and after VIGV adjustment. It is discernible that the closure of the VIGV causes an augmentation in the absolute flow angle at the rotor inlet (C2C2*), which induces a reduction in the twist velocity of the rotor under isobaric and iso-circumferential velocity conditions (WuWu*). According to the definition of adiabatic efficiency and principle of energy conservation, the correlation among the velocity triangles at the elemental stages, pressure ratio, and efficiency is explicitly expounded, as evidenced in Equation (7):
L u = U ( W 1 u W 1 u * ) = U Δ W u = C p ( T t 2 T t 1 ) = C p T t 1 ( π k 1 k 1 η )
where Cp and Tt respectively represent the specific heat ratio of the gas at constant pressure and the total temperature, Lu represents the rim work, and U and Wu respectively represent the circumferential components of the absolute and relative velocities. Equation (7) reveals that the elemental stage pressure ratio is essentially determined by both the twist speed of the airflow (∆Wu) and the efficiency (η) of the elemental stage. In combination with the velocity triangle analysis discussed earlier, it can be inferred that the closure of the CDFS VIGV leads to an overall reduction in blade height twist velocity, therefore causing a decline in the CDFS rotor’s pressure ratio.
Table 3 presents the variation law of the twist velocity at the 95% of the blade height section of the CDFS rotor under different openings of the CDFS VIGV. The data in the table have been dimensionlessly processed based on αVIGV = 0°. The calculation results demonstrate that the twist velocity of the CDFS rotor at the 95% of the blade height section keeps decreasing as the CDFS VIGV closes. As the efficiency change at this height is relatively small under different CDFS VIGV openings (see Figure 11), the total pressure ratio of the CDFS rotor at 95% of the blade height will decrease concomitantly with the reduction in twist velocity, thus further validating the aforementioned conclusion.
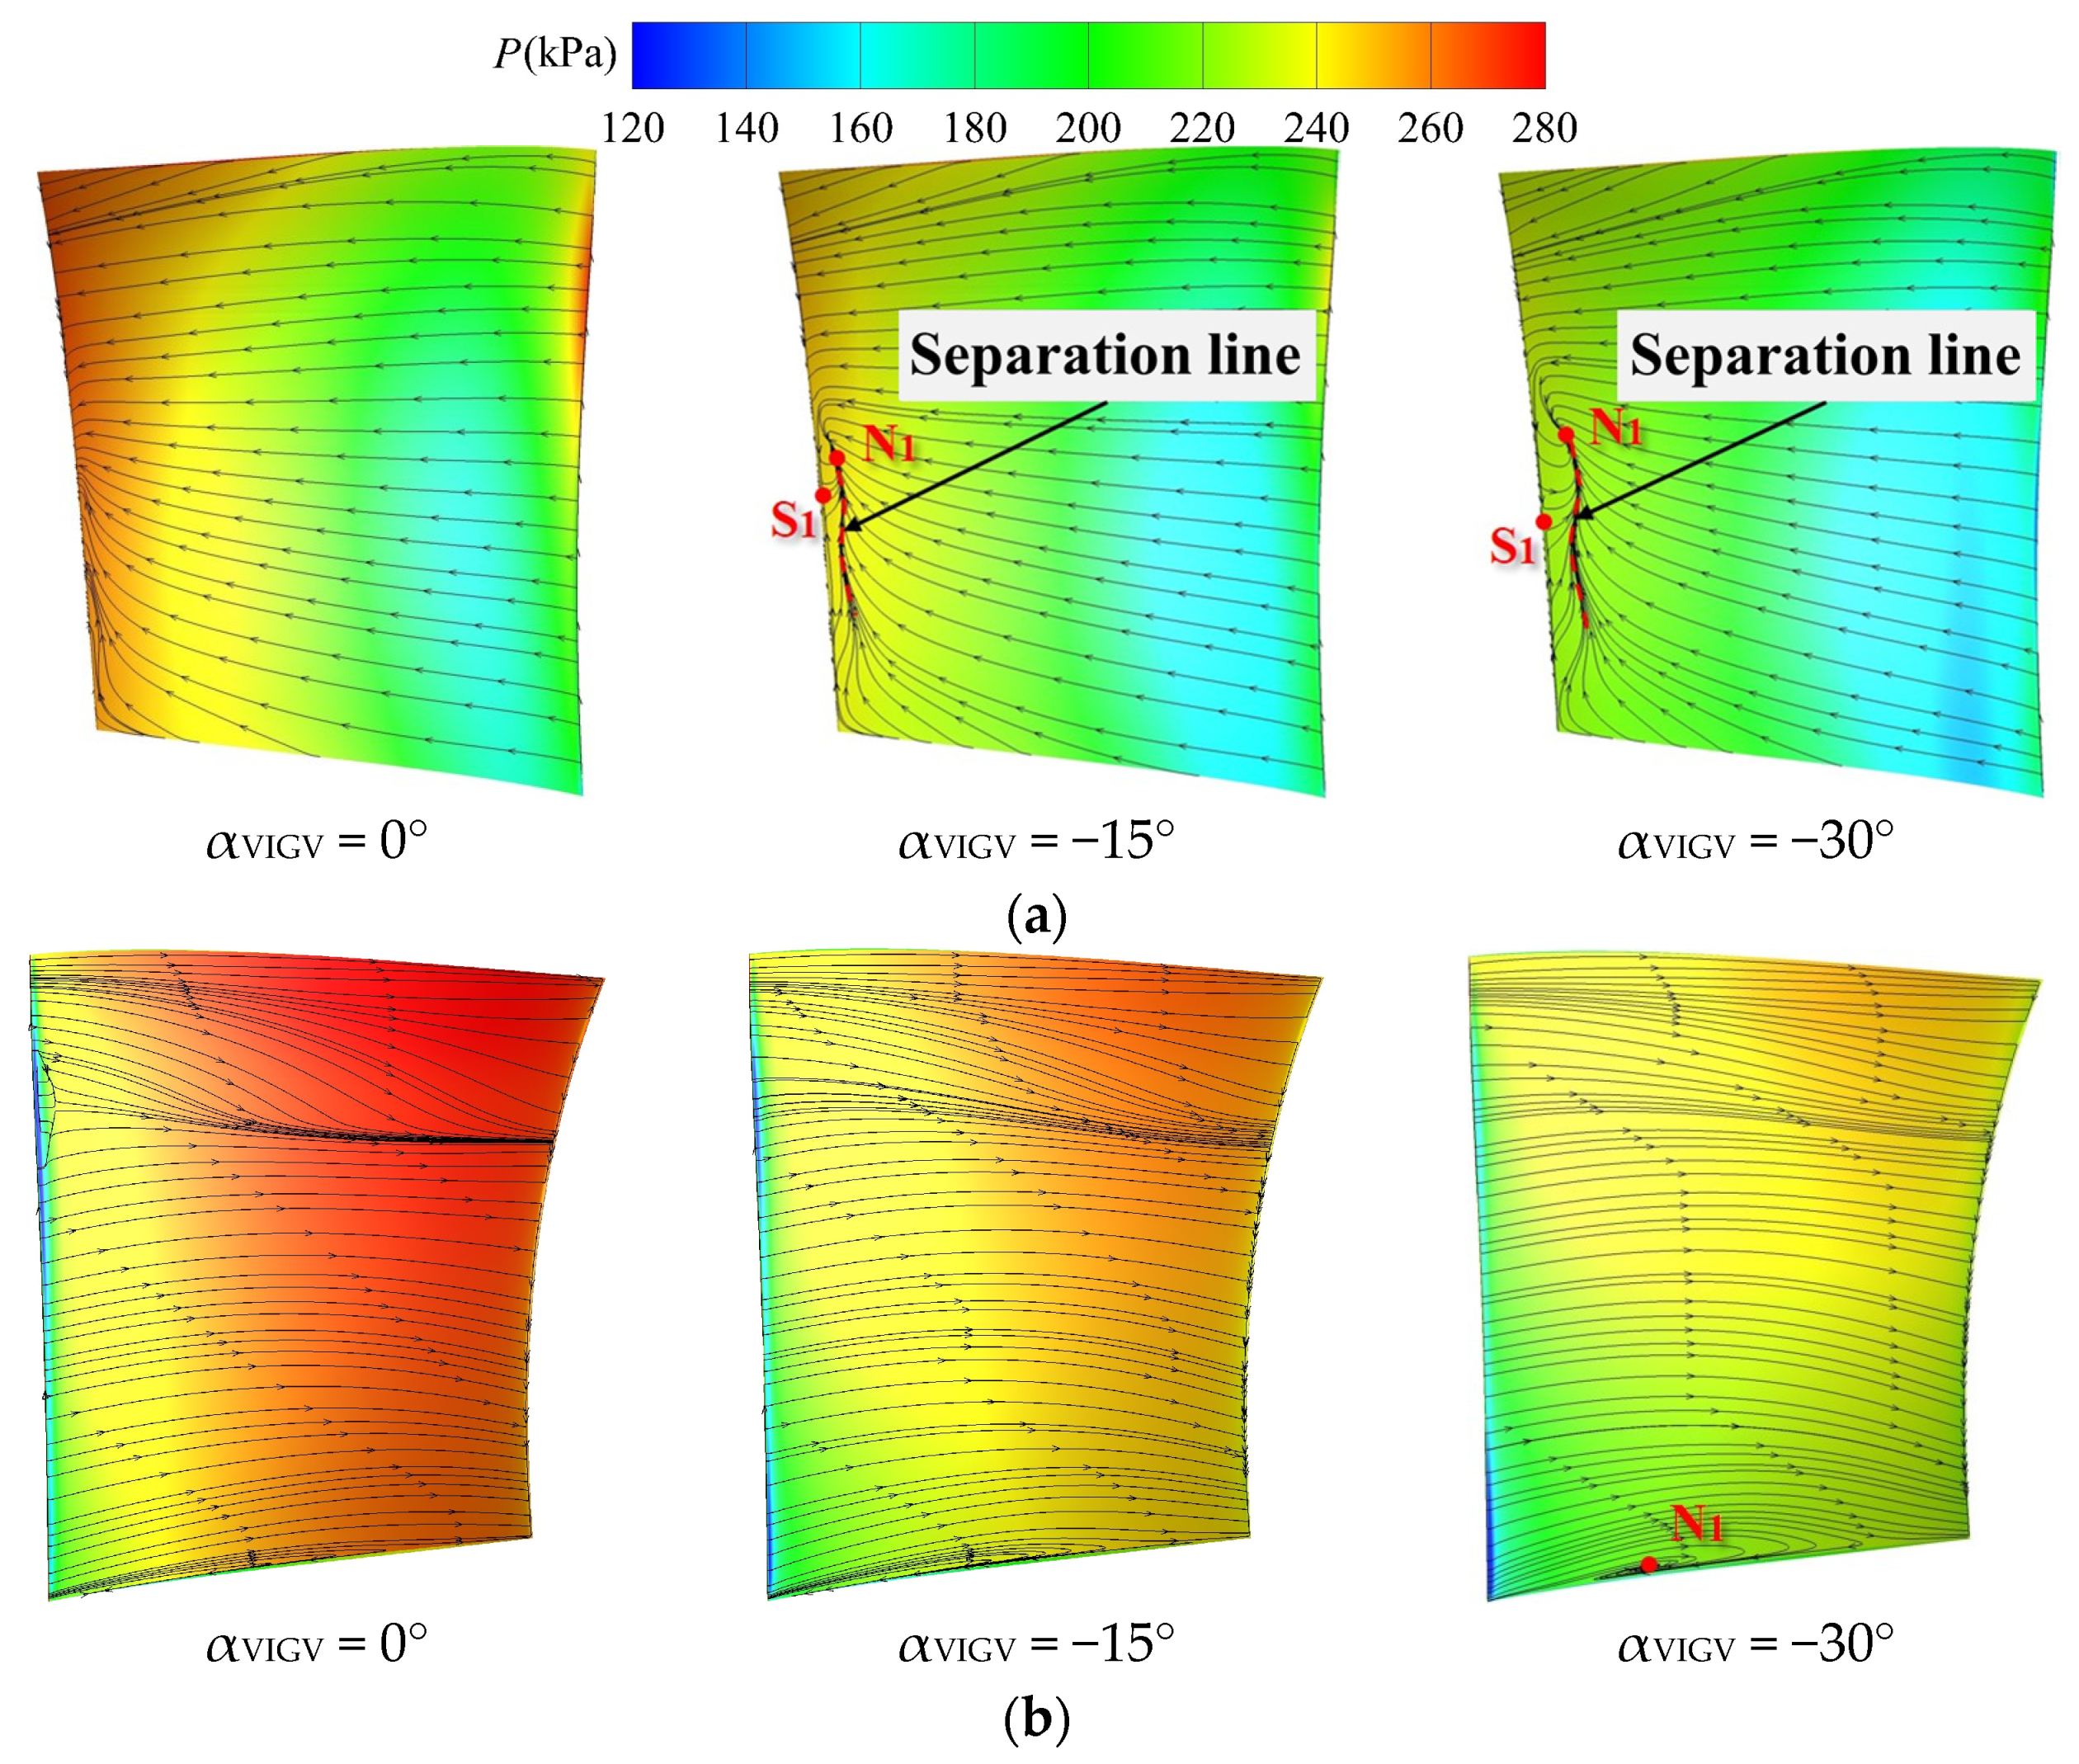
The variation law of the CDFS stator suction surface flow field depicted in Figure 15a revealed that in the absence of closure of the CDFS VIGV, the limit streamline distribution on the stator suction surface is relatively flat, exhibiting no conspicuous topological features. When αVIGV = −15°, a separation line emerges in the vicinity of the trailing edge arising from the confluence of the attached boundary layer fluid on the blade surface and recirculated flow around the trailing edge, thereby forming a saddle-node combination separation at around 50% of the blade height (S1-N1). Further shrinking of the CDFS VIGV opening impels the separation line to drift away from the trailing edge, increasing the distance between saddle point S1 and node N1, and expanding the separation range at the suction surface trailing edge. Regarding the CDFS stator pressure surface flow field variation pattern represented in Figure 15b, it can be inferred that a reduction in the CDFS VIGV opening causes a decline in the transverse adverse pressure gradient on the stator pressure side, concurrently setting off a flow separation phenomenon at the stator root. Further narrowing of the CDFS VIGV opening ushers the stator root into a high negative incidence angle, amplifying the extent of the flow separation zone at the root and resulting in the formation of a separation spiral node.
Figure 16 presents the radial distribution patterns of the aerodynamic performance for the first- and second-stage rotors and stators of the HPC across a range of CDFS VIGV openings. The results indicated that the closure of the CDFS VIGV leads to a substantial increase in the incidence angle of the HPC first-stage rotor in the region below 80% of the blade height, while the incidence angle above the 80% of the blade height region decreases slightly due to the influence of the splitter ring. The rotor pressure ratio distribution pattern illustrates that the pressure ratios across the entire blade height of the first-stage rotor increase with decreasing CDFS VIGV opening. Figure 16b reveals a continuous increase in the incidence angle of the first-stage stator with the closure of the CDFS VIGV, with the root region experiencing a significant increase compared to the tip region. Meanwhile, the total pressure recovery coefficient of the first stage stator remains mostly unchanged. Figure 16c,d demonstrates that the closure of the CDFS VIGV increases the incidence angle and pressure ratio of the HPC second-stage rotor across the entire blade height range, with a higher increase in magnitude compared to the first-stage rotor. With the closure of the CDFS VIGV, the incidence angle of the HPC second-stage stator steadily increases, indicating its gradual departure from the choke boundary. Concurrently, the total pressure recovery coefficient at the root of the HPC second-stage stator increases, while it slightly decreases at the tip.
The relative Mach number distribution patterns at the 95% and 5% of the blade height sections of the HPC under different CDFS VIGV openings are presented in Figure 17. In the unclosed CDFS VIGV state, the flow field structure at the tip of the HPC first-stage rotor features a leading edge detached positive shock wave and a passage positive shock wave. A reduction in the CDFS VIGV opening induces an expulsion of the passage shock wave at the rotor tip out of the passage. Based on the flow field variation at the root of the HPC, it can be inferred that in the unclosed CDFS VIGV state, the HPC second-stage stator operates at a significantly negative incidence angle. Consequently, substantial flow separation occurs on the pressure surface of the stator, which ensures an adequate margin within the compression system upon closure of the CDFS VIGV. The closure action leads to the disengagement of the second-stage stator root from the choke condition, thereby enhancing the efficiency of the HPC.
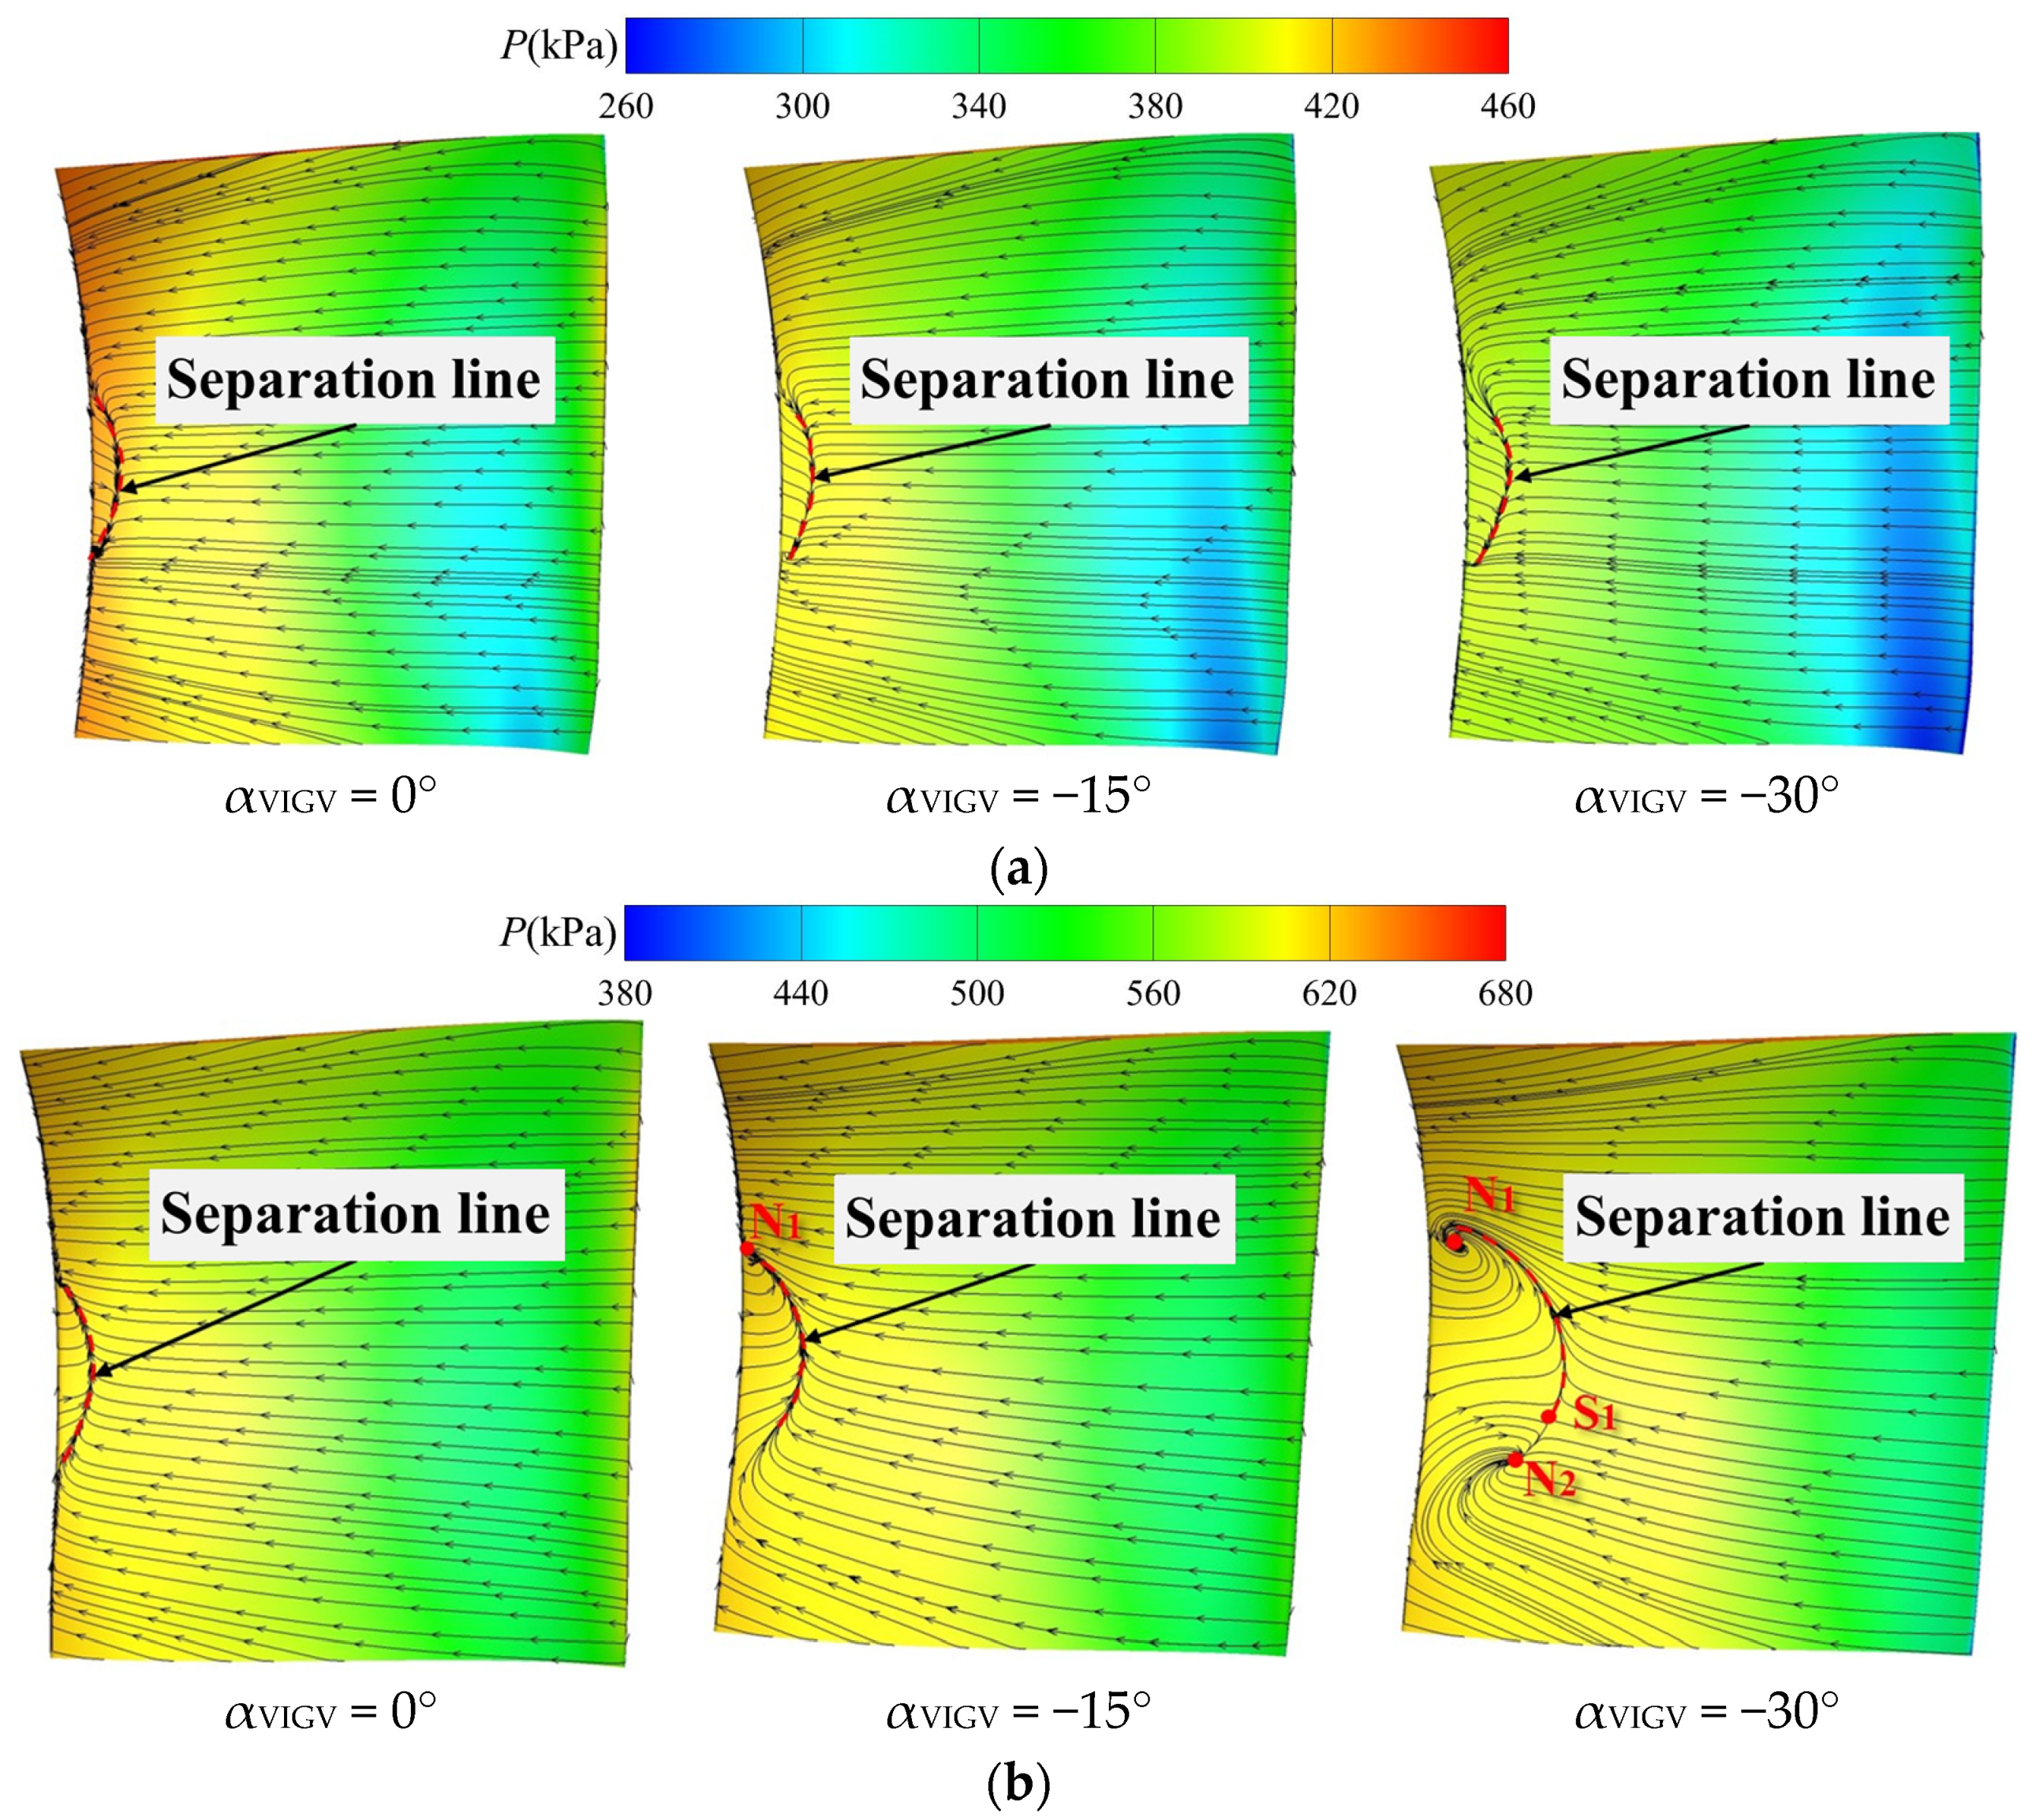
Figure 18 presents the distribution patterns of static pressure and limit streamlines on the suction surface of the first- and second-stage stators of the HPC under varying CDFS VIGV openings. The limit streamline distribution patterns on the suction surface of the first-stage stator are relatively similar for all three CDFS VIGV openings, exhibiting a separation line formed by the convergence of the attached boundary layer fluid and recirculation at the trailing edge. Diminishing the CDFS VIGV opening induces no significant variation in the range of this separation line and does not alter the flow topology of the suction side of the first-stage stator. As indicated in Figure 18b, the limit streamline distribution on the suction side of the second-stage stator is highly comparable to that of the first-stage stator in the unclosed CDFS VIGV state. Decreasing the VIGV opening to −15° results in a slight expansion of the range of the separation line. Further reducing the VIGV opening angle to −30° causes a significant change in the flow topology on the suction surface of the second-stage stator, characterized by a combined separation of the saddle point (S1) and double separation of the spiral nodes (N1, N2).

4.2. The Influence of the FVABI

As a critical regulating component of medium variable bypass ratio compression systems, the FVABI plays a vital role in controlling the mixing process of the streamflows of the first and second outer bypasses, thereby exerting significant influence over the aerodynamic performance of the compression system. To investigate the underlying mechanisms of FVABI regulation on the aerodynamic performance of the compression system under HB mode, this study employs αVIGV = −30° and AFVABI = 0.30 as the baseline state, whereby the FVABI opening is adjusted to alter the matching state between the compression system components. Table 4 presents the parameter settings for FVABI opening adjustment, with the AFVABI adjustment range ranging from 0.30 to 0.58 while maintaining other control parameters constant.
In order to analyze the effects of FVABI regulation on the compression system bypass ratio and component aerodynamic performance, this study defines the variation of the compression system performance under different FVABI openings, with AFVABI set to 0.30 as the baseline state:
Δ B = ( B A F V A B I   =   0.34 , 0.38 , 0.42 , 0.46 , 0.50 , 0.54 , 0.58 B A F V A B I   =   0.30 1 ) × 100 %
Δ m = ( m A F V A B I   =   0.34 , 0.38 , 0.42 , 0.46 , 0.50 , 0.54 , 0.58 m A F V A B I   =   0.30 1 ) × 100 %
Δ π = ( π A F V A B I   =   0.34 , 0.38 , 0.42 , 0.46 , 0.50 , 0.54 , 0.58 π A F V A B I   =   0.30 1 ) × 100 %
Δ η = ( η A F V A B I   =   0.34 , 0.38 , 0.42 , 0.46 , 0.50 , 0.54 , 0.58 η A F V A B I   =   0.30 1 ) × 100 %
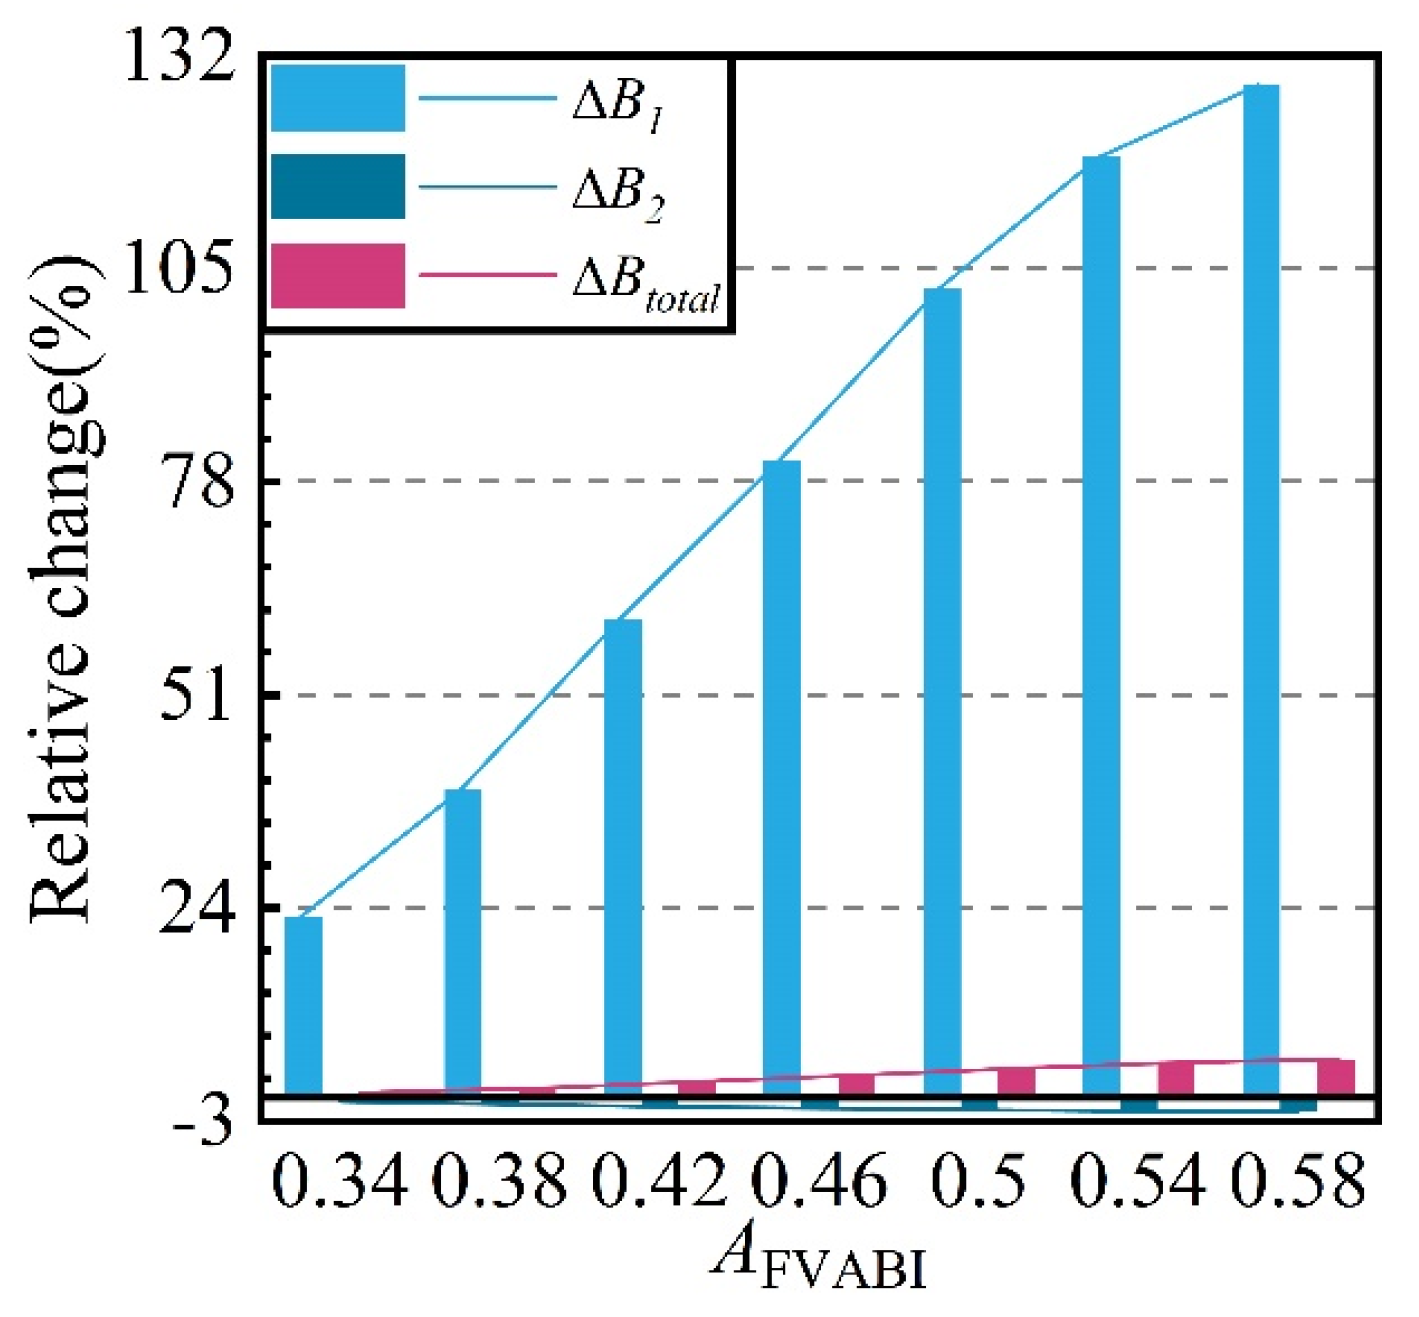
Figure 19 illustrates the variation of the compression system bypass ratio with respect to the FVABI opening. As the opening increases, the flow area of the first outer bypass outlet expands, thereby enhancing the flow capacity. Consequently, the compression system B1 exhibits a sharp increase, with a growth rate that initially rises before declining. When AFVABI = 0.58, the increase in the compression system’s first outer bypass ratio reaches 128.31%. Simultaneously, the compression system B2 gradually decreases during the FVABI opening process, and its variation range is relatively small. Btotal is influenced by both the first and second outer bypasses, gradually increasing with the increase in FVABI opening. However, due to the significant difference in flow rates between the first and second outer passages, the total passage ratio increases much less than the first outer passage ratio. When AFVABI = 0.58, the increase in Btotal reaches 4.90%.
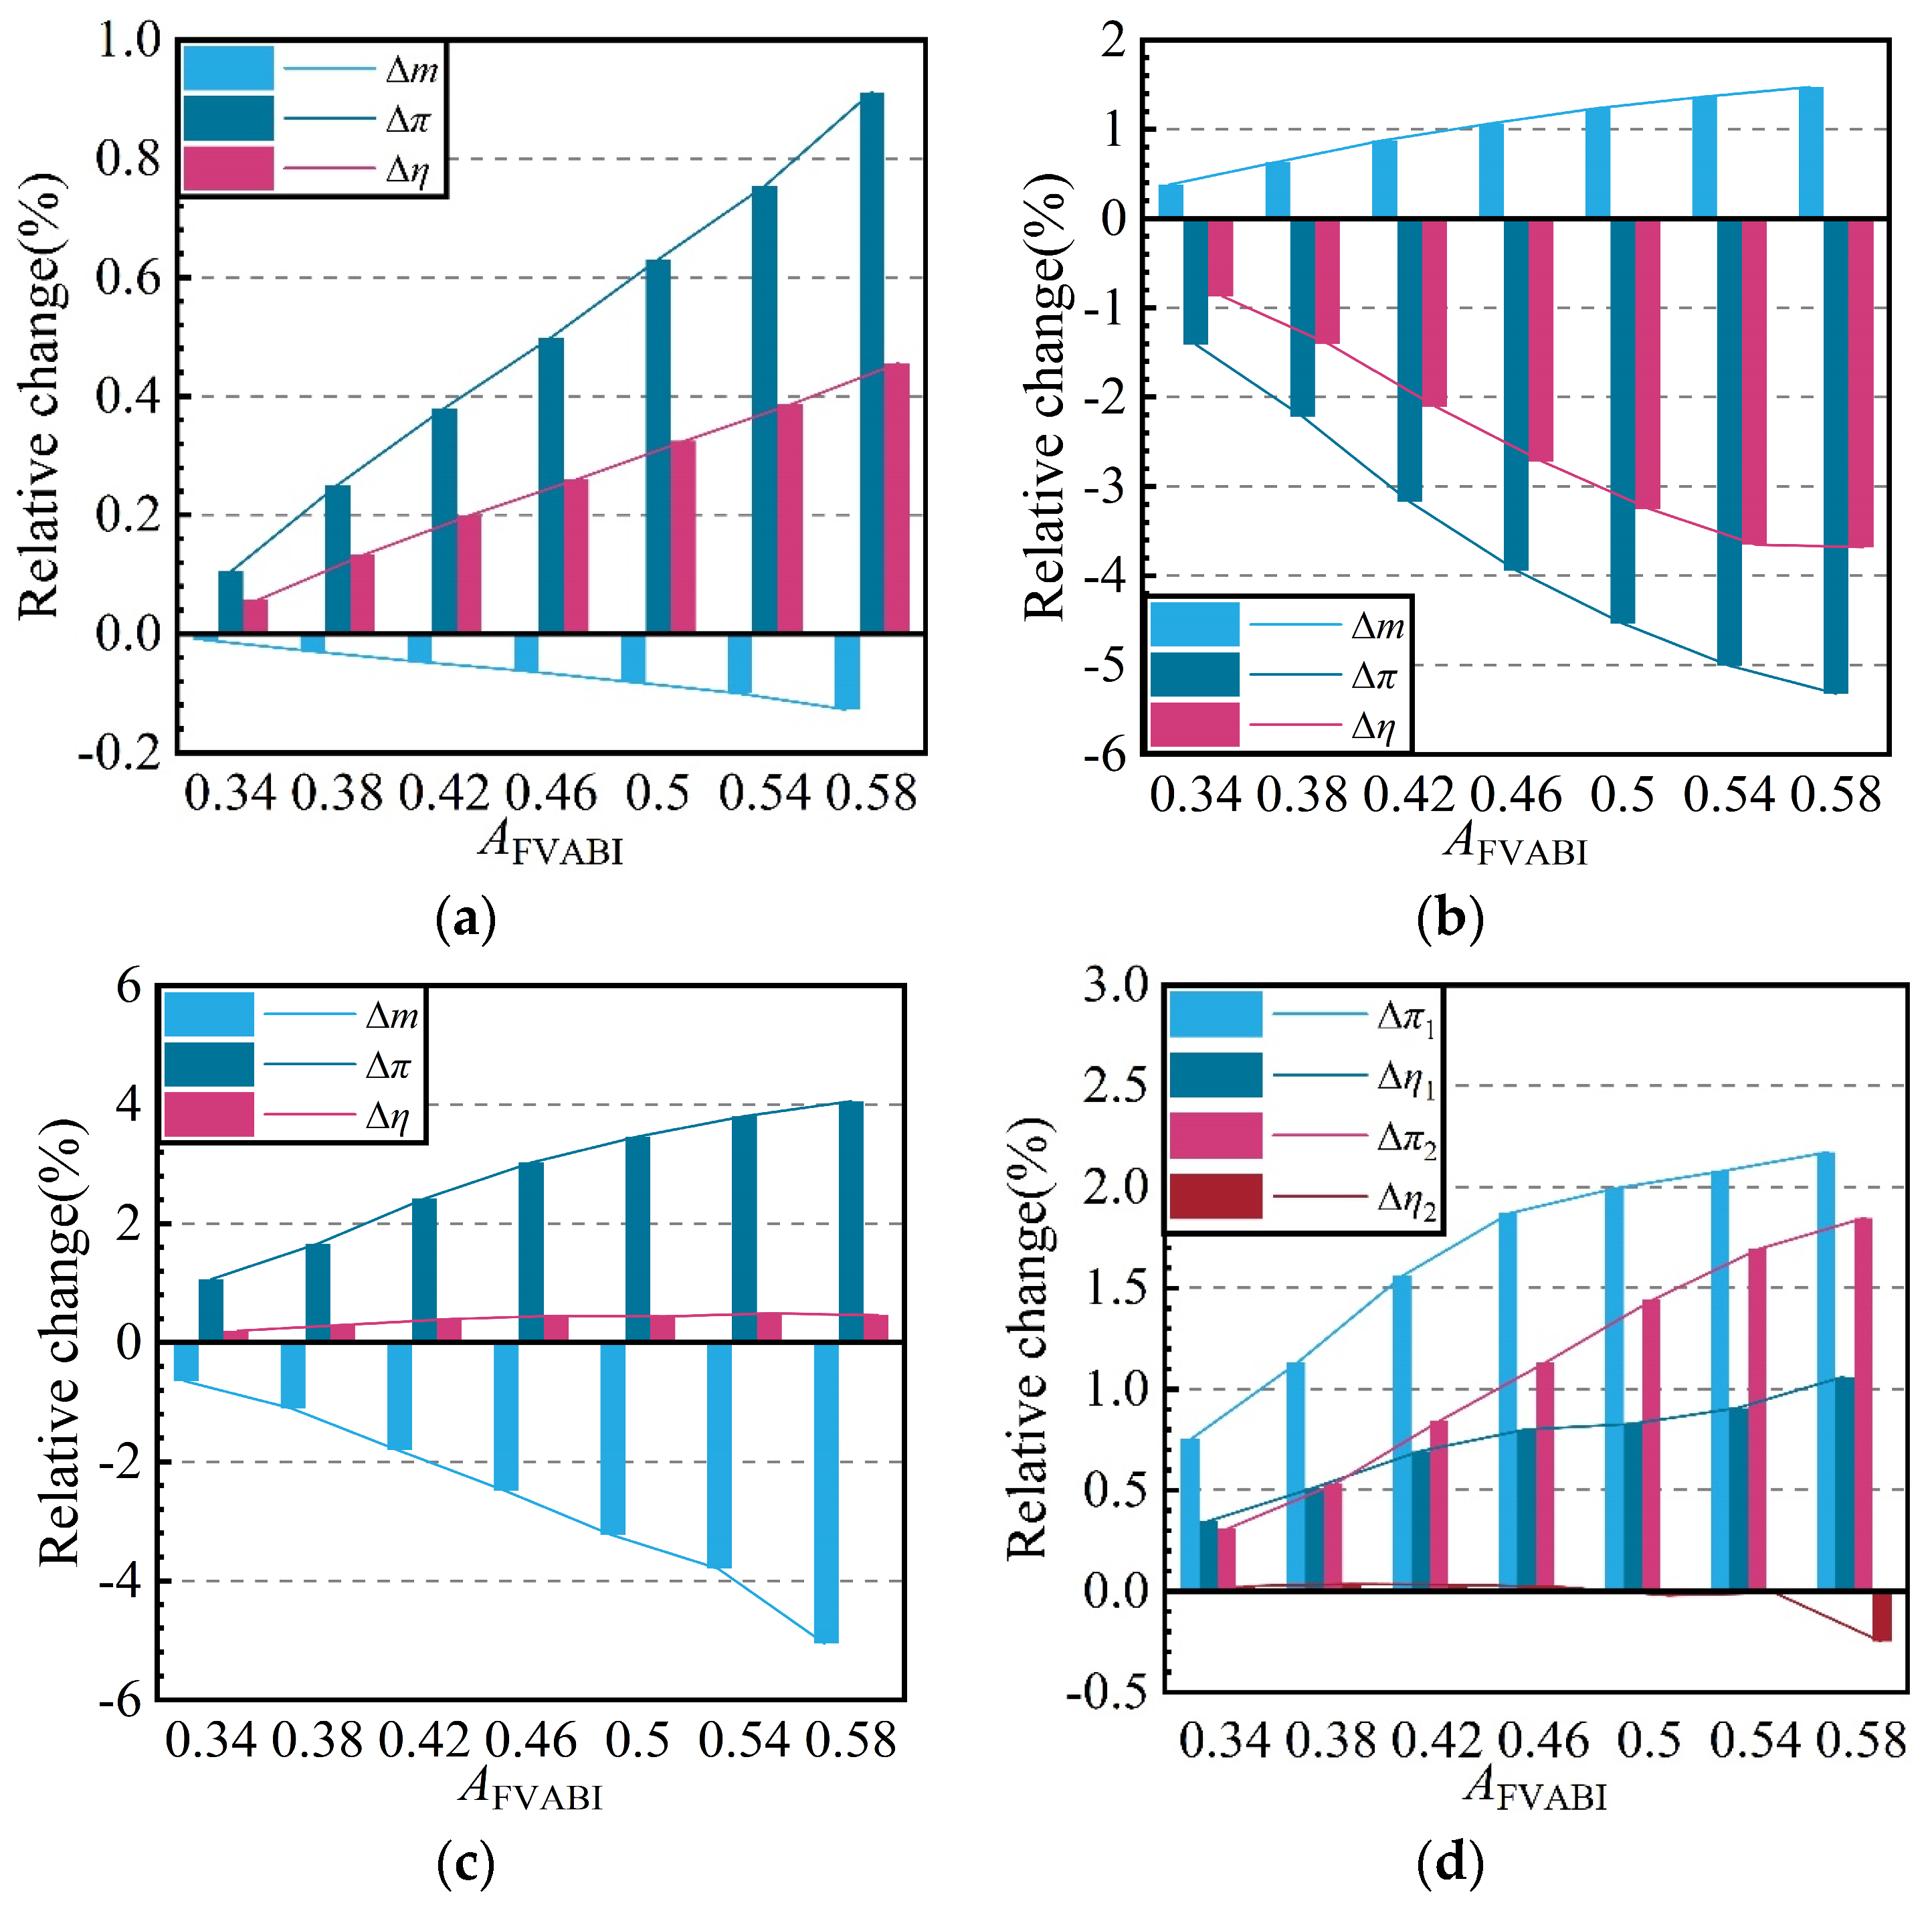
Although Btotal undergoes only minor changes during the FVABI regulation process, the operational state of each component changes and the matching relationship between the components is altered. Figure 20 presents the variation in the aerodynamic performance of each component in the compression system during the FVABI opening regulation process. As the FVABI opening increases, the flow rate of the fan decreases, while its efficiency and pressure ratio both increase, with the maximum variation range of all three parameters not exceeding 1%. It can be concluded that the influence of FVABI regulation on the fan’s performance is relatively weak. In contrast, the aerodynamic performance of the CDFS exhibits an opposite trend to that of the fan. Increasing the FVABI opening enhances the flow capacity of the CDFS but also leads to a decrease in its efficiency and pressure ratio.
The variation in the overall aerodynamic performance of the HPC with respect to the FVABI opening is shown in Figure 20c. As the FVABI opening increases, the flow rate of the HPC gradually decreases, while its efficiency and pressure ratio increase. The increment in pressure ratio is significantly higher than that in efficiency, and both of their growth rates slow down as the FVABI opening further increases. When AFVABI = 0.58, the increase in pressure ratio reaches 4.06%, while the increase in efficiency is only 0.46%. Figure 20d further presents the variation in the total pressure ratio and adiabatic efficiency of the first two stages of the HPC. The calculation results indicate that, during the gradual opening of the FVABI, both the pressure ratio of the first two stages of the HPC and efficiency of its first stage continuously increase, while the efficiency of its second stage exhibits a trend of first increasing and then decreasing.
In general, when the compression system is in HB mode, the impact of adjusting the FVABI opening on the aerodynamic performance of the fan is relatively small. The variation in FVABI opening mainly affects the aerodynamic performance of the CDFS and HPC.
To reveal the influence mechanism of FVABI opening on the performance of each component, three typical operating conditions with AFVABI = 0.30, 0.42, and 0.58 were selected. In-depth analyses were conducted on the interstage flow matching of the fan, CDFS, and HPC, as well as the flow characteristics of each component.
The radial distribution patterns of the average aerodynamic parameters of the fan rotor under different FVABI openings are presented in Figure 21. With the increase in FVABI opening, the pressure ratio of the fan rotor continuously increases in the area above 40% of the blade height, while it remains basically unchanged in the remaining blade height range, and the efficiency is basically unaffected by the change in FVABI opening. Additionally, the incidence angle and total pressure recovery coefficient of the fan stator are not sensitive to the change in FVABI opening, which is similar to the effect mechanism of CDFS VIGV regulation on the aerodynamic characteristics of the fan.
Figure 22 shows the radial distribution patterns of the aerodynamic performance of the CDFS rotor and stator under different FVABI openings. With the increase in FVABI opening, the pressure ratio of the CDFS rotor decreases in the entire blade height range, and the pressure drop near the blade tip is larger. In addition, the incidence angle of the rotor increases slightly in the range of 40% to 80% of the blade height, while it decreases in the area below 40% of the blade height. As shown in the right half of Figure 22, during the process of increasing the FVABI opening, the total pressure recovery coefficient of the CDFS stator significantly decreases in the root region and increases in the range of 40% to 90% of the blade height. The incidence angle of the stator continuously increases in the entire blade height range, and the increase rate shows a distribution pattern of “high in the middle, low at both ends.”
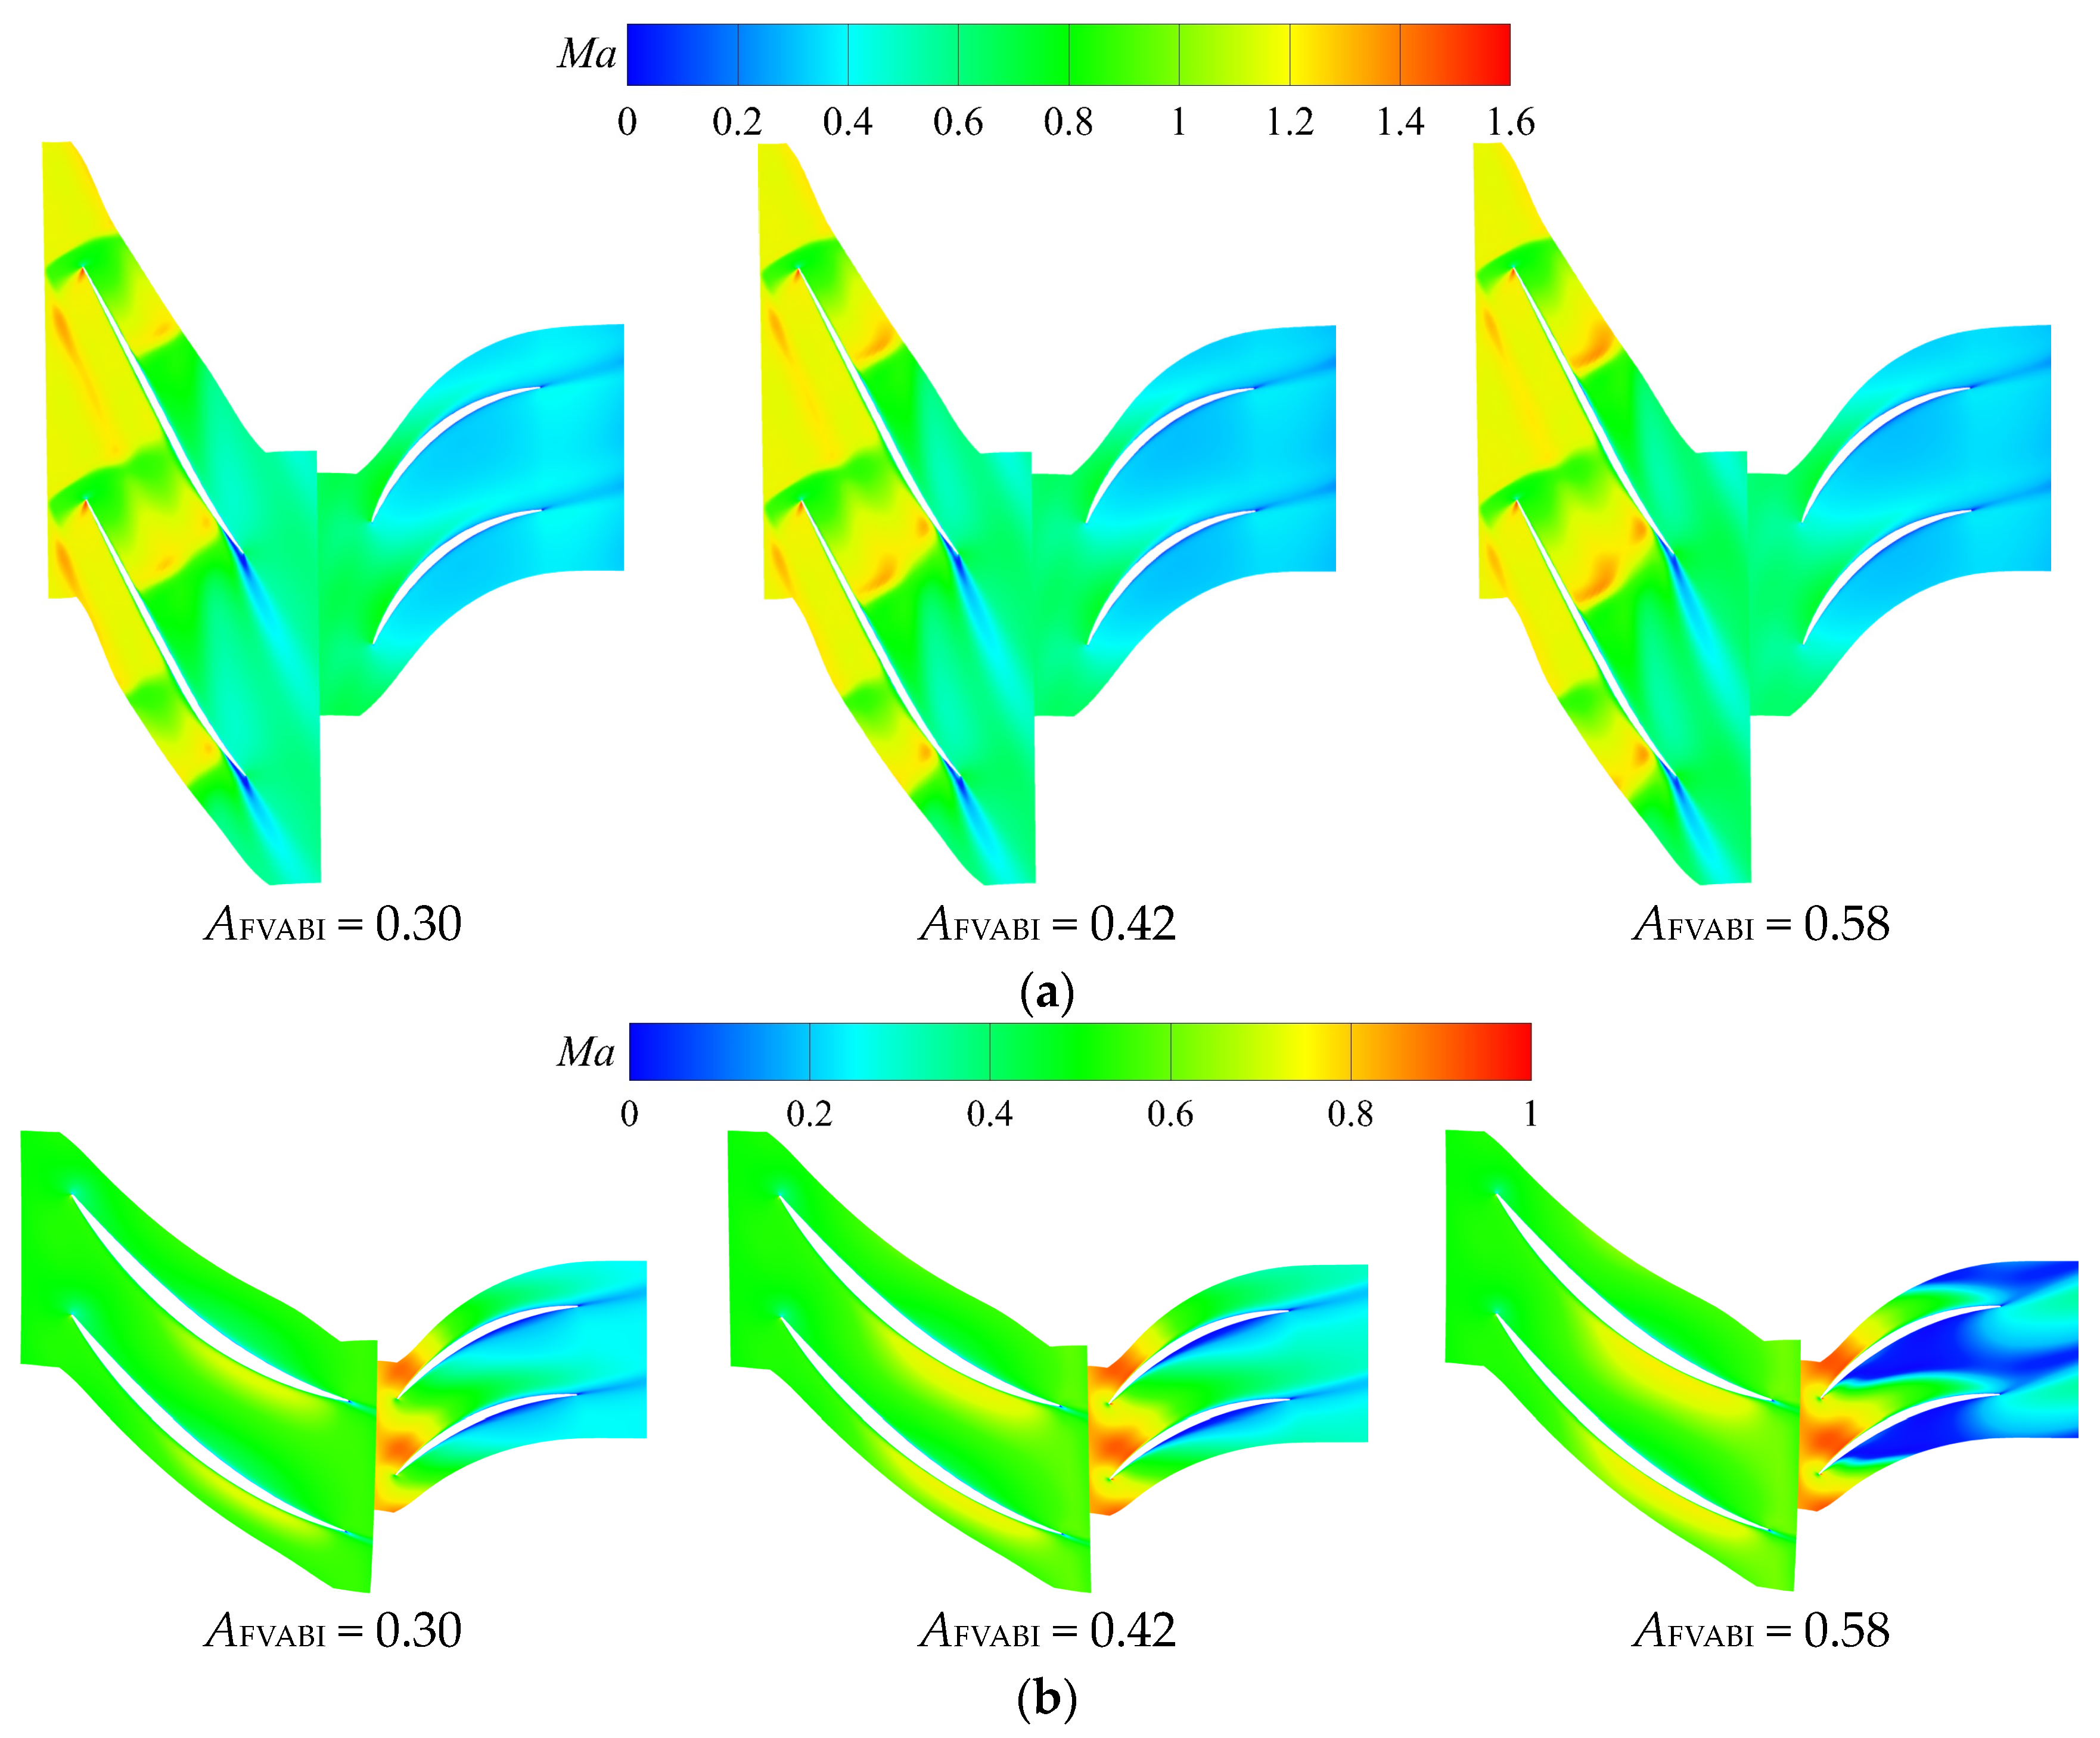
Figure 23a,b shows the distribution patterns of the relative Mach number of the CDFS at the 95% and 5% of the blade height sections under different FVABI openings. It can be seen that under different FVABI openings, the position and intensity of the first leading edge-detached shock wave remain unchanged, while the intensity of the second passage shock wave slightly increases with the increase in FVABI opening, and there is no significant change in the flow field structure at the CDFS tip. According to the change pattern of the flow field at the blade root, with the increase in FVABI opening, the flow separation on the pressure side of the CDFS stator root becomes more severe, and the corresponding total pressure loss at the stator root becomes larger.
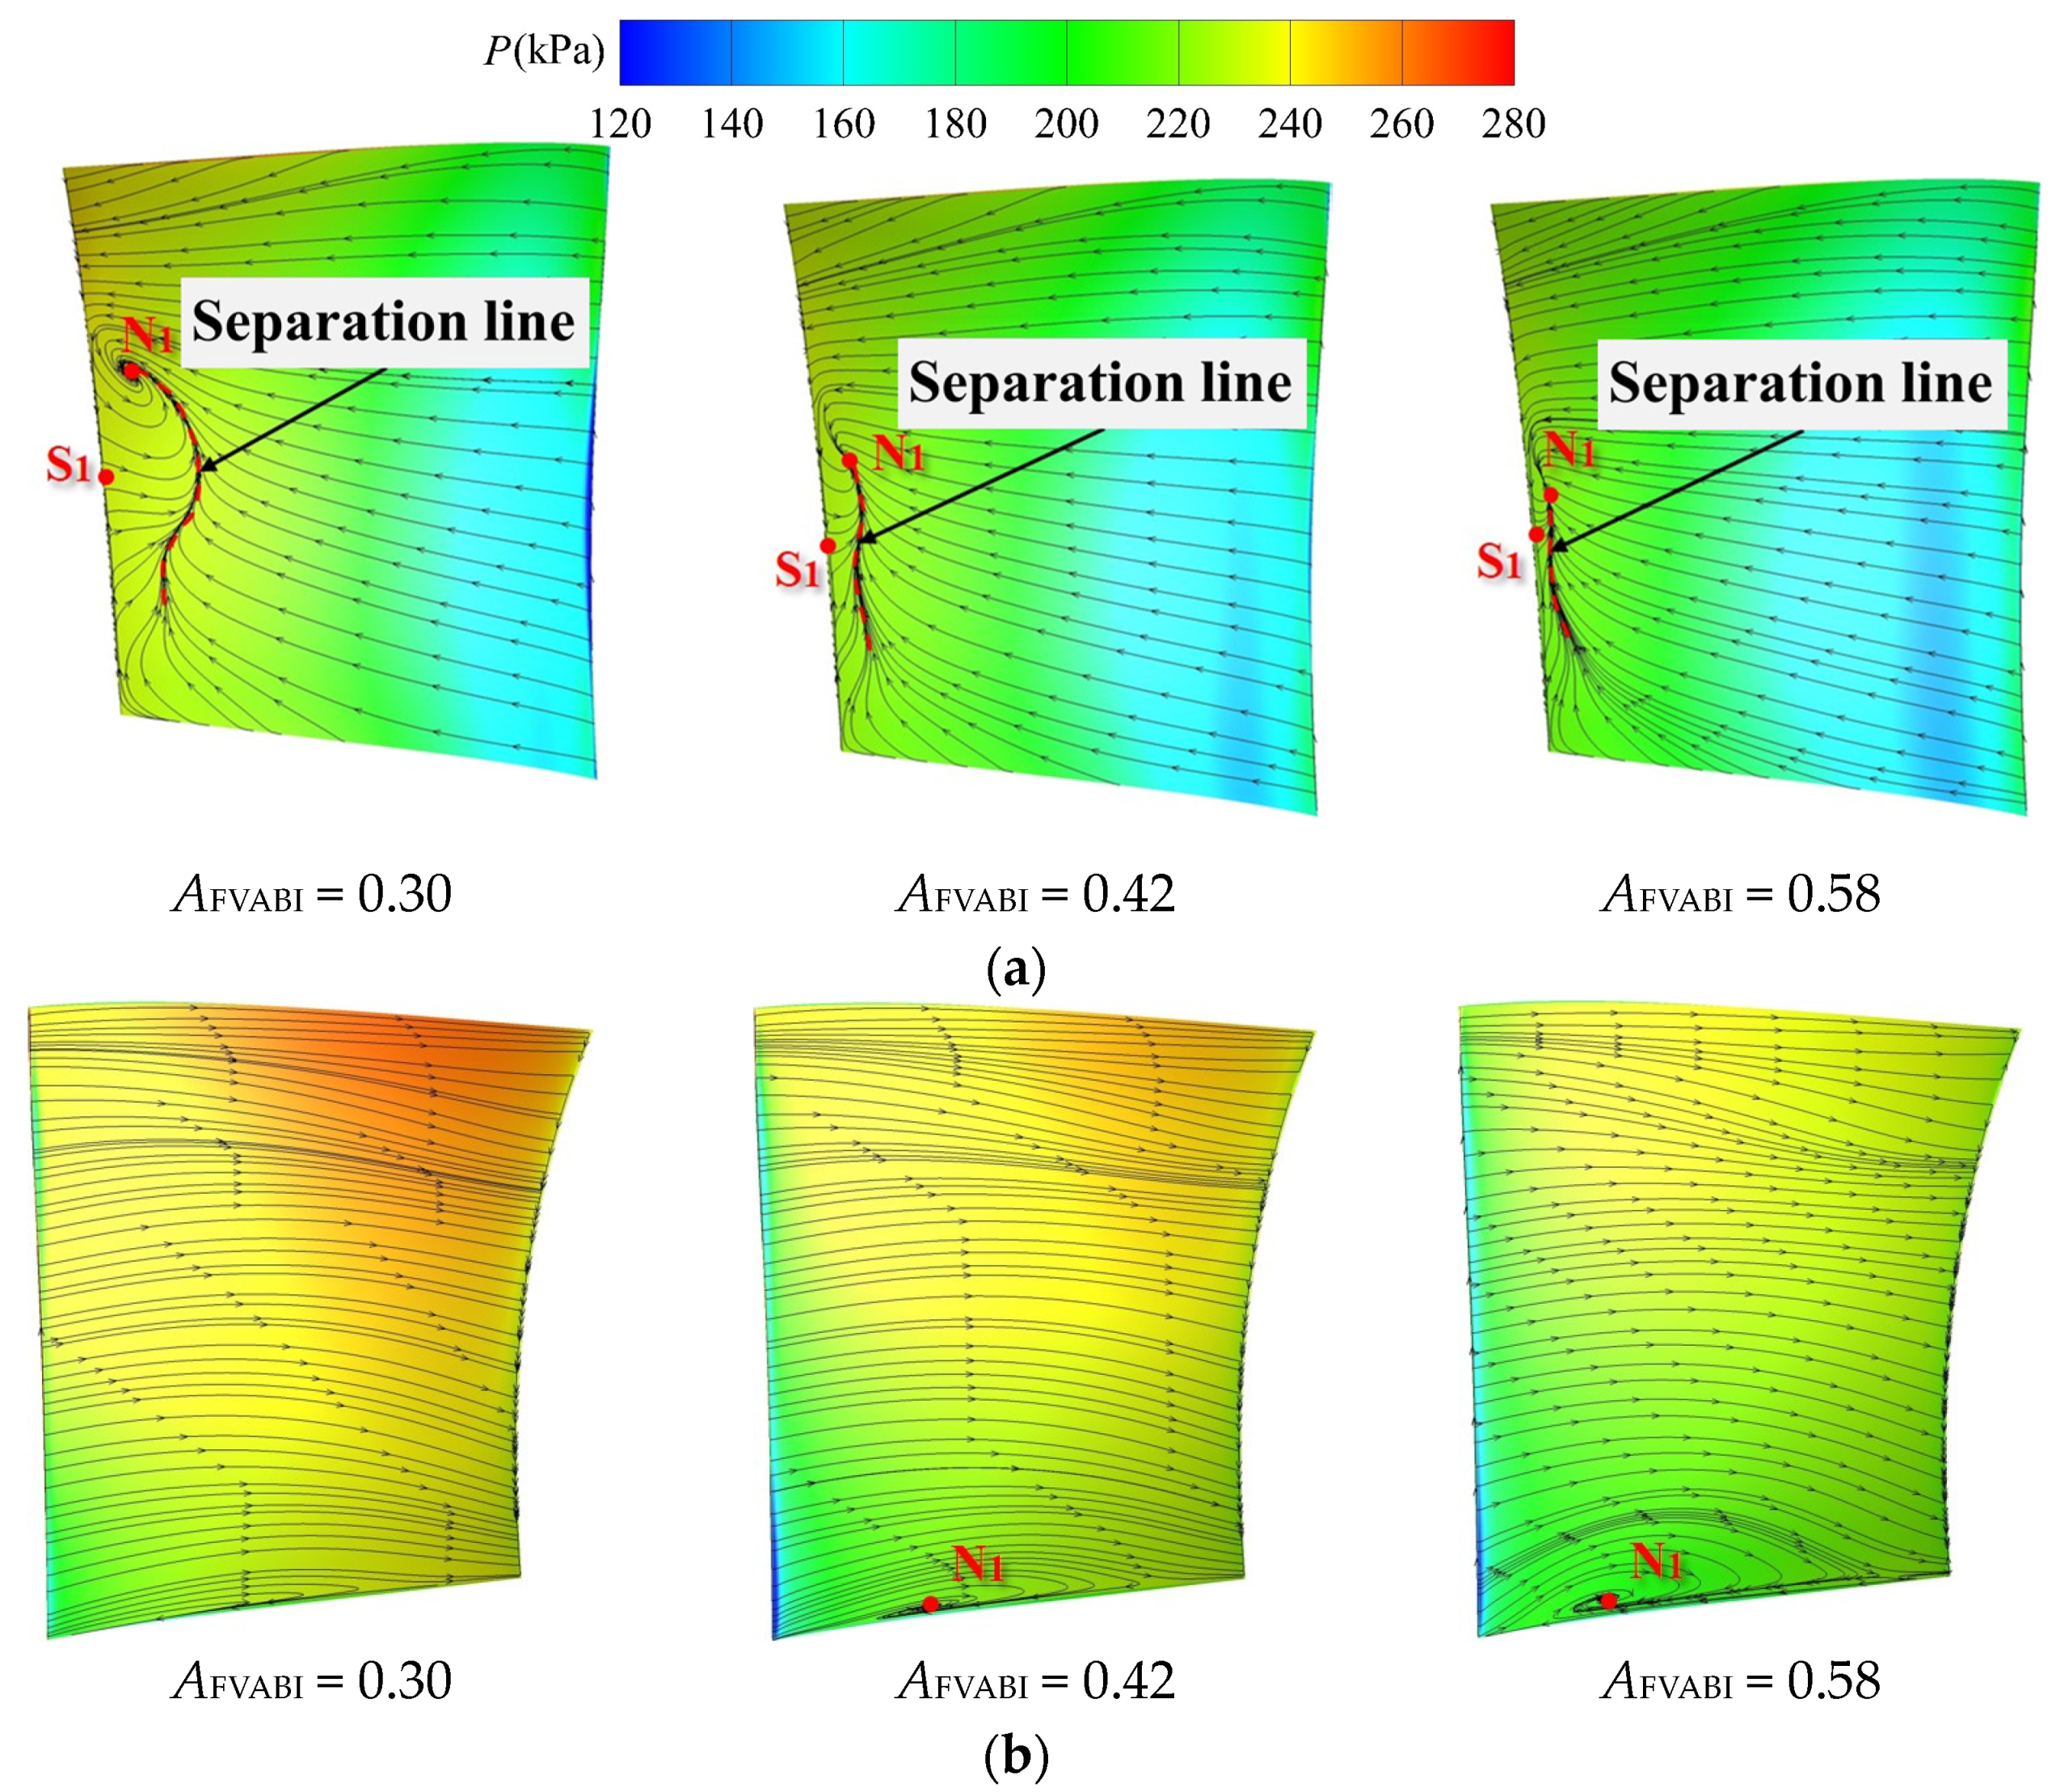
Figure 24 presents the distribution patterns of static pressure and limit streamlines on the suction and pressure surfaces of the CDFS stator under different FVABI openings. It can be observed that when the FVABI opening is small, the low-energy fluid on the hub of the CDFS stator is lifted upward by the radial force of the blade and interacts with the backflow from the trailing edge to form a concentrated separation vortex. With the increase in FVABI opening, the core of the concentrated shedding vortex disappears, and the scale of the separation region on the suction surface of the CDFS stator is reduced. On the contrary, increasing the FVABI opening widens the scale of the separation region at the root of the stator pressure surface, indicating that opening the FVABI will further exacerbate the blockage at the CDFS stator root.
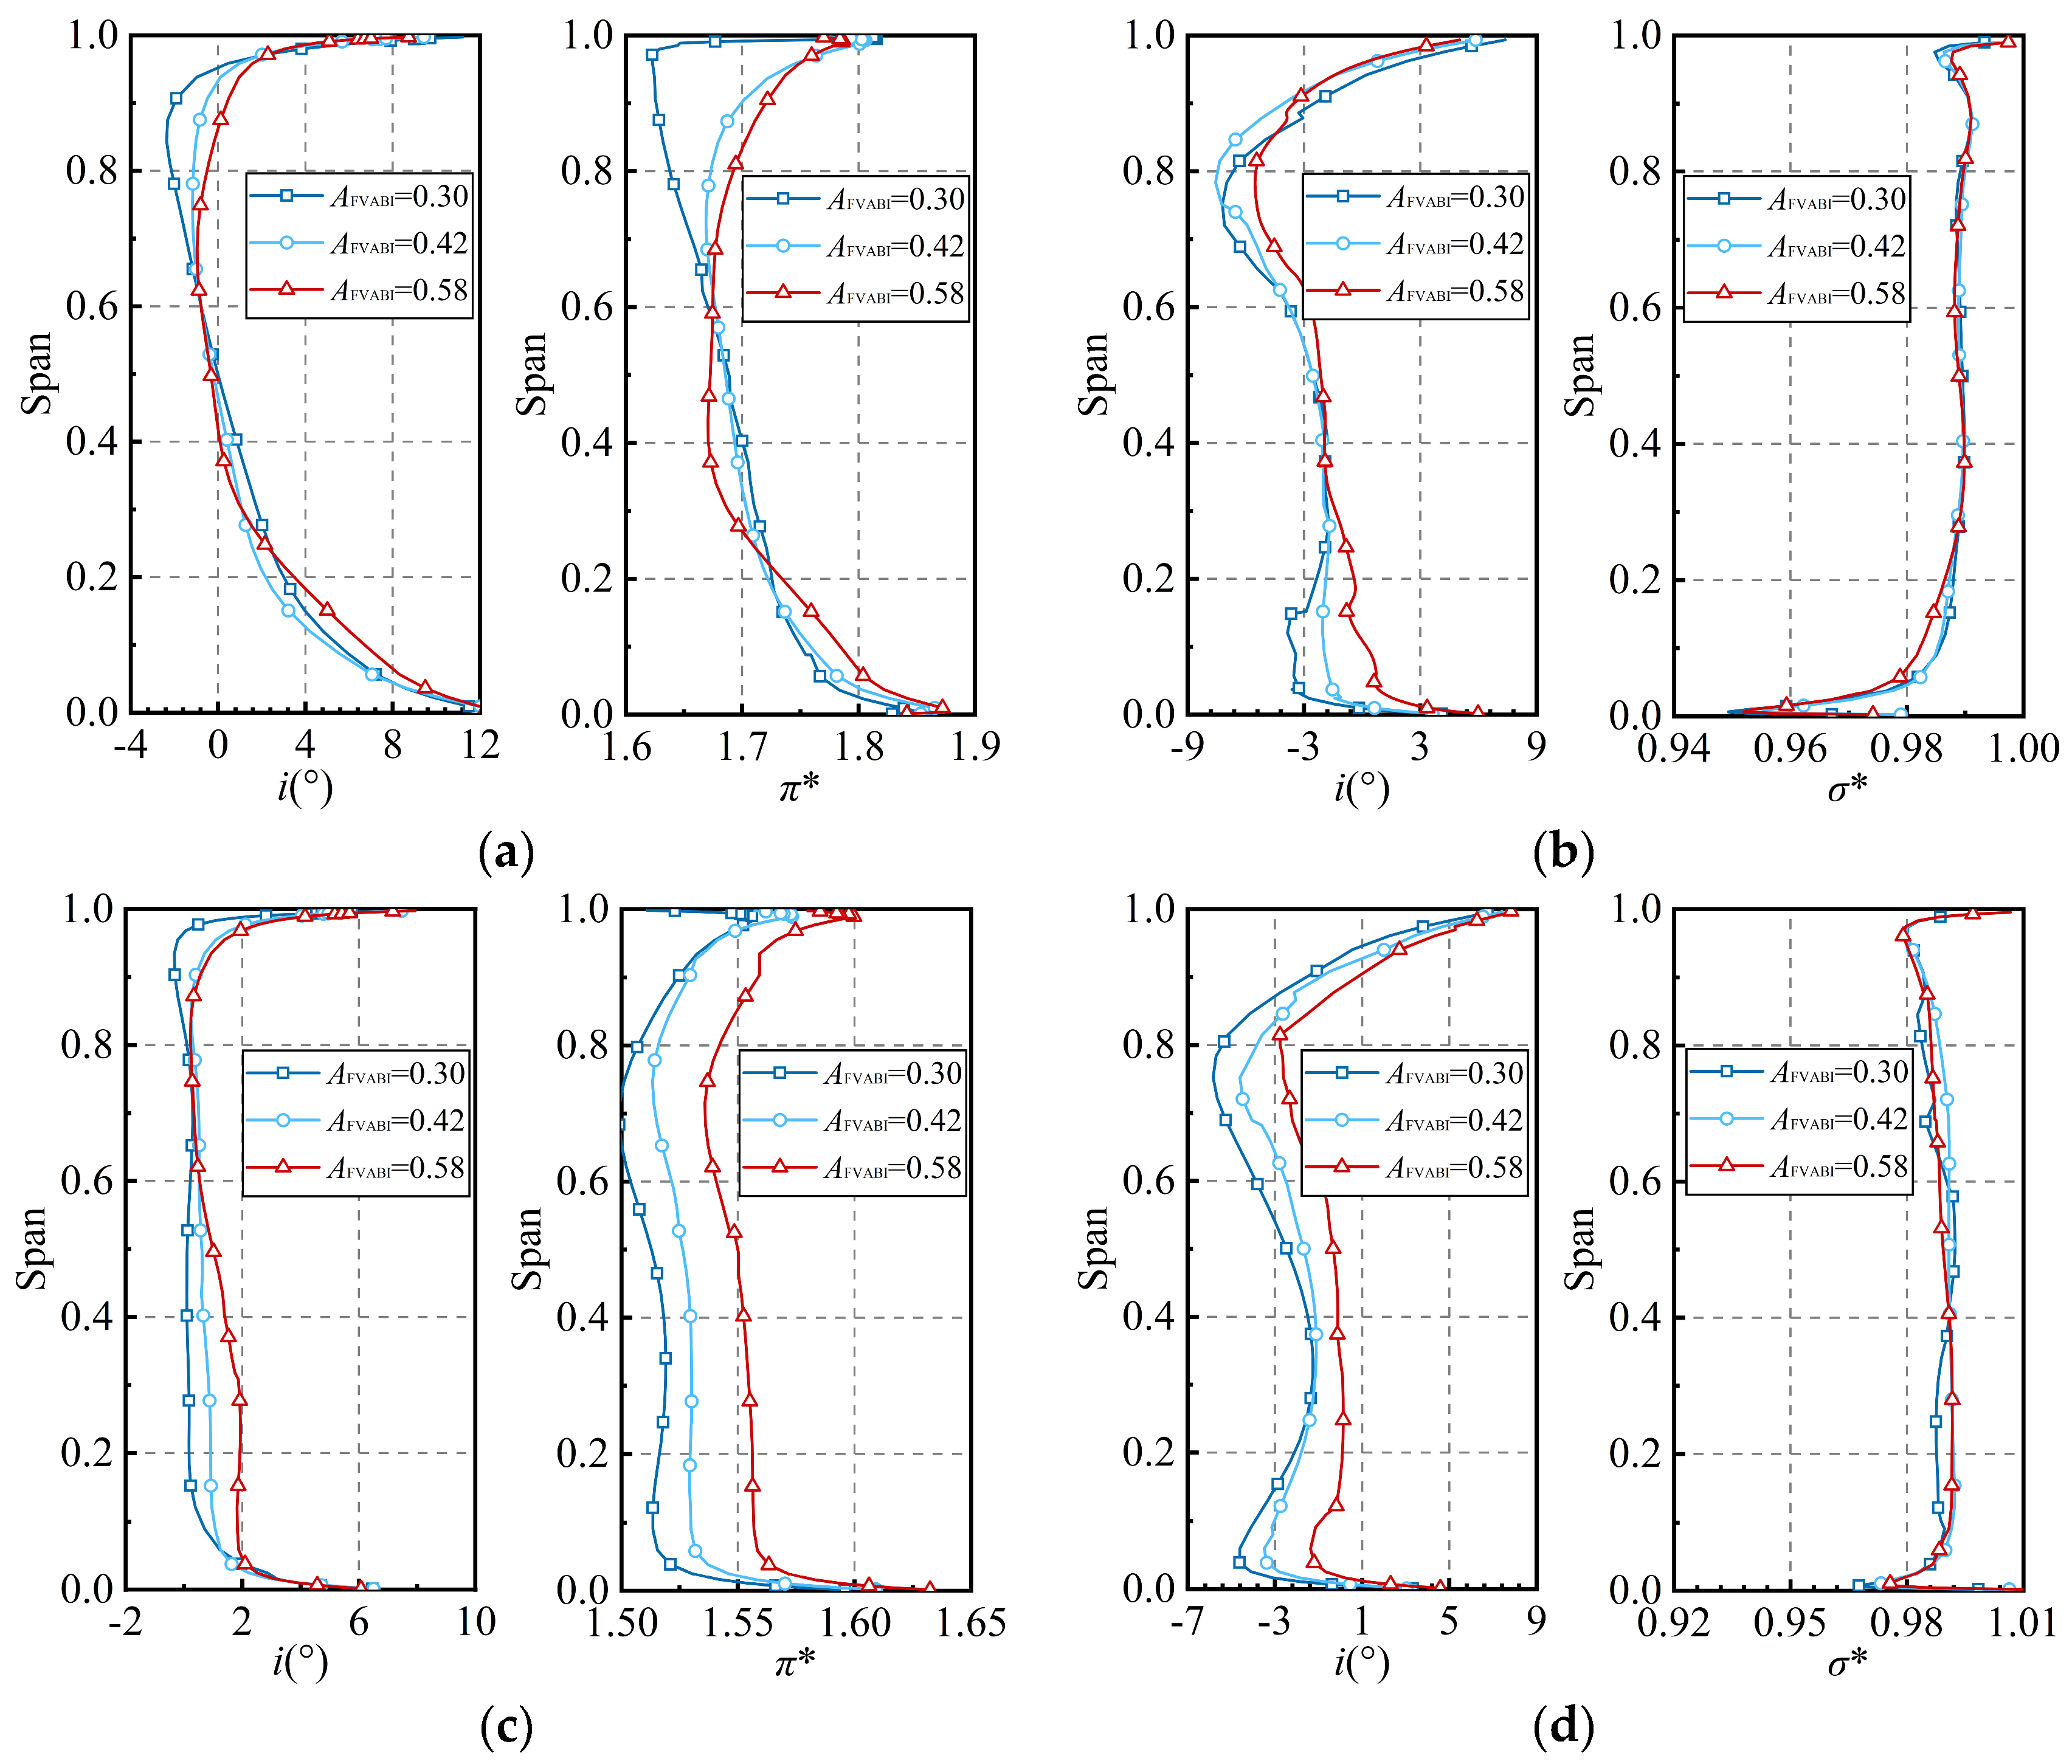
The radial distribution patterns of the aerodynamic performance of the HPC first and second stage under different FVABI openings are depicted in Figure 25. With the increase in FVABI opening, the incidence angle in the region above 60% of the blade height of the HPC first-stage rotor increases, while the incidence angle in the remaining blade height alternates. Correspondingly, the pressure ratio of the HPC first-stage rotor exhibits the same distribution pattern as the incidence angle. The variation in the aerodynamic performance of the HPC first-stage stator indicates that increasing the FVABI opening will increase the incidence angle at the root and decrease the total pressure recovery coefficient at the root. The radial distribution patterns of the aerodynamic performance of the second stage of the HPC under different FVABI openings are shown in Figure 25c,d. With the increase in FVABI opening, the incidence angle decreases in the region below 60% of the blade height of the HPC second-stage rotor, while the pressure ratio increases over the entire blade height. The performance variation in the HPC second-stage stator reveals that increasing the FVABI opening will increase the incidence angle over the entire blade height, but its influence on the total pressure recovery coefficient is relatively weak.
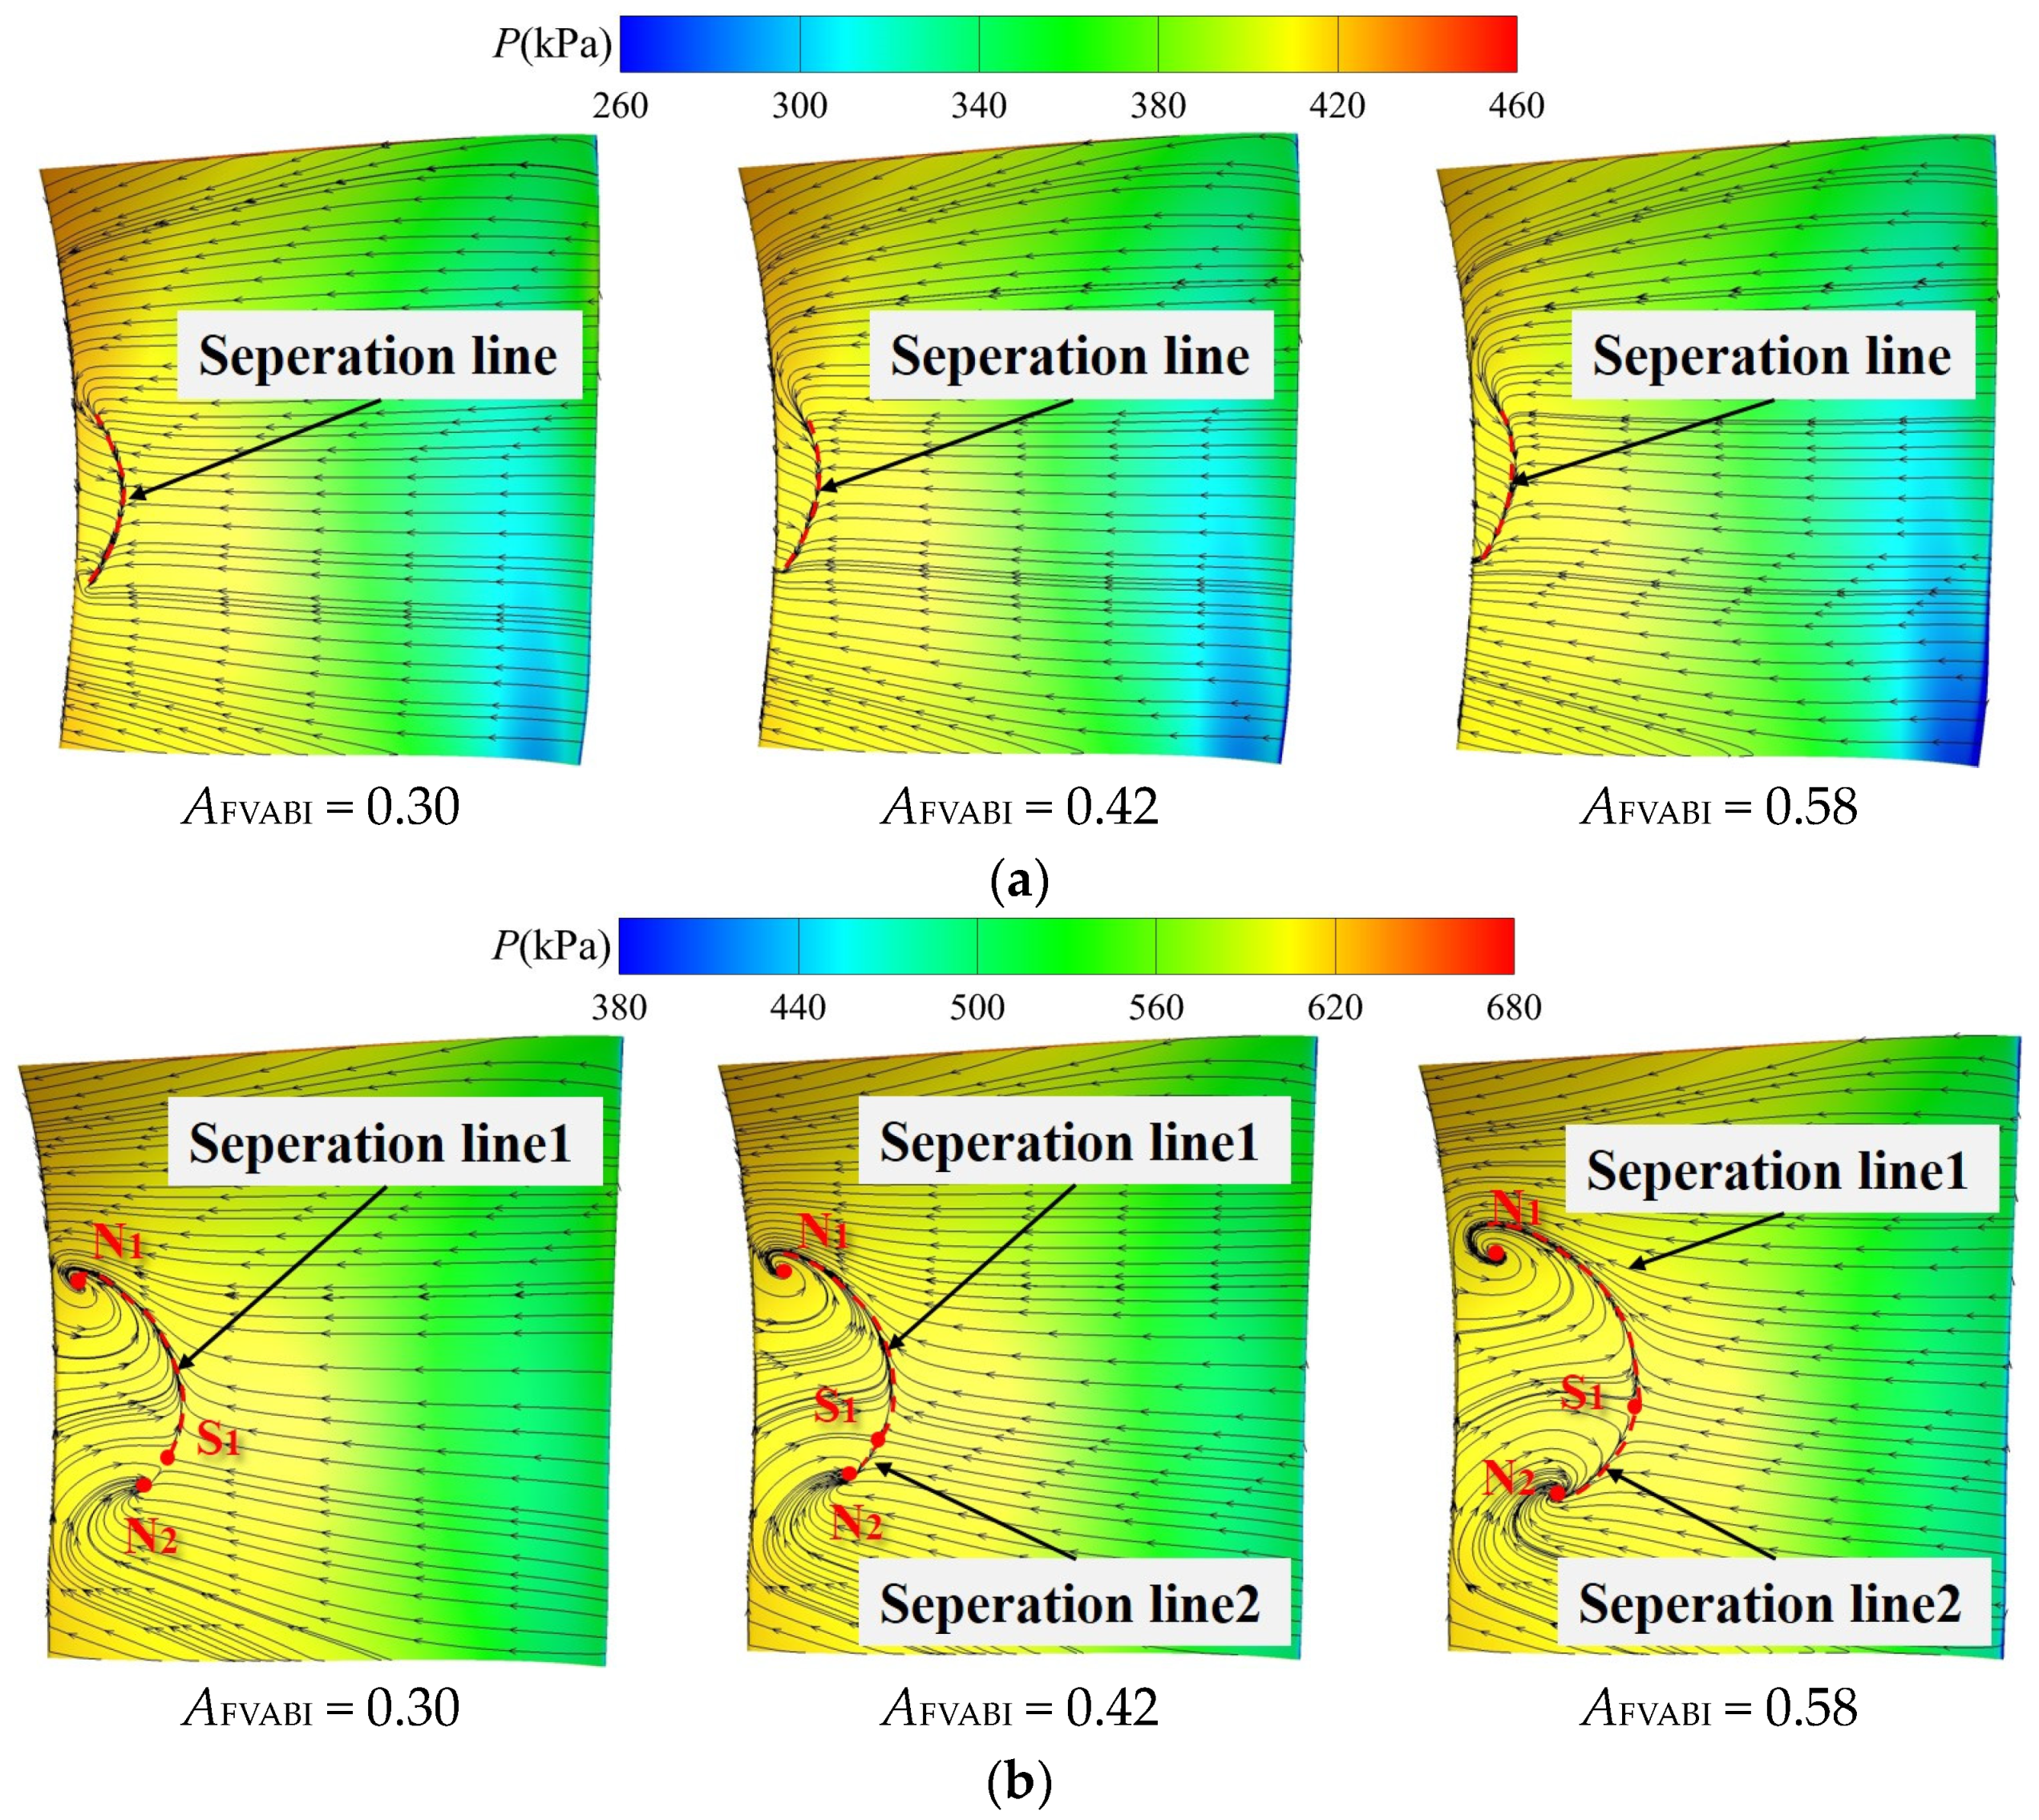
Figure 26 shows the distribution patterns of static pressure and limit streamlines on the suction side of the first- and second-stage stators under different FVABI openings. It can be observed that under different FVABI openings, the shape and length of the separation lines on the suction side of the first-stage stator remain unchanged, and the influence of FVABI opening on the flow field structure of the first-stage stator is not significant. According to the variation law of the flow field structure on the suction surface of the second-stage stator, when the FVABI opening is low, the suction surface of the second-stage stator presents a combined separation pattern of double separation spiral nodes (N1, N2) and a saddle point (S1), and only one obvious separation line (Separation Line 1) exists on the suction side. With the increase in FVABI opening, the distance between the separation spiral nodes N1 and N2 increases, and a second separation line (Separation Line 2) appears between separation spiral node N2 and saddle point S1, indicating that the scale of the separation area on the suction side is continuously increasing.
4.3. Summary of Adjustment Rules for Variable-Geometry Components

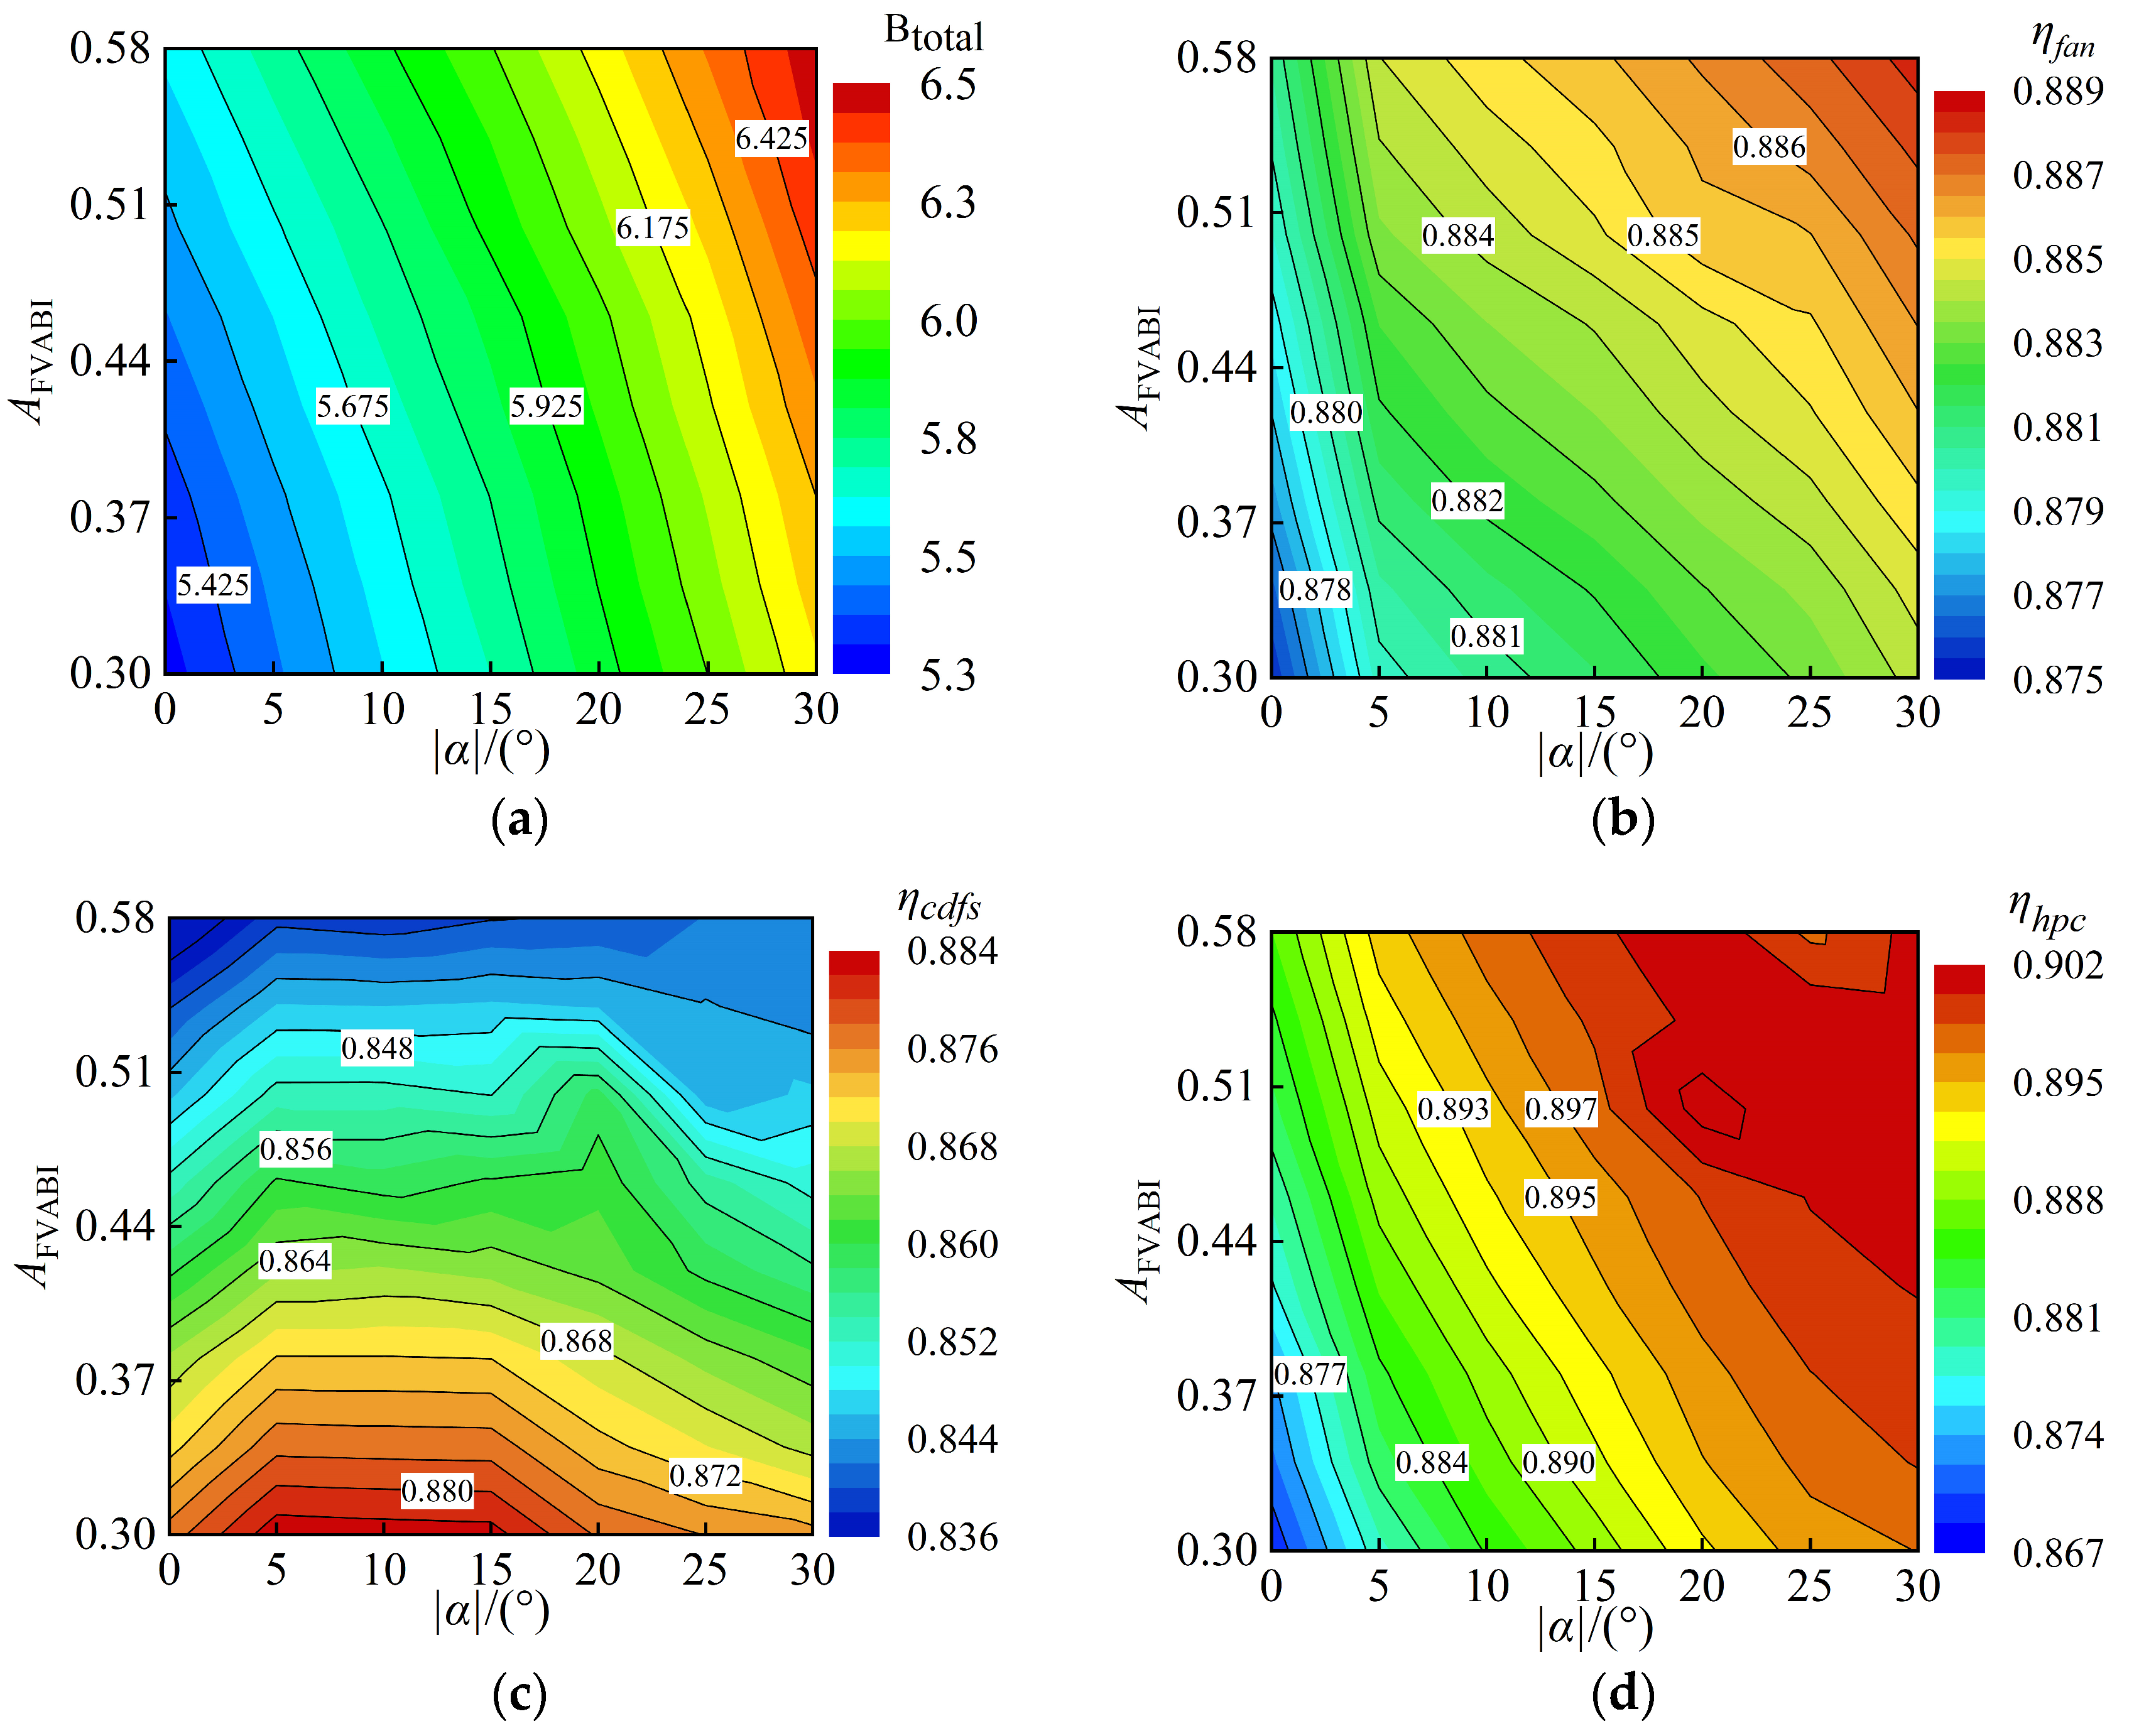
In order to further summarize the coupling mechanism of CDFS VIGV regulation and FVABI regulation on the compression system, a joint control scheme of the two adjustable components is presented in Figure 27. The adjustment range of the CDFS VIGV opening is from 0° to −30°, and the adjustment range of the FVABI opening is from 0.30 to 0.58.
Figure 28 presents the variation spectra of the compression system bypass ratios and component performance under different variable-geometry control schemes. It can be seen that closing the CDFS VIGV and opening the FVABI can both increase the overall bypass ratio, and the increase caused by closing the CDFS VIGV is significantly higher than that caused by FVABI regulation. Decreasing the opening of the CDFS VIGV and increasing the opening of the FVABI both provide some benefits to fan efficiency growth, but the gains brought about by both adjustments are relatively small.
When the FVABI opening is constant, reducing the CDFS VIGV opening will first increase and then decrease the efficiency of the CDFS, while the efficiency of the HPC will continuously increase as the CDFS VIGV opening decreases. Moreover, the smaller the FVABI opening, the greater the efficiency gain brought about by reducing the CDFS VIGV opening. When the CDFS VIGV opening is constant, increasing the FVABI opening will cause the efficiency of the CDFS to continuously decrease and the efficiency of the HPC to continuously increase. However, when the CDFS VIGV opening reaches −30°, an excessively large FVABI opening will instead lead to a reduction in the efficiency of the HPC.
Based on the variation patterns of each component’s performance in the compression system under the comprehensive variable-geometry adjustment, when the compression system transitions from the LB mode to the HB mode, the FVABI opening should be appropriately reduced to maintain CDFS efficiency at a higher level. However, the FVABI opening should not be too small, otherwise the efficiency of the HPC will excessively decrease. Within the range of operating conditions studied in this paper, reducing the FVABI opening from 0.42 to 0.34 during the mode transition process of the compression system can keep each component’s performance at a higher level.

5. Conclusions

This study is based on a comprehensive three-dimensional model of a medium bypass ratio compression system, providing an in-depth analysis of the impact of variable-geometry adjustment on the internal flow and component matching characteristics of the system. The study concludes with a summary of component adjustment techniques applicable to medium bypass ratio compression systems. The primary results are as follows:
The medium bypass ratio compression system achieves mode transitions by adjusting the CDFS VIGV and FVABI, which not only comprises conventional compression components and main flow channels but also intricate variable-geometry ducts and regulating mechanisms. The interdependent working characteristics of these components necessitate a comprehensive consideration of changes in the compression system’s overall aerodynamic performance based on an integrated model when analyzing variable-geometry adjustment patterns.
The performance of the fan is not sensitive to adjustments in CDFS VIGV or FVABI openings. Closing the CDFS VIGV results in a significantly reduced twist speed of the CDFS rotor, which subsequently leads to a significant decrease in the pressure ratio of the CDFS. However, the impact on the efficiency of the CDFS is relatively negligible. In contrast, closing the CDFS VIGV results in an elevated pressure ratio as well as increased efficiency of the HPC.
In the HB mode, the augmentation of FVABI opening moves the matching point of the CDFS towards the choke boundary, deepening the stator blockage of the CDFS and thereby reducing its pressure ratio and efficiency. Concurrently, the matching point of the HPC shifts towards the peak efficiency point, resulting in an increase in both pressure ratio and efficiency.
During the mode transition process, it is recommended to appropriately decrease the FVABI opening to maintain a higher level of performance matching between the compression system components. Within the scope of the operating conditions investigated in this study, reducing the FVABI opening from 0.42 to 0.34 when transitioning from LB mode to HB mode can sustain the performance of each compression system component at an elevated level.
Based on the research work presented in this paper, there are several areas that require further investigation. Firstly, the research methodology employed in this study can be extended to analyze the matching characteristics of compression systems with other aerodynamic layouts, thereby improving the universality of compression system analysis methods. Secondly, this study primarily focuses on the compression system of the engine without considering the constraints of other components. Future studies could incorporate an overall matching analysis of the entire engine system. Lastly, experimental validation of the variable cycle compression system can be conducted to obtain detailed measurements of the flow fields within the compression system.

Author Contributions

Conceptualization, Q.L.; methodology, S.Z. (Shiji Zhou) and H.X.; software, H.X. and X.S.; validation, Q.L.; formal analysis, Q.L. and S.Z. (Shiji Zhou); investigation, Q.L. and H.X.; resources, S.Z. (Shengfeng Zhao); data curation, Q.L.; writing—original draft preparation, Q.L. and S.Z. (Shiji Zhou); writing—review and editing, S.Z. (Shengfeng Zhao), H.X., and X.S.; visualization, Q.L. and X.S.; supervision, S.Z. (Shengfeng Zhao); project administration, S.Z. (Shengfeng Zhao); funding acquisition, S.Z. (Shengfeng Zhao). All authors have read and agreed to the published version of the manuscript.

Funding

This research was funded by the National Science and Technology Major Project (No. J2019-II-0004-0024).

Data Availability Statement

Not applicable.

Conflicts of Interest

The authors declare that they have no known competing financial interests or personal relationships that could have appeared to influence the work reported in this paper.

References

  1. Gies, M.; Schilling, K. A survey of unmanned aerial vehicle (UAV) usage for traffic monitoring. Transp. Res. Part C Emerg. Technol. 2019, 104, 136–151. [Google Scholar]
  2. Smith, J.; Johnson, L.; Williams, K. Design and optimization of a high-altitude long endurance UAV propeller. J. Aerosp. Eng. 2021, 28, 04021015. [Google Scholar]
  3. Vdoviak, J.; Ebacher, J. VCE Test Bed Engine for Supersonic Cruise Research; NASA CP-2108; NASA: Washington, DC, USA, 1979.
  4. French, M.; Allen, C. NASA VCE test bed engine aerodynamic performance characteristics and test results. In Proceedings of the 17th Joint Propulsion Conference, Colorado Springs, CO, USA, 27–29 July 1981; American Institute of Aeronautics and Astronautics: Reston, VA, USA, 1981. [Google Scholar]
  5. Vdoviak, J.; Knott, P.; Ebacker, J. Aerodynamic/Acoustic Performance of YJ101/Double Bypass VCE with Coannular Plug Nozzle; NASA CR-159869; NASA: Washington, DC, USA, 1981.
  6. Sullivan, J.; Parker, E. Design Study and Performance Analysis of a High-speed Multistage Variable Geometry Fan for a Variable Cycle Engine; NASA CR-159545; NASA: Washington, DC, USA, 1979.
  7. General Electric. GE Successfully Concludes Phase 1 Testing on Second XA100 Adaptive Cycle Engine 2021. Available online: https://www.ge.com/news/pressreleases/ge-successfully-concludes-phase-1-testing-onsecond-xa100-adaptive-cycle-engine (accessed on 15 December 2021).
  8. Berton, J.; Haller, W.; Senick, P.; Jones, S.; Seidel, J. A Comparative Propulsion System Analysis for the Highspeed Civil Transport; NASA/TM-2005-213414; NASA: Washington, DC, USA, 2005.
  9. Giffin, R.; Johnson, J. Gas Turbine Engine with Outer Fans. EP2333238A2, 26 May 2011. [Google Scholar]
  10. Simmons, R. Design and Control of a Variable Geometry Turbofan with and Independently Modulated Third Stream; The Ohio State University: Columbus, OH, USA, 2009. [Google Scholar]
  11. Giffin, G.; Johnson, J. FLADE Gas Turbine Engine with Counter-Rotatable Fans. US7246484B2, 24 July 2007. [Google Scholar]
  12. Wang, R.; Yu, X.; Liang, C.; Meng, D.; An, G.; Liu, B. Performance evaluation method for integrated variable cycle engine compression system considering complex duct effects. J. Aerosp. Power 2022, 37, 2090–2103. [Google Scholar]
  13. Conrad, D.; Guy, K. Individual Bypass Injector Valves for a Double Bypass Variable Cycle Turbofan Engine. US4175384, 27 November 1979. [Google Scholar]
  14. Liu, B.; Wang, R.; Liang, C.; Yu, X.; Wang, J.; An, G. A CFD Model for Bypass Flow in Variable Cycle Engine Compression Systems and Criterion to Predict Flow Recirculation During Mode Transition. J. Propuls. Technol. 2021, 42, 1976–1984. [Google Scholar]
  15. Liu, B.; Wang, R.; Yu, X. On the mode transition of a double bypass variable cycle compression system. Aerosp. Sci. Technol. 2020, 98, 105743. [Google Scholar] [CrossRef]
  16. Hirai, K.; Kodama, H.; Miyagi, H. Analysis of flow in the front-mixing region of hypersonic combined-cycle engine. In Proceedings of the 34th Aerospace Sciences Meeting and Exhibit, Reno, NV, USA, 15–18 January 1996; American Institute of Aeronautics and Astronautics: Reston, VA, USA, 1996. [Google Scholar]
  17. Aygun, H.; Turan, O. Exergetic sustainability off-design analysis of variable-cycle aero-engine in various bypass modes. Energy 2020, 195, 117008. [Google Scholar] [CrossRef]
  18. Chen, H.; Cai, C.; Luo, J.; Zhang, H. Flow control of double bypass variable cycle engine in modal transition. Chin. J. Aeronaut. 2022, 35, 134–147. [Google Scholar] [CrossRef]
  19. Jia, L.; Chen, Y.; Cheng, R.; Tan, T.; Song, K. Designing method of acceleration and deceleration control schedule for variable cycle engine. Chin. J. Aeronaut. 2021, 34, 27–38. [Google Scholar] [CrossRef]
  20. Meng, X.; Zhu, Z.; Chen, M. Performance Optimization of Adaptive Cycle Engine during Subsonic Climb. Energy Procedia 2019, 158, 1613–1619. [Google Scholar] [CrossRef]
  21. Chen, H.; Zheng, Q.; Gao, Y.; Zhang, H. Performance seeking control of minimum infrared characteristic on double bypass variable cycle engine. Aerosp. Sci. Technol. 2021, 108, 106359. [Google Scholar] [CrossRef]
  22. Zhang, J.; Tang, H.; Chen, M. Robust design of an adaptive cycle engine performance under component performance uncertainty. Aerosp. Sci. Technol. 2021, 113, 106704. [Google Scholar] [CrossRef]
  23. Xu, Z.; Li, M.; Tang, H. A multi-fidelity simulation method research on front variable area bypass injector of an adaptive cycle engine. Chin. J. Aeronaut. 2022, 35, 202–219. [Google Scholar] [CrossRef]
  24. Song, F.; Zhou, L.; Wang, Z. Integration of high-fidelity model of forward variable area bypass injector into zero-dimensional variable cycle engine model. Chin. J. Aeronaut. 2021, 34, 1–15. [Google Scholar] [CrossRef]
  25. Zhang, B.; Liu, H.; Zhou, J. Experimental research on the performance of the forward variable area bypass injector for variable cycle engines. Int. J. Turbo Jet-Engines 2023, 40, 43–47. [Google Scholar] [CrossRef]
  26. Huang, G.; Li, C.; Xia, C. Investigations of entrainment characteristics and shear-layer vortices evolution in an axisymmetric rear variable area bypass injector. Chin. J. Aeronaut. 2022, 35, 230–244. [Google Scholar] [CrossRef]
  27. Wang, R.; Yu, X.; Zhao, K. Development and Validation of a Novel Control-Volume Model for the Injection Flow in a Variable Cycle Engine. Aerospace 2022, 9, 431. [Google Scholar] [CrossRef]
  28. Wang, R.; Liu, B.; Yu, X. The exploration of bypass matching limitation and mechanisms in a double bypass engine compression system. Aerosp. Sci. Technol. 2021, 119, 107225. [Google Scholar] [CrossRef]
  29. Lu, H.; Li, Q. Analysis and application of a new type of sweep optimization on cantilevered stators for an industrial multistage axial-flow compressor. Proceedings of the Institution of Mechanical Engineers. Part A J. Power Energy 2016, 230, 44–62. [Google Scholar]
  30. Wu, Y.; An, G.; Wang, B. Numerical investigation into the underlying mechanism connecting the vortex breakdown to the flow unsteadiness in a transonic compressor rotor. Aerosp. Sci. Technol. 2019, 86, 106–118. [Google Scholar] [CrossRef]
  31. Zhang, L.; Wang, S.; Zhu, W. Application of endwall contouring in a high subsonic tandem cascade with endwall boundary layer suction. Aerosp. Sci. Technol. 2019, 84, 245–256. [Google Scholar] [CrossRef]
  32. Zhang, C.; Hu, J.; Li, J.; Wang, Z. Three-dimensional compressor blading design improvements in low-speed model testing. Aerosp. Sci. Technol. 2017, 63, 179–190. [Google Scholar] [CrossRef]
Figure 1. Schematic diagram of the medium bypass ratio compression system.
Aerospace 10 00707 g001
Figure 2. The CDFS VIGV geometry model.
Aerospace 10 00707 g002
Figure 3. The structure and parameter definition of the LFVABI.
Aerospace 10 00707 g003
Figure 4. The 3D geometric model and mesh of the compression system.
Aerospace 10 00707 g004
Figure 5. The variation in CDFS performance for different grid densities.
Aerospace 10 00707 g005
Figure 6. The radial distribution of the average aerodynamic parameters at the CDFS outlet pitch for different grid densities.
Aerospace 10 00707 g006
Figure 7. The variation law of the compressor system bypass ratio with respect to αVIGV.
Aerospace 10 00707 g007
Figure 8. The variation laws of the aerodynamic performance of each component in the compression system with respect to αVIGV. (a) The variation laws of the fan, (b) the variation laws of the CDFS, (c) the variation laws of the high-pressure compressor, (d) the variation laws of each stage of the high-pressure compressor.
Aerospace 10 00707 g008
Figure 9. The radial distribution of the aerodynamic performance of the fan rotor and stator under different CDFS VIGV openings. (a) Fan rotor, (b) fan stator.
Aerospace 10 00707 g009
Figure 10. The distribution of the relative Mach number at the 95% of the blade height section of the fan under different CDFS VIGV openings.
Aerospace 10 00707 g010
Figure 11. The radial distribution of the aerodynamic performance of the CDFS rotor under different CDFS VIGV openings.
Aerospace 10 00707 g011
Figure 12. The radial distribution of the aerodynamic performance of the CDFS stator under different CDFS VIGV openings.
Aerospace 10 00707 g012
Figure 13. The distribution of the relative Mach number at the 95% and 5% of the blade height sections of the CDFS under different CDFS VIGV openings. (a) The 95% of the blade height section of the CDFS, (b) the 5% of the blade height section of the CDFS.
Aerospace 10 00707 g013
Figure 14. Comparison of the velocity triangles of the CDFS rotor before and after VIGV adjustment.
Aerospace 10 00707 g014
Figure 15. The distribution of static pressure and limit streamlines on the suction and pressure surfaces of the CDFS stator under different CDFS VIGV openings. (a) The suction surface of the CDFS, (b) the pressure surface of the CDFS.
Aerospace 10 00707 g015
Figure 16. The radial distribution of the aerodynamic performance of the first- and second-stage rotors and stators of the HPC under different CDFS VIGV openings. (a) The first-stage rotor of the HPC, (b) the first-stage stator of the HPC, (c) the second-stage rotor of the HPC, and (d) the second-stage stator of the HPC.
Aerospace 10 00707 g016
Figure 17. The distribution of the relative Mach number at the 95% and 5% of the blade height sections of the HPC under different CDFS VIGV openings. (a) The 95% of the blade height section of the HPC, (b) the 5% of the blade height section of the HPC.
Aerospace 10 00707 g017
Figure 18. The distribution of static pressure and limit streamlines on the suction and pressure surfaces of the HPC stator under different CDFS VIGV openings. (a) The suction surface of the first-stage stator of the HPC, (b) the suction surface of the second-stage stator of the HPC.
Aerospace 10 00707 g018
Figure 19. The variation laws of the compression system bypass ratio with respect to AFVABI.
Aerospace 10 00707 g019
Figure 20. The variation laws of the aerodynamic performance of each component in the compression system with respect to AFVABI. (a) The variation laws of the fan, (b) the variation laws of the CDFS, (c) the variation laws of the HPC, (d) the variation laws of each stage of the HPC.
Aerospace 10 00707 g020
Figure 21. The radial distribution of the aerodynamic performance of the fan rotor and stator under different FVABI openings.
Aerospace 10 00707 g021
Figure 22. The radial distribution of the aerodynamic performance of the CDFS rotor and stator under different FVABI openings.
Aerospace 10 00707 g022
Figure 23. The distribution of the relative Mach number at the 95% and 5% of the blade height sections of the CDFS under different FVABI openings. (a) The 95% of the blade height section of the CDFS, (b) the 5% of the blade height section of the CDFS.
Aerospace 10 00707 g023
Figure 24. The distribution of static pressure and limit streamlines on the suction and pressure surfaces of the CDFS stator under different FVABI openings. (a) The suction surface of the CDFS, (b) the pressure surface of the CDFS.
Aerospace 10 00707 g024
Figure 25. The radial distribution of the aerodynamic performance for the first and second stage of the HPC under different FVABI openings. (a) The first-stage rotor of the HPC, (b) the first-stage stator of the HPC, (c) the second-stage rotor of the HPC, (d) the second-stage stator of the HPC.
Aerospace 10 00707 g025
Figure 26. The distribution of static pressure and limit streamlines on the suction and pressure surfaces of the HPC stator under different FVABI openings. (a) The suction surface of the first-stage stator of the HPC, (b) The suction surface of the second-stage stator of the HPC.
Aerospace 10 00707 g026
Figure 27. Joint control scheme of adjustable components in the compression system.
Aerospace 10 00707 g027
Figure 28. Variation spectra of compression system bypass ratios and component performance under different variable-geometry component control schemes. (a) The variation in the bypass ratio, (b) the variation in the fan efficiency, (c) the variation in the CDFS efficiency, (d) the variation in the HPC efficiency.
Aerospace 10 00707 g028
Table 1. The configurations of the computational grids.
G1G2G3G4
grid density/104760109513821621
Table 2. Settings of CDFS VIGV opening adjustment parameters.
αVIGVAFVABIPinnerPouter
Condition 100.421.01.0
Condition 2−5
Condition 3−10
Condition 4−15
Condition 5−20
Condition 6−25
Condition 7−30
Table 3. The twist velocity at the 95% of the blade height section of the CDFS rotor under different openings of the CDFS VIGV.
VIGV OpeningsαVIGV = 0°αVIGV = −15°αVIGV = −30°
Wu1.0000.9290.809
Table 4. Settings of FVABI opening adjustment parameters.
αVIGVAFVABIPinnerPouter
Condition 1−300.301.01.0
Condition 20.34
Condition 30.38
Condition 40.42
Condition 50.46
Condition 60.50
Condition 70.54
Condition 80.58
Disclaimer/Publisher’s Note: The statements, opinions and data contained in all publications are solely those of the individual author(s) and contributor(s) and not of MDPI and/or the editor(s). MDPI and/or the editor(s) disclaim responsibility for any injury to people or property resulting from any ideas, methods, instructions or products referred to in the content.