Abstract
Contrails are responsible for a significant proportion of aviation’s climate impact. This paper uses data from the European Centre for Medium-Range Weather Forecasts to identify the altitudes and latitudes where formed contrails will not persist. This reveals that long-lived contrails may be prevented by flying lower in equatorial regions and higher in non-equatorial regions. Subsequently, it is found that the lighter fuel and reduced seating capacity of hydrogen-powered aircraft lead to a reduced aircraft weight, which increases the optimal operating altitude by about 2 km. In non-equatorial regions, this would lift the aircraft’s cruise point into the region where long-lived contrails do not persist, unlocking hydrogen-powered, low-contrails operation. The baseline aircraft considered is an A320 retrofitted with in-fuselage hydrogen tanks. The impacts of the higher-altitude cruise on fuel burn and the benefits unlocked by optimizing the wing geometry for this altitude are estimated using a drag model based on theory proposed by Cavcar, Lock, and Mason, and verified against existing aircraft. The weight penalty associated with optimizing wing geometry for this altitude is estimated using Torenbeek’s correlation. It is found that thinner wings with higher aspect ratios are particularly suited to this high-altitude operation and are enabled by the relaxation of the requirement to store fuel in the wings. An example aircraft design for the non-equatorial region is provided, which cruises at a 14 km altitude at Mach 0.75 with a less than 1% average probability of generating long-lived contrails when operating at latitudes more than 35° from the equator. Compared to the A320, this concept design is estimated to have a 20% greater cruise lift–drag ratio, due to the 33% thinner wings with a 50% larger aspect ratio, enabling just 5% more energy use per passenger-km, despite fitting 40% fewer seats.
Keywords:
aviation; climate change; non-CO2 emissions; contrails; mitigation; altitude; radiative forcing; design 1. Introduction
The climate impact of contrails has been a concern since 1970 [1], and they are currently estimated to be responsible for approximately 50% of aviation’s total climate change impact [2]. However, there has not yet been significant progress towards contrail abatement. Karcher [3] explains that this is because “observational data on contrail cirrus” are “very scarce, since it is difficult to distinguish them visually from naturally occurring high ice clouds” and that this has resulted in uncertainty that has “prevented the formulation of options for mitigation” since it is difficult to assess the effectiveness of abatement options when the problem is so difficult to observe in the first place. This has hampered progress toward the elimination of contrails.
The accepted theory of contrail formation was proposed by Schmidt in 1941 [4], and further developed by Appleman in 1953 [5]. They identified that contrail formation depends not only on ambient air temperature, pressure, and humidity but also on aircraft exhaust conditions. More recent research [6] has identified an additional condition that must be met for formed contrails to persist rather than rapidly dissipate. This persistence condition depends only on the state of the ambient air. Accurate modelling of contrail persistence is therefore particularly attractive, as it can be used to create a global, aircraft-independent map of regions where contrails will not persist. Short-lived contrails have “little to no impact” [3] on the climate, so operating aircraft exclusively in these regions would be sufficient to eliminate most of the contrails’ radiative forcing. Focusing on preventing persistence rather than formation enables one to avoid the uncertainties that remain in modeling the microscopic processes that govern the formation and provides certainty on the impact of altitude on contrails, which will aid designers seeking to optimize their aircraft for contrail evasion.
A strategy frequently proposed for limiting persistent contrails is in-flight navigational contrail avoidance, wherein live weather modeling is used to predict when an aircraft is approaching a region where formed contrails will persist, enabling it to reroute and prevent long-lived contrails. Scholz [7] argues that this would be possible “without dramatically enhancing the workload of air traffic controllers” because “though only 25% of aircraft movements occur at night, they account for 60–80% of the contrails’ radiative forcing”, meaning that only a small number of flights would need redirecting. However, a recent FlyZero report [8] remarks that this is not yet possible as “significant research is still needed to confidently predict” regions where formed contrails would persist in real-time. This is complicated by the chaotic nature of the weather, which ensures that only short-term predictions can be made accurately so these forecasts will need to be made within days of the flight. The report, therefore, states that before meaningful contrail abatement can be made this way, there is an urgent need to “improve meteorological weather prediction” with a new “optimized statistical approach to identify and avoid regions” where formed contrails would persist. Progress has been made in this area by private companies [9,10] working with airlines to reduce their climate impact by providing “minor modifications” to the flight plan “on the day” to avoid contrail persistence regions based on their atmospheric modeling. However, the effectiveness of this approach has not yet been proven, as it is difficult to demonstrate that long-lived contrails have been prevented, and FlyZero proposes that there is therefore a need for further research using methods, such as chase plane measurements to clarify the impact of preventative measures.
Alternative proposals, such as those being pursued by Aero Engine Craft [11], suggest that aircraft engines could be redesigned to prevent water emission at altitudes with a high probability of contrail persistence. However, these are untested at scale and will likely suffer from trade-offs, such as reduced engine efficiency due to water capture, meaning the contrail reduction would have to be carefully balanced against the additional fuel burn to ensure the overall climate impact of the aircraft is improved by the novel engine design.
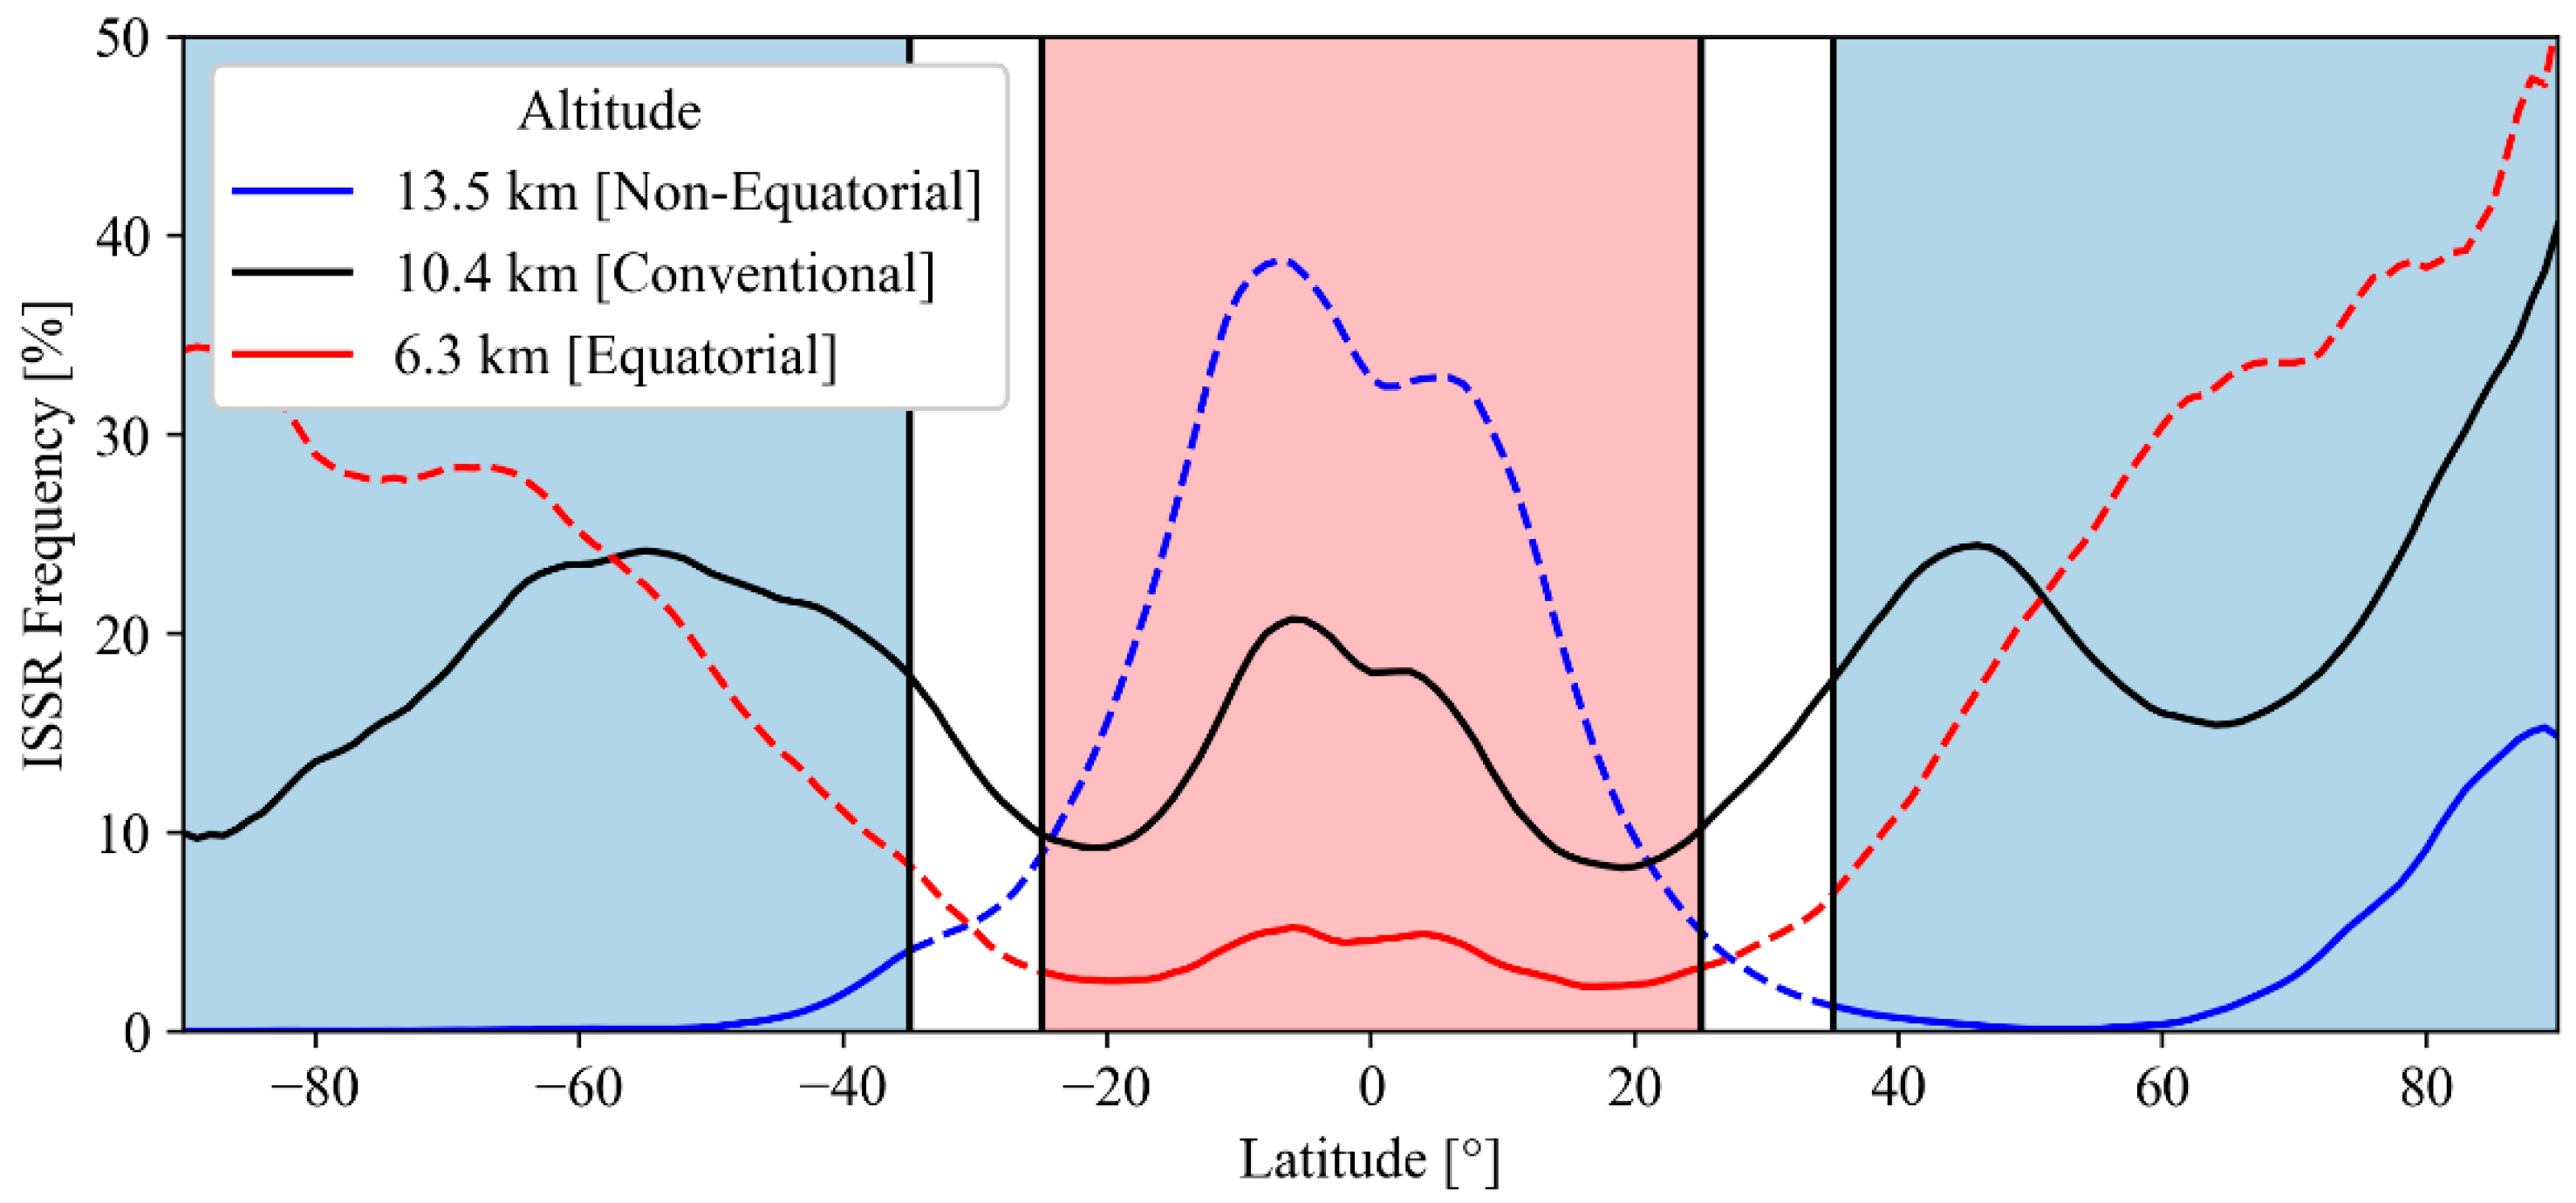
This study proposes that the uncertain effectiveness of actively predicting contrail persistence regions during a cruise may be avoided by instead focusing on redesigning the aircraft to optimize them for altitudes with a low historic average probability of persistent contrails. FlyZero [12] remarks that the reason there has not been progress in the design for zero contrails is that “aircraft designers want to know the effect of changing the design altitude on climate impacts” but that “considerable research” is still needed on this aspect. This is clear from the disagreements found in the literature over whether cruise altitude should be decreased [7,13,14] or increased [15] to reduce contrail persistence. This paper seeks clarity on the impacts of altitude by using global weather data from the European Centre for Medium-Range Weather Forecasts (ECMWF) to map the average probability of contrail persistence worldwide. This technique has been proven against real-world contrail observations by previous studies [16] and leads to the conclusion that high-altitude flight is preferable for reduced contrails in polar regions, while low-altitude flight minimizes contrails in equatorial regions. This is consistent with findings described in the Encyclopedia of Atmospheric Sciences [17] and is demonstrated in Figure 1, wherein the frequency of ice-supersaturated regions (which represent the average probability of contrails persisting) is plotted at three different altitudes across a range of latitudes.
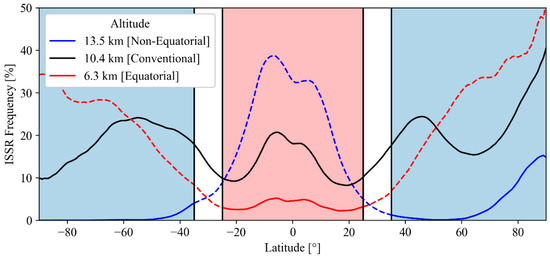
Figure 1.
Frequency of ice supersaturated regions against latitude for conventional, high, and low-altitude flights. This uses data from 2018, averaged across longitude and month, as discussed in Section 2.
The aims of this study are to predict the dependence of contrail persistence regions on altitude, latitude, and longitude, and then to use this to determine how retrofitting a conventional aircraft with in-fuselage hydrogen tanks for hydrogen-powered operation at low-contrails altitudes will affect its performance and finally to redesign the wings of a hydrogen aircraft for minimal fuel burn at a zero-contrails operating altitude and Mach number. The objective of zero contrails is adopted to explore the potential of what could be performed to eliminate contrail cirrus effects. It is accepted that this may not be practically achievable for many flights.
This paper begins by describing a methodology for determining the dependence of contrail persistence on altitude and latitude and identifying the best cruise regions for the prevention of long-lived contrails. The impact of redesigning the aircraft’s wings on its ability to operate with good performance at low-contrails altitudes is then predicted using a model devised for the aircraft’s drag polars as a function of wing geometry, based on the theory proposed by Cavcar, Lock, and Mason. This was verified against an Airbus A320 and a Boeing 787-8 drag polars from Piano [18]. The impact of retrofitting an aircraft with in-fuselage liquid hydrogen tanks is incorporated through a model which estimates the required volume of hydrogen and tank geometry given thermodynamic and structural constraints. This enables a comparison of the trade-offs between contrails and fuel burn for several hydrogen aircraft with different wing designs. The paper concludes by predicting the changes in wing geometry that would be required to make a fuel-efficient, low-contrails, hydrogen aircraft.
The key novel finding of this paper is the understanding of the effects of altitude choice on contrails at a range of latitudes, which will inform aircraft designers looking for design altitudes that preclude long-lived contrails. Additionally, the perceived disadvantage of a hydrogen retrofit leading to in-fuselage tanks which reduce passenger count was found to be advantageous for aircraft aerodynamics, as it relaxed constraints on wing volume. The retrofit was also beneficial for contrails in non-equatorial regions, as the resulting low aircraft weight preferenced it towards high-altitude, low-contrails operation. This will be of particular interest to aircraft designers, aerodynamicists, and all those who are interested in understanding the impacts of aircraft design on climate change.
2. Materials and Methods
2.1. Identifying Contrail Persistence Regions
The objective of this section is the accurate prediction of latitudes and altitudes where contrails will persist, which will inform the choice of operating points for a low-contrails aircraft. To achieve this, meteorological data for 2016–2018 from the ECMWF ERA-Interim dataset [19] are used to determine which altitudes and latitudes typically lead to contrail persistence. This is a reanalysis dataset, meaning it blends measurements and forecasts based on short-term historic data to create a global weather map with uniformly spaced datapoints. The method of predicting contrails using ERA-Interim data was verified by a 2020 study [16] which noted that ERA-Interim’s sparse 0.75° latitude spatial resolution leads to inaccuracy at fine scales but good general predictions of contrail persistence regions, which is sufficient for modeling the key trends with altitude and latitude.
2.1.1. The Contrail Formation and Persistence Conditions
The Schmidt–Appleman Criterion determines contrail formation. It states that a contrail forms if at some point during the mixing of hot engine exhaust with cool ambient air, the exhaust jet is transiently supersaturated with respect to water, so that excess vapor condenses into water droplets which freeze into ice crystals, forming contrails. Supersaturation occurs when relative humidity with respect to water is greater than 100%, where (1) defines relative humidity, RH.
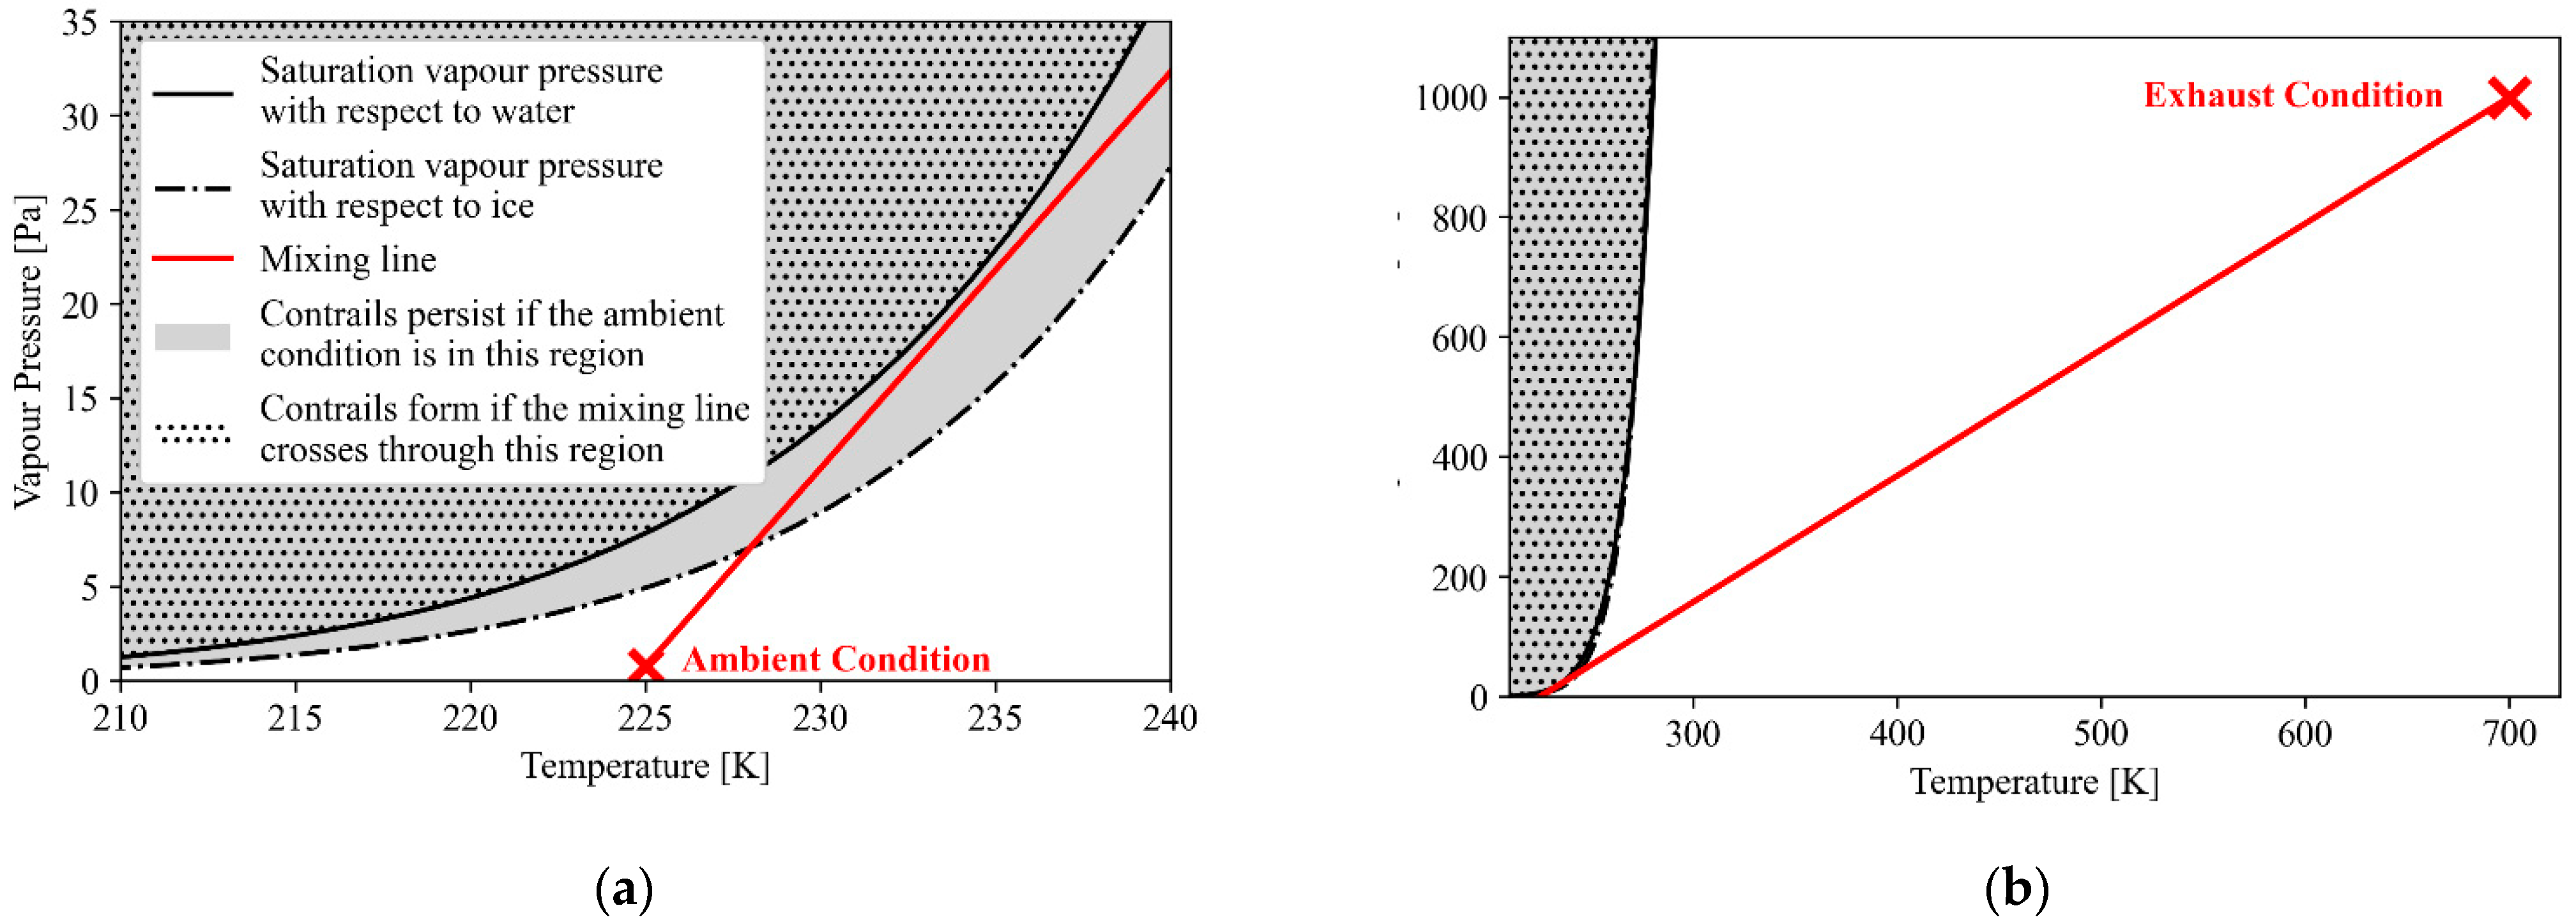
Saturation vapor pressure is defined as either over water or over ice. It represents the equilibrium point at which any further vapor added would condense as water or deposit as ice. At all temperatures below freezing, the saturation vapor pressure over ice is lower than over water because the greater amount of energy required for ice to sublimate than for water to evaporate results in lower equilibrium vapor content over ice than water, as shown in Figure 2. Contrails persist if the ambient air is supersaturated with respect to ice, so that the ice crystals remain frozen.
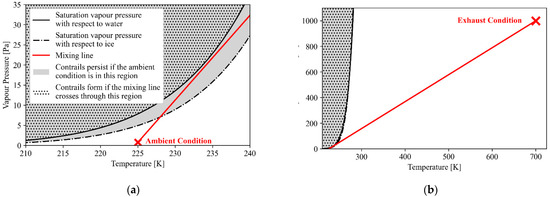
Figure 2.
Saturation vapor pressure against temperature according to the Goff–Gratch Equation [20], with a typical mixing line for a kerosene aircraft indicated: (a) scaled to show the ambient condition; (b) scaled to show the exhaust condition.
2.1.2. Mapping Contrail Persistence Regions
The ERA-Interim dataset provides relative humidity with respect to water at all points with temperatures above 273 K and with respect to ice for all points with temperatures below 250 K. In the region between, the dataset interpolates between the values with respect to ice and water. This interpolation has little impact on the accuracy of the results, as shown by the less than 3% difference when a linear reverse-interpolation step was added to all datapoints with temperatures above 250 K.
To model the impacts of altitude and latitude on contrail persistence, data were imported from ERA-Interim, covering relative humidity measurements every 6-h at 14 altitudes between 4.2 km and 15.8 km, with a 0.75° latitude and longitude resolution. All datapoints, where relative humidity implied supersaturation with respect to ice, were marked as possible ice super-saturated regions (ISSR). An existing study [16] found this method’s ISSR predictions were most consistent with measurements from passenger aircraft when the relative humidity threshold used to indicate saturation was 90% rather than 100%. The explanation offered for this in [16] is that the model used by ERA-Interim limits relative humidity to 100% in supersaturated regions where ice clouds have formed, thus reducing the average relative humidity of these regions and underpredicting ISSR. The suggested 90% threshold is used hereafter.
For each month from 2016 to 2018, the percentage of time instants where the air was supersaturated with respect to ice was calculated (2) and used as an indicator of the average risk of contrails persisting at each altitude-longitude-latitude combination. This ‘ISSR frequency percentage’, is plotted in Figure 3. This demonstrates that persistence regions are frequent at the equator at high altitudes and at the poles at low altitudes.

Figure 3.
ISSR frequency variation in June 2017 at two example altitudes: (a) 13.5 km, (b) 8.1 km.
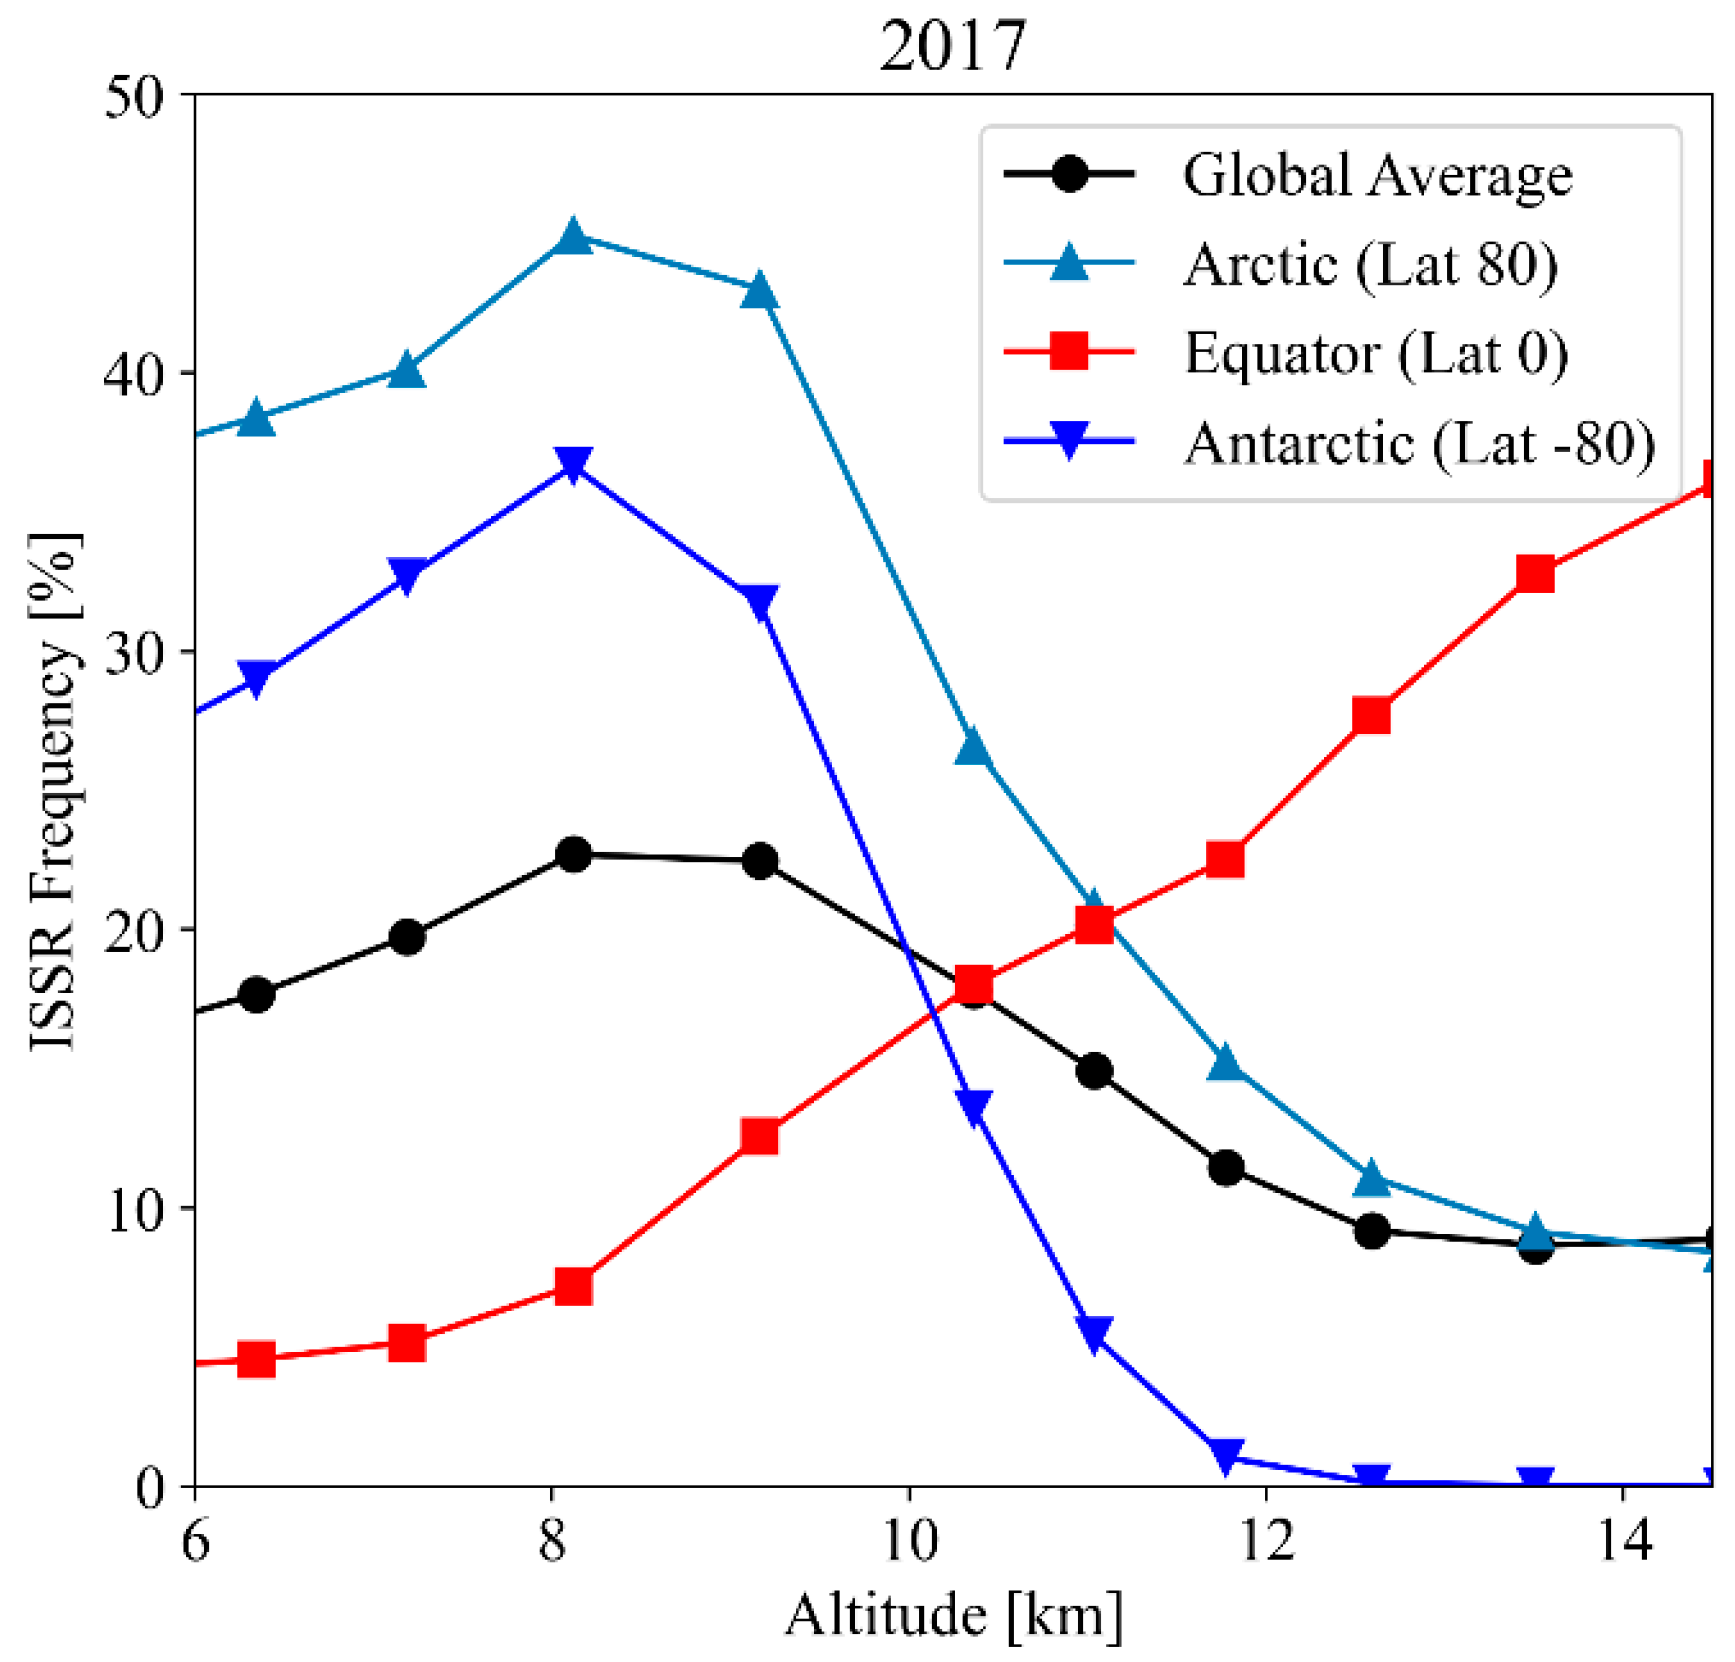
To understand the impact of altitude on contrails for an aircraft that operates year-round, ISSR frequency was then averaged across all months to find the annual average ISSR frequency at each location. Latitude variation has a much greater impact on ISSR frequency than longitude, so the results were also averaged across longitude as in (3) to inform the design of an aircraft for all longitudes. Figure 4 shows the resulting trends with altitude and latitude.
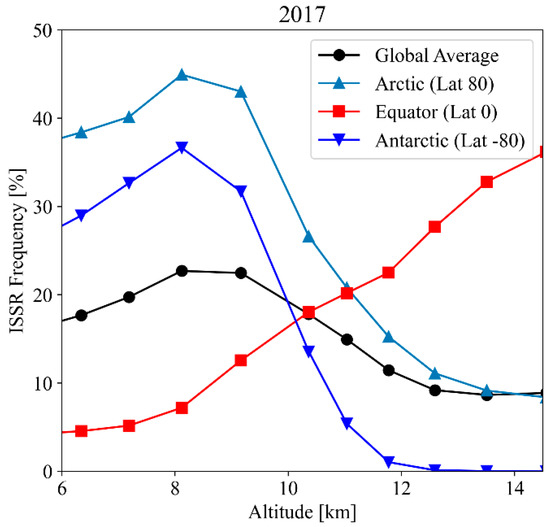
Figure 4.
ISSR Frequency variation with altitude at equatorial and polar latitudes, averaged across all months and longitudes in 2017.
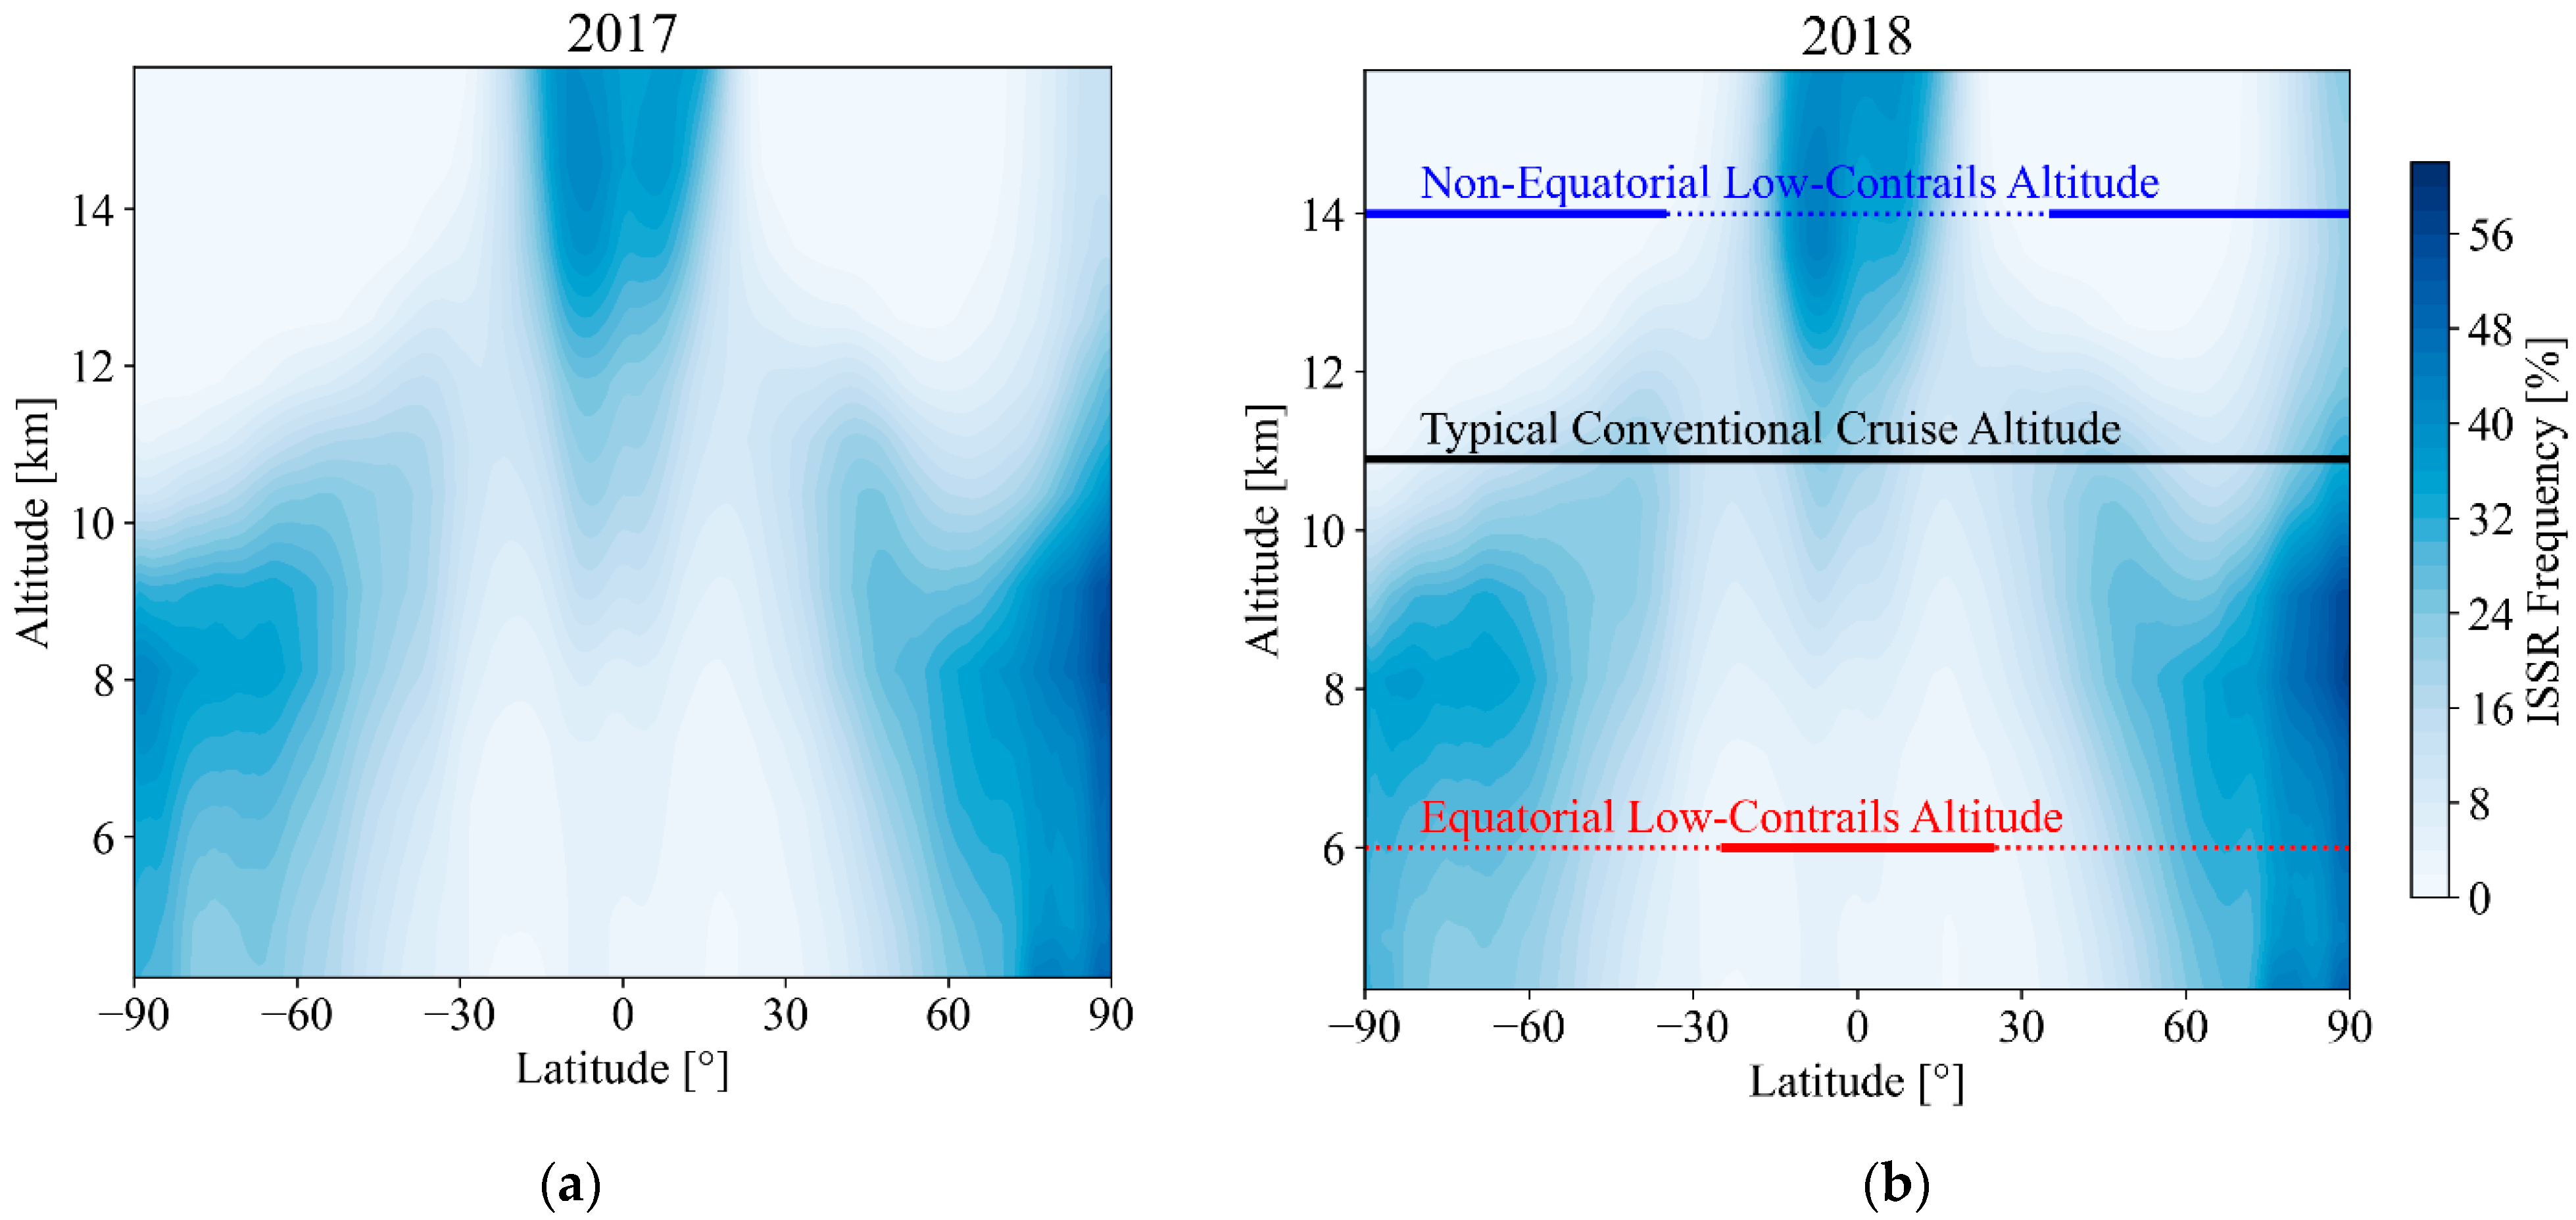
Figure 4 shows that the dependence of ISSR frequency on latitude can be separated into two regimes. Near the equator, ISSR frequency peaks at high altitudes. Conversely, ISSR frequency is minimum at high altitudes for latitudes more than 35° or less than −35°. This is corroborated by the discussion in the Encyclopedia of Atmospheric Sciences [17]. Designing one aircraft to balance these conflicting constraints leads to a minimum average ISSR frequency when the aircraft flies at ~12 km altitude, not much higher than aircraft typically achieve today, and with little improvement in contrails. However, designing separate aircraft for each of the two regimes enables significant reductions in contrail persistence. Figure 5 shows that equatorial aircraft ought to fly at ~6 km altitude to minimize long-lived contrails, while aircraft operating more than 35° from the equator can minimize long-lived contrails by operating at ~14 km altitude.
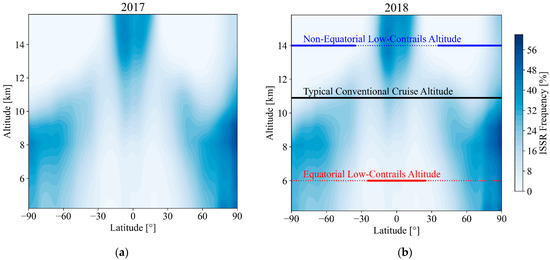
Figure 5.
ISSR frequency variation averaged across all longitudes and months: (a) in 2017; (b) in 2018, with typical cruise altitudes and regions for contrail avoidance indicated.
The variation in contrail persistence with latitude for aircraft operating at a fixed altitude was demonstrated in Figure 1. These are summarized in Table 1, which describes an equatorial low-altitude point and a polar high-altitude point that could reduce contrail persistence by factors of approximately 5 and 10, respectively, compared to conventional altitudes.

Table 1.
Proposed operating points for minimal-contrails aircraft. ISSR Frequencies indicated in the table are averages across the full longitude range and all seasons.
The design of an aircraft for the high-altitude operating point is the focus of the rest of this paper, while the design for the low-altitude point is an opportunity for further work. An aircraft operating at altitudes of approximately 6 km would require significant redesign, as the required cruise Mach number at such low altitudes is expected to be so low that a propeller engine would be more suitable than a turbofan. Note that designing for the operating points proposed in Table 1 would lead to a fleet of aircraft with a restricted range of latitudes. For flight routes that cross between the regions, the resulting aircraft designs would produce higher contrail levels than shown in Table 1. However, the impact of this is expected to be small and could be managed through the use of the aircraft best suited to the route and changing flight altitude through intermediary latitudes.
2.2. Modeling Redesigned Aircraft
In this section, a model is devised for the aerodynamics and weight distribution of hydrogen aircraft with redesigned wings. This will later be used to determine the changes to wing geometry that will be most beneficial for the fuel economy of high-altitude (low-contrails), hydrogen-powered aircraft. Though these statistical and physics-based models can only ever provide estimates, due to the complexity of predicting the weight and aerodynamics of future aircraft, they are expected to provide insight into the direction in which aircraft design would need to shift to optimize it for hydrogen-powered, high-altitude operation.
2.2.1. Developing a Theory-Based Drag Polar Model for Redesigned Wings
According to Cavcar [21], any aircraft’s drag coefficient may be written as Equations (4) and (5) in terms of a compressible component and a quadratic incompressible component. The latter dominates at low subsonic speeds, where compressibility is negligible.
The Zero-Lift Drag Coefficient
The constant incompressible component in (5), CD0, is called the zero-lift drag coefficient. It represents the contribution of parasitic drag due to skin friction and form drag from all external aircraft components. Contributions are neglected here from all components except the wings and fuselage, given by Civil Jet Aircraft Design [22] as in (7).
The commercial aircraft considered here operate at a high Reynolds number (107–108), so the flow over the wings and fuselage is considered turbulent for the purpose of estimating skin friction (8). The characteristic lengths used to estimate the Reynolds number for the wing and fuselage are mean chord and fuselage length, respectively.
The Induced Drag Coefficient
The quadratic term in (5), k1, represents lift-induced drag [23]. It has two components. The first, inviscid vortex drag, is caused by downwash from wingtip vortices, reducing the relative angle-of-attack of the wing. This increases the component of the lift vector acting rearwards, thus increasing the nominal drag force. There is also a viscous element, which represents the change in skin friction and forms drag with angle-of-attack and lift. Nita and Scholz [24] provide a model for these which is summarized in (9) with the former term representing inviscid drag and the latter representing viscous drag.
The Effect of Camber and Wing Twist
The linear term in (5), k2, accounts for the effects of wing twist and camber, which provide positive lift at zero angle-of-attack, shifting the drag polar upwards so that it is asymmetric about the CD axis. This is typically neglected during preliminary design because its contribution is small and difficult to quantify, partly because airframe camber and twist represent intellectual property that is valuable (and hence guarded), but also because the effects are skewed in flight as flaps alter camber and lift coefficients. It is neglected hereafter.
The Compressible Drag Component
Lock’s relation, reported by Hilton [25], states that the compressible drag component in (4) scales with the fourth power of the Mach number above the critical Mach number. Poole, Allen, and Rendall [26] explain that “drag per unit height of a normal shock scales with the third power” while “shock height” scales with the first power, hence the fourth-order dependence. Grasmeyer [27] gives the empirical relation:
Cavcar [21] defines the drag-divergence Mach number as the point at which compressibility increases the overall drag coefficient by 0.002. Therefore, by rearranging (10):
The Korn Equation (12), extended by Mason [28] to include the role of sweep, gives an empirical result for the drag-divergence Mach number, where 0.95 is a technology factor for supercritical airfoils.
The Complete Drag Model (Table 2)
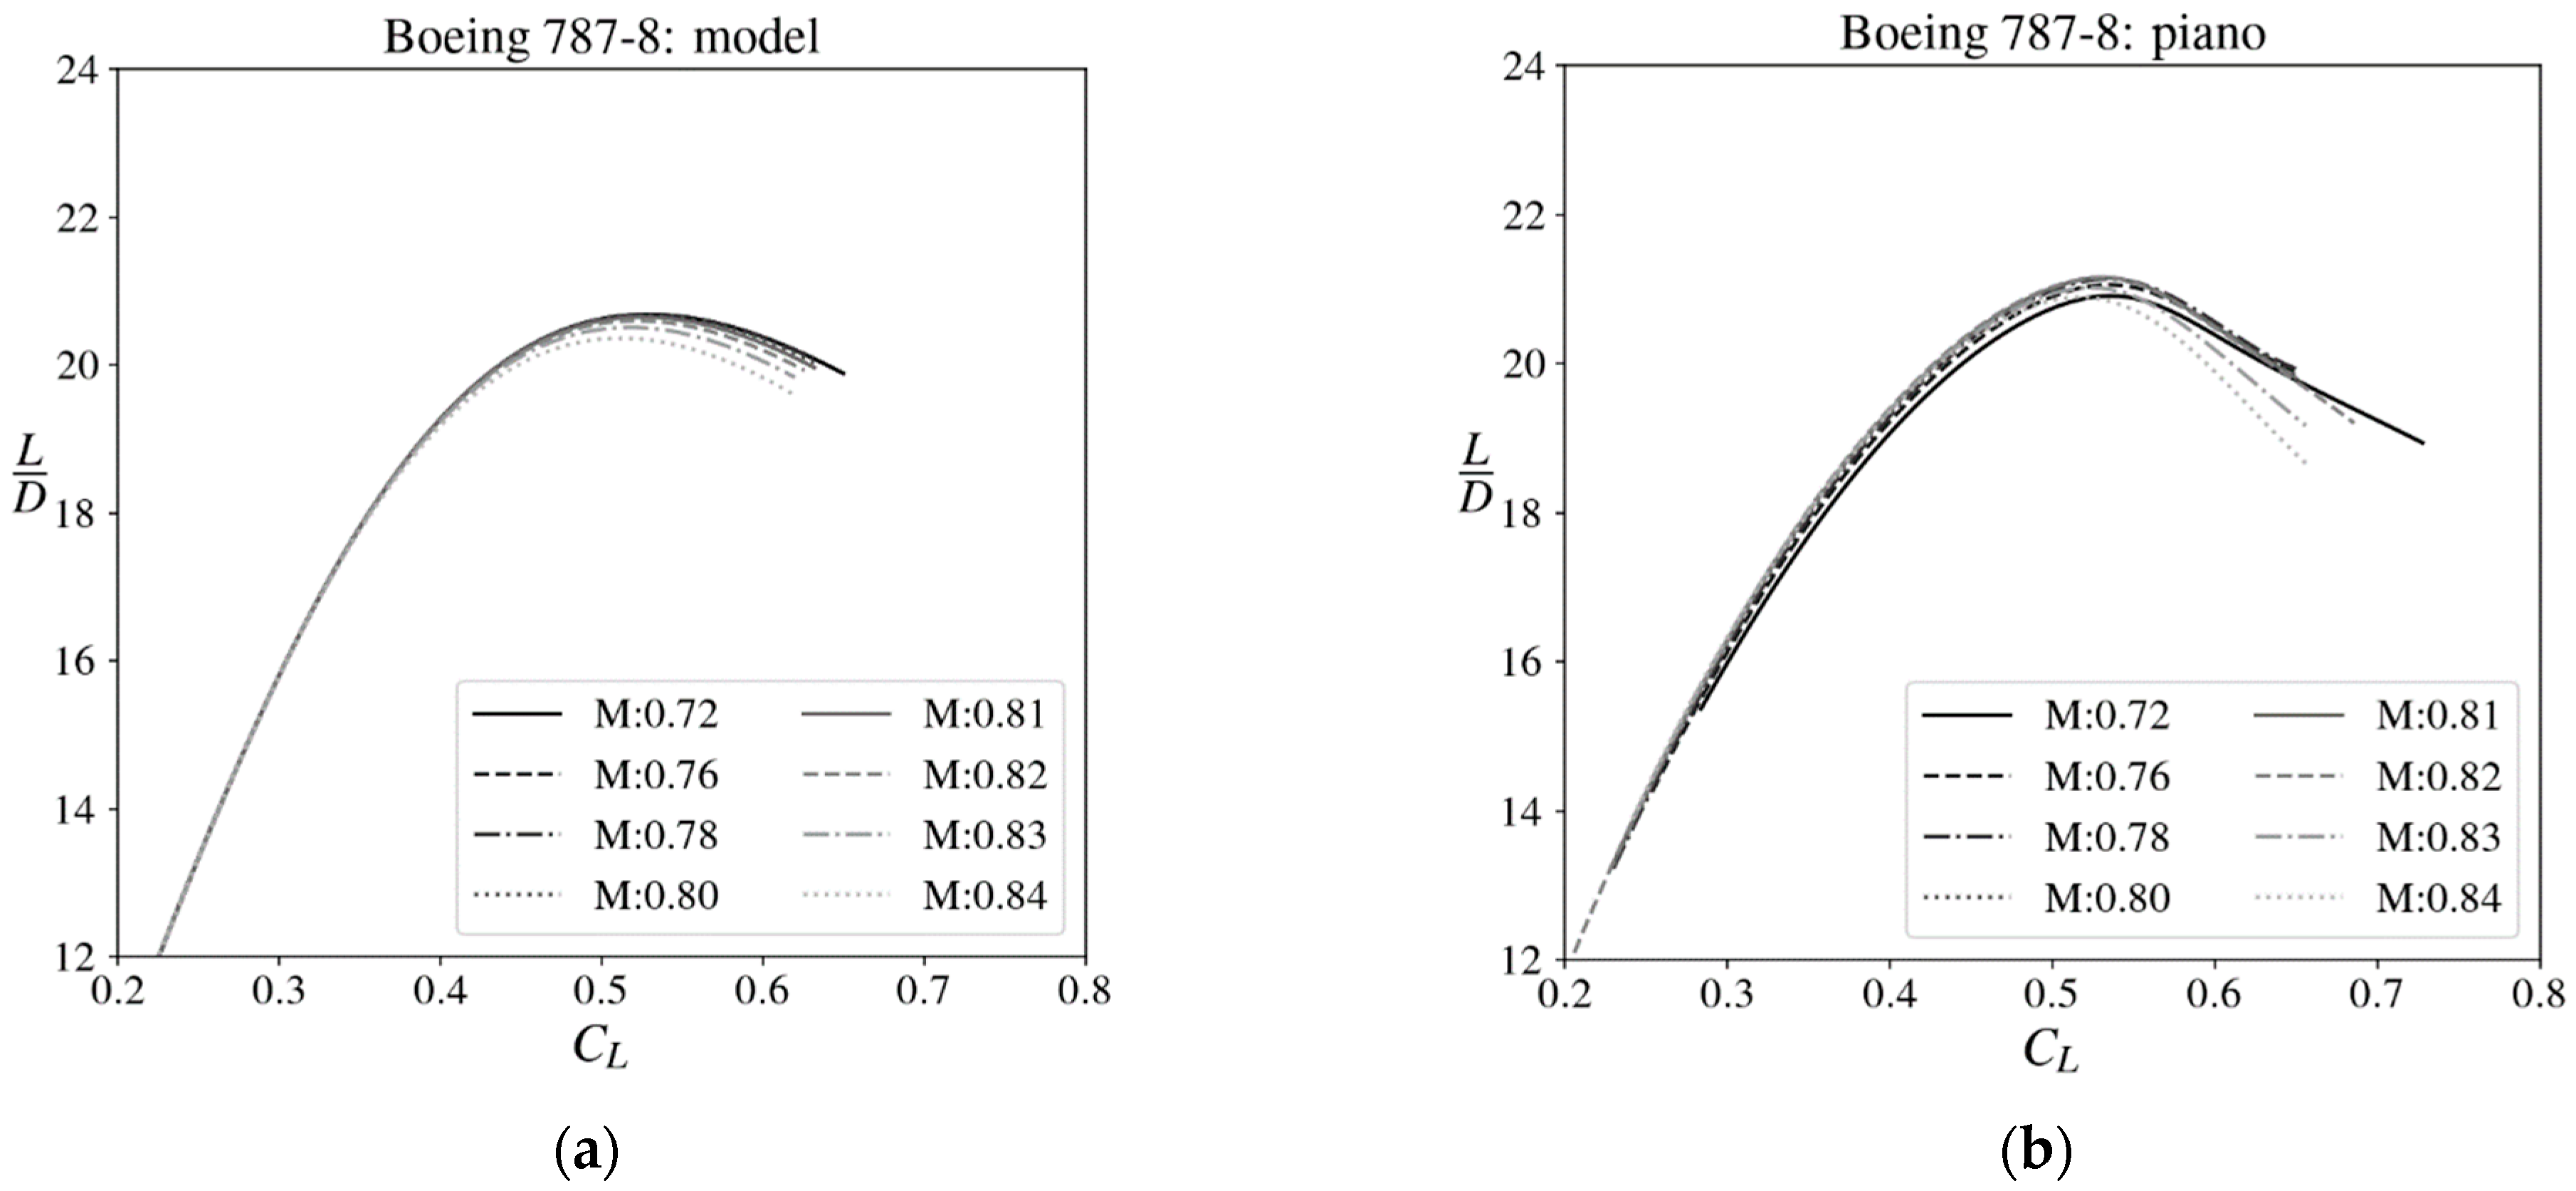
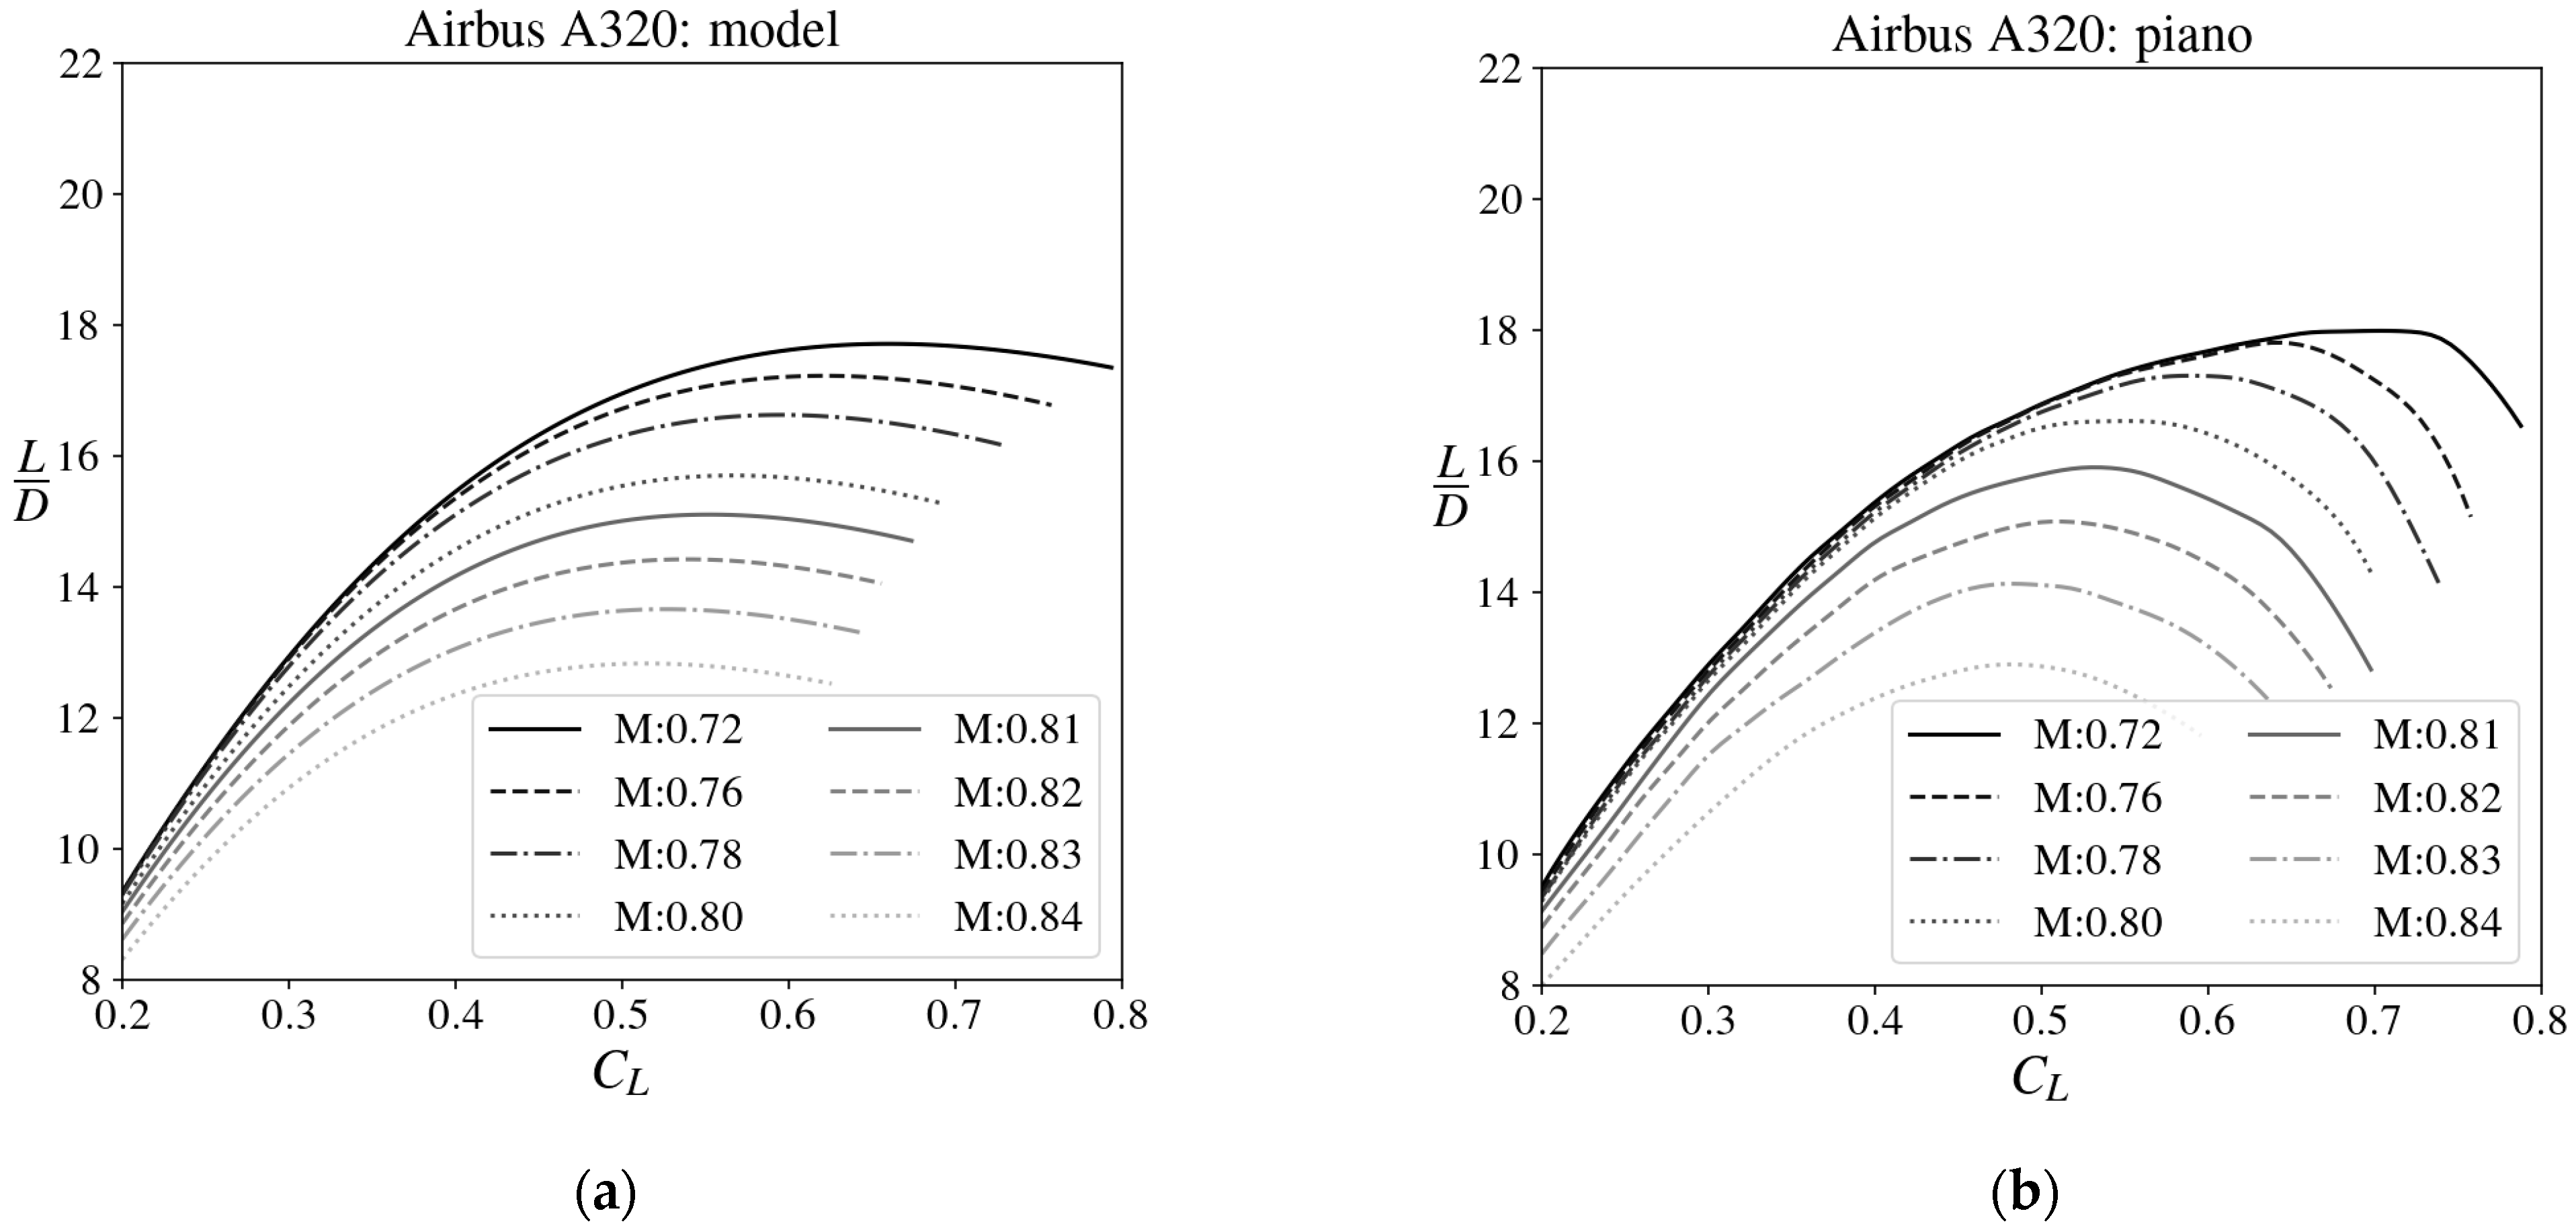
The skin friction coefficient is the only altitude-dependent component and is hereafter approximated as constant because it varies by only 10% across the altitude range of 8–14 km, beyond which any retrofitted A320 is unlikely to operate. This enables the generation of altitude-independent drag polars using only the input geometry. These were verified by comparison with the drag polars from Piano [18] for two aircraft of known geometry (Table 3), as shown in Figure 6 and Figure 7. Both demonstrate sufficient similarity to support the validity of this model for investigating the impact of wing geometry on performance. The Piano polars demonstrate stall, wherein the boundary layer separates on top of the wing at a high angle-of-attack, resulting in a large wake and high-pressure drag. As a conservative estimate for predicting stall, the model prohibits operation at lift coefficients 20% greater than that which maximized lift-drag ratio, which is where the lines end on the right-hand side of the polars.

Table 3.
A320 Geometry [22] and Boeing 787-8 Geometry [29,30].
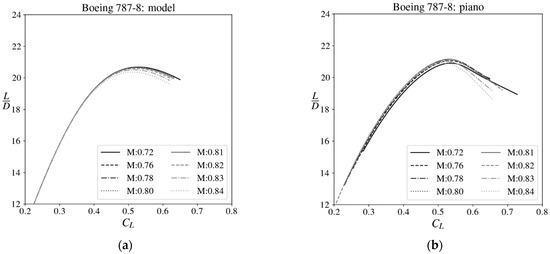
Figure 6.
Drag polars for the Boeing 787-8 created using (a) the model and (b) the Piano [18] data.
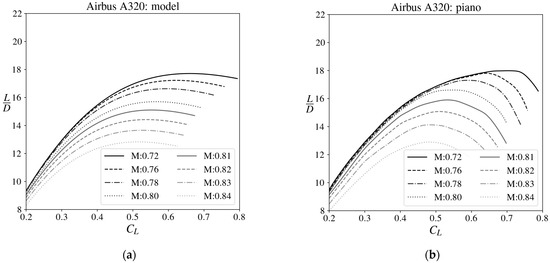
Figure 7.
Drag polars for the Airbus A320 created using: (a) the model and (b) the Piano [18] data.

Table 2.
Breakdown of the Drag Model.
Table 2.
Breakdown of the Drag Model.
| Incompressible Components | Compressible Component | ||
|---|---|---|---|
| Coefficient | k1 | ||
| Equation | (6) | (9) | (10) |
| Dependencies | |||
Drag Polars for Redesigned Wing Geometry
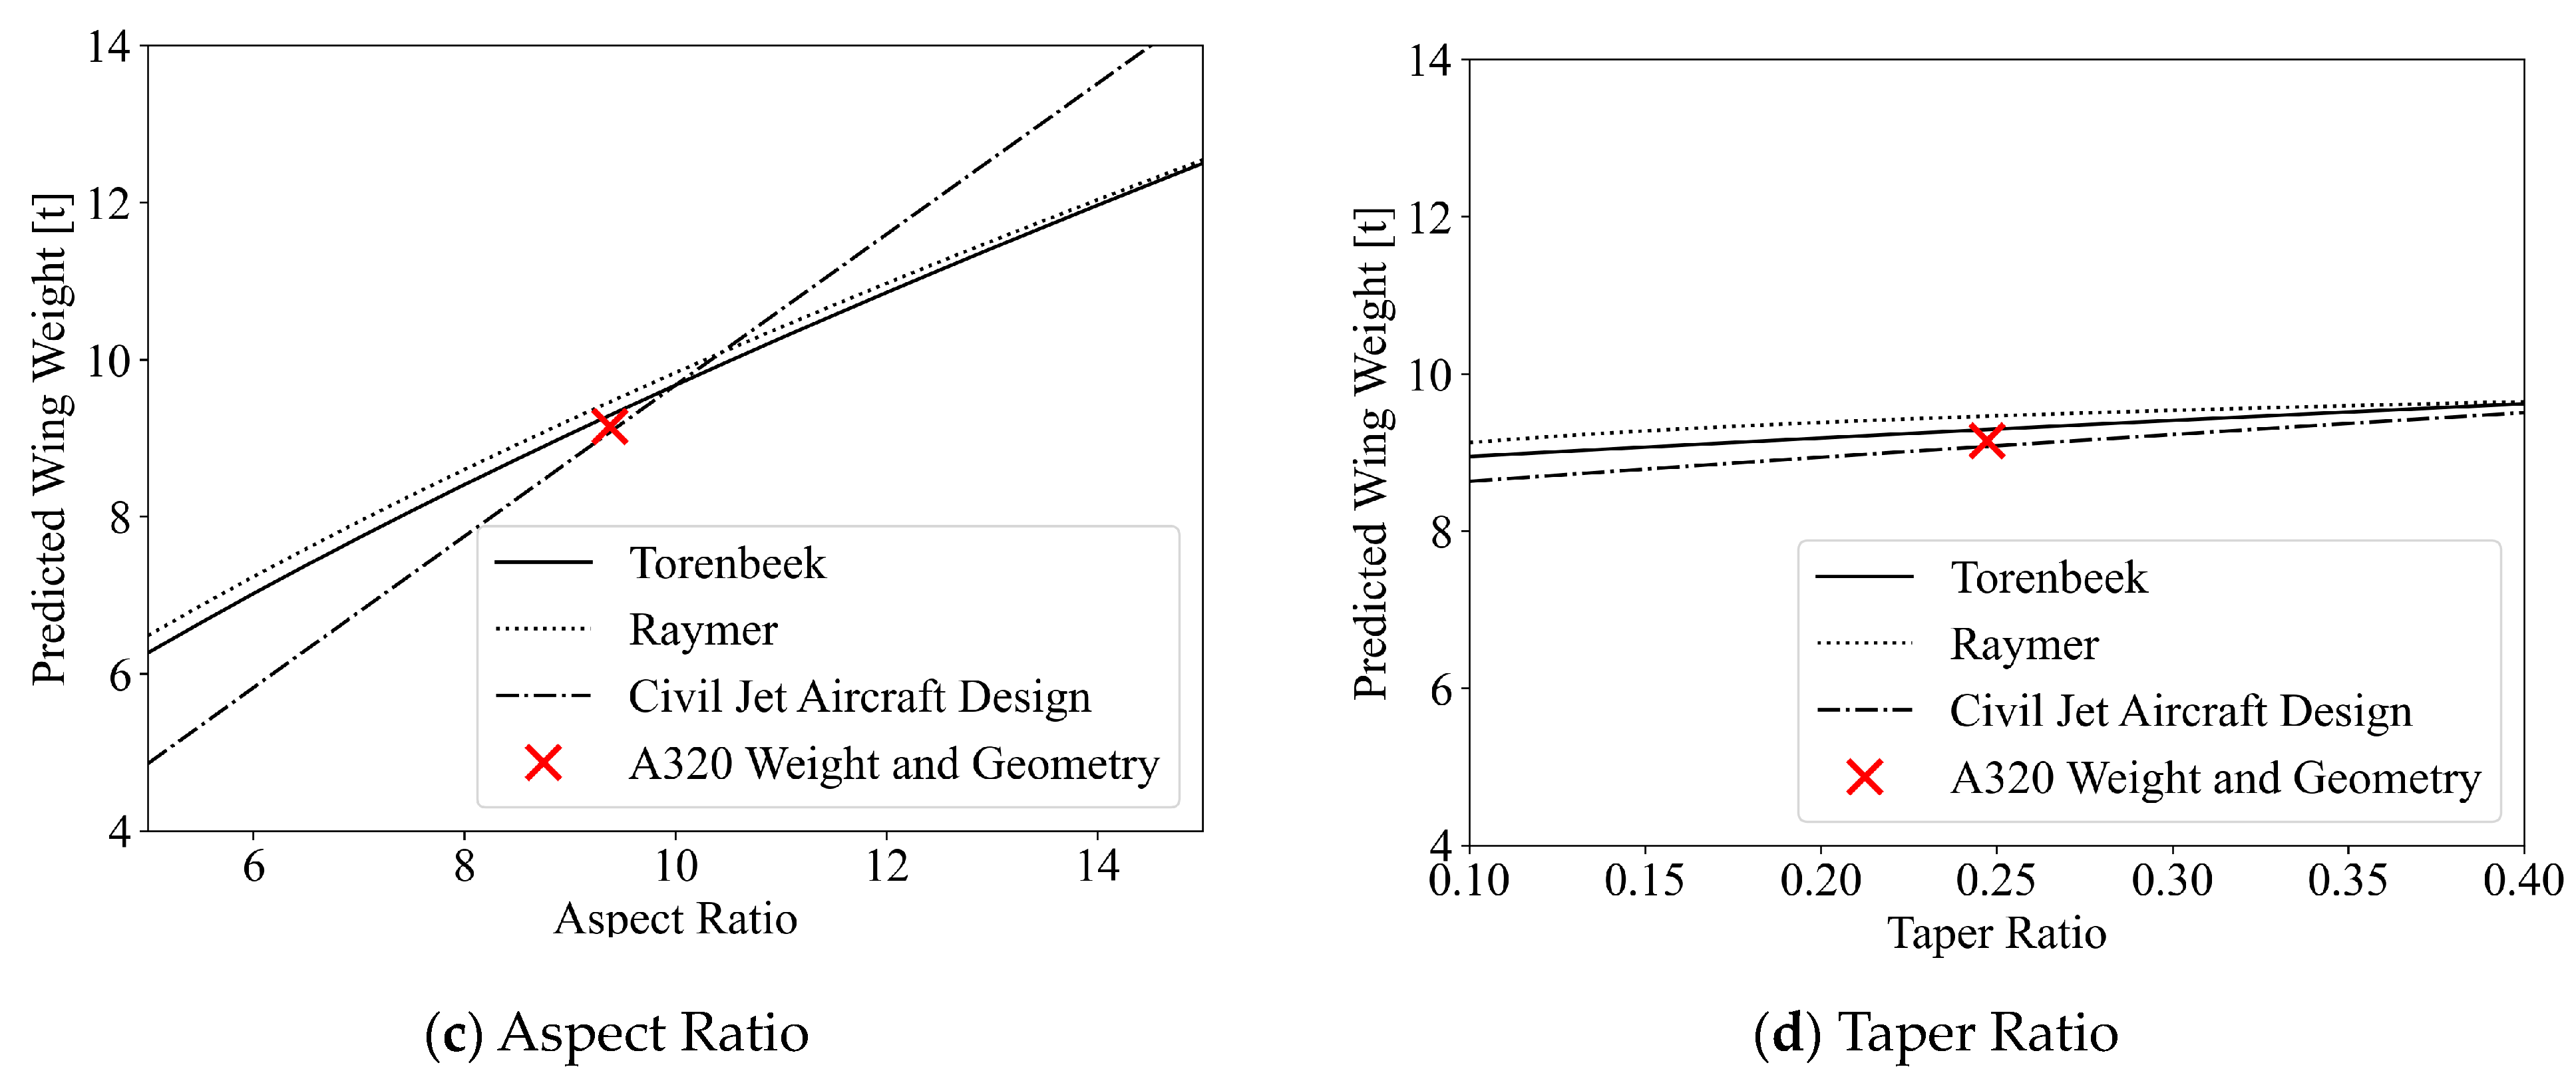
To understand the impact of the thickness-chord ratio, aspect ratio, and wing sweep on aerodynamics and wing weight, a strategy is now devised for varying each independently of the rest. The initial simplification is that the wing area, S, must remain constant to ensure the redesigned aircraft can generate the same lift at a given altitude, Mach number, and lift coefficient. The thickness-chord ratio is varied independently by setting the wing chord constant to maintain wing area and varying thickness. The aspect ratio is altered at a constant area by varying the wing span according to (13).
Varying the sweep angle alters the wing length because the wing span must remain constant to avoid changing the aspect ratio. An inverse change in the chord is thus also required to maintain a constant wing area, as in (14).
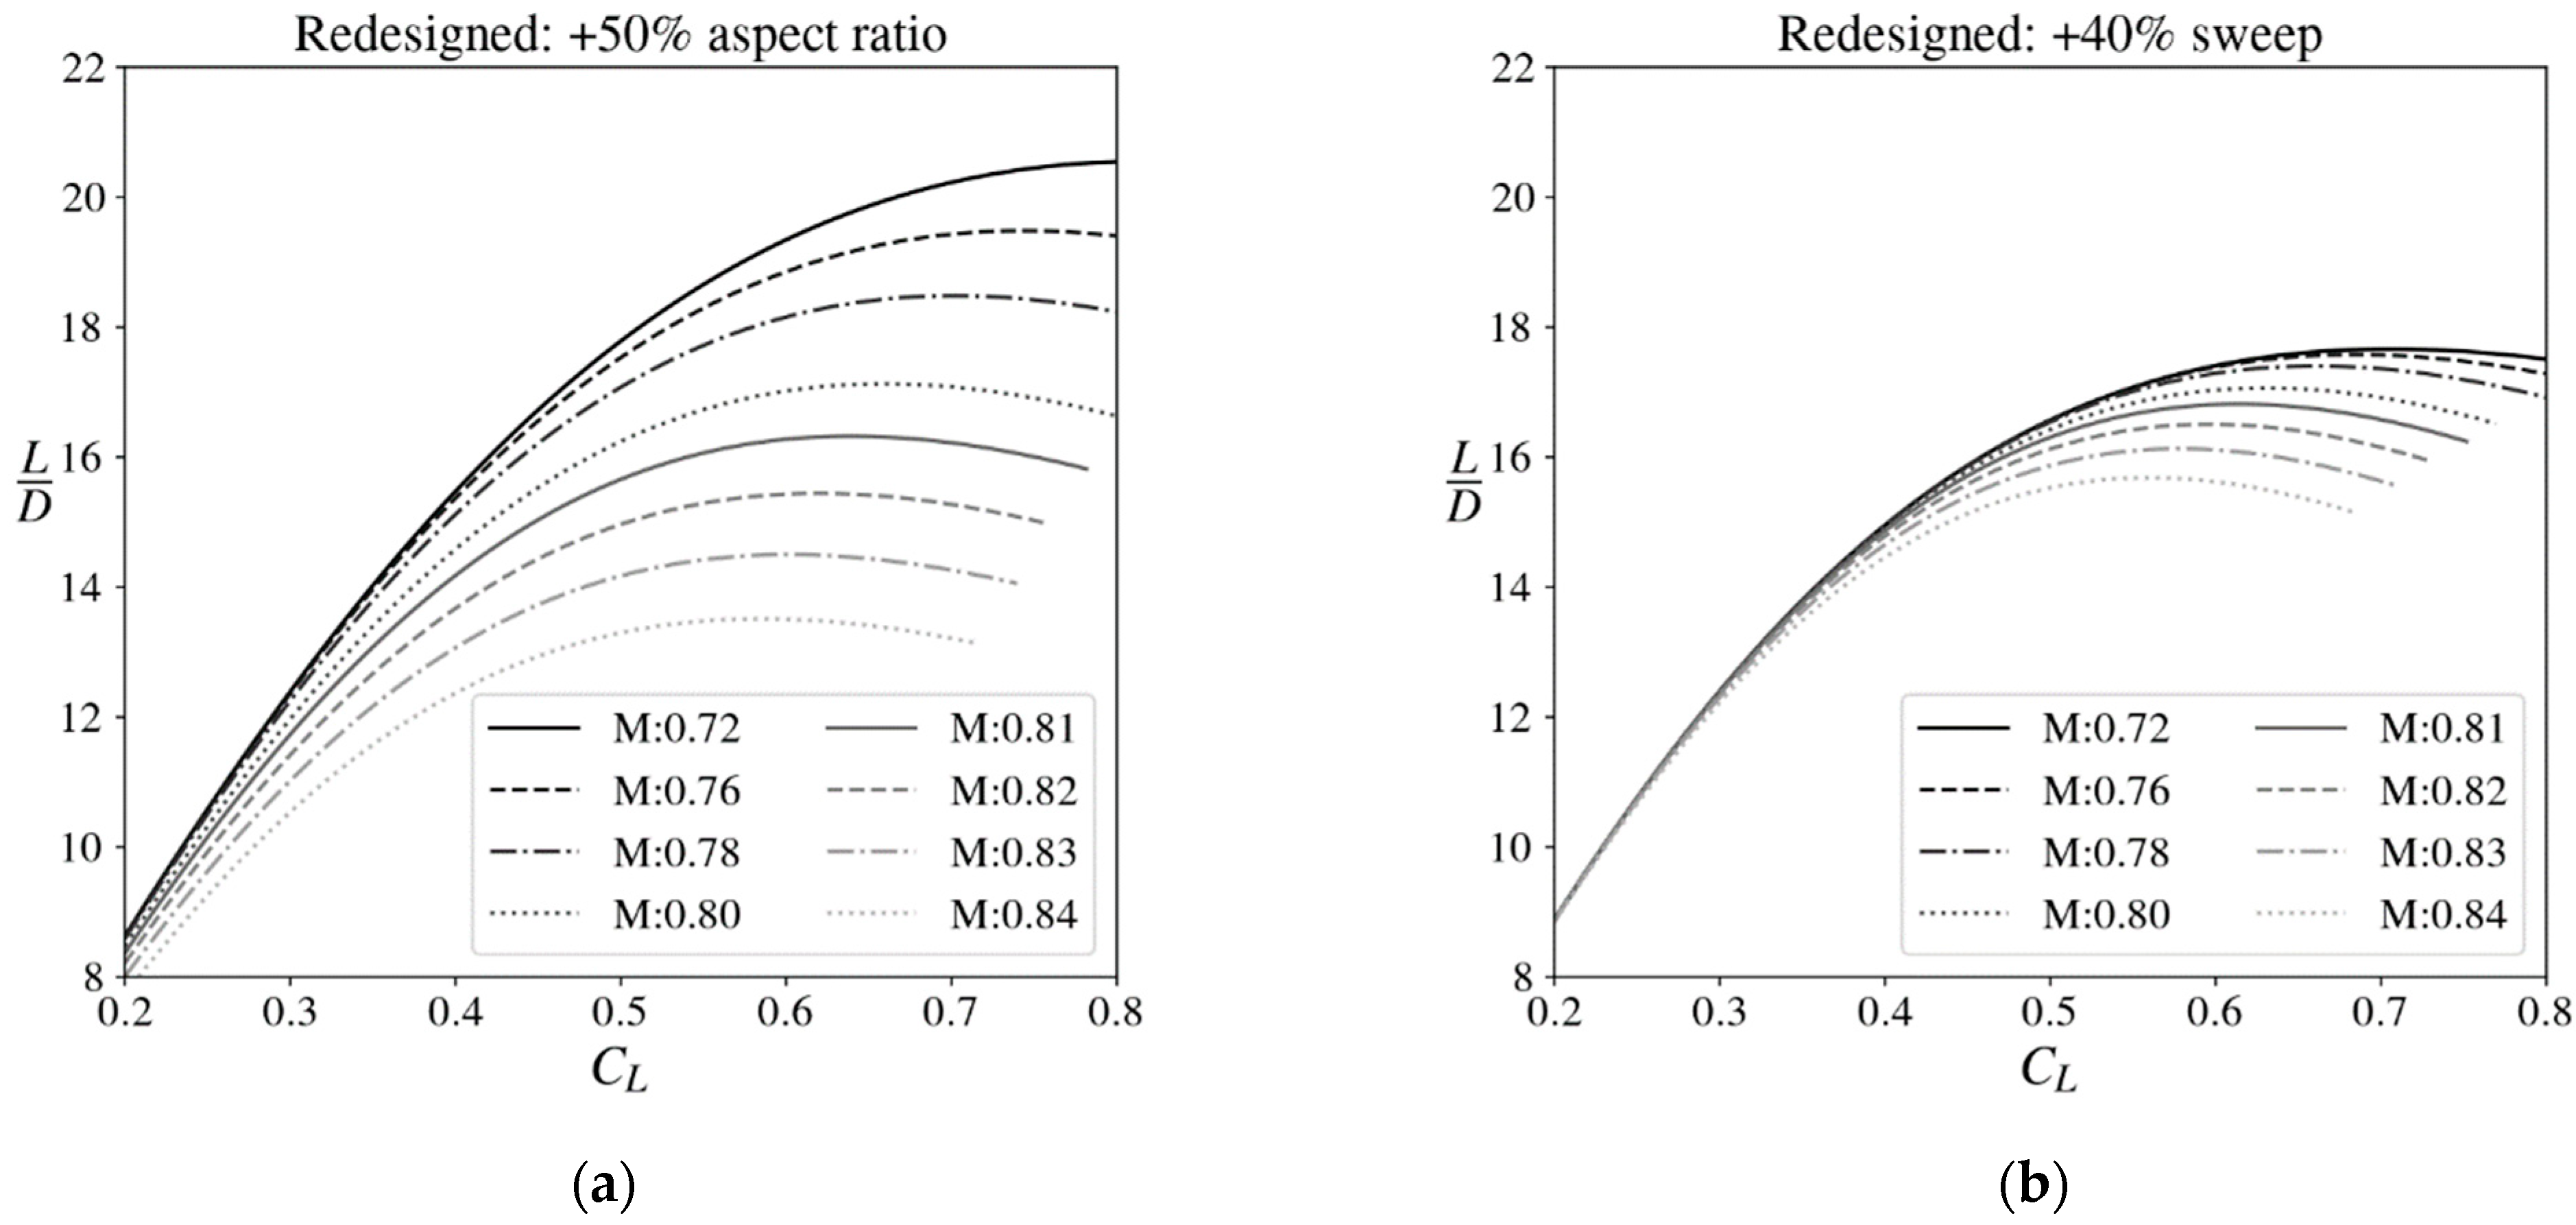
The drag polars generated by the model for two example aircraft with altered wing geometry are shown in Figure 8. The first plot demonstrates that a high aspect ratio leads to low induced drag, because the smaller wing tips reduce the size of tip vortices, leading to low at a high aspect ratio in (9). The latter plot demonstrates that higher sweep does not affect lift-drag values at low Mach numbers, but it does reduce compressibility effects by decreasing the component of wind-speed normal to the leading edge, shown by the decrease in critical Mach number as sweep increases in (12). High sweep is therefore particularly beneficial for aircraft that cruise at high Mach numbers, which typically operate at high altitude to maintain high-lift coefficient despite their high speed. This benefit for high-altitude aircraft will later be shown to be useful for designing low-contrails aircraft.
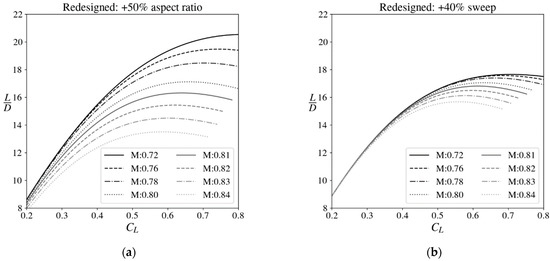
Figure 8.
Drag polars for two A320s with altered: (a) aspect ratio; (b) wing sweep.
2.2.2. Estimating the Weight of Redesigned Wings
Early estimates of wing weight are typically performed using an empirical formula for wing mass as a function of wing geometry. Raymer [31] emphasizes that “there are no “right” answers in weight estimation until the first aircraft flies”, but that a good approach is to calculate weights “using several different equations, and then select an average, reasonable result”. Here, three different methods are compared, and a reasonable average is used.
Raymer’s method (15) is a statistical model using data that “typify those used in conceptual design by the major airframe companies”. All quantities in (15) are in imperial units, with the value for dynamic pressure, q, taken with density given by the International Standard Atmosphere at a typical operating point of ~38,000 ft and Mach ~0.74. The ultimate load factor, ULF, represents the maximum load acceptable on an aircraft in units of total aircraft weight. Here, a typical value of 3.75 is used [21].
Torenbeek’s method (16) from [32] is based on estimating the mass of structural material required to withstand the root bending moment due to lift. The actual aircraft’s weight data were used to estimate the constant factors.
Civil Jet Aircraft Design provides a statistics-based model (17). The parameter R describes the effect of inertia relief, wherein acceleration relieves wing bending. This depends on wing weight, but the A320’s true wing weight is used here to avoid iteration. Fuel weight is excluded from the wing inertia relief calculation for retrofitted hydrogen aircraft, as they have no fuel in their wings.
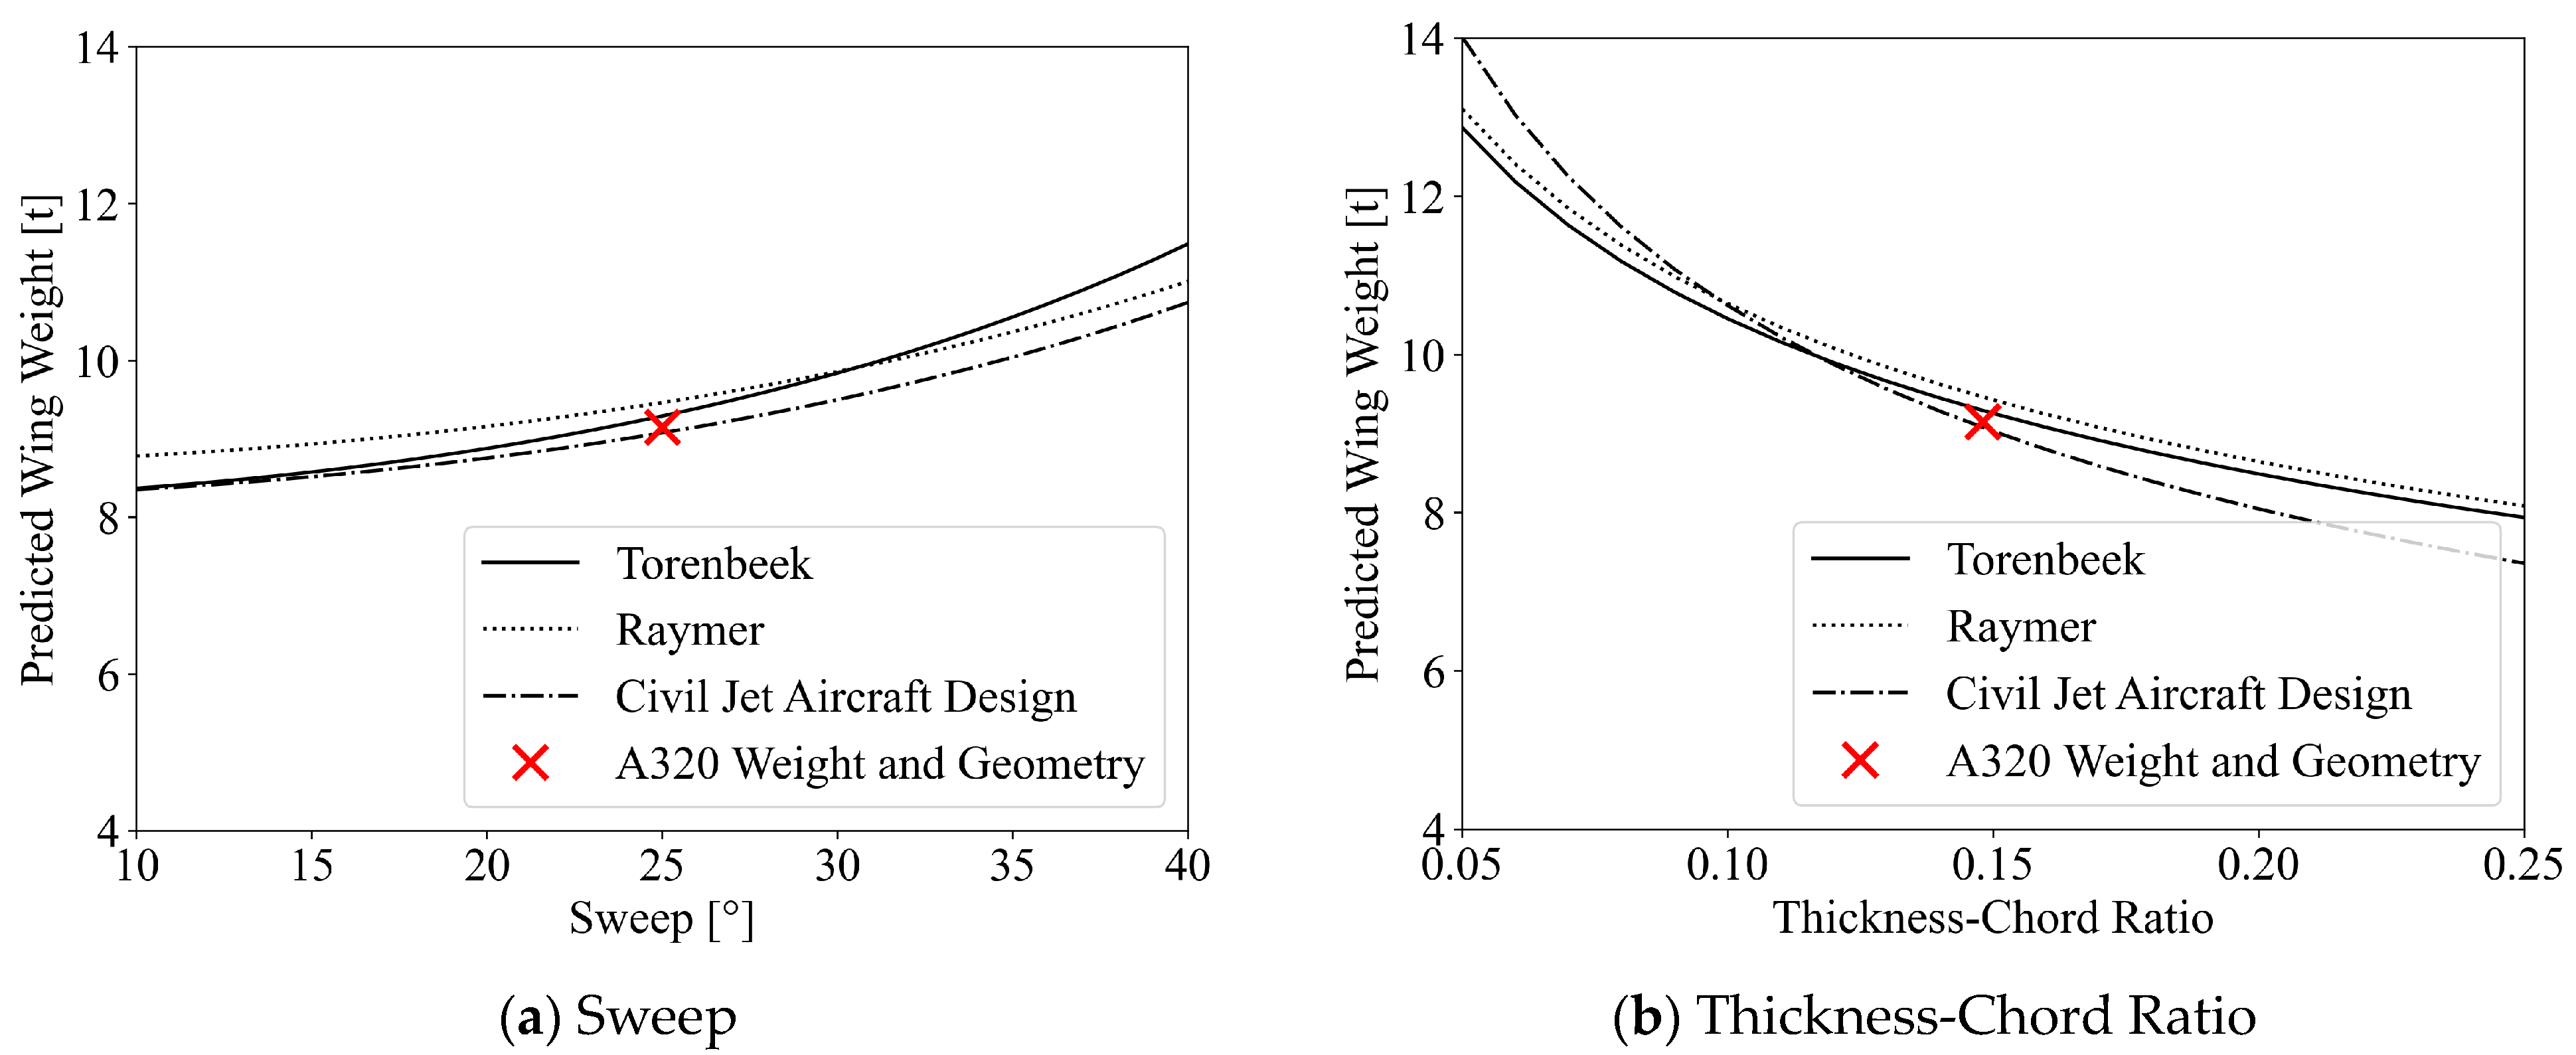
Figure 9 demonstrates that the three models generate similar results. Notably, all models predict decreasing wing weight with thicker wings for a given chord. The explanation from Gudmundsson [33] is that “a thick airfoil provides a large structural depth that accommodates a taller spar” which “brings down bending stresses in the spar caps and results in a lighter wing”.
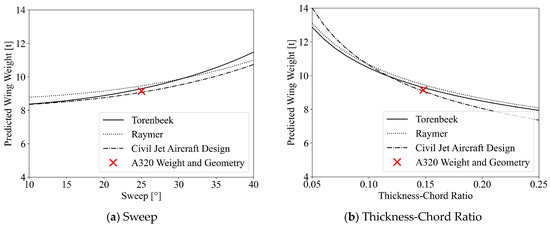
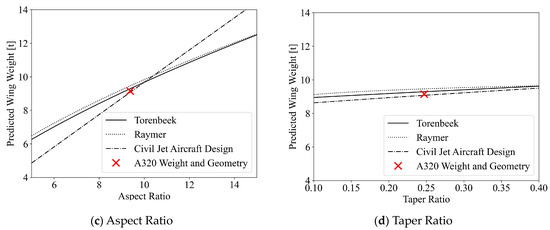
Figure 9.
Variation of wing weight with geometry for three mass estimation models, with A320 geometry [22] and wing weight indicated.
Table 4 demonstrates that the Civil Jet Aircraft Design model gave the smallest error on the A320’s actual 9.15 ton [34] wing weight. Despite this, it is considered the least reliable method for modeling redesigned wings, as it differed from the others by up to 25% when the aspect ratio was varied. Torenbeek and Raymer’s models, however, lead to almost identical results and are accompanied by a physics-based derivation. These are, therefore, the most suitable models. Henceforth, Torenbeek’s model, normalized to match the A320 at its base geometry, is used to estimate the change in mass caused by wing redesign.

Table 4.
Comparison of A320 wing mass estimates.
2.2.3. Modelling Hydrogen Aircraft
Sizing Liquid Hydrogen Tanks
Liquid hydrogen has a lower volumetric energy density than kerosene, requiring larger fuel tanks which cannot fit within conventional aircraft wings. The only suitable place for liquid hydrogen tanks in a simple A320 retrofit is the fuselage. Optimal liquid hydrogen storage tanks would be spherical to minimize the surface-area-to-volume ratio and, hence, limit heat transfer and evaporation. Here, cylindrical tanks with hemispherical heads are considered as a compromise between thermodynamics, structure, and efficient use of space. The focus is on retrofitting existing airplane designs with hydrogen tanks, so non-integral tanks placed inside the fuselage will be used. Integral tanks could be used as part of the aircraft structure and are hence more mass-efficient but necessitate extensive redesign.
The American Society of Mechanical Engineers (ASME) Boiler and Pressure Vessel code [35] is used for the structural design, providing minimum thickness requirements for longitudinal stress, circumferential (hoop) stress, and corrosion allowance. For all tanks considered here, the constraining thickness was one of the latter two.
Hydrogen boils at 20.30 K [36], so to store it without heavy cooling systems, it must be well-insulated. Even so, there will be some heat transfer and hence evaporation, leading to evaporated hydrogen which is no longer usable. This must be modeled, so that the required amount of excess hydrogen can be modeled. Heat transfer from the tanks was assumed to be dominated by natural convection from a fixed-temperature surface. The rate of heat transfer, and hence the amount of fuel evaporated, depends on the tank thickness. The process of defining tank geometry is iterative as tank thickness also depends on the total amount of fuel required (including that which will evaporate). A compromise between long elongated tanks (which have a much higher surface-area-to-volume ratio and therefore more evaporation, but easily fit in the plane) and spherical tanks was found by applying an algorithm which tries to fit the required quantity of fuel into the available space while minimizing tank and boil off fuel mass, by using several different tanks if required and iterating through different tank diameters to identify the one that minimizes tank volume while providing the required amount of fuel for the input design range.
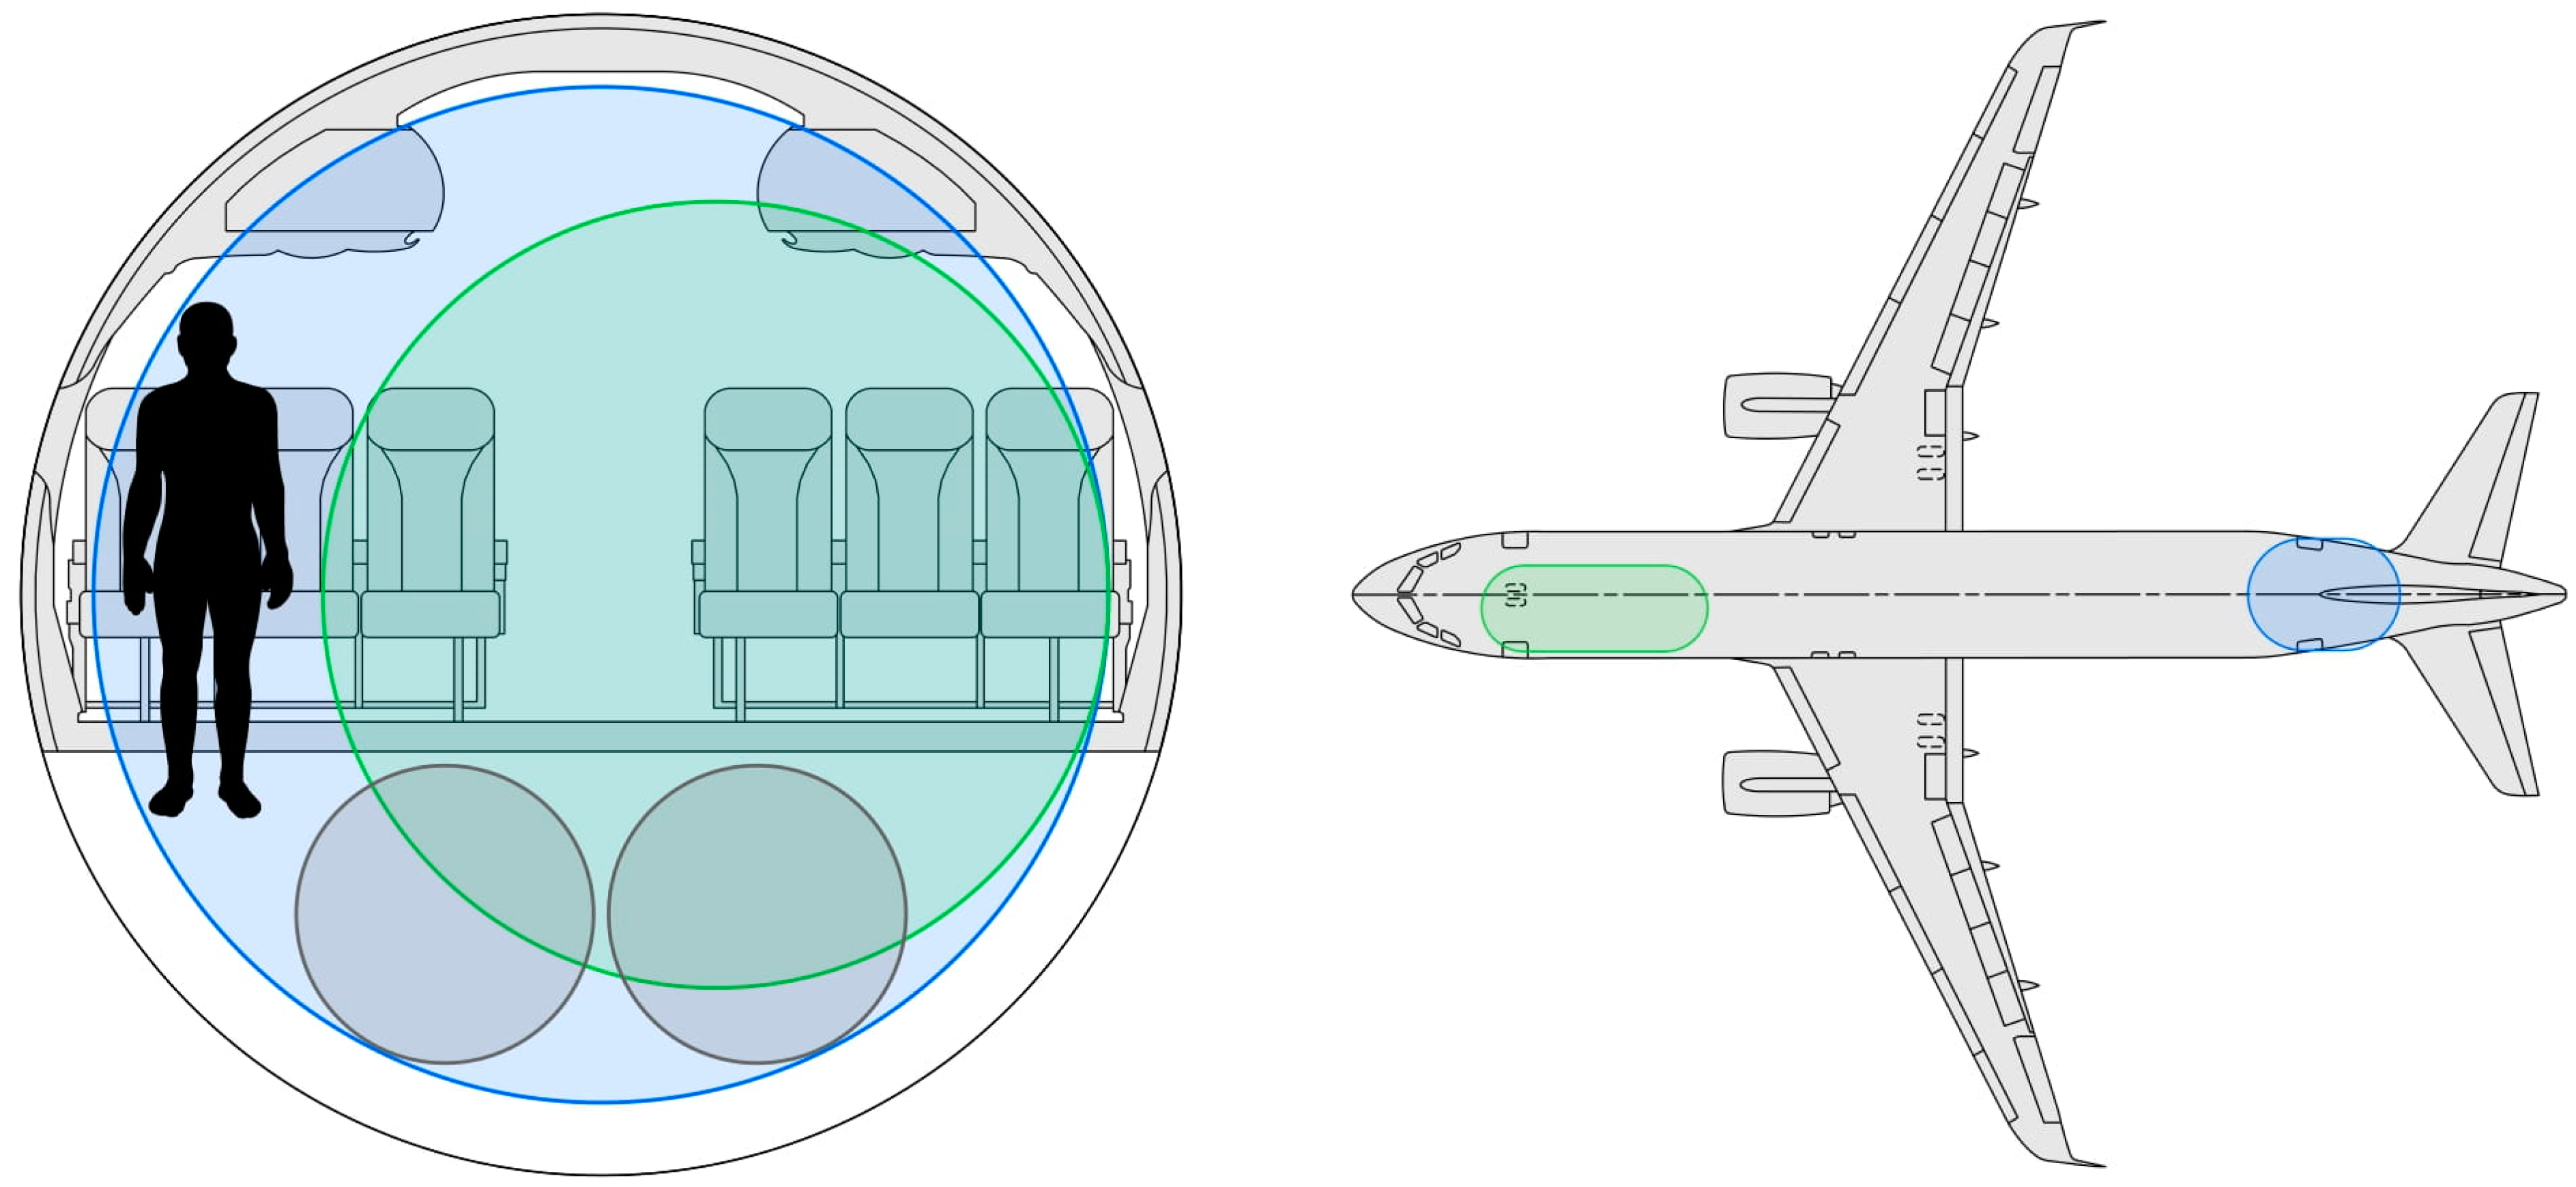
The liquid hydrogen was split between two tanks. The first was placed towards the aft of the aircraft, where the outer diameter of the tank approaches the fuselage diameter. The second was placed between the cockpit and passenger cabin, where the outer diameter is reduced to allow crew access alongside it. Storing fuel in the aircraft hold was also considered. However, the reduced outer diameter of the tanks proved too restrictive for a mid-range aircraft, even when several were placed alongside one another or a wide tank with an elliptical cross-section was used.
The combined length of the hydrogen tanks was subtracted from the length of the cabin to give a new cabin length. The corresponding number of rows of seats in the cabin was reduced, assuming a seat pitch of 29 inches for the A320. The lower capacity enabled the front toilet and galley to be removed, allowing for two extra rows of seats.
The aft tank is more space efficient since it stores more fuel per unit length, meaning less cabin space is lost for a given mass of liquid hydrogen storage. However, the center of mass of the aircraft cannot shift significantly during a flight as fuel is drained from the tanks. Any significant shift would result in excessive trim drag and potential instability. Therefore, the useful liquid hydrogen (excluding boil-off) was split evenly between the tanks. The revised cabin layout and tank placement are demonstrated in Figure 10. The aft tank is positioned far from the center of lift, potentially shifting the weight balance towards the rear. To address this, the wings of such a hydrogen aircraft may need to be positioned further back along the fuselage. Further work is required to assess the impact of these changes on safety: research [37] suggests in-fuselage tanks would be less likely to rupture, but more hazardous if they do.
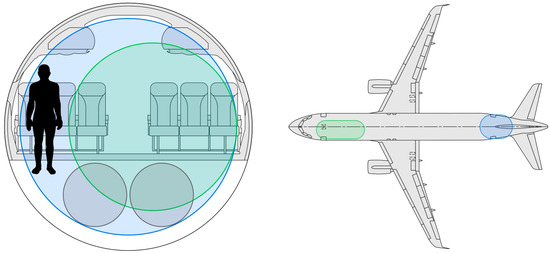
Figure 10.
Scale drawing [38,39] of the cryogenic tank placement in the fuselage of an Airbus A320 with an example 3700 km range. The aft tank is indicated in blue, and the tank between the cabin and cockpit is in green. The two smaller gray circles illustrate the size of tanks that could be stored in the hold area.
Effect of Hydrogen on Weight Distribution
The operating empty weight of the airframe has increased due to the cryogenic tanks’ dry weight. The corresponding reduction due to removed floor panels and seats was not considered due to a lack of available weight data. However, this will be partly compensated by new systems for hydrogen such as fuel lines and heat exchangers.
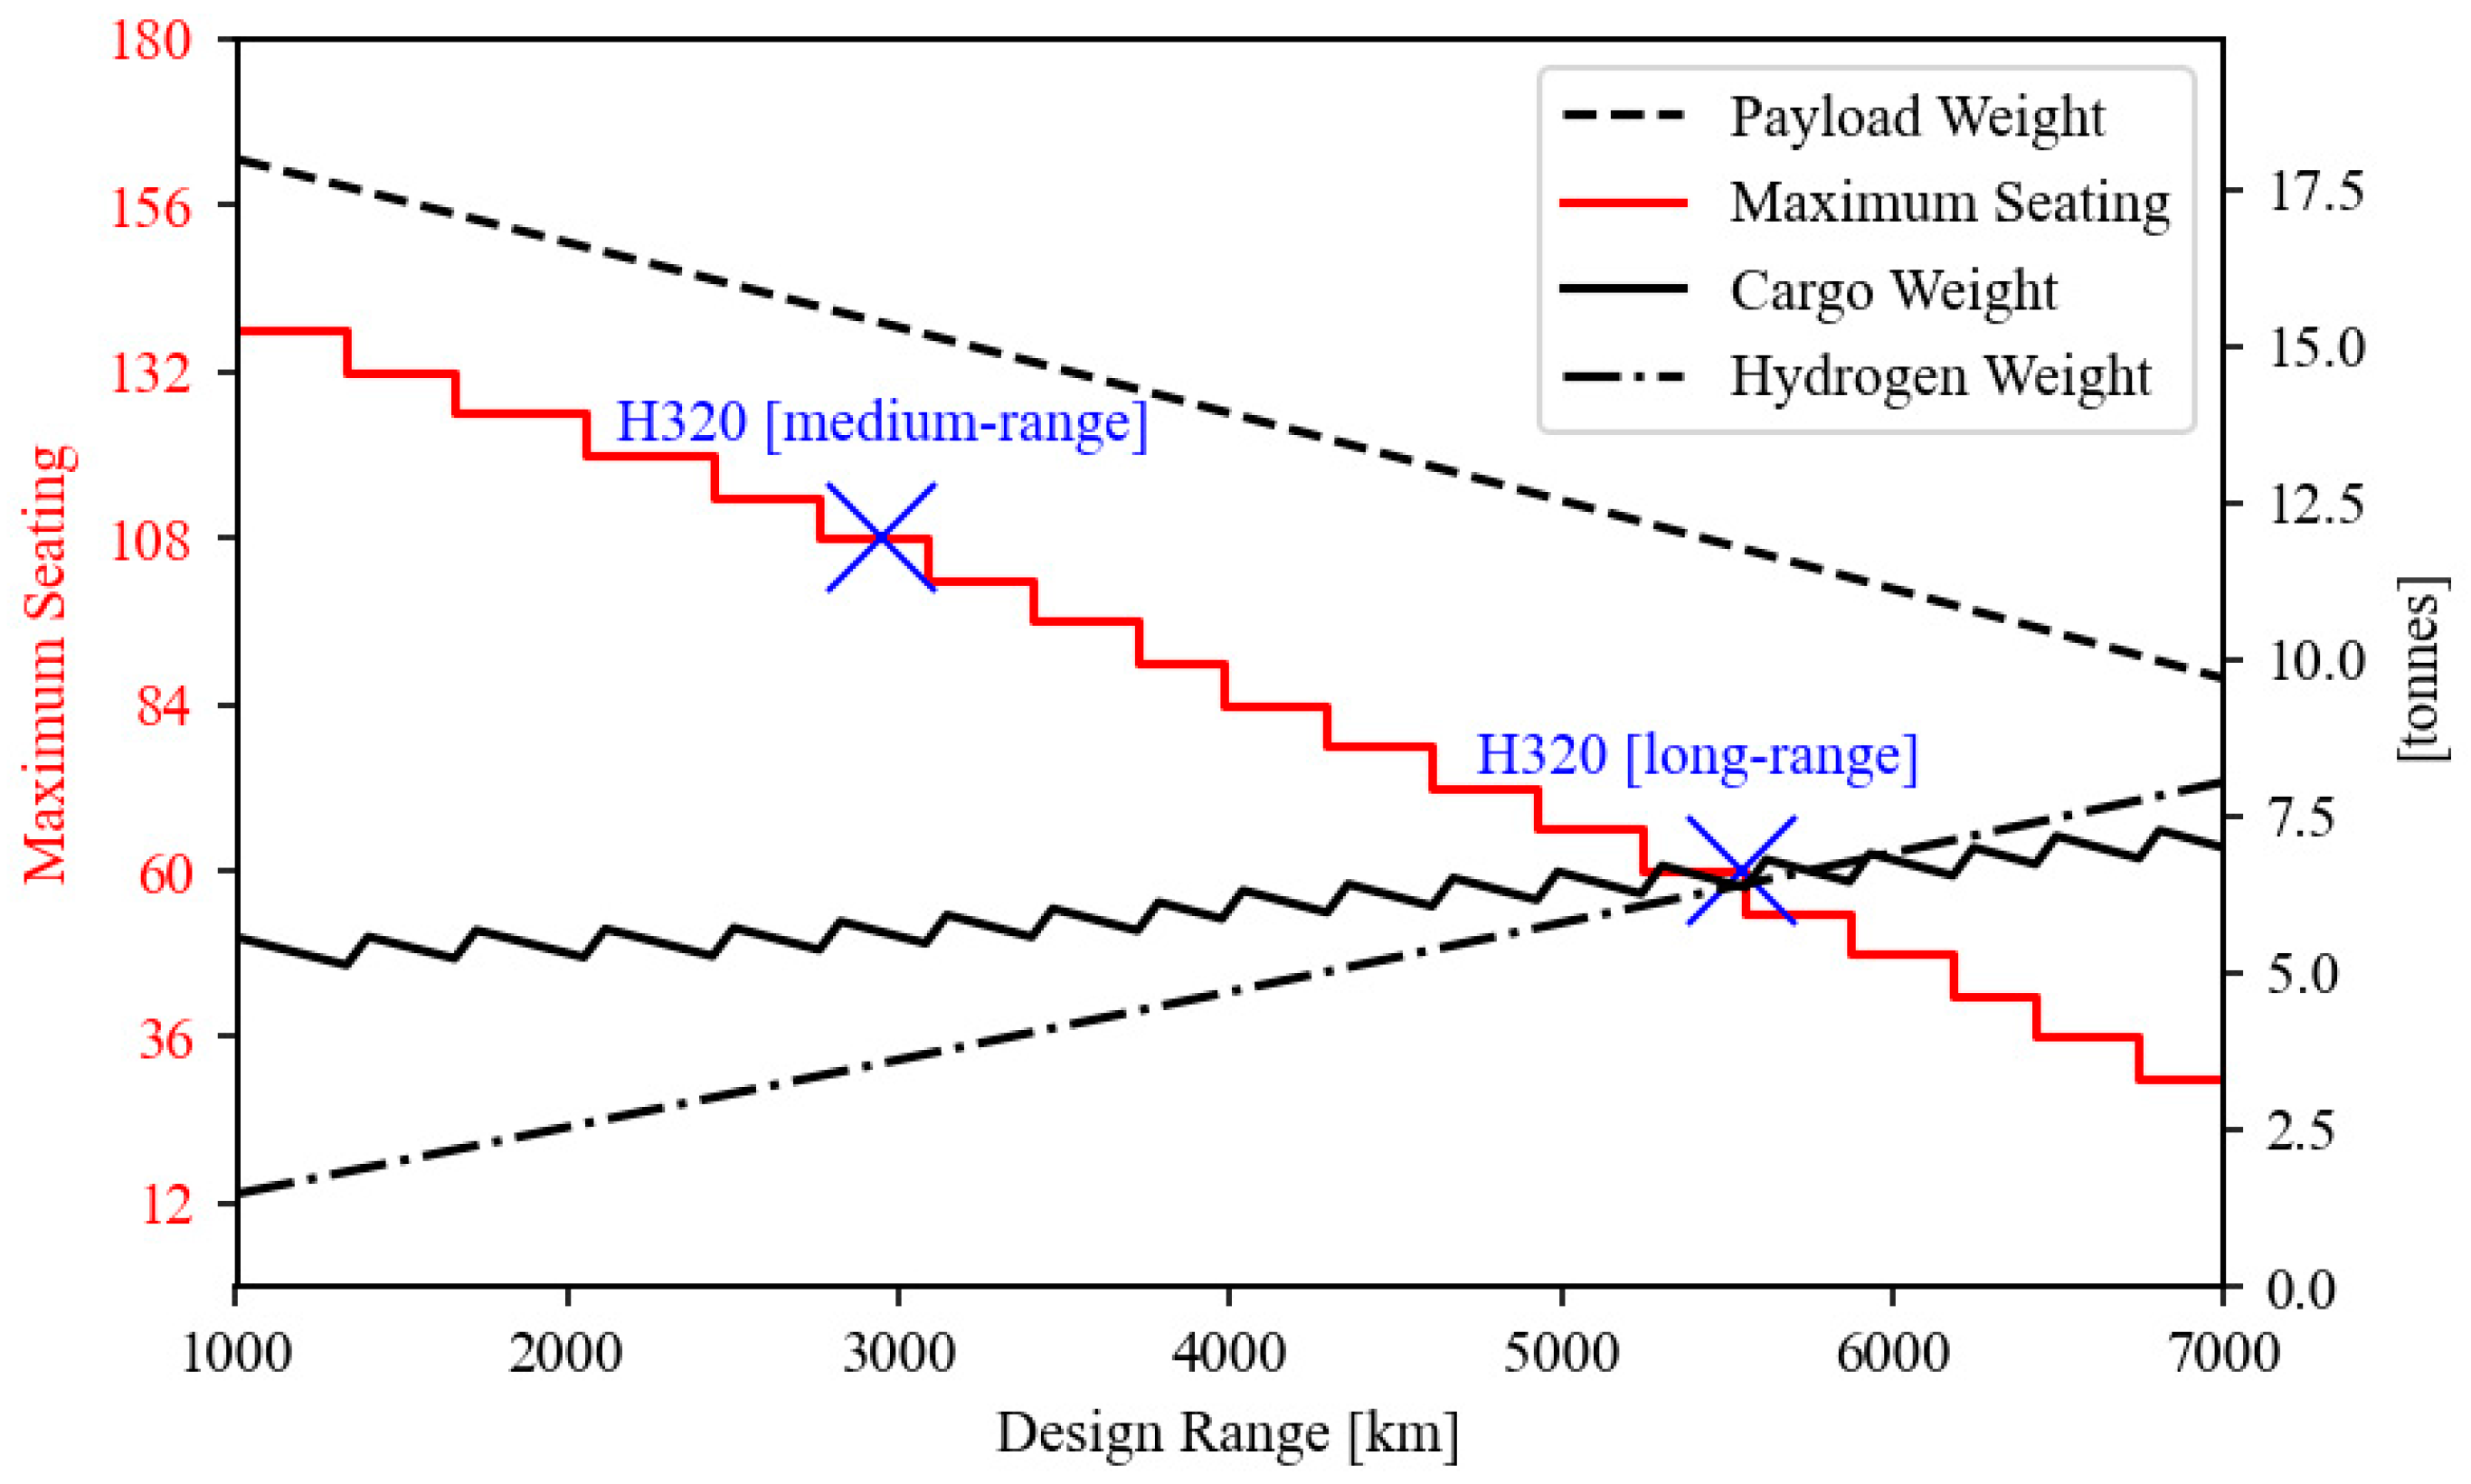
This hydrogen tank model was used to demonstrate the effect of varying design range on weight distribution, as in Figure 11, with seating capacity falling in steps of six as seats are removed to allow for larger fuel tanks. Weight-range diagrams are shown in Figure 12 for two example aircraft designed for the range indicated by the crosses in Figure 11. The “medium-range” aircraft is used henceforth as it achieves a reasonable passenger count (40% less than the A320) at a maximum range that can complete the majority of A320 flight missions [40]. This reduction in seating capacity potentially has large implications for commercial operations, though it will be shown in the next section that similar fuel burn per passenger-km can be achieved by redesigning to optimize the airfoil for hydrogen-powered operation at low-contrails altitudes. The weight-range diagrams indicate that loading any amount of fuel reduced the amount of cargo the aircraft could carry. This is because fuel is not stored in the wings, so this aircraft behaves, such as a conventional airplane carrying no fuel, with negligible downward force acting on the wing as relief against the lift-induced wing bending moment. Its take-off weight is therefore limited to its maximum zero-fuel weight (MZFW) by the maximum wing bending moment.
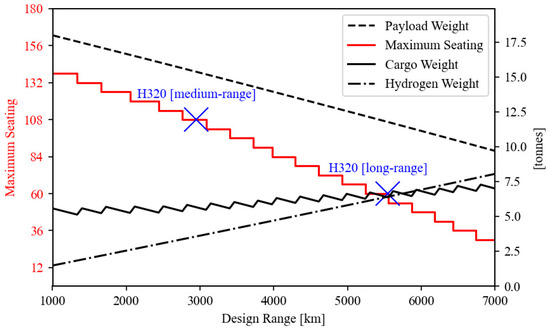
Figure 11.
Variation of seating capacity, fuel weight and maximum cargo weight with design range for an H320 at a 13 km altitude. The H320 designs shown in Figure 12 are indicated with crosses.

Figure 12.
Weight-range diagrams for two H320 designs, showing the total aircraft weight breakdown at Mach 0.75. They are shown at their optimal ~13 km cruise altitude for minimum fuel burn.
Effect of Hydrogen on Operating Point and Contrails
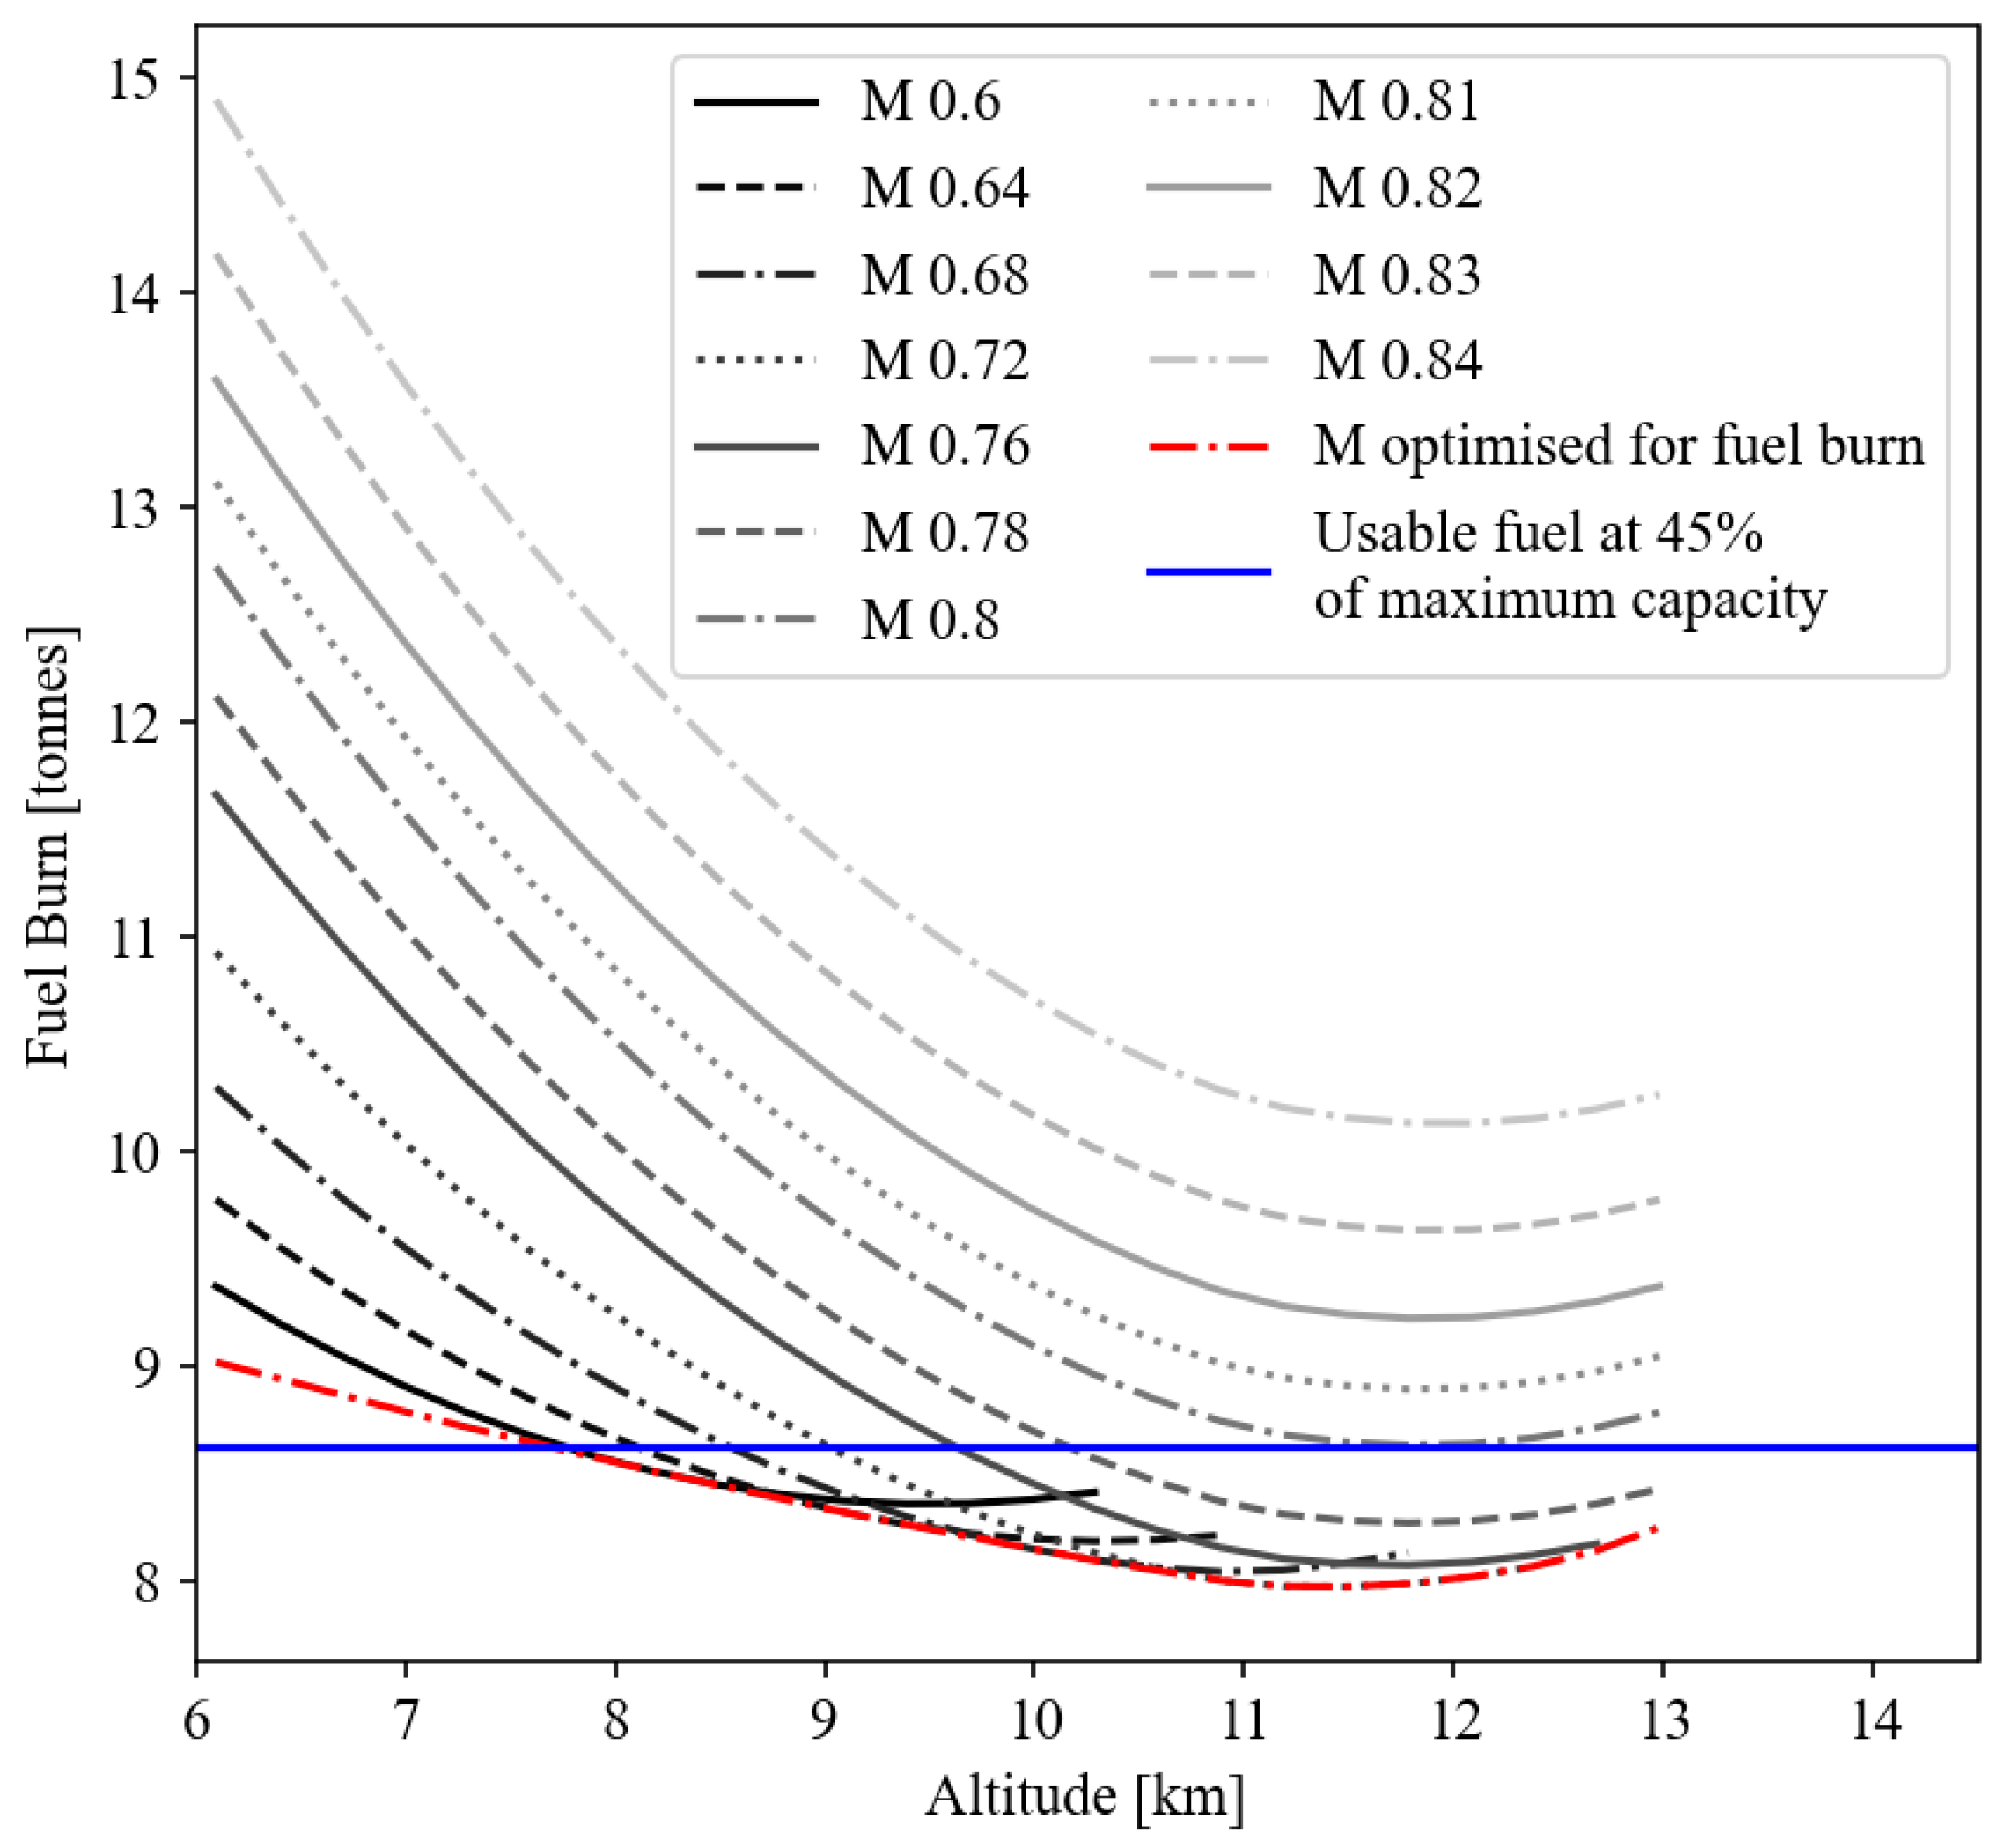
Hydrogen’s low gravimetric energy density increases the operating point stability: the weight of liquid hydrogen required to produce a fixed amount of thrust is typically about 35% [41] of the corresponding weight of kerosene, so fuel weight is lower in hydrogen aircraft. For an A320 operating at the typical range of ~2800 km, about eight tons of fuel is burned (as in Figure 13), which is a tenth of the aircraft’s maximum take-off weight, leading to ~10% variation in the lift coefficient throughout the flight mission as fuel is burned. For a H320, however, this would correspond to a variation of only ~3.5%. This would reduce the required variation in altitude (cruise-climb to fix lift coefficient) or Mach number (deceleration at cruise to fix lift coefficient) and enable flight at a nearly constant altitude, allowing more flexible altitude control to avoid regions where contrails will persist.
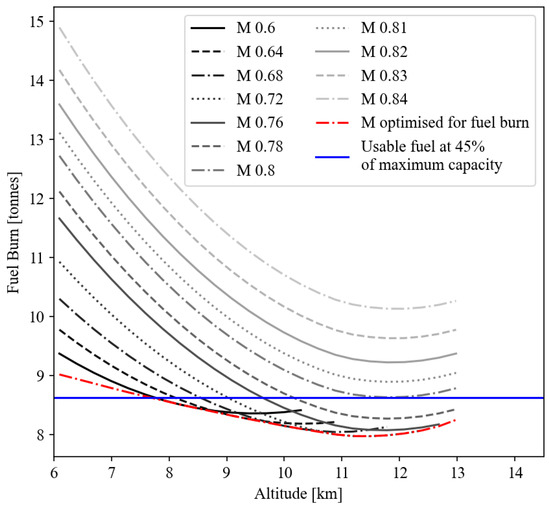
Figure 13.
Fuel burn against cruise altitude for an A320 operating a 2800 km flight mission at 45% of its maximum fuel capacity so that it can operate this range at minimum weight.
Despite retrofitted hydrogen aircraft having their maximum take-off weight limited to their MZFW, the H320 is overall volume-limited, not weight-limited, because replacing passenger capacity due to low-density hydrogen tanks in the fuselage reduces the aircraft weight significantly, and so it is unlikely to operate at MZFW. The reduction in MTOW to MZFW corresponds to about a 20% decrease in total weight and lift required from the aircraft wings. This leads to a 20% lower lift coefficient at a given altitude and Mach number, which is beneficial for contrail avoidance because it allows the aircraft to operate in air that is 20% less dense without reaching a higher lift coefficient, enabling operation at high altitudes without stall. The next section quantifies this shift to higher altitude and its impact on contrails. The trade-offs between fuel economy and contrail persistence for both hydrogen and conventional aircraft are then compared. The same engine performance is assumed for hydrogen aircraft; although a combustor burning hydrogen would take a slightly different form, ultimately it could supply hydrogen at a rate which gives the same combustor outlet temperature.
3. Results and Discussion
3.1. Performance of Redesigned Hydrogen Aircraft
3.1.1. Modeling Aircraft Fuel Burn and Contrails
Here, the aerodynamics and weight models from the previous section are used to estimate the overall aircraft performance. The dependence of minimum-achievable fuel burn on altitude is then determined for various redesigned hydrogen aircraft operating a typical A320 flight mission, so that the trade-offs between fuel economy and contrails may be assessed across a range of altitudes. The formula used to assess aircraft fuel burn is the Breguet Range Equation (18). The overall efficiency term is calculated at the given operating point using the simple turbofan model described in Appendix A.
Minimum fuel burn at a given range is achieved by maximizing H. However, since overall efficiency and lift-drag ratio vary throughout the flight mission, fuel burn for a given mission must be calculated by breaking the flight down into stages of quasi-steady operating points and summing the fuel burn contributions due to each stage. The model used here iterates over 20 stages per flight mission. Additional steps would alter the total by less than 1%.
The standard mission range considered here is ~2800 km, as this is among the A320’s modal operating ranges [40]. The fuel burn at this range is calculated for a range of altitudes and Mach numbers using (19) and plotted in Figure 13. A constant Mach number and altitude are assumed throughout the mission so that the effect of each can be shown independently, though in reality a cruise-climb strategy would be used to maintain optimum lift-drag ratio as weight reduces. The minimum fuel burn at each altitude is shown in red, achieved by operating at the Mach number, which maximizes the average H during the flight. The maximum altitude shown at each Mach number is the aircraft’s aerodynamic ceiling, which occurs when the lift coefficient becomes sufficiently high that safe operation is impossible because accelerating would result in flow separation and shock waves that reduce lift, while decelerating would result in such a high required lift coefficient and angle-of-attack that the aircraft would stall. In this case, the aircraft is already operating with such a low fuel loading (45% of the maximum) that it cannot afford to remove any more fuel to lift its aerodynamic ceiling. Therefore, the 13 km upper altitude limit shown in Figure 13 is the highest the A320 will be able to operate for contrail-reduction purposes on this typical flight mission.
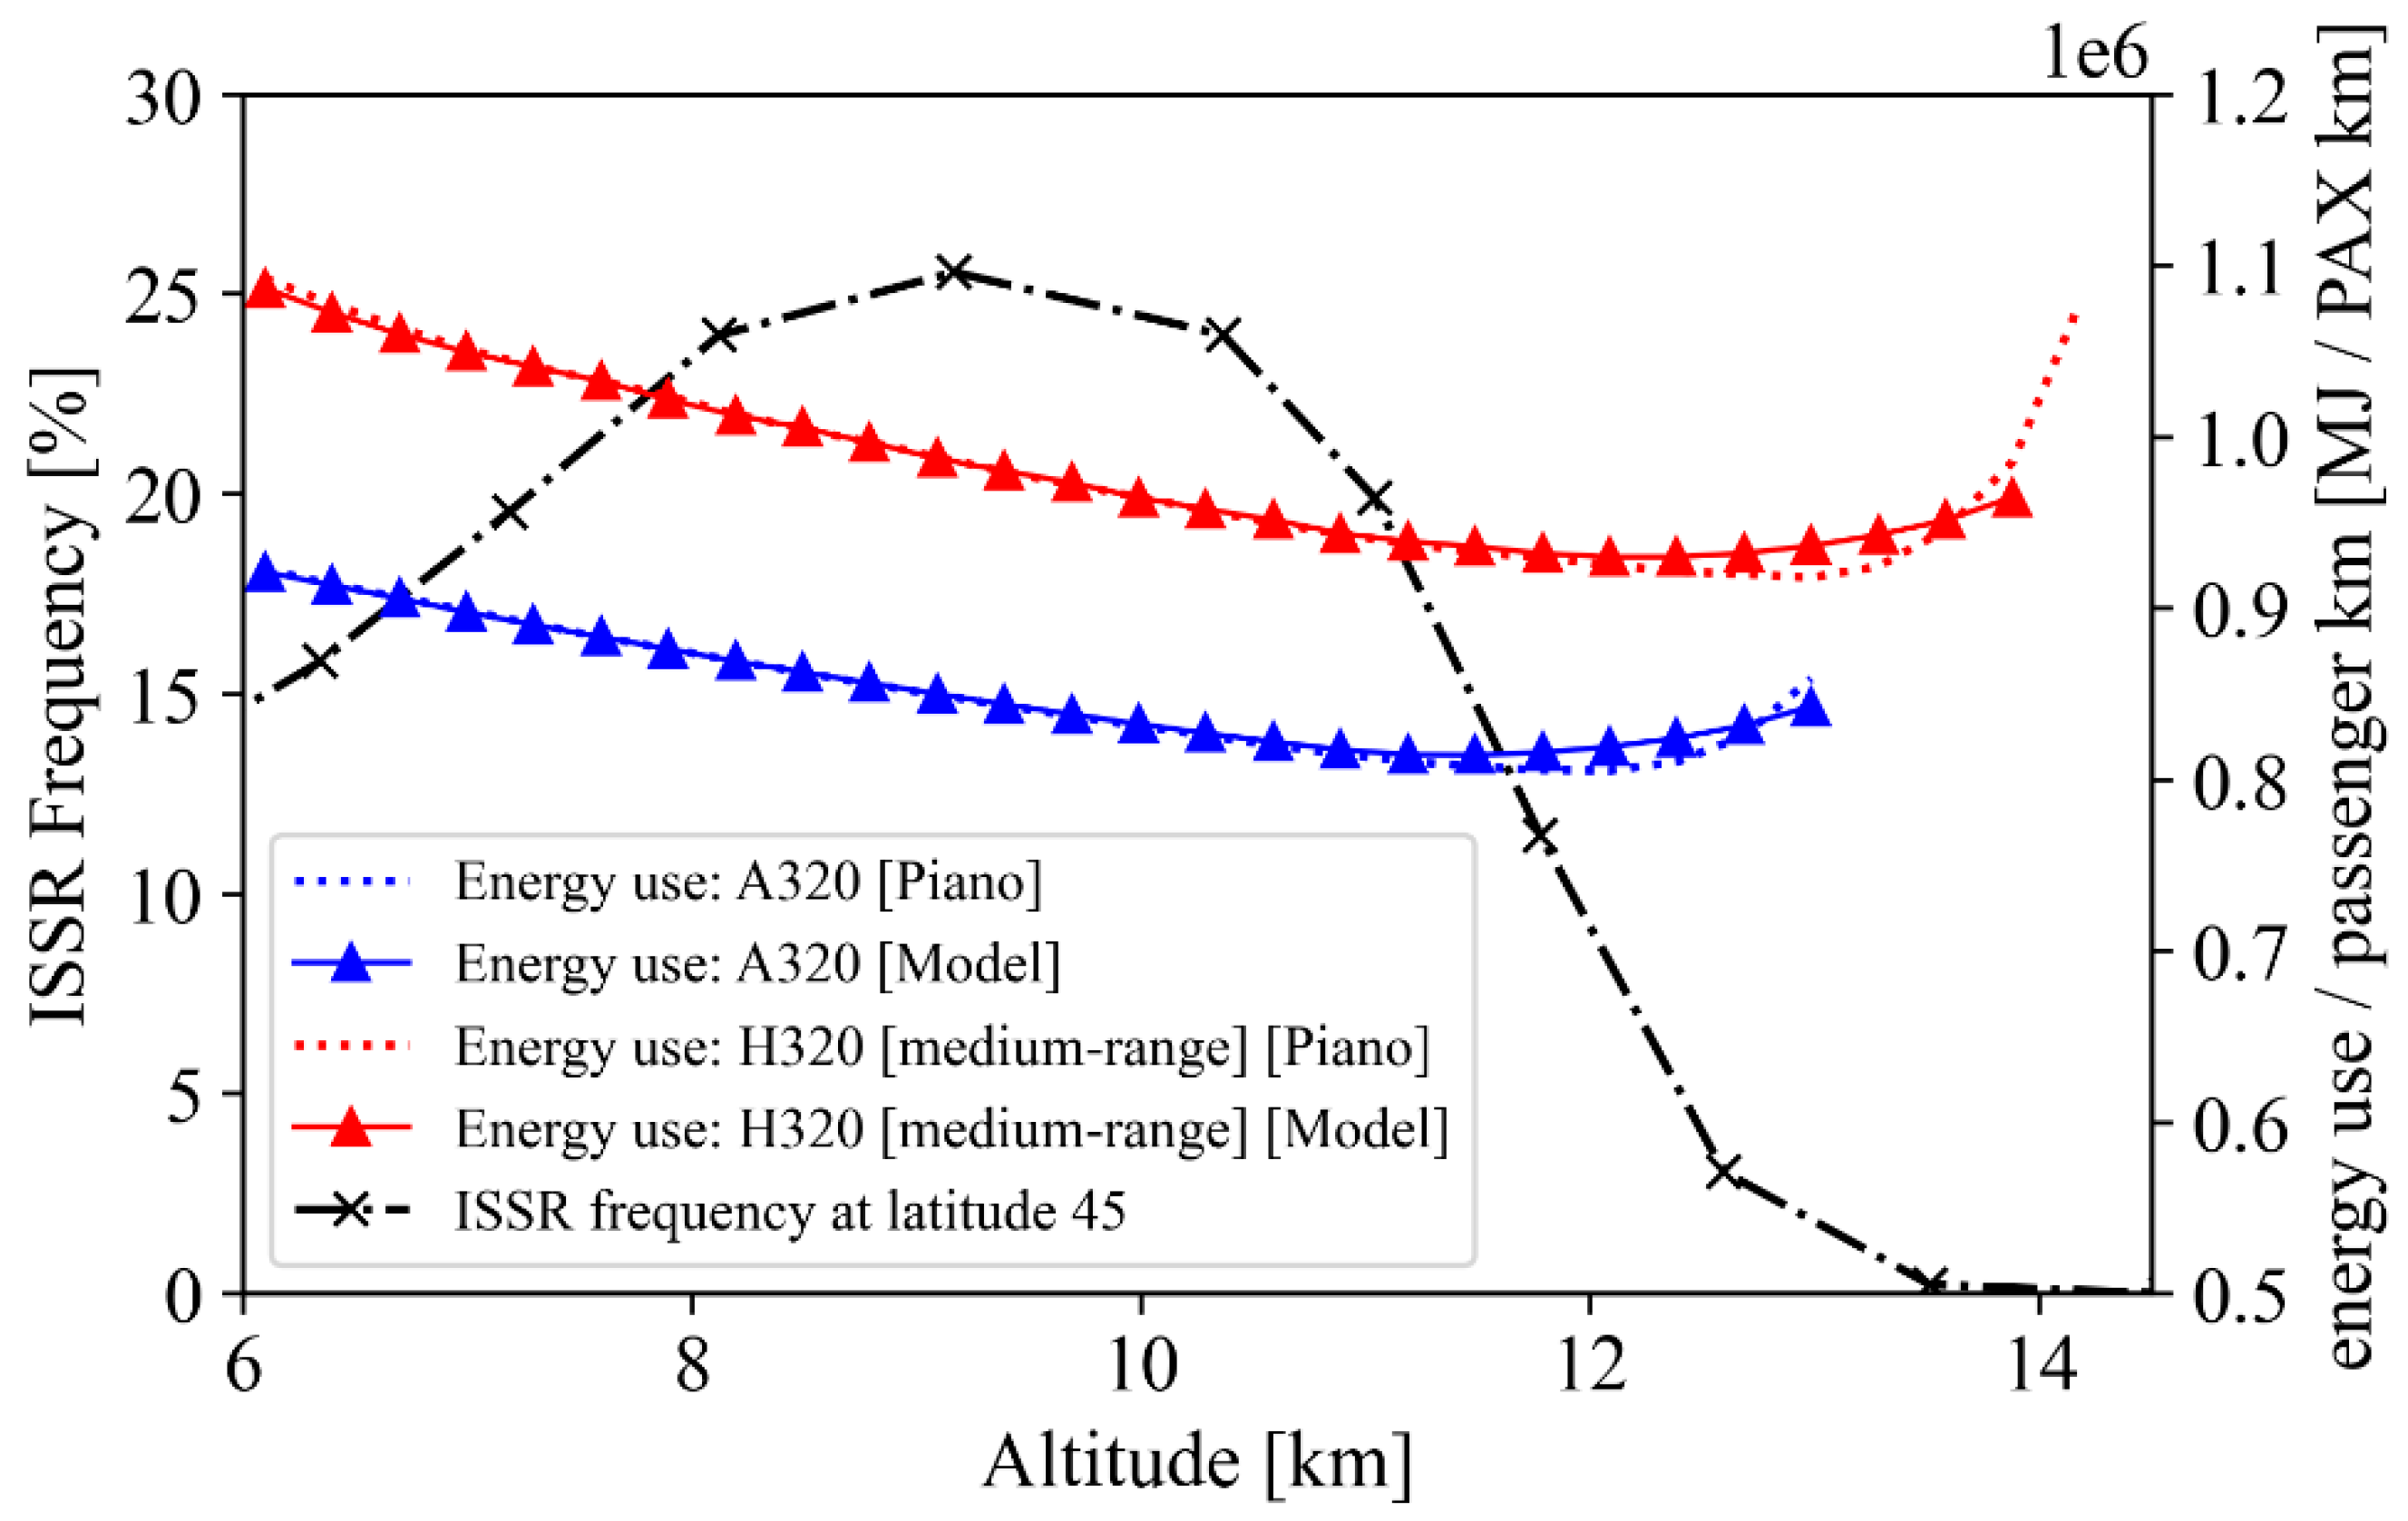
Overall energy use and contrail persistence probability for the A320 and H320 are shown in Figure 14. The lighter weight of the hydrogen aircraft, as discussed in the previous section, increases the altitude required for a given lift coefficient by about 2 km, which enables operation with reduced contrail persistence. At this typical latitude, an H320 operating at a 13.5 km altitude leads to a very low ISSR frequency of about 1%, with about 15% higher energy use per passenger-km than the A320. Flying even higher would achieve a greater reduction in contrails, with negligible contrail persistence above altitudes of about 14 km in non-equatorial latitudes. Notably, the A320’s average ISSR frequency may also be reduced to about 3% by operating at 12.5 km, near its maximum altitude (assuming the A320 is not above 45% fuel capacity, as this would be above the maximum operating altitude of a fully loaded A320).
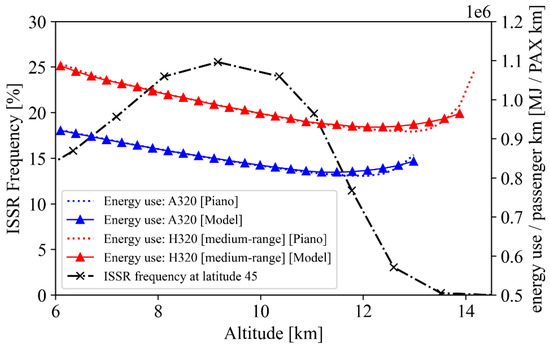
Figure 14.
Energy use per passenger-km vs. cruise altitude for the H320 and A320 on a 2800 km flight mission. The A320 is at 45% of its maximum fuel loading, which is the minimum required for this range.
3.1.2. Modeling a Hydrogen Aircraft for Best Performance with Zero Contrails
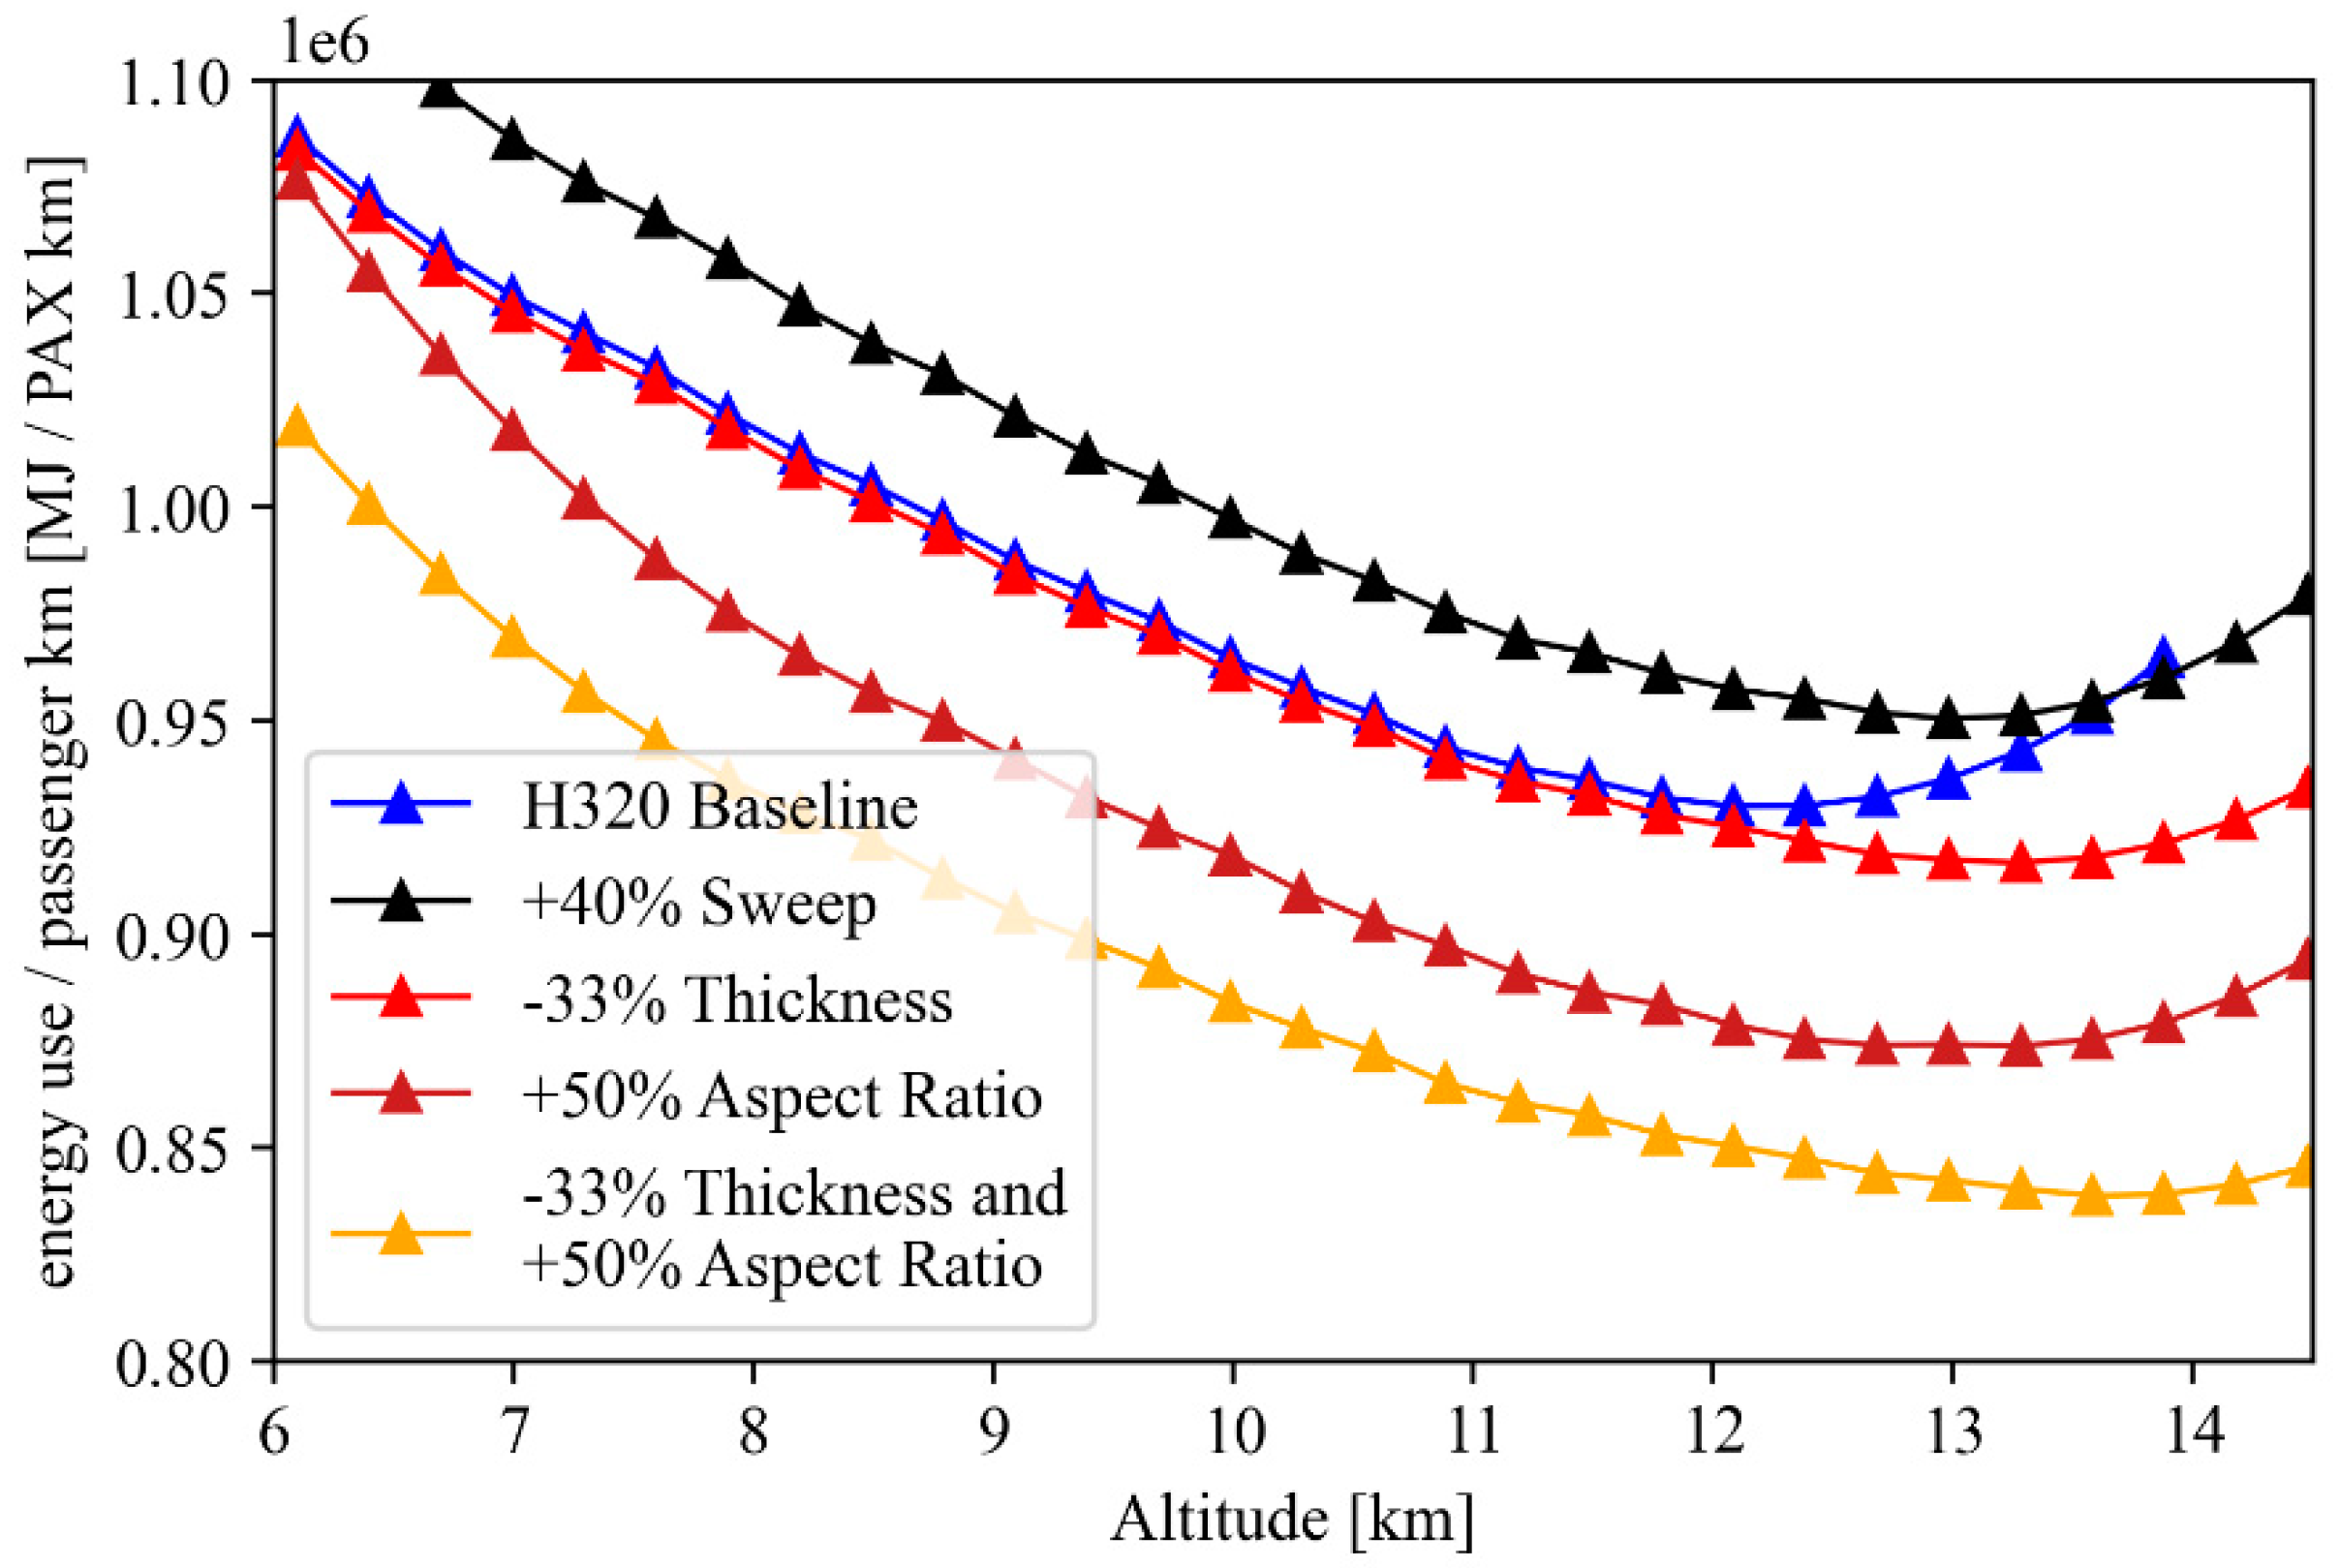
Each of the wing alterations that were shown in Figure 8 that lead to improved drag polars also increased the aircraft’s wing weight. In Figure 15, the net effect of these competing effects is assessed. This shows that increasing the aspect ratio by about 50% causes a 10% reduction in energy use despite the heavier wing weight because it leads to a high lift-drag ratio at all lift coefficients and Mach numbers. The optimal geometry shown in Figure 15 represents a combination of high aspect ratio and thinner wings (i.e., with lower thickness-chord ratio due to decreased thickness at constant chord, as described in Section 3). This was more effective than adding sweep-to-high aspect ratio wings because further sweep increased the structural weight required with no benefits except at very high altitudes. Low thickness, on the other hand, also reduces the zero-lift drag coefficient, so that it could decrease fuel burn at all altitudes. This H320 with a 50% higher aspect ratio and 33% thinner wings is taken as an example of an effective design for high-performance flight at low-contrails altitudes and is hereafter referred to as the zero-contrails H320 (H320-ZC).
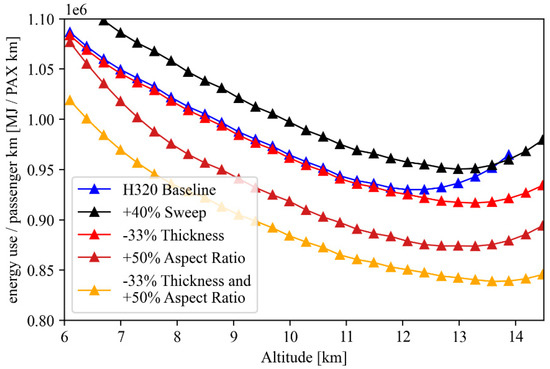
Figure 15.
Energy use per passenger-km against cruise altitude for several H320 wing redesigns.
3.2. Discussion of the Zero Contrails Hydrogen Aircraft Design
3.2.1. Contrails and Energy Use
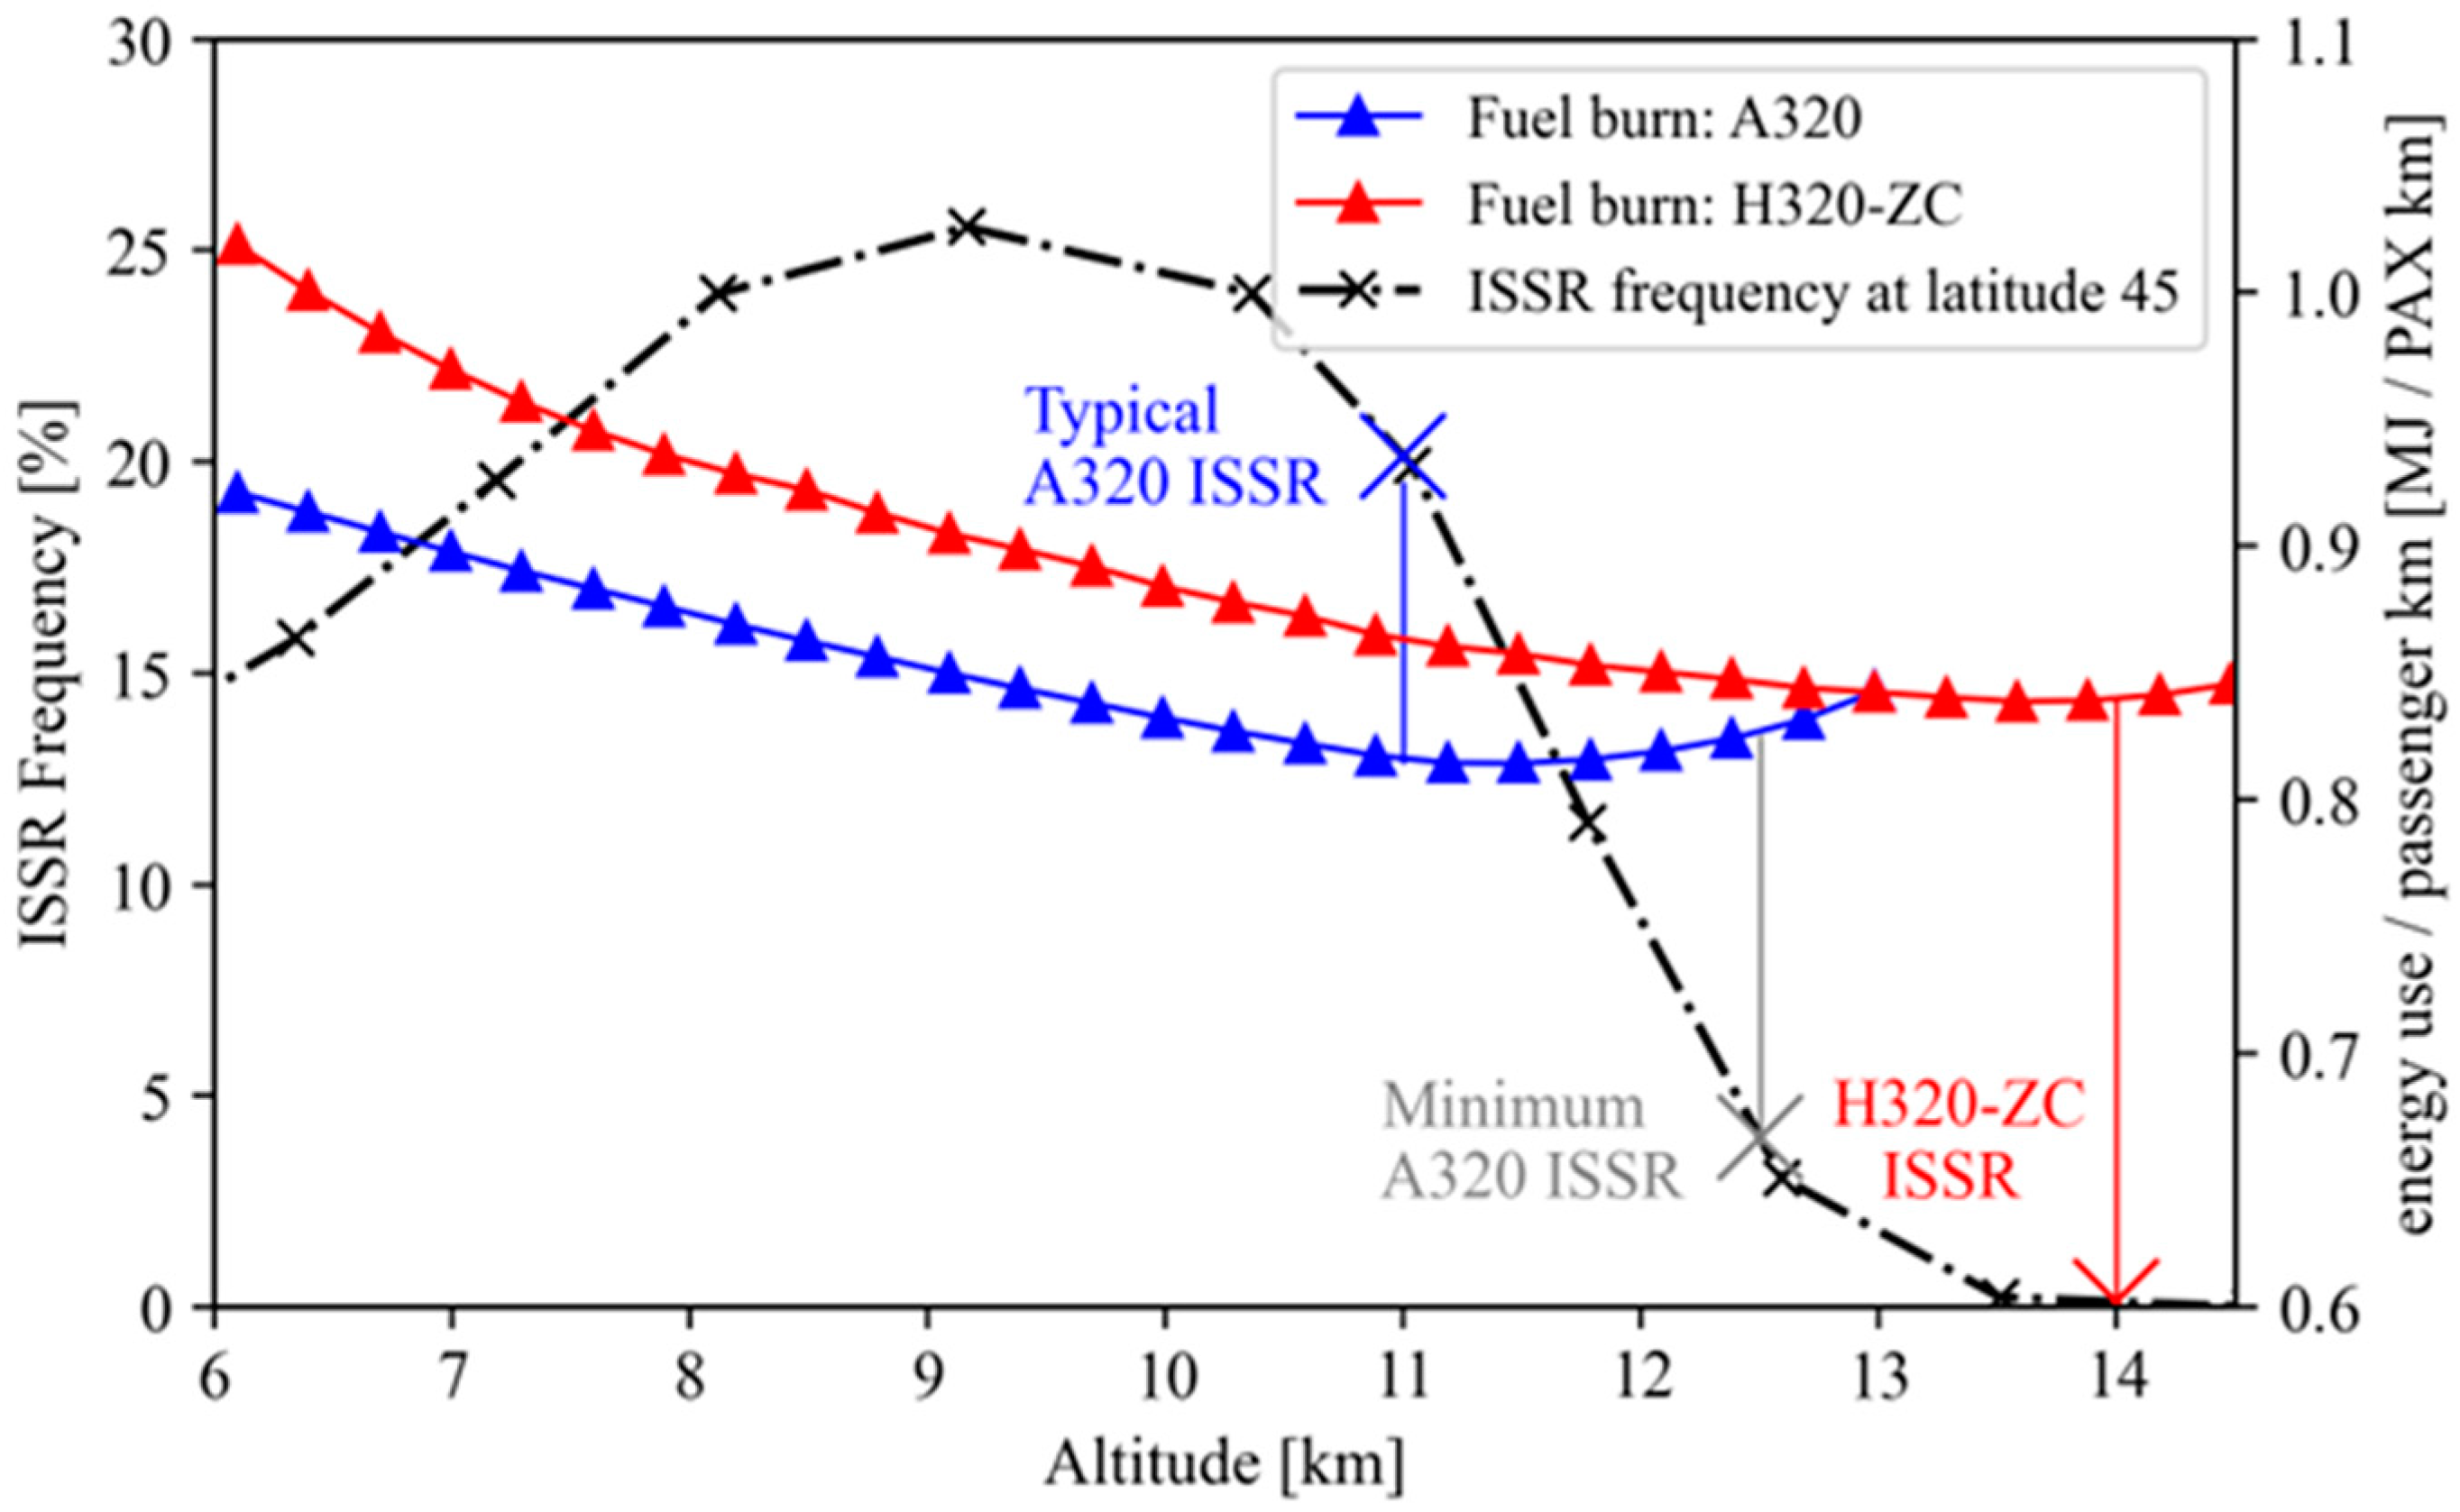
Figure 16 demonstrates that the H320-ZC will produce negligible persistent contrails in non-equatorial regions at its 14 km operating point. Its energy use per passenger-km is predicted to improve significantly compared to the baseline H320. The 5% increase compared to the A320, as shown in Table 5, is small relative to the expected uncertainties in modeling future aircraft. While the A320, having entered service almost forty years ago, may no longer be a good representative of future aircraft aerodynamics, it is considered sufficient for this study given that the focus is not the absolute fuel burn of the baseline aircraft, but the shift caused by the change in altitude and fuel type.
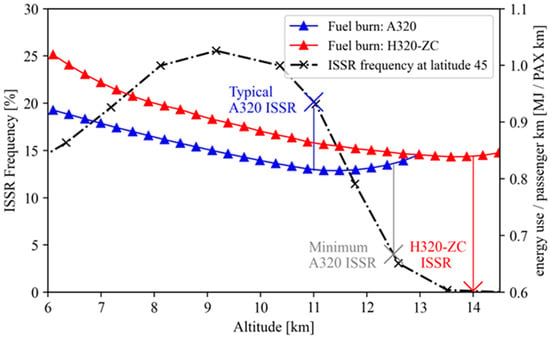
Figure 16.
Energy use per passenger-km and contrail persistence probability at typical non-equatorial latitude for the A320 and H320-ZC at a range of cruise altitudes on a typical 2800 km A320 flight mission.

Table 5.
Comparison of geometry, energy use and contrails for A320, H320 and H320-ZC.
3.2.2. Wing Weight and Strength
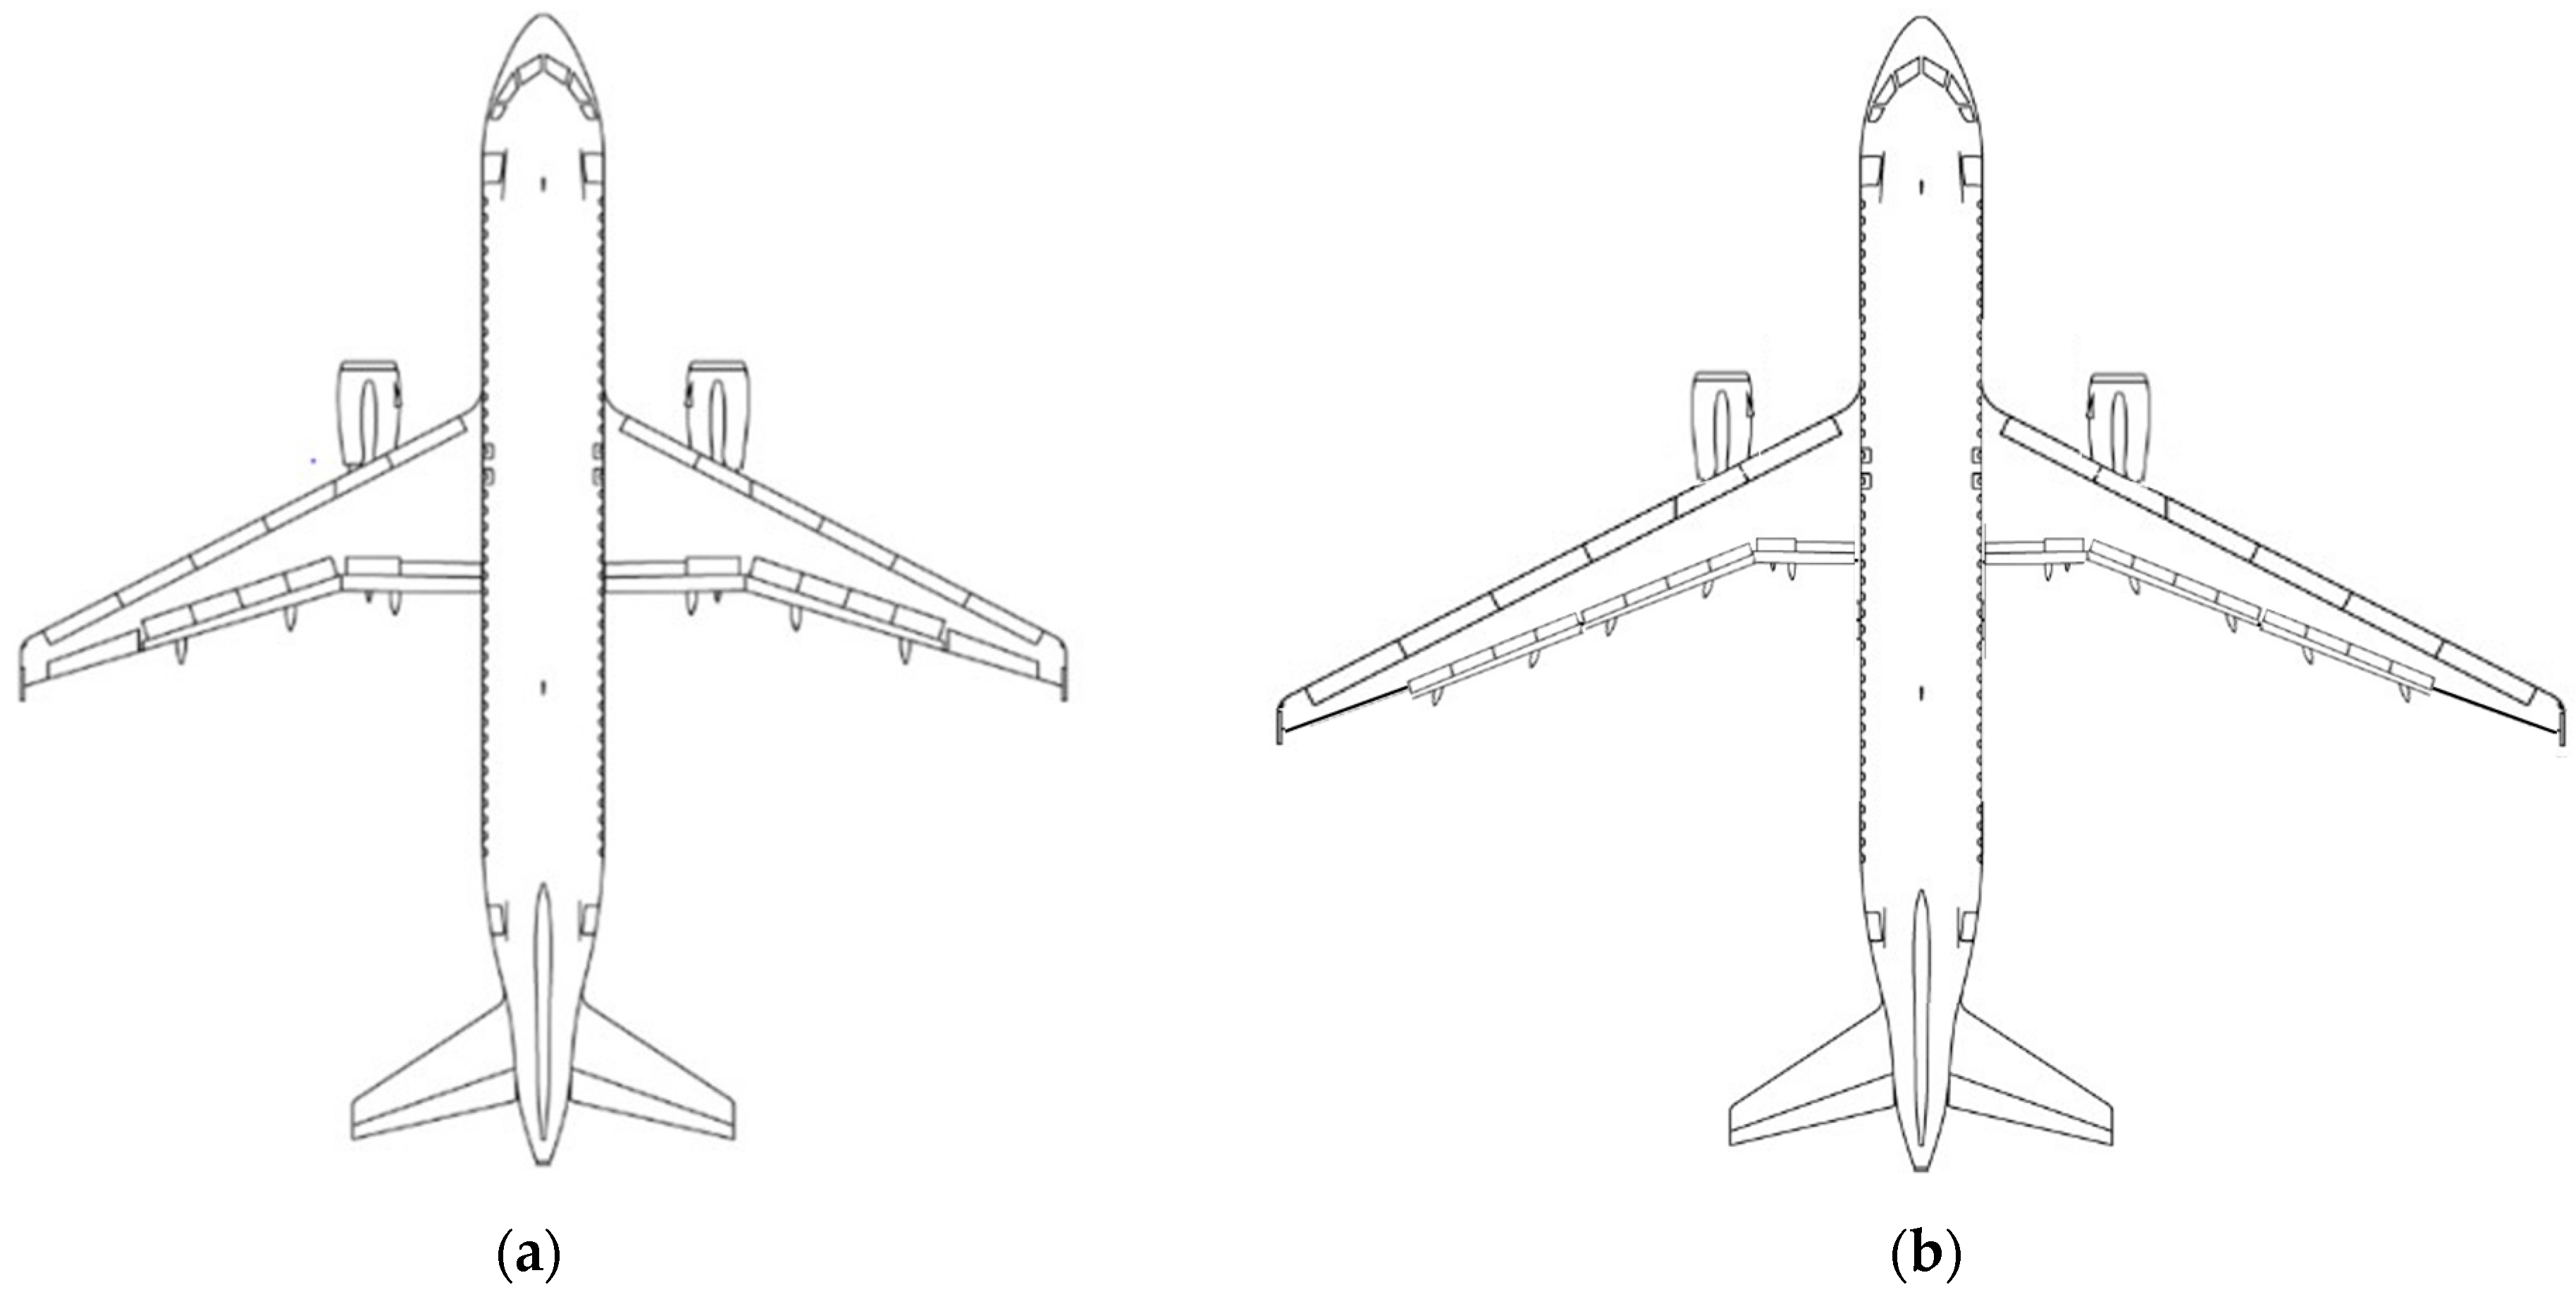
According to Torenbeek’s method, the H320-ZC wing weight is estimated to be 5.6 tons greater than the A320’s 9.15-ton wings (as shown in Figure 17). Since the wing area is unchanged, this is entirely due to the added weight of additional spars and stiffer structural elements required to support a thin, long wing with less inherent resistance to bending moments. This increase in wing structural weight is balanced by the reduction in loaded wing weight due to 8–10 tons of fuel that would have been loaded in an A320’s wings on a typical medium-range mission, so the total loaded wing weight will decrease overall by 20–40%. Such severe wing thickness reduction would not have been possible for a conventional aircraft, which would require bulkier wings to maintain large wing volume for fuel storage.
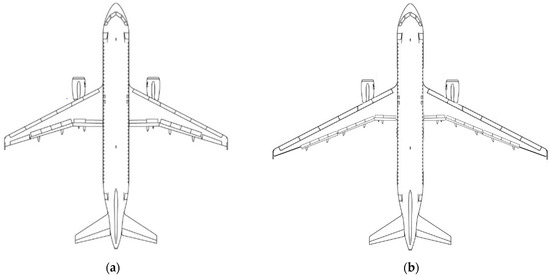
Figure 17.
Planform diagrams of the: (a) A320; and (b) H320-ZC [42].
3.2.3. Payload, Range, and Feasibility
Due to its shorter range, the H320-ZC can retain approximately 60% of the A320’s 180 seats despite the in-fuselage hydrogen tanks. It can still operate flight missions up to about 2800 km range, as shown in Figure 18, which covers most flight missions currently operated by the A320 [40]. It is unlikely that the H320-ZC will be able to carry as much cargo mass as implied by Figure 18 because it will be volume-limited by the in-fuselage hydrogen tanks.

Figure 18.
Weight-range diagrams for the A320 and H320-ZC. Increased wing weight is responsible for the larger operating empty weight (OEW) of the H320-ZC. This enables a corresponding increase in maximum zero-fuel weight (MZFW) due to relief of lift in the heavier wings, preventing the H320-ZC from being weight-limited.
The H320-ZC can operate with negligible long-lived contrails everywhere except between latitudes −35° and 35°, an area representing 43% of the Earth’s surface. This may be sufficiently large to justify an aircraft design that can cover many major routes, especially since routes that cross just beyond the boundaries of this region will still result in greatly reduced contrail climate impact. Further investigation using flight mission data would enable evaluation of the saving achievable on real routes. It operates at a Mach number of ~0.75 at its 14 km altitude and is estimated to use only ~5% greater energy-use per passenger-km than the A320 due to its 20% higher typical lift-drag ratio.
4. Conclusions
The key novel finding is that despite uncertainty about contrails’ impact, there is substantial certainty about the altitudes and latitudes that enable prevention of long-lived contrails. The high-altitude non-equatorial and low-altitude equatorial regions for evasion of long-lived contrails were shown to be consistent across several different years. A zero-contrails hydrogen aircraft design has been proposed for optimal performance at a high cruise altitude, and its energy use and contrail persistence are compared with the A320 in Table 6. This demonstrates that though redesign for high-altitude flight with zero contrails is possible, an intermediary step for contrail reduction could be achieved by operating the A320 higher. However, this is not possible for medium-range or long-range flights where high fuel requirements lead to a low aerodynamic ceiling that precludes high-altitude flight.

Table 6.
Comparison of estimated energy use on a typical flight mission and contrail persistence probability for three methods of reducing long-lived contrails. All values are relative to conventional A320 operation and have been averaged across longitude and month.
A primary result of this study is the wing geometry proposed for the H320-ZC, with thin wings and a high aspect ratio leading to a wing that achieves greater lift, particularly at high altitudes and Mach numbers. This thin, sleek wing requires higher structural weight, but will still result in a lighter wing overall due to the lack of fuel storage in the wings. The model described for the impact of wing design on performance is a useful tool for conceptual aircraft design that could enable further exploration of the effect of varying wing design on contrails and fuel economy. (Table 7)

Table 7.
Objectives and key results.
Author Contributions
Conceptualization, D.I.B. and C.A.H.; methodology, D.I.B. and C.A.H.; hydrogen-tank modeling, M.K.O.; other modeling, D.I.B.; writing—original draft preparation, D.I.B.; writing—review and editing, D.I.B. and C.A.H. All authors have read and agreed to the published version of the manuscript.
Funding
This research received no external funding.
Data Availability Statement
All data used in the manuscript for prediction of contrail persistence regions is publicly available at [19].
Conflicts of Interest
The authors declare no conflict of interest.
Nomenclature
| AR | aspect ratio |
| B | wing span, m |
| BPR | engine bypass ratio by mass, kg kg−1 |
| c | wing chord, m |
| CD | drag coefficient |
| zero-lift drag coefficient | |
| skin friction coefficient | |
| d | fuselage diameter, m |
| FPR | fan pressure ratio |
| g | acceleration due to gravity, m s−2 |
| H | fuel burn parameter, m |
| induced drag coefficient | |
| L/D | lift to drag ratio |
| l | fuselage length, m |
| LCV | low calorific value, MJ kg−1 |
| Mach number | |
| critical Mach number | |
| drag-divergence Mach number | |
| M jet | jet Mach number |
| MTOW | maximum take-off weight, tons |
| MZFW | maximum zero-fuel weight, tons |
| P013 | bypass stagnation pressure downstream of fan, Pa |
| R | inertia relief, tons |
| Re | Reynolds number |
| rp | overall pressure ratio |
| RH | relative humidity |
| wing area, m2 | |
| wetted area of component, m2 | |
| SFC | specific fuel capacity, kg s−1 N−1 |
| t | wing thickness, m |
| T013 | bypass stagnation temperature downstream of fan, K |
| T02 | engine inlet stagnation temperature, K |
| T2 | engine inlet static temperature, K |
| Tjet | jet temperature, K |
| TR | taper ratio |
| ULF | ultimate load factor |
| V | aircraft speed, m s−1 |
| Wfuel | weight of fuel burned during a flight mission, tons |
| Wwing | weight of aircraft wings, tons |
| γ | heat capacity ratio |
| ηcycle | cycle efficiency |
| ηpropulsive | propulsive efficiency |
| ηoverall | overall engine efficiency |
| ηc | combustor isentropic efficiency |
| ηt | turbine isentropic efficiency |
| λ | wing sweep angle, ° |
Appendix A. Modeling Turbofan Efficiency
This section describes the engine model used to calculate overall efficiency and hence determine performance. The engine parameters used in the model are indicated in Table A1 and are typical of the A320’s CFM56-5B4 turbofan. Constant pressure combustion and uniform jet velocity for core and bypass flow are assumed. Overall efficiency is recast in (A1) as the product of its cycle efficiency, propulsive efficiency, and transfer efficiency, for which a typical 90% estimate is used.

Table A1.
Parameters used in the CFM56-5B4 model.
Table A1.
Parameters used in the CFM56-5B4 model.
| Engine Parameter | Value | Source |
|---|---|---|
| Overall Pressure Ratio (rp) | 27.3 | [43] |
| Fan Pressure Ratio | 1.7 | Estimate |
| Bypass Pressure Ratio | 5.7 | [44] |
| Combustor Outlet Temperature | 1585 K | [45] |
| Fan Efficiency | 92% | [46] |
| Compressor Isentropic Efficiency | 89% | Estimate |
| Turbine Isentropic Efficiency | 85% | Estimate |
| Transfer Efficiency | 90% | Estimate |
| Inlet Diameter | 1.735 m | [47] |
Appendix A.1. Cycle Efficiency
The cycle efficiency is defined as in (A2). This is a common formulation, so the derivation is not shown here.
The value for the combustor outlet temperature, T04 is fixed at the typical value from Table A1. can therefore be found as the ratio of this to the compressor inlet temperature, which is calculated using Equation (A3) as a function of altitude and the Mach number by finding the ambient static temperature, , at that altitude, according to the ISA model.
Appendix A.2. Propulsive Efficiency
The engine’s propulsive efficiency depends on Mach number but not altitude. A formula for it is derived in (A4):
Appendix A.3. Overall Efficiency
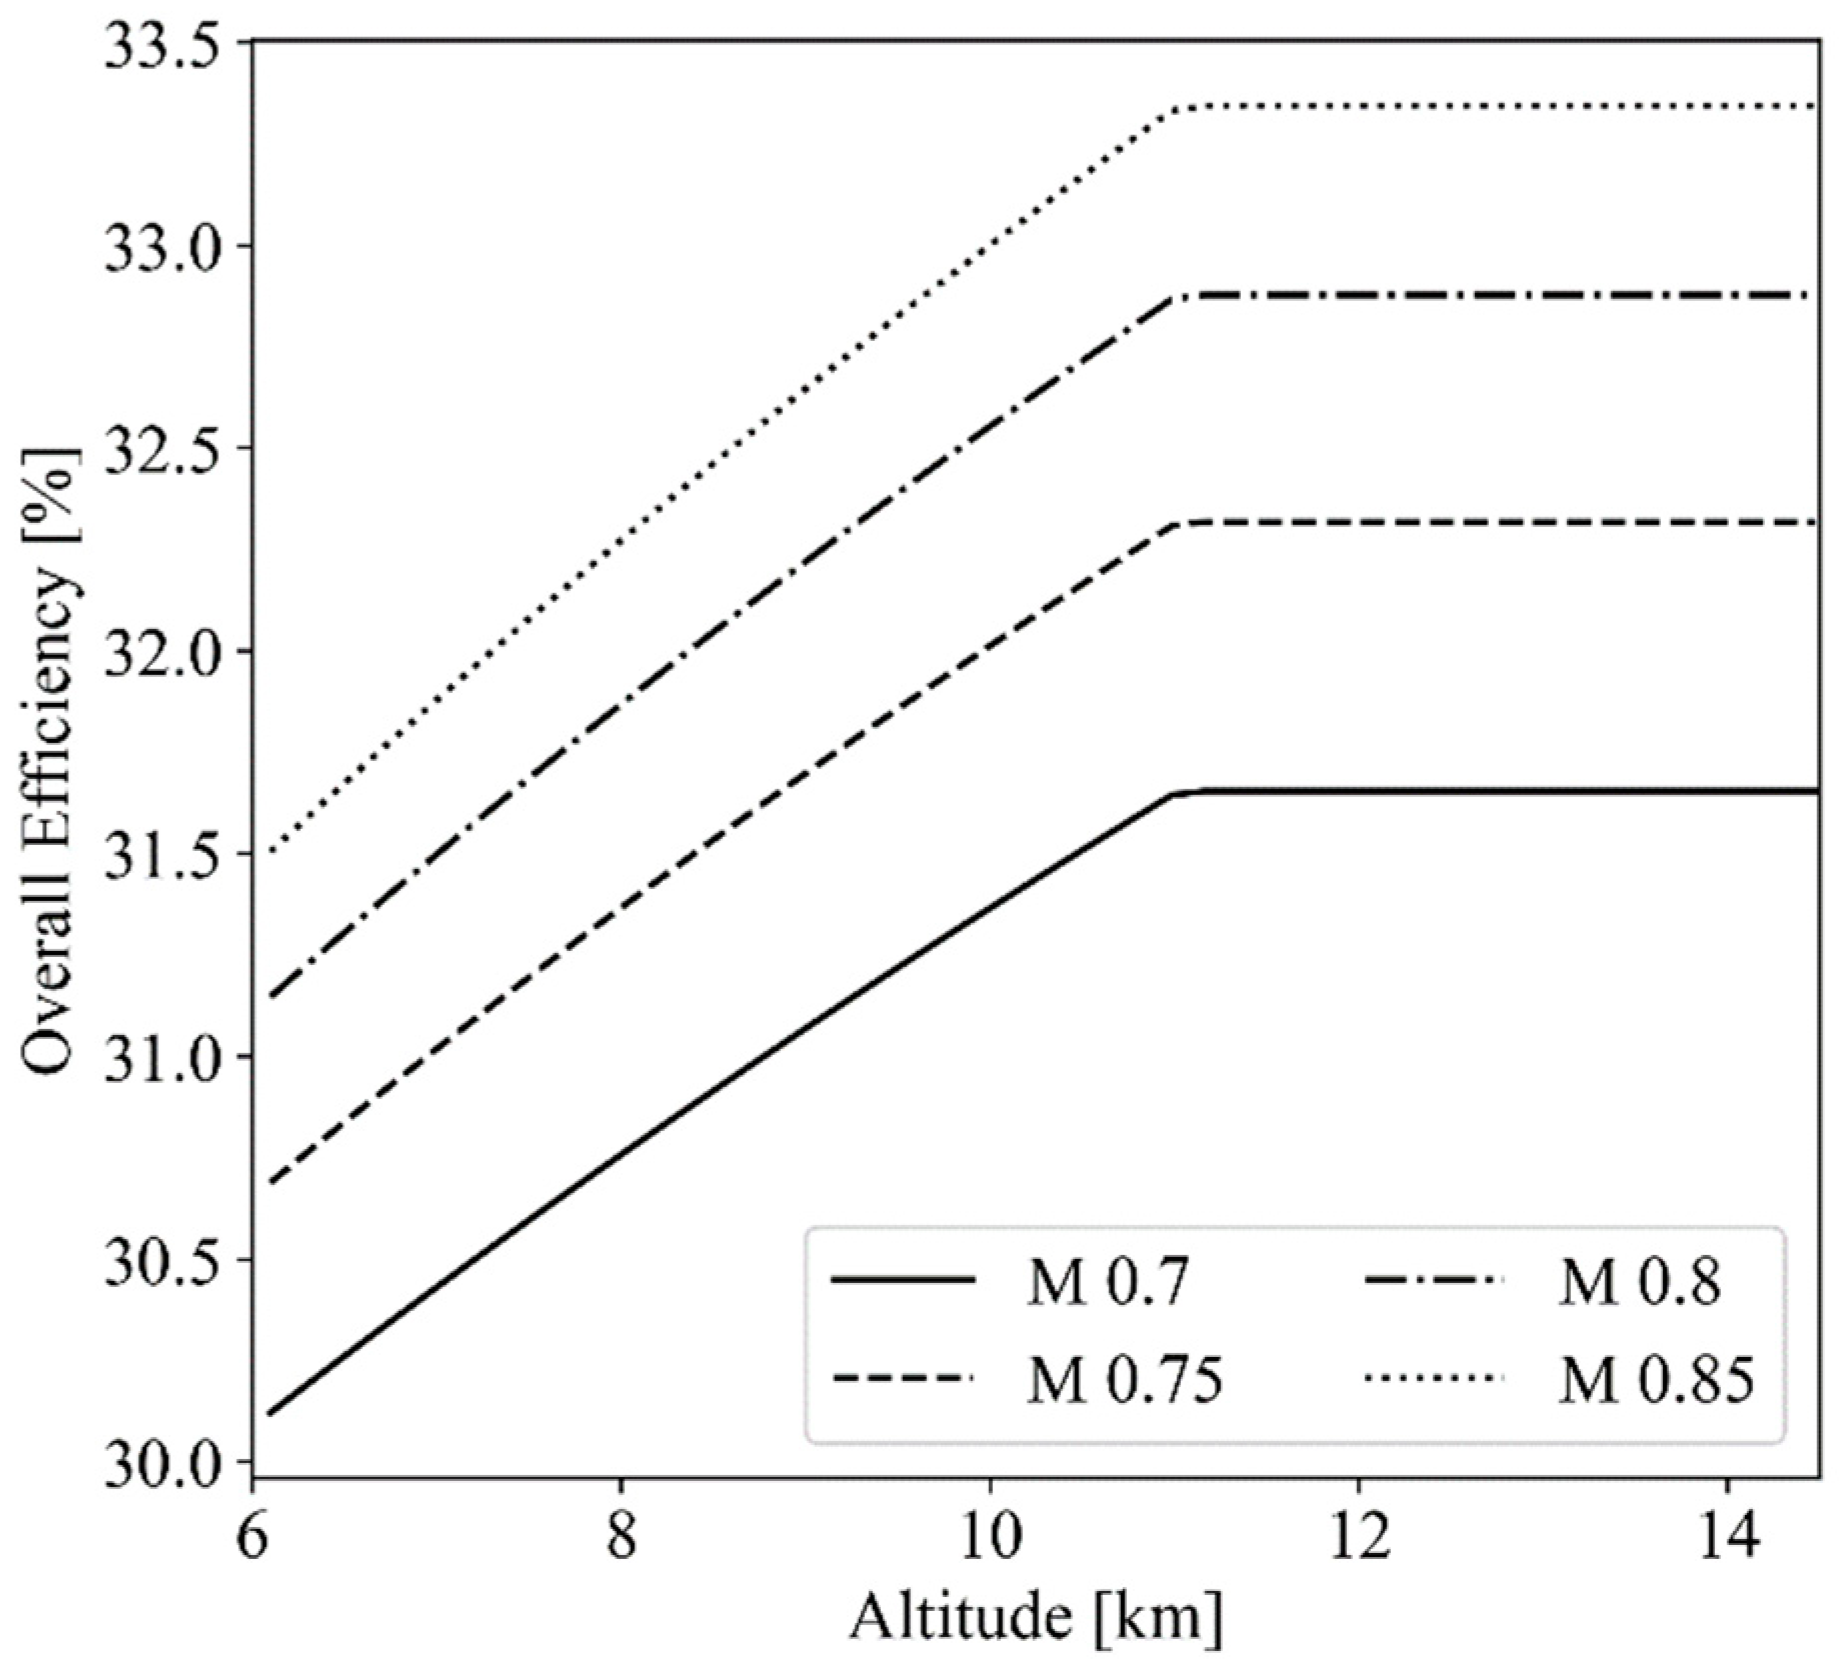
The engine’s overall efficiency is the product of the efficiencies in (A1). It is shown in Figure A1 as a function of the Mach number and altitude. It increases with the Mach number because propulsive efficiency rises with the Mach number faster than cycle efficiency falls. Notably, the effect of altitude is much greater than that of the Mach number.
Note that this model assumes a constant tropopause altitude (based on the ISA). In reality, the tropopause varies from approximately 9 km at the poles to approximately 17 km at the equator but this has little impact on the study’s results: the A320 and H320-ZC cruise altitudes are both above the tropopause in non-equatorial regions (except for the A320 in a narrow window from 35° to 40° latitude). The variation in tropopause height will therefore not affect either (as they both cruise in the region above the tropopause where the temperature is approximately constant).
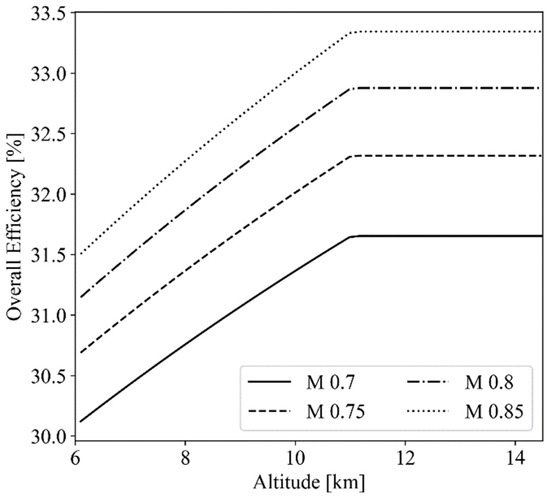
Figure A1.
Dependence of overall efficiency on Mach number and altitude, where inlet static temperature is determined as a function of altitude by the standard ISA model.
Figure A1.
Dependence of overall efficiency on Mach number and altitude, where inlet static temperature is determined as a function of altitude by the standard ISA model.
References
- Murcray, W.B. On the Possibility of Weather Modification by Aircraft Contrails. Mon. Weather Rev. 1970, 98, 745–748. [Google Scholar] [CrossRef]
- Lee, D.S.; Fahey, D.W.; Skowron, A.; Allen, M.R.; Burkhardt, U.; Chen, Q.; Dohert, S.J.; Freeman, S.; Forster, P.M.; Fuglestvedt, J.; et al. The Contribution of Global Aviation to Anthropogenic Climate Forcing for 2000 to 2018. Atmos. Environ. 2021, 244, 117834. [Google Scholar] [CrossRef] [PubMed]
- Kärcher, B. Formation and Radiative Forcing of Contrail Cirrus. Nat. Commun. 2018, 9, 1824. [Google Scholar] [CrossRef] [PubMed]
- Schmidt, E. Die Entstehung von Eisnebel aus den Auspuffgasen von Flugmotoren. Schriften Der Dtsch. Akad. Der Luftfahrtforsch. 1941, 5, 1–15. Available online: https://elib.dlr.de/107948/ (accessed on 30 August 2022).
- Appleman, H. The Formation of Exhaust Condensation Trails by Jet Aircraft. Bull. Am. Meteorol. Soc. 1953, 34, 14–20. [Google Scholar] [CrossRef]
- Jensen, E.K. Environmental Conditions Required for Contrail Formation and Persistence. J. Geophys. Res. 1998, 103, 3929–3936. [Google Scholar] [CrossRef]
- Scholz, D. Design of a Hydrogen Passenger Aircraft–How much “Zero-Emission” is Possible? In Proceedings of the Hamburg Aerospace Lecture Series (AeroLectures, DGLR, RAeS, VDI, ZAL, HAW Hamburg), Hamburg, Germany, 19 November 2020. [Google Scholar] [CrossRef]
- Newbury, S. FlyZero Academic Programme Research Recommendations and Findings. Aerospace Technology Institute: FlyZero, 2022. Available online: https://www.ati.org.uk/wp-content/uploads/2022/03/FZO-ACA-REP-0056-Academic-Programme-Research-Findings.pdf (accessed on 29 August 2022).
- Hambling, D. Cloud Control. New Sci. 2021, 249, 41–43. [Google Scholar] [CrossRef]
- Molloy, J.; Teoh, R.; Harty, S.; Koudis, G.; Schumann, U.; Poll, I.; Stettler ME, J. Design Principles for a Contrail-Minimizing Trial in the North Atlantic. Aerospace 2022, 9, 375. [Google Scholar] [CrossRef]
- Contrail-Induced Global Warming: Why the Aviation Industry Needs to Be Thinking Beyond Carbon Emissions. Cranfield University. 2021. Available online: https://www.cranfield.ac.uk/alumni/communications/alumni-news/2021/0428-why-the-aviation-industry-needs-to-be-thinking-beyond-carbon-emissions (accessed on 6 December 2022).
- Job, S.; Brocklehurst, H.; Kumar, N.; Minshull, J. FlyZero Lifecycle Impact: Further Work on Climate Science and Material Impacts. Aerospace Technology Institute: FlyZero, 2022. Available online: https://www.ati.org.uk/wp-content/uploads/2022/03/FZO-STY-POS-0034-Lifecycle-Impact.pdf (accessed on 29 August 2022).
- Yin, F.; Grewe, V.; Gierens, K. Impact of Hybrid-Electric Aircraft on Contrail Coverage. Aerospace 2020, 7, 147. [Google Scholar] [CrossRef]
- Postma-Kurlanc, A.; Leadbetter, H.; Pickard, C. Hydrogen Infrastructure and Operations: Airports, Airlines and Airspace. Aerospace Technology Institute: FlyZero, 2022. Available online: https://www.ati.org.uk/wp-content/uploads/2022/03/FZO-CST-POS-0035-Airports-Airlines-Airspace-Operations-and-Hydrogen-Infrastructure.pdf (accessed on 29 August 2022).
- Noppel, F.; Singh, R. Contrail Avoidance in the Aircraft Design Process. Aeronaut. J. 2008, 112, 733–737. [Google Scholar] [CrossRef]
- Reutter, P.; Neis, P.; Rohs, S.; Sauvage, B. Ice Supersaturated Regions: Properties and Validation of ERA-Interim Reanalysis with IAGOS in Situ Water Vapour Measurements. Atmos. Chem. Phys. 2020, 20, 787–804. [Google Scholar] [CrossRef]
- Minnis, P. Contrails. In Encylopedia of Atmospheric Sciences; Elsevier: Amsterdam, The Netherlands, 2002; pp. 509–520. ISBN 9780122270901. [Google Scholar]
- Piano’s Aircraft Database. Lissy’s Ltd. Available online: https://www.lissys.uk/dbase.html (accessed on 11 October 2020).
- ERA-Interim Database. European Centre for Medium-Range Weather Forecasts. Available online: https://www.ecmwf.int/en/forecasts/datasets/reanalysis-datasets/era-interim (accessed on 5 November 2021).
- Goff, J.A. Saturation Pressure of Water on the New Kelvin Temperature Scale; Transactions of the American Society of Heating and Ventilating Engineers, American Society of Heating and Ventilating Engineers: New York, NY, USA, 1946; pp. 95–122. [Google Scholar]
- Cavcar, A.; Cavcar, M. Approximate Solutions of Range for Constant Altitude–Constant High Subsonic Speed Flight of Transport Aircraft. Aerosp. Sci. Technol. 2004, 8, 557–567. [Google Scholar] [CrossRef]
- Kroo, I. Drag Due to Lift: Concepts for Prediction and Reduction. Annu. Rev. Fluid Mech. 2001, 33, 587–617. [Google Scholar] [CrossRef]
- Nita, M.; Scholz, D. Estimating the Oswald Factor from Basic Aircraft Geometrical Parameters; Deutscher Luft-und Raumfahrtkongress 2012, Document ID: 28142; Hamburg University of Applied Sciences Aero–Aircraft Design and Systems Group, Berliner Tor 9: Hamburg, Germany, 2012. [Google Scholar]
- Lock CN, H. The Ideal Drag Due to a Shock Wave. Parts I and II. Aeronautical Research Council, Technical Report Issue 2512. 1951. Available online: https://reports.aerade.cranfield.ac.uk/bitstream/handle/1826.2/3677/arc-rm-2512.pdf (accessed on 29 August 2021).
- Poole, D.; Allen, C.; Rendall, T. Objective Function and Constraints for Robust Transonic Aerofoil Optimization. In Proceedings of the 58th AIAA/ASCE/AHS/ASC Structures, Structural Dynamics, and Materials Conference, Grapevine, TX, USA, 9–13 January 2017. AIAA Paper 2017-0360, January 2017. [Google Scholar] [CrossRef]
- Grasmeyer, J. Multidisciplinary Design Optimisation of a Transonic Strut-Braced Wing Aircraft. In Proceedings of the 37th Aerospace Sciences Meeting and Exhibit, Reno, NV, USA, 11–14 January 1999. AIAA Paper 99-16010, January 1999. [Google Scholar] [CrossRef]
- Mason, W.H. Analytic Models for Technology Integration in Aircraft Design. In Proceedings of the Aircraft Design, Systems and Operations Conference, Dayton, OH, USA, 17–19 September 1990. AIAA Paper 90-3262, September 1990. [Google Scholar] [CrossRef]
- Jenkinson, L.R.; Simpkin, P.; Rhodes, D. Civil Jet Aircraft Design; American Institute of Aeronautics and Astronautics: Reston, VA, USA, 2000. [Google Scholar]
- Boeing 787-8 Piano File. Lissys Ltd. Available online: https://www.lissys.uk/samp1/b787.html (accessed on 30 August 2022).
- Boeing 787 Dreamliner Specs. ModernAirliners.com. Available online: https://modernairliners.com/boeing-787-dreamliner/boeing-787-dreamliner-specs/ (accessed on 30 August 2022).
- Raymer, D.P. Aircraft Design: A Conceptual Approach; American Institute of Aeronautics and Astronautics: Reston, VA, USA, 1992. [Google Scholar]
- Torenbeek, E. Synthesis of Subsonic Airplane Design; Delft University Press: Delft, The Netherland, 1982. [Google Scholar]
- Gudmundsson, S. Anatomy of the Airfoil. In General Aviation Aircraft Design; Butterworth-Heinemann: Oxford, UK, 2014; pp. 235–297. [Google Scholar] [CrossRef]
- Flügel, Transporter, Masserelevante Daten; LTH Masseanalyse–Deutsche Aerospace Airbus: Hamburg, Germany, 1993; Technical Report 501 52-01, 1993.
- ASME Boiler and Pressure Vessel Code; American Society of Mechanical Engineers: New York, NY, USA, 2019; ISBN 9780791873564.
- Klell, M. Storage of Hydrogen in the Pure Form. In Handbook of Hydrogen Storage: New Materials for Future Energy Storage; Wiley-VCH Verlag GmbH Co.: Weinheim, Germany, 2010; Chapter 1. [Google Scholar]
- New Aviation, Propulsion, Knowledge and Innovation Network–Full Report. Heathrow Airport. 2022. Available online: https://www.heathrow.com/content/dam/heathrow/web/common/documents/company/about/future-flight-challenge/NAPKIN%20Long%20Report%20221028.pdf (accessed on 17 January 2023).
- Aircraft Characteristics, Airport and Maintenance Planning. Airbus Customer Services. Available online: https://www.airbus.com/sites/g/files/jlcbta136/files/2021-11/Airbus-Commercial-Aircraft-AC-A320.pdf (accessed on 20 August 2022).
- Human Silhouette. Wikimedia Commons. Available online: https://commons.wikimedia.org/wiki/File:SVG_Human_Silhouette.svg (accessed on 30 August 2022).
- Husemann, M.; Schaefer, K.; Stumpf, E. Flexibility within Flight Operations as an Evaluation Criterion for Preliminary Aircraft Design. J. Air Transp. Manag. 2018, 71, 201–214. [Google Scholar] [CrossRef]
- Seeckt, K.; Scholz, D. Jet versus Prop, Hydrogen versus Kerosene for a Regional Freighter Aircraft; Deutscher Luft-und Raumfahrtkongress, Deutsche Gelleschaft für Luft: Aachen, Germany, 2009; Document ID: 121195. [Google Scholar]
- European Union Aviation Safety Agency. Aircraft Engine Emissions Databank. 2021. Available online: https://www.easa.europa.eu/domains/environment/icao-aircraft-engine-emissions-databank (accessed on 30 August 2022).
- Roux, E. (Ed.) Réacteurs Simple et Double Flux: Données Caractéristiques; 2007; ISBN 9782952938006. Available online: http://elodieroux.com/EditionsElodieRouxEngines.html (accessed on 30 June 2023).
- Yin, F.; Rao, A.G. Performance Analysis of an Aero Engine with Inter-Stage Turbine Burner. Aeronaut. J. 2017, 121, 1605–1626. [Google Scholar] [CrossRef]
- CFM56-7: An In-Depth Look at the New Industry Leader. CFM International. 1996. Available online: https://www.cfmaeroengines.com/press-articles/cfm56-7-an-in-depth-look-at-the-new-industry-leader/ (accessed on 30 June 2023).
- CFM56 Brochure. CFM International. 2017. Available online: https://www.cfmaeroengines.com/wp-content/uploads/2017/09/Brochure_CFM56_fiches_2017.pdf (accessed on 30 June 2023).
- Airbus A320 R2 Door. Wikimedia Commons. Available online: https://commons.wikimedia.org/wiki/File:Airbus_A320_R2_Door.png (accessed on 31 August 2022).
Disclaimer/Publisher’s Note: The statements, opinions and data contained in all publications are solely those of the individual author(s) and contributor(s) and not of MDPI and/or the editor(s). MDPI and/or the editor(s) disclaim responsibility for any injury to people or property resulting from any ideas, methods, instructions or products referred to in the content. |
© 2023 by the authors. Licensee MDPI, Basel, Switzerland. This article is an open access article distributed under the terms and conditions of the Creative Commons Attribution (CC BY) license (https://creativecommons.org/licenses/by/4.0/).

