Article

Design Investigation of Potential Long-Range Hydrogen Combustion Blended Wing Body Aircraft with Future Technologies

1
Cluster of Excellence SE²A-Sustainable and Energy-Efficient Aviation, Technische Universität Braunschweig, 38108 Braunschweig, Germany
2
Institute of Aircraft Design and Lightweight Structures, Technische Universität Braunschweig, 38108 Braunschweig, Germany
3
Visionary Aircraft Concepts, Bauhaus Luftfahrt e.V, Willy-Messerschmitt-Straße 1, 82024 Taufkirchen, Germany
4
Computational Engineering and Design Group, Department of Aeronautics and Astronautics, University of Southampton, Southampton SO16 7QF, UK
*
Author to whom correspondence should be addressed.
Aerospace 2023, 10(6), 566; https://doi.org/10.3390/aerospace10060566
Submission received: 24 April 2023 / Revised: 11 June 2023 / Accepted: 15 June 2023 / Published: 17 June 2023
(This article belongs to the Special Issue Aircraft Design (SI-5/2023))

Abstract

:
Present work investigates the potential of a long-range commercial blended wing body configuration powered by hydrogen combustion engines with future airframe and propulsion technologies. Future technologies include advanced materials, load alleviation techniques, boundary layer ingestion, and ultra-high bypass ratio engines. The hydrogen combustion configuration was compared to the configuration powered by kerosene with respect to geometric properties, performance characteristics, energy demand, equivalent CO2 emissions, and Direct Operating Costs. In addition, technology sensitivity studies were performed to assess the potential influence of each technology on the configuration. A multi-fidelity sizing methodology using low- and mid-fidelity methods for rapid configuration sizing was created to assess the configuration and perform robust analyses and multi-disciplinary optimizations. To assess potential uncertainties of the fidelity of aerodynamic analysis tools, high-fidelity aerodynamic analysis and optimization framework MACH-Aero was used for additional verification. Comparison of hydrogen and kerosene blended wing body aircraft showed a potential reduction of equivalent CO2 emission by 15% and 81% for blue and green hydrogen compared to the kerosene blended wing body and by 44% and 88% with respect to a conventional B777-300ER aircraft. Advancements in future technologies also significantly affect the geometric layout of aircraft. Boundary layer ingestion and ultra-high bypass ratio engines demonstrated the highest potential for fuel reduction, although both technologies conflict with each other. However, operating costs of hydrogen aircraft could establish a significant problem if pessimistic and base hydrogen price scenarios are achieved for blue and green hydrogen respectively. Finally, configurational problems featured by classical blended wing body aircraft are magnified for the hydrogen case due to the significant volume requirements to store hydrogen fuel.

1. Introduction

Significant climate changes and potential environmental impacts due to increased transportation in the near future have motivated many industries to reduce emissions. As a major transportation method, the aviation industry has also established the goal of reducing the emissions of new generations of aircraft. Improvements in current airframe and engine technologies continue increasing aircraft efficiency and reducing their overall emissions. However, a potential increase in air transportation may still substantially increase overall emissions, even if existing technologies reach their maximum efficiencies. The European Commission [1] proposed challenging goals toward more sustainable aviation of the future. Particularly, it is desired to achieve a net-zero CO2 emission for intra-EU flights and those departing the EU, 90% reduction in NOx emissions, warming contrail cirrus, and the overall climate impact from CO2 and non-CO2 effects relative to the year 2000. Given goals are unlikely to be met using existing technologies and aircraft concepts, so the development of alternative environmentally friendly energy sources, new aircraft configurations, novel airframe and energy network technologies, and more sustainable flight mission profiles are required to significantly reduce aircraft emissions.
Unconventional aircraft configurations play a particularly important role in achieving more sustainable aviation. Future configurations may not only improve the aircraft’s performance itself, but they may also further motivate or mitigate an introduction of particular technologies that could also improve the aircraft’s sustainability. Among various configurations, the blended wing body is still considered to be one of the promising configurations that may enable more sustainable and energy-efficient aircraft.
Extensive research related to the capabilities of BWB configuration from the overall design perspective has been done by many researchers. Liebeck [2] performed a detailed conceptual analysis of BWB configurations for future commercial aircraft and suggested various important design aspects. Chen [3] also performed a comprehensive review of various BWB configurations, compared their characteristics, and summarized important aspects necessary for the design. Okonkwo [4] performed a review of BWB aircraft developed at that time and indicated the benefits and challenges of the configuration as well as possible research directions. Brown [5], van Dommelen [6], and Dorsey [7] performed different design space exploration exercises and recommended boundaries of different BWB architectures for various mission profiles. Scholz [8] conducted an extensive study of a BWB configuration from a concept to the wind tunnel test model and a flight test prototype.
Along with the capabilities of the BWB configuration, a number of different sizing methodologies were introduced to conceptually size a BWB aircraft. Bradley [9] introduced a cabin sizing methodology and a weight estimation method for BWB aircraft used in the FLOPS program. Hansen [10] extended an existing aircraft design tool PrADO to analyze various BWB aircraft. There, physics-based weight estimation methods, FEA, and panel methods were implemented to size the aircraft and mitigate uncertainties related to the unconventional nature of the configuration. Sgueglia [11] demonstrated a multi-fidelity sizing methodology of BWB aircraft with distributed propulsion where an initial constraint analysis, iteration loops for weights and planform convergence, an MDO framework using OpenMDAO [12], and high-fidelity tools such as RANS and FEA were used to size a BWB with distributed propulsion. Brown [5] introduced a comprehensive sizing methodology for kerosene BWB aircraft. The methodology includes a detailed approach to the planform and cabin shaping, including a three-dimensional parametric geometric model. A low-fidelity aerodynamic and weight models were used for the design, and results were compared to reference aircraft for validation.
Although a lot of research activity has been performed in the direction of a classical kerosene-powered BWB configuration, limited publically available research has been done in the direction of hydrogen-powered BWB aircraft. Seeckt [13] performed an initial comparison between the tube-and-wing and BWB freighter aircraft powered by liquid hydrogen and indicated no clear superiority of the configuration compared to the hydrogen tube-and-wing aircraft. Guynn [14] evaluated the potential capabilities of BWB aircraft powered by fuel cells and concluded that future technologies are necessary to make a given configuration feasible. Finally, Westenberger [15] compared various airplane configurations for future mid-range aircraft, including a BWB configuration, and did not report any positive output compared to conventional configurations, if current technologies are considered.
On the other hand, one or several future airframe and propulsion technologies may make the configuration more attractive and maximize the emission reduction via a synergistic interaction between the propulsion system emission reduction and a more efficient airframe. Therefore, the present research focuses on an assessment of potential hydrogen-powered BWB aircraft with promising future airframe and propulsion technologies considered within the SE2A Excellence cluster. The research is divided into several parts. Section 2 briefly summarizes technologies considered for the present research. Section 3 describes an initial sizing methodology for the hydrogen-powered BWB aircraft and points out important deviations from a kerosene-powered configuration sizing. Section 4 demonstrates the results of the comparative assessment between the kerosene and hydrogen BWB configurations and also presents technology sensitivity studies. Finally, Section 5 describes an aerodynamic verification study to mitigate uncertainties related to the limitation of the low-fidelity analysis.

2. Summary of Future Airframe and Propulsion Technologies

The present section describes general considerations of novel airframe and propulsion technologies that could be potentially implemented in future aircraft and summarizes previous findings and estimates of their impact. Given review will help define estimates used for the present work that are described in the following section.

2.1. Load Alleviation

Load alleviation summarizes various methods to reduce the wing bending moment using passive or active approaches. The reduction of maximum bending moment reduces loads on the wing and allows to design of a lighter structure or increases the service life of the airframe. Ideally, future load alleviation techniques may even allow the wing to be designed for lower-limit load factors, which will improve aircraft fuel efficiency. Figure 1 schematically describes load alleviation technologies considered for the present work.
Passive load alleviation solutions consider a nonlinear stiffness material design [16], viscoelastic damping design, new structural concepts [17,18], and locally morphing structures [19]. Nonlinear stiffness materials may improve the load distribution on the wing under low load cases and improve performance efficiency under those conditions. For viscoelastic damping composites, the viscoelastic layer experiences shear deformations under vibration loads due to gusts or flight maneuvers, which dissipates some portion of the vibration energy. Therefore, the structure can be designed for lower limit loads. Finally, both new structural concepts and local morphing structures aim to extend the aeroelastic design space and enable lighter structural design.
Figure 1. Schematic representation of various future technologies for load alleviation [20]. (a) Locally morphing structures; (b) Viscoelastic composites; (c) Nonlinear stiffness materials; (d) Various options of active load alleviations.
Aerospace 10 00566 g001
The wing active load alleviation uses different types of flow control over the wing to achieve a more favorable wing load distribution and reduce the wing bending moment. Although given technology is being used in modern commercial aircraft, new advanced options are being investigated. Many researchers have approached the design of active load alleviation from a control perspective [21,22,23,24]. Moreover, active load alleviation could also be achieved by fluidic or micro-mechanical flow actuators that could enable more rapid response and, therefore, more efficient load alleviation capabilities [25].

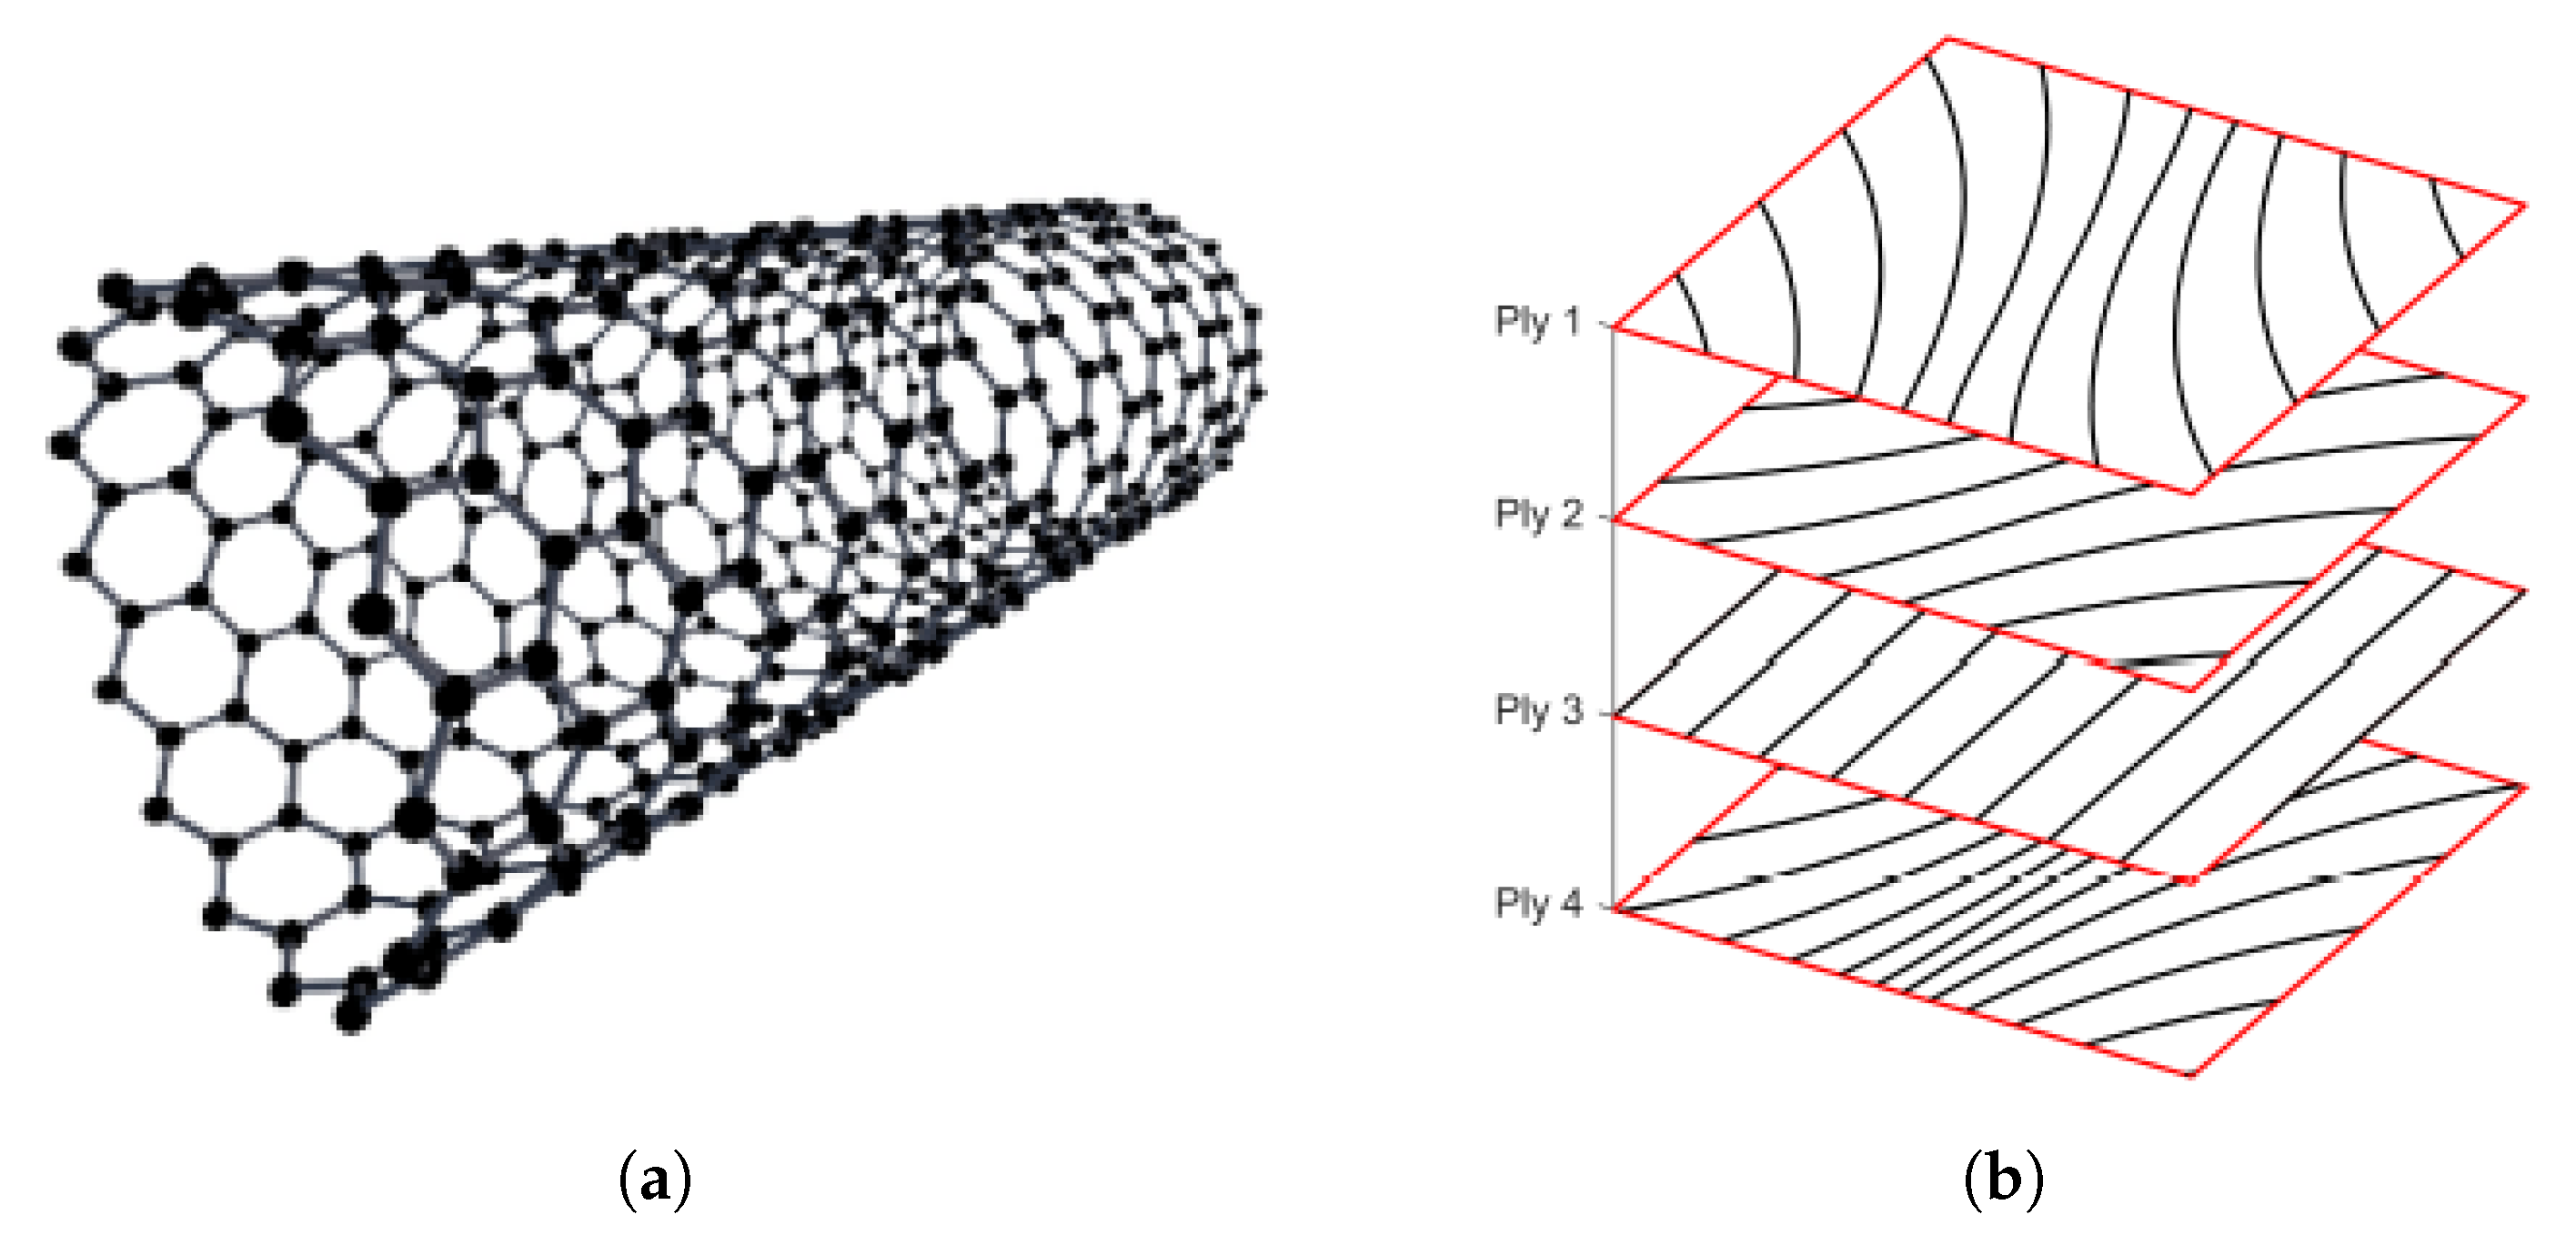
2.2. Advanced Materials

Novel materials and advances in manufacturing are being developed to improve the aircraft structure in terms of stiffness and mass and introduce more unconventional structural concepts, that fit the particular requirements of unconventional aircraft. Moreover, more sustainable materials may also reduce the overall emission along the life cycle of an aircraft and further improve the sustainability of the aviation sector.
One promising direction in material development is related to the generation of hybrid materials based on carbon nanotubes (CNT) and nanofibers (CNF). The atomic structure of carbon nanotubes is shown in Figure 2a. Currently, carbon nanotubes are considered to be the strongest and stuffiest materials in terms of tensile strength and elastic modulus. Moreover, the specific strength of CNT can be up to 300 times higher than high-carbon steels, which may give an extraordinary combination of strength, stiffness, and low weight, which is necessary for aircraft structures [26,27]. Therefore, developments in hybrid materials with CNT and CNF may significantly affect future aircraft airframe structures, although the development of CNT-based materials is challenging.
Another promising direction in advanced materials and structures is related to the development of composite materials using a tow-steering approach. Unlike conventional layups, where each layup has a particular constant orientation angle, layers of tow-steered composites can be laid in a way, that fibers can follow a curved path, as schematically shown in Figure 2b. Such a change in composite manufacturing can provide a more optimal distribution of loads along the structure, mitigate stress concentrations at discontinuities, such as holes, and can further improve capabilities to tailor the structure for more optimal performance [28]. Brooks [29] performed the wing aerostructural optimization to investigate possible improvements in the aircraft mass and fuel burn if tow-steered composites are used. Results demonstrated a potential structural mass reduction of 24% compared to conventional composite materials. Stanford performed a comprehensive study of a CRM wing using tow-steered composites to investigate potential steering options, demonstrating relationships between characteristics of core laminate and the steering path as coupled drivers of aeroelastic behavior [30].
Figure 2. Schematic representations of technologies considered for advanced materials. (a) Atom structure of carbon nanotubes [31]; (b) Tow steered composites [32].
Aerospace 10 00566 g002
Based on the current and expected performance of new materials and manufacturing techniques, the forecast of the NASA N+3 project [33] reported the potential reduction of the airframe mass by 30% if the desired composite performance is reached.

2.3. Ultra-High Bypass Ratio Turbofan Engines

Among several engine technologies, the increase in the bypass ratio may have a substantial fuel consumption improvement, and numerous research projects have considered its impact. Daggett [34] studied several geared turbofan engines of different diameters and bypass ratios with a variable bypass nozzle and advanced counter-rotating turbofan engine for a Boeing 777-200 aircraft. The results showed a 14% reduction in SFC compared to conventional turbofan engines. Hornung [35] conducted a study where ultra-high bypass ratio turbofan (UHBPR) engines with three-spool direct drive and two-spool geared architectures were compared to conventional turbofan engines with the technology level of the year 2000. 26.7% and 32.2% improvements in block fuel were obtained for the three-spool direct-drive and two-spool geared architectures, respectively. Giesecke [36] performed a comparative study of conventional and geared UHBPR engines for a single-aisle aircraft with an active high-lift system. The comparative study included a conceptual design of the reference engine with a BPR of 5 and the geared turbofan with a BPR of 17. Results demonstrated a 21% reduction in SFC for the cruise flight phase and more than 40% SFC reduction for the take-off and landing phases.

2.4. Boundary Layer Ingestion

Boundary layer ingestion improves fuel efficiency by ingesting the boundary layer into the engine and creating a more momentum difference (or thrust) at the same power input. In other words, ingesting the boundary layer re-energizes the wake produced by airframe components and reduces the overall energy loss. As a result, energy efficiency improvement affects the engine’s required power and improves the overall aircraft-specific fuel consumption. Extensive information about the methods of BLI modeling, analyses, and its potential benefits from the aircraft design standpoint is provided in various references. Results of the rear fuselage shape optimization performed by Gray [37] estimate the value of the power saving coefficient of up to 5%. Seitz [38] estimated a 4.7% fuel burn reduction for a long-range commercial aircraft with the aft-mounted engine with BLI. The parallel compressor model developed by Budziszewski and Voigt [39,40] estimates the PSC value of up to 3.4% for configurations with and without active flow laminarization. Uranga [41] estimated a PSC of 13% for the D8 double-bubble configuration. Blumenthal [42] performed high-fidelity CFD analyses of an aircraft with and without an aft-mounted BLI engine. Results showed a 15.6% reduction in cruise power requirements and eighteen drag counts reduction in drag for the BLI model compared to the conventional one. Engine configuration studies of the blended wing body aircraft performed by Kawai [43] also demonstrated a potential reduction in fuel burn of up to 10% depending on the BLI inlet shape.

3. Initial Sizing Methodology

The initial sizing methodology presented in this work is based on the approach used for tube-and-wing aircraft described in Refs. [44,45]. The initially developed toolchain is modified and extended to be able to size kerosene and hydrogen BWB aircraft. In this work, a derivation of the hydrogen BWB aircraft from a kerosene one is shown to emphasize critical sizing aspects of the BWB and further indicate their effects on the overall BWB configuration. The initial sizing methodology is divided into two major modules shown in Figure 3. The first step includes an iterative sizing of the aircraft using the constraint diagram and the mission analysis capability added into the general version of SUAVE [46]. The module helps initialize the configuration and perform the initial design space exploration to understand common trends of the configuration, understand the boundaries of the design, and isolate the design space for further sizing. The second step involves refinements of the first sizing step to resolve aspects unavailable during the first step. Analyses include more detailed performance analysis, more detailed aerodynamic studies, more sophisticated assessments of aircraft stability and control, and a multi-fidelity optimization framework. The optimization framework includes both low- and high-fidelity capabilities to further improve the configuration and mitigate uncertainties related to low-fidelity methods used at the first sizing step. Methods available in the second sizing step formulate an ‘Analysis and Optimization block’ from which some modules are used for the initial sizing block or for external solution packages. The section describes several critical aspects of the sizing framework: geometric parametrization of BWB configurations for the initial sizing, methods used for the initial sizing, and important aspects of the design refinement block critical for the BWB.

3.1. Constraint Analysis Module

The constraint analysis module shown in Figure 3 includes several steps. The module requires a set of top-level requirements, a mission profile, an initial configuration and its geometric parameterization algorithm, initial weight estimation, and information about critical assumptions or methods related to particular design aspects or technologies. After providing all necessary initial information, the sizing sequence is initiated. After the Initial Sizing block receives inputs, the first constraint diagram is created based on selected constraints. The equations defined by Gudmundsson [47] and Loftin [48] are used to calculate the constraint diagram of the BWB. Aerodynamic coefficients required for the constraint analysis and effect of high-lift devices are initially estimated by the designer and are then updated at each iteration after the SUAVE analysis using embedded low-fidelity methods described by Gudmundsson [47] and Torenbeek [49]. The thrust lapse model of Howe [50] was used to estimate the effects of speed and altitude on engine performance. After the set of design constraints is calculated for a sweep of wing loadings, the designer chooses a design wing loading W / S and a thrust-to-weight ratio T / W that will be used for the resizing of the aircraft. The initial configuration prescribed as an initial input is used for the mission analysis, which divides the mission profile into segments and solves the system of equations of motions for a steady balanced flight [46]. Take-off and landing performance characteristics are calculated using low-fidelity physics-based performance methods. Required fuel burn obtained after the mission analysis is passed into the weight estimation block to update aircraft weights. The calculated new value of the maximum take-off mass (MTOM) is compared to the initial estimate to determine the solution convergence. If the convergence is not reached, then the aircraft wing area is updated using the given values of MTOM and W / S , and the planform is automatically resized. The engine available thrust is updated based on the prescribed value of T / W and weights calculated before. A resized planform along with updated aerodynamic characteristics obtained during the mission analysis is input into the constraint analysis again to update all constraints and adjust the design point to repeat the process, while updated weights, geometry, and engine are used for the new mission analysis iteration. Otherwise, if the required tolerance value is reached, then the initial sizing step is finished and the configuration is passed into the Analysis and Optimization block. A given framework is rather flexible and independent of the configuration considered if appropriate geometric parametrization and analysis tools are used. Therefore, the most important initial sizing aspect is related to proper geometric parametrization of the BWB to ensure a balance between the number of parameters and design flexibility.
Geometric Parametrization
To achieve an automatic sizing of the BWB configuration using the constraint analysis, an appropriate geometric model needs to be established. The biggest challenge is related to the fact that the parametrization needs to be robust and include as few variables as possible to perform a rather rapid initial sizing and trade studies with an appropriate level of design flexibility, so a good initial guess is established. The formulation of the hydrogen combustion BWB sizing is generally derived from the kerosene BWB approach relatively similar to the work of Sgueglia [11] with specific parametrization modifications. Therefore, the geometric parametrization of the kerosene BWB is provided first as a reference, while the hydrogen planform derivations are described below as a general extension of the generic capability. Figure 4 shows parametrized BWB planforms for the kerosene and LH2 configurations. For both configurations, the planform is divided into three major segments: the inner wing segment S i n , which includes the aircraft cabin, the cockpit segment S c o c k p i t , which accounts for the cockpit and a smooth transition from it to the main cabin, and the outer wing segment S o u t . The outer portion includes the outer straight tapered portion and the transition portion, which provide the connection between the inner and the outer straight tapered portions. The aircraft planform area is then defined by
S r e f = S c o c k p i t + S i n + S o u t
The inner wing, the outer wing, and the transition portion are defined as trapezoid segments for simplicity of the analysis, while the cockpit segment is a small triangular extension of the inner wing. The planform can be fully defined if all segment chord lengths, spans, and sweep angles are determined. However, if no constraints or initial assumptions are prescribed, then it becomes rather complicated to perform the initial aircraft sizing due to a large number of variables. Therefore, multiple design assumptions were made to reduce the number of planform unknowns without losing the design flexibility:
  • The inner wing responsible for the cabin part and the transition portion of the outer wing segment have a similar leading edge sweep Λ 1
  • The inner wing trailing edge sweep angle was assumed to be equal to zero to simplify the sizing based on the aircraft cabin dimensions.
  • The rear bulkhead of the cabin segment is parallel to the segment trailing edge.
Kerosene BWB Geometric Sizing
As was mentioned previously, the kerosene BWB geometric parameterization is presented in this work as a reference with respect to which the hydrogen BWB will be compared. The planform sizing of both BWB types is divided into several steps.
First, the aircraft cabin is sized. Figure 5a shows the schematic cabin representation described by Bradley [9].
The cabin is divided into multiple bays that consist of several abreast seats and the aisle. Knowing the bay width, the number of bays, and the cabin leading edge sweep Λ 1 , the total cabin length of all combined bays is defined by
L t o t = n L w + w 2 tan Λ 1 i = 1 n ( i 1 )
where n is the number of bays, L w is the side wall cabin length, and w is the bay width. L t o t is the total bay length of the cabin defined similarly to the reference conventional tube-and-wing aircraft and may also account for the extra length of additional aisles between bays of the BWB. Equation (2) is solved for L w and the inner cabin wall length L 0 is found by
L 0 = L w + b 0 tan Λ 1
b 0 = w · n
After the cabin is sized using input and obtained information, the cockpit segment can be defined based on cabin inputs. The input of the cockpit segment length L c is required to define the segment size. Knowing the segment extension length and the cabin dimensions, the cabin sweep Λ 0 can be computed.
The upper and lower thicknesses of airfoil sections within the cabin depend on the designer’s input and the sizing of other systems. A sample section along the inner wing segment is shown in Figure 5b. The thickness of the upper half of the airfoil is defined based on the cabin height requirements. For the lower half-thickness, the baggage volume and the volume required for the landing gear (where needed) determine the minimum possible thickness. By constraining the baggage compartment span along the wing to be no more than the inner wing span and defining the chord ratios devoted to the landing gear, the planform area available for the baggage is obtained. Depending on the baggage volume requirements, the baggage compartment height is obtained, which determines the lower half’s relative thickness. Note that the minimum required thickness per half of the airfoil is obtained not at the thickest airfoil point but at the location where the relative airfoil half-thickness is the lowest, as shown in Figure 5b. Then the maximum half-thickness of the section can be obtained by scaling the actual thickness at the lowest point with respect to the reference airfoil selected by the designer. Finally, the total airfoil section thickness along the cabin is obtained by adding the upper and the lower maximum half thicknesses.
After the cabin and the cockpit are sized, the rest of the wing planform can be obtained. Multiple parameters are required before sizing the planform: the wing aspect ratio A R , reference area S r e f , the rear pressure bulkhead location at the cabin root section with respect to the chord x / c r s , the ratio of the transition portion of the wing with respect to the full span k b , the outer wing sweep angle Λ 2 , airfoil profiles along segment sections, and the outer wing taper ratio λ . Then, the total wingspan and the outer wingspan are found by
b = A R · S r e f
b w = b 2 b 0 b 1 = b 2 b 0 k b b 2
Then, the inner wing area S i n is found using the information about the rear pressure bulkhead location along the cabin section. The cabin root chord C 0 and the cabin side wall chord C w are found by
C 0 = L 0 x / c r s
C w = C 0 b 0 tan Λ 1
Knowing the inner wing chord lengths and the local span, the outer wing area can be obtained. The outer wing is also split into the transition and the outer wing portions, so the outer wing is defined by
S o u t = S r e f 2 S i n S c o c k p i t = S r e f 2 C 0 + C w 2 b 0 L c 2 b 0 = C w + C r 2 b 1 + C r 1 + λ 2 b w
where λ is the taper ratio between C r and C t . Equation (9) is solver for C r to obtain the following relation
C r = S r e f C 0 + C w b 0 C w b 1 L c b 0 b 1 + 1 + λ b w
The tip chord is found by
C t = λ C r
Finally, if the fuel mass is defined, the fuel tank available volume can be found by computing volumes of the transition and outer wing portions devoted to the fuel from planform and airfoil data and a relative position of the landing gear.
Hydrogen BWB Geometric Sizing
In the case of hydrogen BWB aircraft, the sizing procedure differs from the kerosene-powered one. Therefore, two sizing modifications were introduced for the hydrogen-driven BWB: a planform modification to extend the fuel tank segment to occupy more fuel and the fuel tank sizing procedure.
Figure 4b shows a sample hydrogen BWB planform diagram. Unlike the conventional BWB planform described above, an additional hydrogen fuel tank segment was included in the BWB sizing. The straight tapered wing portion is then defined by
b w = b 2 b 0 k b L H 2 b 2 b 1 = b 2 b 0 k b L H 2 b 2 k b 1 b 2
where b L H 2 is the fuel tank segment span and k b L H 2 and k b 1 are span fractions of the fuel tank and the transition wing portions, respectively. Assuming that the BWB rear pressure bulkhead remains parallel to the inner wing trailing edge, the fuel tank segment can be included in the inner wing portion definition along with the cabin segment, so the outer wing area becomes
S o u t = S r e f 2 C 0 + C w 2 b 0 + k b L H 2 b 2 L c 2 b 0
The expression derived in Equation (13) is then used as a left-hand side of Equation (9), while the right-hand side remains similar to the kerosene configuration. Finally, the modified equation is solved for the root chord and the expression is defined by
C r = S r e f C 0 + C w b 0 + k b L H 2 b 2 C w b 1 L c b 0 b 1 + 1 + λ b w
The fuel tank sizing for the hydrogen BWB aircraft significantly differs from the kerosene-powered BWB due to specific requirements to carry hydrogen. Since the fuel tank compartment highly deviates from a cylindrical shape and potentially creates significant limitations to embedding an integral set of fuel tanks, multiple cylindrical non-integral tanks were considered in the present work. However, as a part of the planform sizing, a required number of fuel tanks must be determined so the planform shape has a sufficient amount of volume to allocate the fuel.
In Figure 4b, the fuel for the hydrogen BWB is located only in the transition portion of the wing due to the low thickness of the outer wing portion. The compartment is split into several cylindrical tanks. The selection of cylindrical tanks is driven by the design flexibility of the planform and a potentially significant difference between the transition portion thicknesses at its root and tip. Since the segment is rather slender, the option of the elliptical tank may lead to excessive weight penalties. A separate hydrogen fuel tank study related to a more optimal tank shape for the BWB needs to be conducted to determine if a set of elliptical tanks can be a more convenient option with respect to the aircraft volume available for the fuel. For the present work, it was decided to use multiple cylindrical tanks as a more conventional design option.
To determine the available fuel volume, the number of fuel tanks needs to be determined. Figure 6 shows the BWB cross-section with fuel tanks embedded into the transition portion. The transition portion cross-section is simplistically defined by two straight lines that connect the inner segment and the outer wing portion. The lines are given by functions f 1 and f 2 and have dihedral angles of Γ 1 and Γ 2 . The transition portion can be divided into several trapezoid cells A B C D , as shown in Figure 6, where one fuel tank is inscribed into each cell. However, it is unknown how many cells can be included in the segment and which diameter each tank will have. The solution for the given question starts from the cabin side wall, where the initial diameter of the tank D i is defined. The condition which enables the circle inscription into the trapezoid is defined by
A B + D C = A D + B C
Each side can be described in Equation (15) as a function of the tank diameter. The upper and lower sides of the trapezoid are defined by
A D = D i cos Γ 1
B C = D i cos Γ 2
Lengths of the cell side walls are defined by
A B = f 1 Y i f 2 Y i
D C = f 1 Y i + D i f 2 Y i + D i
Assuming the initial tank diameter value and plugging Equations (16)–(19) into Equation (15), the satisfaction of the geometric condition can be checked. Since the initial diameter is not the correct solution, Equation (15) will have an error ϵ d which is a sum of required changes in lengths of the upper and lower sides to fit the circle. So, the error is defined by
ϵ D = Δ A D + Δ B C = A B + D C A D B C
where incremental length changes Δ A D and Δ B C can also be defined as functions of the required change of the tank diameter, so
Δ A D = Δ D i cos Γ 1
Δ B C = Δ D i cos Γ 2
Changes in upper and lower side lengths can also be modified by manipulating Equations (21) and (22) to have the following form
ϵ D = Δ A D + Δ B C = Δ A D 1 + Δ B C Δ A D = Δ A D 1 + cos Γ 1 cos Γ 2
Equation (23) is solved for Δ A D and Equation (21) is used to obtain the change in the tank diameter Δ D i . Finally, the new tank diameter becomes
D i + 1 = D i + Δ D i
Observing Equation (23), the relative error changes with the new tank diameter, so the iterative solution is required to converge to the final tank diameter. A similar sizing approach is repeated for as many tanks as possible, so the transition portion of the wing is fully filled with the number of potential fuel tanks N t a n k s .
Finally, unnecessary tanks are excluded depending on the required fuel volume, or more span is added to the transition portion to ensure that the required fuel can be stored. Note that the available thickness for fuel tanks is determined similarly to the kerosene aircraft, where the available thickness is computed at minimum half-thickness locations on top and bottom halves of the wing, as shown in Figure 7.

3.2. Constraint Analysis

The equations defined by Gudmundsson [47] and Loftin [48] are used to calculate the constraint diagram of the BWB. Aerodynamic coefficients required for the constraint analysis and effect of high-lift devices are initially estimated by the designer and are then updated at each iteration after the SUAVE analysis using embedded low-fidelity methods described in the following subsection. The thrust lapse model of Howe [50] was used to estimate the effects of speed and altitude on engine performance.

3.2.1. Aerodynamic Analysis

Aerodynamic analysis of the BWB aircraft at the initial sizing step was performed using low-fidelity tools. Aircraft lift was calculated using the AVL vortex-lattice method [51]. The drag of the aircraft was estimated using the component drag breakdown method, where the total drag is defined by
C D = C D p + C D i + C D c + C D m i s c
where C D p is the parasite drag, C D i is the induced drag, C D c is the drag due to compressibility, and C D m i s c is the miscellaneous drag which summarizes additional sources of drag not included in other drag components described.
The parasite drag component C D p is defined using a flat plate analogy for slender bodies [47] using Equation (26), where the wing is discretized into several segments and the skin friction drag is calculated for each segment. Then, the skin friction drag for each segment is corrected with the form factor F F , and all segments are summarized and corrected with the interference factor I F .
C D p = I F S r e f i = 1 N C f , i · S w e t , i · F F i
Induced drag is summarized using the method described by Nita and Scholz [52] and is defined for the BWB by
C D i = C L 2 1 π e t h e o A R + k v i s c C D p
where e t h e o is a wing span efficiency obtained using AVL, C D p is the wing parasite drag calculated using Equation (26), and k v i s c is a coefficient corresponding to changes in friction and pressure drag due to the change of the wing angle-of-attack equal to 0.38. The Oswald efficiency for the mission simulation as well as each constraint in the constraint diagram is estimated during each sizing loop and is dynamically updated, so the constraint diagram captures the effects of the Oswald efficiency changes.
Effects of high-lift devices were implemented into SUAVE using methods of Torenbeek [49]. particularly, BWB features only the leading edge droop nose at the outer wing to extend the value of the critical angle of attack.
Compressibility drag was estimated using the method of Shevell [53], which was derived for conventional aircraft. In fact, the use of a semi-empirical method for conventional aircraft may not be a sufficient representation of the compressibility drag of the BWB due to differences in the planform. Therefore, the applicability of the methodology will be checked in the later section.

3.2.2. Weight and Balance Estimation

The FLOPS [54] method was used to calculate the aircraft’s empty mass since it already includes estimation methods for hybrid wing body aircraft. There, the empty mass is divided into the mass of the outer wing and the mass of the aft wing body of the inner wing. The fuselage mass calculates the part of the BWB responsible for the aircraft cabin. In the case of the hydrogen BWB, the fuselage mass also assumed the portion of the inner wing which contains hydrogen tanks.
A component weight breakdown method of Brewer [55] was used to estimate the weights of all components of the hydrogen fuel system, such as heat exchangers, valves, pipes, etc. Since limited information about the weights of each component is available, constant values obtained by Brewer were used. Weights of hydrogen fuel tanks were estimated using both structural and thermodynamic physics-based analyses described by Verstraete [56] and Winnefeld [57]. The structural analysis is based on hoop stress analysis with limit load factors recommended by Brewer [55], while the thermodynamic analysis is responsible for the weight of the insulation. Since fuel tanks are located in compartments outside the pressurized cabin, all structural loads and thermodynamic properties are considered with respect to the ambient air at the worst design condition along the flight envelope. The present work considers polyurethane foam insulation as a more conservative but reliable insulation option. For each tank obtained during the sizing step, a separate thermodynamic analysis is performed to determine the amount of the fuel boil-off and obtain a particular insulation thickness value. The method of Lin [58] was used to calculate the heat transfer through layers of insulation. Due to the non-linear thermal properties of the insulation, the insulator is divided into several segments through which temperature changes linearly. Each segment of the insulator has its own resistivity R, as shown in Figure 8. Static heat-balance equations are used to simulate the heat transfer from the ambient air to the hydrogen fuel.
The heat transfer model from the ambient air to the liquid hydrogen is defined by Verstraete [56].
Aircraft center of gravity estimation is performed using force balance equations based on component weight breakdown. To simplify the analysis at the initial stage, the three most critical CG locations were considered: the CG at MTOM, the CG, and zero-fuel mass (ZFM) after the design mission, and the CG at the operating empty mass (OEM). Variations of payload with the number of passengers and passengers layout are conducted during the refinement phase.

3.2.3. Propulsion

The gas turbine energy network is modeled using a physics-based approach summarized by Cantwell [59], where each engine component features particular characteristics based on the cycle analysis and the type of fuel used. For the case of the hydrogen combustion engine, the hydrogen expander cycle was assumed as one of the most efficient utilization methods of hydrogen for engine cooling [55]. Effects of more efficient engine performance due to more optimal heat exchange mechanisms are treated using correction coefficients. Based on studies by Brewer, a 4.3% reduction in SFC with respect to conventional gas turbine cycles can be expected from the hydrogen expander cycle. Therefore, since hydrogen is substantially lighter than kerosene, hydrogen SFC becomes only 35% of the kerosene SFC. Additional SFC reduction due to the hydrogen expander cycle would further reduce the SFC to the overall value of 30% with respect to the kerosene SFC. The reduction factor-based differences in hydrogen and kerosene mass are treated within SUAVE inside the combustion model of Cantwell [59], while an additional 4.3% are added as a constant reduction factor.

3.2.4. Aircraft Stability Analysis

Aircraft stability analysis is estimated using AVL which calculates static stability derivatives, the location of the neutral point, and the trim state of the aircraft at various flight regimes. This information is then used to estimate if stability characteristics are satisfied if the aircraft can be trimmed at various locations of the center of gravity and sized control surfaces, and how the planform shall be changed.

3.2.5. Costs Analysis

Calculations of Direct Operating Costs (DOC) are computed using the method of Gobbin [60] and are divided into several components: energy, maintenance, capital, crew, and fees. Total DOC is then defined by
D O C = D O C E n + D O C C r e w + k a d v t e c h · D O C M a + D O C C a p + D O C F e e s
where D O C E n are energy costs, D O C C r e w are crew costs, D O C M a are maintenance costs, and D O C C a p and D O C F e e s are capital and fees costs, respectively. In Equation (28), energy costs D O C E n are directly proportional to the fuel burn and fuel price. Labor costs and fees were taken from the reference year of 2010 and were corrected by the inflation factor depending on the desired operational year. An additional penalty coefficient k a d v t e c h was introduced to maintenance costs to represent maintenance complexities related to the configuration and future technologies. Present research assumes that maintenance costs could be twice more expensive compared to current aircraft. The airframe price used for the capital cost estimation was estimated using the method of Roskam [61] where all parameters related to design complexity and advanced materials, such as carbon fiber composites, were maximized to model the design difficulty of new aircraft development. To account for LH2 tank price, an additional component using the assumption of Hoelzen [62] was added.
The price of LH2 was estimated using the approach suggested by Hoelzen [62], where hydrogen’s total price consists of production, liquefaction, transportation, storage, and refueling components. The total fuel price is defined by
p L H 2 = p p r o d + p l i q + p t r a n s + p s t o r e + p r e f u e l
Here, transportation, storage, and refueling costs can be combined together and generally correspond to 9–10% of total fuel costs [62]. In the present work, various scenarios with assumptions similar to the ones described by Hoelzen [62] were considered. Table 1 and Table 2 summarize the cost bounds of different hydrogen production types based on various scenarios.

3.2.6. Emission Analysis

The emissions of hydrogen and kerosene aircraft were performed using the method derived by Scholz [64]. The overall emission level is represented by the equivalent CO2 emission m C O 2 , e q which accounts for the effect of NOx, contrails, and cirrus clouds. To account for the effect of altitude on the emission along the entire mission, the emission model was integrated into the SUAVE mission analysis to calculate local emissions at each point during the mission. The equivalent emission for an incremental distance is defined by
m C O 2 , e q , G T i = ( k 0 E I C O 2 f k m + k 1 k 2 E I N O x f k m C F m i d , N O x + k 3 k 4 C F m i d , A I C ) Δ R k m
where E I C O 2 is the emission index equal to 3.16, E I N O x is calculated using the Boeing Method 2 [65], Δ R k m represents the incremental range in km, f k m is the local fuel flow rate in kg per km, and C F m i d is the correction factor to convert the value into the equivalent CO2 emission defined by
C F m i d , N O x = S G T P O 3 s S G T P C O 2 s O 3 s + S G T P O 3 L S G T P C O 2 s O 3 L + S G T P C H 4 S G T P C O 2 s C H 4
C F m i d , A I C = S G T P c o n t r a i l s S G T P C O 2 s c o n t + S G T P c i r r u s S G T P C O 2 s c i r r u s
where S G T P is the sustained global temperature potential and s is the forcing factor which depends on the altitude, Values of S G T P and s are provided by Dallara [66] and Scholz [64]. Finally, coefficients k 0 k 4 are correction factors that account for the fuel type and its effect on the emission. The correction factor k 0 represents if kerosene or hydrogen combustion options are used with the value of one for the kerosene option and zero for the hydrogen combustion. Correction factors k 1 k 4 estimate the effects of hydrogen combustion overall emissions.
Several factors affect the hydrogen emission rate for NOx and contrails emission components. Considering emissions of NOx, the chemical heat content of hydrogen is substantially higher than the kerosene fuel (120 MJ/kg for hydrogen and 43 MJ/kg for Jet-A). Generally, the amount of emission of a particular compound is directly proportional to the heat content of the propellant and the emission factor of the compound per unit of energy. If the NOx emission factor of hydrogen is assumed similar to kerosene [67], then its emission becomes 2.79 times larger than for the Jet-A fuel, which leads to the k 1 gain. However, hydrogen’s wider flammability limits enable leaner combustion that leads to lower flame temperatures [68,69]. The total amount of NOx reduction may lead to the range of 50–80% compared to kerosene. If converted to the Global Warming Potential (GWP), then the emission level may become 10–75% with respect to kerosene fuel with an average value of 35%.
The effect of contrails on the overall emission remains highly uncertain and also plays an important role in the overall emission level. In general, contrails and cirrus cloud formation highly depend on ambient conditions and can be described by the Schmidt-Appleman criterion defined by
G = E I H 2 O p c p ϵ Q ( 1 η )
where ϵ is the ratio of molar masses of water and dry air, c p is the air-specific heat capacity at constant pressure, and η is the engine efficiency. A higher value of the Schmidt-Appleman criterion describes higher tendencies of contrails formation at a wider range of altitudes and ambient conditions. In the case of hydrogen, the water emission amount is substantially higher than for kerosene which results in a higher emission index ( E I H 2 O = 8.94 for hydrogen and E I H 2 O = 1.24 for Jet-A). Plugging those values and the chemical heat content into Equation (33), the slope of the hydrogen phase trajectory line becomes 2.58 times steeper than for the Jet-A. This fact negatively affects the contribution of contrails and cirrus clouds on the overall emission. However, based on studies from the Joint Undertaking [68], ice crystals produced by hydrogen combustion are thinner than for kerosene fuel. Moreover, contrails are less visible in case of hydrogen combustion which also potentially lowers the climate impact. To account for both of these components, Scholz [67] suggests the factor of 0.36 to be applied to the overall emission of contrails and cirrus clouds based on the geometric relations of a simplified spherical ice crystal assumption. A more optimistic value for contrails was derived by Marquart [70] where an average radiative forcing for a cryoplane was reduced by 30% compared to the kerosene aircraft regardless of the fact that 2.5 more water vapor is emitted. A transformation of this value leads to a factor of 0.27 if the higher water vapor correction is applied, so a total of 70% of contrails are responsible for the hydrogen emission. Therefore, all corrections described above are added to Equation (30) in terms of gains that are summarized in Table 3. For the present research, average values of correction factors were used in case of a range of potential values.
Finally, fuel production is also taken into account. The amount of emission of hydrogen production highly depends on the type of production, so two types of production are considered in the present work: blue, and green. For green hydrogen, no additional correction factors were added to Equation (30) due to its net-zero emission potential. For blue hydrogen, production byproducts of carbon dioxide and methane are added to the overall emission calculation. Based on studies of Howarth [71], the emission level of 77 g CO2,eq/MJ of CH4 during the blue hydrogen production with flue-gas capturing was used for the model. For the kerosene production, an additional gain of 22% based on studies of Pavlenko [72] was used. The emission to produce hydrogen or kerosene is defined by
m C O 2 , e q , G T i = E I L H 2 , p r o d · C L H 2 · m f , i , Hydrogen production 1.22 m C O 2 , e q , G T i , Kerosene production
where E I L H 2 , p r o d is the emission index of hydrogen production in kg CO2,eq/MJ and C L H 2 is the liquid hydrogen energy density in MJ/kg, m f is the segment fuel burn in kilograms.
Finally, the total emission of the hydrogen aircraft is calculated by
m C O 2 , e q , G T = i = 1 N R m C O 2 , e q , G T i + i = 1 N R m C O 2 , e q , G T i

3.3. Analysis and Optimization Block

The Analysis and Optimization block consists of additional modules that can be used to further improve the design and perform more sophisticated analyses and sizing tasks. The block generally consists of low-fidelity tools based on either semi-empirical methods or physics-based approaches and requires more manual work to perform more detailed aerodynamic and stability analyses, obtain performance maps, analyze various mission scenarios, properly size the landing gear, and other tasks. The block can be enhanced by external modules responsible for various tasks of different fidelity levels or optimization blocks for further aircraft refinements. The present work utilizes two different optimization frameworks to refine the design and further explore the design space compared to a classical constraint analysis. A low-fidelity MDO module based on MATLAB performs a multi-disciplinary optimization with a consideration of the mission analysis, emissions, and costs to further improve the design based on the initial sizing effort. The high-fidelity aerodynamic optimization framework is used to identify problematic aerodynamic areas of the BWB, refine the shape of the aircraft, and also assess the reliability of low-fidelity tools regarding aerodynamics and aircraft static stability. The present section focuses on the optimization framework as the most critical aspect of aircraft sizing in this block.

3.3.1. Low-Fidelity MDO Framework

Low-fidelity MDO studies are performed by coupling SUAVE with the MATLAB Optimization Toolbox. The Genetic Algorithm was used for the optimization to further explore the design space and approach to a better design. To account for the constraints in GA, the penalty function similar to one defined in Ref. [73] was used. The penalty function is defined by
f p = μ ( y y c ) y y c 3
where y is the design variable, y c is the design variable constraint, and μ is the unit step function equal to zero for y y c . With the introduction of the penalty function, the objective function becomes
f = f + i = 1 N f p
where N is the total number of design variables. The number of species for each optimization study depends on the optimization problem and the number of design variables.

3.3.2. High-Fidelity Aerodynamic Analysis

Although several methods are available to estimate the aerodynamic characteristics of BWB aircraft, an uncertainty mainly related to the estimation of compressibility drag remains. Initially selected airfoils and planform characteristics may not always meet the desired requirements and shall be modified [74]. Therefore, a high-fidelity aerodynamic analysis and optimization method is utilized in this work to refine the initially sized aircraft shape to eliminate potential strong shock waves and obtain an optimized design for the subsequent preliminary design.
The MACH-Aero framework is an open-source multidisciplinary design optimization framework for aircraft with high fidelity, which supports high-fidelity aerodynamic and aerostructural optimization applications. MACH-Aero integrates the open-source CFD solver ADflow developed by the MDO Lab [75], which is a finite volume structured multiblock mesh solver and can solve both Euler and RANS equations. In this study, three-dimensional (3D) compressible RANS equations with the Spalart Allmaras (SA) turbulence model are solved for high-fidelity aerodynamic analysis.
The aircraft planform is parameterized by using the free-form deformation (FFD) technique, which can control aircraft geometry with a limited amount of design variables, making it suitable for aerodynamic shape optimization applications. In this work, the open-source code pyGeo [76] is employed for aircraft geometric parameterization. Figure 9a shows a sample FFD box applied for the kerosene BWB aircraft.
The structured multi-block mesh is generated using ICEM and Figure 9b shows a sample BWB mesh. Mesh deformation algorithm should be utilized in aircraft aerodynamic shape optimization to handle large mesh perturbations and maintain robustness during the deformation process. The inverse distance weighting (IDW) algorithm in the open-source code idwarp [77] developed by the MDO Lab is employed. Through the IDW function, the surface mesh perturbations, such as translation and torsion, are transferred into the spatial mesh, which is then updated.
One of the key benefits of the Mach-Aero framework is that gradient-based optimization is employed using the adjoint method, so a large number of design variables can be introduced without a major increase in computational time. The SNOPT (Sparse Nonlinear OPTimizer) [78] is used as the nonlinear optimizer to solve the aerodynamic shape optimization problem.

3.4. Technology Implementation

To account for technological advancements that can be expected in the future, a set of models and assumptions can be considered. Airframe technology assumptions are summarized in Table 4. There, the load alleviation assumption is motivated by internal cluster goals while structural weight reduction is obtained from an average value obtained in several available resources with respect to a metallic structure. Moreover, the weight of non-integral carbon fiber hydrogen fuel tanks is assumed 30% lower than the aluminum ones [79].
As for propulsion technologies, a rather large and long inner wing planform of the BWB and the potential of allocating engines on the aircraft enable utilization of the boundary layer ingestion technology to reduce the SFC. To initially size the aircraft featuring BLI with minimum computational effort, a model of the technology’s effect on the SFC is required. To simulate the effect of the BLI, a simplified physics-based model was derived based on studies of Budziszewski and Voigt [39,40]. A free-body diagram of the engine under the influence of the BLI is shown in Figure 10.
One of the representations of the BLI is described by the power saving coefficient (PSC) defined by
P S C = P N o B L I P B L I P N o B L I
where P N o B L I and P B L I represent propulsive powers without and with the effect of the BLI, respectively. The propulsive power of a typical engine without BLI and assuming both inlet and outlet have a similar cross-sectional area is defined by
P N o B L I = 1 2 ρ V i A N V j 2 V i 2
where A N . is the cross-sectional area and V i and V j represent the diffuser inlet and the jet velocity profiles.
In the case of the influence of the boundary layer, the inlet boundary layer profile can be split into two separate streams, as shown in Figure 10, where the boundary layer has the free-stream segment and the equivalent boundary layer segment, as was described by Budziszewski [40]. This way, the total propulsive power can be split into two separate components and each power contribution can be calculated using Equation (40). There, A N o B L and A B L are cross-sectional areas covered by the free stream and the boundary layer, respectively.
P B L I = P N o B L + P B L = 1 2 ρ V E A N o B L V j 2 V E 2 + V B L A B L V j 2 V B L 2
Inlet segments areas are defined by the following relations
A B L = r N 2 2 ϵ sin ϵ
A N o B L = π r N 2 A B L
ϵ = 2 arccos 1 δ r N
where r N is the inlet radius, ϵ is the sector angle in radians and δ is the boundary layer thickness. Finally, to fully define both inlet streams, the boundary layer velocity is determined using the derivation of Budziszewski [40] and is defined by
V B L = θ δ * V E
where V E is the free-stream velocity for the parallel compressor model and δ * and θ are displacement and momentum thicknesses, respectively, which depend on the boundary layer profile. To simplify the solution, a flat plate fully turbulent boundary layer solution of von Karman and the 1/7th power law for the boundary layer were used [80].
Finally, to obtain the jet outflow velocity, Equation (45) for the case where the BLI is not utilized is used.
T = ρ V i A N V j V i
Knowing the thrust at the cruise condition, Equation (45) is solved for V j to obtain power values of P B L I and P N o B L I and then calculate the PSC. Finally, considering that SFC is directly proportional to PSC, the SFC increment is added to the SFC increment of the UHBPR engine to obtain the total fuel consumption reduction ratio.
The effects of UHBPR engines are modeled using a correction factor implemented in the benchmark engine model. The correction factor was based on the cruise SFC similarity of three reference engines designed during the ENOVAL [81] project. There, three reference engines for regional, mid-range, and long-range aircraft were designed with an emphasis on maximizing their bypass ratios. Final engine configurations had relatively similar cruise SFC for all engines and a similar bypass ratio, regardless of their design thrust and size. A similar logic was applied to the present research. The benchmark engine SFC obtained using the physics-based model in SUAVE was corrected such that the SFC for the UHBPR engine at cruise matched the SFC of the UHBPR engine derived by the ENOVAL project.

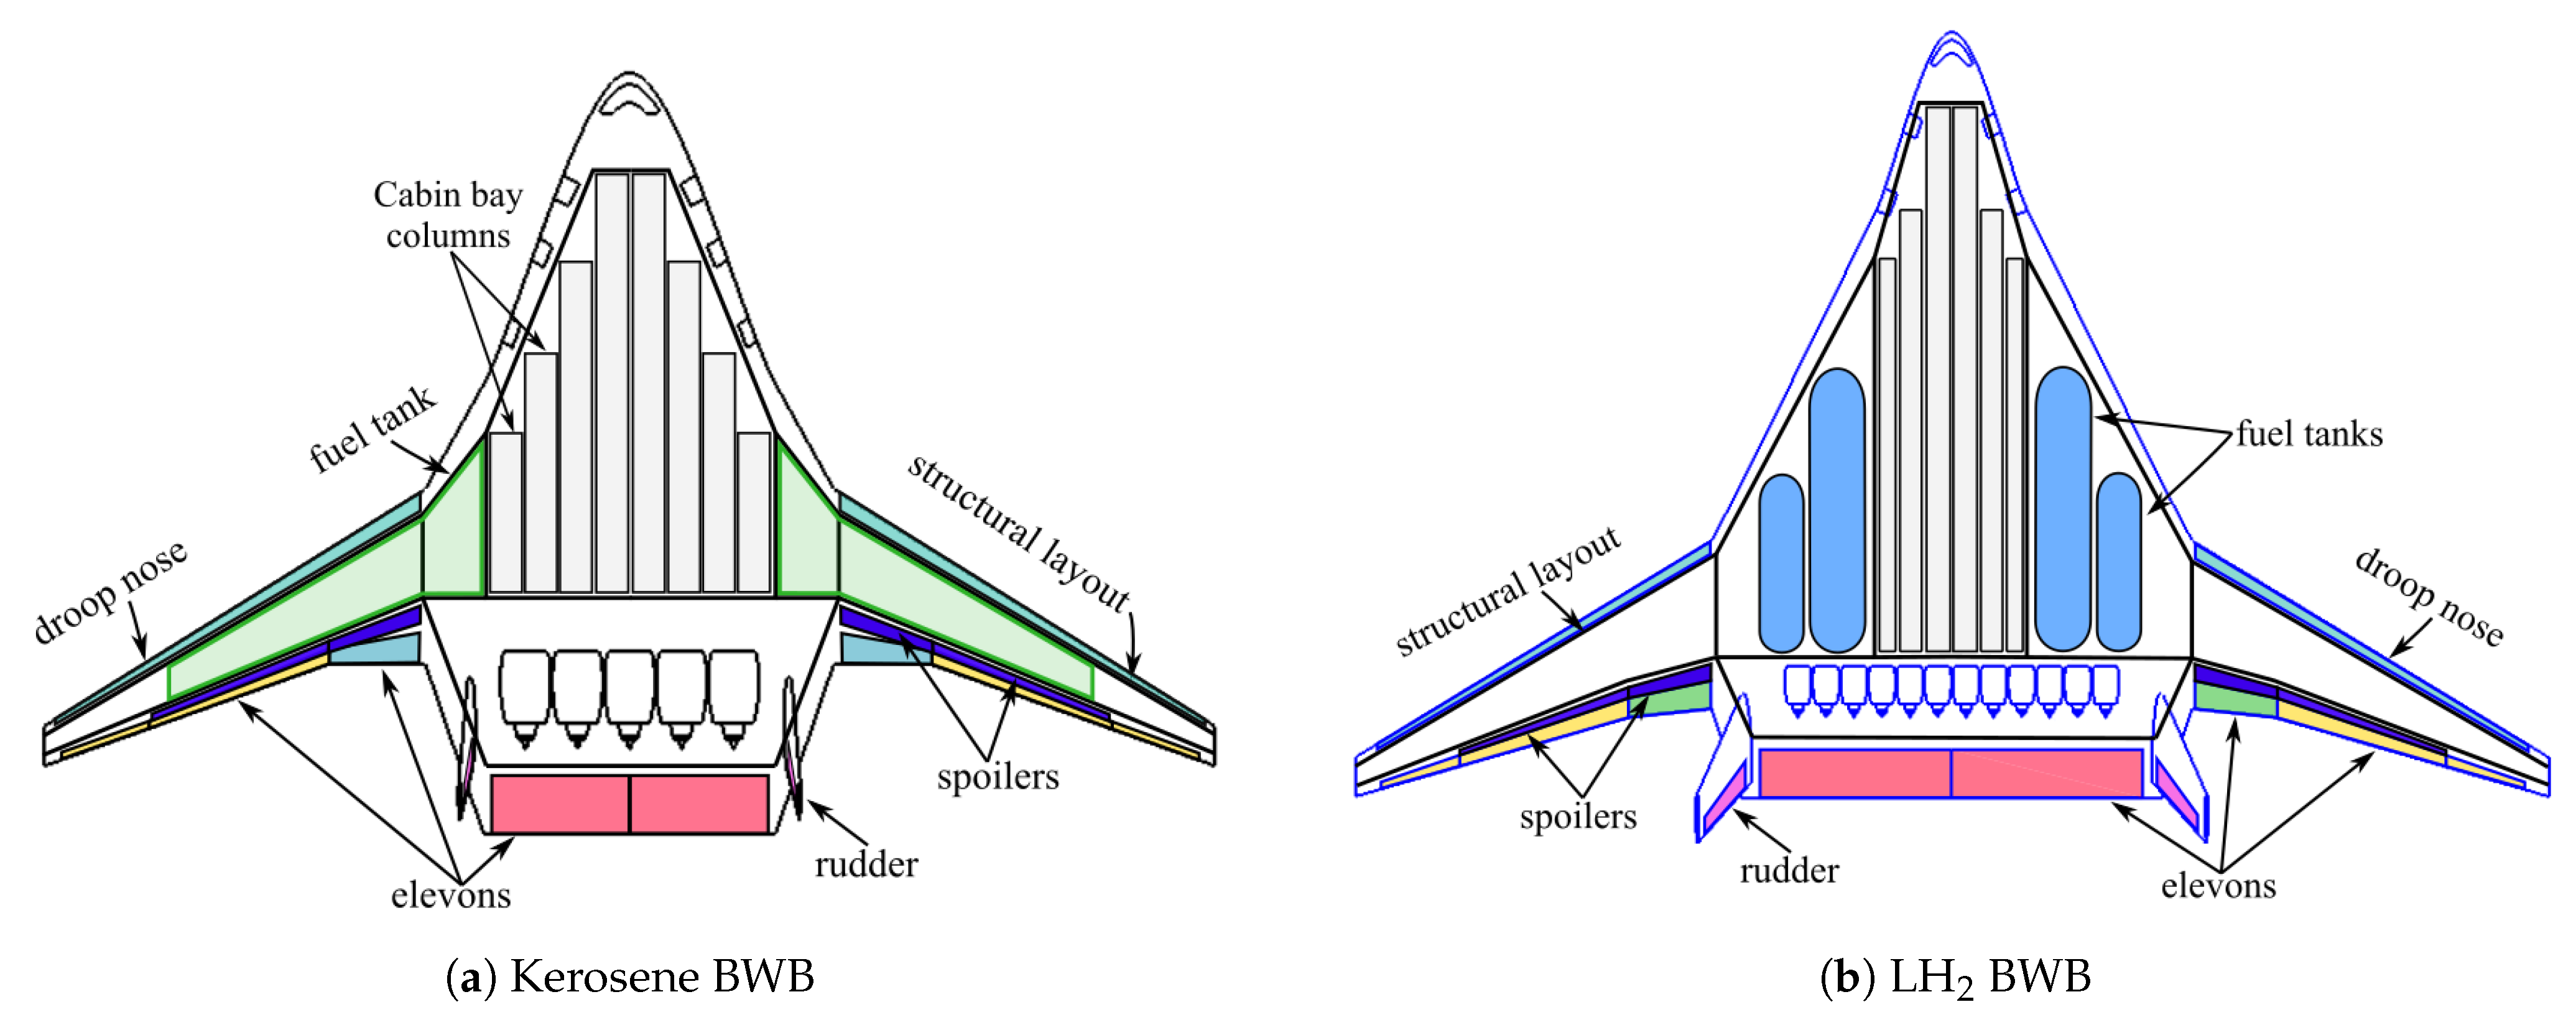
4. Comparative Study of Kerosene and LH2 BWB Aircraft

To investigate the potential of long-range hydrogen aircraft with future technologies, it is worth comparing it to the reference BWB aircraft that features similar potential improvements, so that potential benefits and drawbacks can be explicitly shown. The present section compares two BWB aircraft with different propulsion systems and summarizes the critical differences between the two.

4.1. Top-Level Requirements

Before performing the comparative study, a set of top-level requirements needs to be established. Determination of these requirements for future sustainable long-range aircraft remains a challenging task from the operational standpoint due to uncertainties related to the influence of aviation on the environment, costs, and fleet operations. In fact, uncertainties at this stage are too high to determine what flight operations are applicable to satisfy all three aspects. The goal of the present subsection is to establish the design range cruise altitudes and Mach numbers that could potentially minimize the overall aircraft emission and be feasible in terms of operations with several assumptions that may be achieved in the future. The latitude significantly affects the tendency in the formation of contrails with altitude, where mid-latitude regions generally do not benefit from lower altitudes unless significantly lower altitudes are considered, as shown in Figure 11 [82]. On the other hand, operations of long-range aircraft around the world are not limited to Atlantic and Pacific flight corridors where it may be more beneficial to fly at slightly higher altitudes to avoid contrails. Moreover, a general conflict between contrails radiative forcing and radiative forcing of other elements also becomes more complicated at higher altitudes, which also does not guarantee a major overall reduction of emissions. Therefore, a complicated decision needs to be made to determine a preferable range of flight altitudes with a rather uncertain and incomplete set of information. Table 5 shows the summary of average utilization times of the B747-400 as the only available aircraft close to the reference B777-300ER in terms of airspeed and range. In addition, a set of 515 worldwide routes of B777-300ER was collected to determine the flight duration statistics [83]. Figure 12a shows the summary of flight durations for various flight options, while Table 6 summarizes the study statistics.
The statistics of flight routes and a database of destinations obtained from Ref. [83] and shown in Table 6 can be used to determine the distribution of flight routes around the world and find a compromising solution for the design range of altitudes. To determine, if lower or higher altitudes can be more beneficial for long-range aircraft, it is necessary to understand not only the distribution of flights around the world but also the distribution of time spent for particular routes. The database of 515 routes can be split into two groups with equal combined flight times. Figure 12a shows sorted flight routes initially shown in Figure 12a based on the flight time. The black dashed line represents the boundary of two regions with the similar total added flight times, while the red horizontal line shows the flight time at the limit of two groups equal to eleven hours. A division into two groups helps identify two potentially similar categories of long-range aircraft flights based on total flight time. Assuming that flights are performed at relatively similar altitudes and airspeeds, the overall total emission of the two groups can be treated similarly. Therefore, by observing tendencies in routes for each group, one can estimate the potential effect of the altitude change on the emissions level in a qualitative sense. Figure 13 shows maps of two separate groups of routes with similar cumulative flight times.
Several trends can be observed based on the flight routes of each group. Trajectories of shorter routes frequently intersect the European and Middle Eastern regions, where flying lower is preferable. A rather large portion of flight happens in the Asian region and several routes happen in Australia, Africa, and South America. Although a rather large portion of flight happens over the Atlantic and Pacific flight corridors, where a significant portion of the flight mission happens in the zone of higher contrails, these flights can still benefit from flying lower, as was shown in Figure 11. Therefore, it is beneficial in an overall sense to fly lower, since the majority of flight routes happen at regions, where lower altitudes (a reduction of 6000 ft) mitigate the adverse effects of contrails.
Observing longer routes, a different flight pattern can be observed. Routes from South America to Japan, Australian routes, or routes to China, and some transatlantic routes operate at altitudes, where it is possible to mitigate contrails via flying lower. However, a rather large portion of routes operates at latitudes, where flying lower is not beneficial, if contrails are to be minimized. Therefore, it is potentially more beneficial to slightly increase the altitude for long-haul flights above eleven hours long for selected routes.
Based on observed trends, shorter and longer flights have potentially contradicting effects on the formation of contrails, even if the total flight time (which can be treated similarly to the emission amount) is equal for both regions: long-distance flights generally need to be flown at higher altitudes, while shorter flights will benefit more from lower ones. Therefore, it is important to estimate what general scenarios may benefit more at the global scale, since the range of design altitudes becomes excessive, if both strategies for shorter and longer flights are to be satisfied. It is also important to note that operational seasons affect the annual mean contrail formation. Due to more beneficial summer seasons for the entire set of flight routes, the average contrail coverage can be mitigated for a rather large part of the fleet, which includes almost the entire fleet of shorter flights and a portion of routes with longer flight distances. Moreover, the cumulative effect can be even more beneficial, if altitudes reduce further. Therefore, the present work focuses on the decision of having the design point at lower altitudes, while the service ceiling can be within a typical commercial aircraft altitude to maintain the effect of contrails for mid-latitude operations and provide enough operational flexibility. The design altitude of 7600 m was chosen as a design point with capabilities to reach altitudes of 10,500–11,000 m for more design flexibility.
Since typical flight altitudes will reduce for this work, design speeds will also have to reduce to ensure more efficient flight operations. Observing average values in Table 5 and Figure 12b, long-range aircraft can mostly perform 1–2 flights per day with some special cases of rather short-range flights with a large volume of passengers. Since many flights include two turnarounds, it is important to ensure that the reduction of the cruise speed still lets the aircraft complete one to two rotations without shifting the flight to the next day. Knowing the average number of rotations per day, a corresponding flight duration for the given number of rotations, and the total taxi and ground times, it is possible to calculate the daily utilization time of a given aircraft. The daily utilization of an aircraft can be described by
t u t i l = N f l i g h t t f l i g h t + t t a x i + t g r o u n d
where t u t i l is the utilization time, N f l i g h t is the number of flights, t f l i g h t is the flight duration, t t a x i is the taxi time, and t g r o u n d is the ground time. Assuming that the average statistical data of B777-300ER is similar to B747-400 shown in Table 5 and using data of Table 6, the average daily utilization time of 18 h was obtained using Equation (46). Assuming that ground operation efficiency can be further improved in the future, two possible scenarios of 10% and 15% turnaround time reduction were considered for the long-range aircraft in the most critical case of two flights per day. Obtained flight times for two flights per day gave a 5% and 8% increase in potential flight time for a 10% and 15% reduction in turnaround time, respectively. On the other hand, the longest flights need to be maintained as well, so the ground time reduction shall also be compared against the longest possible flight case of 16.58 h. In this case, the ground time optimization will lead to a flight time increase of 2–3% which is more critical than in cases with turnarounds. If those gains in flight time are converted to the reduction in cruise Mach number and transformed into the altitude of 7600 m, then the cruise Mach number becomes equal to 0.77–0.79. A more conservative cruise Mach number of 0.79 with a sufficient speed margin to get the MMO equal to 0.84 was chosen as the option for the new long-range aircraft. The present decision is qualitatively similar to the research outcome of Dahlmann [85]. There, a fleet of A330-200 aircraft and its modifications were investigated to compare operating costs and emissions for various altitudes. Studies suggested an altitude of 8000 m and cruise Mach number of 0.72 as the option, which may reduce the emissions level by 32% without damaging costs. Given results also indicate a similar trend towards generally lower operating altitudes and lower cruise speeds. Finally, given design speed and altitude studies were provided for the current state of flight operations. Any changes in regulations may move the trend towards particular altitudes even further. For instance, if regulations require lower altitude operations in local regions by law, then the trend towards lower altitudes as a TLR will become more obvious. Table 7 summarizes TLARs for long-range aircraft considered in the present research. The harmonic range, number of passengers, and maximum payload correspond to the reference B777-300ER.

4.2. Design Studies

4.2.1. Concept Definition

For both configurations, the baggage is allocated below the cabin, and fuel tanks are located near the cabin inside the inner wing and the outer wing, depending on the energy network used. For the hydrogen aircraft version, it is assumed that fuel tanks are located between main and rear spars, as shown in Figure 4b, and are non-integral. The cabin was sized based on the total cabin floor area of the reference B777-300ER aircraft, including space for galleys and lavatories, and used a cabin that features four, four, and six seats per row for the first, business, and economy classes, respectively. Since the number of bays significantly affects the configuration of the BWB and its performance, multiple numbers of bays were considered for the present design study. Configurations with three to five bays were sized to determine the benefits and drawbacks of each configuration and suggest the one which is the best compromise between conflicting parameters. The wing is composed of the NASA SC-0414 airfoils scaled at the outer wing, depending on the design, and initially manually modified in the inner wing to fit the cabin and then scaled during the design. To satisfy lateral stability and control requirements, a pair of vertical stabilizers were implemented for all configurations. Since the number of bays affects a possible cabin width and the area that can be used to allocate engines, it was assumed for the initial sizing and MDO refinements that the length between two vertical stabilizers is fully occupied by engines with a reasonable distance between engines and stabilizers. The diameter of engines for each configuration was sized dynamically using SUAVE, so each configuration will have a unique number of engines. Initial trade studies showed that if the option of distributed propulsion with BLI is considered, it is beneficial to maximize the number of engines within the geometric limits of a reference engine dimension.
The longitudinal location of engines depends on the CG envelope. Due to the small sizes of BWB engines because of their number and thrust requirements, a conventional engine with a bypass ratio of five was considered a benchmark engine for distributed propulsion, and SFC and engine diameter correction factors based on the application of UHBPR technologies and BLI were applied. Aircraft features multiple sets of elevons at the inner segment behind the engines and multiple sets of elevons along the outer wing.

4.2.2. Aircraft Sizing and Optimization

As was previously mentioned, the initialization of baseline configurations was performed using the initial sizing methodology and parametric study between the wing loading and aspect ratio for a fixed number of cabin bays, since cabin dimensions significantly affect the overall aircraft shape, performance, and stability. Then, a low-fidelity MDO problem using GA is performed to further refine the design. There, more variables and strong constraints are imposed to ensure adequate performance and stability characteristics. The MDO problem is summarized in Table 8. The problem consists of twenty design variables that include the BWB planform, geometric properties of vertical stabilizers, the thrust-to-weight ratio, and tank insulation thickness t / d i n s . Constraints include field performance, maximum span constraint that is equal to the airport Code F included in the ICAO Annex 14 [87], minimum operating static margin S M m i n according to the information summarized in Ref. [3], and lateral static stability derivatives C n β and C l β . Constraints for both derivatives were obtained from Ref. [3]. For the present work, an acceptable stability constraint for the yaw stiffness and a typical range for the roll stiffness were selected. Trim requirements for each aircraft for the furthest CG location are checked after the optimization.
Three different cabin configurations with three, four, and five bays were considered for the optimization. Figure 14 shows the final geometric layouts of configurations while Table 9 and Table 10 summarize their geometric characteristics and weights. For the weight breakdown, the fuselage mass m f u s e l a g e represents the mass of the cabin portion of the aircraft, as was defined by Bradley [9]. Multiple trends were observed after the sizing of BWB configurations. Observing kerosene BWB configurations, the fuel weight directly depends on the number of bays: the more bays the aircraft has, the more fuel the aircraft requires. This trend is a consequence of an increase in the relative thickness of the cabin inboard segment with more cabin bays because the chord length of the inner wing required to occupy all passengers reduces, but the geometric cabin and baggage compartment heights remain constant. That creates a higher pressure drag on the aircraft and reduces its fuel efficiency. The most fuel-efficient configuration features three bays due to the slenderness of the inboard wing. On the other hand, more slender cabin options strongly affect trim capabilities and the number of exits that play an important role that make the five-bay configuration more suitable and does not benefit the three-bay one. Based on obtained results, the four-bay configuration was selected as an aircraft with a lower fuel burn compared to the one with five bays, sufficient static stability and control characteristics, and not a very narrow cabin layout with respect to the number of exits.
During the sizing of the hydrogen BWB configuration, a significant issue related to cabin sizing was observed. Hydrogen fuel tanks require a large volume due to a low density of liquid hydrogen compared to kerosene. Moreover, the assumption of non-integral cylindrical tanks provides an inefficient utilization of the fuel tank compartment and makes the planform larger. A larger planform affects the drag of the aircraft and reduces the aerodynamic efficiency of the aircraft. Moreover, heavy fuel tanks also affect the distribution of the weights along the planform and affect the static stability of the aircraft. Experiments with four and five-cabin bays showed that a shorter inner wing planform negatively affects the fuel compartment by making it shorter and wider, which increases the number of required fuel tanks, increases the aircraft weight, and requires more fuel. As a consequence, a snowball effect is initiated, and no configuration with acceptable fuel tank volume for four and five bays was found. The only configuration which successfully managed to embed fuel tanks with desired fuel volume and to have acceptable stability characteristics was the three-bay one shown in Figure 15. However, cabin columns on each side of the cabin feature two seats instead of three for the economy class, as shown in Figure 16. The presence of fuel tanks and a relatively low value of fuel weight compared to kerosene makes the aircraft CG not as sensitive to the fuel presence compared to kerosene configuration and is easier to trim for critical flight conditions. On the other hand, the issue of potential emergency complications for the hydrogen aircraft remains unknown and shall be thoroughly studied to ensure that the aircraft can meet emergency certification regulations. Moreover, the allocation of the landing gear has become more challenging compared to the kerosene case. Since the cabin and the baggage compartment are narrower than for a typical BWB, some gears will have to be located between hydrogen fuel tanks. Although tanks from each side of the cabin can be separated apart to create space for the landing gear, a potential issue of tank damage in case of the landing gear failure appears. Due to the explosive nature of hydrogen, such scenarios may be catastrophic and need special design treatment and extensive safety assessments to conclude if such landing gear allocation can be certified.
Since the planform area is substantially higher than any of the designed kerosene aircraft, take-off, and landing field lengths became equal to 2538 m and 1410 m, respectively, which is 17% and 24% lower than the kerosene BWB take-off and landing field lengths.
A wider inner wing section and a generally larger planform enabled the hydrogen aircraft to fully utilize the benefits of distributed propulsion and boundary layer ingestion. The aircraft features twelve engines of a rather low diameter, as shown in Table 9. Combined with a long inner wing portion, the average SFC reduction using the physics-based method described above became equal to 16%, which is relatively similar to results observed for various configurations with a strong BLI effect [41,42,43]. At the same time, the kerosene BWB configuration had a 6.5% SFC reduction due to the geometric limitations of the configuration. Due to a highly distributed propulsion system and small engines, the propulsion system weight became more than twice lower than kerosene configurations, if correction factors for distributed propulsion of FLOPS are used, which assumes a sufficient technology improvement to optimize the propulsion system and minimize any prohibitive weight penalties [54]. However, such a significant reduction of the propulsion system weight shall be assessed using higher-fidelity models to estimate the potential weight of the system more accurately, since such a significant weight reduction may be overly optimistic.
Figure 17 compares two designed configurations, while Table 11 and Figure 18 compare equivalent CO2 emissions, energy consumption, and DOC of each configuration for the designed mission. There, a reference B777-300ER was also shown as a reference value of a currently operational aircraft and serves to indicate a cumulative effect of the configuration and technologies. From the figure, the kerosene configuration is substantially smaller than the hydrogen one and has a wingspan that satisfies current airport span regulations of 65 m. The span limit was a consequence of a balance between the planform area, the overall aspect ratio of the aircraft, and its strong stability and performance constraints. The hydrogen configuration also had a wingspan lower than the design limit of 80 m, but it was more than 65 m, which will force future changes in regulations.
If equivalent emissions are compared, the kerosene variant of the BWB showed a 35% reduction in equivalent CO2 emission compared to the reference B777-300ER, while hydrogen configurations have a potential of reducing emissions by 47% and 88% for blue and green options respectively. Not a significant difference between kerosene and blue hydrogen options was observed since the production emission of blue hydrogen may strongly compensate for in-flight emissions of kerosene. Compared to the reference conventional aircraft without technologies, airframe, and propulsion technologies combined with the configuration may significantly reduce the emission level if desired values are achieved.
On the other hand, the energy consumption of the hydrogen configuration is 27% higher than the kerosene BWB configuration and 35% lower than the reference B777-300ER. Energy consumption is particularly important for the green hydrogen option since current green energy production is significantly limited with respect to the energy demand to fly aircraft [88]. Although potential energy consumption for the hydrogen aircraft is significantly reduced with respect to the reference aircraft, the overall magnitude remains rather large, so the challenge of reusable energy production remains a significant driver of the viability of the green hydrogen BWB aircraft.
As was previously mentioned, various price scenarios could be achieved in the near future. Therefore, several cost cases shall be observed to determine potential commercial issues of advanced technologies and hydrogen fuel. Figure 18 illustrates three case scenarios described in Section 3.2.5 with respective fuel price bounds. Jet aircraft assume the prospective price of Jet-A fuel for 2050 and also include a potential extra carbon tax of 0.42 EUR/kg [89] to give a total price of 1.07 EUR/kg. If the optimistic or base price scenarios are achieved, then blue hydrogen has the potential of having similar or slightly lower DOC compared to the reference B777 and the kerosene BWB whose costs are relatively similar due to the costs penalties of the kerosene BWB aircraft. Particularly, changes in blue hydrogen DOC may range from −18% to +17% with almost similar costs to the kerosene version for the optimistic case, while a range of DOC differences from −8% to +33% with an average of +12% could be expected for the base case. The base scenario could become relatively expensive, but it could also be acceptable if an average value is reached. In the case of the pessimistic scenario, increases of DOC by 6–49% with an average of 27% could be possible, which makes the commercial applicability potentially problematic from the market standpoint. On the other hand, green hydrogen can be economically beneficial only in the optimistic case or if a lower bound of the base scenario is achieved. DOC differences from −21% to +27% with an average of +3% could be achieved for the optimistic scenario, while a range of +3–+67% with an average of +35% was estimated for the base scenario. In the base case, the range of values becomes more similar to the pessimistic scenarios of the blue hydrogen case, so the market applicability of the base case could become a problem. Finally, a range of +36–+134% was obtained for the pessimistic scenario, which makes this scenario inapplicable for future considerations. If the kerosene price scenario is satisfied, a more conservative energetic solution can be achieved with potentially similar costs to a conventional aircraft due to advancements in technologies. Initial estimates concluded that a potential reduction of DOC by 5% may be possible for the kerosene configuration compared to the B777-300ER. It is important to note that deviations in technology achievements may significantly worsen the viability of hydrogen aircraft due to more fuel required and airframe weight increase that is strongly affected by hydrogen tanks.

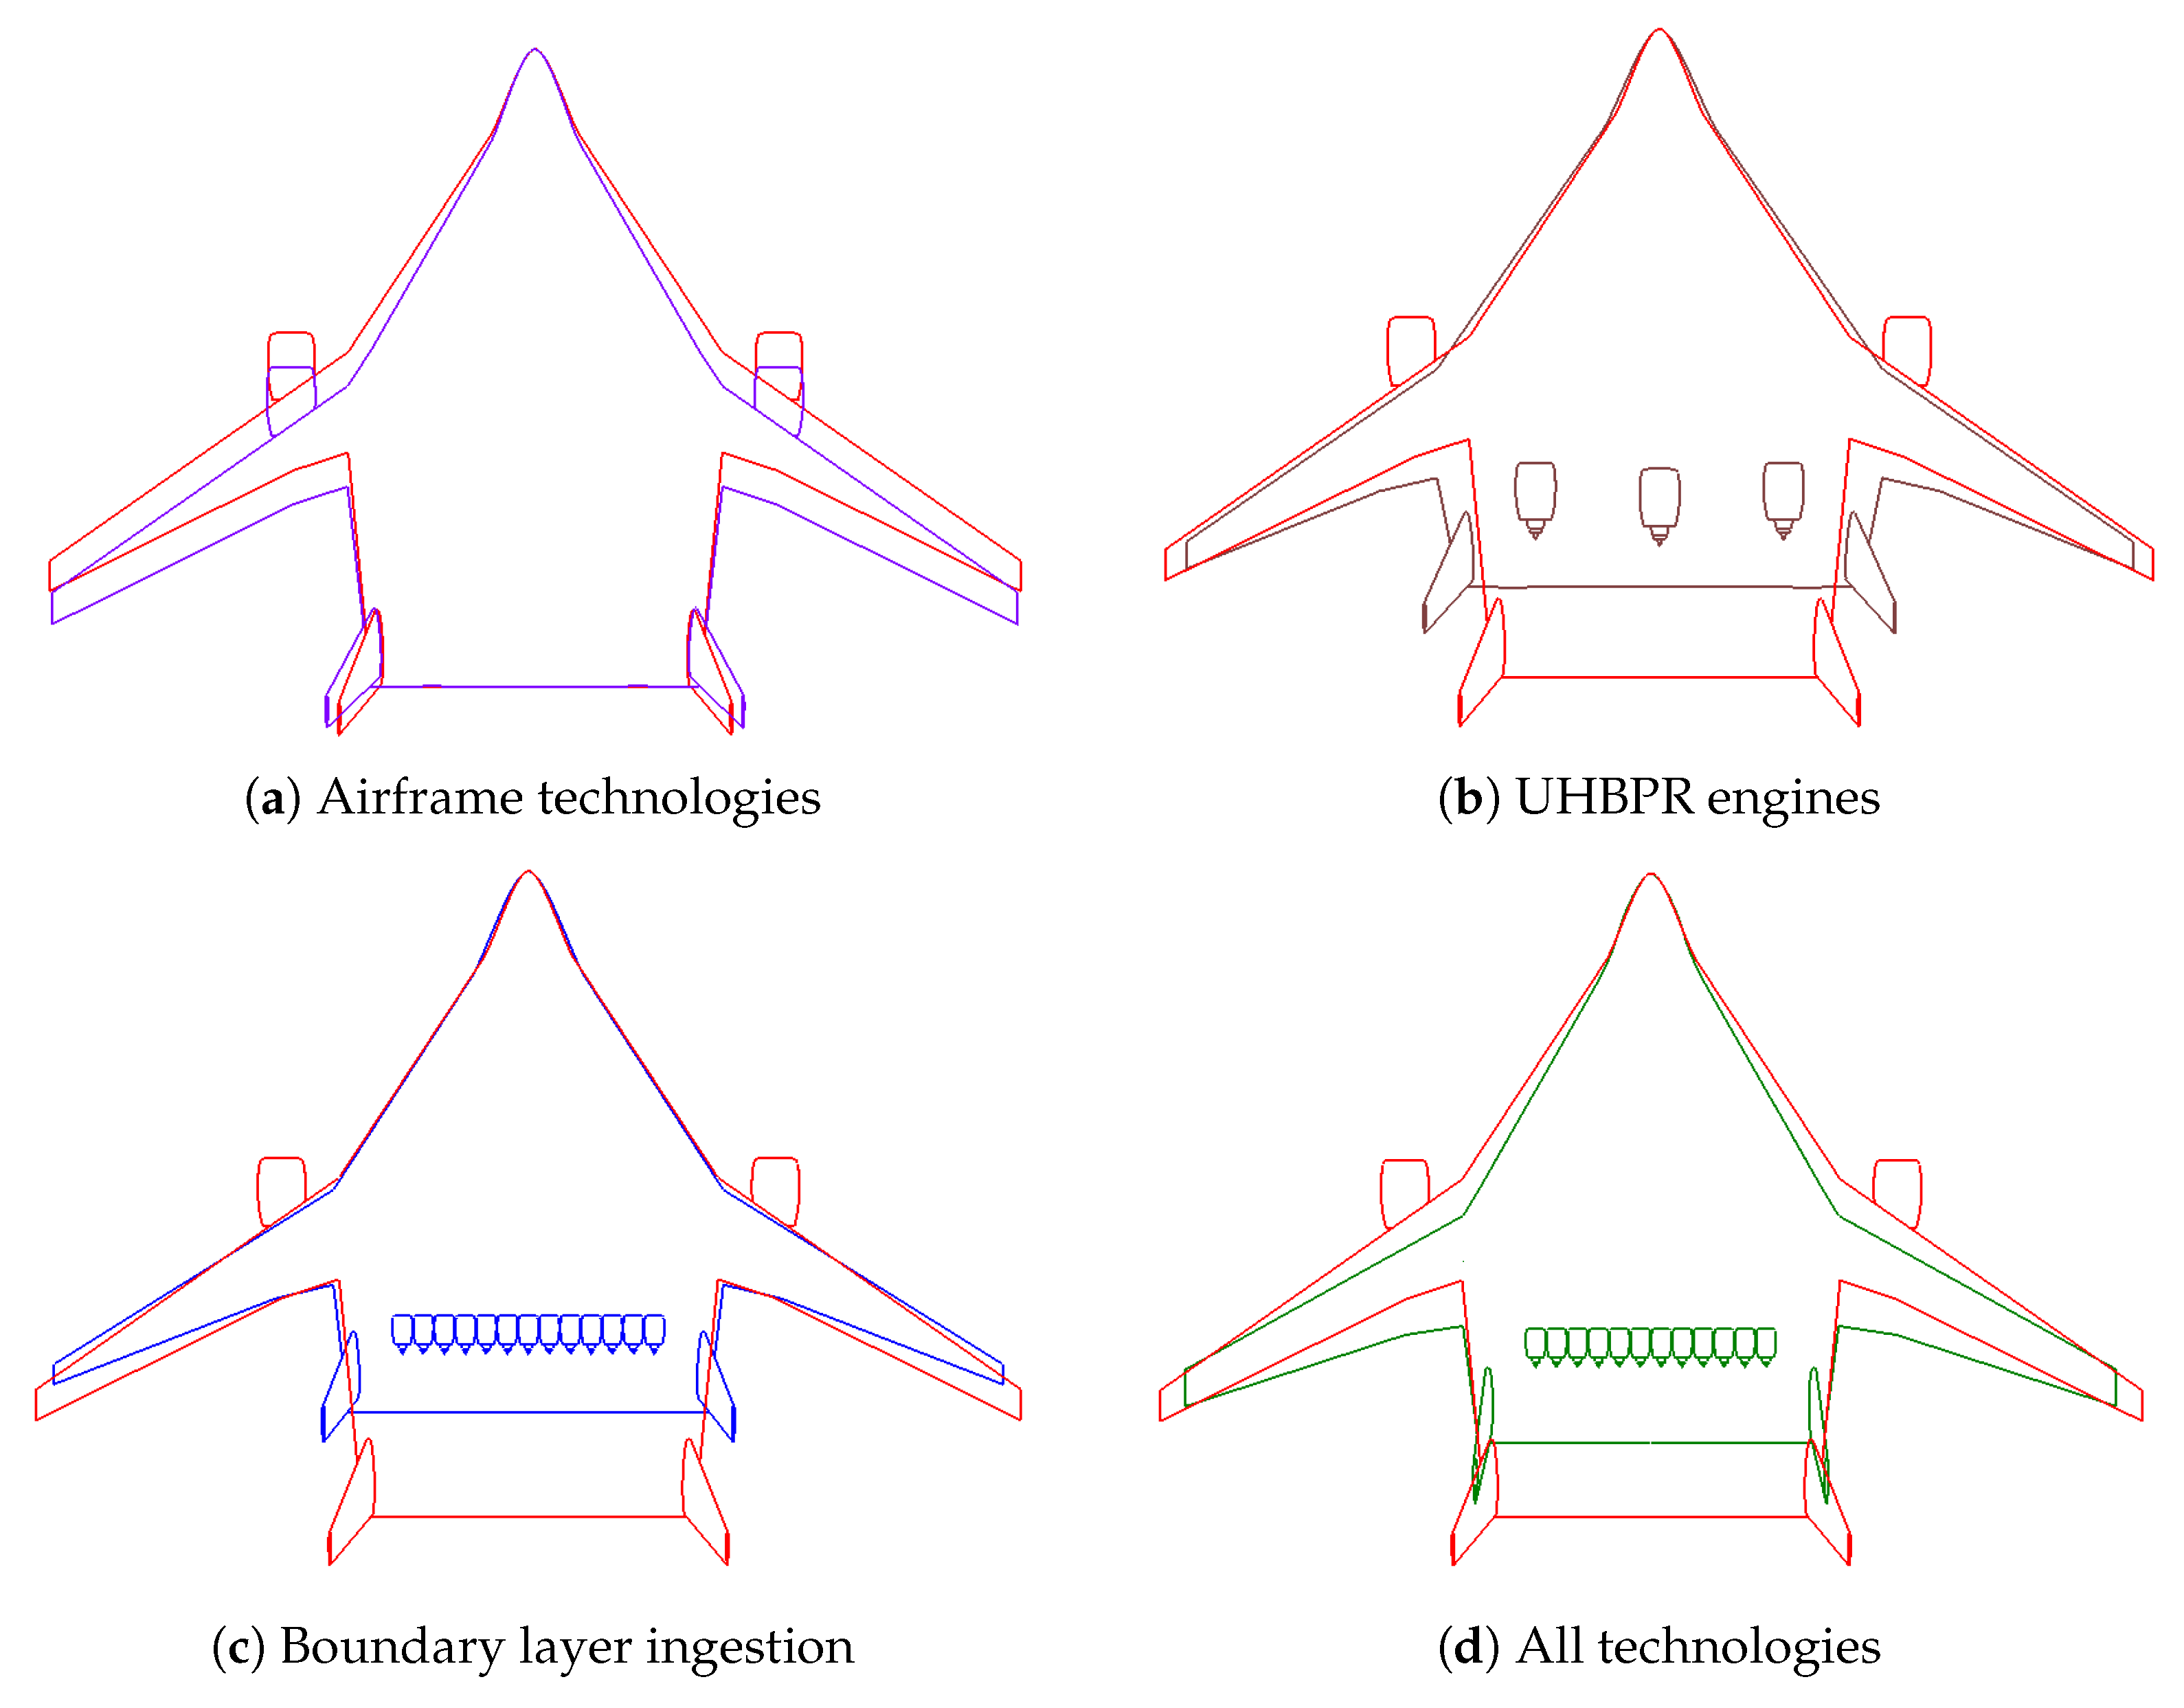
4.2.3. Technology Sensitivity of Hydrogen BWB Aircraft

The last task performed during the conceptual design phase of BWB aircraft was the technology sensitivity study of the hydrogen BWB aircraft. Given the strong design limitations of the BWB aircraft and the large volume required by fuel tanks, technology sensitivities may significantly affect the hydrogen BWB planform. Any significant deviation in technology outcome will force the hydrogen BWB aircraft to add more and larger fuel tanks and rapidly increase its weight, which will initiate a snowball effect and will require to change in the planform. Present subsection estimates which technologies affect the BWB the most with respect to the configuration design and emissions.
Four additional configurations were considered for the sensitivity study. Each of these configurations considered only one of the potential technological scenarios: an aircraft without future technologies, an aircraft with combined airframe technologies, an aircraft with UHBPR engines, and an aircraft with BLI propulsion. A similar procedure with the pre-sizing phase and a subsequent MDO described previously was used to size configurations for the given trade study. Moreover, depending on the benefits and drawbacks of each configuration, parameters such as the number of engines, their locations, and cabin layout were varied to achieve more viable configurations. In the case of aircraft without BLI, alternative engine locations and the number of engines were considered. Moreover, reference engines with a more conventional BPR of 8 and an option of higher BPR in the case of the UHBPR engines were used. Table 12 and Figure 19 summarize results obtained for each aircraft and compare them to the configuration with all technologies implemented, while Figure 20 compares planforms of each configuration.
Several important aspects were observed during the sensitivity study. If no airframe and propulsion technologies are implemented, the required hydrogen tank volume increases rapidly. However, more cabin bays of the aircraft distribute passengers along the span and make the planform shorter, which also creates physical limits to possible fuel tank volume outside of the cabin. The design case with initially prescribed three bays failed to satisfy the volume constraint for the required hydrogen volume, so an option with two bays was considered instead. This way, a longer cabin provides more volume but also makes the planform larger. At the same time, an initially described evacuation issue of hydrogen BWB aircraft becomes even stronger due to a more narrow cabin. Since no propulsion technologies were implemented, two engines located on the outer wing were considered to alleviate load from the outer wing. Note that the final configuration without technologies became similar to a freighter BWB aircraft previously considered by Seeckt [13] with comparable design requirements. Given that the freighter was designed for a mission similar to the B777F (which is a derivative of B777), it is possible to partially verify the sizing method using the aircraft without technologies. Figure 19a includes a summary of weights for present aircraft and the freighter reference, in which an error of empty, maximum take-off, and propulsion system weights does not exceed 11%. On the other hand, the fuel weight of the designed aircraft is 16% larger than the freighter version, which is a consequence of different aircraft applications.
Improvements in airframe technologies do not provide significant changes in the planform compared to the case without any technologies. Fuel burn improved by 4%, while the planform became slightly smaller. Moreover, sweep angles of the planform increased to attempt to minimize the relaxed stability of the aircraft which was observed for the case without technologies and was also stated by Seeckt.
For the case of the aircraft with UHBPR engines, improvements in fuel burn became significant, so a previously considered three-bay cabin layout became possible. The number of hydrogen tanks increased compared to the two previous cases since the hydrogen tank compartment became shorter. Due to a significantly larger fan diameter of engines in the case of an ultra-high bypass ratio engine, it was concluded to split the thrust among three smaller engines and place them above the wing. Since more fuel tanks are required for the configuration, the empty weight became larger compared to the case with airframe technologies, while the fuel burn was reduced by 19% compared to the case without technologies. Similar to previous cases, only the relaxed stability of the aircraft was achieved.
If only BLI is considered, then the platform becomes even smaller due to more fuel efficiency provided by the BLI. Since smaller engines were used compared to the configuration with all technologies considered, it became possible to include one more engine and further improve fuel efficiency. The fuel burn for the given configuration was reduced by 27% compared to the case without technologies. The planform also became smaller than the case with all technologies, since static stability was not achieved and the planform of the aircraft with technologies was significantly affected by static stability requirements. It is also important to note that the configuration with all technologies achieved a fuel burn reduction of 30% compared to the case without technologies, which is not substantially better than the case with BLI only. Such behavior is related to the conflicting influence of BLI and large fans with higher BPR: higher BPR improves fuel burn but also reduces the area affected by the BLI. Therefore, both technologies cannot maximize their potential and the fuel burn does not improve, given that airframe technologies are also present in the case of all technologies implemented. Minor changes in empty and maximum take-off weights were observed for the BLI case compared to the case with all technologies and the planform, On the other hand, smaller engines with BLI may maximize the benefits of the technology more than the UHBPR alone. Therefore, if targeted performance can be achieved, BLI may be a more powerful technology compared to the increase in the bypass ratio.

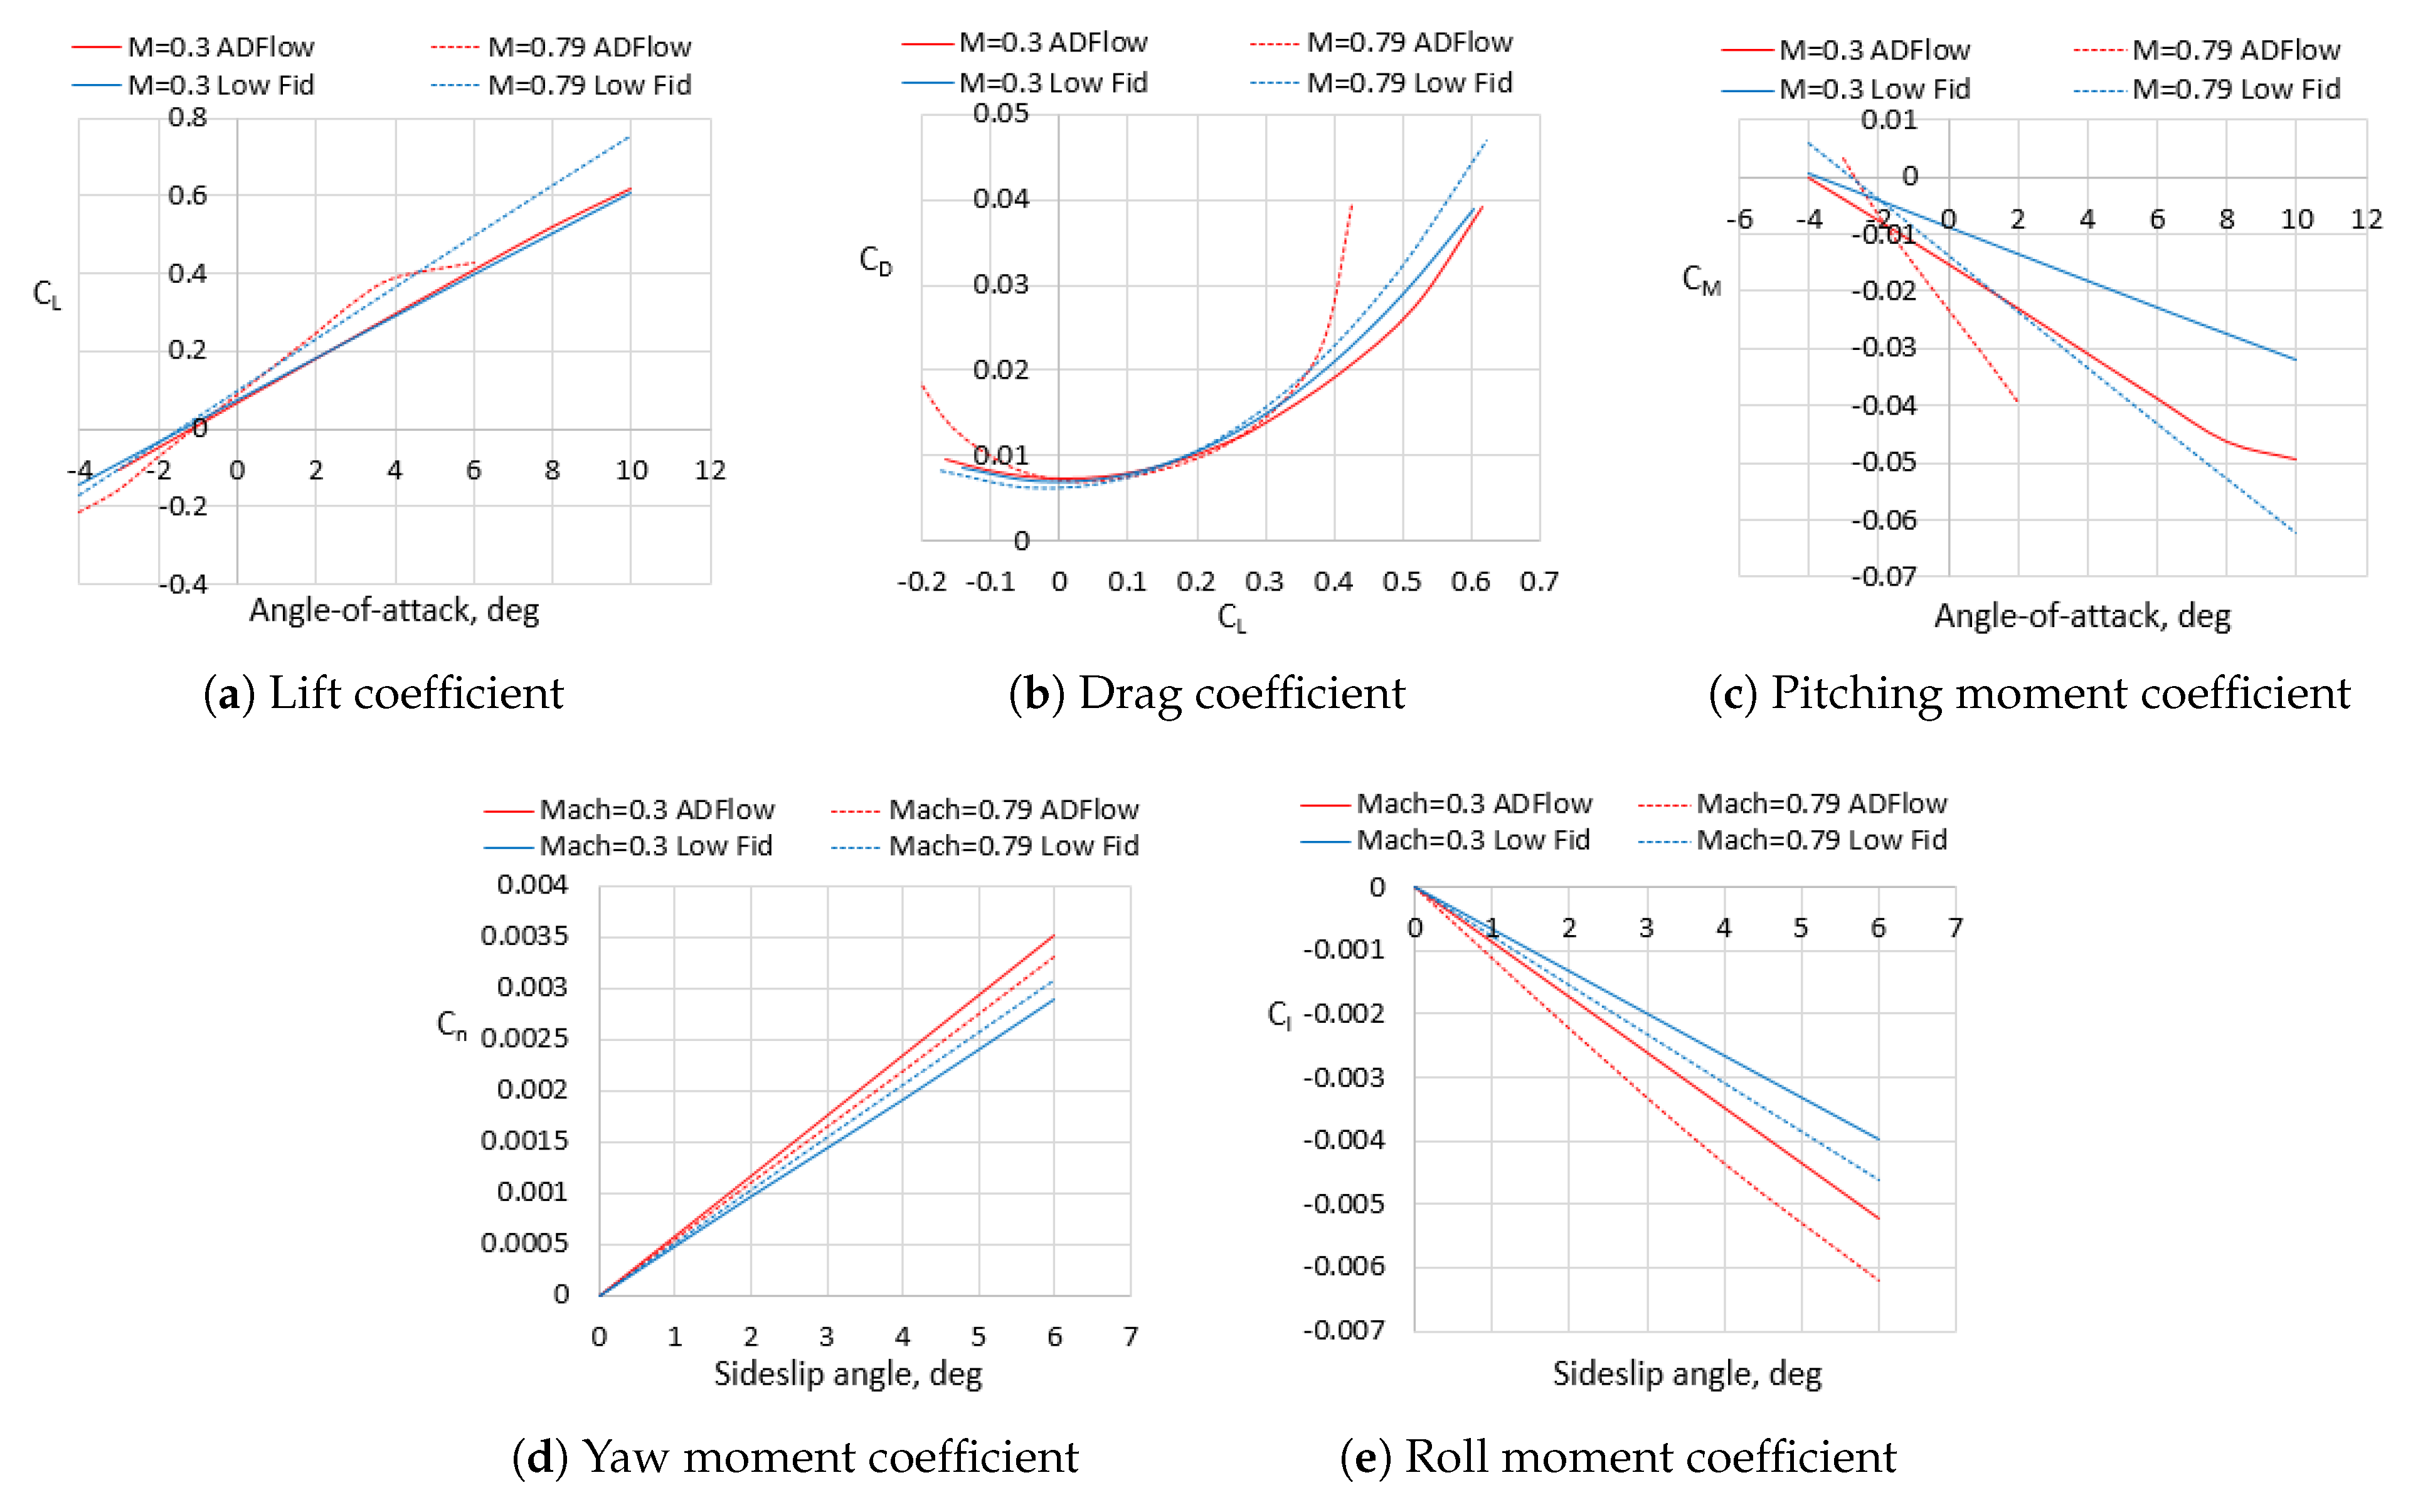
4.3. Verification of Aerodynamics Using High-Fidelity CFD

The present aerodynamic analysis used for the design and optimization is based on a rather low-fidelity vortex-lattice method and semi-empirical methods, that may be inaccurate for high transonic speeds, especially for unconventional configurations. Inaccurate estimation of aerodynamic characteristics of the BWB can not only affect estimations of aircraft’s weight and performance but can also show inadequate stability characteristics that are highly dependent on the geometry. Therefore, an aerodynamic verification study based on high-fidelity CFD methods was performed to determine if low-fidelity methods can be used for the initial sizing without major losses of accuracy. As was previously shown by Karpuk [74], initial sizing of BWB may be subject to strong shock waves and inaccurate results due to differences in estimation fidelity. Low-fidelity methods used for the present work utilized AVL for induced drag estimation, while compressibility drag was assumed for a straight tapered wing and may not be accurate enough for unconventional aircraft. Therefore, for each designed configuration, an aerodynamic shape optimization was performed to mitigate the aerodynamic limitations of low-fidelity analysis and compare the final results to the initial sizing outcome. This way, if initial values of aerodynamic coefficients show relatively good agreement with high-fidelity data, one may conclude that a low-fidelity analysis can be a sufficient option for an assumed good aerodynamic design.
The optimization objective in this work is to reduce the BWB’s drag at a given design Mach number and lift coefficient with a fixed-wing planform, i.e., the optimizer can adjust airfoil shapes using FFD points and wing spanwise twist distributions while keeping the wing span and chords constant.
The BWB configurations designed using methods described in Section 3.3.1 were used as reference configurations for the aerodynamic optimization. For the sake of simplicity, vertical stabilizers were removed and only the BWB wing was optimized. To ensure sufficient accuracy of the mesh used for the analysis and optimization, a grid-Independence study was performed. The mesh size of 16 million cells was selected as a good compromise between the solution accuracy and the number of cells, as shown in Figure 21. Each component’s Y + value was set in the order of 1 to ensure accuracy in solving the near-wall boundary layer flow. The optimization problem is generally formulated in Table 13. Here, the aircraft is optimized with respect to the cruise angle of attack α , local twist angle τ for each spanwise section, and local position of FFD control points Δ Z w i n g . The wing FFD box consists of two layers, one for the upper surface and one for the bottom, each with 6 chordwise by 11 spanwise control points that move vertically during the optimization. Several constraints were implemented as well. The lift coefficient constraint assures that the optimized configuration produces the same lift as the baseline configuration at the corresponding angle of attack. The pairs of control points on the leading and trailing edges must move an equal amount in opposite directions to avoid a shear twist. Thickness constraints ensure that the inner wing remains as thick, as was initially prescribed, while the outer wing may have a relative thickness reduction of up to 10%. Finally, the inner wing volume constraint was implemented for the inner wing to ensure that a sufficient volume for both cabin and hydrogen fuel compartments is preserved, as was initially sized using low-fidelity tools. The inner volume is calculated using the numerical integration of airfoils for each of the fifteen sections along the wingspan.
The comparisons of aerodynamic characteristics between the reference and optimized configurations at the cruise condition are shown in Figure 22 and Figure 23. All blue marks represent the initial configuration, while all red marks represent the optimized configuration. As was initially observed in a similar configuration in Ref. [74], the outer wing features a strong shock wave in both cases, which could not be captured using low-fidelity tools. Moreover, the lift distribution also deviates from the elliptical one, especially at the inner wing portion. Results after the optimization show a substantially more uniform lift distribution compared to the initial one. The twist distribution changed as well and features a rather rapid growth of twist in the transition region between the inner and outer wings. As was expected, the inner wing volume remained consistent with the initial one and only minor shape changes provided more uniform load distribution. The shape optimization of the outer wing minimizes the upper surface suction peak to weaken the shock wave. Therefore, given planform changes reduced the drag coefficient of the kerosene BWB and the LH2 BWB by almost 22% in both cases.
As mentioned above, the biggest uncertainty related to the modified aircraft shape and its aerodynamic and stability effects still remains. If the optimized shape using high-fidelity tools shows a rather different pressure distribution and therefore a different location of the neutral point, then the reliability of low-fidelity tools can be seriously questioned. Consequently, aerodynamic angle-of-attack and sideslip angle sweeps for two flight conditions were performed using both the high-fidelity aerodynamic analysis with ADflow and low-fidelity methods used during the initial sizing. Airfoil sections obtained after high-fidelity optimization were imported into the low-fidelity framework, so AVL can process consistent mean camber lines. Two flight conditions were simulated: cruise flight at the Mach number of 0.79 and altitude of 7600 m and the low-speed flight at the Mach number of 0.3 at sea level. Vertical stabilizers sized using a low-fidelity approach were merged with optimized wing shapes and new meshes were created for aerodynamic analyses, as shown in Figure 24. The goal of the verification study is to determine deviations in aerodynamic and stability parameters and detect important limitations of low-fidelity methods. The comparisons of the kerosene and LH2 BWB aircraft are illustrated in Figure 25 and Figure 26. At low-speed conditions, the lift coefficient demonstrates a close similarity to AVL, which was initially expected. The biggest concern was related to the high-speed case, where AVL may not be a reliable tool.
Comparison of lift curves shows a positive shift in the lift curve slope due to compressibility effects that are more accurately captured with high-fidelity tools. Moreover, onsets of the flow separation are also captured, which may also set limits to climb rates at given flight conditions. Generally, a sufficient margin was achieved before the flow separation occurs.
Comparisons of drag polars show relatively good agreement between low-fidelity and high-fidelity results after the shape optimization at low angles of attack, which concludes that the method of Shevell can generally be used for compressible flow estimations of well-designed BWB aircraft since the method was also based on well-designed wing planform with minimized compressibility drag. However, not a perfect match was achieved at low angles of attack. Differences in the drag coefficient and minimum lift are within 10% error for high-speed cases and within 3% for low-speed cases, which indicates imperfections of the method and its overly optimistic estimates. That will in turn reduce values of initially expected technological benefits, as was initially observed in Ref. [74]. To rapidly estimate potential changes in aircraft weights and avoid the generation of surrogate models, a correction factor proportional to the difference in high-speed drag at low angles of attack was applied for the cruise segment, since the slope of the drag polar is relatively consistent with the level of fidelity. Note that the updated geometry with slightly lower outer wing thicknesses was also imported in SUAVE for the final assessment. The final comparison is shown in Table 14. Results indicate a minor increase in maximum take-off and empty weights due to the increase in fuel weight and a snowball effect driven by higher fuel mass. The fuel burn increase equals 3% for the kerosene aircraft and 5% for the hydrogen aircraft. Note that the hydrogen fuel tank mass was increased by 9% due to more fuel required and minor extensions of the fuel tanks compartment were performed to save a similar number of tanks and make them slightly longer to fit the required fuel. Due to higher fuel burn, the emission level increased by 3.5% and 4.6% for kerosene and blue hydrogen options, respectively. These modifications make emission reductions equal to 32% for the kerosene BWB and 44% and 88% with respect to the B777-300ER. Finally, deviations of drag polars at higher and lower angles of attack occur due to the presence of shock waves. with potentially similar costs to conventional aircraft due to advancements in technologies.
Although lift curves showed relatively close similarity between the two methods, differences in pressure distribution may be rather significant due to differences in calculations of the lifting surfaces. Results obtained using high-fidelity methods show that pitching moment curves are shifted down for both cases with the high-speed case having a more significant curve shift. This fact may affect the trim capabilities of the aircraft and shall be considered again by constraining the trim within the optimization problem. Deviations of the pitching moment curve slope are not as significant at low-speed conditions, which enables a relatively similar estimation of the neutral point, while high-speed cases could be different. While the kerosene configuration showed relatively small changes in the moment curve slope, the hydrogen configuration showed stronger deviations. Therefore, static margins shift backward for the kerosene aircraft by no more than 1% while the static margin of the LH2 aircraft shifts by up to 2%, which could be rather significant. On the other hand, the backward shift is more favorable since the aircraft remains statically stable and low-fidelity tools estimate more conservative cases that could be further updated.
Lateral moment coefficients also showed strong dependence on geometric characteristics, particularly in the side projection of the aircraft. if the yaw moment is observed, a more compact planform of the kerosene aircraft shows fewer deviations in moment coefficients compared to the LH2 configuration. In the case of the hydrogen aircraft, the side projection of the blended wing increases the moment coefficient compared to the AVL case, which mostly relies on vertical stabilizers. As for the roll moment coefficient, generic differences in the lift distribution between AVL and ADFlow as well as an inability of AVL to capture the curvature of the wing blending at the transition region between the inner and the outer wing segments make moment coefficients more aggressive for the high-fidelity case, that needs to be assessed further during the design to prevent an excessive dutch roll tendency. In this case, AVL data became more optimistic and needs to be treated carefully.
Generally, a sufficient agreement between high-fidelity and low-fidelity tools has been achieved. Particularly, sufficient confidence was achieved regarding the neutral point estimation, which significantly affects the planform design. According to the verification study, low-fidelity tools can be used to conservatively estimate the neutral point location and accurately estimate the drag of a well-designed planform. Lateral stability about the roll axis needs to be treated carefully to ensure adequate lateral-directional stability characteristics, while the yaw moment coefficient estimated with AVL showed a more conservative trend which is more applicable for early design stages.

5. Conclusions

The present research investigated potential opportunities for a hydrogen-powered long-range blended wing body with the potential influence of future airframe and propulsion technologies. The work introduced an initial sizing framework that includes both low- and medium-fidelity approaches. In addition, an initial sizing methodology for rapid sizing of hydrogen-powered BWB aircraft was introduced to perform sizing, analysis, and optimization of the configuration. Technologies such as advanced materials, load alleviation, boundary layer ingestion, and ultra-high bypass ratio engines were included in the sizing to investigate potential opportunities for the configuration to be more energy-efficient and mitigate future emissions.
Two aircraft were sized to demonstrate the potential benefits and drawbacks of the hydrogen configuration: one powered by liquid hydrogen combustion and one powered by kerosene. Initial sizing showed a significant dependence of the planform on the size of fuel tanks. The size of fuel tanks strongly affects the sizing of the cabin, planform dimensions, and aerodynamic characteristics such as static stability characteristics. Particularly, the cabin of the BWB aircraft shall be longer and narrower than the one powered by kerosene to ensure that fuel tanks can be integrated into the geometry without potential range limitations. That in turn creates an additional concern regarding the viability of such a configuration of being certified in cases of emergency and crash safety of fuel tank compartments. Compared to the kerosene BWB aircraft, emissions of the blue hydrogen configuration may be reduced by 18%, while 44% emission reduction was achieved in comparison to the reference B777-300ER. The green hydrogen option shows a potential reduction of 88% compared to B777-300ER. On the other hand, the commercial viability of the hydrogen configuration highly depends on the fuel price. Given advanced technologies and their costs penalty, potentially favorable scenarios are possible for up to the base price scenario for the hydrogen aircraft and only for the optimistic scenario for the green hydrogen. At the same time, the kerosene option may have a favorable combination of significant emission reductions and acceptable operating costs compared to the reference aircraft with current technologies. Moreover, although substantial emission reductions were achieved by the hydrogen configuration using the benefits of the configuration and future technologies, its energy demand remains high and establishes a major challenge to green energy production. It also needs to be noted that limitations of the configuration may be caused by the selection of the fuel tank location inside the aircraft. Therefore, further design explorations are encouraged to try to look for other potential solutions.
Technology sensitivity studies indicated a strong dependence of the planform shape on the achievements of airframe technologies. UHBPR engines and BLI technologies showed the strongest impact on emissions but also demonstrated mutually conflicting interference due to the mechanisms of their implementation.
Finally, aerodynamic concerns regarding low-fidelity methods were verified using aerodynamic analysis and optimization techniques. An applicable level of lift and drag coefficients was achieved, although minor deviations were observed and need to be accounted for as early, as possible. The moment coefficients showed a strong dependence on the three-dimensional shape of the aircraft. The estimation of the neutral point and weathervane stability showed that low-fidelity tools can conservatively estimate the aircraft’s behavior, while roll stability shall be treated more carefully since its value appeared higher than the ones estimated using low-fidelity tools. In the case of the initial sizing using SUAVE, values of lift and drag are applicable to have a reliable initial estimate of aircraft weights and emissions.
Generally, the hydrogen long-range aircraft remains a promising configuration for future more sustainable aircraft, but the significant effort needs to be put to solve general configurational problems of BWB aircraft that were even strengthened by the hydrogen fuel and its storage requirements. Particularly, solutions for emergency evacuation exits need to be found to satisfy rather narrow hydrogen BWB cabins and comply with certification regulations. Such an issue is important for both ground operations and the ditching case. Moreover, a general problem of the potential relaxed stability of BWB aircraft needs to be addressed further to make BWB generally applicable for commercial operations. The problem of the structural layout will still remain open and is not improved for the hydrogen BWB. Finally, a generic problem of crash safety of the BWB with the presence of hydrogen tanks shall be thoroughly addressed, especially in the case of the landing gear allocation in close proximity to fuel tanks.

Author Contributions

Conceptualization, S.K.; methodology, S.K.; software, S.K.; validation, S.K. and Y.M.; formal analysis, S.K.; investigation, S.K. and Y.M.; resources, A.E.; data curation, A.E.; writing—original draft preparation, S.K. and Y.M.; writing—review and editing, S.K., Y.M. and A.E.; visualization, S.K.; supervision, A.E.; project administration, A.E.; funding acquisition, A.E. All authors have read and agreed to the published version of the manuscript.

Funding

This research was funded by the Deutsche Forschungsgemeinschaft (DFG, German Research Foundation) under Germany’s Excellence Strategy-EXC 2163/1-Sustainable and Energy Efficient Aviation-Project-ID 390881007.

Institutional Review Board Statement

Not applicable.

Informed Consent Statement

Not applicable.

Data Availability Statement

The final data presented in this study are available on request from the corresponding author.

Conflicts of Interest

The authors declare no conflict of interest.

References

  1. European Commission, Directorate-General for Research and Innovation. Fly the Green Deal—Europe’s Vision for Sustainable Aviation; Advisory Council for Aviation Research and Innovation in Europe (ACARE): Brussels, Belgium, 2022; Available online: https://perma.cc/8JJN-LEKV (accessed on 29 May 2023).
  2. Liebeck, R. Design of the Blended Wing Body Subsonic Transport. J. Aircr. 2004, 41, 1. [Google Scholar] [CrossRef] [Green Version]
  3. Chen, Z.; Zhang, M.; Chen, Y.; Sang, W.; Tan, Z.; Li, D.; Zhang, B. Assessment on Critical Technologies for Conceptual Design of Blended-wing-body Civil Aircraft. Chin. J. Aeronaut. 2019, 32, 8. [Google Scholar] [CrossRef]
  4. Okonkwo, P.; Smith, H. Review of Evolving Trends in Blended Wing Body Aircraft Design. Prog. Aerosp. Sci. 2016, 82. [Google Scholar] [CrossRef]
  5. Brown, M.; Vos, R. Conceptual Design and Evaluation of Blended-Wing Body Aircraft. In Proceedings of the 2018 AIAA Aerospace Sciences Meeting, Kissimmee, FL, USA, 8 January 2018. [Google Scholar] [CrossRef] [Green Version]
  6. van Dommelen, J.; Vos, R. Conceptual Design and Analysis of Blended-wing-body Aircraft. Proc. Inst. Mech. Eng. Part G J. Aerosp. Eng. 2014, 228, 13. [Google Scholar] [CrossRef]
  7. Dorsey, A.; Uranga, A. Design Space Exploration of Blended Wing Bodies. In Proceedings of the AIAA Aviation 2021 Forum, Virtual event, 2–6 August 2021. [Google Scholar] [CrossRef]
  8. Scholz, D. A Student Project of a Blended Wing Body Aircraft—From Conceptual Design to Flight Testing. In Proceedings of the European Workshop on Aircraft Design Education 2007, Samara, Russia, 29 May–2 June 2007; Available online: http://hdl.handle.net/20.500.12738/12617 (accessed on 14 June 2023).
  9. Bradley, K. A Sizing Methodology for the Conceptual Design of Blended-Wing-Body Transports; NASA/CR-2004-213016; NASA Langley: Hampton, VA, USA, 2004. Available online: https://ntrs.nasa.gov/citations/20040110949 (accessed on 29 May 2023).
  10. Hansen, L.; Heinze, W.; Horst, P. Blended wing body structures in multidisciplinary pre-design. Struct. Multidiscip. Optim. 2008, 36, 93–106. [Google Scholar] [CrossRef]
  11. Sgueglia, A. Methodology for Sizing and Optimising a Blended Wing-Body with Distributed Electric Ducted Fans. Ph.D. Dissertation, ISAE-SUPAERO, Toulouse, France, 2019. Available online: https://oatao.univ-toulouse.fr/25515/ (accessed on 29 May 2023).
  12. Gray, J.; Hwang, J.; Martins, J.; Moore, K.; Naylor, B. OpenMDAO: An Open-Source Framework for Multidisciplinary Design, Analysis, and Optimization. Struct. Multidiscip. Optim. 2019, 59, 4. [Google Scholar] [CrossRef]
  13. Seeckt, K.; Heinze, W.; Scholz, D. Hydrogen Powered Freighter Aircraft – The Final Results of the Green Freighter Project. In Proceedings of the 27th International Congress of the Aeronautical Sciences, Nice, France, 19–24 September 2010; Available online: https://perma.cc/XD44-M9KY (accessed on 29 May 2023).
  14. Guynn, M.; Freeh, J.; Olson, E. Evaluation of a Hydrogen Fuel Cell Powered Blended-Wing-Body Aircraft Concept for Reduced Noise and Emissions; NASA/TM-2004-212989; NASA Langley: Hampton, VA, USA, 2004. Available online: https://ntrs.nasa.gov/citations/20040033924 (accessed on 29 May 2023).
  15. Westenberger, A. H2 Technology for Commercial Aircraft. In Proceedings of the Advances on Propulsion Technology for High-Speed Aircraft, RTO, Rhode-Saint-Geneese, Belgium, 12–15 March 2007; pp. 216–258. Available online: https://perma.cc/M2V6-62ZJ (accessed on 3 June 2023).
  16. Bramsiepe, K.; Klimmek, T.; Krüger, W.; Tichy, L. Aeroelastic Method to Investigate Nonlinear Elastic Wing Structures. CEAS Aeronaut. J. 2022, 13, 939–949. [Google Scholar] [CrossRef]
  17. Dähne, S.; Hühne, C. Gradient Based Structural Optimization of a Stringer Stiffened Composite Wing Box with Variable Stringer Orientation. In World Congress of Structural and Multidisciplinary Optimisation; WCSMO 2017; Springer: Cham, Switzerland, 2017. [Google Scholar] [CrossRef]
  18. Wunderlich, F.; Dähne, S.; Reimer, L.; Schuster, A. Global Aero-Structural Design Optimization of More Flexible Wings for Commercial Aircraft. In Proceedings of the AIAA Aviation 2020 Forum, Virtual event, 15–19 June 2020. [Google Scholar] [CrossRef]
  19. Hahn, D.; Haupt, M. Exploration of the effect of wing component post-buckling on bending-twist coupling for nonlinear wing twist. CEAS Aeronaut. J. 2022, 13, 663–676. [Google Scholar] [CrossRef]
  20. Horst, P.; Elham, A.; Radespiel, R. Reduction of Aircraft Drag, Loads and Mass for Energy Transition in Aeronautics; Deutsche Gesellschaft für Luft-und Raumfahrt: Bonn, Germany, 2021. [Google Scholar] [CrossRef]
  21. Liu, X.; Sun, Q. Gust Load Alleviation with Robust Control for a Flexible Wing. Shock Vib. 2016, 2016, 1060574. [Google Scholar] [CrossRef] [Green Version]
  22. Ying, B.; Changchum, X. Gust Load Alleviation Wind Tunnel Tests of a Large-aspect-ratio Flexible Wing with Piezoelectric Control. J. Aeronaut. 2017, 30, 292–309. [Google Scholar] [CrossRef]
  23. Beyer, Y.; Kuzolap, A.; Steen, M.; Diekmann, H.; Fezans, N. Adaptive Nonlinear Flight Control of STOL-Aircraft Based on Incremental Nonlinear Dynamic Inversion. In Proceedings of the 2018 AIAA Aviation Forum, Atlanta, GA, USA, 25–29 June 2018. [Google Scholar] [CrossRef] [Green Version]
  24. Ehlers, J.; Fezans, N. Airborne Doppler LiDAR Sensor Parameter Analysis for Wake Vortex Impact Alleviation Purposes. In Proceedings of the 2015 CEAS Conference on Guidance, Navigation, and Control, Toulouse, France, 13–15 April 2015. [Google Scholar] [CrossRef]
  25. Khalil, K.; Asaro, S.; Bauknecht, A. Active Flow Control Devices for Wing Load Alleviation. J. Aircr. 2022, 59, 2. [Google Scholar] [CrossRef]
  26. Yu, M.; Lourie, O.; Dyer, M.; Moloni, K.; Kelly, T.; Ruoff, R. Strength and Breaking Mechanism of Multiwalled Carbon Nanotubes Under Tensile Load. Science 2000, 287, 5453. [Google Scholar] [CrossRef] [Green Version]
  27. Peng, B.; Locascio, M.; Zapol, P.; Li, S.; Mielke, S.; Schatz, G.; Espinosa, H. Measurements of Near-ultimate Strength for Multiwalled Carbon Nanotubes and Irradiation-induced Crosslinking Improvements. Nat. Nanotechnol. 2008, 3, 626–631. [Google Scholar] [CrossRef] [PubMed]
  28. Brooks, T.; Martins, J. On Manufacturing Constraints for Tow-steered Composite Design Optimization. Compos. Struct. 2018, 204, 548–559. [Google Scholar] [CrossRef]
  29. Brooks, T.; Kennedy, G.; Martins, J. High-fidelity Multipoint Aerostructural Optimization of a High Aspect Ratio Tow-steered Composite Wing. In Proceedings of the 58th AIAA/ASCE/AHS/ASC Structures, Structural Dynamics, and Materials Conference, Grapevine, TX, USA, 9–13 January 2017. [Google Scholar] [CrossRef] [Green Version]
  30. Stanford, B.; Jutte, C. Aeroelastic Tailoring via Tow Steered Composites; NASA/TM–2014-218517; NASA: Langley, VA, USA, 2010. Available online: https://core.ac.uk/works/24799315 (accessed on 4 April 2023).
  31. Wang, X.; Tang, F.; Cao, Q.; Qi, X.; Pearson, M.; Li, M.; Pan, H.; Zhang, Z.; Lin, Z. Comparative Study of Three Carbon Additives: Carbon Nanotubes, Graphene, and Fullerene-C60, for Synthesizing Enhanced Polymer Nanocomposites. Nanomaterials 2020, 10, 838. [Google Scholar] [CrossRef]
  32. Carvalho, J.; Sohouli, A.; Suleman, A. Fundamental Frequency Optimization of Variable Angle Tow Laminates with Embedded Gap Defects. J. Compos. Sci. 2022, 6, 64. [Google Scholar] [CrossRef]
  33. Greitzer, E.; Bonnefoy, P.; delaRosaBlanco, E.; Dorbian, C.; Drela, M.; Hall, D.; Hansman, R.; Hileman, J.; Liebeck, R.; Lovegren, J.; et al. N+3 Aircraft Concept Designs and Trade Studies, Volume 1; NASA/CR—2010-216794/VOL1; NASA: Cleveland, OH, USA, 2010. Available online: https://core.ac.uk/display/10557299 (accessed on 4 April 2023).
  34. Dagget, D.; Brown, S.; Kawai, R. Ultra-Efficient Engine Diameter Study; NASA/CR-2003-212309; NASA: Seattle, WA, USA, 2003. Available online: https://ntrs.nasa.gov/citations/20030061085 (accessed on 29 May 2023).
  35. Bijewitz, J.; Seitz, A.; Hornung, M. Architectural Comparison of Advanced Ultra-High Bypass Ratio Turbofans for Medium to Long Range Application. In Proceedings of the Deutscher Luft-und Raumfahrtkongress 2014, Augsburg, Germany, 16–18 September 2014; Available online: https://perma.cc/YDF6-A66D (accessed on 29 May 2023).
  36. Giescke, D.; Lehmler, M.; Friedrichs, J.; Blinstrub, J.; Bertsch, L.; Heinze, W. Evaluation of Ultra-high Bypass Ratio Engines for an Over-wing Aircraft Configuration. J. Glob. Power Propuls. Soc. 2018, 2, 493–515. [Google Scholar] [CrossRef]
  37. Gray, J.; Mader, C.; Kenway, G.; Martins, J. Modeling Boundary Layer Ingestion Using a Coupled Aeropropulsive Analysis. J. Aircr. 2018, 55, 3. [Google Scholar] [CrossRef]
  38. Seitz, A.; Habermann, A.L.; Peter, F.; Troeltsch, F.; Castillo Pardo, A.; Della Corte, B.; van Sluis, M.; Goraj, Z.; Kowalski, M.; Zhao, X.; et al. Proof of Concept Study for Fuselage Boundary Layer Ingesting Propulsion. Aerospace 2021, 8, 16. [Google Scholar] [CrossRef]
  39. Voigt, J.; Friedrichs, J. Development of a Multi-Segment Parallel Compressor Model for a Boundary Layer Ingesting Fuselage Fan Stage. Energies 2021, 14, 5746. [Google Scholar] [CrossRef]
  40. Budziszewski, N.; Friedrichs, J. Modelling of A Boundary Layer Ingesting Propulsor. Energies 2018, 11, 708. [Google Scholar] [CrossRef] [Green Version]
  41. Uranga, A.; Drela, M.; Greitzer, E.; Hall, D.; Tichener, N.; Lieu, M.; Siu, N.; Casses, C.; Huang, A. Boundary Layer Ingestion Benefit of the D8 Transport Aircraft. AIAA J. 2017, 55, 11. [Google Scholar] [CrossRef] [Green Version]
  42. Blumenthal, A.; Elmiligui, A.; Geiselhart, K.; Campbell, K.; Maughmer, M.; Schmitz, S. Computational Investigation of a Boundary Layer Ingestion Propulsion System for the Common Research Model. In Proceedings of the 6th AIAA Fluid Dynamics Conference, Washington, DC, USA, 13–17 June 2016. [Google Scholar] [CrossRef] [Green Version]
  43. Kawai, R.; Friedman, D.; Serrano, L. Blended Wing Body (BWB) Boundary Layer Ingestion (BLI) Inlet Configuration and System Studies; NASA/CR-2006-214534; NASA: Huntington Beach, CA, USA, 2006. Available online: https://core.ac.uk/works/15254411 (accessed on 4 April 2023).
  44. Karpuk, S.; Elham, A. Influence of Novel Airframe Technologies on the Feasibility of Fully-Electric Regional Aviation. Aerospace 2021, 8, 163. [Google Scholar] [CrossRef]
  45. Karpuk, S.; Radespiel, R.; Elham, A. Assessment of Future Airframe and Propulsion Technologies on Sustainability of Next-Generation Mid-Range Aircraft. Aerospace 2022, 9, 279. [Google Scholar] [CrossRef]
  46. Lukaczyk, T.; Wendroff, A.; Colonno, M.; Economon, T.; Alonso, J.; Orra, T.; Ilario, C. SUAVE: An Open-Source Environment for Multi-Fidelity Conceptual Vehicle Design. In Proceedings of the 16th AIAA ISSMO Multidisciplinary Analysis and Optimization Conference, Dallas, TX, USA, 22–26 June 2015. [Google Scholar] [CrossRef] [Green Version]
  47. Gudmundsson, S. General Aviation Aircraft Design: Applied Methods and Procedures, 1st ed.; Butterworth-Heinemann: Oxford, UK, 2013. [Google Scholar] [CrossRef]
  48. Loftin, L. Subsonic Aircraft: Evolution and the Matching of Size to Performance; NASA RP 1060; NASA Langley: Hampton, VA, USA, 1980. Available online: https://ntrs.nasa.gov/citations/19800020744 (accessed on 4 April 2023).
  49. Torenbeek, E. Synthesis of Subsonic Airplane Design; Springer: Delft, The Netherlands, 1982. [Google Scholar] [CrossRef]
  50. Howe, D. Aircraft Conceptual Design Synthesis; Professional Engineering Publishing Limited: London, UK, 2000. [Google Scholar]
  51. Drela, M.; Youngren, H. Athena Vortex-Lattice Method. Available online: https://perma.cc/RWM5-NFK9 (accessed on 4 April 2023).
  52. Nita, M.; Scholz, D. Estimating the Oswald Factor from Basic Aircraft Geometrical Parameters. In Proceedings of the Deutscher Luft-und Raumfahrtkongress 2012, Berlin, Germany, 10–12 September 2012; Available online: https://nbn-resolving.org/urn:nbn:de:101:1-201212176728 (accessed on 4 April 2023).
  53. Shevell, R.; Bayan, F. Development of a Method for Predicting the Drag Divergence Mach Number and the Drag Due to Compressibility for Conventional and Supercritical Wings; Research Report SUDAAR 522; Stanford University: Stanford, CA, USA, 1980; Available online: https://perma.cc/XN5X-EUZN (accessed on 28 April 2022).
  54. Wells, D.; Horvath, B.; McCullers, L. The Flight Optimization System Weights Estimation Method; NASA TM 20170005851; NASA: Hampton, VA, USA, 2017. Available online: https://core.ac.uk/display/84913944 (accessed on 28 April 2022).
  55. Brewer, D. Hydrogen Aircraft Technology; CRC Press: Boca Raton, FL, USA, 1991. [Google Scholar]
  56. Verstraete, D. The Potential of Liquid Hydrogen for Long Range Aircraft Propulsion. Ph.D. Dissertation, Cranfield University, Cranfield, UK, 2009. Available online: https://dspace.lib.cranfield.ac.uk/handle/1826/4089 (accessed on 3 April 2023).
  57. Winnefeld, C.; Kadyk, T.; Bensmann, B.; Krewer, U.; Hanke-Rauschenbach, R. Modelling and Designing Cryogenic Hydrogen Tanks for Future Aircraft Applications. Energies 2018, 11, 105. [Google Scholar] [CrossRef] [Green Version]
  58. Lin, C.; Van Dresar, N.; Hasan, M. A Pressure Control Analysis of Cryogenic Storage Systems. In Proceedings of the 27th Joint Propulsion Conference, Sacramento, CA, USA, 24–26 June 1991. [Google Scholar] [CrossRef] [Green Version]
  59. Cantwell, B. Aircraft and Rocket Propulsion; Stanford University: Stanford, CA, USA, 2022. [Google Scholar]
  60. Bardenhagen, A.; Gobbin, A. Flugzeugentwurf II; TU Berlin: Berlin, Germany, 2017. [Google Scholar]
  61. Roskam, J. Airplane Design, 2nd ed.; Darcorporation: Lawrence, KS, USA, 2003; Volume 1–8. [Google Scholar]
  62. Hoelzen, J.; Silberhorn, D.; Zill, T.; Bensmann, B.; Hanke-Rauschenbach, R. Hydrogen-powered Aviation and its Reliance on Green Hydrogen Infrastructure – Review and Research Gaps. Int. J. Hydrogen Energy 2022, 47, 5. [Google Scholar] [CrossRef]
  63. Hydrogen Council. A Perspective on Hydrogen Investment, Market Development, and Cost Competitiveness; McKinsey & Co.: New York, NY, USA, 2021; Available online: https://perma.cc/4APJ-7ZMB (accessed on 29 May 2023).
  64. Scholz, D. Limits to Principles of Electric Flight; Deutscher Luft-und Raumfahrtkongress: Darmstadt, Germany, 2019. [Google Scholar] [CrossRef]
  65. Baughcum, S.; Tritz, T.; Henderson, S.; Pickett, D. Scheduled Civil Aircraft Emission Inventories for 1992: Database Development and Analysis; NASA Contractor Report 4700; Langley Research Center: Hampton, VA, USA, 1996. Available online: https://ntrs.nasa.gov/citations/19960038445 (accessed on 28 April 2022).
  66. Dallara, E. Aircraft Design for Reduced Climate Impact. Ph.D. Dissertation, Stanford University, Stanford, CA, USA, 2011. Available online: https://perma.cc/3TDH-TB2S (accessed on 28 April 2022).
  67. Scholz, D. Calculation of the Emission Characteristics of Aircraft Kerosene and Hydrogen Propulsion; Harvard Data-verse; HAW Hamburg: Hamburg, Germany, 2020. [Google Scholar] [CrossRef]
  68. Fuel Cells and Hydrogen 2 Joint Undertaking. In Hydrogen-Powered Aviation: A Fact-based Study of Hydrogen Technology, Economics, and Climate Impact by 2050; Publications Office of EU: Luxembourg, 2020. [CrossRef]
  69. Svensson, F.; Hasselrot, A.; Moldanova, J. Reduced environmental impact by lowered cruise altitude for liquid hydrogen-fuelled aircraft. Aerosp. Sci. Technol. 2004, 8, 4. [Google Scholar] [CrossRef]
  70. Marquart, S.; Suasen, R.; Ponater, M.; Grewe, V. Estimate of the Climate Impact of Cryoplanes. Aerosp. Sci. Technol. 2001, 5, 1. [Google Scholar] [CrossRef]
  71. Howarth, R.; Jacobson, M. How green is blue hydrogen? Energy Sci. Eng. 2021, 9, 10. [Google Scholar] [CrossRef]
  72. Pavlenko, N.; Searle, S. Assessing the Sustainability Implications of Alternative Aviation Fuels. In Proceedings of the International Council on Clean Transportation 2021; Available online: https://perma.cc/XPG7-UK79 (accessed on 28 April 2022).
  73. Andersson, J.; Krus, P. A Multi-Objective Optimization Approach to Aircraft Preliminary Design. In Proceedings of the SAE World Aviation Congress, Montreal, QC, Canada, 8–11 September 2003. [Google Scholar] [CrossRef]
  74. Karpuk, S.; Liu, Y.; Elham, A. Multi-Fidelity Design Optimization of a Long-Range Blended Wing Body Aircraft with New Airframe Technologies. Aerospace 2020, 7, 87. [Google Scholar] [CrossRef]
  75. Mader, C.; Kenway, G.; Yildirim, A.; Martins, J. ADflow—An open-source computational fluid dynamics solver for aerodynamic and multidisciplinary optimization. J. Aerosp. Inf. Syst. 2020, 17, 508–527. [Google Scholar] [CrossRef]
  76. Kenway, G.; Kennedy, G.; Martins, J. A CAD-free approach to high-fidelity aerostructural optimization. In Proceedings of the 13th AIAA/ISSMO Multidisciplinary Analysis Optimization Conference, AIAA 2010-9231, Fort Worth, TX, USA, 13–15 September 2010. [Google Scholar] [CrossRef] [Green Version]
  77. Secco, N.R.; Kenway, G.K.; He, P.; Mader, C.; Martins, J.R. Efficient Mesh Generation and Deformation for Aerodynamic Shape Optimization. AIAA J. 2021, 4, 1151–1168. [Google Scholar] [CrossRef]
  78. Gill, P.; Murray, W.; Saunders, M. SNOPT: An SQP algorithm for large-scale constrained optimization. SIAM J. Optim. 2002, 12, 4. [Google Scholar] [CrossRef] [Green Version]
  79. Silberhorn, D.; Atanasov, G.; Walther, J.; Zill, T. Assessment of Hydrogen Fuel Tank Integration at Aircraft Level. In Proceedings of the Deutscher Luft- und Raumfahrtkongress 2019, Darmstadt, Germany, 30 September–2 October 2019; Available online: https://core.ac.uk/download/pdf/237080603.pdf (accessed on 29 May 2023).
  80. Cengel, Y.; Cimbala, J. Fluid Mechanics Fundamentals and Applications, 3rd ed.; McGraw-Hill Education: Columbus, OH, USA, 2013. [Google Scholar]
  81. Merkl, E. Final Report Summary-ENOVAL (Engine Module Validators); European Commission: Amsterdam, The Netherlands, 2018; Available online: https://perma.cc/59JE-877J (accessed on 29 May 2023).
  82. Fichter, C.; Marquart, S.; Sausen, R.; Lee, D. The Impact of Cruise Altitude on Contrails and Related Radiative Forcing. Meteorol. Z. 2005, 14, 4. [Google Scholar] [CrossRef] [Green Version]
  83. Infinite Flight. Online Flight Routes Database. 2021. Available online: https://perma.cc/VGB8-6PV7 (accessed on 29 May 2023).
  84. Cook, A.; Tanner, G. European Airline Delay Cost Reference Values; University of Westminster: London, UK, 2015; p. 60. Available online: https://perma.cc/GFX2-8JSE (accessed on 29 May 2023).
  85. Dahlmann, K.; Koch, A.; Linke, F.; Lührs, B.; Grewe, V.; Otten, T.; Seider, D.; Gollnick, V.; Schumann, U. Climate-Compatible Air Transport System—Climate Impact Mitigation Potential for Actual and Future Aircraft. Aerospace 2016, 3, 38. [Google Scholar] [CrossRef] [Green Version]
  86. Certification Specifications and Acceptable Means of Compliance for Large Aeroplanes CS-25. June 2020. Available online: https://perma.cc/9K76-KJPW (accessed on 4 April 2023).
  87. Annex 14 to the Convention on International Civil Aviation, Aerodromes, Volume 1, 8th ed. July 2018. Available online: https://perma.cc/H853-AMWW (accessed on 4 April 2023).
  88. Scholz, D. Design of Hydrogen Passenger Aircraft—How much “Zero-Emission” is Possible? In Hamburg Aerospace Lecture Series (DGLR, RAeS, VDI, ZAL, HAW Hamburg); Zenodo: Hamburg, Germany, 2020. [Google Scholar] [CrossRef]
  89. Valdes, R.; Comendador, V.; Campos, L. How Much Can Carbon Taxes Contribute to Aviation Decarbonization by 2050. Sustainability 2021, 13, 1086. [Google Scholar] [CrossRef]
Figure 3. Initial sizing framework diagram. Reds line represent global data flow, blue lines show local data flow, and green lines show exchanges of solution modules.
Aerospace 10 00566 g003
Figure 4. Parametrization of kerosene and hydrogen BWB planforms.
Aerospace 10 00566 g004
Figure 5. Schematic cabin top and side views. (a) Cabin bays distribution. Adapted from [9]; (b) BWB cross-section and fuel tank integration.
Aerospace 10 00566 g005
Figure 6. Hydrogen BWB front cross-section view. Red lines represent the actual geometric shape while the black lines show a simplified shape.
Aerospace 10 00566 g006
Figure 7. Cabin segment cross-section.
Aerospace 10 00566 g007
Figure 8. Hydrogen tank heat transfer resistance analogy.
Aerospace 10 00566 g008
Figure 9. FFD control framework and the ICEM mesh for the kerosene BWB aircraft.
Aerospace 10 00566 g009
Figure 10. BLI free-body diagrams.
Aerospace 10 00566 g010
Figure 11. Absolute changes in contrail coverage due to a downward displacement of air traffic by 6000 ft for January and July mean values. Adapted from [82].
Aerospace 10 00566 g011
Figure 12. Flight routes summary for B777-300ER [83].
Aerospace 10 00566 g012
Figure 13. Distribution of flight routes for B777-300ER for shorter and longer route cases.
Aerospace 10 00566 g013
Figure 14. Geometric comparison of BWB kerosene aircraft with three (red), four (blue), and five (green) bays.
Aerospace 10 00566 g014
Figure 15. Layouts of designed kerosene and LH2 BWB aircraft.
Aerospace 10 00566 g015
Figure 16. Cabin comparison of kerosene and LH2 BWB aircraft.
Aerospace 10 00566 g016
Figure 17. Comparison of kerosene and hydrogen BWB wing planforms. Black aircraft represents the kerosene aircraft and blue aircraft corresponds to the LH2 aircraft.
Aerospace 10 00566 g017
Figure 18. Comparison of DOC for various types of hydrogen production.
Aerospace 10 00566 g018
Figure 19. Summary of technology sensitivity study for hydrogen BWB aircraft.
Aerospace 10 00566 g019
Figure 20. Geometric summary of technology sensitivity study for hydrogen BWB aircraft. Red aircraft represents a reference aircraft without any technologies implemented.
Aerospace 10 00566 g020
Figure 21. Mesh sensitivity analysis summary.
Aerospace 10 00566 g021
Figure 22. Aerodynamic shape optimization summary of the kerosene BWB aircraft.
Aerospace 10 00566 g022
Figure 23. Aerodynamic shape optimization summary of the LH2 BWB aircraft.
Aerospace 10 00566 g023
Figure 24. LH2 mesh using ICEM.
Aerospace 10 00566 g024
Figure 25. Comparison of aerodynamic calculation results between low- and high-fidelity methods for the kerosene BWB aircraft.
Aerospace 10 00566 g025
Figure 26. Comparison of aerodynamic calculation results between low- and high-fidelity methods for the LH2 BWB aircraft.
Aerospace 10 00566 g026
Table 1. Summary of hydrogen production costs in USD/kg [62,63].
Production TypeScenarioMinimumMaximum
BlueBase1.02.0
GreenOptimistic0.82.5
Base1.83.8
Pessimistic2.66.5
Table 2. Summary of hydrogen liquefaction costs in USD/kg [62].
ScenarioMinimumMaximum
Optimistic0.21.0
Base0.82.0
Pessimistic1.73.0
Table 3. Correction factors for the equivalent CO2 emissions for hydrogen and kerosene combustion.
ConstantKeroseneHydrogenCorrection Description
k 0 1.00.0Accounts for the fuel type
k 1 1.02.79Accounts for higher hydrogen combustion temperature
k 2 1.00.1–0.75Lean combustion
k 3 1.02.58Higher H2O emission
k 4 1.00.27–0.36Thinner ice crystals and less visibility of contrails
Table 4. Summary of airframe technology assumptions.
TechnologyAssumptionReference
Load alleviationLimit load factor 2.0Cluster goal
Advanced structures19% airframe weight reduction [29,33] Cluster goal
Table 5. Average long-range aircraft rotations, durations, and block hours [84].
Aircraft Rotations
Per Day
Flight Duration
(min)
Taxi Hours
Per Day
Ground Time
at-Gate (min)
Block Hours
Per Day
B747-4001.55100.718013.9
Table 6. Statistical summary of B777-300ER flight routes durations in hours.
MeanStandard
Deviation
MedianAbsolute
Minimum
Absolute
Maximum
1 Standard
Deviation
8.374.038.171.016.584.33–12.40
Table 7. SE2A LR top-level requirements.
RequirementValueUnits
Harmonic range10,580km
Maximum payload70,000kg
Passengers (2-class seating)378
Cruise Mach number0.79
Maximum wingspan80.0
Maximum operating Mach number≥0.84
Design cruise altitude7650m
Service ceiling≥10,500m
Take-off field length3050m
Mission reserveCS-25 [86]
Table 8. BWB aircraft optimization problem definition.
ParameterLowerUpperUnits
minimize m C O 2 , e q
wrt A R 4.006.50
S r e f 700.01550.0m2
λ 0.250.4
Λ 1 45.065.0deg
Λ 2 20.040.0deg
Γ 0.02.0deg
k b L H 2 0.20.35
k b 1 0.030.2
C r s / C 0 0.650.85
t / c | r o o t 0.090.11
t / c | t i p 0.090.11
i r o o t 0.03.0deg
i t i p −3.00.0deg
A R T 1.02.0
Λ T 40.060.0deg
Γ T 0.050.0deg
λ T 0.30.6
C r T 5.57.5m
t / d i n s 0.030.15
T / W 0.2250.35N/N
subject toTake-off field length 3050m
b 80.0m
C t 2.0 m
C n β 0.025
C l β −0.0570.0
S M m i n 0.02
Table 9. Final design summary of BWB configurations.
ParameterKerosene BWBLH2 BWBUnits
Wing
Number of bays3453
A R 6.24.885.374.67
S r e f 7457107021203m2
b68.058.951.874.9m
C 0 42.2536.4529.646.1m
C w 28.7722.3517.920.2m
C t 2.12.022.072.38m
Λ 1 67.862.551.760.3deg
Λ 2 26.031.830.028.8deg
Γ 1.01.01.61.7deg
k b L H 2 0.23
k b 1 0.130.100.170.04deg
C r s / C 0 0.760.670.660.83deg
t / c r o o t 0.0920.0970.0940.096
t / c t i p 0.0920.0940.0900.098
i r o o t 3.02.72.02.6deg
i t i p 0.0−0.1−0.1−2.5deg
Vertical tail
A R 1.321.271.401.3
b5.95.05.757.3m
λ 0.380.350.400.5
Λ L E 54.556.556.051.2deg
Γ 9.512.02.010.0deg
t / c 0.090.090.090.09
Propulsion
Number of engines35712
Engine diameter3.202.702.421.66m
T / W 0.310.310.320.25N/N
Hydrogen tanks
Number of tanks 4
t / d i n s 0.13
Table 10. Weights summary of SE2A LR BWB configurations.
ConfigurationKerosene BWBLH2 BWBUnits
Number of bays3 bays4 bays5 bays
m M T O W 254,892262,358265,911260,846kg
m f u e l 59,80066,80072,10027,900kg
m e m p t y 125,115125,577123,824162,900kg
m e n g i n e s 18,00017,95217,0669941kg
m n a c e l l e s 3123291429361923kg
m l a n d i n g g e a r 998810,25810,38710,203kg
m w i n g 21,33323,89323,12442,652kg
m e m p e n n a g e 1737147218363266kg
m f u s e l a g e 28,71226,37625,54623,148kg
m s y s t e m s 41,340641,84642,15144,943kg
m L H 2 t a n k s 25,503kg
m p a i n t 8158657771320kg
Table 11. Comparison of equivalent CO2 emission and energy demand for BWB configurations. The value in parentheses indicates the green hydrogen option.
ParameterKerosene BWBLH2 BWBB777-300ERUnits
m C O 2 , e q 371,770303,070567,803kg/flight
(69,148)
Energy demand263133485210GJ/flight
Table 12. Technology sensitivity summary for hydrogen BWB aircraft.
ParameterNo TechnologiesAirframe TechnologiesUHBPRBLIAll TechnologiesUnits
Wing
A R 4.504.564.765.484.67
S r e f 14231348123611011203m2
b80.078.476.677.874.9m
C 0 50.851.043.542.446.1m
C w 30.427.620.220.020.2m
C t 2.82.72.21.632.38m
Λ 1 56.760.055.357.060.3deg
Λ 2 35.036.734.732.128.8deg
Γ 1.30.30.70.41.7deg
k b L H 2 0.240.250.30.250.23
C r s / C 0 0.840.850.820.850.83deg
t / c r o o t 0.090.10.0960.0920.096
t / c t i p 0.0960.0950.1030.0960.098
i r o o t 3.02.92.72.92.6deg
i t i p −0.190.0−0.58−0.4−2.5deg
Vertical tail
A R 1.681.51.351.331.3
b7.47.26.96.97.3m
λ 0.370.40.360.320.45
Λ L E 50.249.651.552.351.2deg
Γ 28.640.034.630.010.0deg
Propulsion
Number of engines2231312
Engine diameter2.662.573.221.321.75m
T / W 0.250.290.260.290.25N/N
Hydrogen tanks
Number of tanks44664
t / d i n s 0.0960.10.080.080.13
Table 13. BWB aerodynamic shape optimization problem.
Kerosene BWBLH2 BWBDescriptionQuantity
Minimize C D Drag coefficient
with respect to 3.0 α 5.0 Angle of attack [deg]1
3.0 τ 1.0 Wing sections twist [deg]9
1.0 Δ Z wing 1.0 Vertical displacement of FFD control points [m]100
Total design variables110
subject toCL = 0.20CL = 0.17Lift coefficient1
t / t ini,inwing ≥ 1.0Inner wing segment thickness constraint50
t / t ini,outwing ≥ 0.9Outer wing segment thickness constraint100
Δ Z LE,upper =  Δ Z LE,lowerWing fixed trailing edge constraint10
Δ Z TE,upper =  Δ Z TE,lowerWing fixed trailing edge constraint10
V i n w i n g / V i n i , i n w i n g  ≥ 1.0inner wing internal volume constraint10
Total constraints181
Table 14. Comparison of weight before and after high-fidelity refinement for BWB configurations. The value in parentheses indicates the green hydrogen option.
ParameterKerosene BWB before RefinementKerosene BWB after RefinementLH2 BWB before RefinementLH2 BWB after RefinementUnits
m M T O W 262,358267,962260,846264,968kg
m e m p t y 125,577128,707162,900165,800kg
m f u e l 63,60265,95825,31626,541kg
m L H 2 t a n k s 25,50027,816kg
m C O 2 , e q 371,770384,023303,070315,010kg/flight
(69,769)(69,148)(69,769)
Disclaimer/Publisher’s Note: The statements, opinions and data contained in all publications are solely those of the individual author(s) and contributor(s) and not of MDPI and/or the editor(s). MDPI and/or the editor(s) disclaim responsibility for any injury to people or property resulting from any ideas, methods, instructions or products referred to in the content.

