Article

An Evaluation of Fixed-Wing Unmanned Aerial Vehicle Trends and Correlations with Respect to NATO Classification, Region, EIS Date and Operational Specifications

by
Dimitrios Mitridis
1,2,
Stavros Kapsalis
1,2,
Dimitrios Terzis
1,2 and
Pericles Panagiotou
1,2,*
1
Laboratory of Fluid Mechanics & Turbomachinery, Department of Mechanical Engineering, Aristotle University of Thessaloniki, 54124 Thessaloniki, Greece
2
UAV Integrated Research Center (UAV-iRC), Center for Interdisciplinary Research and Innovation (CIRI), Aristotle University of Thessaloniki, 57001 Thessaloniki, Greece
*
Author to whom correspondence should be addressed.
Aerospace 2023, 10(4), 382; https://doi.org/10.3390/aerospace10040382
Submission received: 28 February 2023 / Revised: 7 April 2023 / Accepted: 18 April 2023 / Published: 20 April 2023
(This article belongs to the Section Aeronautics)

Abstract

:
The current study provides a thorough analysis and evaluation of fixed-wing UAV correlations with respect to NATO classification, region of production, entry-into-service (EIS) date and other operational specifications. A set of 202 existing fixed-wing platforms is used to populate an in-house database. A screening of the corresponding data is conducted using a correlations matrix, and a statistical analysis of the key UAV design parameters is, in turn, performed. The results are presented using a wide variety of charts and statistical coefficients, to provide as much information as possible for future UAV design and performance assessment studies. Correlations for each mission type are provided, followed by a detailed evaluation of the key design parameters and design ratios (wingspan, gross takeoff weight, empty weight, payload weight, endurance, and operational speeds) with respect to NATO classification and region of origin. These key parameters are then plotted as a function of EIS date for every NATO category to identify any underlying trends and, finally, the platforms are classified in regard to some qualitative attributes, such as mission type and low observability. The results suggest that the trendlines extracted for each category significantly deviate from the generic trends. Therefore, omitting the classification in terms of region, size and weight can lead to misleading outcomes and should be avoided. Another conclusion lies in the fact that, apart from the average trendline, the design engineers should also have an indication of the data variance, due to the high dispersion observed in the datasets of several design parameters.

1. Introduction

The field of fixed-wing unmanned aerial vehicles (UAVs) design has advanced rapidly within the 21st century. Typical UAV applications range from soil erosion monitoring [1] to precision agriculture [2,3]. Another possible application is terrain mapping, as shown in [4], where the use of dedicated sensors and software allows for the 3D representation of a post-mining site. UAVs can also be used for environmental purposes, such as beach litter surveys and assessment [5], and sea-lane monitoring [6].
Driven by the variety of applications and in an attempt to cope with the increasingly booming market [7], research institutes and industries throughout the globe are conducting fixed-wing UAV design studies, covering a wide range of platform sizes and mission specifications [8,9,10,11]. New configurations are investigated [12,13,14,15] and new drag estimation methods are introduced [16,17] to provide the means for design engineers to enhance aerodynamic efficiency and performance. Moreover, the recent advances in the fields of electronics and control systems allow the unmanned systems to expand their mission range, assuming operational tasks that were traditionally assigned to manned aircraft [18]. Summing up, it is evident that, although arguably smaller in size and budget, the activities developed in the field of UAV design resemble those developed for commercial aviation.
This observation has motivated a few researchers to provide some critical pieces of information when it comes to design, i.e., to extract statistical data and historic trends from existing configurations [19,20,21]. A typical example is the work of Gomez-Rodriguez et al. [22]. They provide a very interesting overview of fixed-wing UAV platforms, emphasizing their layout specifications, such as empennage type and shape. Although some information is also provided on mission type and size, this distinction is conducted rather arbitrarily and does not follow the well-established norms of NATO classification [23]. In one of the most complete research papers in this topic, Verstraete et al. [24] documented over 800 existing UAVs, providing trendlines and correlations for the key design and performance parameters. However, the authors of this work do not provide any information in terms of configuration layout, mission type and platform category. More specifically, although the regression equations they provide achieve a very good fitting, they do so for all UAV sizes and weights. This either indicates that all fixed-wing UAV configurations, ranging from a 0.5 kg drone to a 5 ton platform, follow the same design trends, e.g., in terms of empty weight ratio, or that by applying a regression to all the data alike, the researchers missed the individual information in-between. Alulema et al. [25] provide propulsion sizing correlations for both electrical and fuel-powered UAVs. The researchers have a rather complete approach and make some observations with respect to NATO classification, but their study is almost explicitly propulsion-oriented. In another related study, Bajwa, Baluch and Saeed [26] gathered data from 41 UAVs. Employing a rather innovative approach, the authors use the data to train an artificial intelligence model, which can in turn predict key parameters, such as weight fractions, power and service ceiling. A key limitation of this work is that the reference data are somewhat limited when compared to the other two papers, not to mention that almost no information is given concerning classification and mission type. Moreover, as a general observation, these studies have also omitted another parameter when it comes to analyzing design data and extracting correlations from historic trends: time. Table 1 summarizes the strengths and shortcomings of the studies shown above. Summing up, to the best of our knowledge, there is limited information concerning the impact of classification, region, mission type and evolution of the key design and performance parameters.
After several decades of UAV development, the authors of this paper can find no obvious reason for omitting that type of information, i.e., time, size and weight classification and mission type. In the field of manned aviation, this information is considered fundamental knowledge and plays a key role in major research activities [18,19,23,27]. More specifically, the weight classification is probably the most important and fundamental distinction that has to be made before expressing design data and trends [18,23]. For example, when it comes to designing the commercial airliners of the future, it would be rather unwise to rely on “aircraft data” in general. The corresponding design expert, or team, will search for the trends and data that refer to their respective category, be it a regional, 70-PAX, or a double-aisle, commercial jet. This is the reason why, for example, almost all major EU research projects provide dedicated data for each platform category [28,29,30,31]. In a similar manner, when a new UAV development project begins, it is highly likely that the design team will have an indication of its size beforehand. That is, they will not be looking for “fixed-wing UAV design trends” in general, but for the trends and data that apply to their specific design case. Similar arguments can be made for the mission type parameter, which, along with the size and weight classification, is a key variable used by well-established aircraft design textbooks and methods [19,20,32,33] when it comes to expressing design trends data and charts. Region of origin can help to provide insight into the technology availability and design approach of various countries and continents, while identifying the trends in terms of design parameters and technology availability is a powerful tool, not only from a marketing point of view, but from a designer’s perspective as well. Indicatively, when investigating future designs, a common practice in the commercial airliner industry is to project all values to a reference entry-into-service (EIS) year [28,29,30,31] so that any new configurations, technologies and architectures can be assessed in equal terms. Introducing these critical parameters to unmanned aviation is the primary motivation for this work. Generating a fixed-wing UAV database that resembles the philosophy employed by manned aircraft designers will help to further advance the UAV design activities. Moreover, given that the tools of UAV layout design and performance are based on aircraft design textbooks and methods, the authors can find no reason to not establish a common approach on a database level.
An in-house database based on 202 existing fixed-wing UAV platforms has been populated, including 38 different parameters. It must be noted that not every parameter is available for all 202 UAV models, as is the case with Section 3.2 (results per EIS). These parameters refer to both “technical” variables (layout, aerodynamics, and performance), as well as to “operational” variables related to EIS year and NATO classification. As indicatively shown in the methodology section (Section 2), adding the “operational” variables in the investigation aids the authors in identifying some shortcomings and gaps in the existing literature concerning existing fixed-wing UAV correlations. A wide variety of charts, trends and coefficients are calculated and presented in an attempt to highlight those shortcomings and to suggest a way of addressing them.
It must be noted at this point that some of the initially considered technical and operational parameters are eventually omitted. That is, parameters related to units of production, cost per unit, aspect ratio, installed power/thrust and runway length are not shown in the results, due to a lack of solid available data. A typical example of such a parameter is the range, as thoroughly discussed in Section 2.2.5. For the rest of the parameters, the corresponding results can be primarily used to provide a more pragmatic definition of fixed-wing UAV design space. Finally, by providing data for the “operational” variables, as well as their correlations with the “technical” ones, the results of this work can be used to train advanced machine learning models, in a similar approach to the one suggested in [26].

2. Materials and Methods

The key steps of the proposed methodology are presented in Figure 1. The first step in the data collection process is to identify the sources of data and to create the basic UAVs’ array per model, along with the “technical” and “operational” parameters that are going to be investigated. The selected parameters, among others, include layout and performance data (weights included), NATO classification, region of origin, EIS, mission type, etc. Once the data have been collected, they are organized into a comprehensive and updatable database, which allows ease of access and retrieval of the contained information. The database is also designed to allow for efficient searching, filtering, and sorting of data. The final step is to analyze the data and to identify occurring trends in UAV design. The lack of a specific trend to a dataset can also be useful in informing future UAV designers to treat historic data and trendlines with caution.

2.1. Database Population

For the current research, the available data sources include government agencies, academic institutions and private companies that publicly share their UAV data. To ensure data quality control, a systematic method is developed for collecting and storing data, including a multi-step process of finding available UAVs, cross-checking the given values based on similar platforms or other independent sources, including the specific model to the database and conducting a final sample check of approximately 1 out of 20 entries to assure that all values are correctly entered. Less than 0.5% of the values corresponded to wrongly entered ones, i.e., one wingspan and one EIS value. The latter is traced back to typos made by the researchers during the database population. After collecting the data, a standardized data structure and format are introduced to the database, as special guidelines for data naming conventions and units of measurement are set. The database itself is created in a spreadsheet format for ease of access, data sorting and plot creation.

2.2. Parameter Selection

The selected parameters for the database population are split into two main categories. The first one includes the parameters that are used to quantify the specifications of a UAV and, as such, are related to layout, aerodynamics and performance (“technical” parameters). They are used to extract design trends regarding the platform itself, in a similar way to the work shown in [22,24,25]. The most notable of these parameters are the wingspan and length, the cruise and maximum speed, the gross take-off weight (GTOW), payload weight and empty weight, the propulsion type and its generated power, the endurance, service ceiling and the operational range. The second category involves UAV characteristics that are used to classify the aerial vehicles from an operational perspective (“operational” parameters). Indicatively, some of these parameters are the region of origin, EIS, NATO UAV category, primary mission type, etc. In general, technical parameters are expressed using continuous numeric variables, whereas operational ones are either grouped in classes or defined as logical ones, respectively creating different types of charts (continuous plots for the first and bar/pie charts for the latter)

2.2.1. UAV NATO Classification

The aim of the NATO UAV classification system (Table 2) is to provide a certain way of describing different UAVs based on a wide range of characteristics, such as their size, range, endurance and operational capabilities. The classification intends to facilitate interoperability and equipment interchangeability among NATO member-states by providing a common ground about UAVs, and it consists of three main parts: operational category, performance capabilities and design approach.
In the present study, the categorization is primarily made in terms of GTOW. Especially when it comes to Class III, the authors also employ the parameters of service ceiling (i.e., to set the “MALE” and “HALE” categories apart) and mission type (i.e., for the UAVs that belong in the “Strike” category), provided that the GTOW is above 600 kg [23].
Using a standardized classification system facilitates a systematic universal approach to categorizing UAVs based on engineering/design criteria and market/operational constraints. By observing the numbers referring to weight and ceiling, it is evident that fixed-wing UAVs vary considerably in terms of size. This observation supports the claim made in the introduction section (Section 1), i.e., that by ignoring the classification system and by employing design trends extracted for all UAVs alike, a design engineer can draw confusing, or simply inaccurate, conclusions and guidelines for the design space that refers to their study (in a similar way that employing trends for double-aisle jets can confuse a general aviation aircraft designer).

2.2.2. Year of Introduction (EIS YEAR)

The year of introduction (or EIS year) parameter is introduced to the overall analysis in order to provide trends data for the UAV design and market evolution, based on several reasons. First of all, the field of fixed-wing UAVs is a rapidly evolving one, and new designs are being introduced every year. By assessing the year of introduction, it is possible to identify how a design compares to more recent UAV models in terms of performance and capabilities. Moreover, in a similar approach to manned aircraft and, more specifically, to commercial airliners, the EIS classification can be used to identify any trends, e.g., as a result of material technology improvements. Finally, UAV designs can evolve over time, with improvements and modifications being made to address performance and operational issues, sometimes with the introduction of derivative models or “submodels”. A typical example is the case of the General Atomics MQ-9B Sea Guardian and MQ-9C Avenger, i.e., two versions of the MQ-9 Reaper, which vary considerably in terms of wingspan and payload capacity [34]. The year of introduction for each “submodel” can be important for understanding the design’s development history and creating relevant trendlines for future ones. However, it should be noted that EIS year is one of the most challenging parameters to accurately obtain, since many UAV manufacturers may avoid presenting maiden flight dates or present market derivative models as completely new designs [7].

2.2.3. Region Classification

The region classification is used to categorize fixed-wing UAVs, based on the continent of origin. Note that the authors decided to exclude the United States of America and Israel from their respective continents and categorize them as separate regions, since both countries exhibit a large number of different UAV designs throughout the years and are widely recognized as pioneering nations in this field. This claim is supported by the data shown in Figure 2, where the UAV models per region are presented as a percentage of the total sample. USA and Israel feature double digits, surpassing entire continents, such as Africa and Oceania.
Summing up, the region classes of this study are:
  • Africa;
  • America;
  • Asia;
  • Europe;
  • Oceania;
  • USA;
  • Israel.

2.2.4. Mission Categorization

As the UAV industry continues to expand, the authors considered the option to classify UAVs based on their specific applications and functionalities (from now on to be referred to as “missions”) [18,27]. The suggested mission categories are comprehensive, ensuring that no UAV is left out of the categorization process, and are listed as follows:
  • ISTAR (Intelligence, Surveillance, Target Acquisition and Reconnaissance) tactical, for UAVs intended to act as “eyes in the sky” for military and civilian use and operational range in line of sight from its command center (LOS);
  • ISTAR strategic, for UAVs that have a similar role to the previous category, but their range is limited only by their performance parameters (not by their telecommunication systems);
  • Attack, for UAVs that carry armament and have ground attack capabilities (UCAV);
  • Target, for UAVs used as practice targets for manned aircraft;
  • Loitering Munitions (LM), for single-use UAVs used as ordnance delivery systems;
  • Utility, for UAVs with missions that cannot be classified into the above.

2.2.5. Range

Range can be an important performance criterion in UAV design and in aircraft in general [19]. However, although the authors initially considered the range amongst the various parameters of this study, it was eventually dropped for a number of reasons. As a start, most fixed-wing UAVs conduct ISTAR missions, where loiter endurance is more important than cruise range, while when it comes to target drones or LM UAVs, cruise range may be calculated for a one-way sortie only. Moreover, in some sources, it is not specified if the maximum range of a given UAV is calculated with full payload or not. Furthermore, in contrast to manned aircraft, UAV range does not refer to the usual performance criterion that maximizes either fuel capacity or aerodynamic and performance efficiency. That is, the operational range of an unmanned vehicle is also constrained by the maximum communications radius and, in turn, by its avionics. Therefore, the data available in the literature concerning the range parameter are not of practical use, simply because each source may refer to a different definition. For example, some of the manufacturers give an indicative range value as a result of performance calculation and others as telecommunication systems limitations.
To support these arguments, the example of Guardian Eye is given, which is an electrically powered mini UAV with a marketed range of 46.3 km. At the same time, its endurance is given to up to 4 h (with solar panels) with a cruising velocity of 85 km/h [35]. It is apparent that the operational radius is constrained by non-performance factors and the exact configuration (with or without supplementary solar panels) is not specified in its datasheet.

2.2.6. Other Parameters

This section refers to parameters that may be of interest for UAV designers but are either not well documented, or that apply to very few UAVs, at least for the time being. A typical example is the “low observability” parameter. All these special parameters are logical variables since, for example, a fixed-wing UAV can either be designed for low observability (marked as “true”) or not (marked as “false”).

2.3. Correlation Coefficients Calculation and Initial Parameters Screening

To identify possible correlations between the dataset parameters, the heatmap presented in Figure 2 was utilized [26]. Figure 2 is a graphic representation of the Spearman rank correlation coefficient, which measures the strength and direction of the monotonic relationship (whether linear or not) between two variables. The resulting coefficient ranges from −1 to +1, where −1 indicates a perfect negative monotonic relationship, 0 indicates no relationship, and +1 indicates a perfect positive monotonic relationship. It is defined as the Pearson correlation coefficient between the rank variables (Equation (1)).
r s = ρ R ( X ) , R ( Y ) = c o v ( R ( X ) , R ( Y ) ) σ R ( X ) σ R ( Y )
Utilizing Figure 3, it can be shown that there is a strong correlation between some variables (e.g., GTOW and payload weight, wingspan and GTOW), indicating that those combinations can be further analyzed. The parameter combinations that do not have a well-defined linear correlation are excluded from the overall analysis for the rest of this study.

2.4. Statistical Methods and Trends Fitting

To extract useful trends from the dataset created, the least squares methodology is implemented in the current work. Ordinary least squares (OLS) is a well-established statistical technique for finding the best-fitting line or curve to represent a set of data points. By calculating the sum of squared errors between predicted and actual values, OLS [36,37,38] minimizes this value to identify the best-fitting line or curve (Equations (2)–(6)). This widely used method is presented in several textbooks [31,32,33] and is helpful for better understanding the relationships between variables and making more accurate predictions. OLS has been applied in similar research papers regarding UAV databases and sizing correlations [24].
L i n e a r : y = A x + B
P o l y n o m i a l : y = A x 2 + B x + C
P o w e r : y = A x B
E x p o n e n t i a l : y = A e B x
L o g a r i t h m i c : y = A ln x + B
Two approaches are used with the dataset, depending on whether the variable to be fitted shows great dispersion or not. In case this statement is true (e.g., wingspan versus gross takeoff weight (GTOW)), a logarithmic transformation is conducted to the data for the fitting process to be smoother. If not, then the fitting process continues uninterrupted. To determine the most suitable correlation between UAV parameters, the aforementioned OLS method is used, with the parameters either logarithmically transformed or not, onto the 4 determined curve types. In the case of the transformed data, the best-fitted curve has to be transformed back to the physical plane and thus changes its form (e.g., a linear curve in the logarithmic plane, should be a power curve in the physical). Assisting the fitting process, the Python® machine learning library Scikit-Learn [39] was implemented. As criteria to determine the most suitable curve, the R2 term is utilized, by splitting the available data into fitting and testing ones with a 75–25% distribution, using the fitting ones for the fit process and then checking the curve fitted with the testing ones.
Box plots, bar charts and pie charts are utilized as additional tools to further explore the nature of the dataset parameters. Bar charts and pie charts are created to identify the market trends or gaps through the years for qualitative parameters, such as low observability and satellite communication system (SatComm). Moreover, box plots are used as a statistical means to show the dispersion of the data [36], which is also a very important metric to evaluate the fitting in addition to the R2. The main attributes of a box plot are the box itself, the median line, the whiskers and the possible outliers.

2.5. Initial Results and Method Evaluation

To evaluate the suggested methodology, some preliminary results of this work are compared against existing data from the literature. This comparison leads to a very interesting observation that, to a large extent, defines a large part of the approach of this study and strengthens the motivation.
Indicatively, as shown in Figure 4 and Table 3, the in-house generated trendline for the “wingspan vs. GTOW” dataset is compared against the trendline calculated in Ref [24]. Note that the two results achieve a very high prediction accuracy and are in very good agreement with each other. Any minor deviations are attributed by the authors to the different dataset entries, since the two studies do not have a common database. As a next step, the authors applied these trendlines to predict the wingspan parameter for a given GTOW value, for several UAVs that belong in different NATO categories. Some typical results are shown in Table 4. Note that the exact same trendlines that, as described above, adequately represent the general sample are not as accurate for all NATO categories alike. For example, although a single-digit accuracy is achieved for the mini category, the predictions deviate considerably for larger UAVs, reaching as much as 40% for the tactical category.
As discussed in the introduction, it is highly likely that, by applying a regression to all the data alike, the individual information in-between is “smoothed-out”, rendering the general trendlines insufficient. However, when it comes to developing a new fixed-wing UAV, the mission requirements (e.g., useful payload capacity) will usually point to a range of NATO categories, if not to a specific one. Therefore, the corresponding design engineer (or design team) will not be looking for “fixed-wing UAV design trends” in general, but for the trends and data that apply to their specific design case.
Summing up, based on these preliminary results, the reader is advised to evaluate each chart separately and not to only rely on the generic UAV trendlines. Dot plots and box plots are also provided as a statistical means to show the dispersion of the data [37], which, in some cases, is also a very important metric to better define the corresponding design space and evaluate the fitting (apart from R2).

3. Results

The results section begins with an overview of the statistical data regarding the documented UAV missions (Figure 5). The results indicate that the predominant mission for fixed-wing UAVs (74%) is related to intelligence, surveillance, target acquisition and reconnaissance (ISTAR). A 13.4% is related to combat missions, while single-digit percentages correspond to LM and target drones. Due to the clear tendency of the fixed-wing UAV fleet towards the ISTAR missions, no technical charts are going to be presented with regard to the primary mission type.

3.1. General Results: Key Geometrical, Aerodynamic and Performance Parameters

This section is dedicated to the analysis of the key technical parameters. For every parameter, the results are initially presented for all UAVs alike, followed by the NATO categories and regional classifications. More specifically, in the first charts of Section 3.1, the technical parameters of wingspan and weights are discussed, along with the critical weight design ratios. Concerning the latter, the fundamental relation shown in Equation (7) is used as a reference point [19,33].
W 0 = W crew + W payload 1 W f / W 0 W e / W 0
Note that W0 stands for GTOW, the ratios Wf/W0 and We/W0 for the fuel and empty weight fractions and Wcrew is the crew weight that in UAV design is, by definition, set to zero. Correlations regarding the payload weight and empty weight are investigated. Moreover, the empty weight ratio (We/W0) is also analyzed as one of the most critical parameters that need to be estimated during conceptual design [19]. The analysis of the fuel weight ratio, however, is not as straightforward, since a common UAV operator strategy is to exchange between payload (for maximum effectiveness and/or sensing) and fuel (for maximum flight time), depending on the mission. Therefore, the approach of [24] is employed, and the parameter of Wp · E is discussed, where E stands for endurance (flight time). Finally, the cruise speed and service ceiling parameters are also plotted as a function of GTOW. Note that, as mentioned in Section 2.4, the authors opted to use dot plots to highlight the large sample dispersion and to provide as much information to the reader as possible.
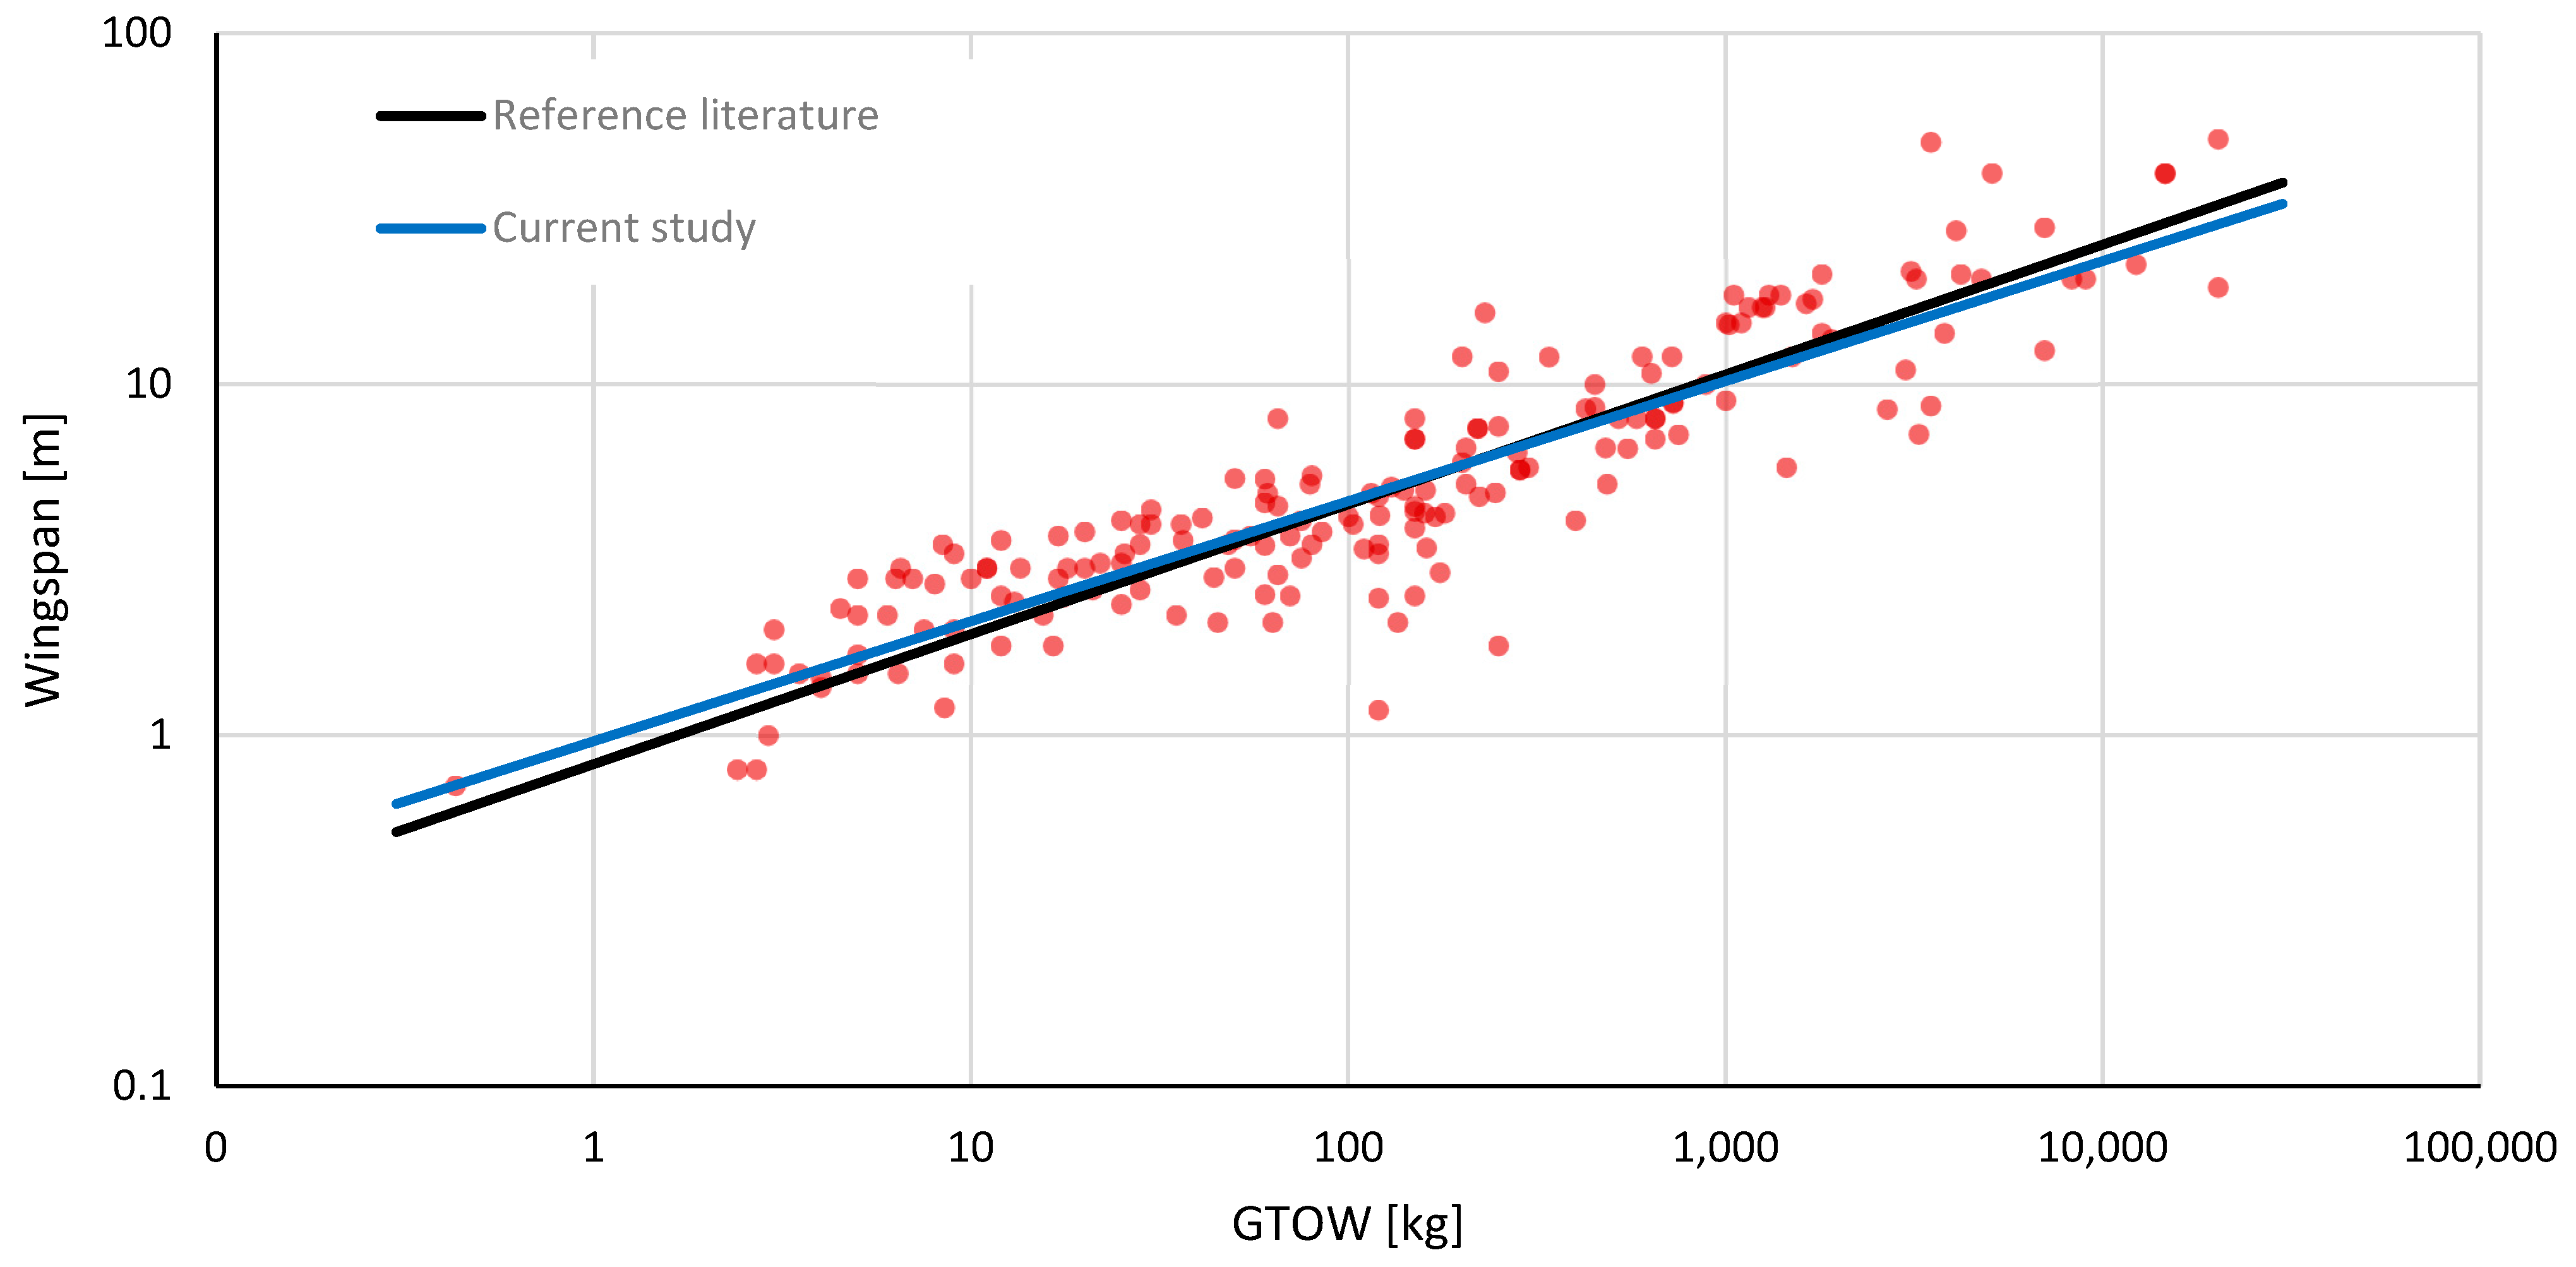
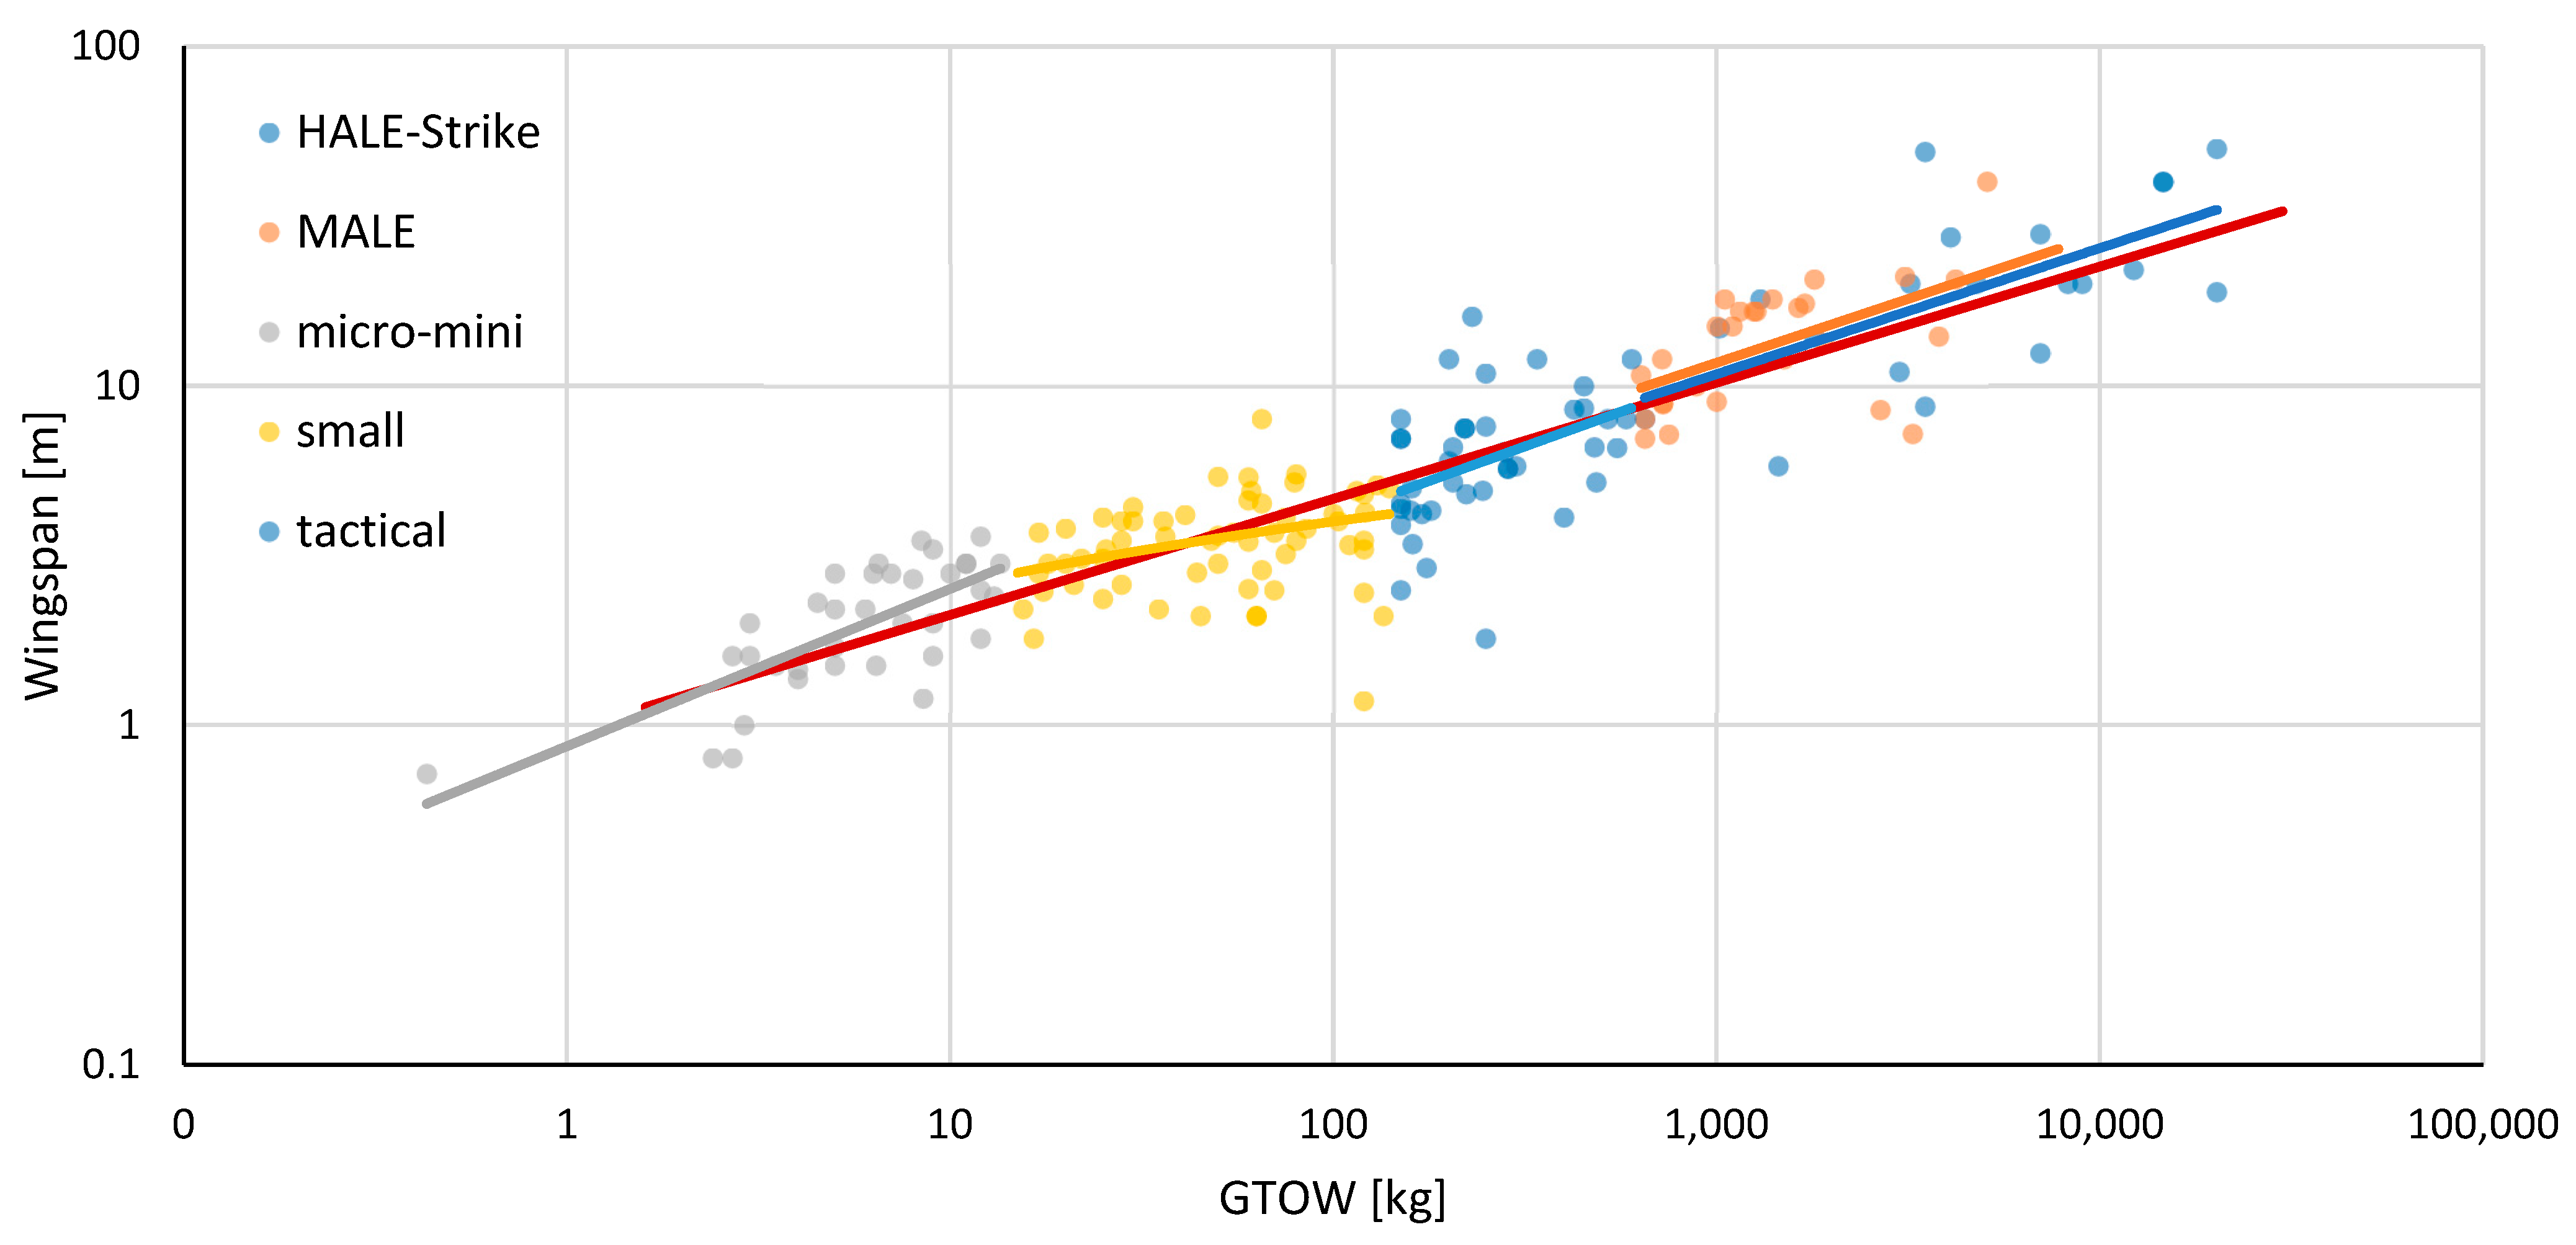
Figure 6 shows the wingspan as a function of GTOW with respect to the NATO classification, while Table 5 sums up the corresponding statistical and correlation results. As also discussed in Section 2.4, the trendline fitting is sufficient in the general category, achieving an R2 of 0.8. However, when each NATO category is individually investigated, the fitting changes considerably. This can be attributed to the inherently large dispersion inside the NATO UAV categories, which is smoothed-out when examining the general dataset. Although a statistical fit might not seem good for a statistics expert, in the field of UAV design this should not be considered a negative result. Instead, in the eyes of a design engineer, this translates to a larger design space for the given category, which would not be available if only the general trendline was taken into account.
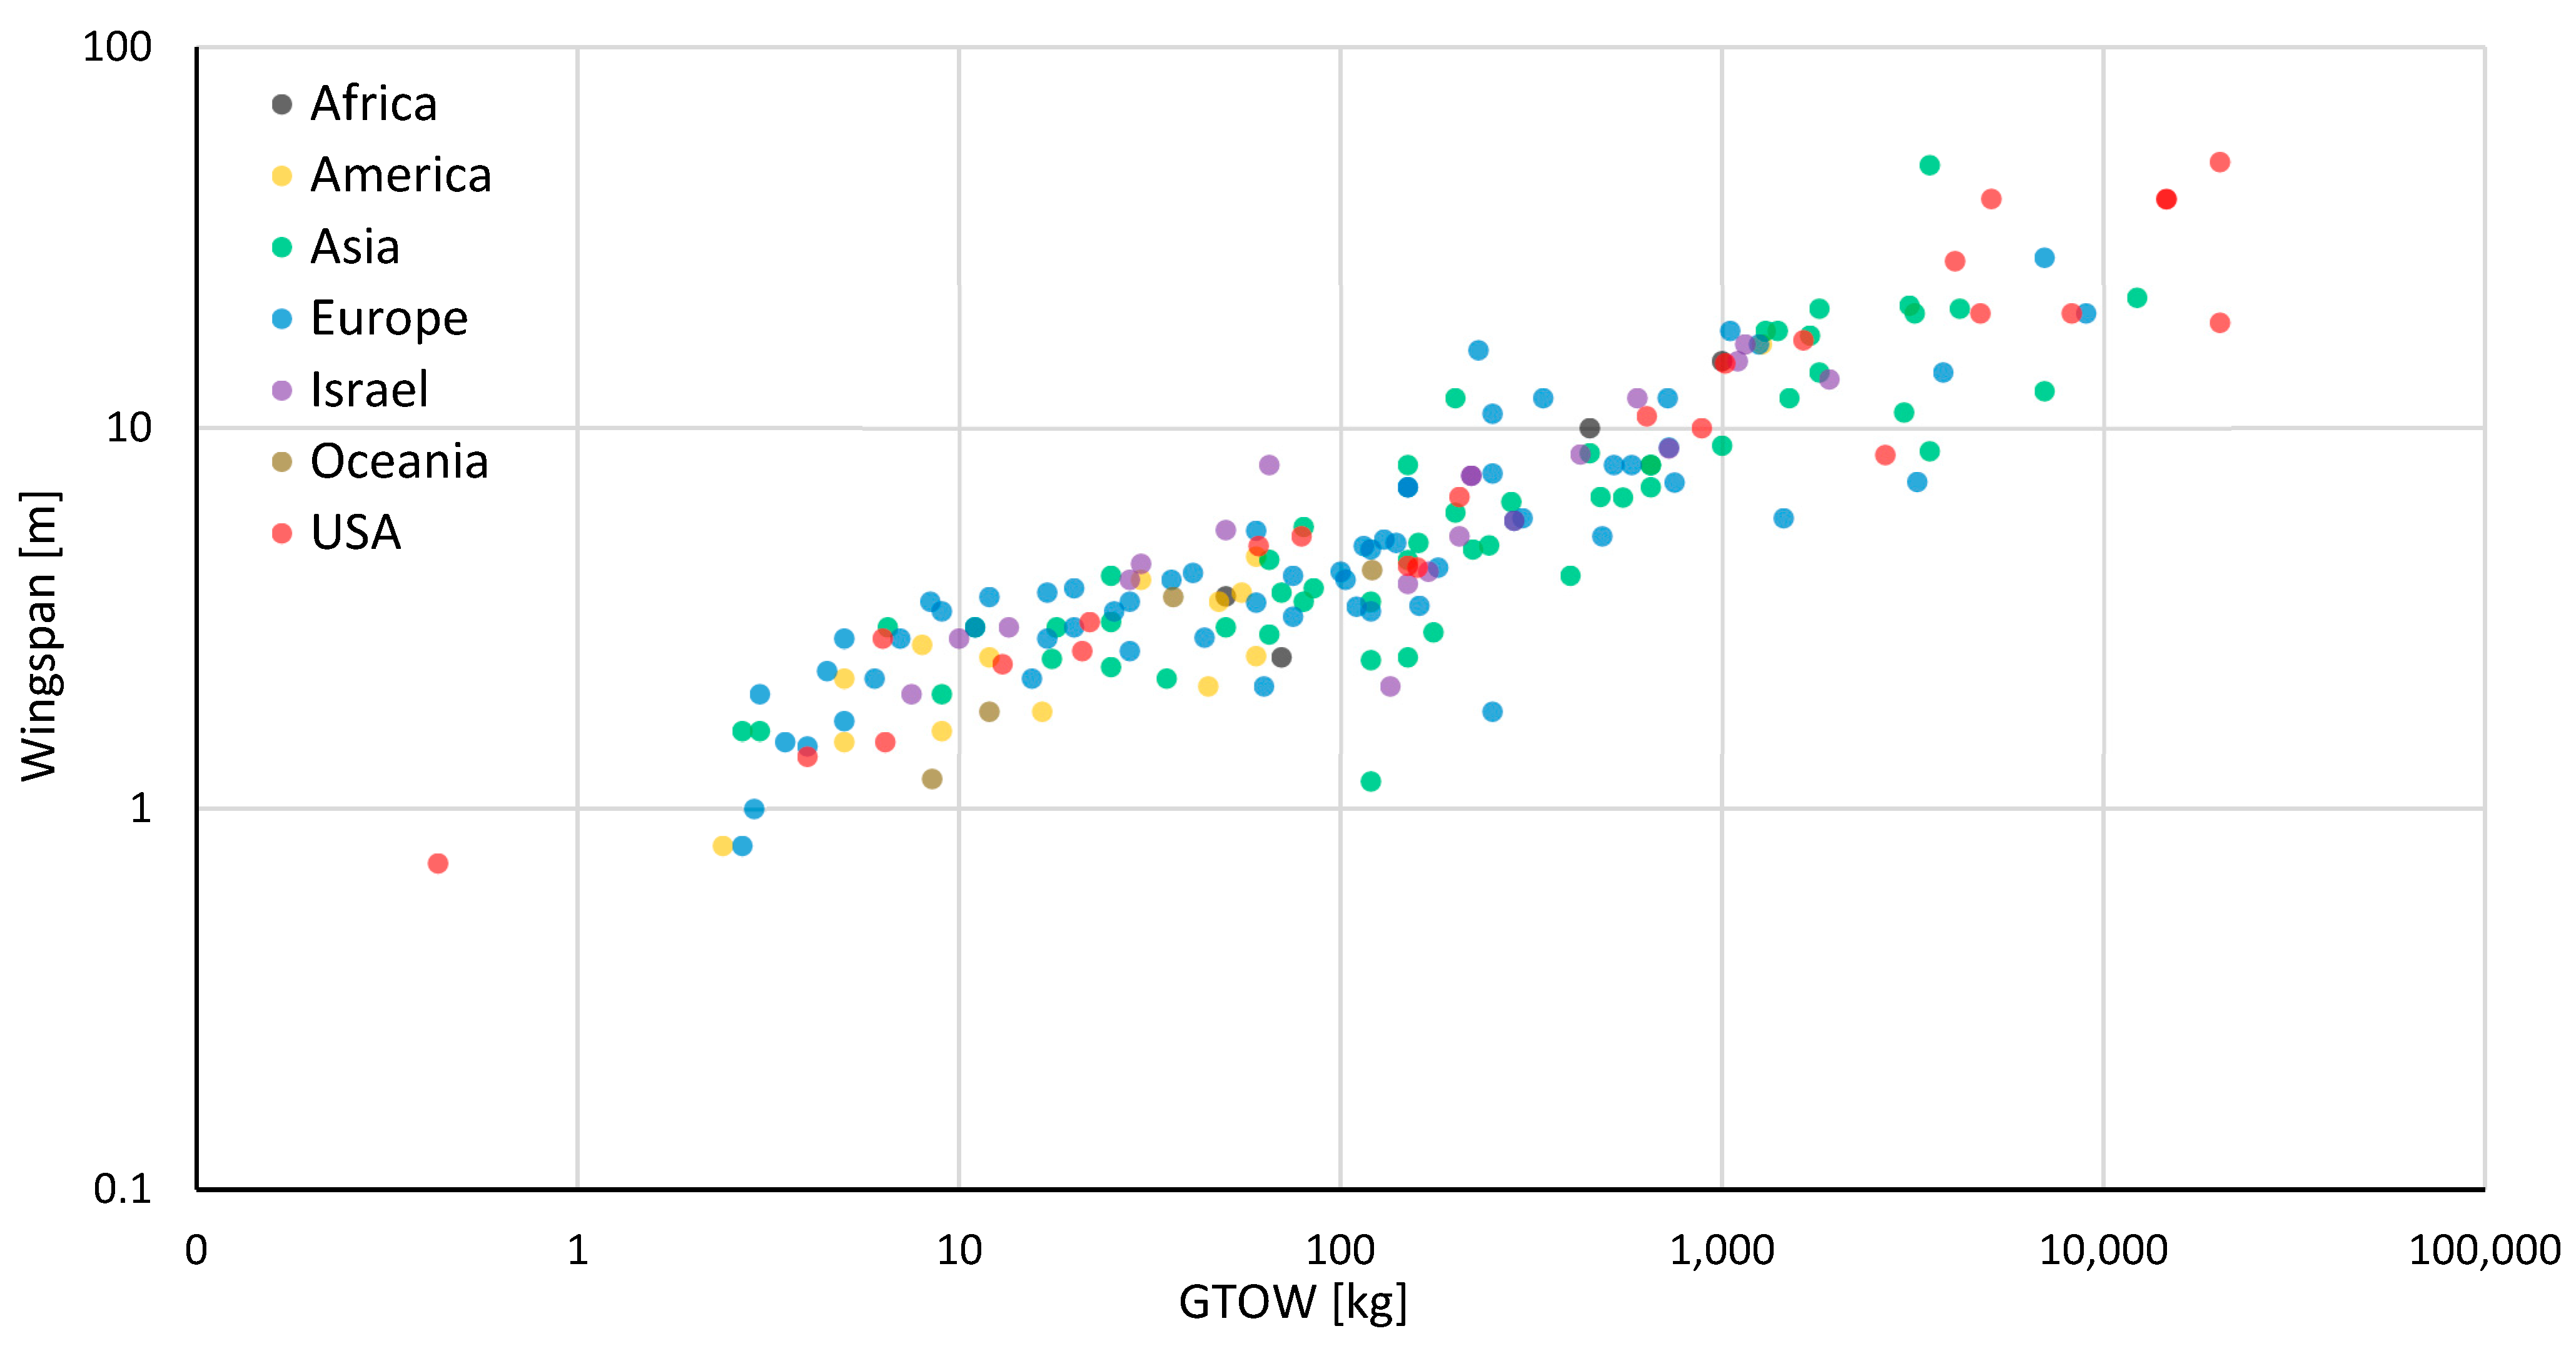
Figure 7 shows the wingspan as a function of GTOW with respect to region of origin. The data dispersion regarding the wingspan as a function of GTOW correlation for different regions of origin is very high. However, this chart can be used to extract certain market conclusions regarding each region. For example, the largest UAVs in terms of wingspan and GTOW have been developed in the United States, whereas the rest of the American continent develops platforms that are smaller in size and weight.
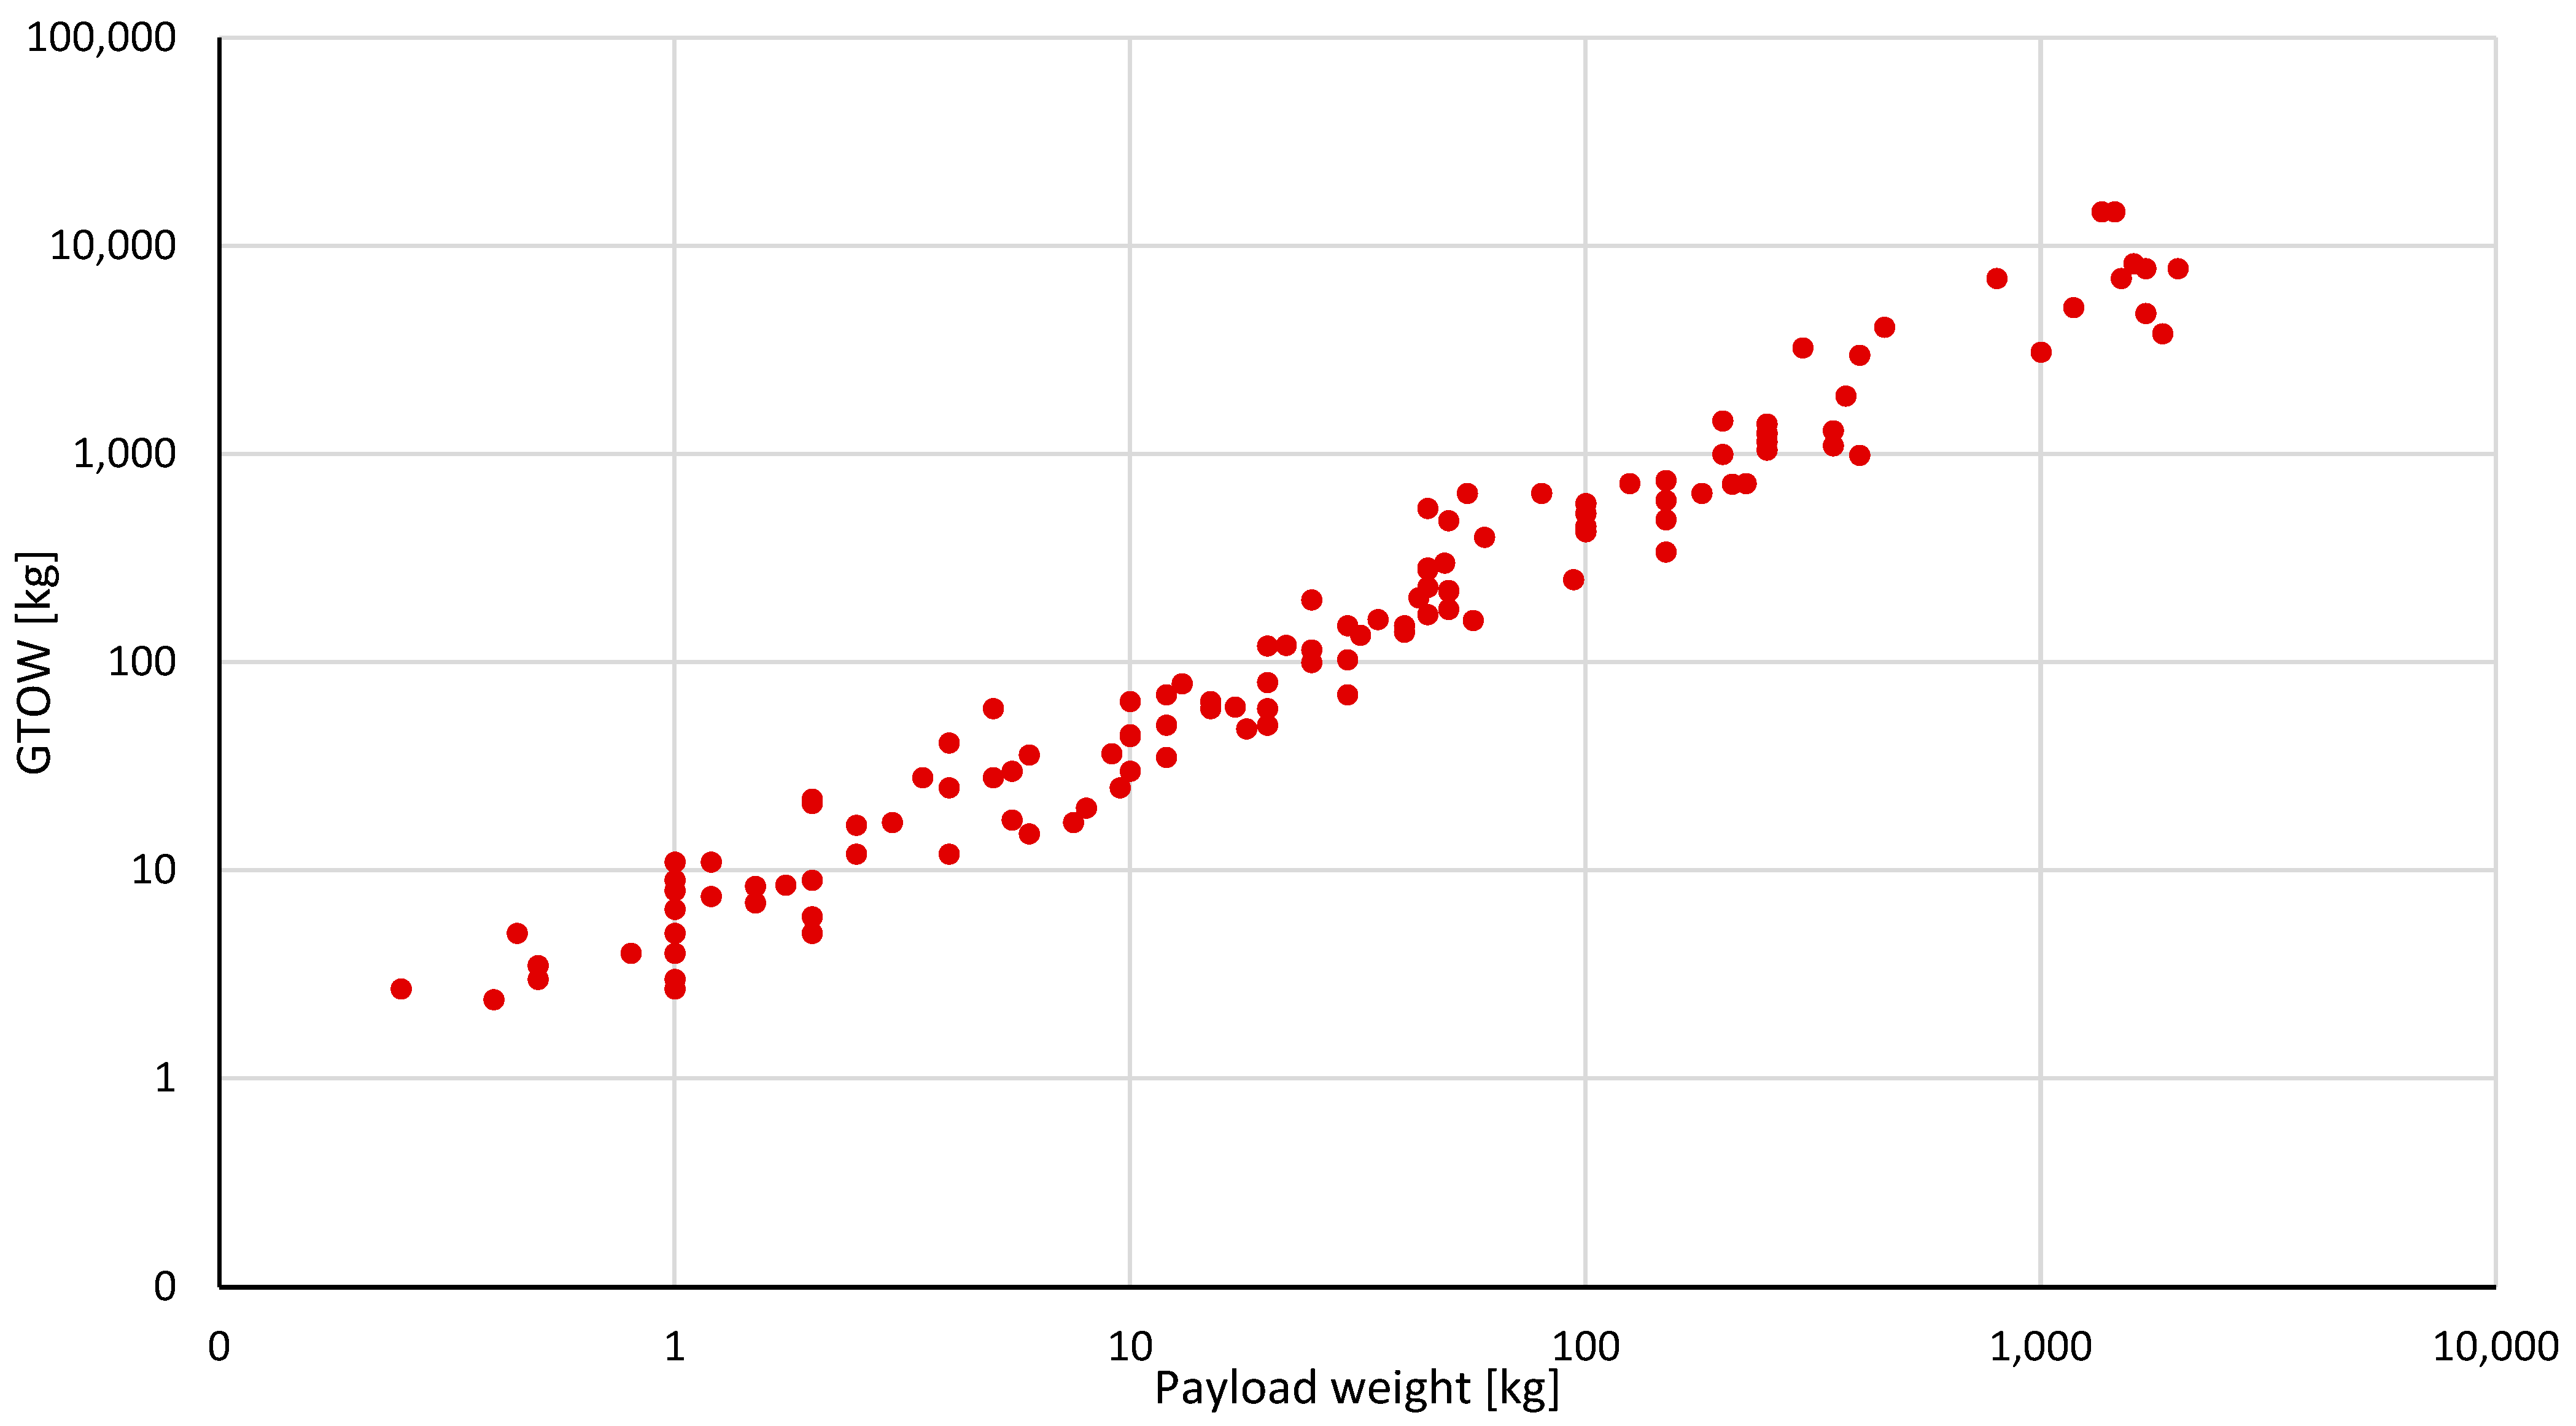
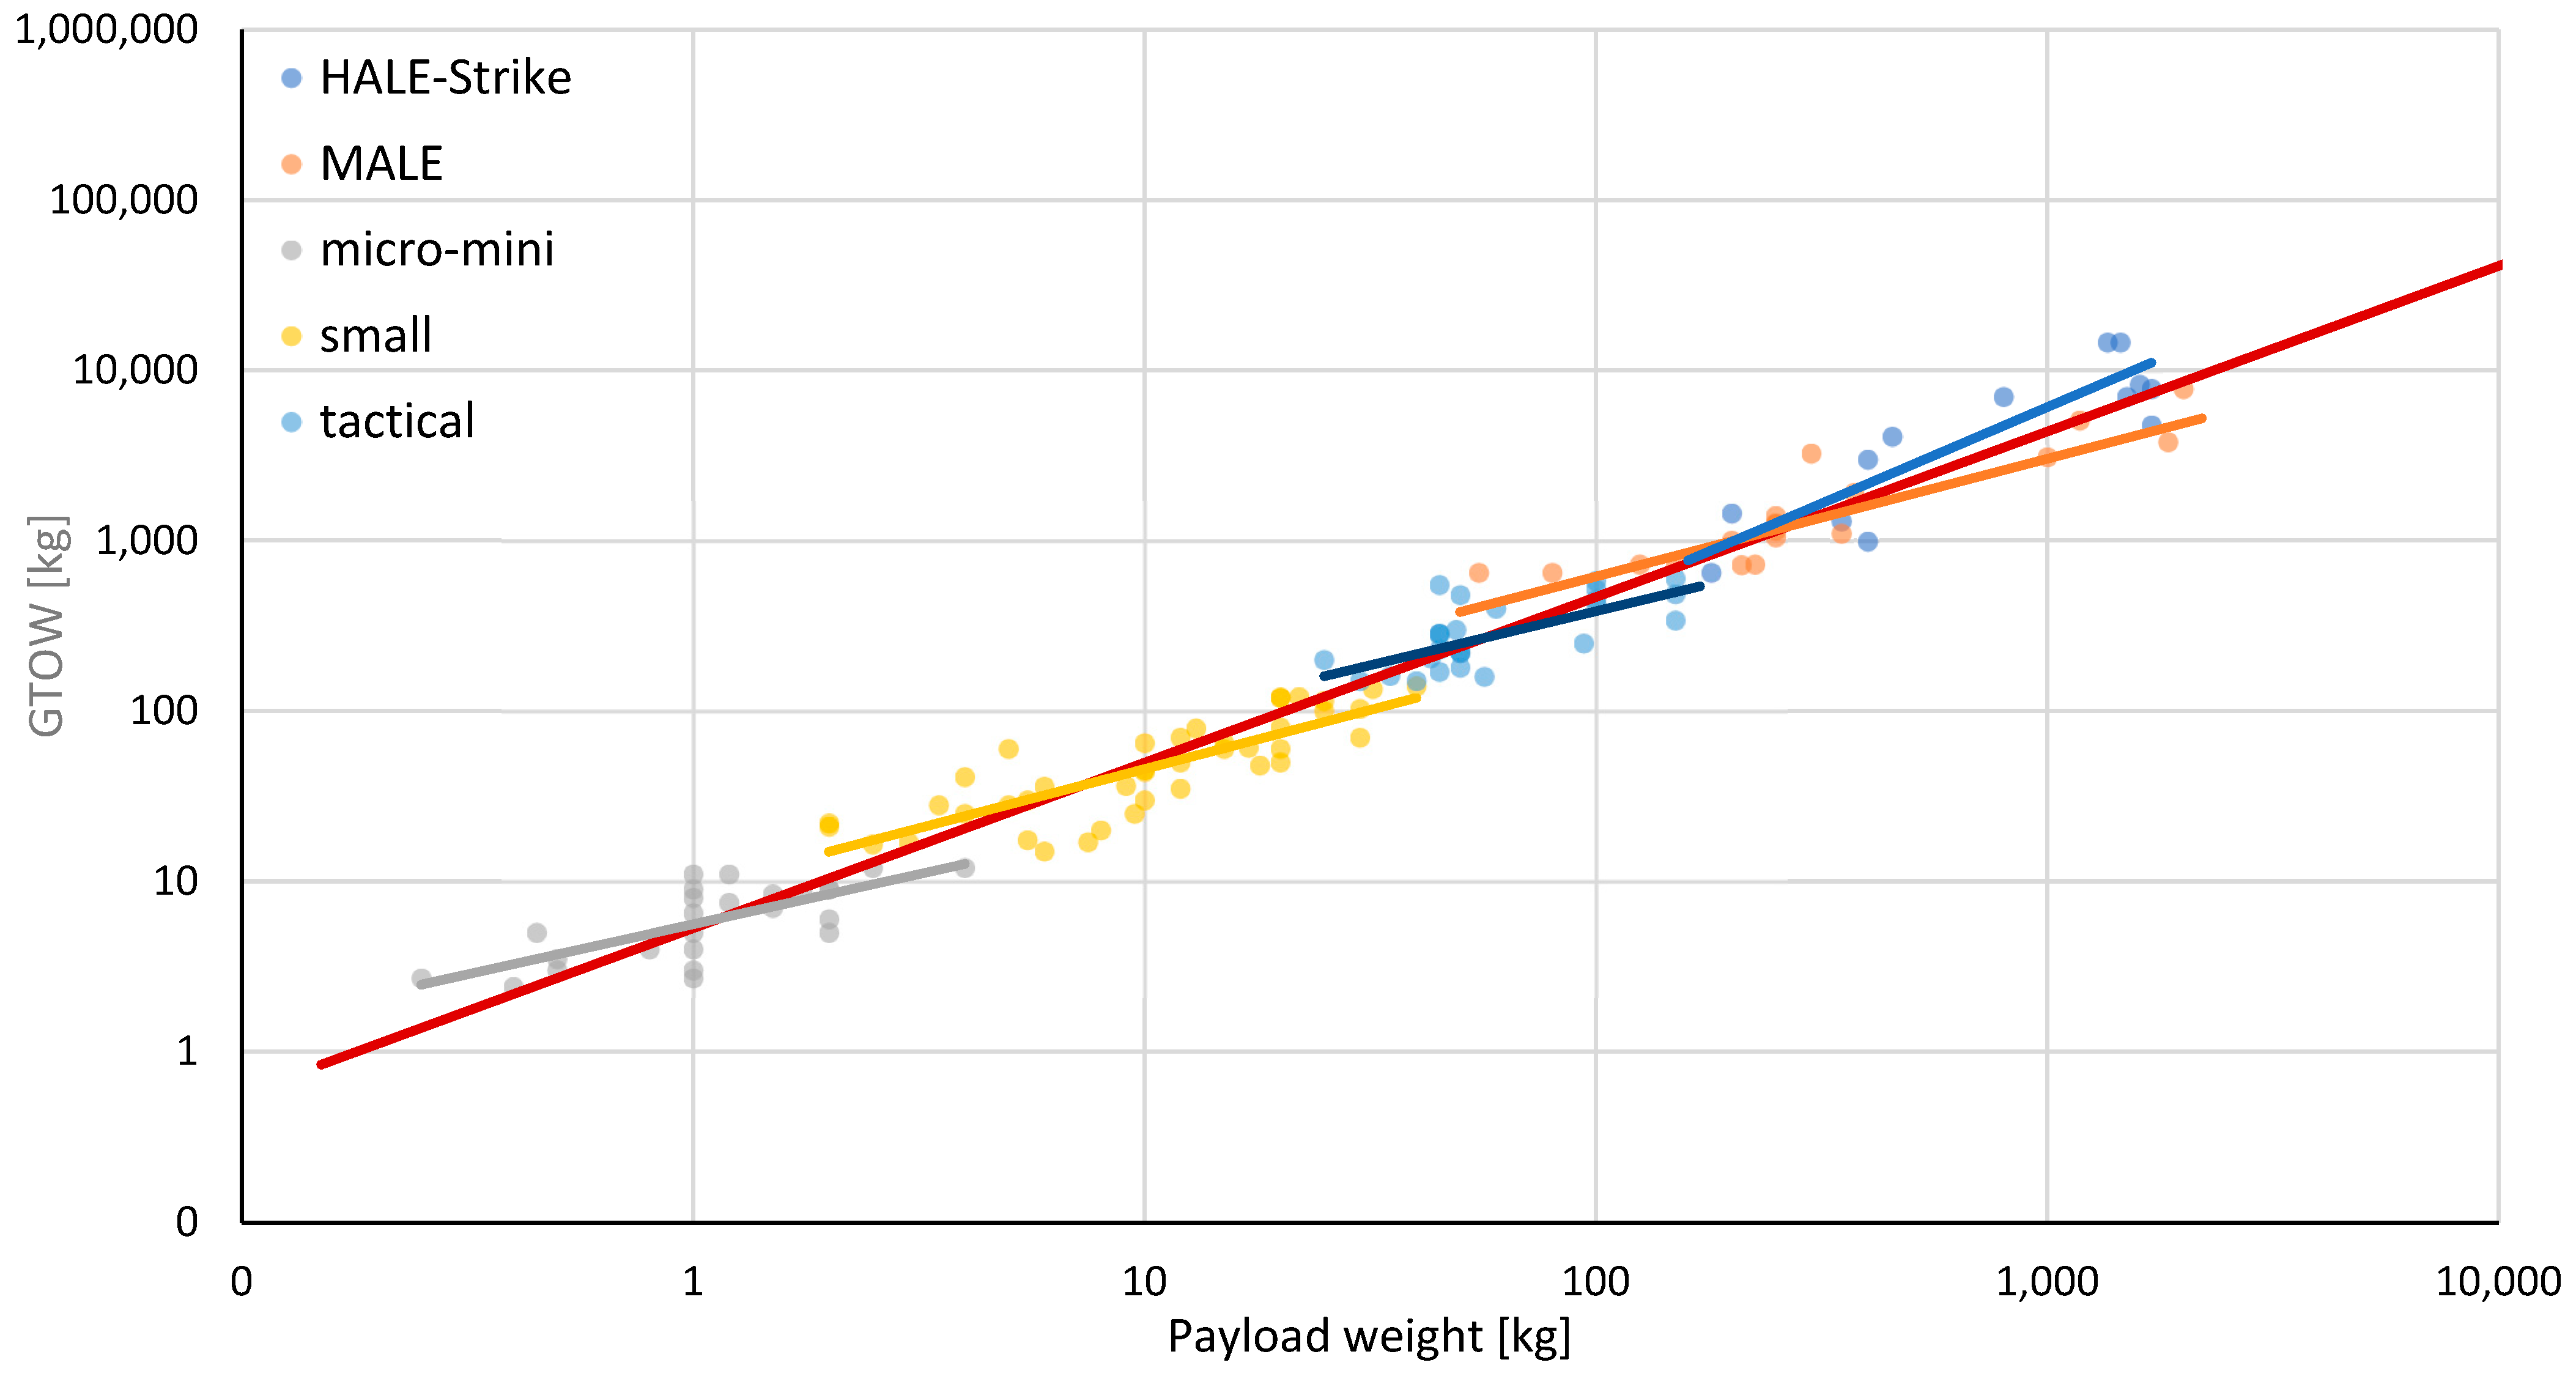
Figure 8 shows the GTOW as a function of payload weight for the general category, while Figure 9 shows the same correlation with respect to NATO classification. Supplementary Table 6 sums up the statistical and correlation results for the GTOW against payload weight analysis. In Figure 8, it can be noticed that there is a very strong power fitting between GTOW and payload weight in the general category, with an R2 equal to 0.965. A very good fitting is also achieved in the MALE classification, where the dispersion of available data is low. Τhe rest of the fittings appear to have a better R2 compared to Table 4, but a considerable dispersion is still present when observing each NATO category individually, leading to the conclusion that the designers need to be more careful when following the trendlines available in previous studies.
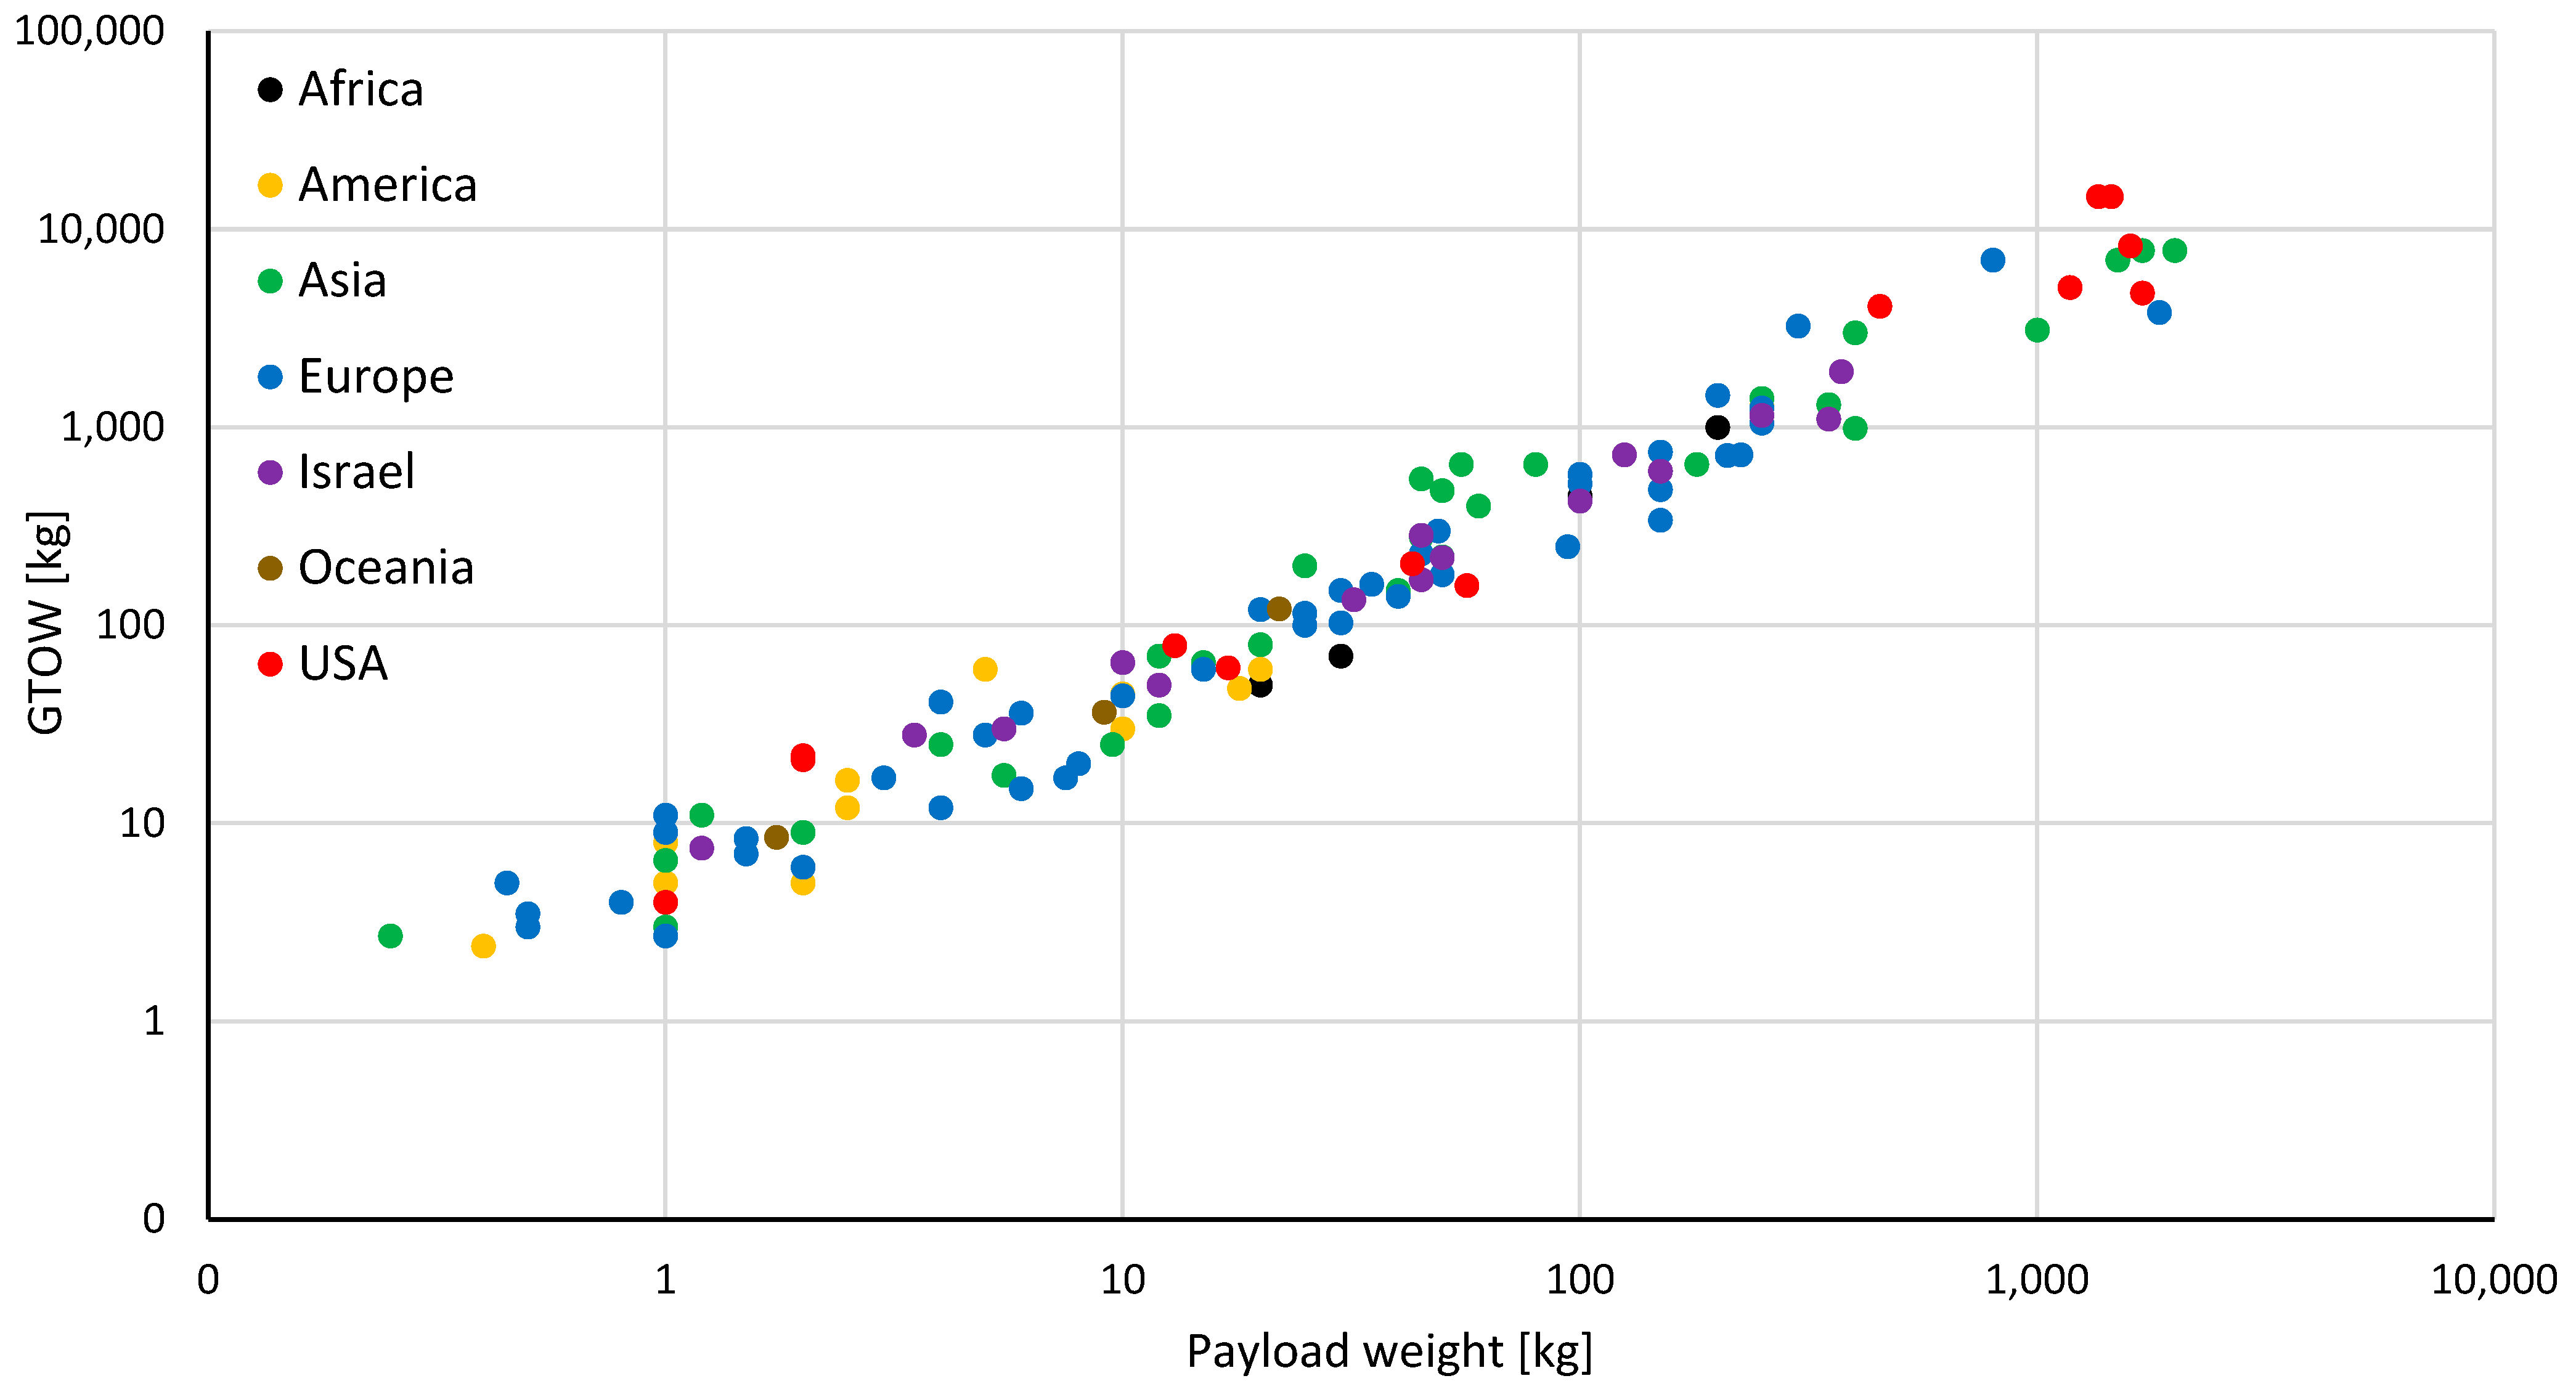
Figure 10 shows the GTOW as a function of payload weight with respect to region of origin. No major conclusions can be drawn from this chart, other than that all regions follow more or less the same trend and that no region shifts its data to a specific plot area.
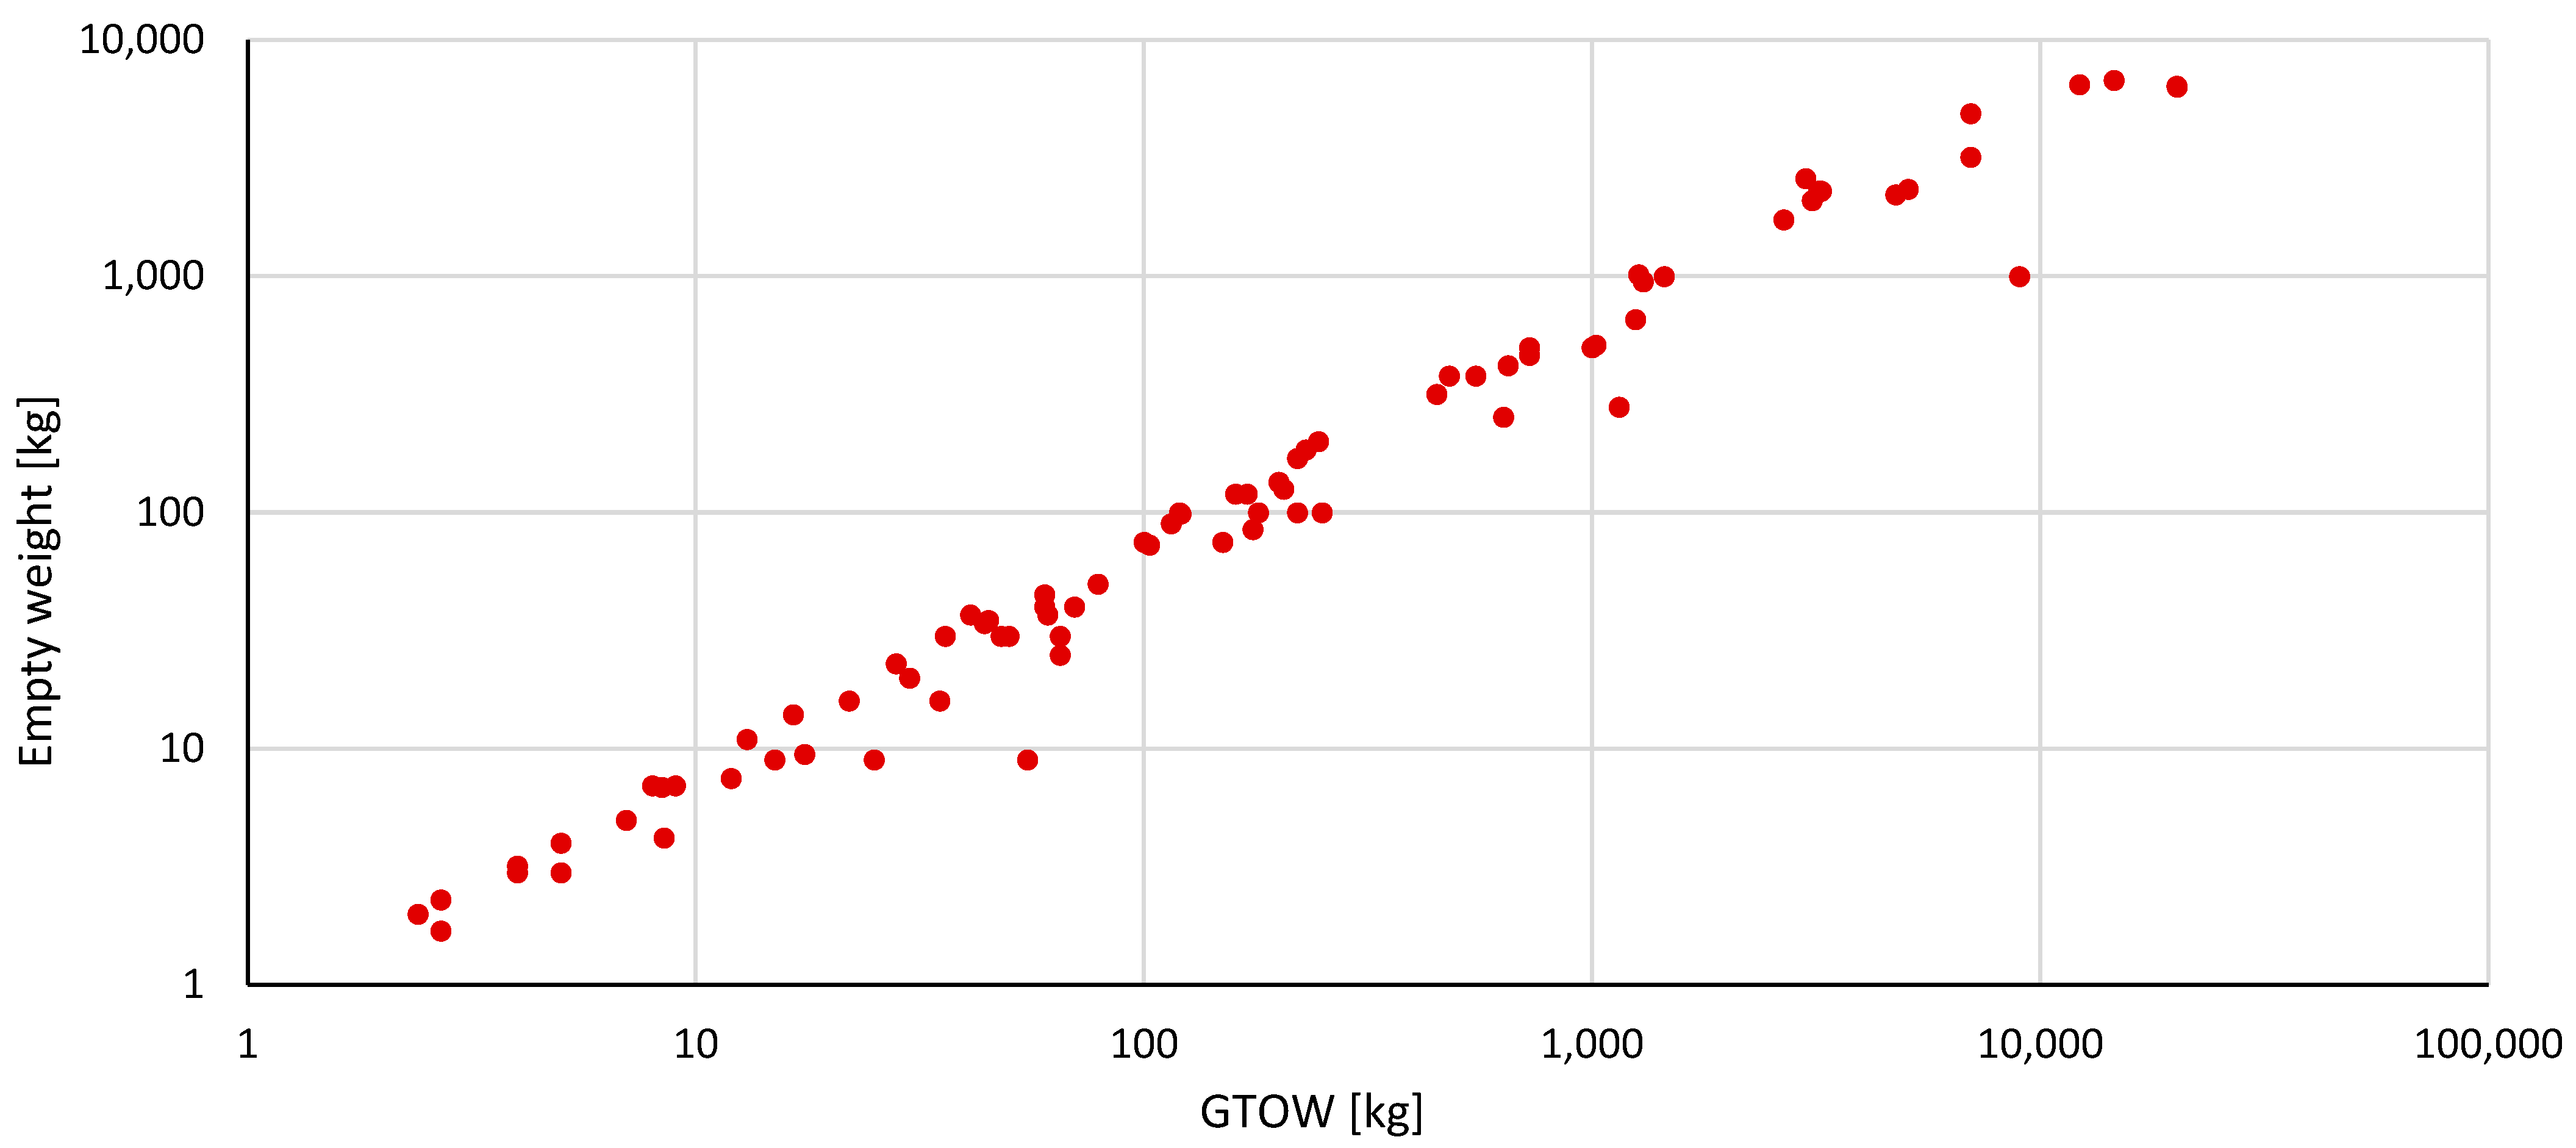
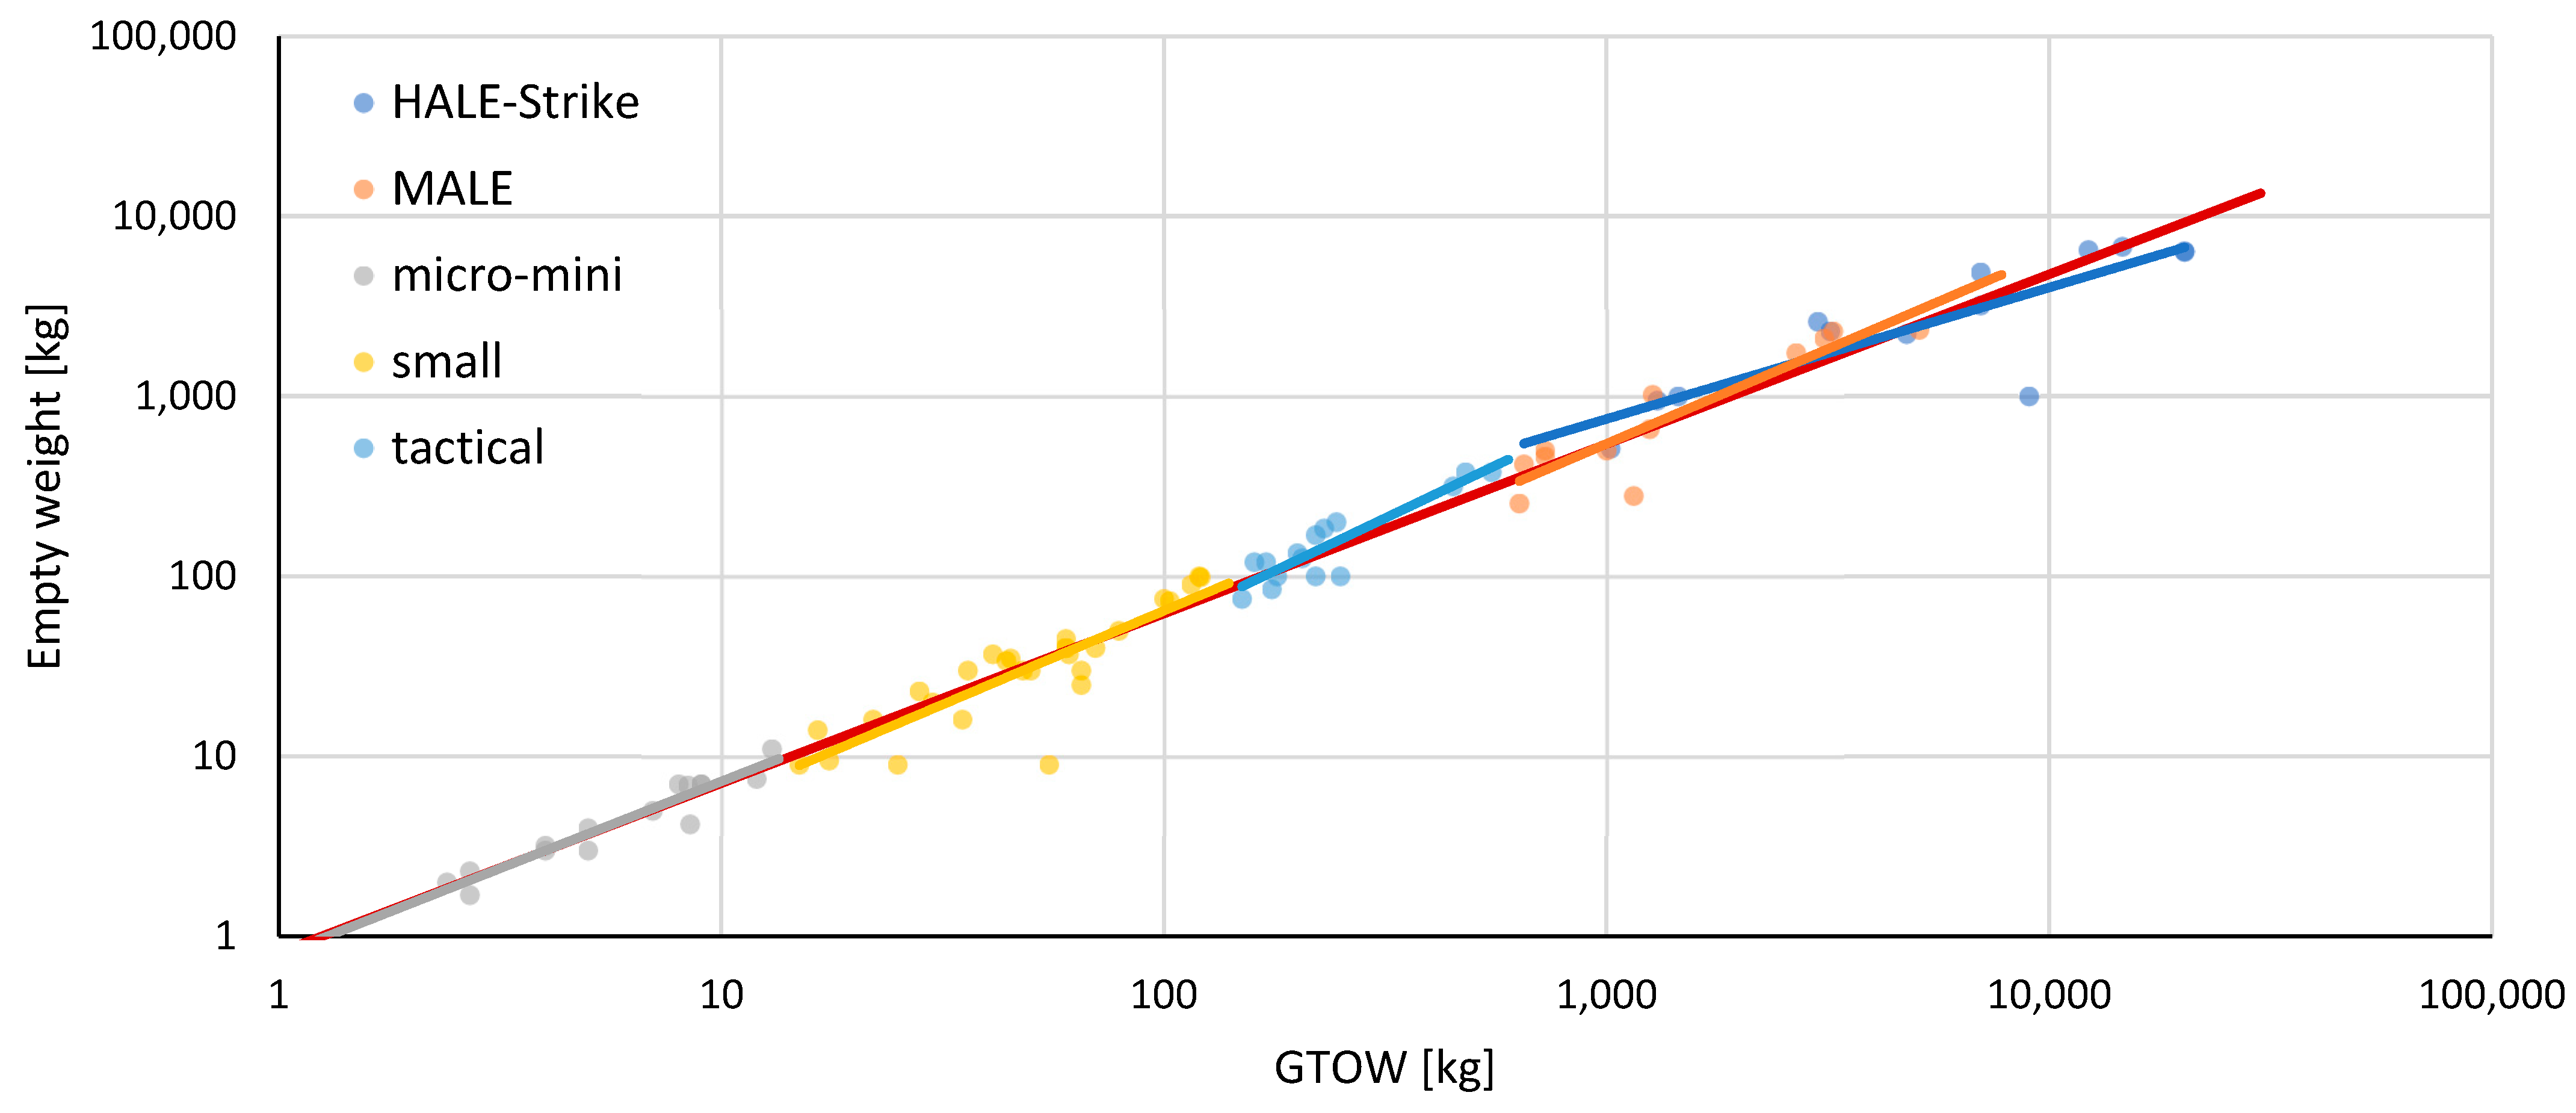
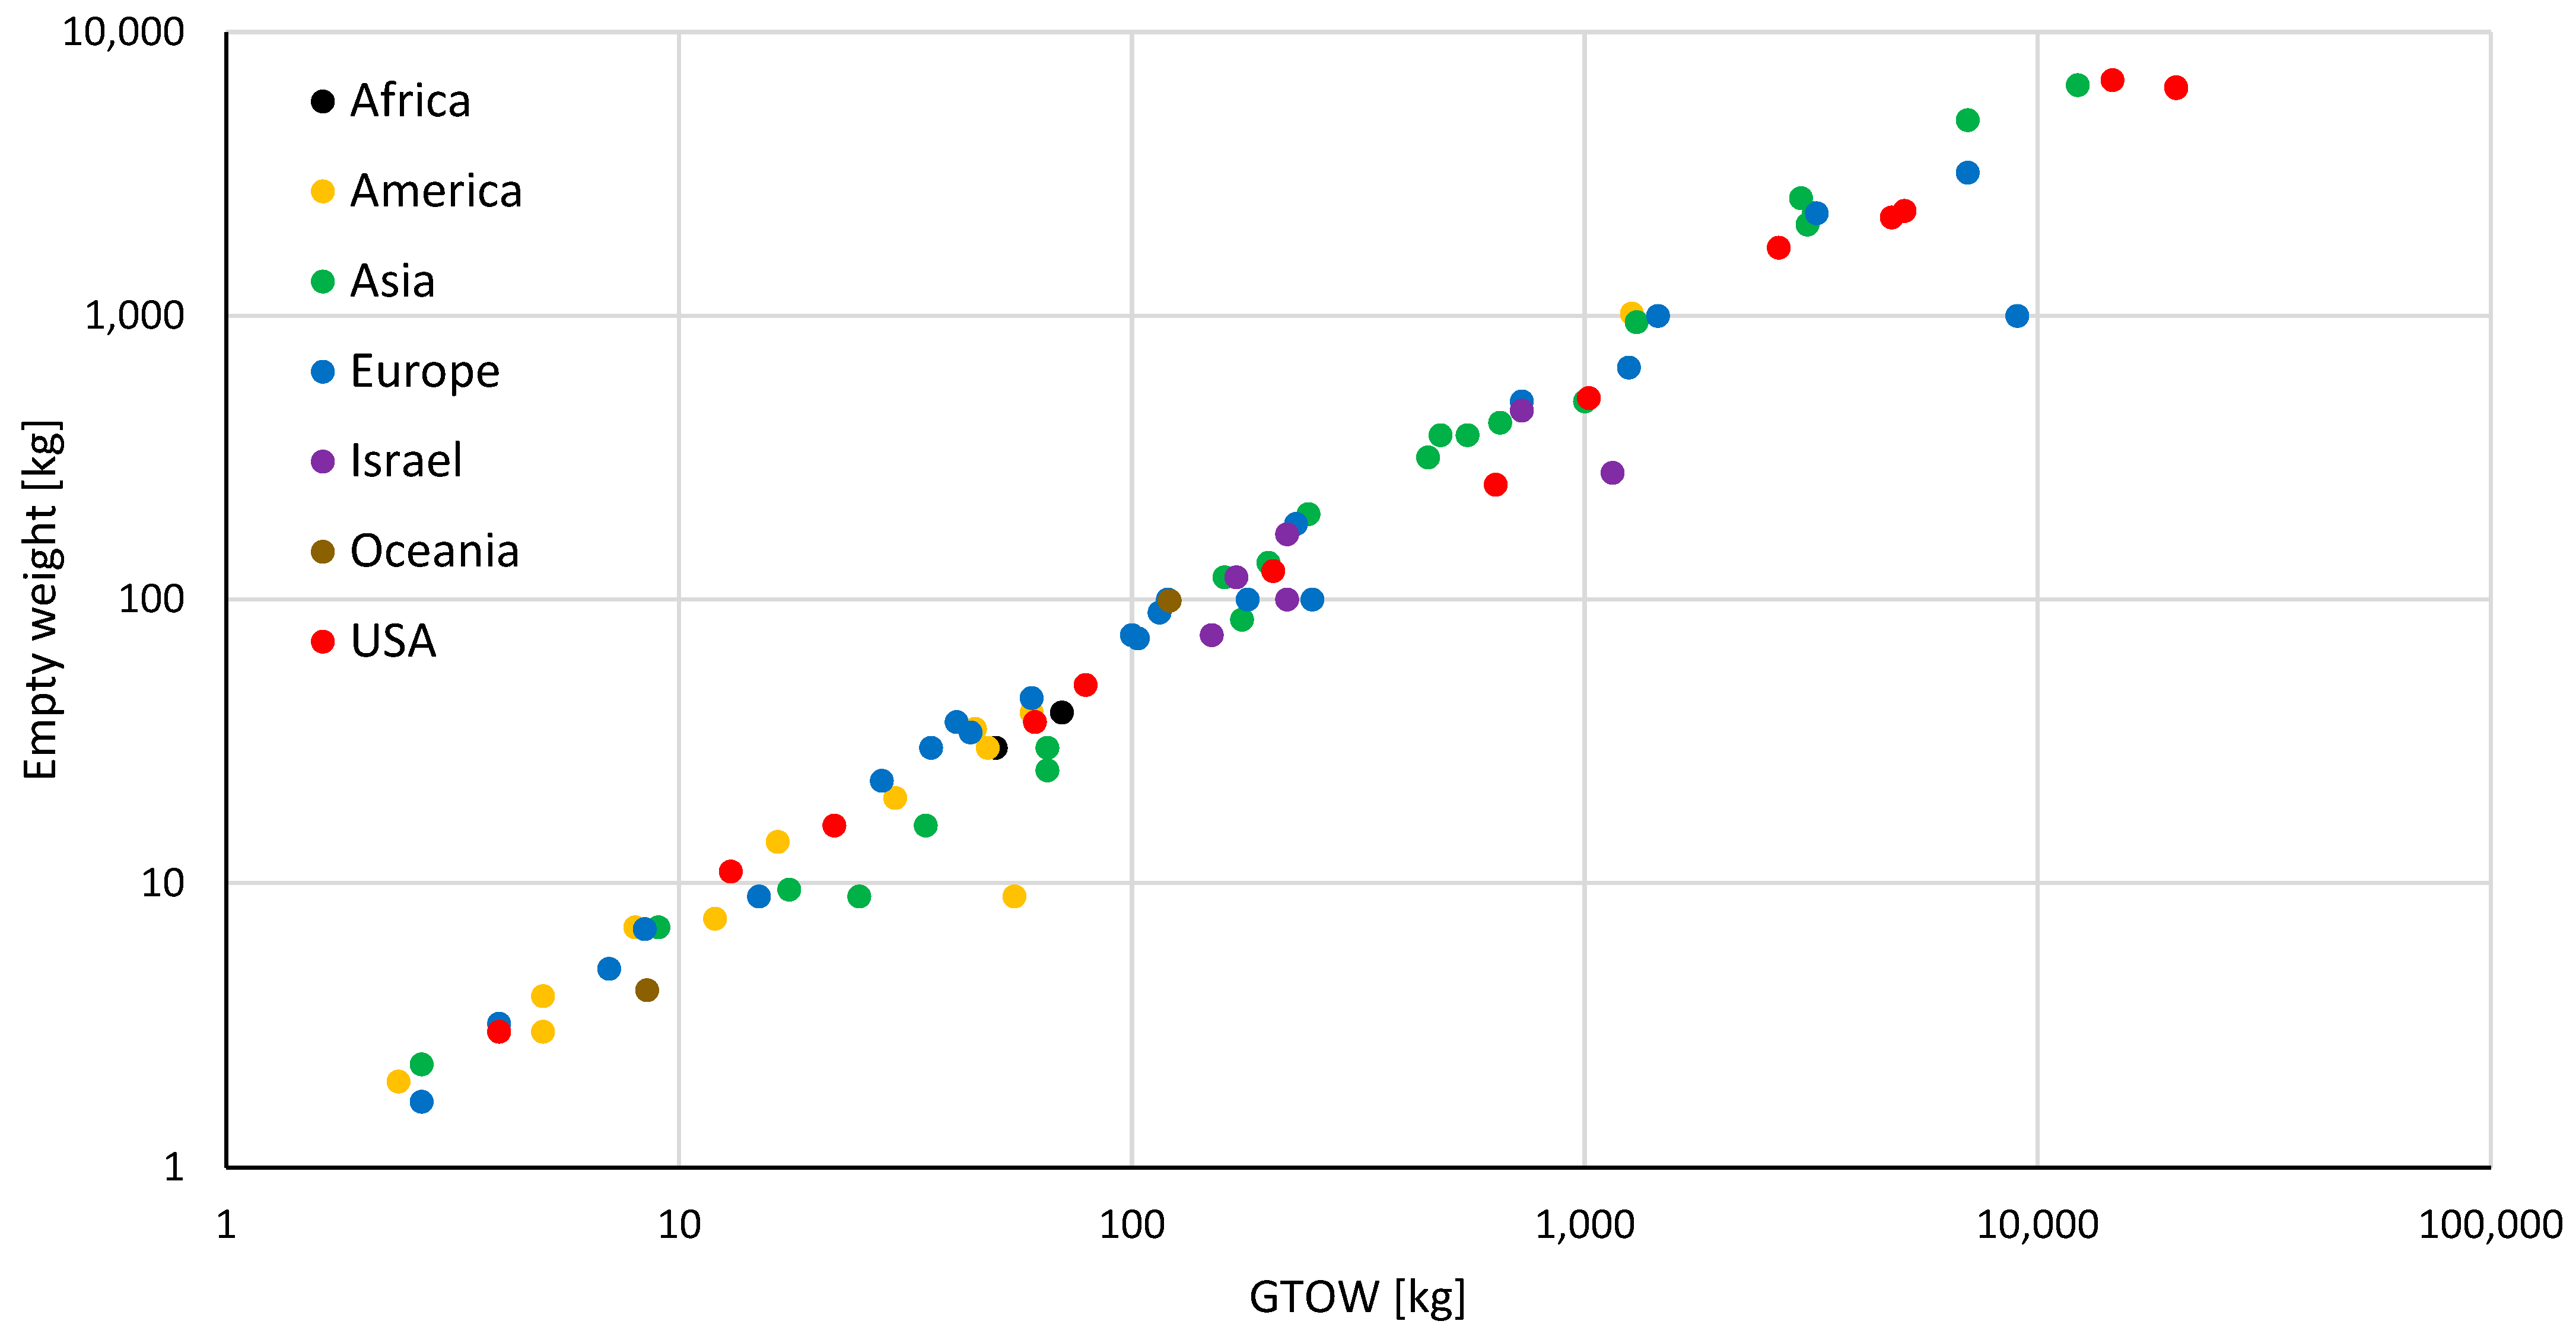
Figure 11 shows the data scatter for the empty weight parameter as a function of GTOW, and Figure 12 shows the same distribution with respect to NATO classification. Table 7 sums up the statistical data regarding the trend fitting for the empty weight as a function of GTOW plots. In this case, the level of confidence for the trendlines is higher, as no R2 is calculated below 0.75 for any NATO category. However, note that this chart shows the We and not the empty weight ratio (We/W0) employed by most design textbooks. Figure 13 shows the empty weight parameter against GTOW per region of origin. As is the case with Figure 11, no major deviations are observed from the main trend for any of the regions.
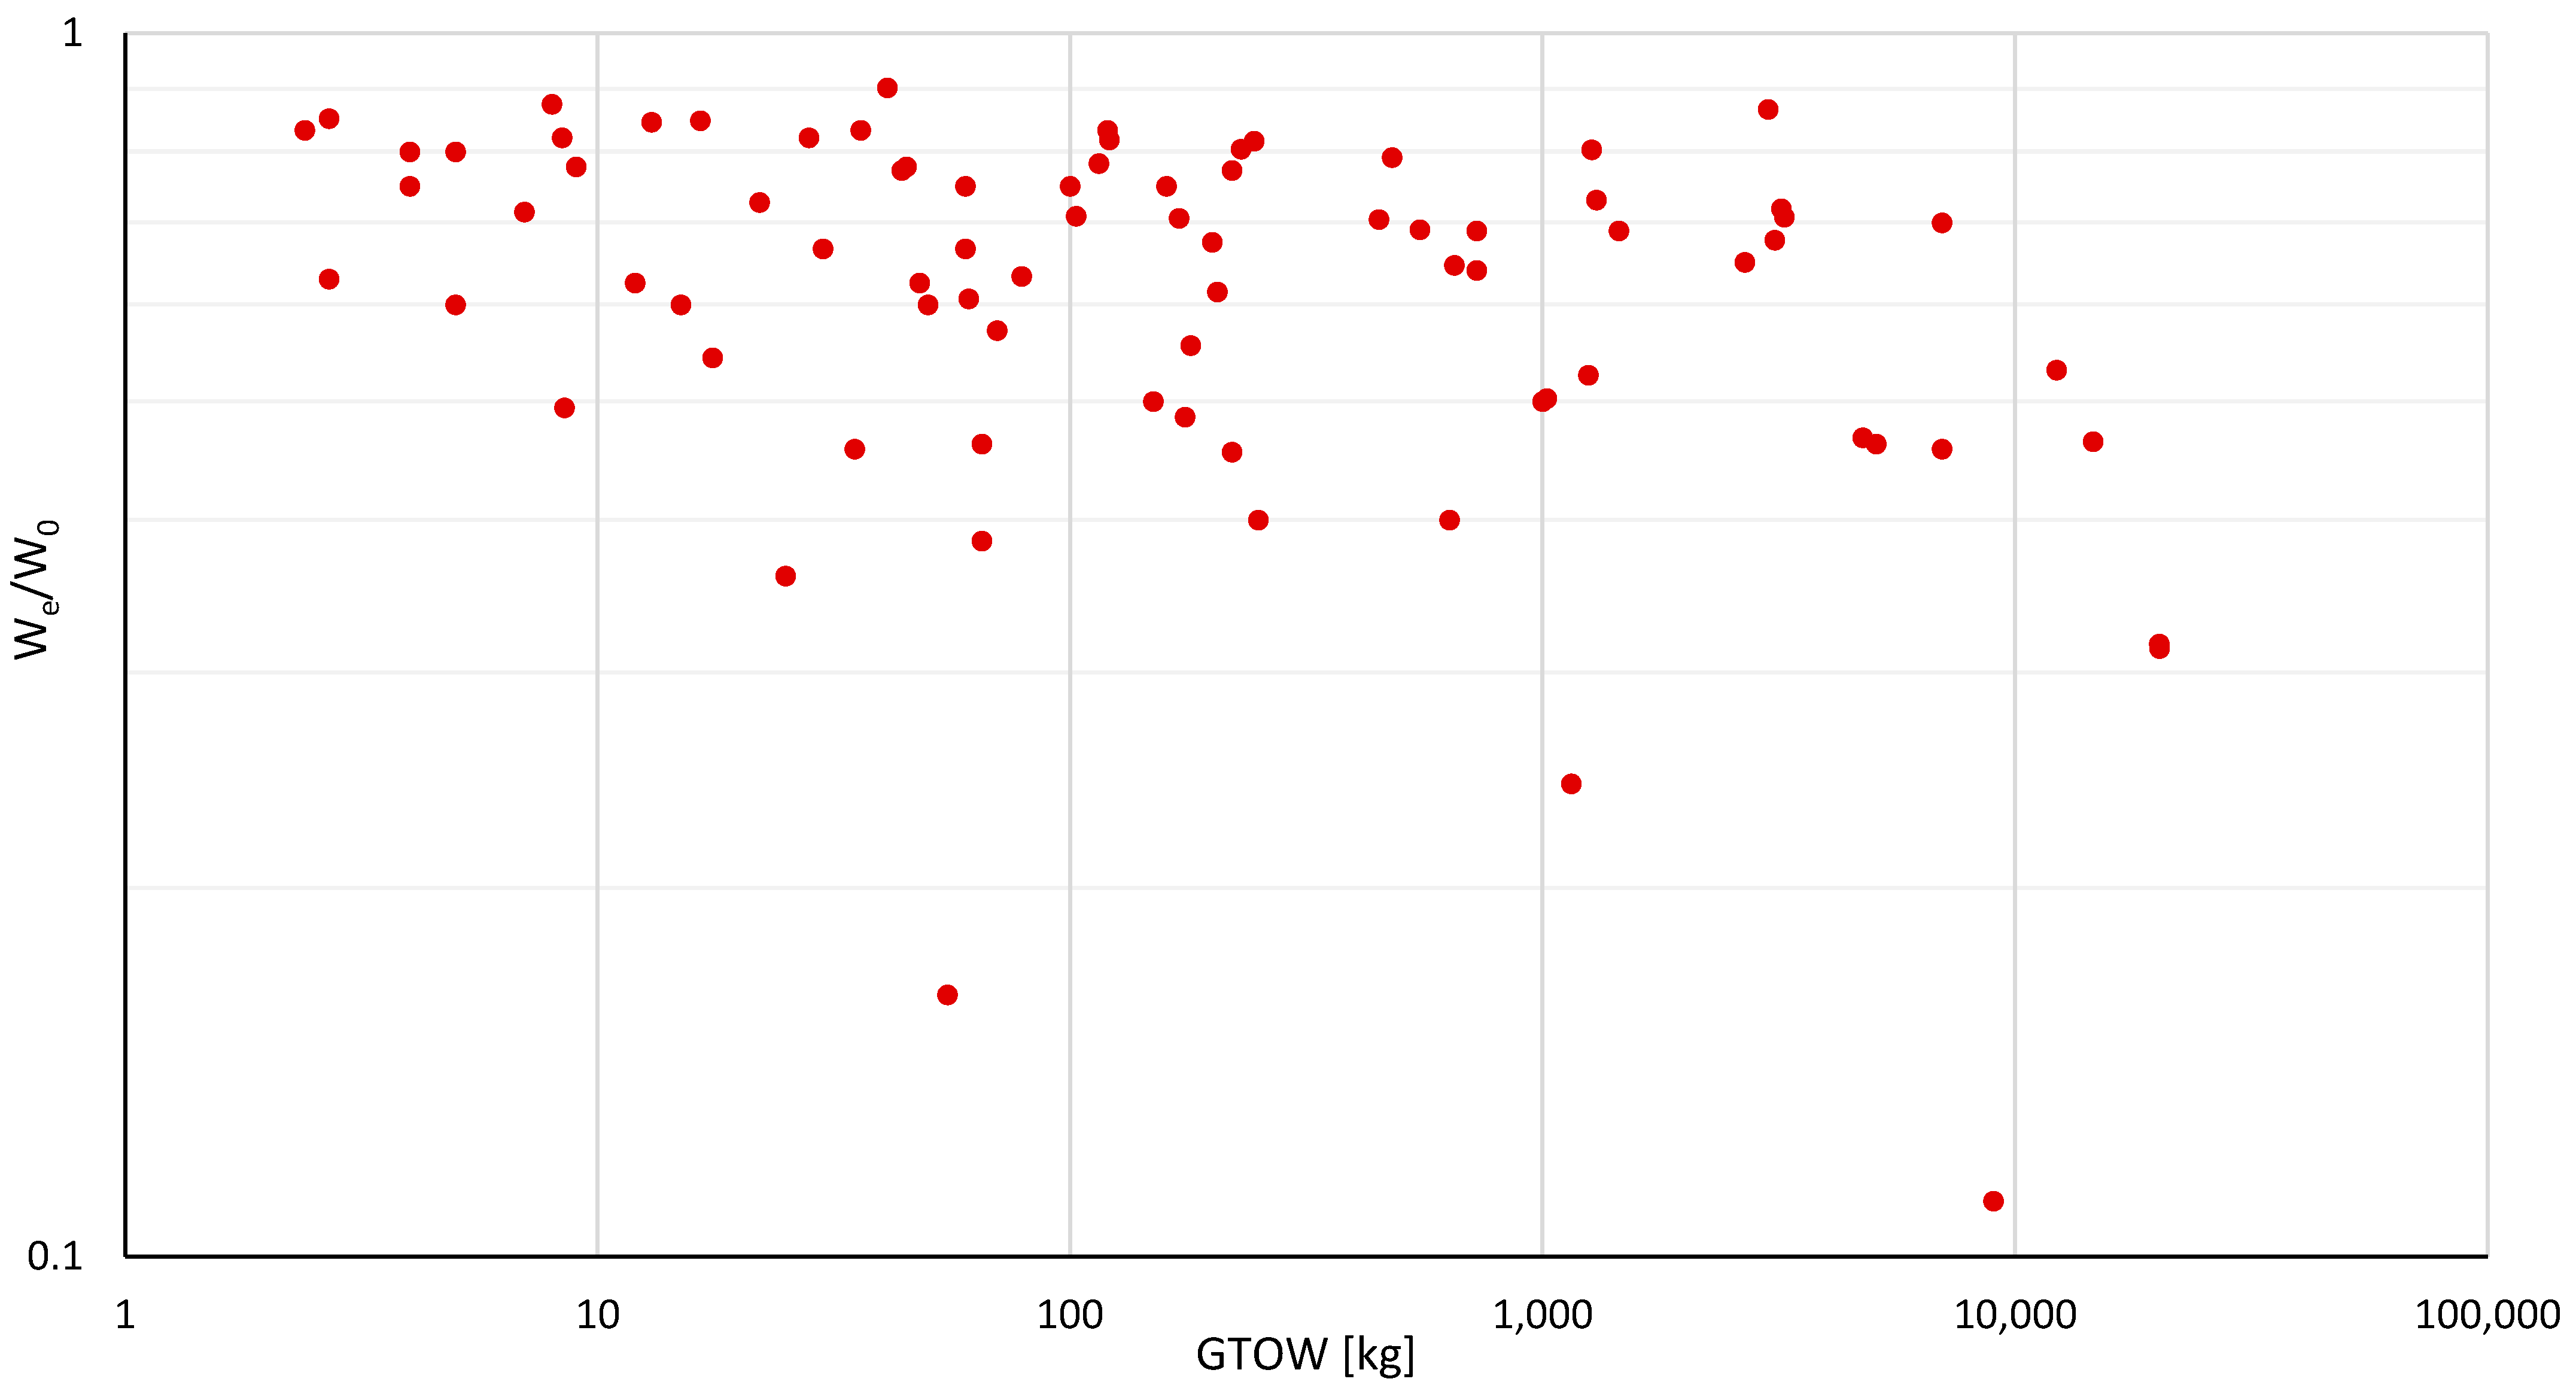
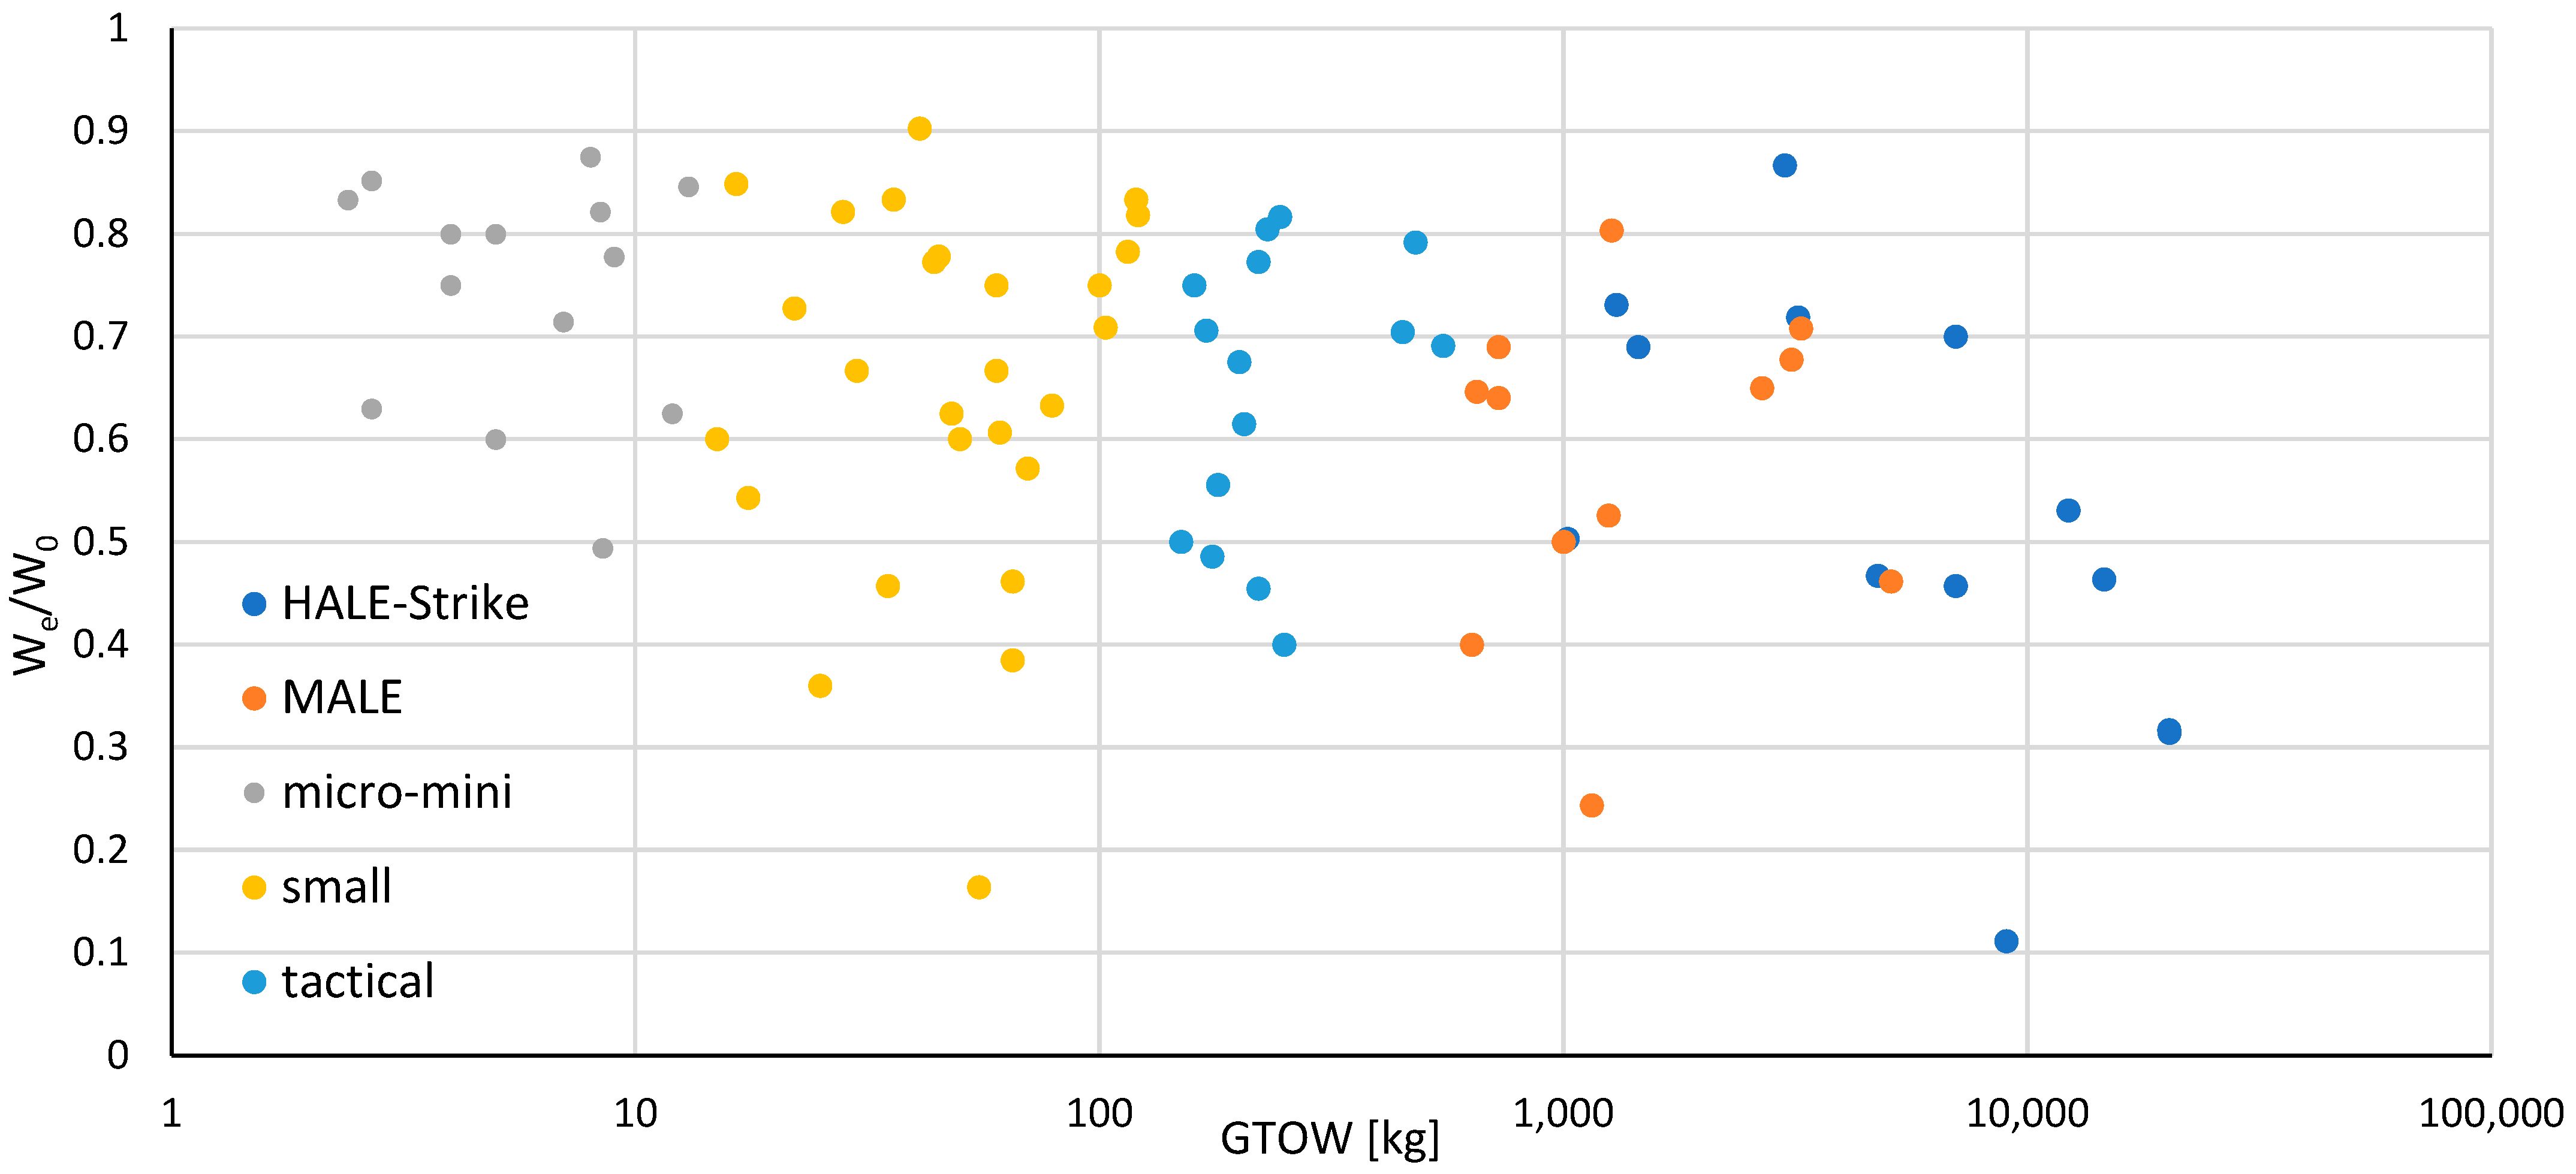
The next two figures (Figure 14 and Figure 15) are used to present the empty weight ratio as a function of GTOW, for the general category and NATO categorized UAVs, respectively.
Although no sufficient fit can be achieved for the We/W0 against W0 plots, the general trend is decreasing for heavier UAVs, following the overall philosophy presented in aircraft design textbooks for this particular ratio [19,20]. It must be noted, though, that every NATO category presents its own behavior and that UAV designers should consider each of them separately, depending on their respective design study. 
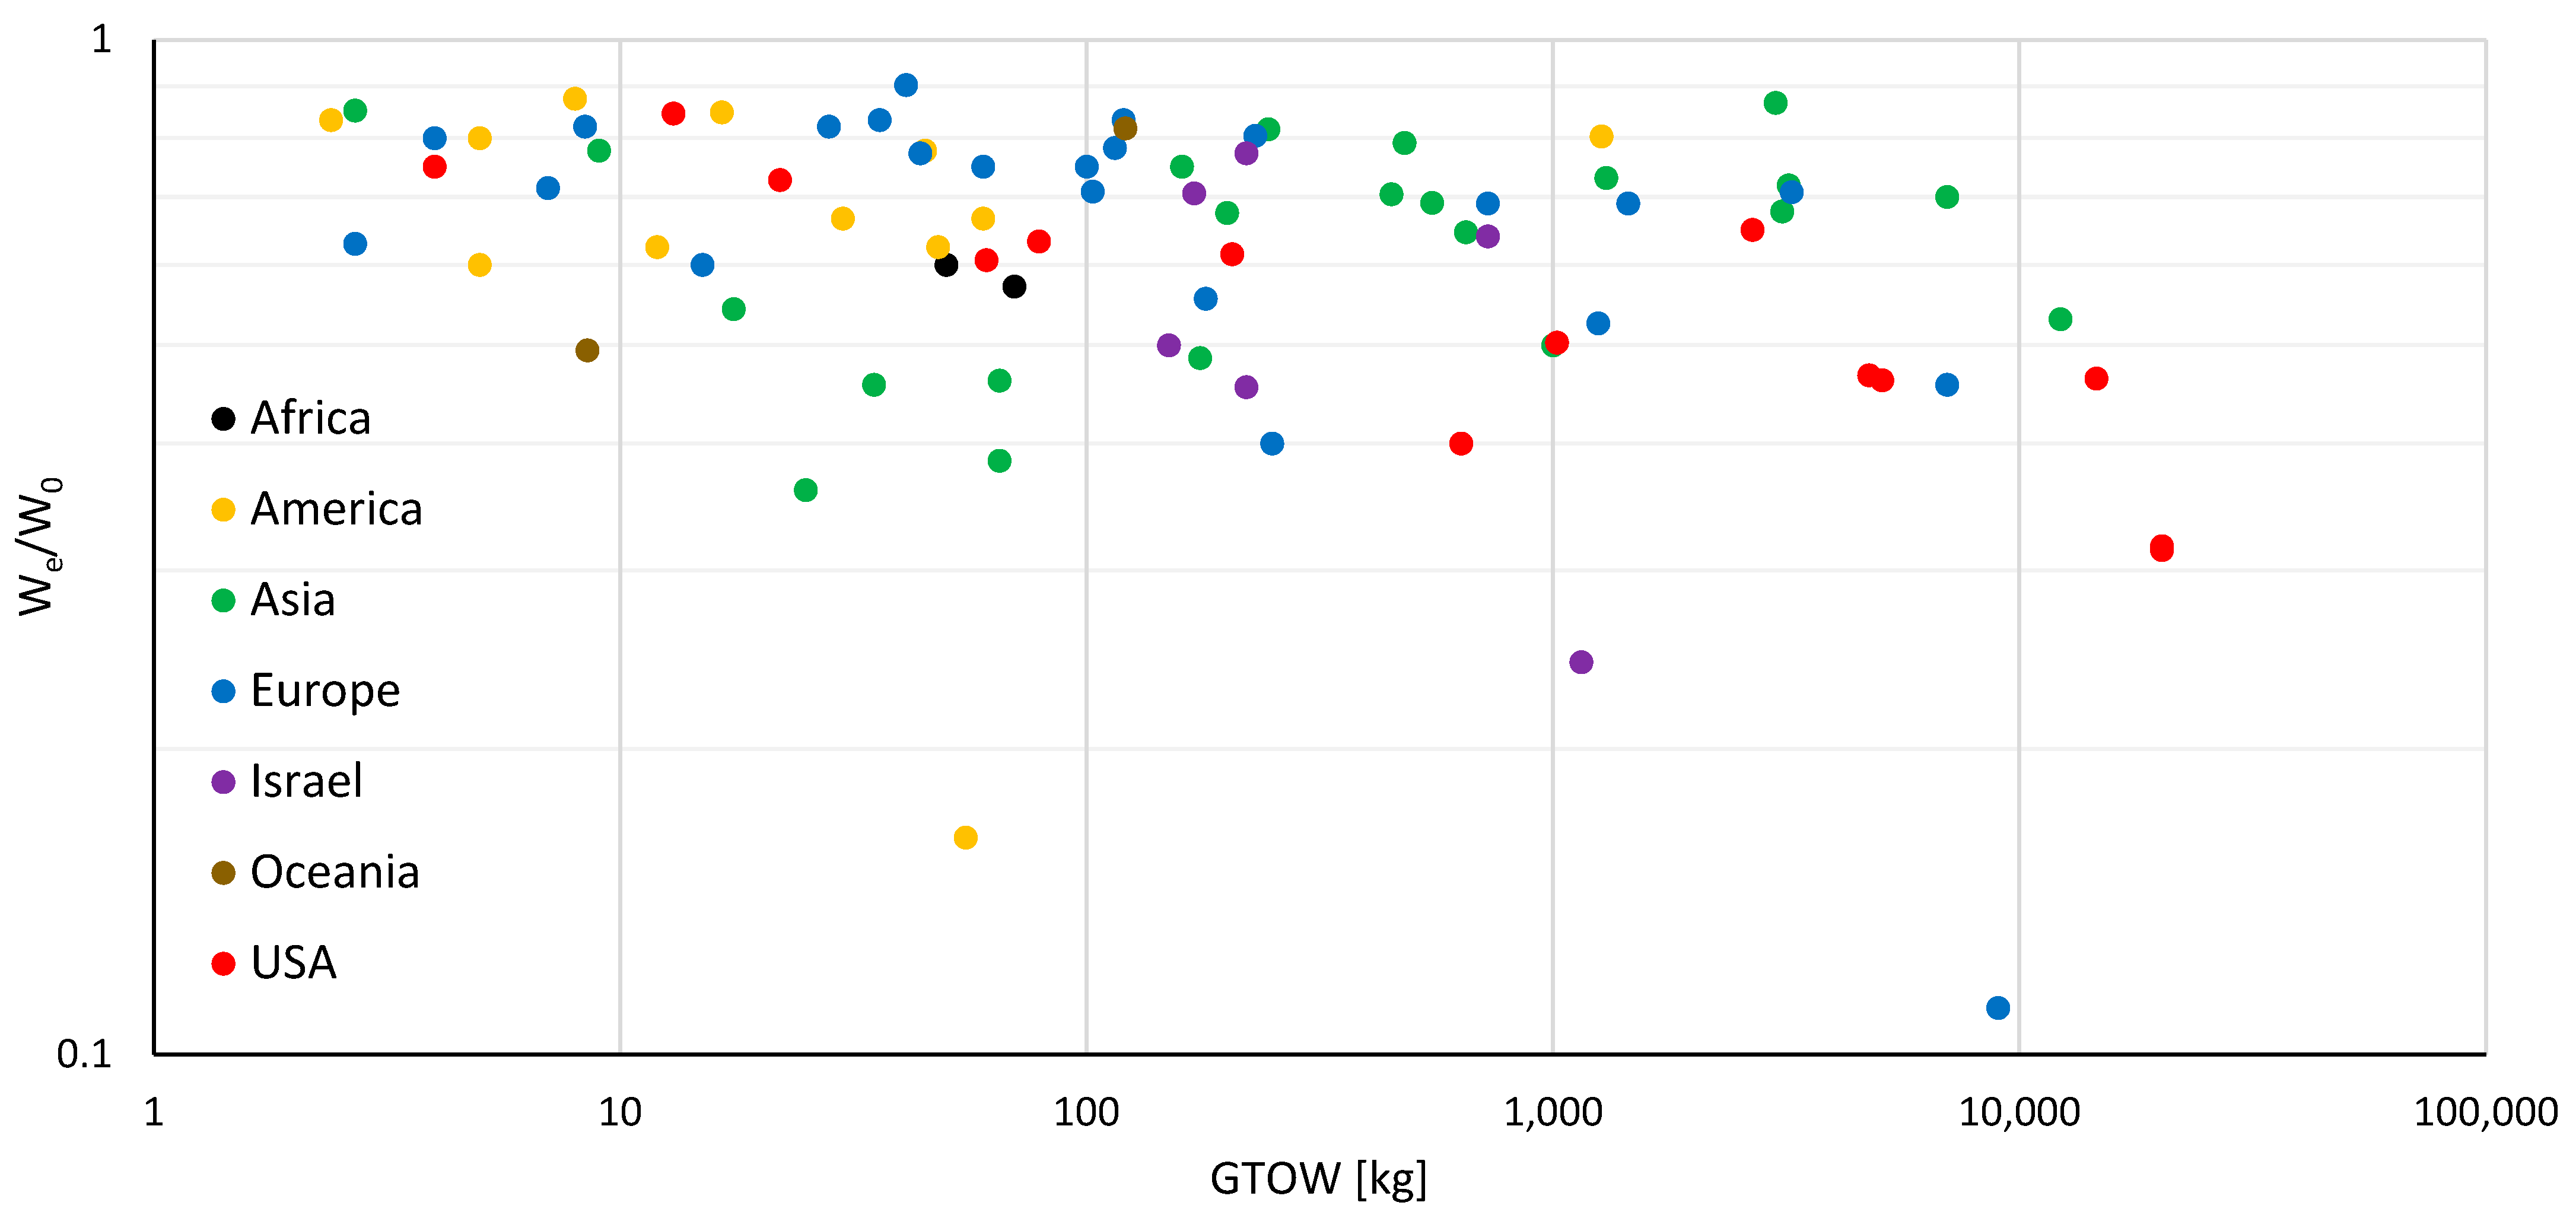
Figure 16 shows the data scatter for the ratio We/W0 against W0 with respect to region of origin. An interesting observation is that platforms that originate from the USA and Europe follow a quite similar trend, while platforms that originate from Israel feature a steeper trend. On the contrary, Asian UAVs feature an opposite behavior, i.e., where the empty weight ratio increases as the platforms get heavier.
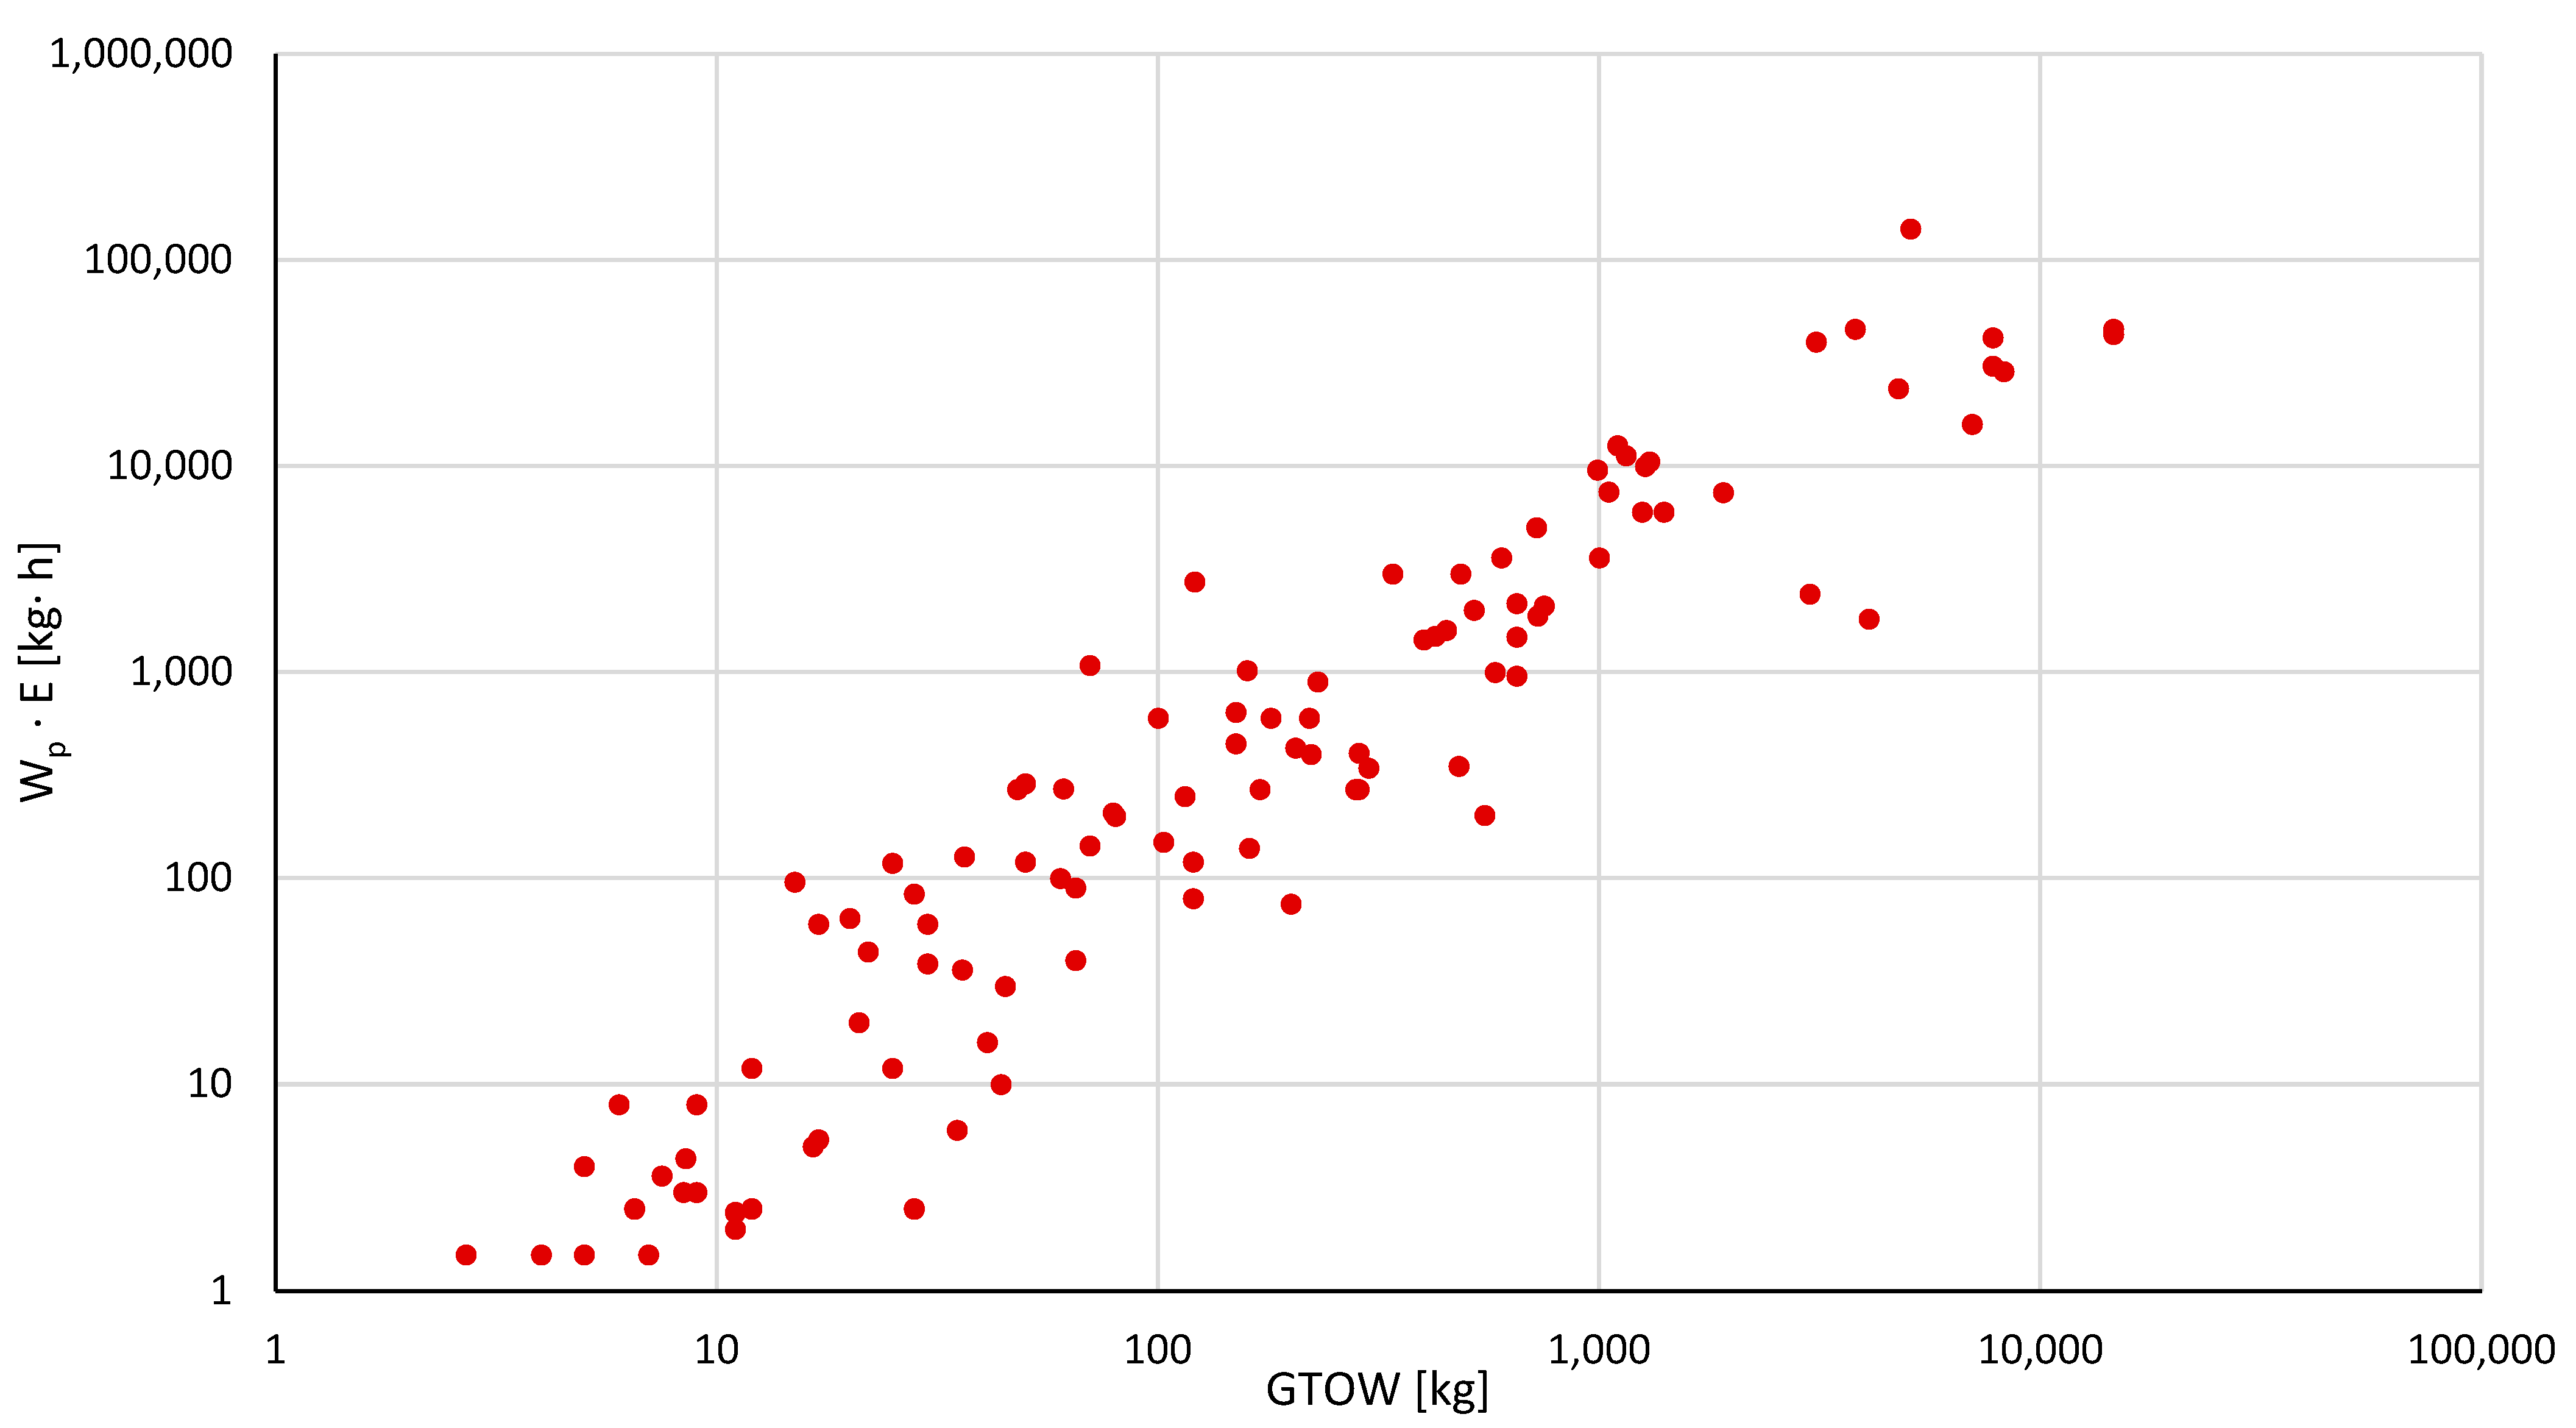
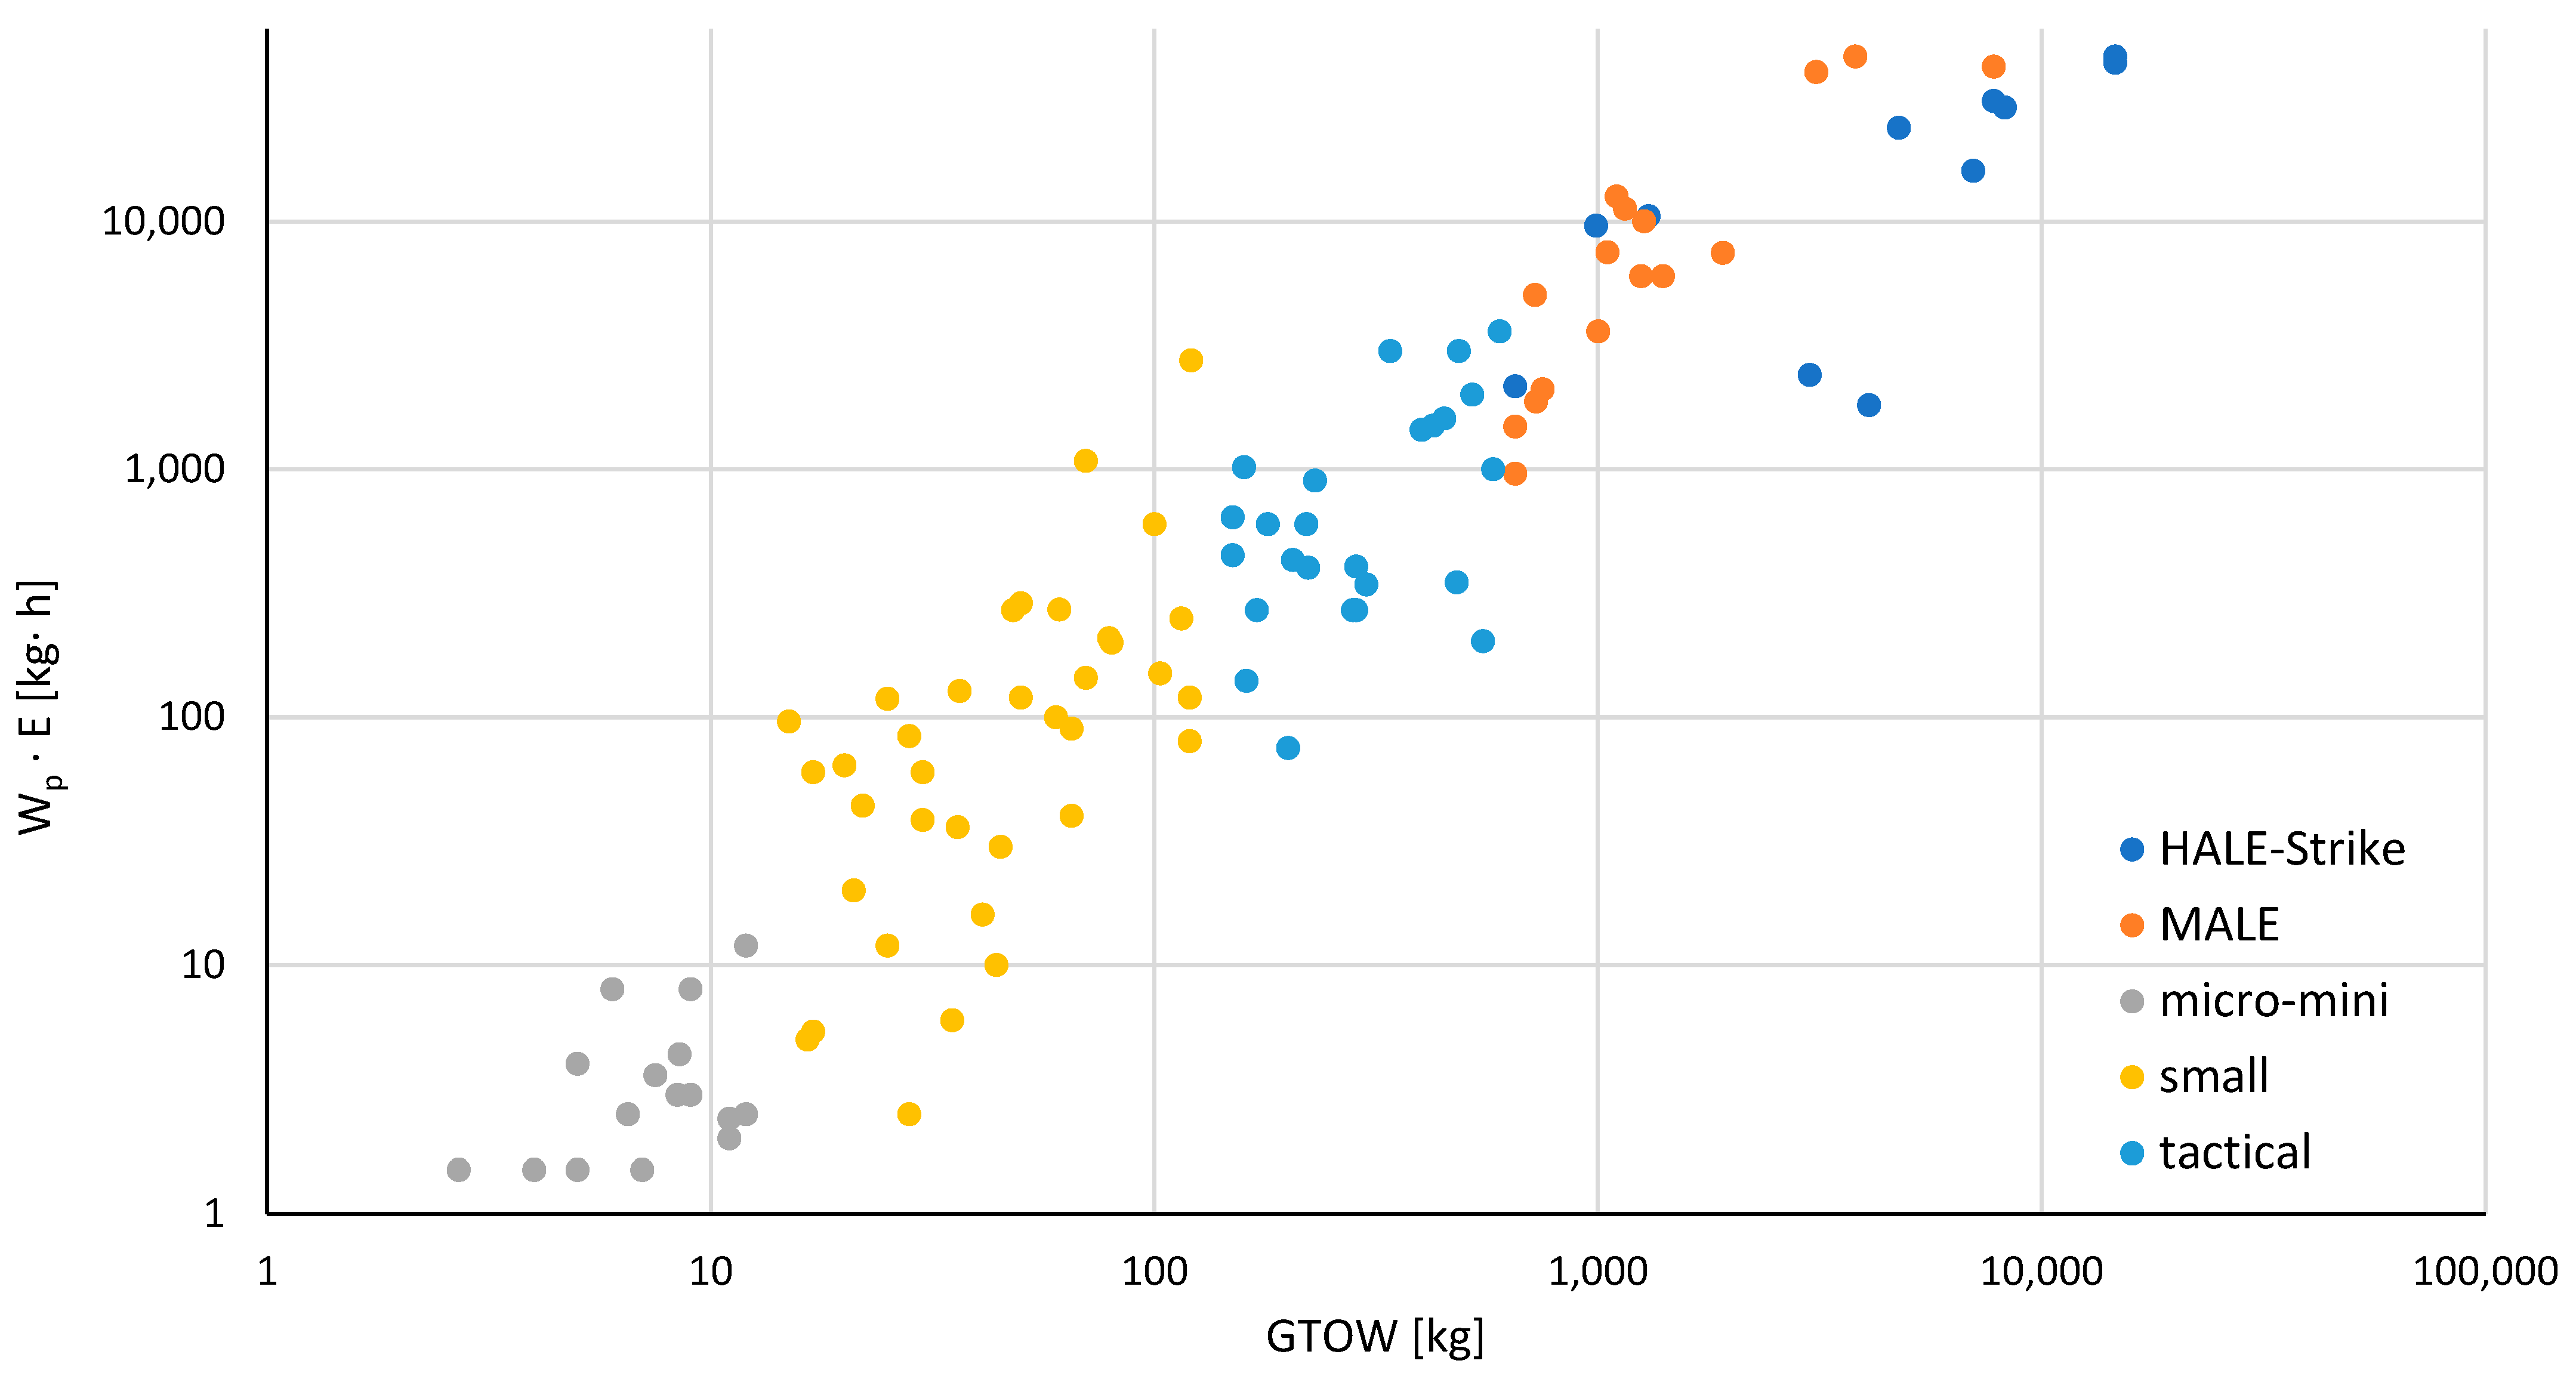
As discussed in the beginning of the section, for a given empty weight value, UAVs can potentially switch between larger payload capacity or fuel, i.e., flight time. To evaluate this potential, Figure 17 and Figure 18 show the product of payload weight times the given endurance as a function of GTOW, while Table 8 sums up the statistical data regarding the trend fitting.
In these plots, clear trendlines exist for the general sample as well as for larger categories of the NATO classification system. Once again, given the large dispersion of the categories that are smaller in weight, it should be noted that, apart from R2, the UAV designers should also take into consideration the range of the data, before evaluating a design against the suggested trendlines and finalizing their design choices during the conceptual design phase. 
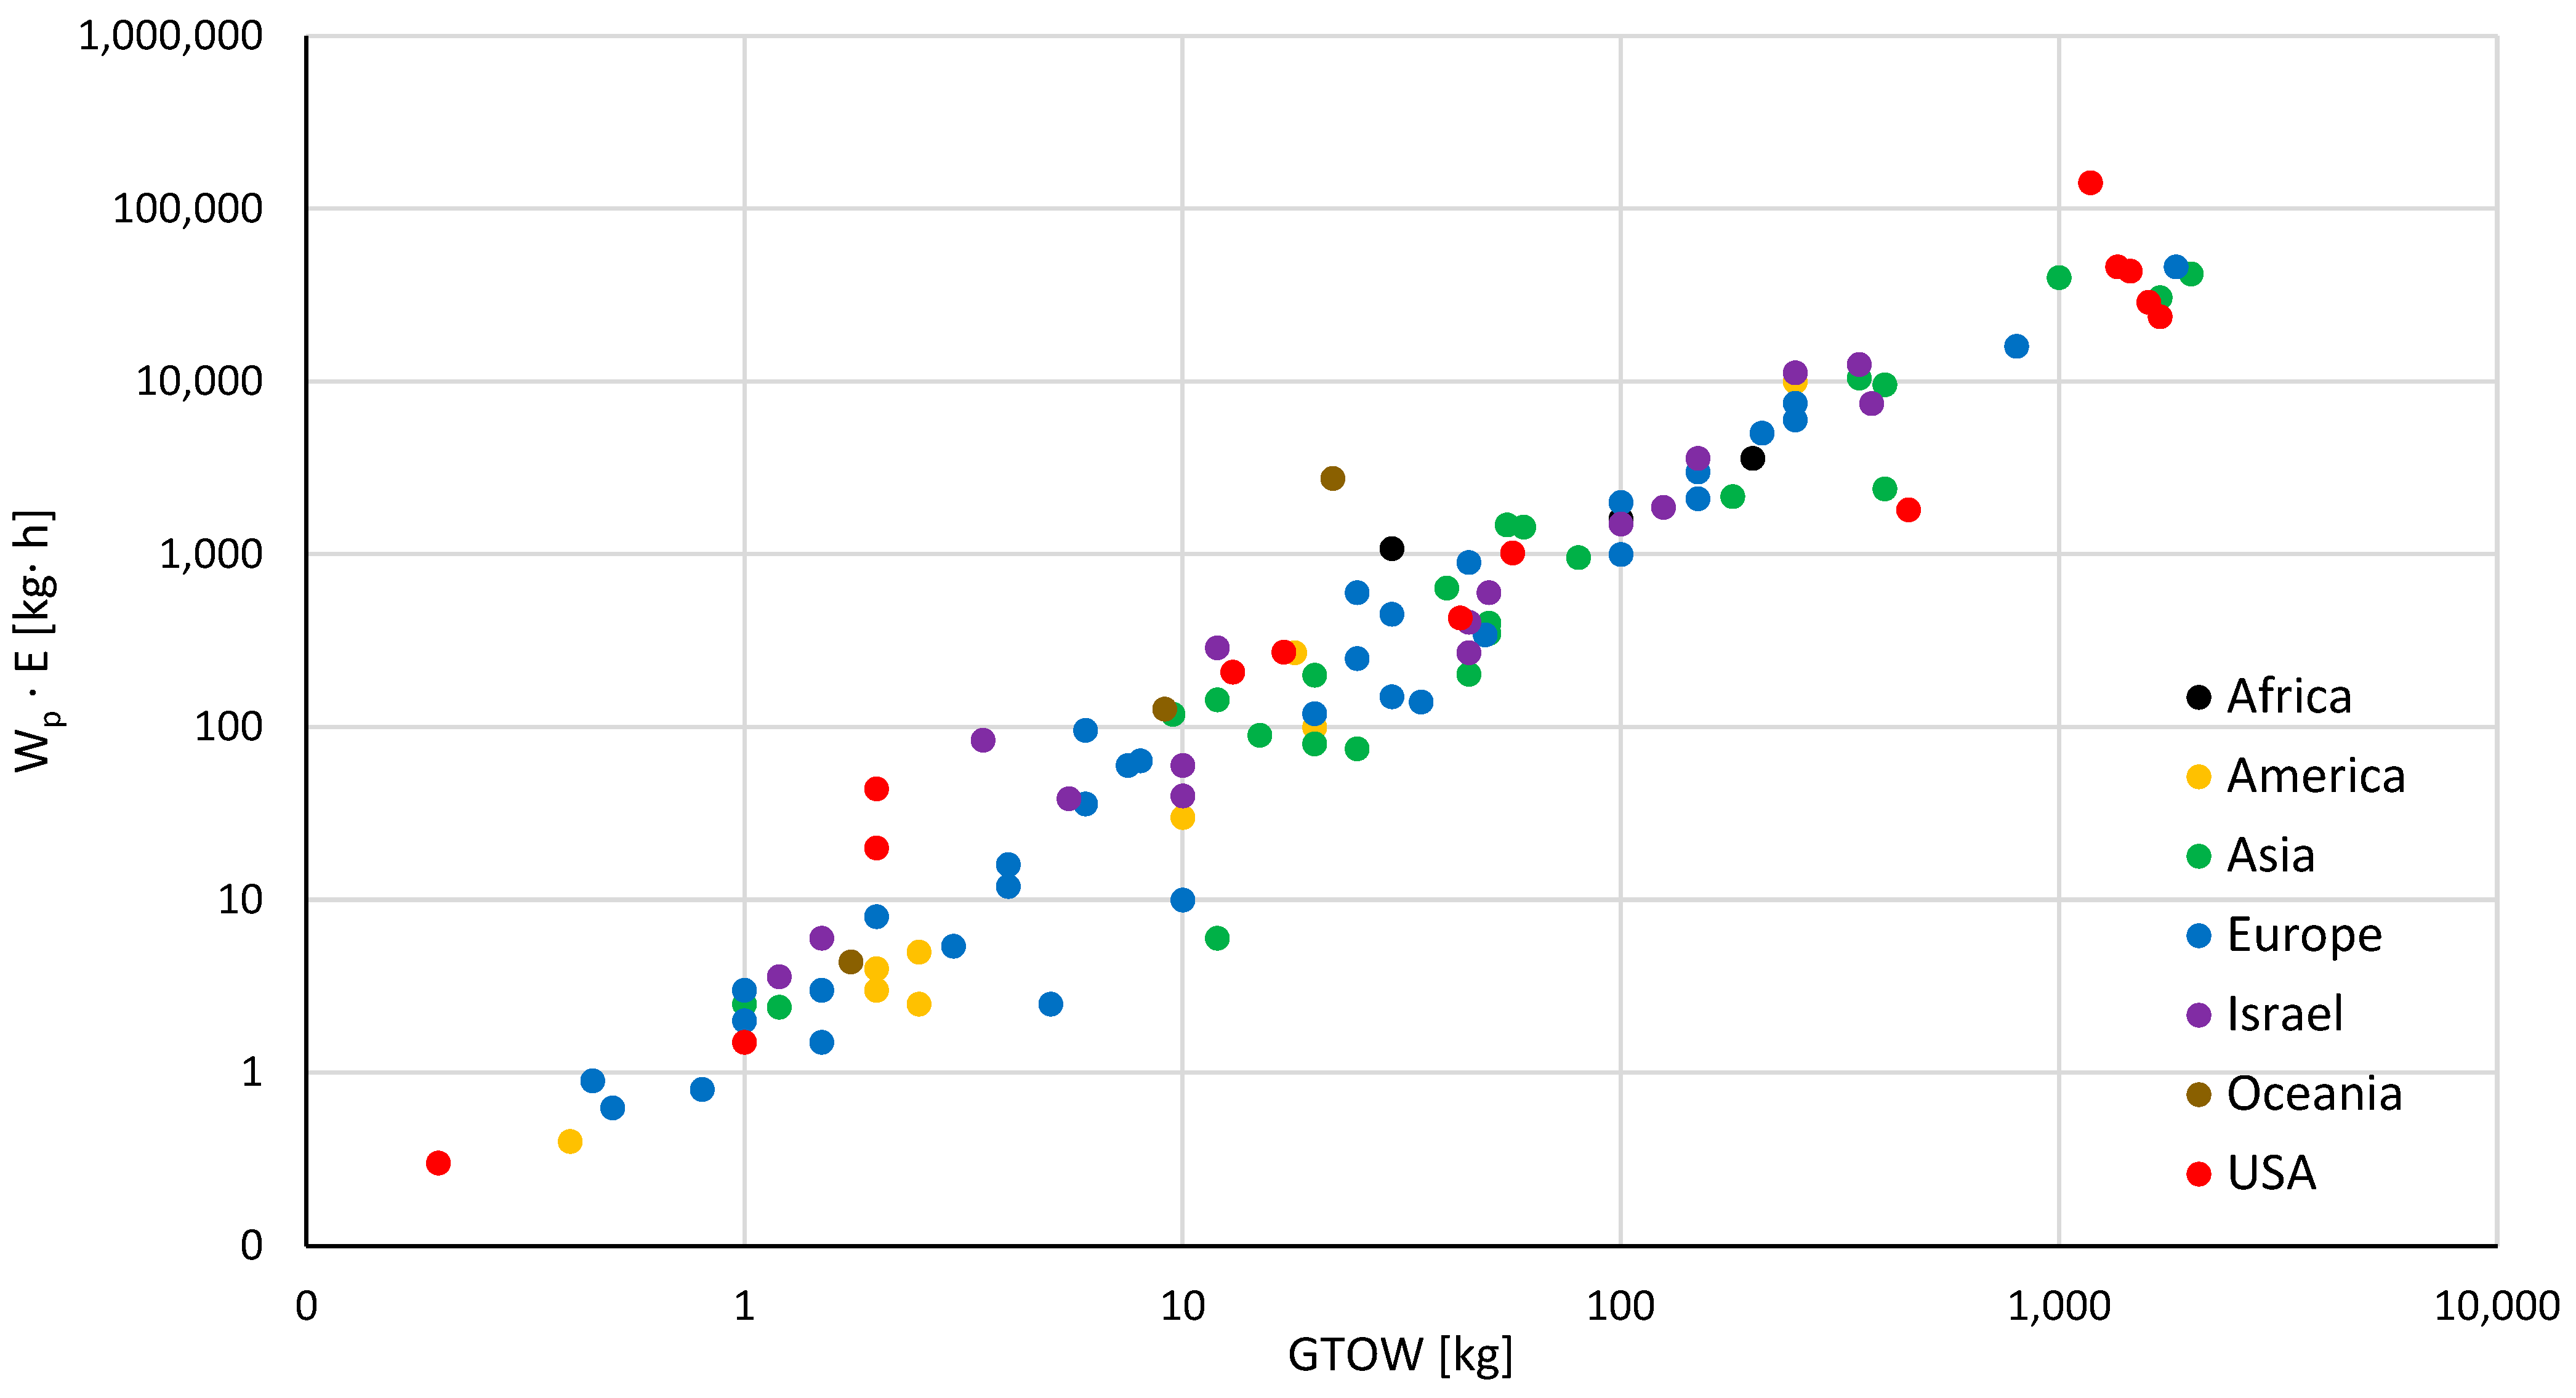
Figure 19 shows the product of payload weight times the given endurance as a function of GTOW per region of origin. It is observed that, in general, all regions follow the same trendline. USA, Israel and Europe span the entire range of the chart, from the lowest to the highest values of GTOW, indicating market presence in all NATO categories. The American continent has a strong presence in the region of lower GTOW and, consequently lower Wp · E products, while Asia focuses on higher GTOW. This can possibly indicate either a design philosophy or a marketing approach.
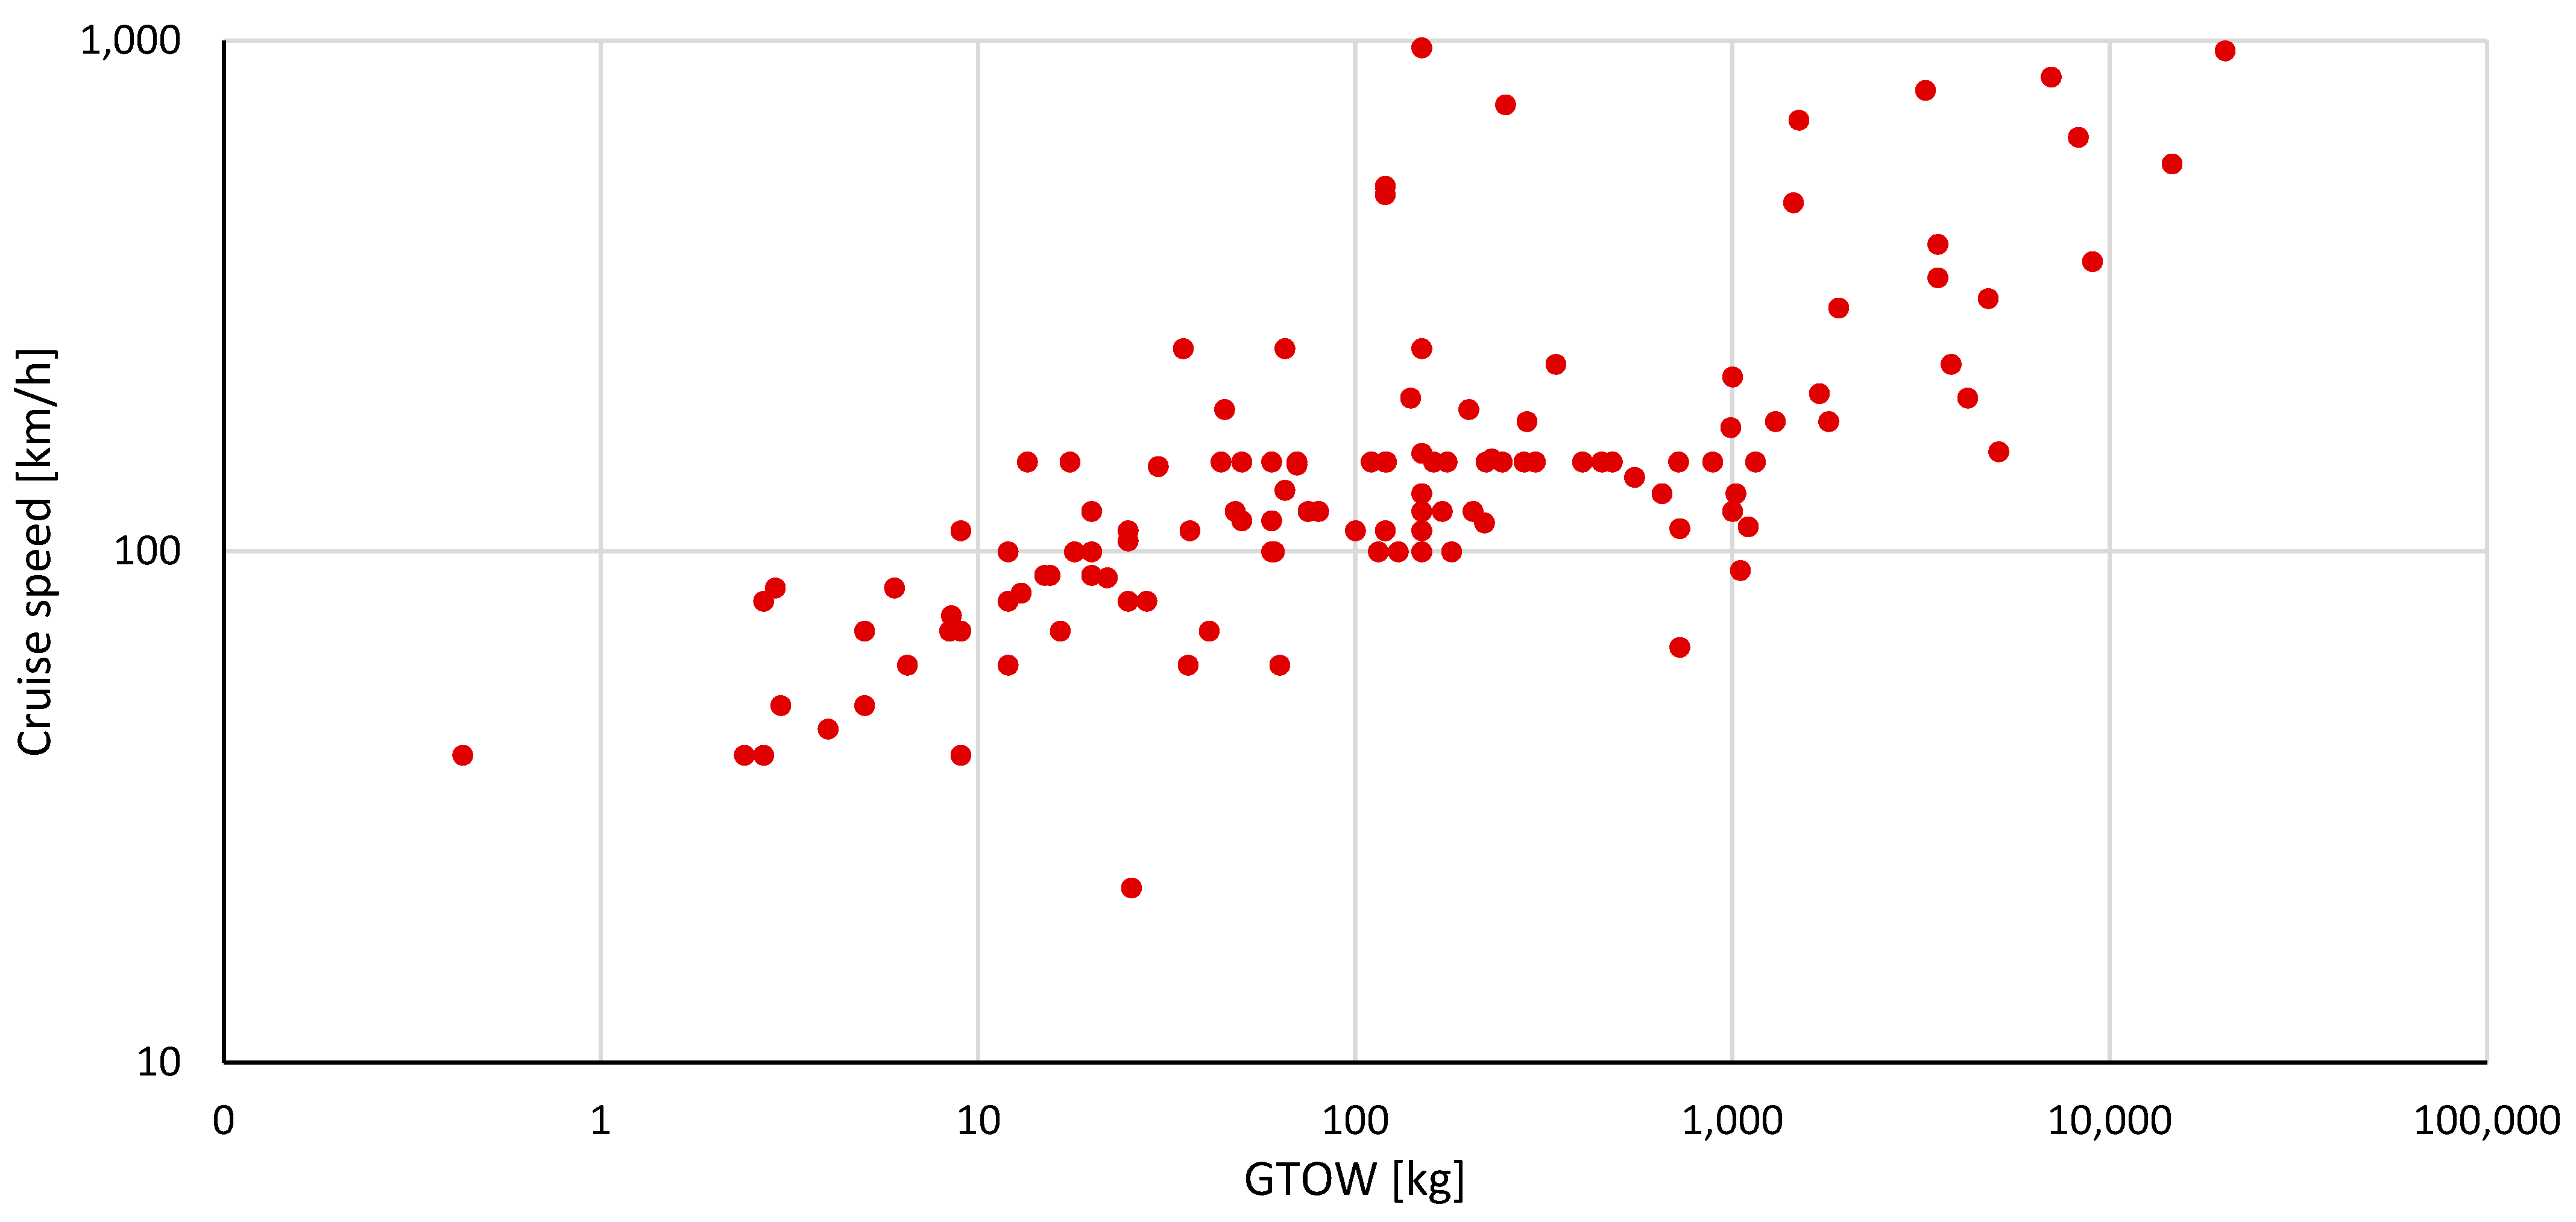
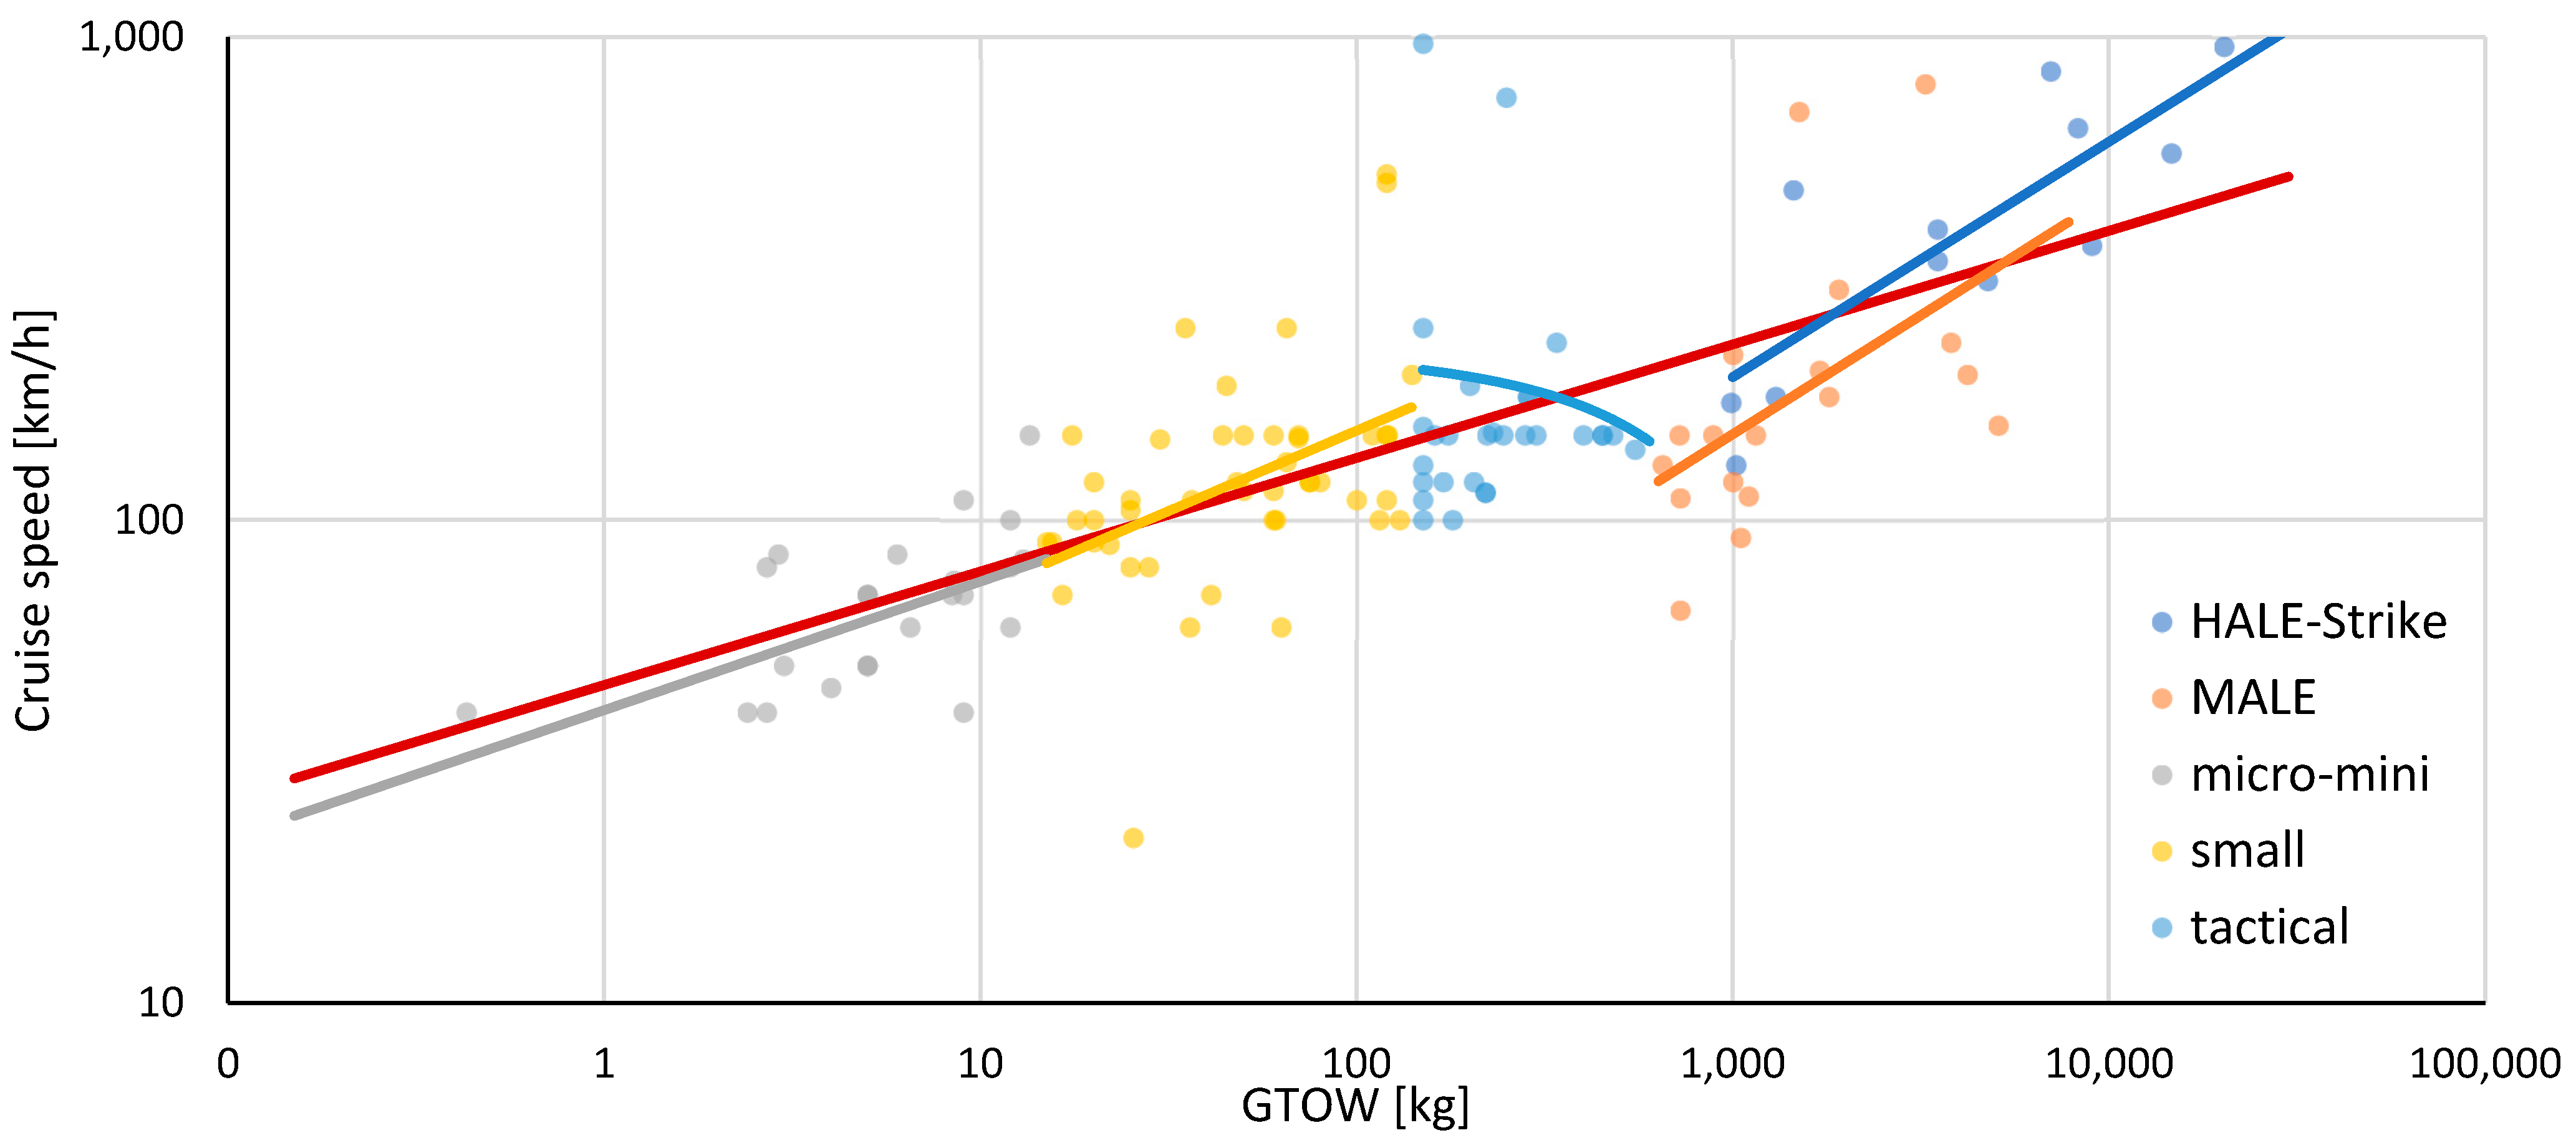
Figure 20 and Figure 21 present the cruise speed parameter as a function of GTOW, while Table 9 sums up the corresponding statistical results.
The cruise speed parameter is a typical example where the categories deviate significantly from the general trendline. It is apparent that the analyzed UAV sample depicts a large dispersion that can be explained based on that the cruise speed is dependent both on the airframe, as well as on the sensors and mission. 
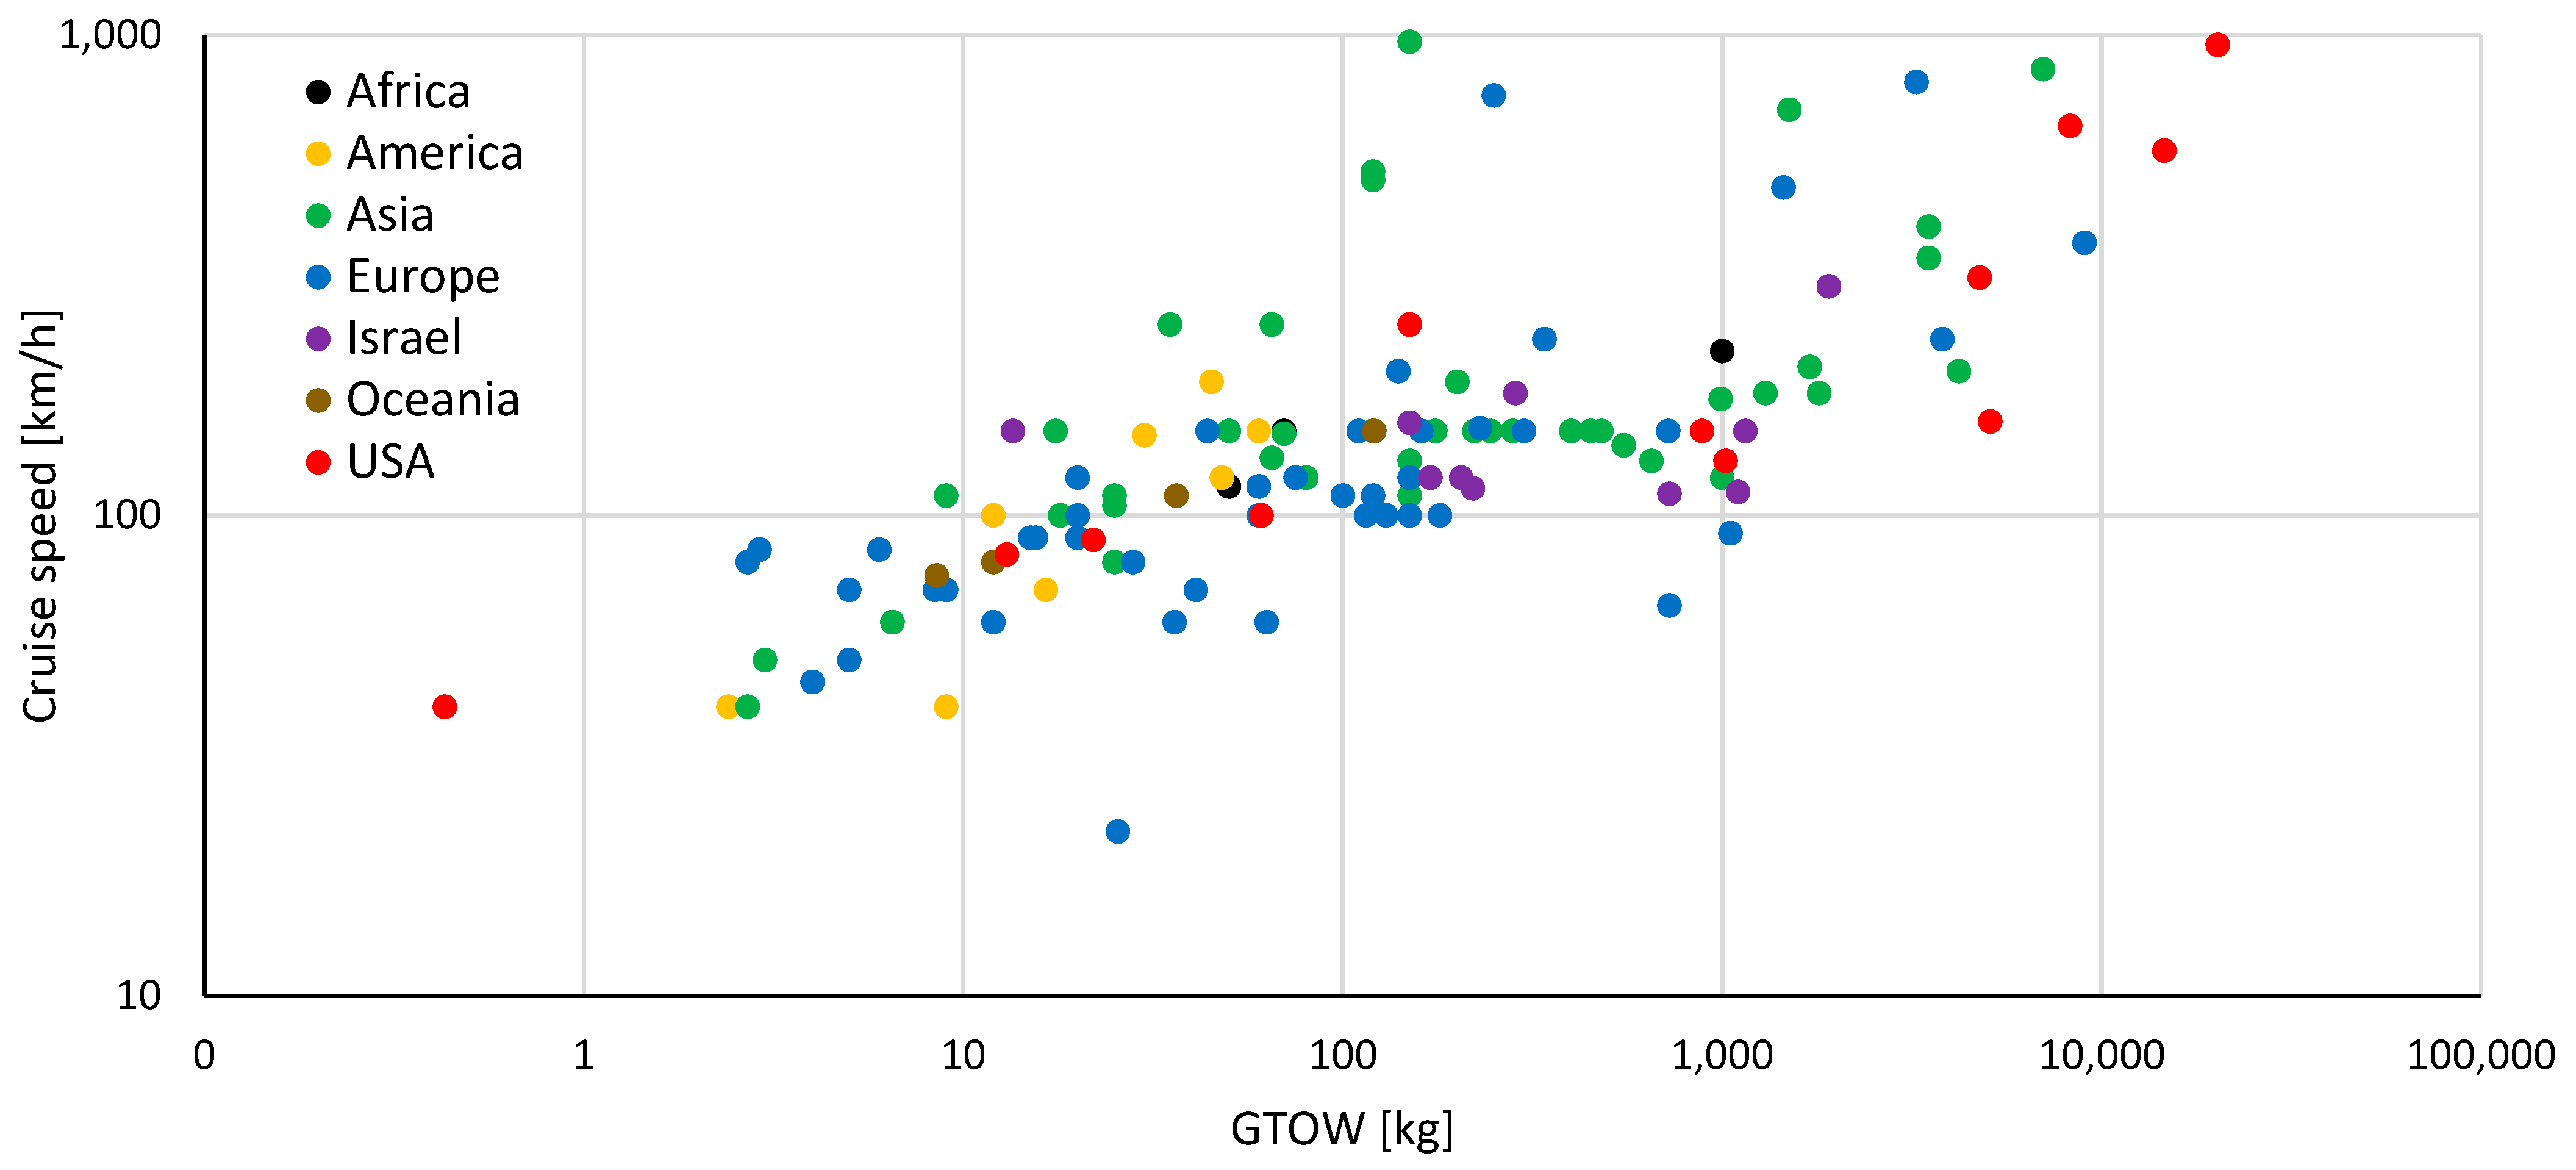
Figure 22 depicts the same parameters with respect to region of origin. UAVs developed in Israel appear to have a common approach, featuring cruise speeds between 100 km/h and 200 km/h from a GTOW range between 10 kg and 1000 kg. UAVs developed in Europe and Asia, on the other hand, feature a large dispersion above 100 kg. Several Asian platforms, in particular, have a documented cruise speed that exceeds 800 km/h, indicating that they have been designed to operate in compressible flow conditions, at least based on their documentation. The USA and the rest of the American continent feature well-established trendlines, with the platforms marked in yellow concentrated again at the lower right corner of the data.

3.2. Results per EIS

In the current section, the UAVs are grouped in regard to their EIS in four major periods. The first one corresponds to the early UAV designs, i.e., the few platforms that were in service before 1995. The 1995–2005 and 2005–2015 periods contain the majority of UAVs and, as such, can be used to generate safer conclusions. The last period corresponds to the last decade of UAV design and, even though some operational examples exist, the data in the literature are considerably fewer when compared to the previous two periods. Indicatively, 12, 31 and 79 UAV models belong in the first, second and third periods, respectively, whereas only 16 are available for the fourth period (Appendix A). As also discussed in the introduction, the models considered in this section are 138, since the EIS dates are not available for the rest 64.
It must be noted at this point that, especially concerning the last decade, the authors have limited access to fixed-wing UAV data. This is possibly attributed to the fact that, since many of the new UAV projects are still under development, their information released to the general public is limited for safety reasons. However, the scientific approach and analysis methods suggested in this work can potentially be applied to any UAV database, e.g., in a few years’ time when more data will be available. For the time being, it was decided to omit the last period altogether, so as not to generate inaccurate conclusions concerning the trends of the examined parameters.
Six box plots (Figure 23, Figure 24, Figure 25, Figure 26, Figure 27 and Figure 28) are used to present the progression of key technical parameters through the years, per NATO category. Note that, in some of these plots, the logarithm of the corresponding parameter is presented so that the results enhance the datagrams visualization and comprehensibility.
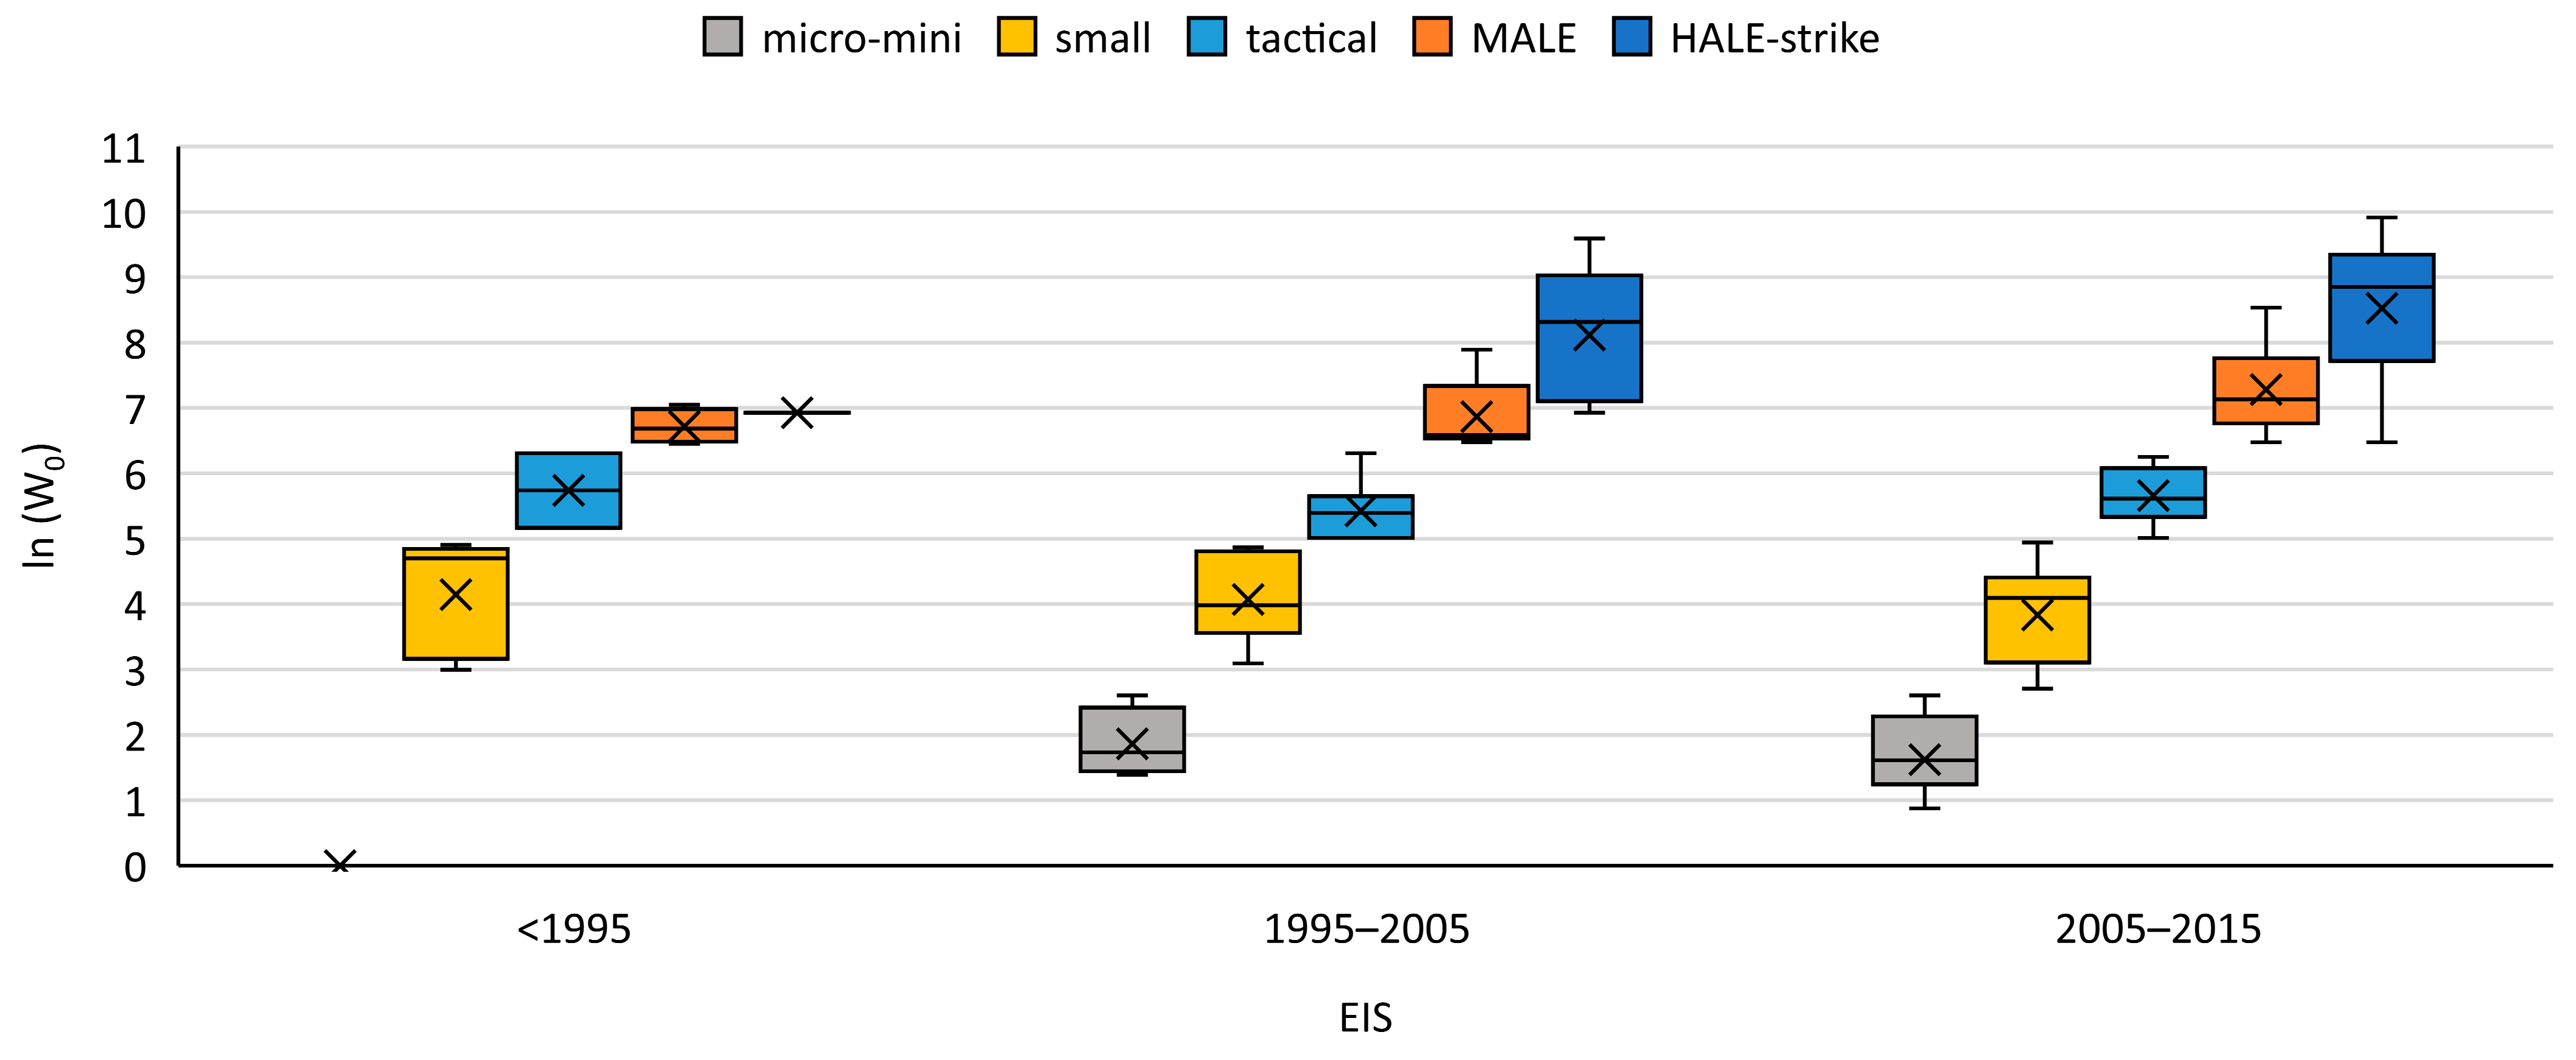
Figure 23 shows the GTOW progression for the five NATO categories. In terms of GTOW, the small, tactical and MALE categories have a constant presence throughout the years. However, in the last of the examined decades, these three categories tend to deviate from one another and the boundaries between the three become clearer, at least in terms of GTOW. The micro-mini and HALE categories did not exist before 1995, indicating technology was not mature enough. In the last two decades, there has been a large expansion of the design space in terms of GTOW, with the HALE mean increasing by 50.4% and the micro-mini decreasing by 21%. The whiskers in the last examined decade have a larger dispersion, especially for the MALE and HALE categories, indicating an expansion of the design space regarding these categories. It is evident that there is a potential overlap between NATO categories, particularly in Class III, as discussed in Section 2.2.1. Therefore, it is important to consider the flight altitude as well, to accurately determine the appropriate NATO category for a given UAV. This is because some UAVs with greater service ceilings (HALE) may not necessarily be heavier than their MALE counterparts. The reader is advised to take this into account when analyzing the data.
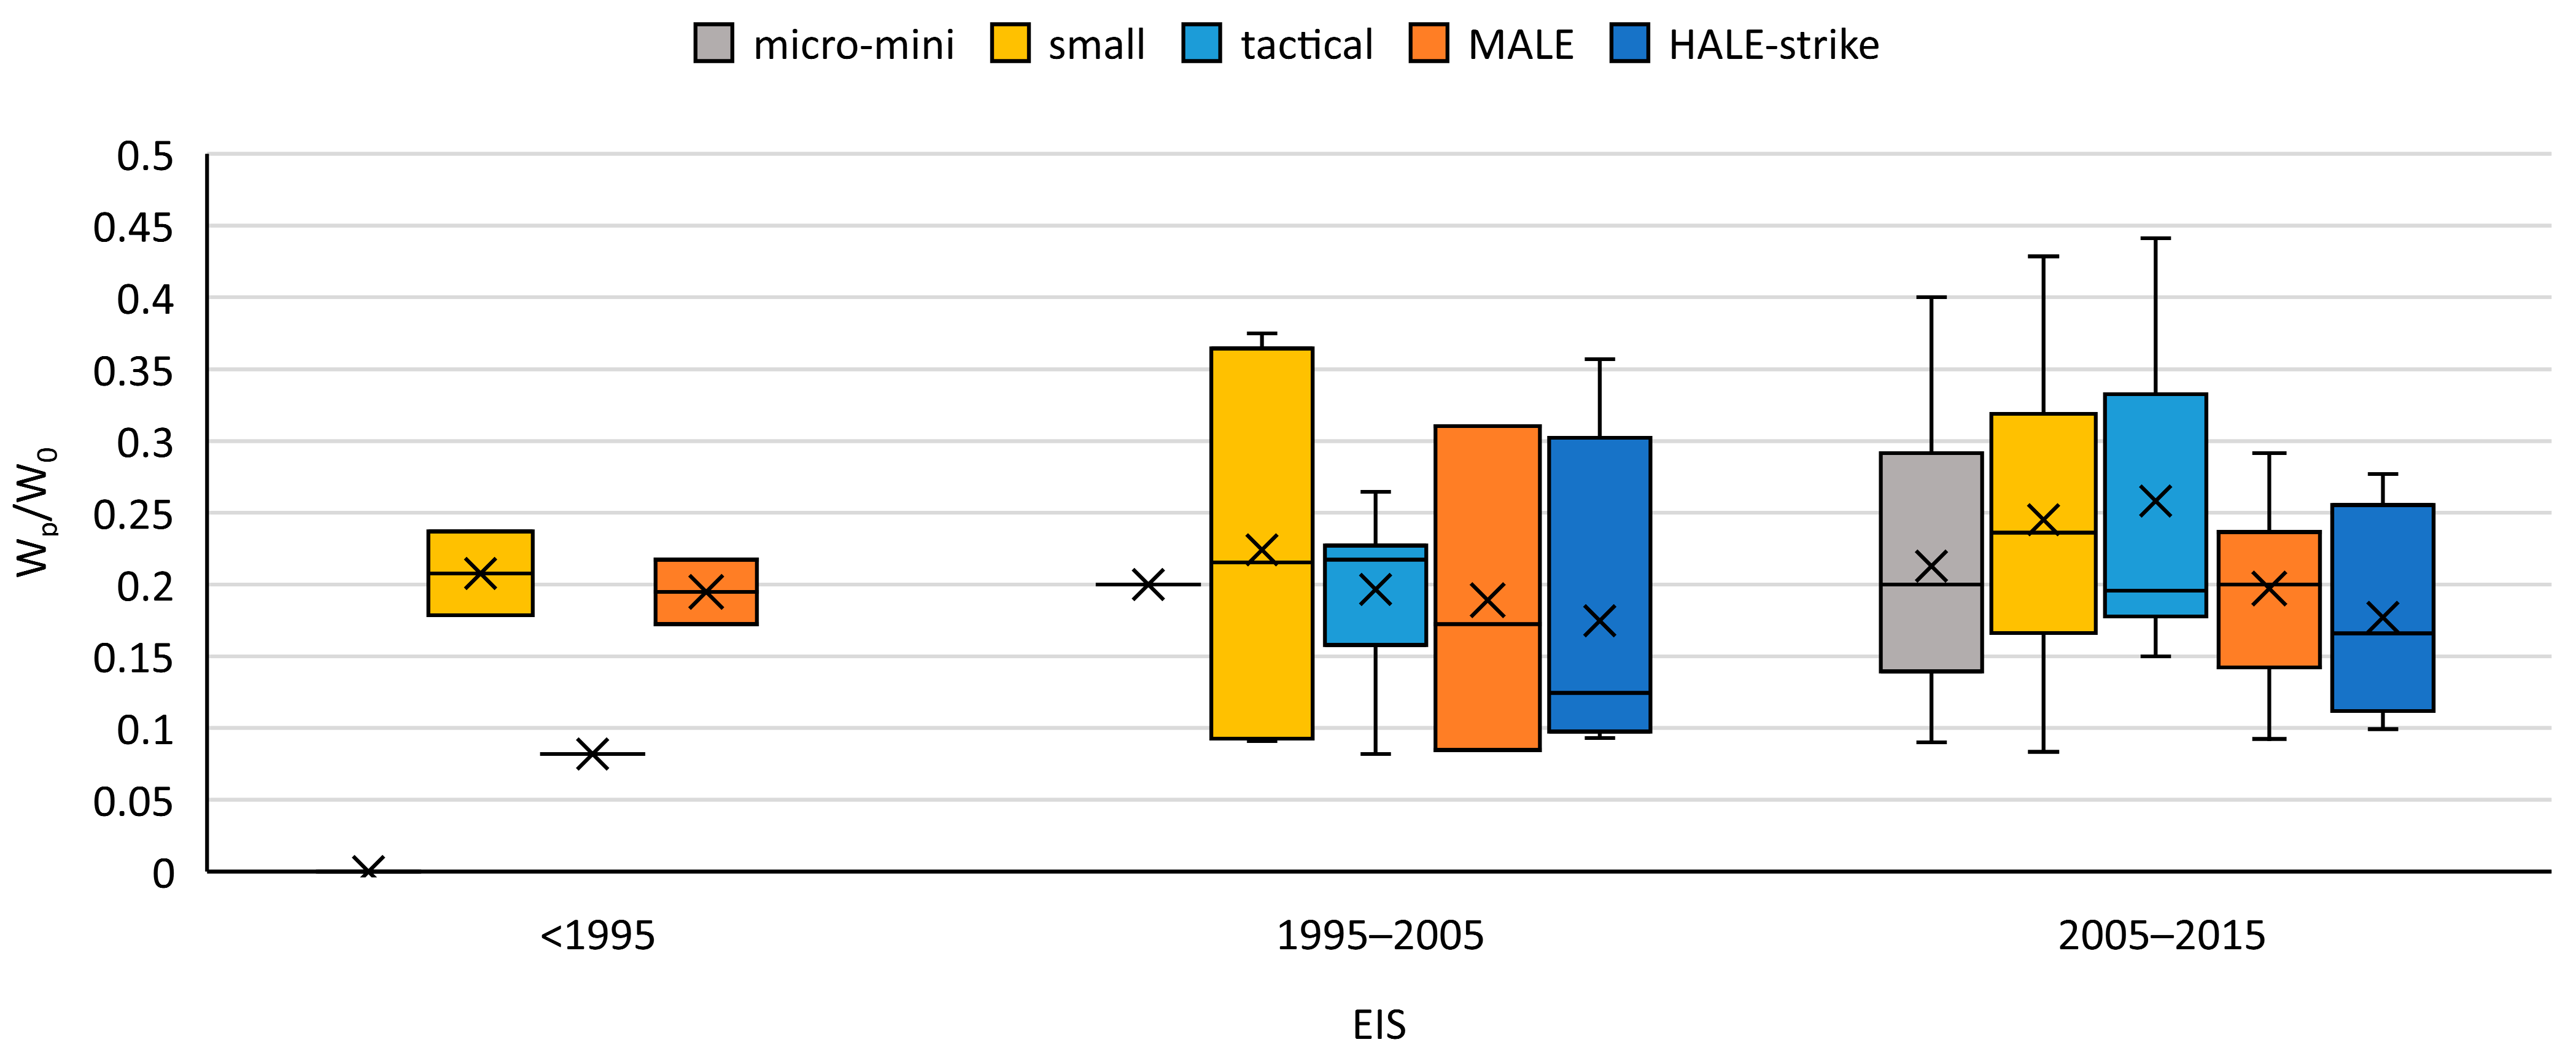
Figure 24 presents the ratio of the payload weight to GTOW per NATO classification, in 10-year intervals. It is observed that the micro-mini categories have an almost constant mean of 0.2. However, the dispersion has increased dramatically from 2005 onwards, indicating that more models of this category are being introduced within a greater design space. The small category fluctuates between 0.2 and 0.25 as the corresponding ratio slightly increases (24%), and their box dispersion decreases. For the tactical category, the mean appears in the same range, although with an exact opposite trend, i.e., the mean decreases (28%), and the box dispersion increases. Lastly, the MALE and HALE categories are below 0.2. Their mean values remain practically constant, and their box dispersion decreases.
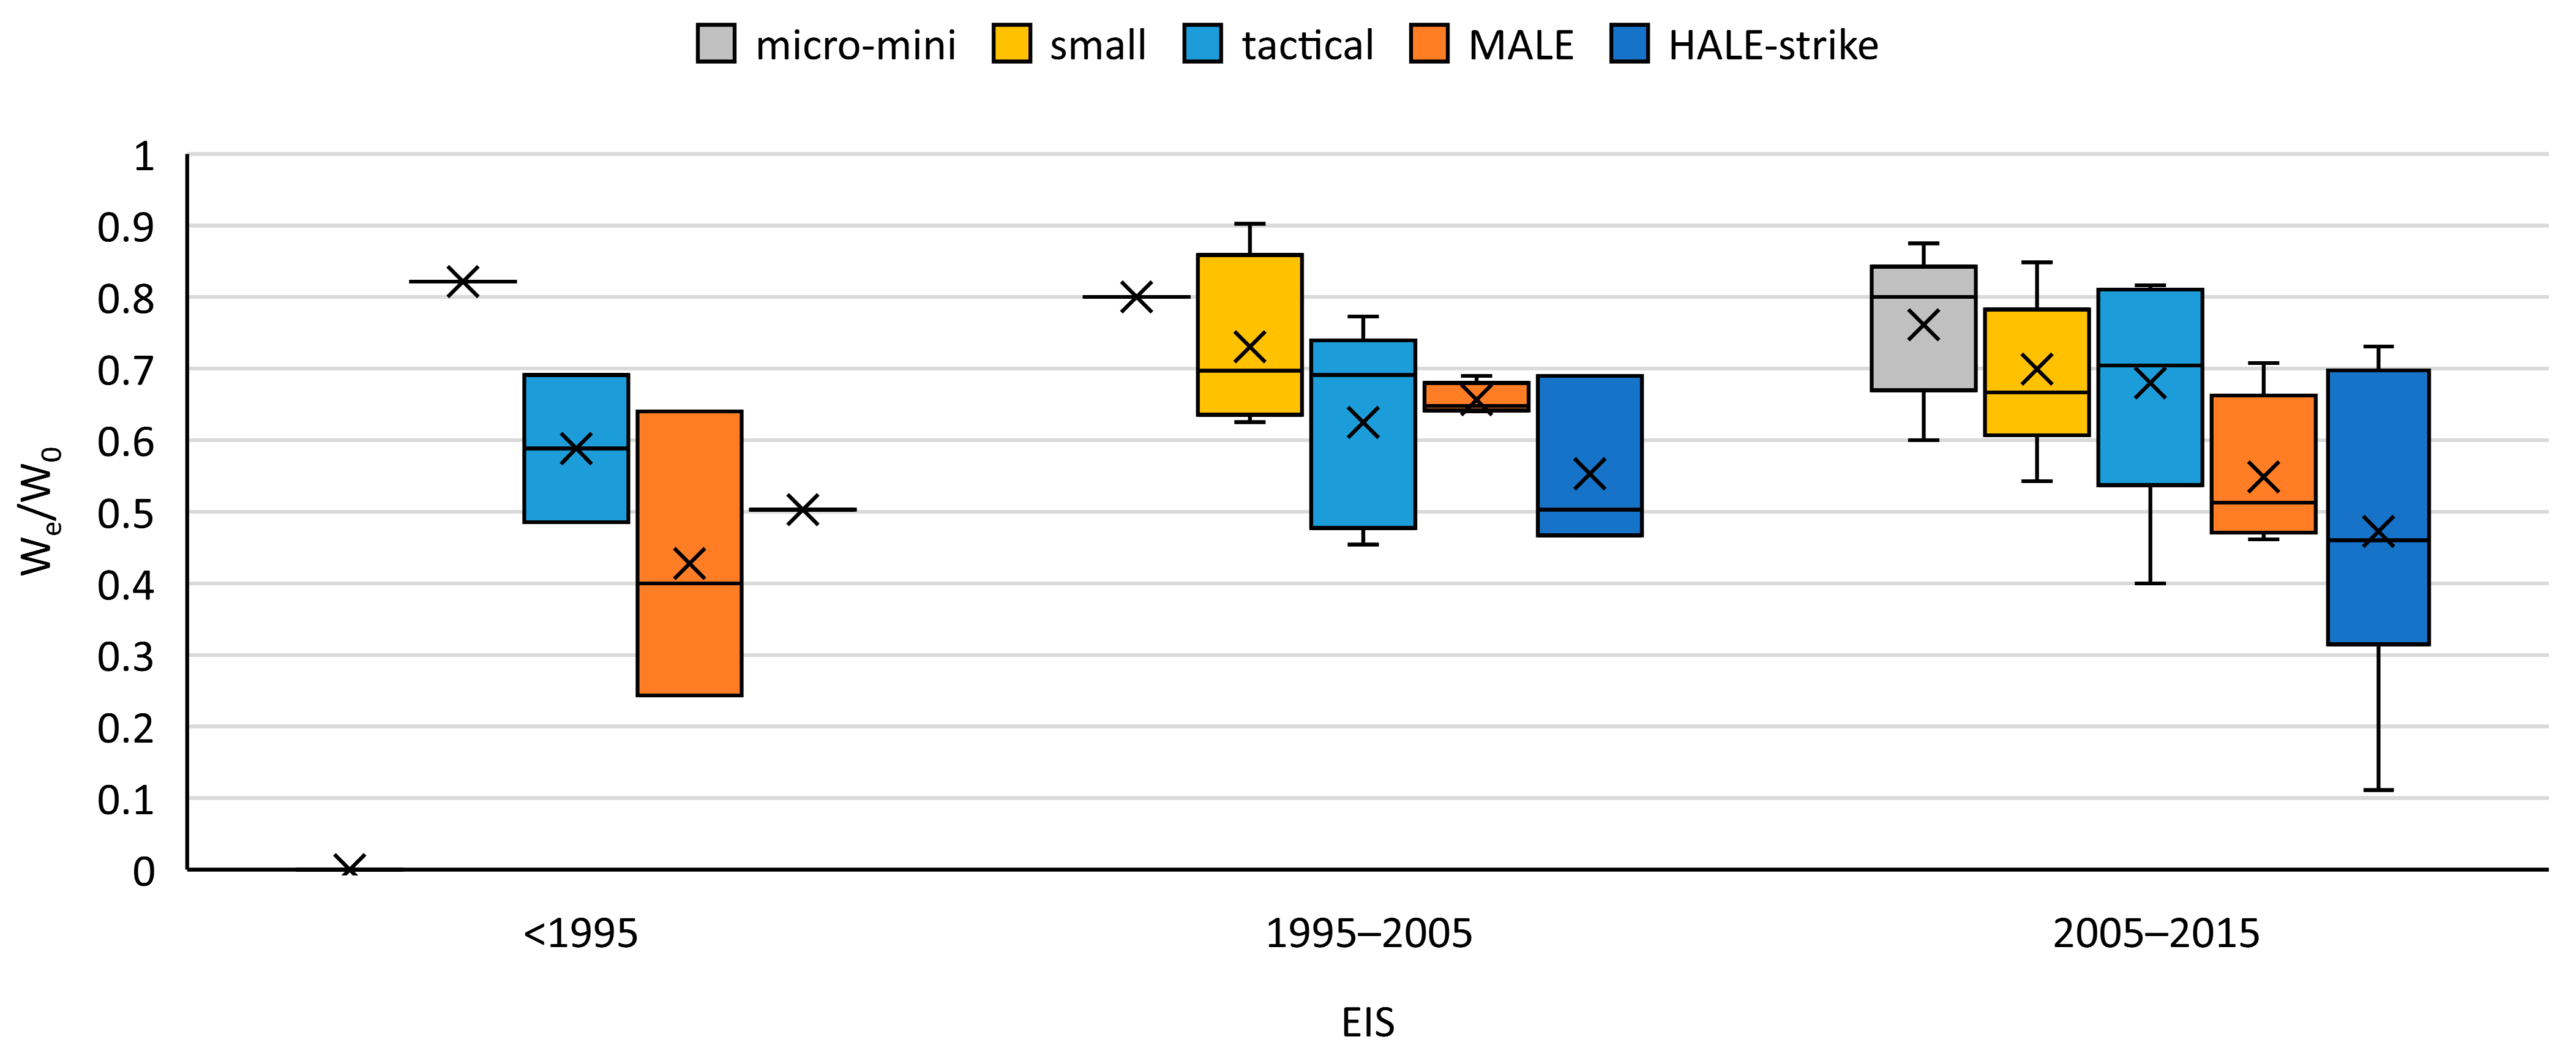
Figure 25 presents the evolution of the We/W0 ratio for all NATO categories, where no specific tendency can be observed for the mean and median values of the distribution. The results indicate that the empty weight fraction of the MALE and HALE categories appears to be decreasing, suggesting a market trend towards higher payload and fuel weight fractions. The decrease in empty weight fraction can be attributed to the improvements in material sciences and UAV manufacturing techniques [19,20]. However, it is important to note that the dispersion of the sample has increased in recent years; therefore, researchers and design engineers are advised to proceed with caution when using a general trendline for future UAV designs.
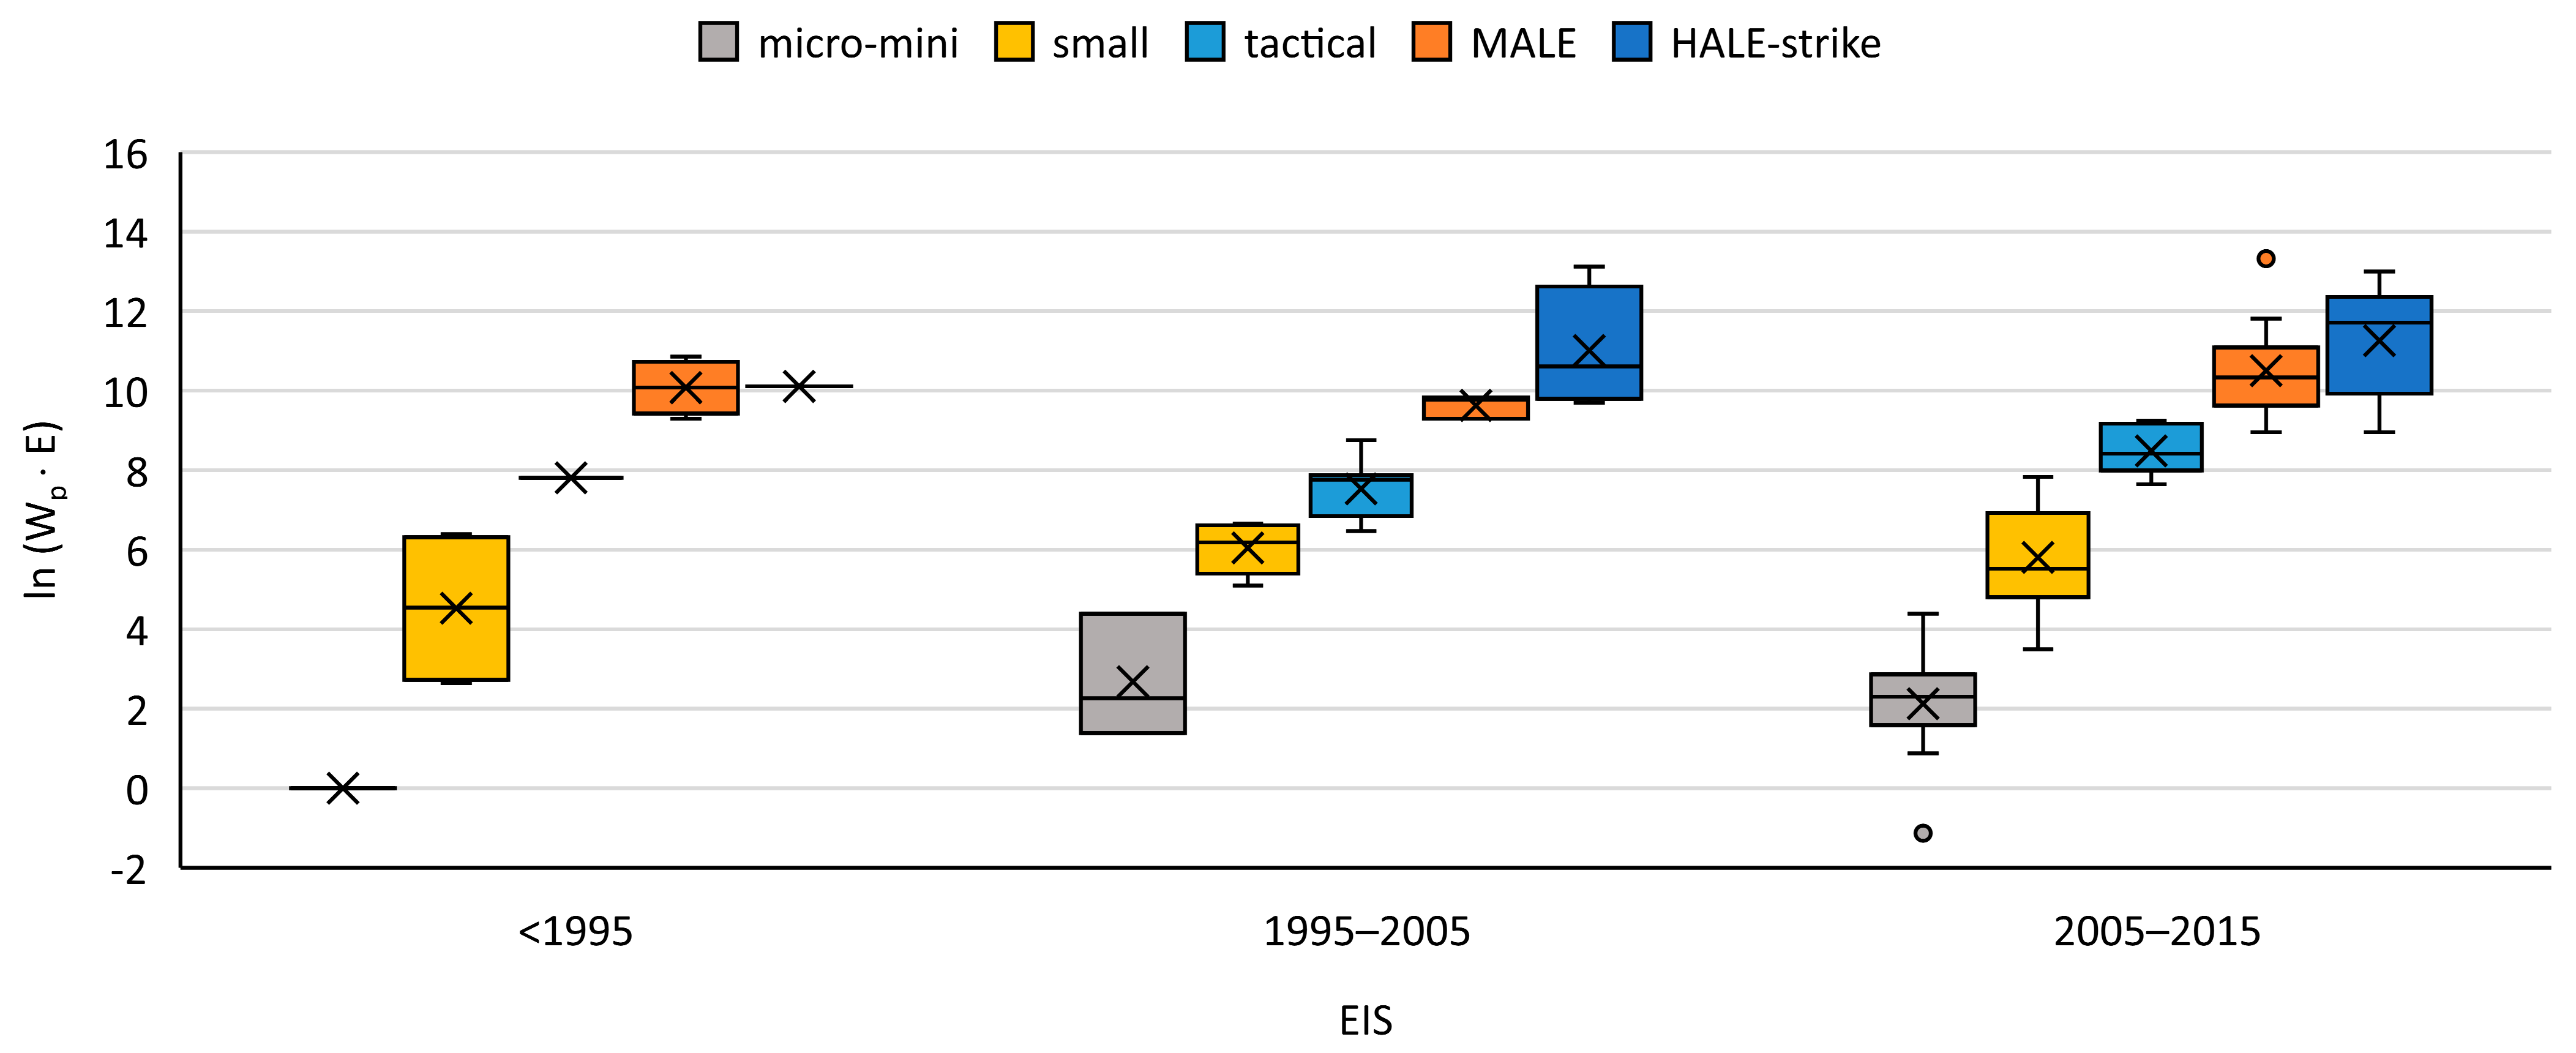
Figure 26 presents the evolution of the Wp · E product, per NATO category, as a function of EIS. A logarithmic scale is employed so that a better visualization of the results is possible. The results of this chart can be used complementarily to the ones of Figure 25, indicating that UAV operational capabilities expand over the years, as the Wp · E product increases for most categories. Combining this observation with the fact that the ratios of Wp over W0 remain more or less constant (Figure 24), it can be suggested that the UAV market is prioritizing increasing flight times (endurance).
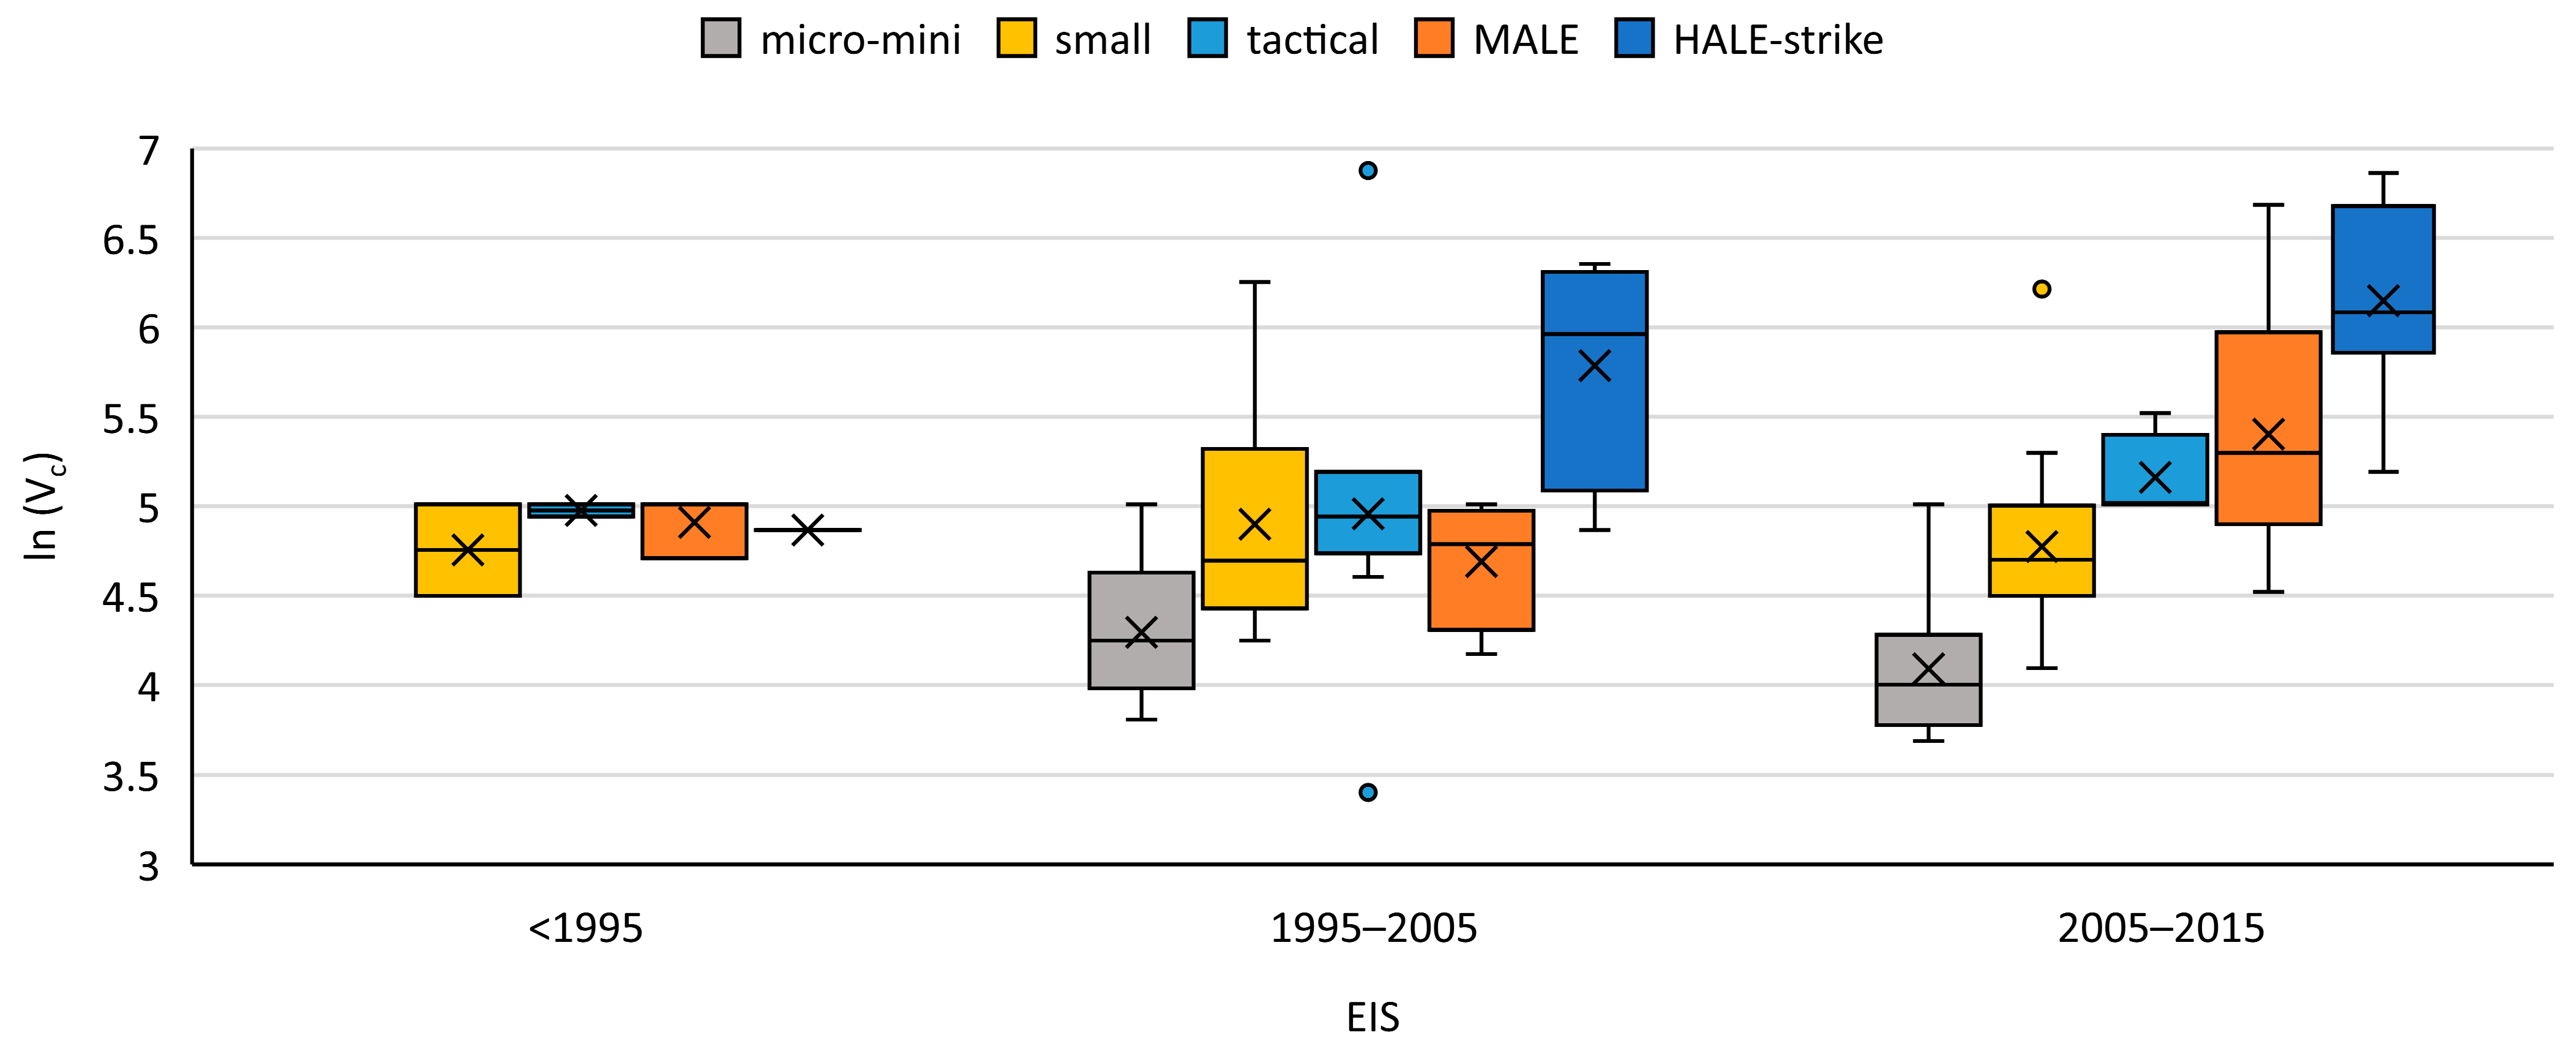
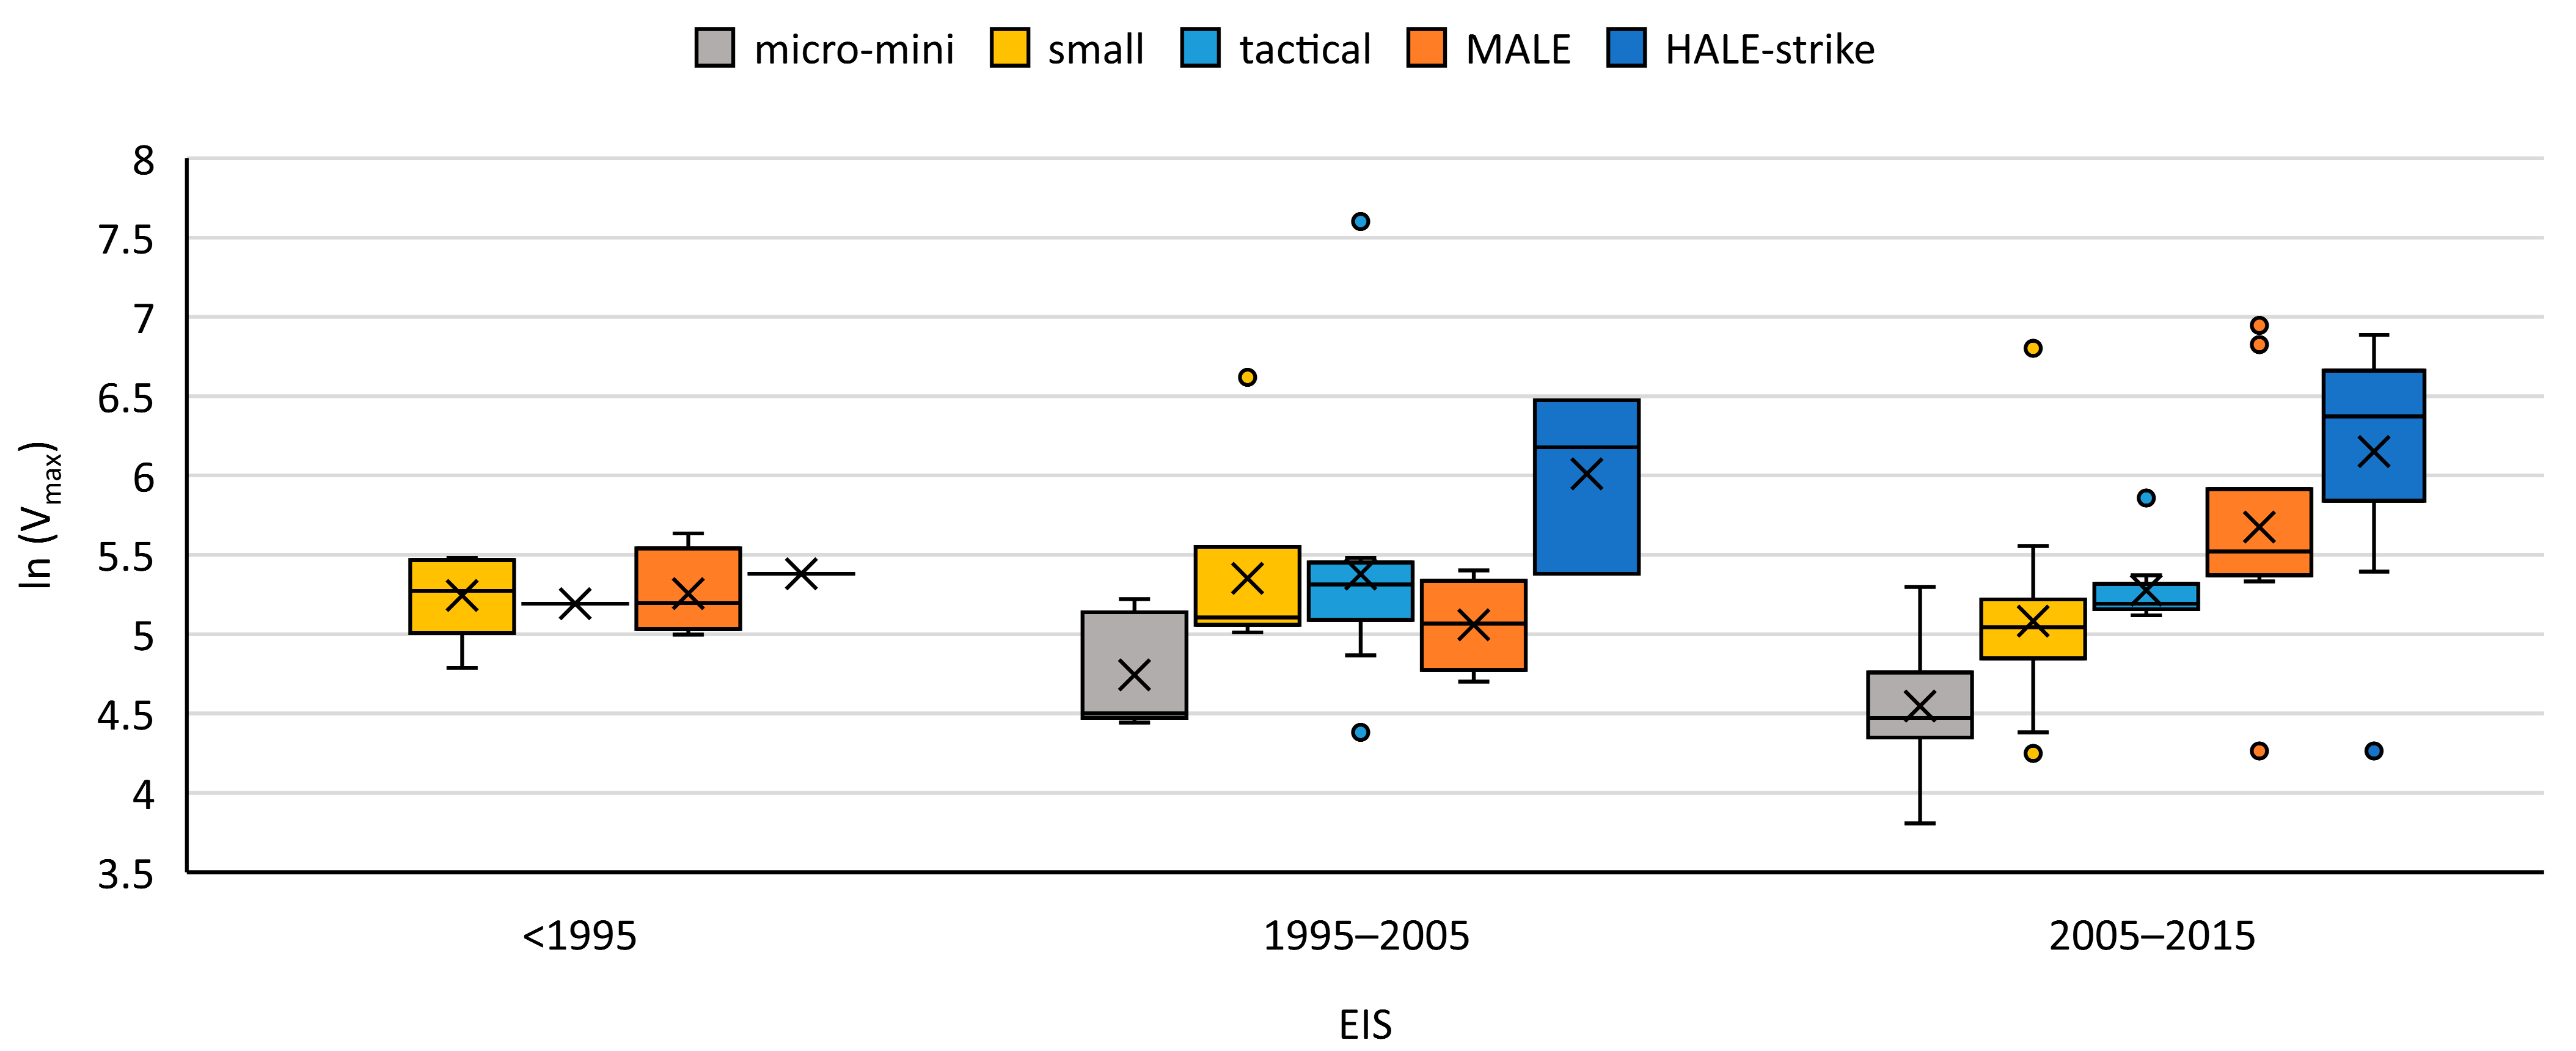
Figure 27 and Figure 28 show the progression of cruise and maximum speed, respectively, as a function of EIS, per NATO classification. One interesting finding is that in the first two decades, the cruise speed parameter for all categories is similar, with only HALE platforms deviating. However, in the 21st century, an increasing deviation is observed. Similarly, for the maximum speed, the small, tactical, and MALE categories are grouped together before 1995, while in the 2005–2015 decade, a clearer trend emerges, indicating that larger UAVs have a higher maximum speed.
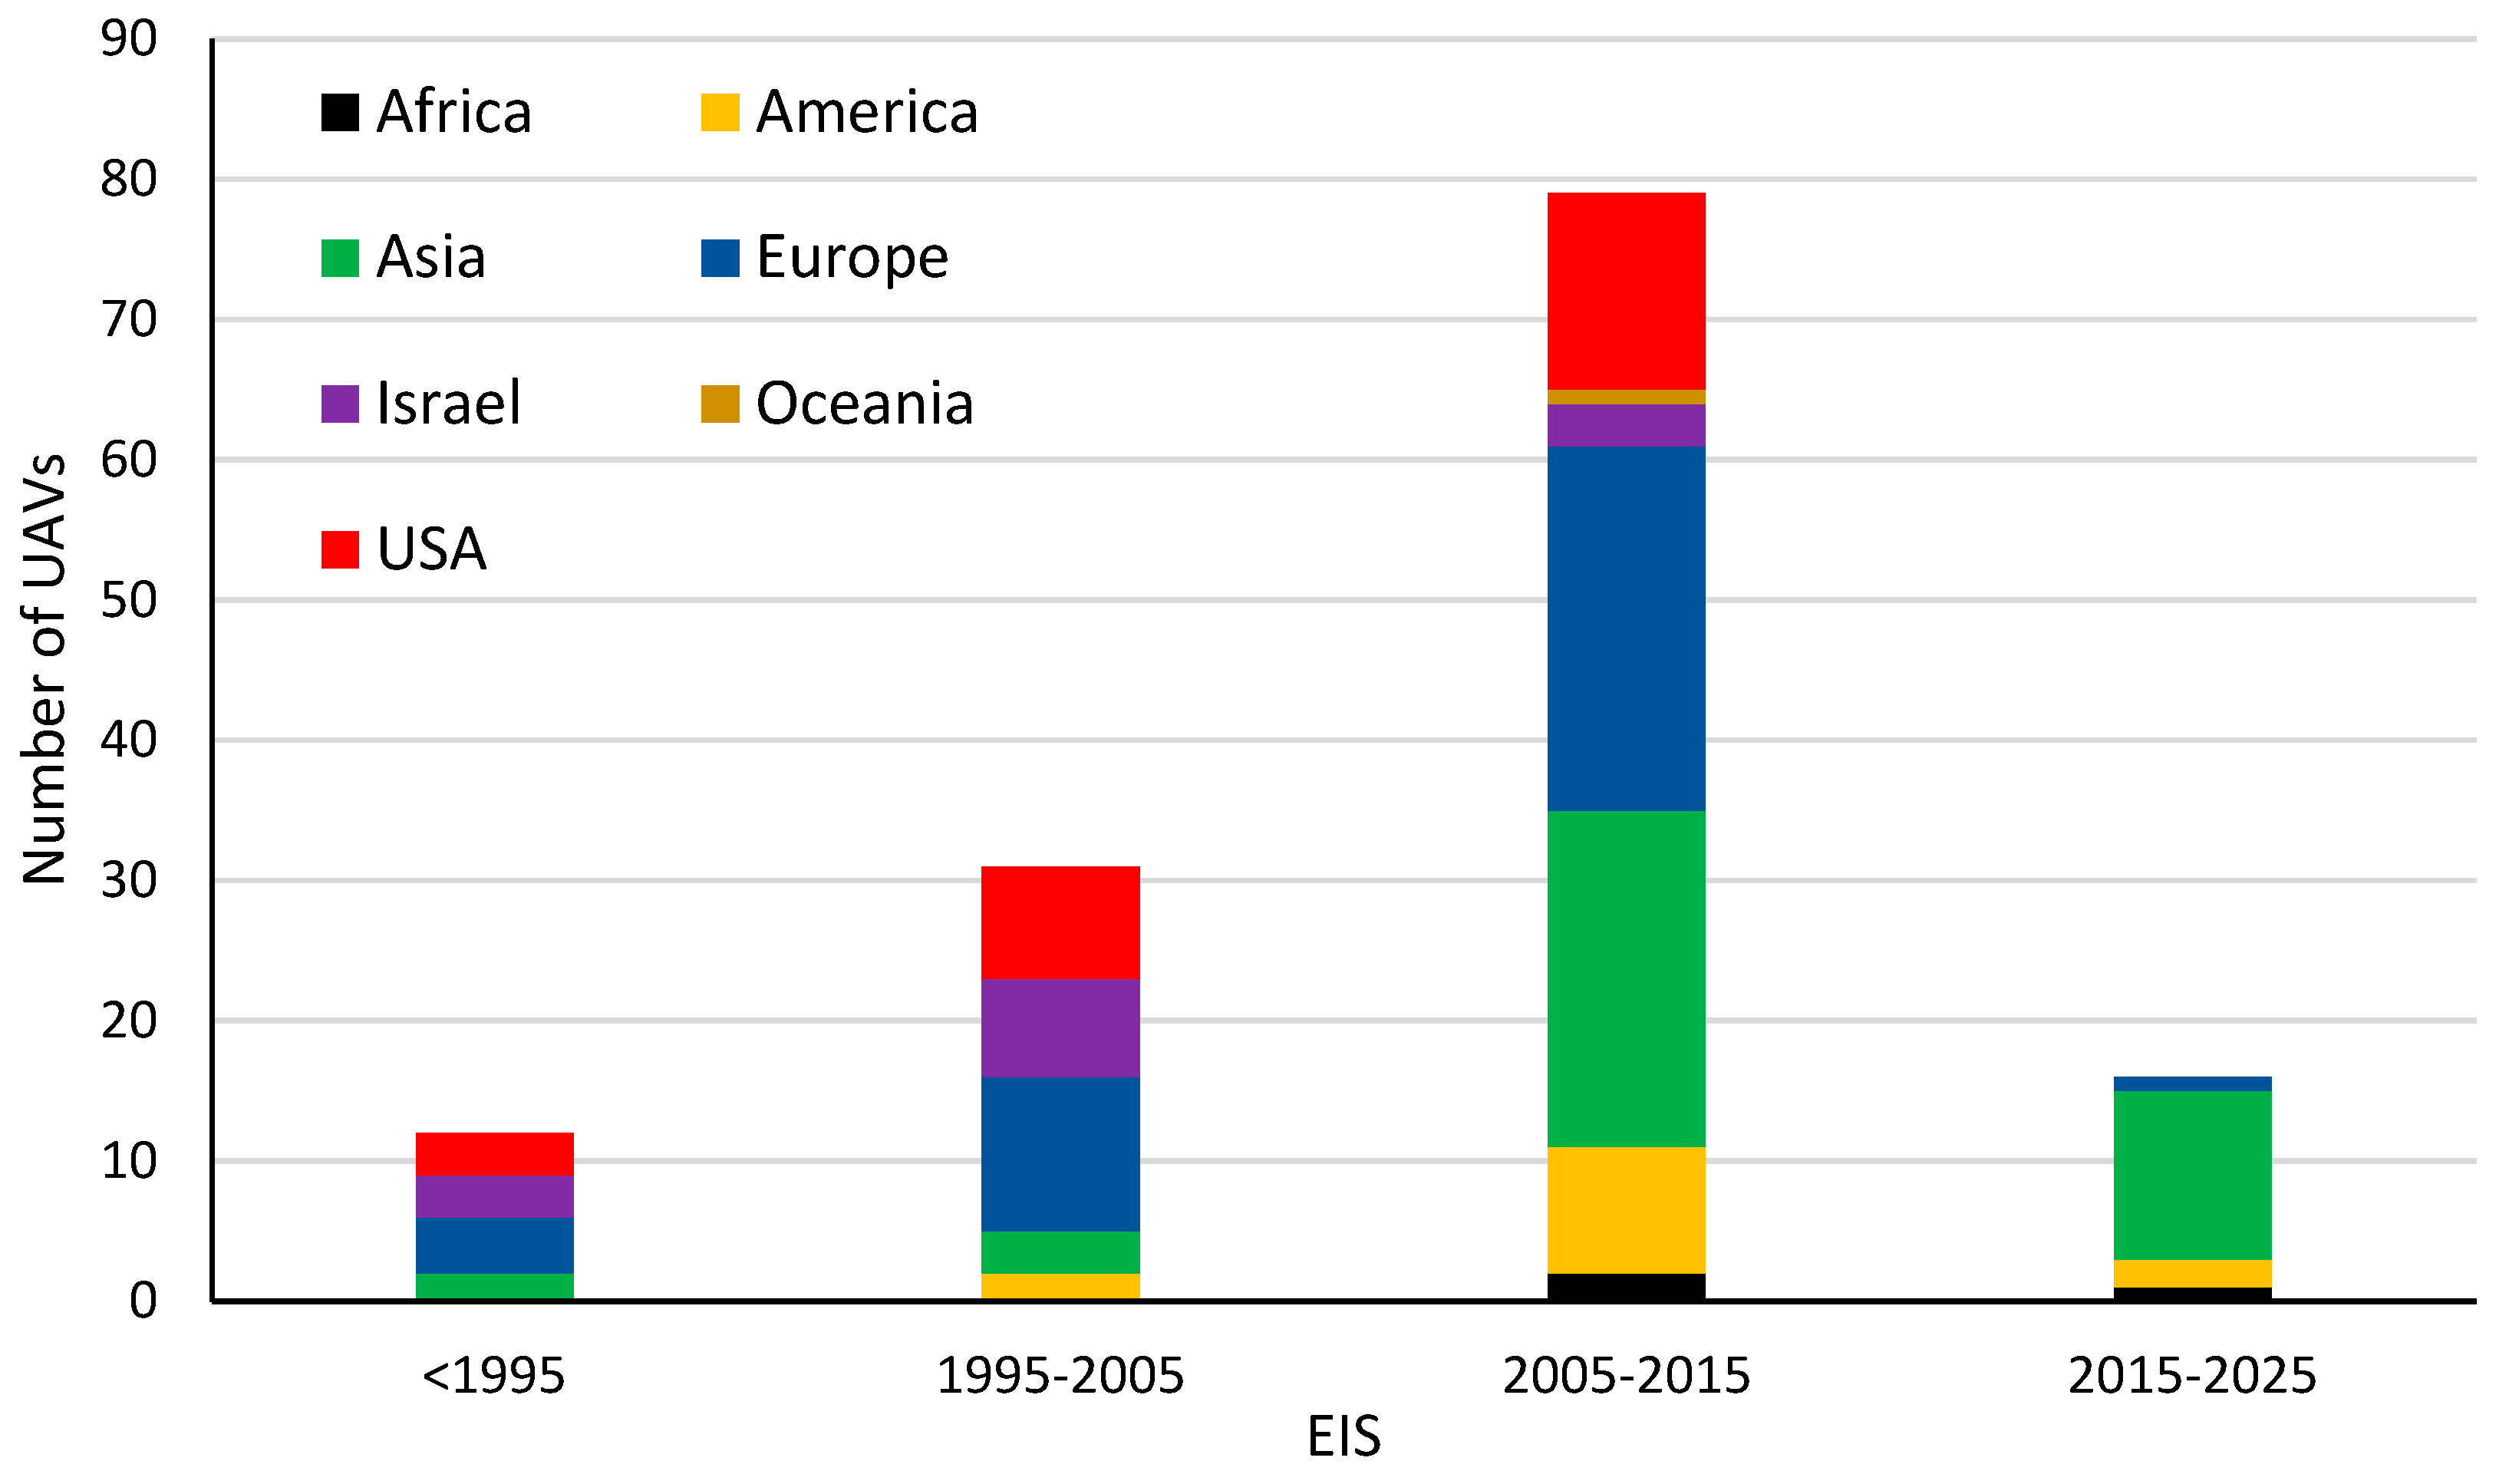
The last chart of this section (Figure 29) shows the number of UAV platforms that have been introduced in the past three periods per region. The regions of America and Europe present a steady advancement. Africa and Oceania have fewer entries in this chart, while in Asia it appears that UAV development has boomed since the beginning of the century. Note that the entries from USA and Israel do not appear to increase at the same pace, although both are amongst the pioneering nations in UAV development (first period). However, this chart only shows the number of new entries (i.e., new fixed-wing UAV models) per EIS period and does not show the number of units produced, as the latter is not a publicly available value. Therefore, this lack of new entries for the USA and Israel may be attributed to the high maturity of UAV technology in these regions. That is, a few well-designed fixed-wing UAV models may be enough to carry out the required missions, if produced in large numbers.

3.3. Other

Figure 30 is used to present the percentage of fixed-wing UAVs that have satellite communications per NATO category. The micro-mini and small categories feature the smallest percentages, which is partially expected, due to the relatively large weight of the corresponding avionics. On the contrary, almost half of the fixed-wing UAVs of the HALE category have SatComm, which also allows them to fly longer distances and cover strategic ISTAR operations [18].
Figure 31 presents the percentage of fixed-wing UAVs that are designed for low observability, per NATO category. In a similar observation to the SatComm chart, only the largest of UAVs seem to have been designed for low observability. This can be attributed to the fact that smaller platforms are, by definition, not easily detectable by radar. Therefore, designing them for low observability provides little-to-no additional benefits. Moreover, the vehicles of NATO Class III are substantially larger and more expensive assets that have to be more protected against enemy air defense systems.
Finally, the authors also considered including airworthiness as a qualitative parameter. Given the very recent changes in UAV legislation, as of 2022, all UAVs that operate inside the European Union countries must have a Type Certificate (TC) [40]. However, the only conclusion resulting from the corresponding investigation is that, as of today, no fixed-wing UAV has a TC from an aviation authority, either civilian or military.

4. Discussion and Conclusions

In this work, an analysis and evaluation of fixed-wing UAV correlations with respect to NATO classification, region of production, entry-into-service (EIS) date and other key operational specifications is conducted. An in-house database is populated using a set of 202 existing fixed-wing UAVs and a statistical analysis is performed, using a combination of charts and coefficients. The key conclusions are presented as follows:
  • As of today, the majority of UAVs currently in operation are used to perform missions related to intelligence, surveillance, target acquisition and reconnaissance.
  • The statistical analysis of the key design parameters and ratios indicated that the NATO classification should not be omitted when generating the corresponding trends. More specifically, it was observed that, when examining the general dataset, the trendlines have a considerably better fitting than the trendlines calculated for each category separately. However, new design projects are usually based on a given set of requirements that points towards a specific NATO category (or a range of adjacent categories). Therefore, as interesting as these general dataset fittings may be from a statistical point of view, they are of little practical use. The calculations for the corresponding category should be employed instead of the “nice”, but misleading, fittings calculated for the general dataset.
  • As discussed in the previous point, the data for several design parameters and ratios present a considerable dispersion. Therefore, apart from considering the corresponding trendlines and coefficients, the design engineers are advised to refer to charts such as dot and box plots, where the data dispersion can be quantified and the overall design space is better defined for each variable and NATO category.
  • Considering the EIS date parameter for the statistical analysis has provided some interesting conclusions. The empty weight trends indicate that better materials and processes are employed for fixed-wing UAV manufacturing, leading to decreased empty weight ratios over time. Moreover, the payload-weight-times-endurance product, Wp·E, increases over time for most categories. Combining the above observation with the fact that the ratios of payload weight over GTOW remain practically constant, it can be suggested that the UAV market prioritizes increasing flight endurance.
  • Concerning the operational parameters, the majority of fixed-wing UAVs that support satellite communication belong either to the HALE or to the MALE categories, followed by the tactical one. When it comes to low observability, the list is even more confined, since only UAVs that belong to the HALE and MALE categories are identified with such features. Moreover, even though the European legislation dictates that all fixed-wing UAVs operating in the continent should be airworthy, no such platform exists yet.
There are several areas for future work. For example, further research could be conducted to expand the database to include additional UAVs and parameters, such as cost, reliability and maintainability, as well as to further populate the existing ones. The authors would like to deepen their research activities in an attempt to better capture the correlations and provide better guidelines to designers. To that end, the current database can be used to train machine learning algorithms capable of providing any underlying trends. Finally, the authors suggest that a corresponding study should also be conducted in approximately ten years’ time so that reliable data can also be extracted for the current age.

Author Contributions

Conceptualization, P.P., D.M. and S.K.; methodology, D.M., S.K. and D.T.; software, S.K. and D.T.; validation, P.P., S.K. and D.T.; formal analysis, S.K., D.T. and D.M.; investigation, D.M., S.K. and D.T.; resources, P.P.; data curation, D.M. and D.T.; writing—original draft preparation, D.M., S.K. and D.T; writing—review and editing, P.P.; visualization, S.K. and D.T.; supervision, D.M and P.P.; project administration, P.P.; funding acquisition, P.P. All authors have read and agreed to the published version of the manuscript.

Funding

The research work was supported by the Hellenic Foundation for Research and Innovation (HFRI) under the 3rd Call for HFRI PhD Fellowships (Fellowship Number: 6179).

Data Availability Statement

The data gathered and processed along with the produced results for this paper remain at the Authors’ disposal. However, we encourage anyone who may be interested in any relevant data to contact the corresponding author directly via e-mail.

Conflicts of Interest

The authors declare no conflict of interest.

Appendix A

The appended UAVs are models that entered into service after 2015. As is evident, the model count is barely at double digits, therefore no reliable statistical data can be extracted for this period. This indicates that, in the current age (2015–2025), reliable information can be extracted for the previous decade. Consequently, the authors suggest that a similar analysis should be conducted in ten years’ time, to provide an update on the corresponding data and trends.
Table A1. UAVs models that entered into service after 2015 and their respectivre specifications.
UAVRegionNATO ClassEISMission TypeSpan [m]Cr. Speed [km/h]Max Speed [km/h]Max Range [km]Endurance [h]Service Ceiling [ft]GTOW [kg]Payload [kg]Low Observ.SatComm
Wing Loong 10AsiaHALE-Strike2016UCAV20N/A620N/A2049,0003200N/Anoyes
CH6AsiaHALE-Strike2021UCAVN/AN/AN/AN/A18N/A78001700nono
CH7AsiaHALE-Strike2019ISTAR strategic22N/A8853500N/A32,80812,250N/Ayesno
CacadorAmericaMALE2016ISTAR strategic16.6N/A2073504030,0001270250noyes
CH5AsiaMALE2017ISTAR strategic21N/A48010004029,52531001000noyes
CH6AsiaMALE2021ISTAR tacticalN/AN/AN/AN/A21N/A78002000nono
Rustom 2AsiaMALE2019ISTAR strategic20.6180225350N/A22,0001800N/Anoyes
CarcaraAmericamicro-mini2016ISTAR tactical1.64050601.5820092nono
Ai Bird KC - 2000Asiamicro-mini2017ISTAR tactical211014060415,10092nono
EOSEuropemicro-mini2017ISTAR tactical3.57010017213008.41.5nono
AMELAfricasmall2016ISTAR tactical3.62115150240611,5005020nono
Sharp swordAsiaHALE-Strike2019UCAV14N/AN/A15,00048N/A1800N/Ayesyes
Cloud ShadowAsiaHALE-Strike2016UCAV11N/A620290646,0003000400noyes
Shahed 129AsiaHALE-Strike2017UCAVN/A1753002002425,000990400noN/A
KUS 7Asiatactical2016ISTAR strategic4.215018050N/A14,000Ν/AN/Anoyes
KUS 9Asiatactical2016ISTAR strategic4.513020050N/A8200150N/Anono

References

  1. Carabassa, V.; Montero, P.; Alcañiz, J.M.; Padró, J.C. Soil Erosion Monitoring in Quarry Restoration Using Drones. Minerals 2021, 11, 949. [Google Scholar] [CrossRef]
  2. Šiljeg, A.; Marinović, R.; Domazetović, F.; Jurišić, M.; Marić, I.; Panđa, L.; Radočaj, D.; Milošević, R. GEOBIA and Vegetation Indices in Extracting Olive Tree Canopies Based on Very High-Resolution UAV Multispectral Imagery. Appl. Sci. 2023, 13, 739. [Google Scholar] [CrossRef]
  3. Alfonso-Torreño, A.; Gómez-Gutiérrez, Á.; Schnabel, S. Dynamics of Erosion and Deposition in a Partially Restored Valley-Bottom Gully. Land 2021, 10, 62. [Google Scholar] [CrossRef]
  4. Moudrý, V.; Urban, R.; Štroner, M.; Komárek, J.; Brouček, J.; Prošek, J. Comparison of a Commercial and Home-Assembled Fixed-Wing UAV for Terrain Mapping of a Post-Mining Site under Leaf-off Conditions. Int. J. Remote Sens. 2018, 40, 555–572. [Google Scholar] [CrossRef]
  5. Gonçalves, G.; Andriolo, U.; Gonçalves, L.M.S.; Sobral, P.; Bessa, F. Beach Litter Survey by Drones: Mini-Review and Discussion of a Potential Standardization. Environ. Pollut. 2022, 315, 120370. [Google Scholar] [CrossRef] [PubMed]
  6. Jessin, J.; Heinzlef, C.; Long, N.; Serre, D. A Systematic Review of UAVs for Island Coastal Environment and Risk Monitoring: Towards a Resilience Assessment. Drones 2023, 7, 206. [Google Scholar] [CrossRef]
  7. UAV Market Size, Share, Growth, Trends, Industry Analysis Forecast 2026. Available online: https://www.technavio.com/report/uav-market-industry-analysis (accessed on 26 January 2023).
  8. Kontogiannis, S.G.; Ekaterinaris, J.A. Design, Performance Evaluation and Optimization of a UAV. Aerosp. Sci. Technol. 2013, 29, 339–350. [Google Scholar] [CrossRef]
  9. Papadopoulos, C.; Mitridis, D.; Yakinthos, K. Conceptual Design of a Novel Unmanned Ground Effect Vehicle (UGEV) and Flow Control Integration Study. Drones 2022, 6, 25. [Google Scholar] [CrossRef]
  10. Suewatanakul, S.; Porcarelli, A.; Olsson, A.; Grimler, H.; Chiche, A.; Mariani, R.; Lindbergh, G. Conceptual Design of a Hybrid Hydrogen Fuel Cell/Battery Blended-Wing-Body Unmanned Aerial Vehicle—An Overview. Aerospace 2022, 9, 275. [Google Scholar] [CrossRef]
  11. Bishay, P.L.; Kok, J.S.; Ferrusquilla, L.J.; Espinoza, B.M.; Heness, A.; Buendia, A.; Zadoorian, S.; Lacson, P.; Ortiz, J.D.; Basilio, R.; et al. Design and Analysis of MataMorph-3: A Fully Morphing UAV with Camber-Morphing Wings and Tail Stabilizers. Aerospace 2022, 9, 382. [Google Scholar] [CrossRef]
  12. Panagiotou, P.; Mitridis, D.; Dimopoulos, T.; Kapsalis, S.; Dimitriou, S.; Yakinthos, K. Aerodynamic Design of a Tactical Blended-Wing-Body UAV for the Aerial Delivery of Cargo and Lifesaving Supplies. In Proceedings of the AIAA Scitech 2020 Forum, Orlando, FL, USA, 6–10 January 2020; American Institute of Aeronautics and Astronautics Inc., AIAA: Reston, VA, USA, 2020; Volume 1. Part F. [Google Scholar]
  13. Ozdemir, U.; Orkut Aktas, Y.; Vuruskan, A.; Dereli, Y.; Farabi Tarhan, A.; Demirbag, K.; Erdem, A.; Duygu Kalaycioglu, G.; Ozkol, I.; Inalhan, G.; et al. Design of a Commercial Hybrid VTOL UAV System. J. Intell. Robot. Syst. 2014, 74, 371–393. [Google Scholar] [CrossRef]
  14. Lehmkuehler, K.; Wong, K.C.; Verstraete, D. Design and Test of a UAV Blended Wing Body Configuration. In Proceedings of the 28th Congress of the International Council of the Aeronautical Sciences ICAS 2012, Brisbane, Australia, 23–28 September 2012; Volume 1, pp. 432–442. [Google Scholar]
  15. Kaparos, P.; Bliamis, C.; Yakinthos, K. Conceptual Design of a UAV with VTOL Characteristics. In Proceedings of the AIAA Aviation 2019 Forum, Dallas, TX, USA, 17 June 2019; American Institute of Aeronautics and Astronautics Inc., AIAA: Reston, VA, USA, 2019; pp. 1–11. [Google Scholar]
  16. Götten, F.; Finger, D.F.; Havermann, M.; Braun, C.; Marino, M.; Bil, C. Full Configuration Drag Estimation of Small-to-Medium Range UAVs and Its Impact on Initial Sizing Optimization. Aerosp. Sci. Technol. 2020, 107, 106306. [Google Scholar] [CrossRef]
  17. Panagiotou, P.; Dimopoulos, T.; Dimitriou, S.; Yakinthos, K. Quasi-3D Aerodynamic Analysis Method for Blended-Wing-Body. Aeropsace 2021, 8, 13. [Google Scholar] [CrossRef]
  18. Austin, R. Unmanned Aircraft Systems, UAVs Design, Development and Deployment; Wiley: Chichester, UK, 2010. [Google Scholar]
  19. Raymer, D.P. Aircraft Design: A Conceptual Approach, 5th ed.; American Institute of Aeronautics and Astronautics: Reston, VA, USA, 2012; ISBN 978-1-60086-911-2. [Google Scholar]
  20. Gudmundsson, S. General Aviation Aircraft Design: Applied Methods and Procedures; Butterworth-Heinemann: Oxford, UK, 2013. [Google Scholar]
  21. Gundlach, J. Designing Unmanned Aircraft Systems; American Institute of Aeronautics and Astronautics: Reston, VA, USA, 2012. [Google Scholar]
  22. Gómez-Rodríguez, Á.; Sanchez-Carmona, A.; García-Hernández, L.; Cuerno-Rejado, C. Preliminary Correlations for Remotely Piloted Aircraft Systems Sizing. Aerospace 2018, 5, 5. [Google Scholar] [CrossRef]
  23. ATP-3.3.7; Guidance for the Training of Unmanned Aircraft Systems (UAS) Operators. NATO Standard: Brussels, Belgium, 2014.
  24. Verstraete, D.; Palmer, J.L.; Hornung, M. Preliminary Sizing Correlations for Fixed-Wing Unmanned Aerial Vehicle Characteristics. J. Aircr. 2018, 55, 715–726. [Google Scholar] [CrossRef]
  25. Alulema, V.; Valencia, E.; Cando, E.; Hidalgo, V.; Rodriguez, D. Propulsion Sizing Correlations for Electrical and Fuel Powered Unmanned Aerial Vehicles. Aerospace 2021, 8, 171. [Google Scholar] [CrossRef]
  26. Bajwa, O.; Baluch, H.; Saeed, H. Machine Learning Techniques for Predicting UAV Design Parameters: Overview, Methodology and Potential Benefits. In Proceedings of the 2022 19th International Bhurban Conference on Applied Sciences and Technology, IBCAST 2022, Islamabad, Pakistan, 16–20 August 2022; Institute of Electrical and Electronics Engineers Inc.: Piscataway, NJ, USA, 2022; pp. 249–255. [Google Scholar]
  27. Moir, I.; Seabridge, A.G.; Jukes, M. Military Avionics Systems; John Wiley & Sons: Hoboken, NJ, USA, 2006; ISBN 0470016329. [Google Scholar]
  28. Heinemann, P.; Panagiotou, P.; Vratny, P.C.; Kaiser, S.; Hornung, M.; Yakinthos, K. Advanced Tube and Wing Aircraft for Year 2050 Timeframe. In Proceedings of the 55th AIAA Aerospace Sciences Meeting, Gravepine, TX, USA, 9–13 January 2017. [Google Scholar]
  29. Nguyen, E.; Defoort, S.; Ridel, M.; Donjat, D.; Viguier, C.; Ali, M.; Youssef, T.; Gerada, D.; Gerada, C.; Nguyen Van, E.; et al. Design and Performance Evaluation of a Full Turboelectric Distributed Electric Propulsion Aircraft: Preliminary Results of EU Project IMOTHEP. In Proceedings of the 9th European Conference for Aeronautics and Space Sciences (EUCASS), Lille, France, 27 June–1 July 2022. [Google Scholar]
  30. Towards A Sustainable Air Transport System; TU Delft: Delft, The Netherlands, 2021.
  31. Mukhopadhaya, J.; Rutherford, D. Performance Analysis of Evolutionary Hydrogen-Powered Aircraft; The International Council on Clean Trasportation ICCT: Washington DC, USA, 2022. [Google Scholar]
  32. Roskam, J. Airplane Design; DARcorporation: Lawrence, Kansas, 2004. [Google Scholar]
  33. Anderson, J.D. Aircraft Performance and Design; McGraw-Hill Education: Boston, MA, USA, 1999; Volume 358, ISBN 0-07-001971-1. [Google Scholar]
  34. Predator. Available online: https://www.deagel.com/Support%20Aircraft/Predator/a000517 (accessed on 5 April 2023).
  35. Aircraft. Drone Specific & Intelligent. Available online: https://www.atbelgium.com/aircraft/eng/drone-product.php?drone=77 (accessed on 5 April 2023).
  36. Montgomery, D.C.; Peck, E.A.; Vining, G.G. Introduction to Linear Regression Analysis, 5th ed.; Wiley: Hoboken, NJ, USA, 2012; ISBN 978-0-470-54281-1. [Google Scholar]
  37. Bates, D.M.; Watts, D.G. Nonlinear Regression Analysis and Its Applications; Wiley: New York, NY, USA; Cichester, UK, 2007; ISBN 9780470139004. [Google Scholar]
  38. Fox, J. Applied Regression Analysis and Generalized Linear Models, 3rd ed.; Sage Publications, Inc.: Thousand Oaks, CA, USA, 2015; ISBN 978-1-4522-0566-3. [Google Scholar]
  39. Pedregosa, F.; Michel, V.; Grisel, O.; Blondel, M.; Prettenhofer, P.; Weiss, R.; Vanderplas, J.; Cournapeau, D.; Varoquaux, G.; Gramfort, A.; et al. Scikit-Learn: Machine Learning in Python. J. Mach. Learn. Res. 2011, 12, 2825–2830. [Google Scholar]
  40. European Union Aviation Safety Agency. Introducing of a Regulatory Framework for the Operation of Unmanned Aircraft Systems and for Urban Air Mobility in the European Union Aviation System; EASA: Cologne, Germany, 2022; Issue 4. [Google Scholar]
Figure 1. Methodology flowchart.
Aerospace 10 00382 g001
Figure 2. Percentage of UAV database entries per region (out of 202 total UAVs).
Aerospace 10 00382 g002
Figure 3. Parameters Spearman rank correlation coefficient heatmap, used to investigate potential correlations between the acquired data.
Aerospace 10 00382 g003
Figure 4. Span as a function of GTOW for the general sample category.
Aerospace 10 00382 g004
Figure 5. Fixed-wing UAV missions.
Aerospace 10 00382 g005
Figure 6. Wingspan as function of GTOW with respect to the NATO classification. Dark red color is used for the trendline of the entire sample, while the rest of the colors are used for the respective classes and coincide with the bullets color code, as explained in the legend.
Aerospace 10 00382 g006
Figure 7. Wingspan as a function of GTOW with respect to region of origin.
Aerospace 10 00382 g007
Figure 8. GTOW as a function of payload weight for the general category.
Aerospace 10 00382 g008
Figure 9. GTOW as a function of payload weight with respect to NATO classification. The color code is identical to the one described in Figure 6.
Aerospace 10 00382 g009
Figure 10. GTOW as a function of payload weight with respect to region of origin.
Aerospace 10 00382 g010
Figure 11. Empty weight as a function of GTOW for the general category.
Aerospace 10 00382 g011
Figure 12. Empty weight as a function of GTOW with respect to NATO classification. The color code is identical to the one described in Figure 6.
Aerospace 10 00382 g012
Figure 13. Empty weight as a function of GTOW with respect to region of origin.
Aerospace 10 00382 g013
Figure 14. Empty weight divided by GTOW as a function of GTOW for the general category.
Aerospace 10 00382 g014
Figure 15. Empty weight divided by GTOW as a function of GTOW with respect to NATO classification.
Aerospace 10 00382 g015
Figure 16. Empty weight divided by GTOW as a function of GTOW with respect to region of origin.
Aerospace 10 00382 g016
Figure 17. Wp · E as a function of GTOW.
Aerospace 10 00382 g017
Figure 18. Wp · E as a function of GTOW with respect to NATO categories.
Aerospace 10 00382 g018
Figure 19. Wp · E as a function of GTOW with respect to region of origin.
Aerospace 10 00382 g019
Figure 20. Cruise speed as a function of GTOW for the general category.
Aerospace 10 00382 g020
Figure 21. Cruise speed as a function of GTOW with respect to NATO classification. The color code is identical to the one described in Figure 6.
Aerospace 10 00382 g021
Figure 22. Cruise speed as a function of GTOW with respect to region of origin.
Aerospace 10 00382 g022
Figure 23. GTOW EIS progression per NATO category.
Aerospace 10 00382 g023
Figure 24. Payload weight over GTOW ratio EIS progression per NATO category.
Aerospace 10 00382 g024
Figure 25. Empty weight ratio EIS progression per NATO category.
Aerospace 10 00382 g025
Figure 26. Wp · E product EIS progression per NATO category.
Aerospace 10 00382 g026
Figure 27. Cruise speed progression.
Aerospace 10 00382 g027
Figure 28. Maximum speed progression.
Aerospace 10 00382 g028
Figure 29. Number of UAVs introduced per region per EIS.
Aerospace 10 00382 g029
Figure 30. UAVs equipped with satellite communication systems per NATO category.
Aerospace 10 00382 g030
Figure 31. UAVs designed for low observability per NATO category.
Aerospace 10 00382 g031
Table 1. Previous UAV database studies.
ResearchSampleStrengthsShortcomings
Raymer [19]N/AWell-established design trendsFocused on manned aircraft
Gomez-Rodriguez et al. [22]398Focused on layout specification and sizeNo mission classification/lack of standardized size (NATO) classification
Verstraete et al. [24]856Large dataset/focused on key design parameter correlationsNo mission or size classification
Alulema [25]N/ADetailed propulsion system reviewNo information on platform classification
Bajwa et al. [26]41Novel AI-based approachLimited dataset/lack of mission or size classification
Table 2. NATO UAV classification.
ClassCategoryGTOWEmploymentAltitudeMission RadiusExample
Class IMicro<2 kgTactical subunit<200 ft<5 kmDragon Eye
Mini2 kg–15 kgTactical subunit<3000 ft<25 kmEOS
Small15 kg–150 kgTactical unit<5000 ft<50 kmOrbiter
Class IITactical150 kg–600 kgTactical formation<18,000 ftLOSShadow
Class IIIMALE>600 kgOperational<45,000 ftBLOSX47
HALE>600 kgStrategic<65,000 ftBLOSGlobal Hawk
Strike>600 kgStrategic<65,000 ftBLOSAvenger
Table 3. Reference dataset trend factor results and comparison of the corresponding literature [24].
R2ABnType of Fitting
Reference [24]0.760.8280.37836Power
Current study0.8110.9620.342202Power
Table 4. Indicative results for UAVs of different NATO categories (“Current”) and comparison with the actual values (“Actual”) and the reference literature [24] (“Ref.”).
UAVRegionGTOWSpan (Actual)Span (Ref.)Span (Current)Error (Ref.)Error (Current)
Stardust 2Chile51.51.501.570%4%
YasirIran252.362.722.8515%21%
HERTIUK34011.997.167.50−40%−37%
CH5China31002116.217.05−23%−19%
MantisUK9000202425.3220%27%
Table 5. Statistical data regarding the trend fitting for the wingspan vs. GTOW plots.
R2ABnType of Fitting
All0.810.9620.342202Power
Micro-Mini0.470.8660.46440Power
Small<0.20.6191.47365Logarithmic
Tactical<0.20.6330.40845Power
MALE0.370.8710.37629Power
HALE-Strike0.340.8360.37123Power
Table 6. Statistical data regarding the trend fitting for the GTOW as a function of payload weight plots.
R2ABnType of Fitting
All0.975.3121680.9720.9646Power
Micro-Mini0.495.58620.5880.4869Power
Small0.739.20550.69440.734Power
Tactical0.6920.780190.6340.689Power
MALE0.9425.457240.6920.935Power
HALE-Strike0.572.4645271.1310.568Power
Table 7. Statistical data regarding the trend fitting for the empty weight as a function of GTOW plots.
R2ABnType of Fitting
All0.880.81050.9425202Power
Micro-Mini0.890.78280.966640Power
Small0.880.53071.041865Power
Tactical0.910.24641.172645Power
MALE0.850.37781.05329Power
HALE-Strike0.764.8290.7323Power
Table 8. Statistical data regarding the trend fitting for the Wp · E vs. GTOW plots.
R2ABnType of Fitting
All0.9050.3131.33202Power
Micro-Mini0.26910.2131.27140Power
Small0.4333.2970.8665Power
Tactical0.35511.1545Power
MALE0.8140.1091.53829Power
HALE-Strike0.82916.0530.82923Power
Table 9. Statistical data regarding the trend fitting for the cruise speed vs. GTOW plots.
R2ABnType of Fitting
All0.55945.6040.235202Power
Micro-Mini0.69140.4470.26645Power
Small<0.233.0060.33360Power
Tactical<0.2−0.131224.2545Linear
MALE<0.25.0090.49329Power
HALE-Strike0.866.8480.48723Power
Disclaimer/Publisher’s Note: The statements, opinions and data contained in all publications are solely those of the individual author(s) and contributor(s) and not of MDPI and/or the editor(s). MDPI and/or the editor(s) disclaim responsibility for any injury to people or property resulting from any ideas, methods, instructions or products referred to in the content.

