Abstract
The Aerospace Plane Research Center at the Muroran Institute of Technology is currently conducting research to develop enabling technologies for high-speed aircraft traveling at high altitudes and constructing experimental, small-scale, unmanned supersonic aircraft called Oowashi as a testbed for flight. To confirm the control performance of the aircraft, an experiment using a one-third-scale model of the Oowashi aircraft has been planned. The flight of high-speed aircraft always presents the problem of having to land on an ordinary runway regardless of the aircraft’s high speed at the beginning of the landing process. This paper therefore proposes a new landing control design method that can shorten the landing distance for a high-speed aircraft without increasing the rate of descent. The design method utilizes the newly clarified relationship between an angle of attack and the time constant of flare control system, which is effective to raise glideslope angle during landing. The validity of the method is confirmed by computer simulation assuming the model aircraft equivalent to a one-third-scale model of the Oowashi aircraft.
1. Introduction
In recent years, the demand for intercontinental rapid transportation has grown, as has the global demand for transportation able to orbit Earth. As a proof of those dual movements, emerging private companies are developing small or midsized rockets [1], and research agencies are working on low-noise supersonic aircraft [2]. In response to those demands, the Aerospace Plane Research Center at Muroran Institute of Technology has performed studies on the aerodynamics, propulsion, structure, and guidance control of high-speed, high-altitude aircraft to develop enabling technologies for those supersonic aircraft. Some of those technologies are to be verified using a one-third-scale Oowashi aircraft (Figure 1) as a testbed for flight.
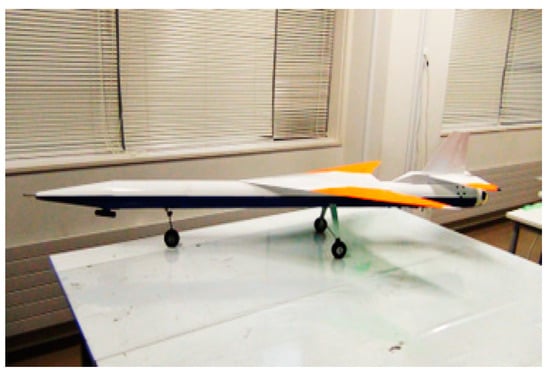
Figure 1.
One-third-scale Oowashi.
The cruise speed of one-third-scale Oowashi aircraft is designed to be around 50 m/s [3], and the high-speed aircraft should shorten the landing distance in order to land on an ordinary runway. To realize it, the speed in the landing phase should be ideally reduced to be above and near stall speed [4]. Therefore, this study aimed at developing landing technology which can shorten the air distance of landing by clarifying the relationship of angle of attack (AoA) of the aircraft with its speed.
In the field of short distance landing technology for unmanned aerial vehicles (UAVs), vertical takeoff and landing (VTOL) technologies have been extensively researched [5,6,7,8] which install lift fans or propellers for lift on wing [5] or body [6] and design examples of UAVs with tilt wings [7] or rotors [8]. The VTOL equipment such as lift fans or propellers increase the weight of UAVs. Generally, as UAVs must fly a long distance by carrying required fuel and payload, so it is suitable to develop short-distance landing technologies without increasing the weight by VTOL equipment.
As a conventional technology that achieves short-distance landing without special equipment, the deep-stall landing technology [9,10,11,12] is well known and its detailed control system is introduced in [9], and the control technology uses on-line nonlinear model predictive controller to improve the precision of maneuver of transition from level flight to deep-stall landing [10] as well as vision-assist technology to improve usability of deep-stall landing [11]. However, except the technology for UAVs where control surfaces and wing lie in the propeller flow stream [12], the deep-stall landing technologies do not take into account the method to recovery from stall. In addition, landing technology usually deals with low-speed UAVs which are to be landed on a long runway. Therefore, we have investigated short-landing technologies for high speed UAVs to descend with a large glideslope angle without stalling extra equipment, which has not been tried yet. As high speed UAVs require higher redundancy, using deep-stall landing is considered not to be suitable for high-speed UAVs.
Regardless of the problem of long landing distances, there is a considerable need to shorten the landing distance to improve the use of fixed-wing UAVs in future. To our knowledge, no study has examined short-distance landing technology considering stall AoA for design of parameter fixed-wing high-speed UAV landings despite the deep-stall. To shorten the landing distance, it is very effective to increase AoA within a limitation of stall, because higher AoA increases lifts and drags and contributes to reducing landing speeds and maintaining the descent rate. Conventionally, there are several constraints for landing parameters from characteristics of UAVs. In this article, we therefore propose a new method that will utilize a high glideslope angle and high bandwidth flare control to facilitate short-distance landing with fixed-wing UAVs. In constraints of not exceeding stall AoA, high glideslope angle and a small flare time constant enable short landing distances. At first, we have analytically clarified the limits of the glideslope angle and the flare time constant with respect to AoA. Then, the proposed method was later applied to the landings of a one-third-scale Oowashi aircraft via 6-degrees-of-freedom simulations to confirm its validity. In that simulation result, the landing distance is well reduced compared with the conventional one avoiding increase speed.
2. New Landing Control Design Method
2.1. Design Policy
As described in the previous section, a high AoA is a key design parameter to reduce landing distance while keeping ordinary descent rate. Figure 2 shows the landing profile which consists of a glideslope phase, flare phase, and rollout phase. To shorten the landing distance for a high-speed UAV, from the start of the glideslope phase to the end of the rollout, the following two steps are carried out: (1) increase of the glideslope angle and (2) pull up rapidly during flare phase while keeping the AoA within the stall AoA, as shown Figure 2. The first step requires a higher AoA. Additionally, those steps must be achieved under limitations of specified descent rate and speed. In the following subsections, the method for how to design the steps under the constraints for each phase is described.
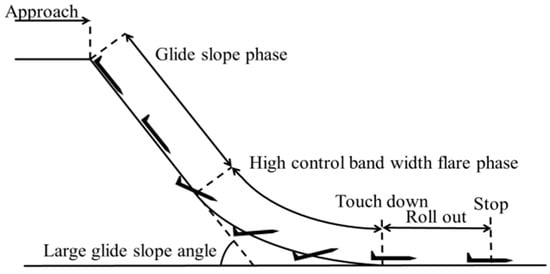
Figure 2.
Landing profile.
2.2. Longitudinal Conrol System Configuration
The longitudinal control system configured to the new design method contains a glideslope controller, flare controller, and speed controller (Figure 3). This configuration enables UAV to follow landing path via controlling AoA and flight speed by pitch controller and speed controller, respectively. The glideslope control and flare control switch at the altitude where the flare maneuver begins. The definition of the altitude where the flare maneuver begins will be described in Section 2.4. The pitch controller and speed controller in this system was configured by the ordinal PID controller. The sink-rate is calculated from the differential of height . The new design method of parameters of the glideslope controller and the flare controller will be described below.
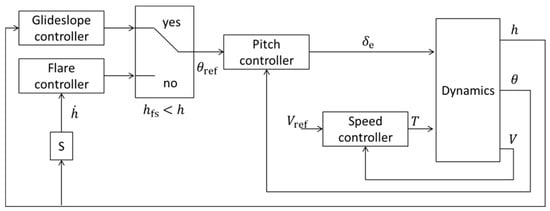
Figure 3.
Longitudinal control system.
2.3. Glideslope Controller
A glideslope path, along which the aircraft flies while descending, occupies most of the landing path. The glideslope controller is a controller which enables the UAVs following a glideslope path via making . The descent rate increases as the vertical component of the speed increases proportional to the glideslope angle, as shown in Figure 4. To reduce the descent rate, it is necessary to increase the AoA of the aircraft to reduce the total speed of the aircraft. This requires increasing of the drag. Therefore, it is very important to derive the relation between glideslope angle and drag to clarify the limit of the magnitude of the glideslope angle specified by the stall AoA. In this section, the limit of the magnitude of the glideslope angle and that which determined the limit are described.
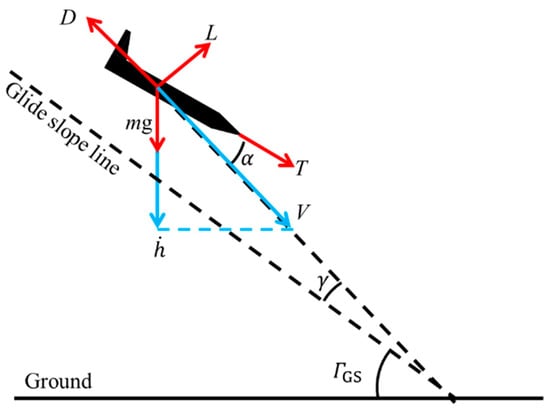
Figure 4.
Definition of angles and forces acting on UAV and vectors of V and .
In the glideslope phase, no acceleration from gravity is ideal due to maintaining the sink rate. This is the starting point of considering what and how glideslope angle is limited. The glideslope phase involves flying at a constant speed after deceleration, achieved by the operation of the speed control system, while the AoA and thrust vary during deceleration. However, since the UAV’s motion is mostly constant speed and attitude during the glideslope phase, the AoA and thrust can be considered as constant, and thus, the forces acting on UAV during the glideslope phase can be considered as being balanced. To consider the limit of the magnitude of glideslope angle which avoids an acceleration generated by gravity, it is necessary to clear the relation between glideslope angle and flight state. As the forces are in balance, for the purpose of design, we assumed the UAV to be a mass point and instead of using the 6 degrees of freedom equations of motion, we employed the 3 degrees of freedom equations of motion to deal with the glideslope angle, angle of attack, and balance of forces. Equation (1) is validated by the force balance shown in Figure 4 under the condition of constant flight speed. From Equation (1), it is clear that the drag D and part of thrust T are resisting the acceleration generated by gravity. Therefore, in this study, the glideslope angle is assumed to be limited by the stall AoA because the drag is limited by the stall AoA. A quantitative proof of that from an analytical way is below.
When calculating constant flight speed motion, lift-and-drag force is expressed as in Equations (2) and (3) and by considering zero lift angle as being significantly small.
When Equations (2) and (3) are substituted for Equation (1), Equation (4) computes the relationship between the glideslope angle and the AoA for constant flight speed motion along the glideslope line of that angle.
Equation (5) is the derivative of Equation (4) with respect to the AoA. Under the condition of Equation (6), Equation (5) cannot be negative. The condition of Equation (6) is the limitation of this method. However, in the glideslope phase, mostly the difference of drag and thrust is lower than gravity so that the condition of Equation (6) is considered as acceptable.
Because the AoA cannot be larger than the stall AoA, , the condition of Equation (7) is established according to the relationship in Equation (4) and the tendency to need large AoA for large glideslope angle , as shown in Equation (5).
In practical terms, the relation between lift and AoA is nonlinear at high AoA. Thus, to determine the glideslope angle, it is necessary to determine nominal AoA during glideslope phase, , and during glideslope from the UAV’s specification. From this necessity, the glideslope angle is determined as in Equation (8).
2.4. Flare Controller
The flare control pulls up the aircraft before it touches down on the ground. To shorten the length in the flare phase, it is necessary to pull up the aircraft faster. This study deals with the flare control system as shown in Figure 5, in which the flare time constant τ is a design parameter [4]. In this section, it will be described that the small flare time constant is necessary for faster pull up and what limits the smallness of the flare time constant. In addition, represents time from when the flare phase starts. In this section also consider the motion of UAV as a motion of mass point and using 3 degrees of freedom equation of motion.

Figure 5.
Flare control system.
This flare control system uses its present height and flare time constant τ as a descent rate as shown in Equation (9).
As the path angle is equal to at the time when the flare starts, from Equation (9), the height where the flare phase starts is assumed as Equation (10) from using the relationship between , , and τ, as shown in Equation (9). Thus, the height during the flare phase is assumed as Equation (11). Equation (11) explains when the flare time constant is smaller and the UAV touches down faster.
In the flare phase, the path angle of UAV is vectored gradually along the flare path. The path angle of the UAV can be vectored by changing the force applied to the UAV in the vertical direction. Thus, the flare time constant is limited by stall AoA because the lift is limited by stall AoA. How the flare time constant is limited by stall AoA will be described below. At first, the motion can be calculated with Equation (12) by using determined as in Equation (13).
The vertical acceleration is calculated with Equation (14).
Next, by substituting Equation (12) for Equation (13), Equation (15) is derived, and then, by substituting Equation (14) for Equation (15), Equation (16) is derived. Because represents a vertical acceleration, is in the denominator of the left side of Equations (15)–(17).
By considering the lift force to be a function of the AoA (Equation (2)), the relationship between the AoA and the flare time constant during the flare can be determined, as shown in Equation (18), which refers to Equations (2) and (17).
Equation (18) can be converted to Equation (19) by way of Equation (12).
From Equation (19), the AoA at the flare phase start is largest, as shown in Figure 6, and that AoA is derived as in Equation (20). Equation (20) is derived from introducing to Equation (19).
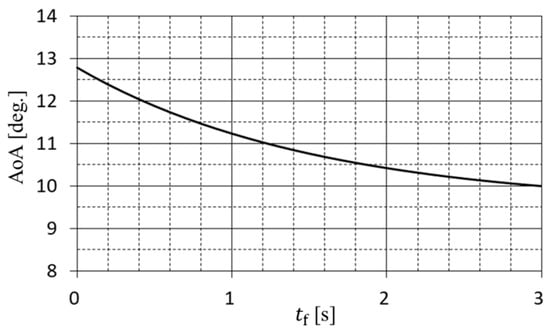
Figure 6.
Estimated AoA versus flare time for one-third-scale Oowashi using Equation (19) at .
By calculation, the stall AoA determines the minimum flare time constant , as shown in Equation (21). In the same way as the needs to set , it is necessary to set to determine . In this term, the tale down angle is considered.
2.5. Designe Procedure
The relationship between the AoA, , and were shown to be constrained by the stall AoA, and these values can be designed by setting the AoA during landing, . Next, the design procedure of the landing control system using these relationships is presented. The general steps in the design process are as follows, and each step is described below (Figure 7).
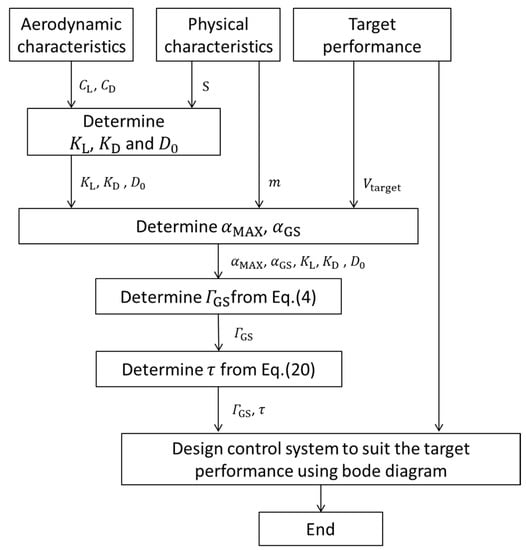
Figure 7.
Design procedure.
- Identify the aerodynamic and physical characteristics via measurement or estimation from the analytical methods.
- Design target performance from mission requirement or acceptable load at touch down.
- Determine , and as in Equations (2) and (3) by introducing the aerodynamic characteristics and the physical characteristics of UAV.
- Determine and from aerodynamic characteristics and the physical characteristics of UAV.
- Design using Equation (4) by introducing the parameters determined in previous step.
- Design using Equation (20) by introducing the parameters determined in previous step.
- Design control systems which configure the longitudinal control system shown in Figure 3 to meet the target performance.
2.5.1. Determine and
Equations (4) and (21) indicate the and must be determined to calculate the and . Therefore, the and should be within a margin from the marginal AoA that can be taken according to the aircraft characteristics, such as the stall AoA, in the range of AoA in which the lift curves linearly, and the tale down angle and the AoA of the roll reversal occur.
2.5.2. Design and
Equations (4) and (21) indicate that the must be determined before determining the flare time constant. The is designed by substituting the into Equation (4); then, by substituting the and into Equation (21), τ is designed sequentially.
2.5.3. Control System Design
The GS control system and flare control system should be designed to follow the set path and meet the target performance. Additionally, the pitch control system and speed control system should be designed by bode diagram to be stable and meet the target performance.
3. Design
The proposed method is applied to a one-third-scale Oowashi model shown in Figure 8 and later is confirmed by using computer simulations.
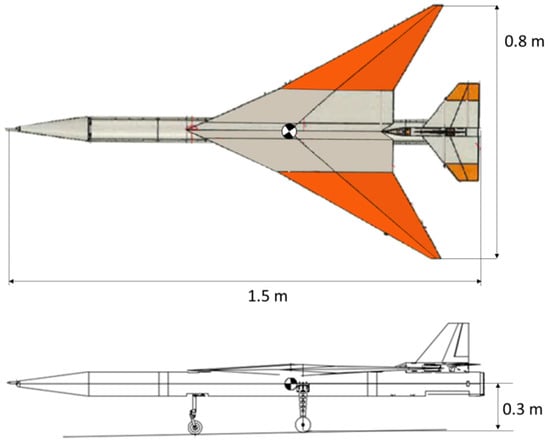
Figure 8.
Horizontal and side view of one-third Oowashi.
3.1. Specifications of a One-Third-Scale Oowashi
The specifications of the one-third-scale Oowashi model are shown in Table 1 and Table 2. The aerodynamic parameters were measured by wind tunnel test.

Table 1.
Physical parameters of the one-third-scale Oowashi.

Table 2.
Aerodynamic parameters of the one-third-scale Oowashi.
3.2. Target Performance
The target performance of the landing control system for the one-third-scale Oowashi is shown in Table 3. From the experience of flight tests of lower cruising speed UAVs [3], the velocity of touch down is set to 25 m/s as a realistic value. In this simulation, the speed of the one-third Oowashi is reduced from 50 m/s to 25 m/s before the landing sequence. The target performance of the sink rate at touch down is defined by referring to the experimental flight of lower cruising speed UAV [3].

Table 3.
Target performance.
3.3. Design result
Since is time-varying by the speed controller and impossible to accurately determine, it was assumed that is balanced with . , and are calculated from specifications in Table 1 and Table 2.
From the parameters of Table 4, the and are designed as in Table 5 by the design procedure shown in Figure 7. The is larger than is conventional; it is around 3–5 deg. The is smaller than is conventional; it is around 2–5 s.

Table 4.
Parameters used for design.

Table 5.
Design result.
4. Simulation
To validate the effectiveness of the proposed design method which takes into account AoA, the 6-degrees-of-freedom simulations were carried out and were configured as a rigid body model on SimuLink. Simulation conditions are shown in Table 6 and were imported to the simulation. These are defined by referring to experimental flight. In addition, the cross wind, gust, and ground effect are not introduced to verify the validity of the design method only. The observed values such as height, speed, and angles of attitude on the simulation contain noise which is based on the characteristics of the sensors which were introduced to the one-third Oowashi.

Table 6.
Simulation conditions.
4.1. Simulation Cases
The two cases of simulations delineated in Table 7 were carried out in order to compare the performance of conventional design and newer design by the proposed method. Case 1 () was compatible with conventional design, whereas Case 2 () was compatible with a newer design from the proposed method.

Table 7.
Conditions of simulation for cases 1 and 2.
4.2. Simulation Results
The simulations of the proposed system confirmed the target performance shown in Table 3. Figure 9 presents the longitudinal profile. The simulations showed that the control system designed according to the proposed method could greatly reduce the landing distance from 1106 m to 308 m.
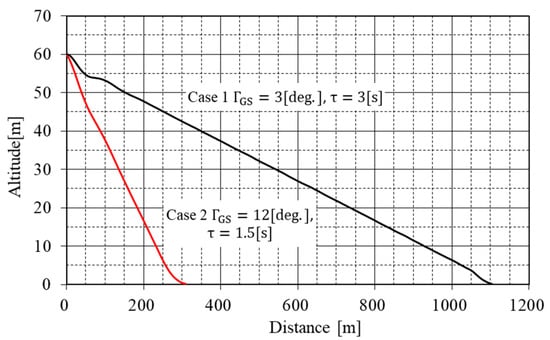
Figure 9.
Vertical flight path.
Figure 10a presents the descent-rate profile, while Figure 10b presents the velocity profile. From Figure 10a,b, the descent rate at touch down is 0.3 m/s and velocity is maintained at nearly 25 m/s during landing, and both of these are in the range of target performance. These results show that despite the increase in from 3 deg. to 10 deg., the glideslope control worked very well while preventing acceleration, and the descent rate was suppressed to within the target value by flare control.
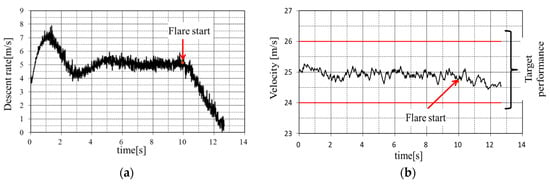
Figure 10.
(a) Descent-rate profile; (b) velocity profile.
Lastly, Figure 11 shows that the AoA of the one-third-scale Oowashi never exceeded the stall AoA of 16 deg. and the margin from the stall AoA was 1 deg. The simulation results presented here are based on a 6-degrees-of-freedom simulation, in which the UAV’s motion is described by the 6 degrees of freedom equations of motion. Therefore, in this simulation, not only the vertical motion but also the lateral motion is simulated. The cross-wind and ground effect were not considered in the design, and to take them into account, it is necessary to confirm the variation of the AoA using a 6-degrees-of-freedom simulation that includes these effects. The results of the confirmation showed that no countermeasures are necessary as long as the AoA does not exceed the stalling AoA. However, if it does exceed the stalling AoA, countermeasures are required. To address this, it is necessary to decrease the AoA during flight, and since the maximum AoA during landing is reached at the beginning of the flare control, increasing the flare time constant is considered to be effective. In addition, though this system does not control AoA, the AoA during the glideslope phase is converged to 10 deg., which is equal to . This also shows the validity of the proposed glideslope angle design method.
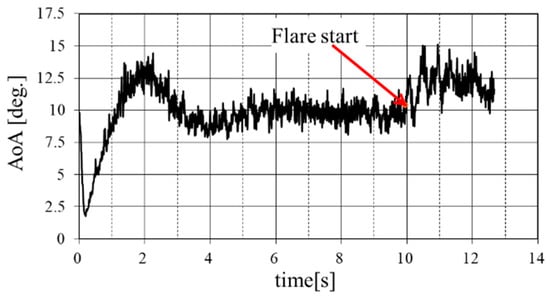
Figure 11.
AoA profile.
From the simulation results, it is confirmed that the performance of the landing control system designed according to the proposed method met the target performance completely.
5. Conclusions
From the results presented in the previous section, the proposed method worked very well, as intended. The simulations confirmed that it is possible to greatly reduce land-ing distances with the method and that the landing control system during glideslope phase maintained an AoA of 10 deg., within maximum AoA, and contributed to maintaining airspeed at 25 m/s and that the time constant during flare phase was maintained at the limited descent rate of 1 m/s without exceeding the stall AoA. The conclusion of this paper is that it is possible to design larger glideslope angle and smaller flare time constant by determining the maximum or nominal AoA in each phase to shorten the landing distance. In the future, a flight experiment using conventional fixed-wing UAVs with the weight, wingspan, and length around 6 kg, 2 m, and 2 m, respectively. After that, the flight experiment using the one-third-scale Oowashi will be conducted to prove the validity of the method.
Author Contributions
Conceptualization, S.H.; Resources, M.U.; Writing–original draft, S.H.; Writing–review & editing, M.U.; Supervision, M.U. All authors have read and agreed to the published version of the manuscript.
Funding
This research and the APC was funded by Aerospace Plane Research Center (APReC), Muroran Institute of Technology.
Data Availability Statement
Due to the research project of Oowashi of APReC is ongoing, no data could share.
Conflicts of Interest
The authors declare no conflict of interest.
Nomenclature
| acceleration, m/s2 | |
| drag, N | |
| gravitational acceleration, m/ s2 | |
| height, m | |
| lift per unit AoA, N/rad | |
| drag per unit AoA, N/rad2 | |
| lift, N | |
| mass, kg | |
| thrust, N | |
| time from flare start, s | |
| velocity, m/s | |
| angle of attack, rad | |
| error of path angle, rad | |
| path angle, rad | |
| pitch angle, rad | |
| flare time constant, s | |
| Subscripts | |
| f | flare |
| fs | flare start |
| GS | glideslope |
| target | target performance |
| MAX | maximum |
| min | minimum |
References
- Rocket Lab. Available online: https://www.rocketlabusa.com/ (accessed on 4 January 2022).
- NASA X-59. Available online: https://www.nasa.gov/X59 (accessed on 4 January 2022).
- Ueba, M.; Kamata, T.; Nakajima, S.; Maeda, Y. Verification of Fully Autonomous Flight from Takeoff to Landing of a Low-Speed Model Airplane with Application to a Small Unmanned Supersonic Airplane. Trans. Jpn. Soc. Aeronaut. Space Sci. Aerosp. Technol. Jpn. 2021, 19, 667–675. [Google Scholar] [CrossRef]
- Bandu, N.P. Performance, Stability, Dynamics, and Control of Airplanes, 3rd ed.; AIAA: Reston, VA, USA, 2015. [Google Scholar]
- Dündar, M.; Bilici, T. Ünler, Design and performance analyses of a fixed wing battery VTOL UAV. Eng. Sci. Technol. Int. J. 2020, 23, 1182–1193. [Google Scholar]
- Wang, C.; Zhou, Z.; Wang, R. Research on Dynamic Modeling and Transition Flight Strategy of VTOL UAV. Appl. Sci. 2019, 9, 4937. [Google Scholar] [CrossRef]
- Misra, A.; Jayachandran, S.; Kenche, S.; Katoch, A.; Suresh, A.; Gundabattini, E.; Selvaraj, S.K.; Legesse, A.A. A Review on Vertical Take-Off and Landing (VTOL) Tilt-Rotor and Tilt Wing Unmanned Aerial Vehicles (UAVs). J. Eng. 2022, 2022, 1803638. [Google Scholar] [CrossRef]
- Cetinsoy, E.; Dikyar, S.; Hancer, C.; Oner, K.; Sirimoglu, E.; Unel, M.; Aksit, M. Design and construction of a novel quad tilt-wing UAV. Mechatronics 2012, 22, 723–745. [Google Scholar] [CrossRef]
- Yayli, U.C.; Kimet, C.; Duru, A.; Cetir, O.; Torun, U.; Aydogan, A.C.; Padmanaban, S.; Ertas, A.H. Design optimization of a fixed wing aircraft. Adv. Aircr. Spacecr. Sci. 2017, 4, 65–80. [Google Scholar] [CrossRef]
- Mathisen, S.; Gryte, K.; Gros, S.; Johansen, T.A. Precision Deep-Stall Landing of Fixed-Wing UAVs Using Nonlinear Model Predictive Control. J. Intell. Robot. Syst. 2021, 101, 24. [Google Scholar] [CrossRef]
- Kim, D.; Park, S. Vision-assisted deep stall landing for a fixed-wing UAV. J. Field Robot. 2022, 39, 1136–1150. [Google Scholar] [CrossRef]
- Paranjape, A.A. Steady Deep Stall Landings Using Lifting Surfaces in Propeller Flow and Wing Articulation. In Proceedings of the AIAA SCITECH 2022 Forum, San Diego, CA, USA, 3–7 January 2022. [Google Scholar] [CrossRef]
Disclaimer/Publisher’s Note: The statements, opinions and data contained in all publications are solely those of the individual author(s) and contributor(s) and not of MDPI and/or the editor(s). MDPI and/or the editor(s) disclaim responsibility for any injury to people or property resulting from any ideas, methods, instructions or products referred to in the content. |
© 2023 by the authors. Licensee MDPI, Basel, Switzerland. This article is an open access article distributed under the terms and conditions of the Creative Commons Attribution (CC BY) license (https://creativecommons.org/licenses/by/4.0/).