Article

Understanding the Early Stage of Planet Formation: Design and Demonstration of the Space Experimental Apparatus

1
School of Aeronautic Science and Engineering, Beihang University, Beijing 100191, China
2
School of Aerospace Engineering, Tsinghua University, Beijing 100084, China
*
Author to whom correspondence should be addressed.
Aerospace 2023, 10(3), 285; https://doi.org/10.3390/aerospace10030285
Submission received: 20 January 2023 / Revised: 28 February 2023 / Accepted: 7 March 2023 / Published: 13 March 2023
(This article belongs to the Special Issue Dynamics and Control Problems on Asteroid Explorations)

Abstract

:
Planet formation begins with the collision and growth of dust in protoplanetary disks. Concerning the basic cognition of the early stage of planet formation, a long-standing weakness of the research is a comprehensive physical model describing the collisional evolution of dust particles. Microgravity experiments providing original data are crucial in developing related theories. In this work, we propose an experimental scheme for observing the collisional growth of dust analogues under a unidirectional and continuous shearing process, aiming at a future implementation in space experiments. The experimental process is simulated using the discrete element method, and the atlas of the design parameter versus the evolutionary path is depicted. We notice fractal structures and growth stalling as remarkable outcomes in the process of collisional growth, which is analogous to the evolutionary mechanism in the ancient protoplanetary disks. Based on these phenomena, we determine the sensitive design parameters, i.e., the shear velocity and the filling factor, which serve as the recommended parameters in future space experiments. The validation using numerical experiments shows that the experimental scheme with proper design parameters is feasible, which promises to generate constructive data that will facilitate the development of planet formation theory.

1. Introduction

Understanding and reconstructing the planet formation process has long been a splendid goal for planetary scientists. While the initial and final stages of this process, represented by dust in protoplanetary disks [1] and exoplanets [2], respectively, can be observed using cutting-edge techniques, the intermediate phases pose many enigmatic questions that cannot be resolved by observations and even in situ explorations. Numerical simulations and experiments are imperative for developing and refining planet formation models. Based on previous research, a sketch of the planet formation model has been preliminarily drawn: beginning with the collisional and sticking growth of micrometer-sized dust particles, subsequent collisions of dust aggregates lead to compaction and pebble-sized aggregates can form through coagulation, which could be more resistant to the headwinds than smaller aggregates; the collision velocity increases with the size of the aggregates, resulting in growth stalling, bouncing barrier, further possible erosion, fragmentation, and mass transfer; on the basis of the formation of kilometer-sized planetesimals and planetesimal/pebble accretion, the planetary embryos would come into existence, which are possible to evolve into terrestrial planets or gas giants [3,4,5]. However, many details pertaining to each step remain incomplete and require enrichment [5,6,7]. In this work, we focus on the first stage of planet formation, i.e., the dust processes.
Evidence recording dust coagulation exists in the solar system. Comets and asteroids, serving as a record of early solar system history, preserve primitive materials from the time of the solar system’s birth [8,9]. Spacecraft Rosetta rendezvoused with comet 67P/Churyumov–Gerasimenko (hereafter 67P) in 2014 and revealed the morphology and structure of cometary dust particles in unprecedented detail through its lander and scientific instruments [10,11]. The images captured using the instrument COSIMA and MIDAS show that dust particles consist of highly porous aggregates of smaller grains, with porosity of at least 60 % [12,13]. The porosity of dust aggregates could be characterized by the fractal dimension D f , which typically ranges from less than to close to 3, and, in the case of certain fluffy aggregates from 67P, less than 2, according to the data collected by Rosetta, [11,14]. Coincidentally, asteroid missions in recent years, such as Hayabusa2 to asteroid 162173 Ryugu [15] and OSIRIS-REx to asteroid 101955 Bennu [16], uncovered that many asteroids are gravitationally aggregating rubble piles and are rich in chondrules, which are believed to have formed through the rapid melting and rapid cooling of dust aggregates [17,18]. The pristine materials contained in comets and asteroids prove the episode of dust agglomeration in the accretion disks and provide Supplementary Information about the properties of aggregates.
Theoretical and experimental investigations, combining observation evidence, have demonstrated that micrometer-sized dust grains growing to centimeter-sized pebbles is ubiquitous in protoplanetary disks [19,20]. Furthermore, further pebble growth is constrained due to either bouncing/fragmentation in the inner disk region or the radial drift in the outer disk region [21]. In the context of the dust processes in protoplanetary disks, various experiments and calculations have been conducted to study the statistics and physics of dust–aggregate collision and growth. Wurm and Blum [22,23] observed the formation of fractal aggregates, the ballistic cluster–cluster aggregation without restructuring, and the impact of fractal aggregates onto solid targets with compaction using laboratory experiments, providing the mass-size relation of fractal aggregates and the effective range of collision velocity. Furthermore, the third process was repeated in the drop tower, which brought a different collision velocity–behaviour atlas due to avoiding Earth’s gravitational pull. Kelling et al. and Kruss et al. [24,25,26] studied the two-dimensional collisions of ensembles of dust aggregates using gas-levitating techniques to counteract Earth’s gravity, showing the millimeter-sized aggregate–aggregate contact instability, the growth stalling, and the possible path to overcome the bouncing barrier. Lasue et al. [12] developed numerical simulations of aggregate impact flattening in a wide range of interparticle cohesive strength and explained the morphologies of dust aggregates observed by Rosetta and other laboratory experiments. Therefore, the experiments in lasting and stable microgravity conditions and numerical simulations are of great significance for promoting the development of early dust processes in protoplanetary disks.
In this work, we proposed a scheme to conduct microgravity experiments for observing the collision and growth of dust analogues onboard, which is verified to be practical through numerical simulations using the discrete element method (DEM). Specifically, a Taylor–Couette shear cell (an annular shear cell) is designed to provide a velocity gradient, i.e., the source of collision velocity, to floating particles between the shearing walls. Cameras would capture the collisional evolution of particles from different perspectives. Using DEM simulations, we observed the significant evolutionary behaviour of sheared granular materials relating to the dust evolution during the early stage of planet formation and determined important design parameters for space experiments. The structure of this paper is as follows. Section 2 describes the details of the experimental design, which considers the conditions and requirements of spaceflights as much as possible. In Section 3, we introduce the DEM code, simulation setup, and results regarding the evolutionary scenarios of particles under different design parameters. Two remarkable phenomena relevant to the real dust process are noticed and discussed. Section 4 presents the appropriate design parameters for space experiments and prospects the potential of analogue experiments for future investigations into the earliest phases of planet formation.

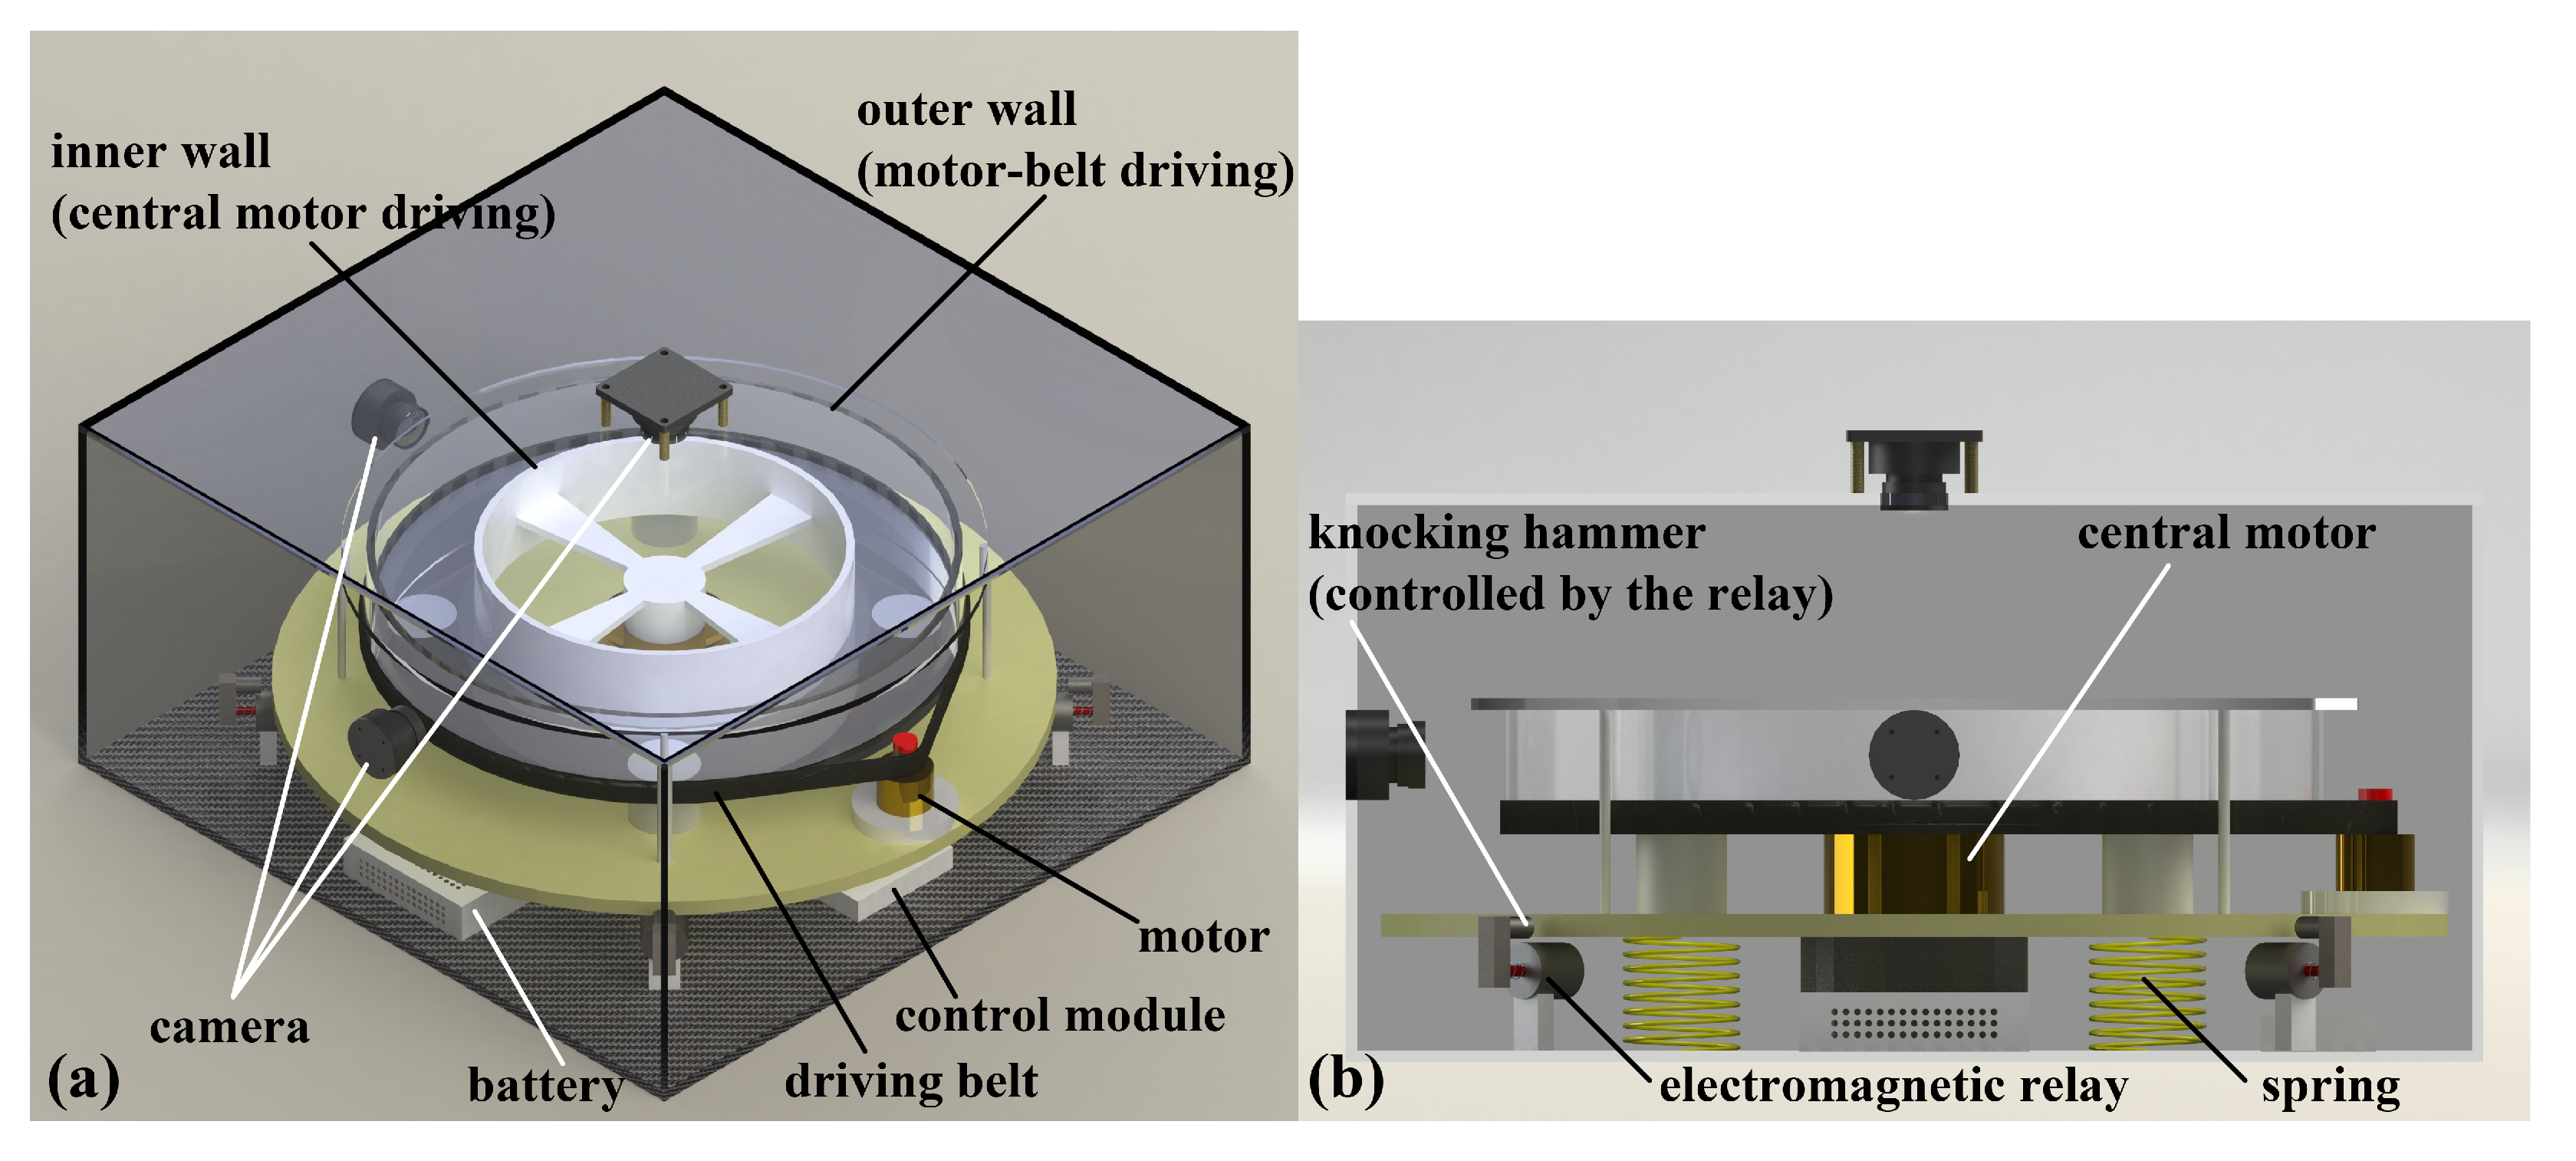
2. Experimental Design

In this section, the scheme of experimental design aiming at being deployed in a space station is described. Our design employs a Taylor–Couette shear cell to apply shear load to dust analogues, a kind of granular matter in dilute regimes. In real scenarios of protoplanetary disk evolution, various factors facilitate the mutual collisions of dust particles, such as Kepler velocity shear, radial drift, vertical settling, and gas turbulence [5]. The experimental scheme in this work aims to mimic the collisional evolution of dust aggregates induced by differential drift in protoplanetary disks. In our scheme, the shear load is designed to render particles in a velocity-gradient regime to ensure sufficient particle collisions. Furthermore, the annular cell is the only feasible way to provide unidirectional and continuous shear load in a confined space. Particles are injected into the gap between the inner and outer cylindraceous walls (with radii of 100 mm and 150 mm, respectively) and are subjected to the shear action induced by the difference in the rotational speeds of the two walls, as shown in Figure 1. The outer wall is driven by the motor-belt transmission, and the inner wall is propelled by the bridge arms connected to the central motor. The rotational speed signals of the two driven motors are generated from the control module. Considering the microgravity condition in space, the apparatus materials should be lightweight to avoid too strong an attraction to the floating granular matter, and be concurrently convenient for observation. For example, print the inner wall and the bottom disc using light-colored Acrylonitrile Butadiene Styrene (ABS) and process the outer wall and the top lid using transparent acrylic material. Three high-resolution and high-speed cameras are set to record the behaviour of the sheared granular matter from different perspectives [see Figure 1a].
Concerning the candidate granular materials of dust analogues, SiO 2 is suggested, which has similar compositions to dust particles in protoplanetary disks and has been adopted widely in previous microgravity experiments related to the early stage of planet formation [23,26,27]. Different from previous dust aggregating experiments, we aim to observe the large-scale collisional behavior of from thousands to tens of thousands of particles in the annular region, including the further interaction of particle clusters. The diameter of the dust particle monomer is usually micrometer-sized in protoplanetary disks. However, it is a huge challenge for us to use micrometer-sized dust particles as the granular matter in an onboard experimental design for a space station. Shrinking the annular shear device to match micrometer-sized particles would pose challenges in the mechanical design and manufacture. Furthermore, dust monomers in this scale easily attach to the walls due to either electrostatic adsorption or gravitational attraction. Besides, photomicrographic apparatus is required to capture the morphology and structure of dust aggregates in micrometer scales, and they typically have a small field of view and are insufficient for monitoring the large-scale dust collision and growth processes. Synthetically considering the experimental constraints and pre-simulation results, we fix the diameter of dust analogues at 1 mm. As shown in Section 3, the features of particle agglomeration in millimeter-particle simulations share normalized similarities with previous small-scale experiments with micron-scale particle monomers, such as the fractal dimension. Therefore, we speculate that using 1 mm dust analogues in the experiment can achieve effects similar to those of actual dust processes in protoplanetary disks and magnify these processes visually. In the granular cabin, keep the gas pressure in the range of 100–200 Pa, which is mandatory for planet formation experiments [5]. From the perspective of granular sticking properties, the cohesive force between mutual contacting particles, induced by the van der Waals forces between individual molecules within each grain, would play a critical role in the hit-and-stick process of dust particles in the proper pressure range. Because a rarefied gas environment compared with Earth’s atmosphere could significantly decrease the minimum distance between particle surfaces, leading to more substantial cohesive effects [28,29]. Based on this experimental design, we conduct extensive numerical experiments to explore the evolutionary paths of sheared dilute granular matter under different design parameters to find the appropriate parameter combination for space experiments. The design parameters, such as the rotational speeds of the inner and outer walls, the physical properties, and the filling factor of particles, are mainly considered in numerical simulations, which are described in detail in Section 3.
However, particles inevitably move toward the outer wall due to the centrifugal effect when shifting circularly; meanwhile, the particles tend to attach to the inner and outer walls because of the gravitation. Both cause the shear action to be inefficient. As shown in Figure 1, four knocking hammers controlled by the electromagnetic relays are designed to expel the particles attaching to the walls. The knocking–expelling mechanism, i.e., applying pulsing knocking loads on the shear cell to render the particles leave the walls, has also been numerically simulated to determine the proper timing and patterns of knocking.

3. Numerical Experiments

In this section, we briefly introduce the simulation tool DEMBody and important material parameters of particles. Then, the general simulation setup and two design parameters to determine the experimental scheme are acquainted. The results section illustrates the evolutionary paths of particle collision and growth under different parameter combinations, including the physical descriptions and classification principles of different evolutionary scenarios. Furthermore, two significant phenomena are specified: fractal structure and growth stalling. Finally, we exhibit the effects of expelling the particles and agglomerates attaching to the walls by impulsive knocking loads.

3.1. Method and Tool

In this work, the numerical experiments are performed using an original code, DEMBody, which is based on the soft-sphere discrete element method (SSDEM) [30,31,32]. This code is developed for planetary science and geophysics and has been employed for reconstructing the evolutionary history of morphologies and landforms of solar system small bodies whose results have a high degree of coincidence with the observations [33,34,35]. The regolith materials of small bodies, i.e., a kind of granular matter with a diameter from micrometer to meter [36,37], possess similar compositions and mechanical properties with dust particles in protoplanetary disks. Therefore, DEMBody could also accurately model the dynamical behaviour of the particles in the space experiments we designed.
DEMBody calculates the nonlinear contact forces between the two contacting objects (particle–particle or particle–boundary) on the basis of Hertz–Mindlin–Deresiewicz contact theory [38] according to the particle overlaps (typically <1% of their reduced radii). The forces between contacting particles include normal and tangential viscoelastic force, rolling and twisting friction, and cohesive force. A friction coefficient μ controls the stick–slip Coulomb friction between colliding particles, and a shape parameter β , representing a statistical measure of real particle nonsphericity, controls the rotational resistance to relative motions in rolling and twisting directions [39]. To describe the interparticle van der Waals attraction, a dry cohesion model based on the granular bridge idea [40,41] is adopted and the interparticle cohesive strength c is used to parameterize the physical properties of the grains, such as the porosity, surface energy, and Hamaker constants [36,40,42]. The implementation of SSDEM in DEMBody finally narrows the material parameter space down to three: μ , β , and c, which characterize the sliding resistance strength, the rotational resistance strength, and the cohesive strength of contacting particles. In the following numerical experiments, μ = 0.8 and β = 0.8 , respectively, are chosen in terms of the properties of sand particles [43,44]. Furthermore, c ranges from 0 to 100 Pa to adjust the material cohesion, which is determined according to the microgravity level, the particle size, and the particle cleanliness ratio [28,29].

3.2. Simulation Setup

In the simulations, we set up the experimental process of shearing the dilute granular matter as two triangulate-meshed rotating annular walls with reverse rotational directions and free particles with initial velocity on the order of millimeters per second, as shown in Figure 2. The mono-layer and mono-disperse particles are set in the annular region for more apparent observation. In terms of the previous research [3,45], the outcomes of collisional evolution highly depend on the monomer–particle diameter, filling factor, collision velocity, etc. The filling factor ϕ in the simulation setup is defined as the ratio of the sum of the particle volume to the granular cabin volume (for mono-layer particle setup, the height of the granular cabin is set as the diameter of the particle monomer). In the experimental design, the magnitude of the collision velocity is indirectly influenced by the rotational speeds of the two walls. Here, we define the shear velocity v s = ω 1 R 1 ω 2 R 2 as one of the design parameters. We fix the monomer–particle diameter at 1 mm and then explore the collisional evolution in the parameter space spanned by the filling factor ϕ and the shear velocity v s .

3.3. Results

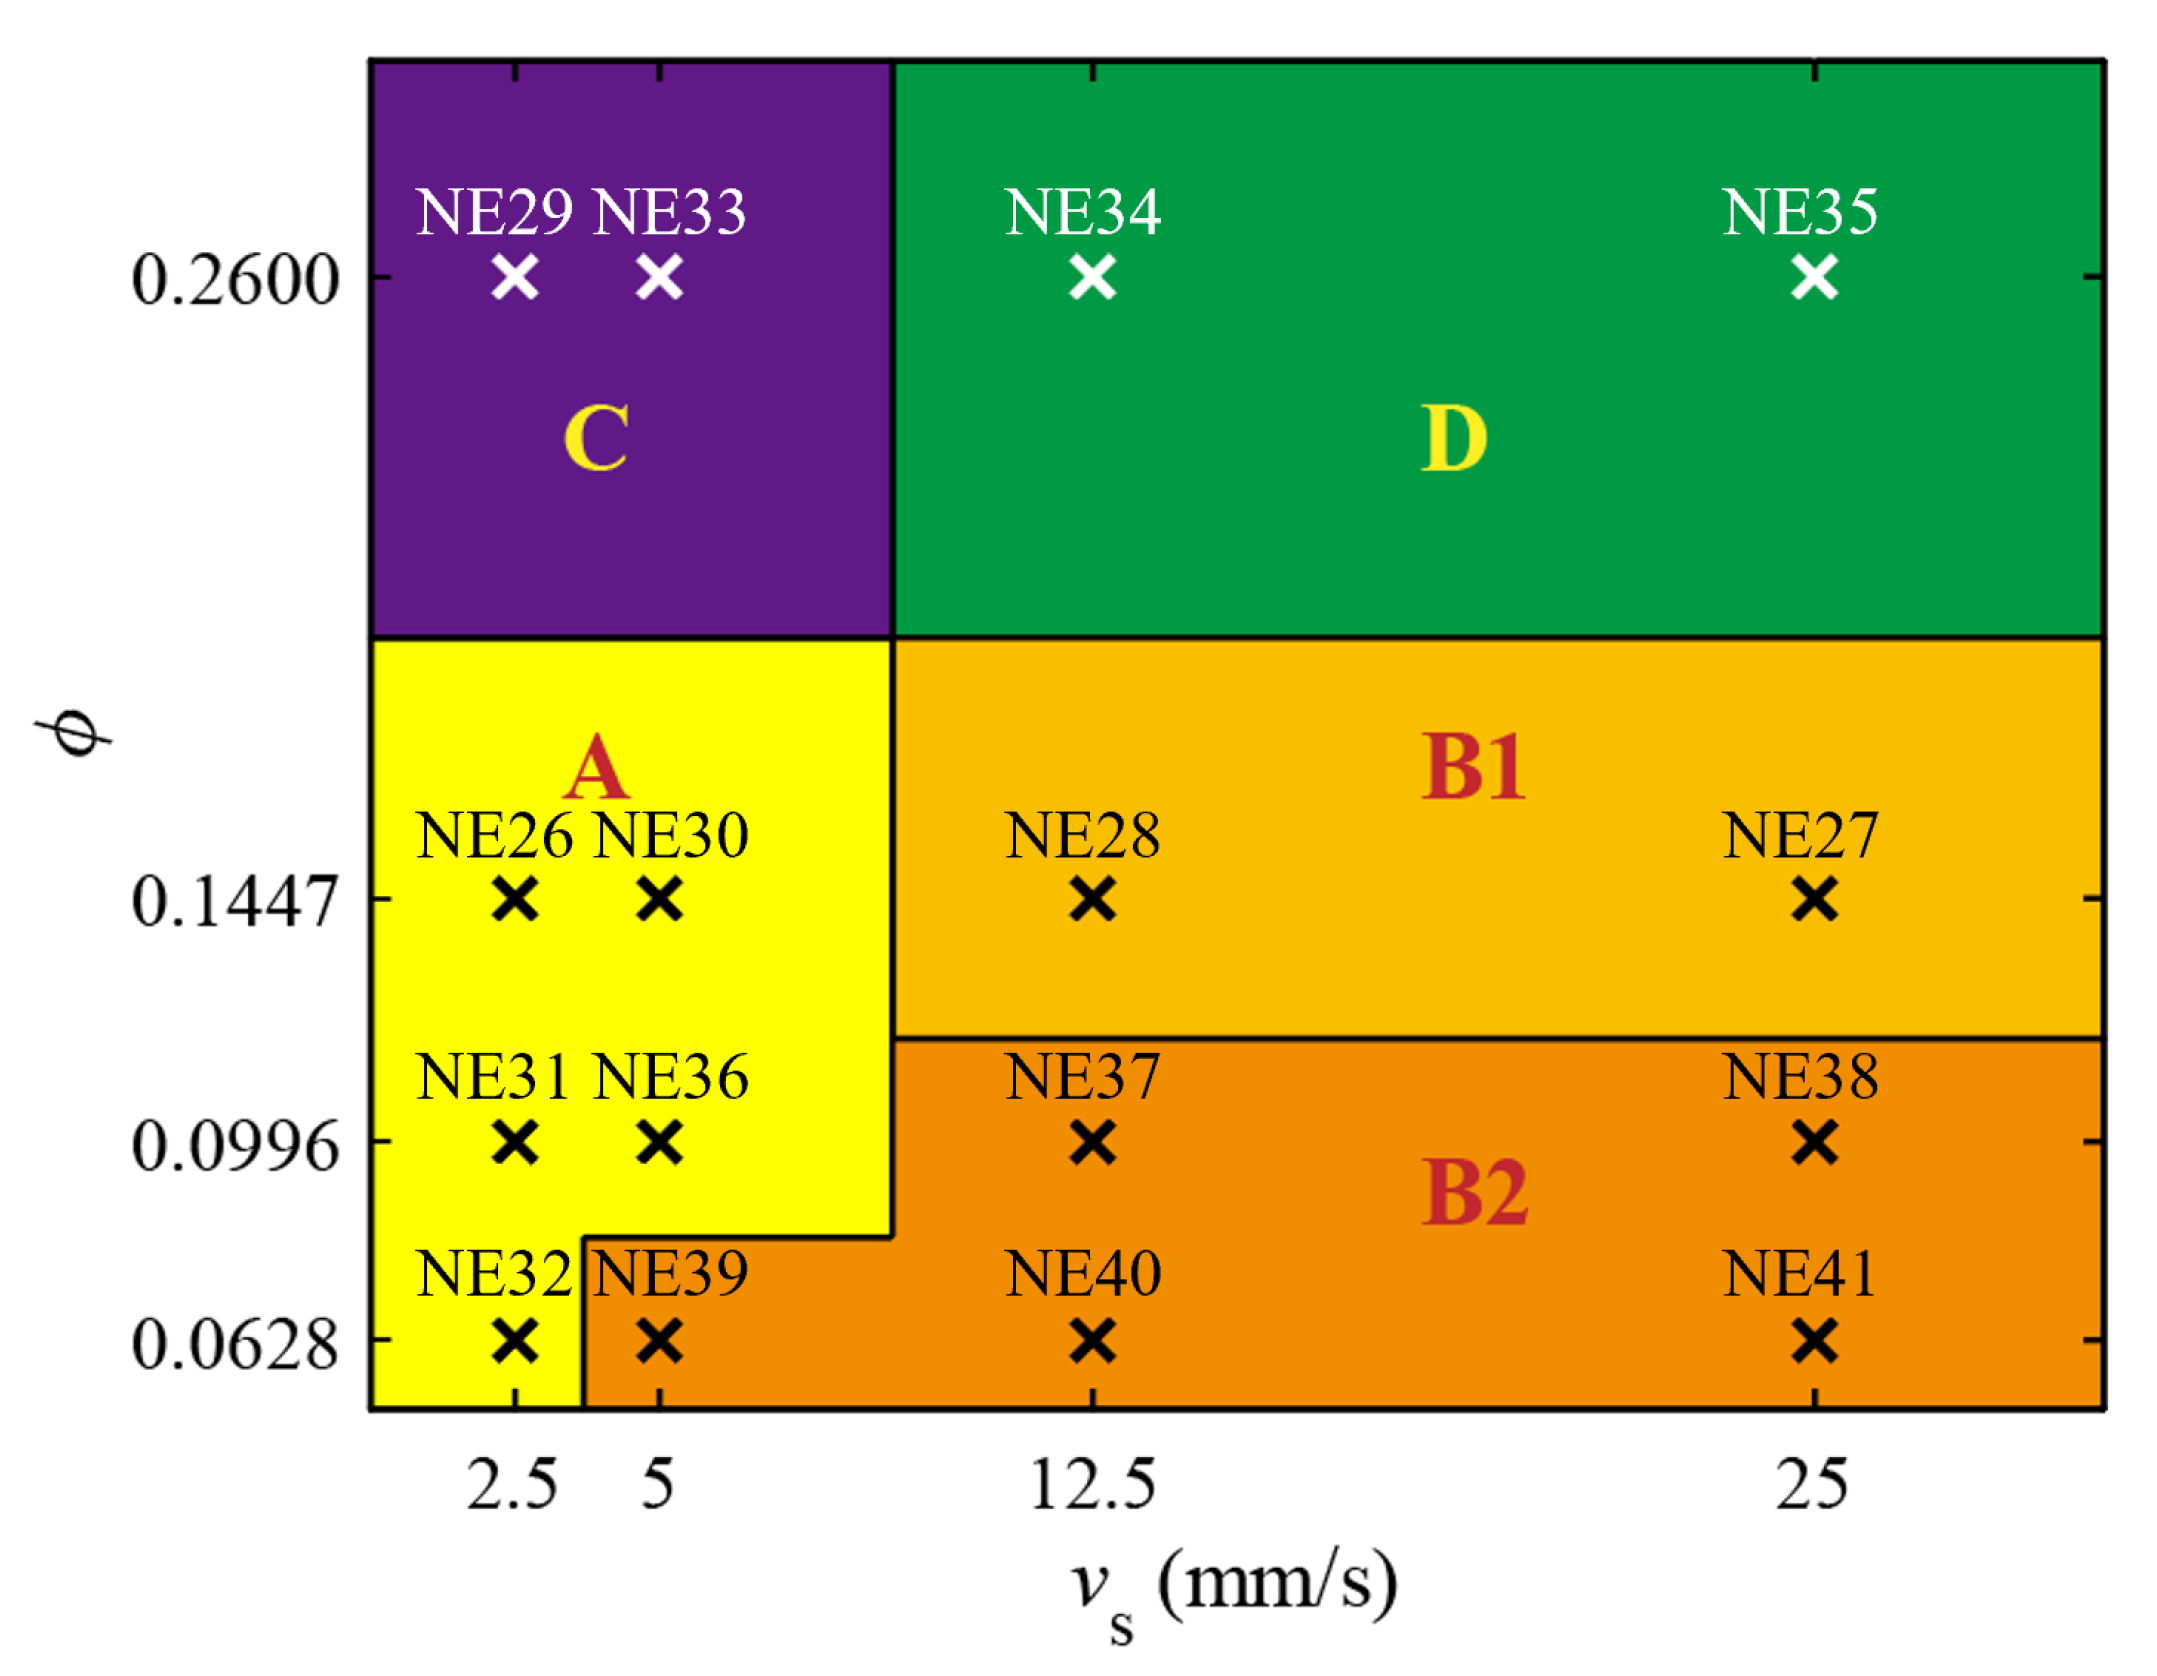
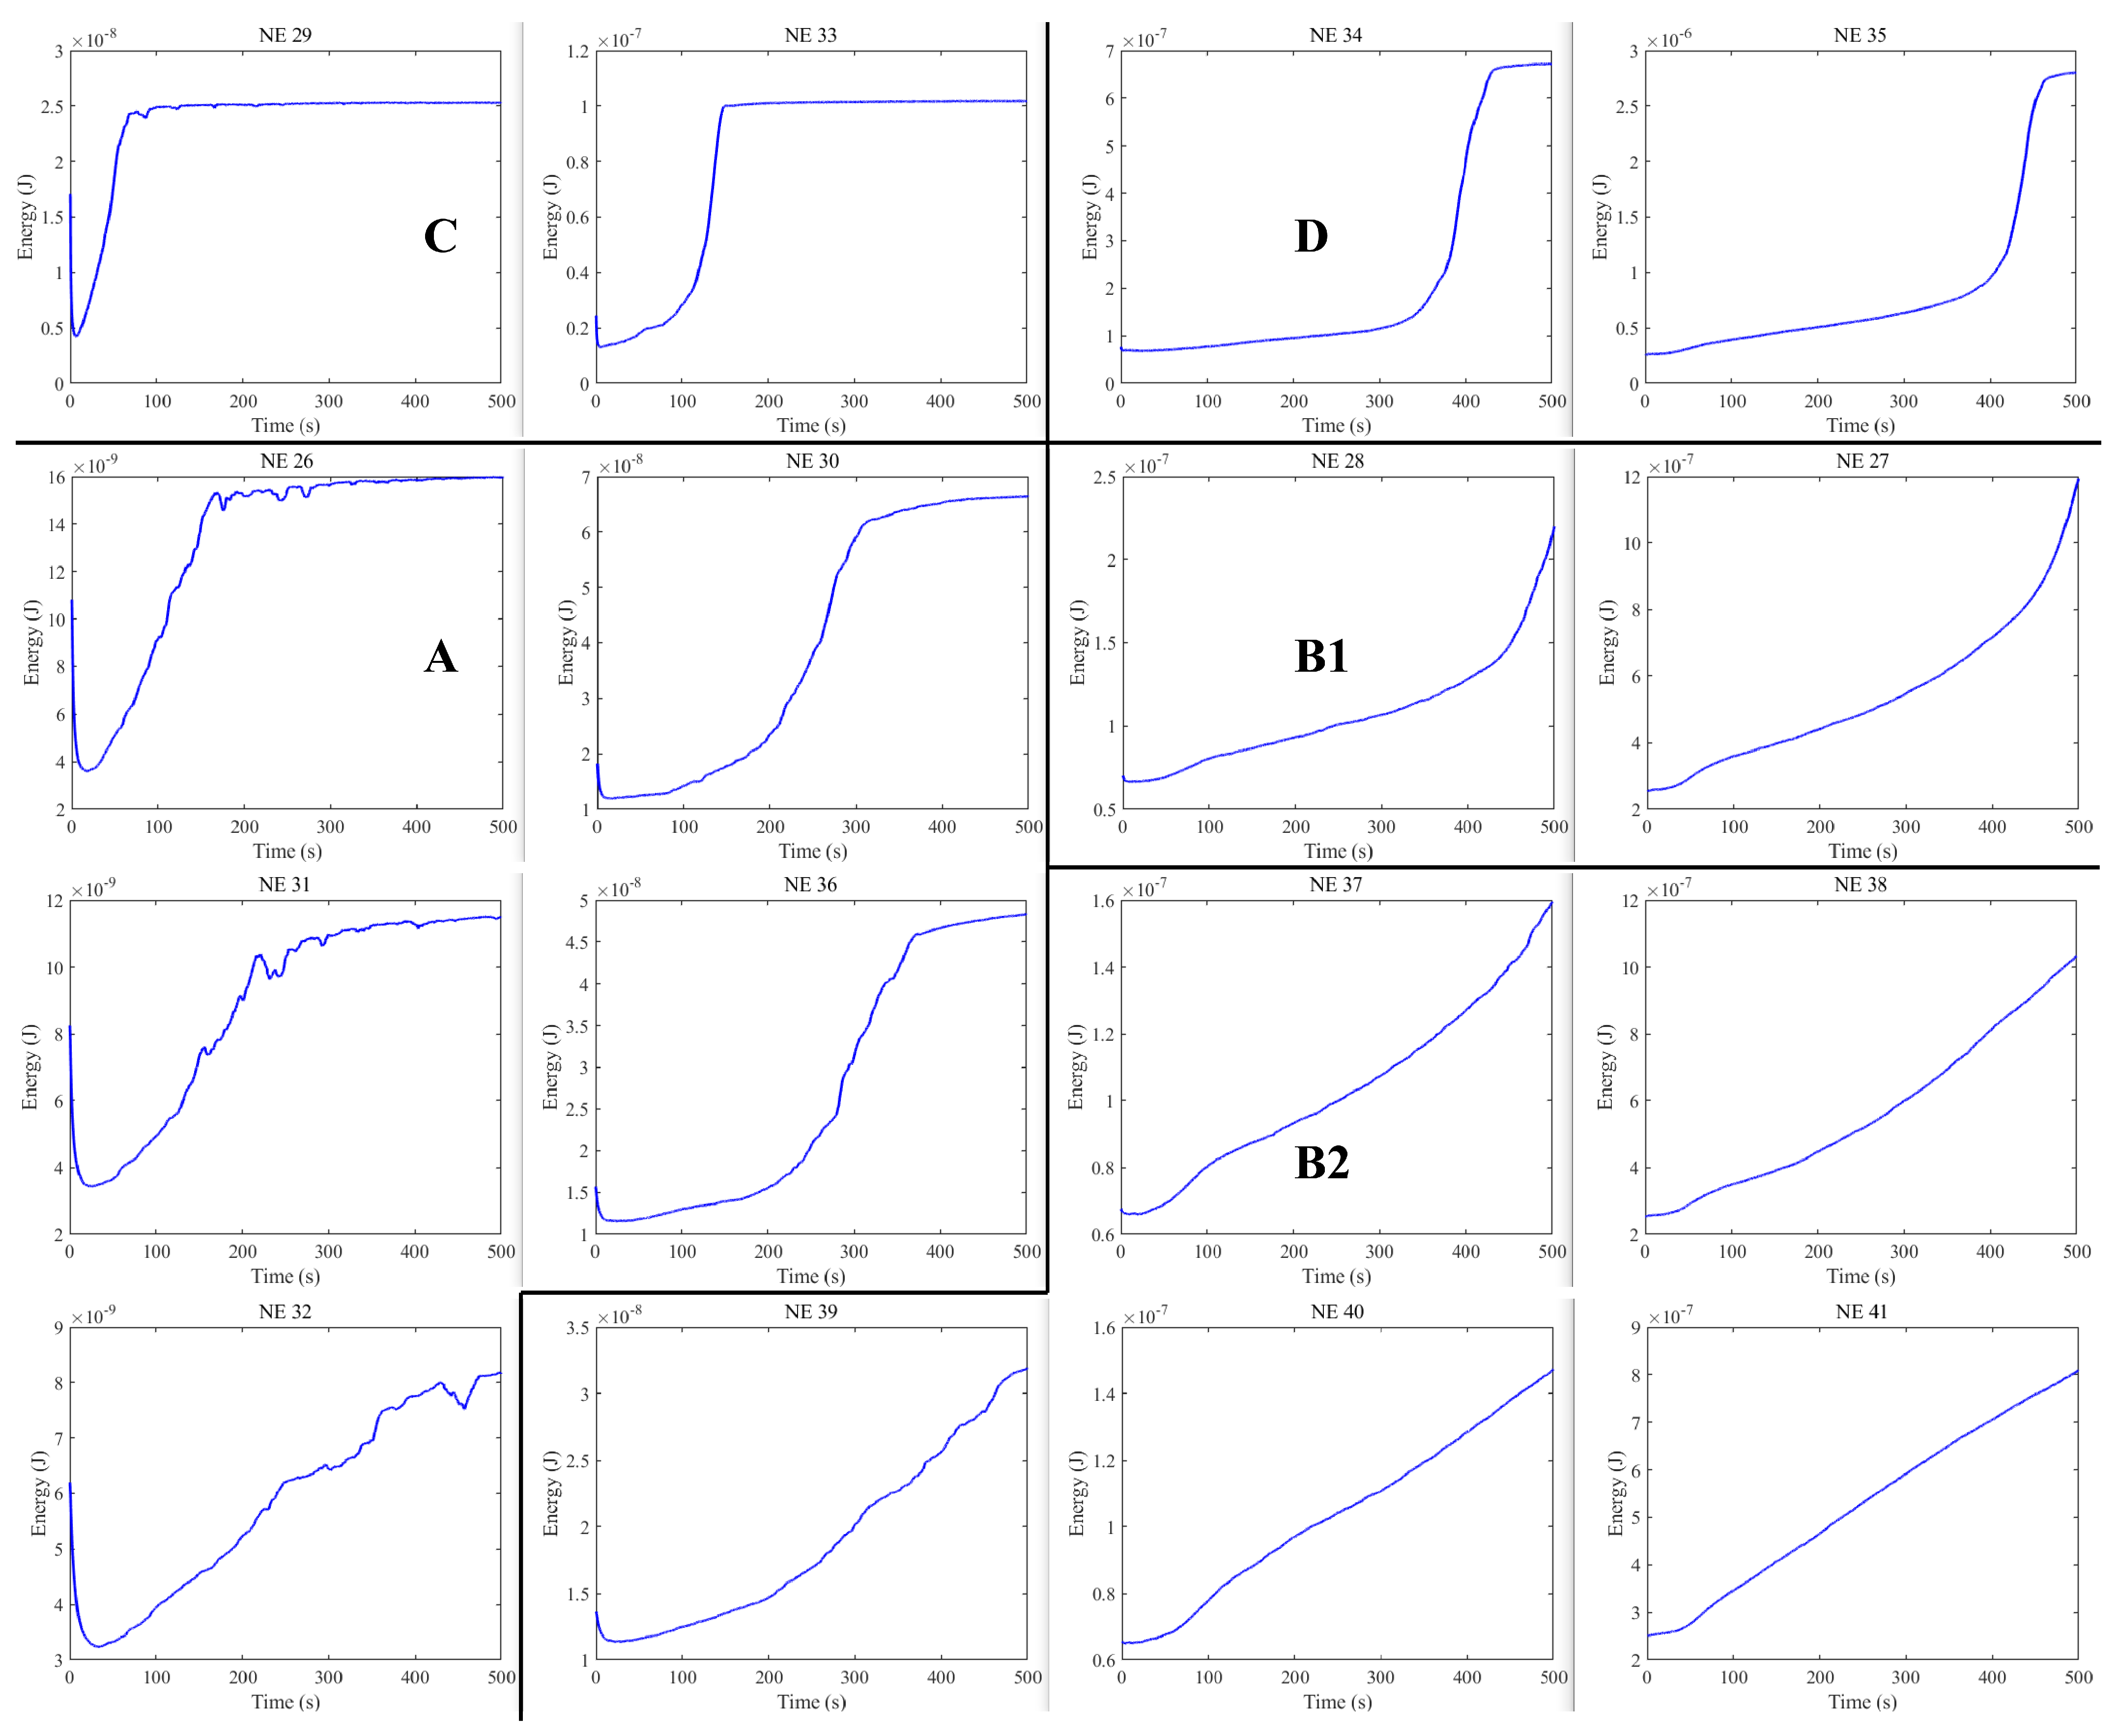
3.3.1. Evolutionary Paths Structured in the Parameter Space

We performed numerical experiments with the filling factor ϕ ranging from 0.0628 to 0.26 and the shear velocity v s ranging from 2.5 mm/s to 25 mm/s in order to find significant phenomena for the dust process in the early stage of planet formation and corresponding parameter combinations. Every numerical experiment simulates for 500 s. To systematize the physical description of the numerical experiments, we classified the collision and growth of particles into four evolutionary paths (A–D), and the relation of the parameter combination and the evolutionary path is shown as Figure 3:
A.
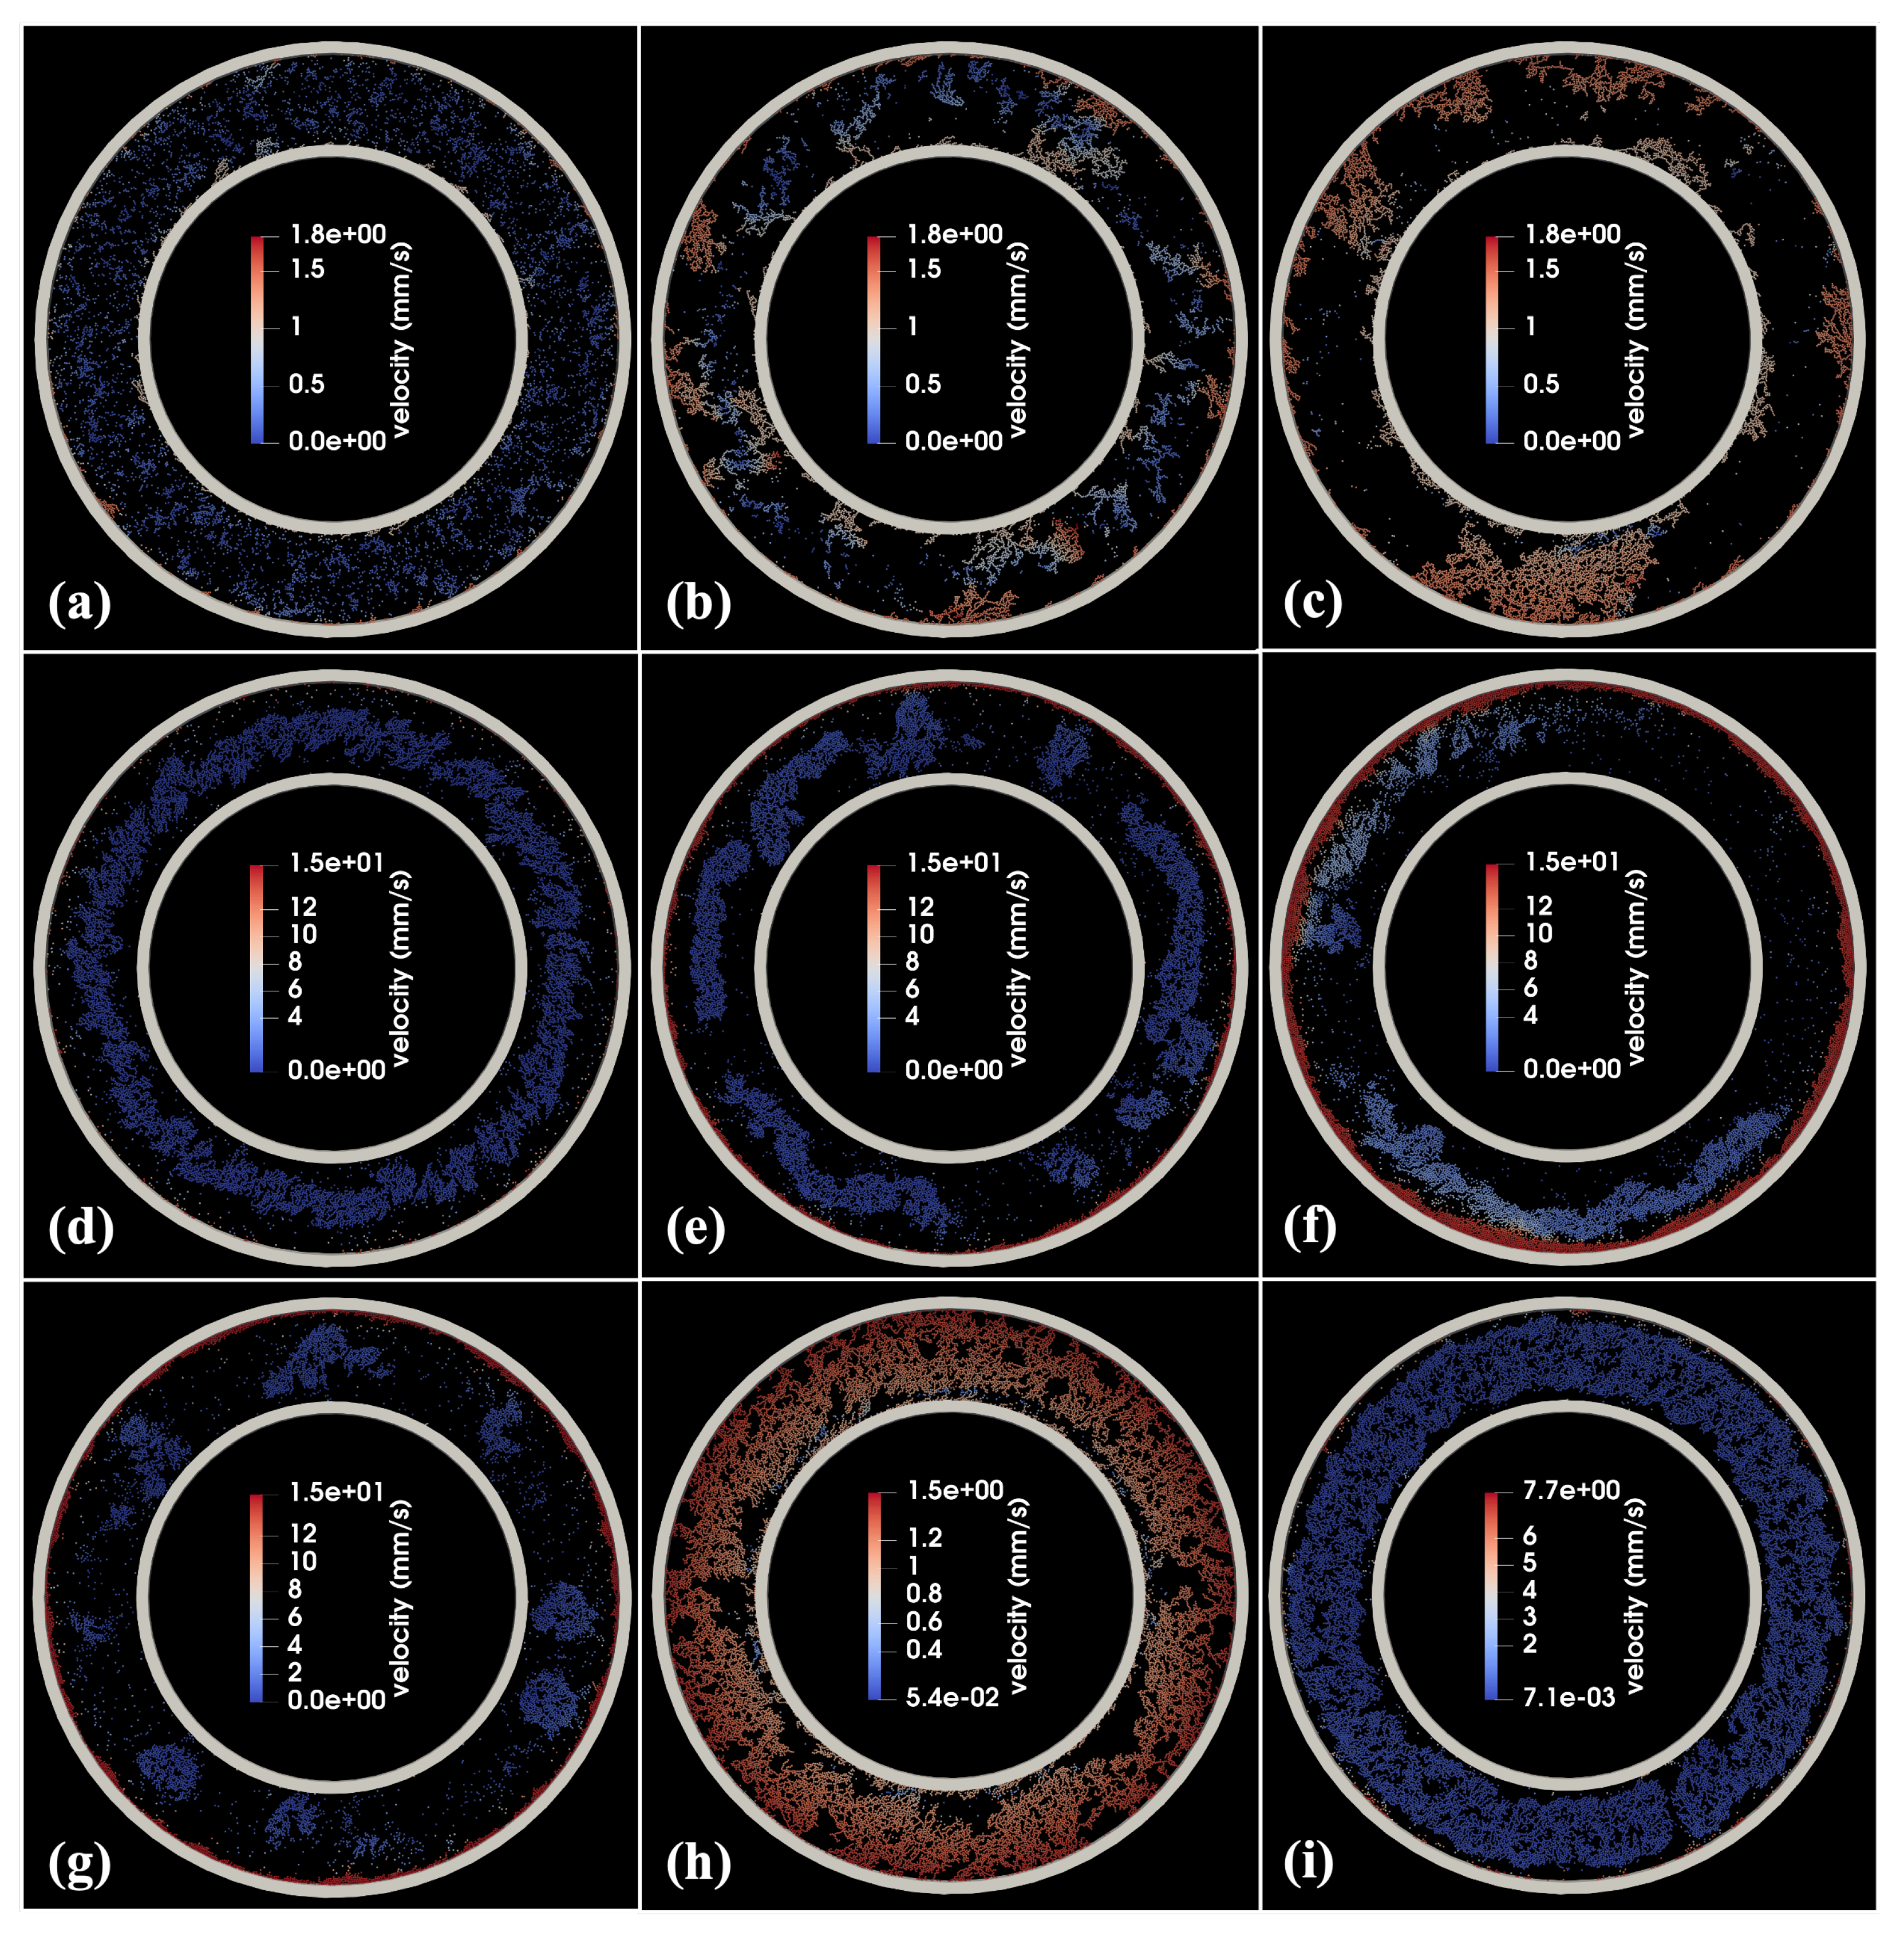
First, the hit-and-stick growth of particles is observed, forming the fractal agglomerates. Mutual collisions and shear actions of agglomerates are followed, during which the cluster–cluster interaction is dominated instead of particle–cluster interaction. The fractal agglomerates continually stick and grow into big blocks, while interactions between clusters break off a small portion of branched structures. The agglomerates generally maintain the structural porosity, and finally attach to the walls and rotate with the walls (see Figure 4a–c).
B.
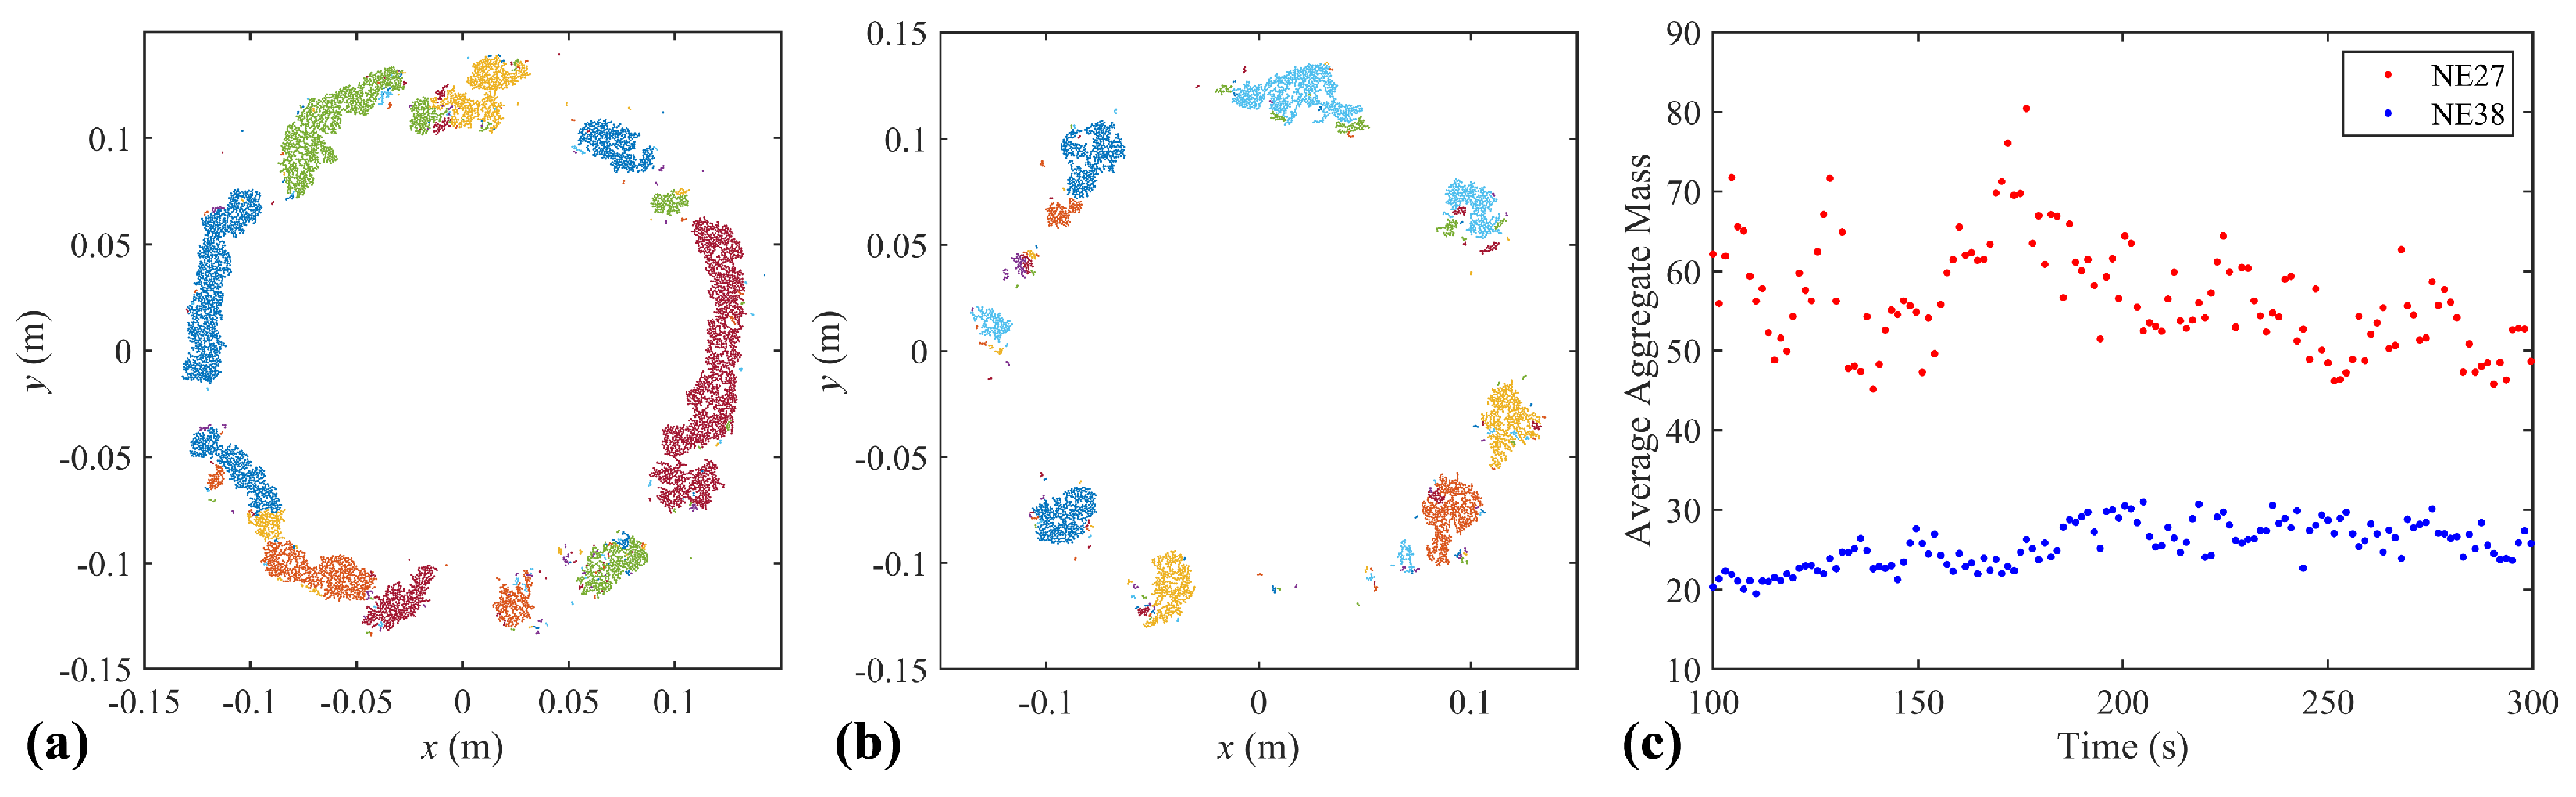
The hit-and-stick growth of the particles rapidly leads to the formation of centimeter-sized loose agglomerates. The subsequent evolution is dominated by particle–cluster collision: centimeter-sized clusters floating between the two walls are constantly impacted by scattered particles, which produces cluster restructuring, fragmentation, and collapse. Finally, most particles attaching to the outer walls rotate with the walls (see Figure 4d–f). There are also differences for the intermediate centimeter-sized clusters in different filling factors. Compared with agglomerates generated in the condition of lower filling factors (as shown in the deep orange region B2 of Figure 3), the agglomerates in the higher filling factors (the light orange region B1 of Figure 3) are larger in size, have stronger resistance for particle impact, and live for a longer time before fragmentation (compare Figure 4e with Figure 4g).
C.
Particles agglomerate and quickly form big and fractal blocks attaching to the outer wall, similar to freezing fractal clusters (see Figure 4h).
D.
Particles agglomerate and quickly form big blocks between the inner and outer walls, which are impacted by a few scattered particles (see Figure 4i).
In summary, a lower shear velocity, which results in lower collision velocity, engenders longer, more evident, and a more significant number of branched structures compared with a higher shear velocity (see Figure 4b,g for comparison). A lower shear velocity more easily creates cluster–cluster interactions in the evolution process (such as evolutionary path A), while a higher shear velocity predominately induces particle–cluster interactions (such as evolutionary path B). As for the other design parameter, a higher filling factor such as 0.26 leading to the evolutionary path C and D is against the observation of the collision and growth of particles and aggregates because the big blocks bonded by particles occupy too much space in the annular region.
Besides the phenomenon-dominated criteria for the classification of evolutionary paths, the total kinetic energy curves also support the classification results from a quantitative perspective. In Figure 5, every small panel depicts the variation in the kinetic energy (sum of the translational energy and rotational energy of all particles) with time. The numerical experiments grouped into the same evolutionary path, which are divided using black lines in Figure 5, possess similar patterns of the time–energy variation.

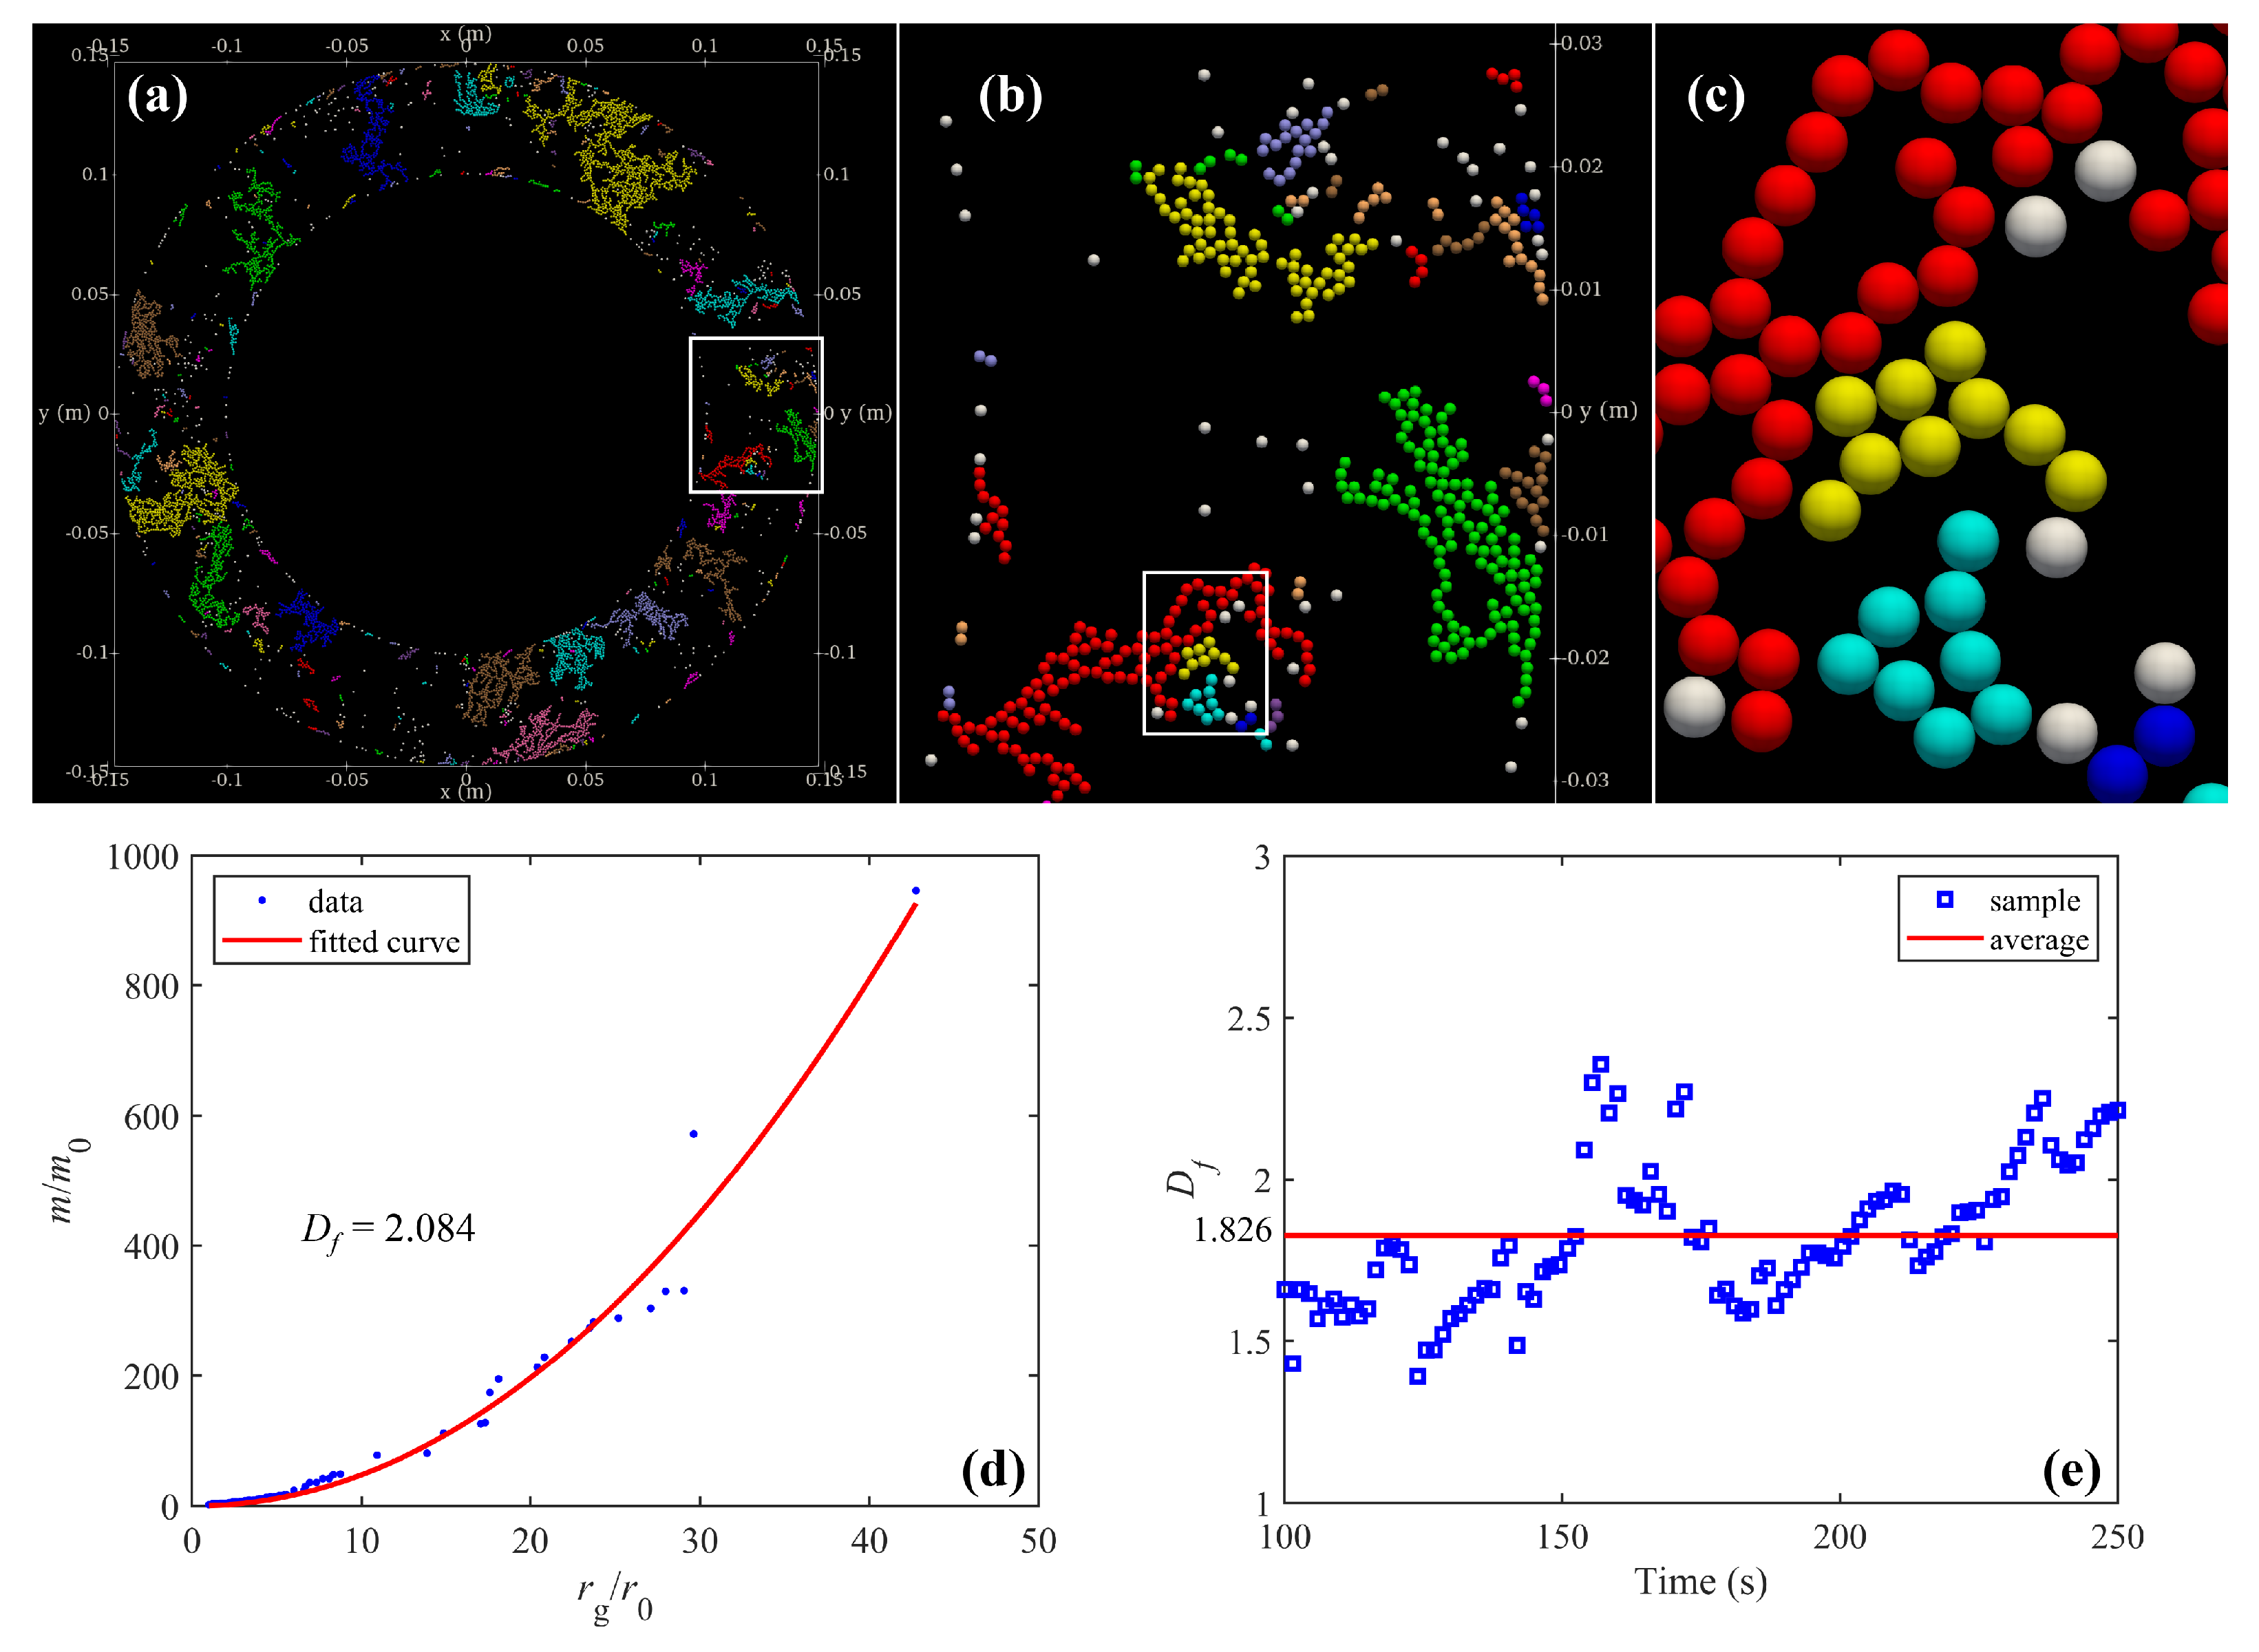
3.3.2. Fractal Characteristics of Agglomerates

Previous research using experiments and coagulation equation analyses have indicated that growing dust agglomerates could be described using the concept of fractals [3,46]. Fluffy or dendritic structured agglomerates are observed almost in all the numerical experiments. Furthermore, in the condition of the lower shear velocity, such as the condition of evolutionary path A and C, the dendritic structures are more obvious.
Here, we choose simulation NE31 as an example to analyze the fractal characteristics of agglomerates, whose collisional evolution process is typically cluster–cluster interaction dominated. We define the agglomerate division first, which is the precondition to measure the morphology of agglomerates. The particles in contact with each other are divided into the same agglomerate. We detect the interparticle contact according to the distance between the centroids of the two particles being less than or equal to the sum of their radii. The contact relations are maintained by cohesive force or viscoelastic force. As shown in Figure 6a–c, the agglomerate division is presented using different colors, and white spheres denote the monomer particles that do not aggregate with others. Figure 6b,c enlarge the local structure of agglomerates. Use the mass-size relation [22] to quantitatively describe the agglomerate characteristics:
m m 0 ( r g r 0 ) D f ,
where m and r g denote the mass and the gyration radius of an agglomerate, m 0 and r 0 particle–monomer mass and radius, and D f the fractal dimension. The gyration radius r g of a N-particle agglomerate is defined as
r g = i = 1 N m 0 r i 2 i = 1 N m 0 ,
in which the particle–monomer mass element m 0 locates at a distance r i from the center of mass of the agglomerate. For the ensemble of agglomerates in Figure 6a, measuring the normalized mass and gyration radius of every cluster [as the scatters in Figure 6d shown], we obtain that the fitted exponent D f is 2.084. Furthermore, for the growing stage of aggregates in simulation NE31 (around 100∼250 s), D f fluctuates between 1.4 and 2.3 with the average value 1.826 (Figure 6e).
The results of the fractal characteristics agree with those of the ballistic cluster–cluster aggregation process in the previous experiments and simulations. Blum et al. [47] discovered that, for differential settling induced collisions in the velocity range of millimeters-to-centimeters per second, the forming dust aggregates present a fractal structure with D f = 1.7 . Wurm and Blum [22] conducted similar experiments using dust particles with relative velocities up to a few tens of centimeters per second and gained a higher D f = 1.9 . Lasue et al. [12] simulated and distinguished certain growth modes of dust aggregates: the diffusion limited cluster–cluster aggregating ( D f 1.8 ) and the reaction limited cluster–cluster aggregating ( D f 2.1 ). These investigations illustrate that hit-and-stick collisions in an ensemble of dust grains lead to fractal aggregates with fractal dimension D f < 2 , while the reaction, instead of directly sticking, can increase the fractal dimension. Self-consistently, low fractal dimensions require hit-and-stick collisions. Similarity and uniformity between these investigations and our simulations lie in the tendency and values of the fractal dimension. At lower shear rates, i.e., lower collision velocity that more easily result in direct sticking, the fractal structures are more pronounced, and the fractal dimension is lower (compare the intermediate states of simulations belonging to evolutionary path A and B in Figure 4). Furthermore, the average value of D f in our simulations (evolutionary path A and the example NE31) falls within the range of the cluster–cluster aggregating experiment or simulation results. Besides the significant fractal phenomena, the agreement also proves the rationality of particle size selection and material parameter selection.

3.3.3. Stage of Growth Stalling

In the cases subject to higher shear velocities, such as conditions leading to evolutionary path B, the period exists during which the sizes of the agglomerates are limited to a narrow range. Although the scattered particles continuously impact the floating agglomerates in the annular gap and agglomerate restructuring persistently occurs to absorb the impact energy, the growth of the agglomerates evidently stalls, which is similar to the bouncing barrier in the previous experiments [25,26] and the current planet formation model [5]. Furthermore, this steady state sustains for a long time before agglomerate fragmentation and collapse. In the gas-levitating experiments, Kruss et al. [26] observed quartz dust growing into larger entities, finally forming constant number aggregates that only bounce off each other. They also found that, feeding on the small particle supply, the bouncing aggregates grew larger but still stepped into another larger-sized growth stalling. Both previous experimental research and our simulations prove the robustness of growth stalling.
From another perspective, the agglomerates generated in a higher filling factor are larger than those in a lower filling factor at the stage of growth stalling, as shown in Figure 7a,b. Figure 7c presents the variation in the average mass of aggregates with time at this stage in simulation NE27 and NE38. The average mass of the aggregates is normalized by the particle–monomer mass m 0 , and, in fact, represents the average particle number that aggregates consist of, which indirectly reflects the average size of the aggregates. We can see that fluctuations of average aggregate mass in these two simulations are both in a narrow range, and NE27 (higher filling factor) maintains a higher average aggregate scale level.

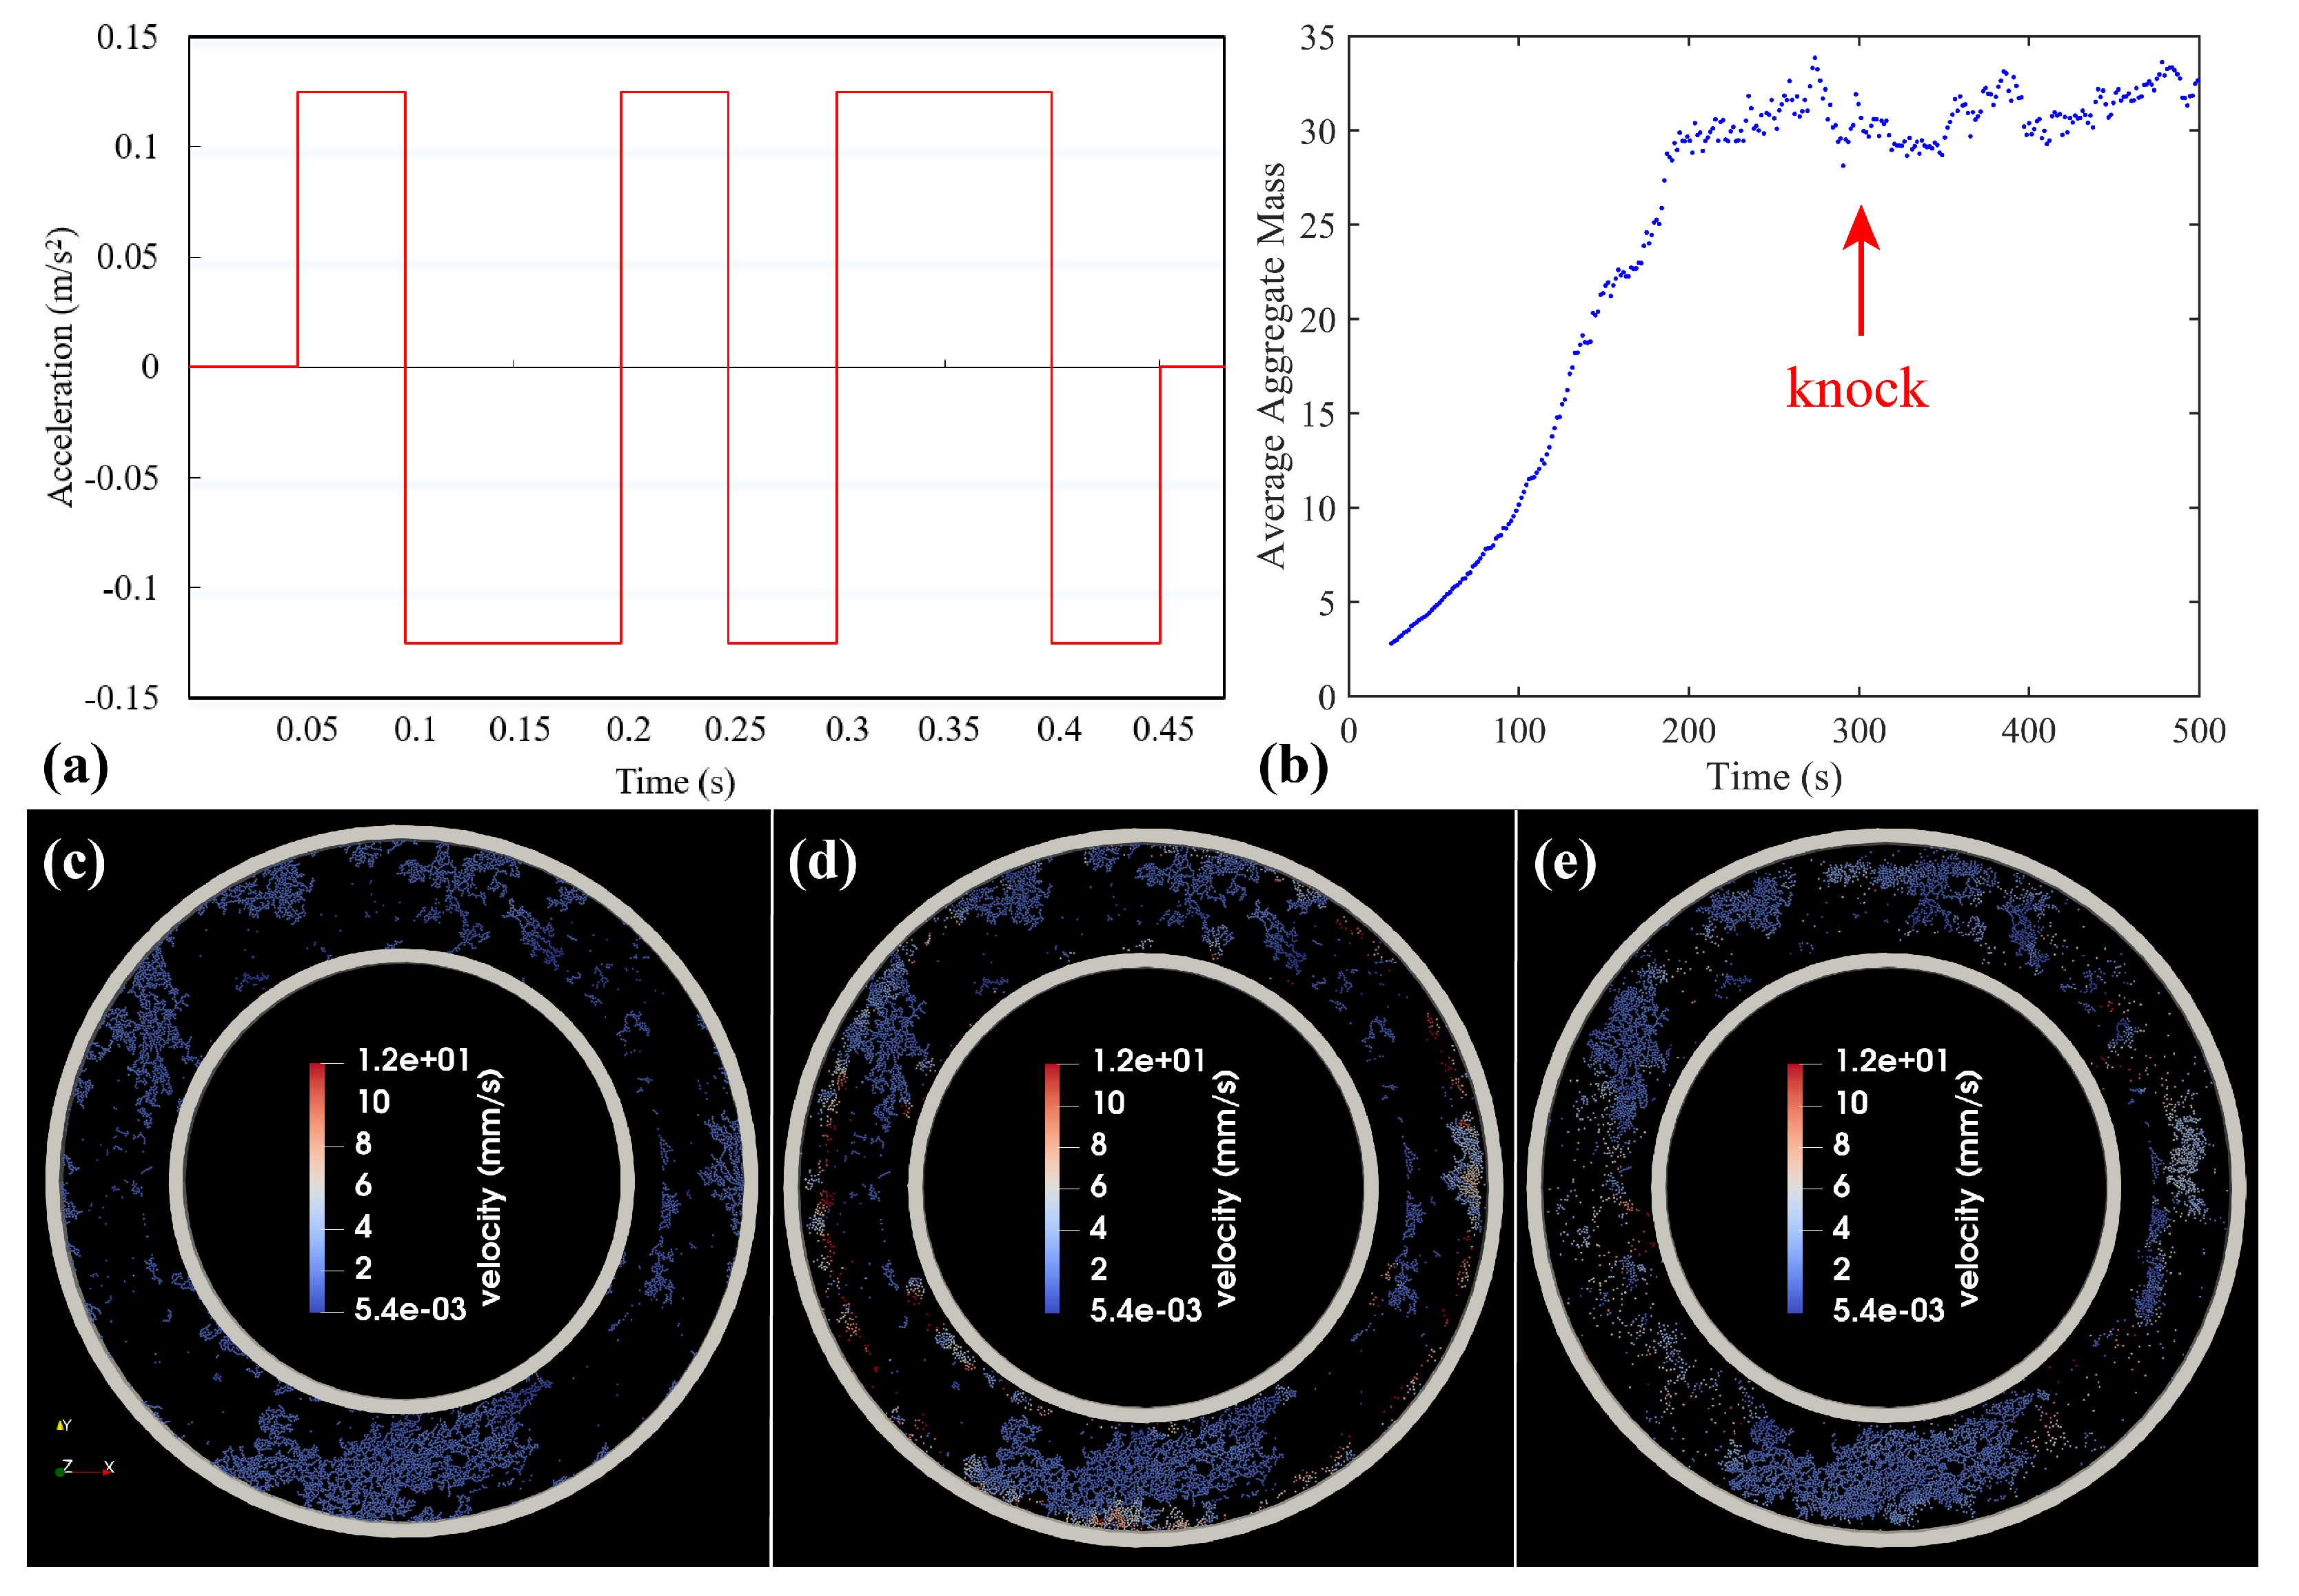
3.3.4. Knocking–Expelling Mechanism Simulations

Based on the numerical experiments shown above, the outcome that particles or aggregates attach to the walls is unavoidable, mainly owing to the centrifugal effect. The phenomena render the shear action inefficient. Therefore, we design four knocking hammers in the apparatus scheme to expel the particles by impulsive loads. Here, we simulate the knocking–expelling mechanism by applying an acceleration impulse on the walls. The acceleration pattern set on the walls in a single direction (such as the x-axis direction) is shown in Figure 8a. The acceleration impulse is applied in two perpendicular directions. As for the timing of impulsive loads, when the collision and growth process steps into a steady state, such as the plateau stage of the evolution of the average mass of aggregates as shown in Figure 8b, apply the knocking loads. The aim is to cause the particles and aggregates to regain the velocity in the radial direction and initiate new collisions and growth. Figure 8c–e exhibit the effect of impulsive loads acting on the walls: particles and aggregates depart the walls and remix in the annular gap.

4. Discussion and Conclusions

Understanding the early stage of planet formation, i.e., the dust process in protoplanetary disks, requires results from experiments in long-term and stable microgravity conditions. The data from microgravity experiments in space stations are of great significance for the development of theoretical studies, either as verification or as input parameters. In this work, we propose a portable, low-cost experimental scheme that can be deployed in any crewed/uncrewed spacecraft to observe the collision and growth of dust analogues under unidirectional and continuous shear loads, which is from the perspective of analogizing the differential-drift-induced dust collisional evolution in protoplanetary disks. Different from previous experiments, the scheme aims to investigate the collisional evolution of large-scale particles (∼10 4 monomers) with sustainable sources of collision velocity.
Noticing that numerical simulations are essential for verifying the feasibility of such an experimental scheme, we conducted numerical experiments using DEM code and searched the design parameter space expanded by two crucial design parameters—shear velocity v s and filling factor ϕ , which influence the outcomes of collisional evolution to a great extent. Based on extensive and systematic simulations, we first draw an atlas of evolutionary paths under different parameter combinations. Then, we focus on two specific phenomena—fractal growth and growth stalling, which are typical in the real dust process of protoplanetary disks. We determine the parameter combinations ( v s = 2.5 mm/s, ϕ = 0.0996 ), the conditions of NE31, ( v s = 25 mm/s, ϕ = 0.0996 ), and the conditions of NE38 as the design parameters of space experiments to study the two phenomena, respectively. We deduce that the migration and aggregation of particles under these design parameters deserve further observation and measurement using a space experimental analogy system, which could offer the original data and help us infer the basic process and core mechanics of dust collision and growth. This work has verified the feasibility of the experimental strategy using 1 mm particles through DEM simulations, which is determined mainly according to the limitations of the experimental techniques. In the future study, we will focus on the experimental techniques suitable for large-scale micron-sized particles under microgravity, which better approximate the actual dust process in protoplanetary disks. The numerical validation and prototype manufacture will be conducted using the approach developed in this study.

Supplementary Materials

The following supporting information can be downloaded at: https://www.mdpi.com/article/10.3390/aerospace10030285/s1, Video S1: NE31_5X_10fps.mp4. Video S2: NE38_5X_10fps.mp4. These two videos record the simulation NE31 and NE38 at 5× speed. Particle colors in videos denote the magnitude of particle velocity, with the unit of m/s.

Author Contributions

Conceptualization, C.H. and Y.Y.; methodology, C.H., Z.S. and B.C.; software, B.C.; validation, C.H., Z.S. and B.C.; formal analysis, Y.Y.; investigation, W.D.; resources, Y.Y.; data curation, W.D.; writing—original draft preparation, C.H.; writing—review and editing, Y.Y.; visualization, C.H.; supervision, Y.Y.; project administration, Y.Y.; funding acquisition, Y.Y. All authors have read and agreed to the published version of the manuscript.

Funding

This research was funded by the National Natural Science Foundation of China Grants No. 12022212 and No. 12272018.

Institutional Review Board Statement

Not applicable.

Informed Consent Statement

Not applicable.

Data Availability Statement

Not applicable.

Conflicts of Interest

The authors declare no conflict of interest.

References

  1. Keppler, M.; Benisty, M.; Müller, A.; Henning, T.; Van Boekel, R.; Cantalloube, F.; Ginski, C.; Van Holstein, R.; Maire, A.L.; Pohl, A.; et al. Discovery of a planetary-mass companion within the gap of the transition disk around PDS 70. Astron. Astrophys. 2018, 617, A44. [Google Scholar]
  2. Zhu, W.; Dong, S. Exoplanet statistics and theoretical implications. Annu. Rev. Astron. Astrophys. 2021, 59, 291–336. [Google Scholar]
  3. Blum, J.; Wurm, G. The growth mechanisms of macroscopic bodies in protoplanetary disks. Annu. Rev. Astron. Astrophys. 2008, 46, 21–56. [Google Scholar] [CrossRef] [Green Version]
  4. Wurm, G. Selective aggregation experiments on planetesimal formation and Mercury-like planets. Geosciences 2018, 8, 310. [Google Scholar]
  5. Wurm, G.; Teiser, J. Understanding planet formation using microgravity experiments. Nat. Rev. Phys. 2021, 3, 405–421. [Google Scholar]
  6. Johansen, A.; Blum, J.; Tanaka, H.; Ormel, C.; Bizzarro, M.; Rickman, H. The multifaceted planetesimal formation process. arXiv 2014, arXiv:1402.1344. [Google Scholar]
  7. Morbidelli, A.; Raymond, S.N. Challenges in planet formation. J. Geophys. Res. Planets 2016, 121, 1962–1980. [Google Scholar]
  8. Crovisier, J.; Encrenaz, T.R.S. Comet Science: The Study of Remnants from the Birth of the Solar System; Cambridge University Press: Cambridge, UK, 2000. [Google Scholar]
  9. Asphaug, E. Growth and evolution of asteroids. Annu. Rev. Earth Planet. Sci. 2009, 37, 413–448. [Google Scholar]
  10. Biele, J.; Ulamec, S.; Maibaum, M.; Roll, R.; Witte, L.; Jurado, E.; Muñoz, P.; Arnold, W.; Auster, H.U.; Casas, C.; et al. The landing(s) of Philae and inferences about comet surface mechanical properties. Science 2015, 349, aaa9816. [Google Scholar]
  11. Levasseur-Regourd, A.C.; Agarwal, J.; Cottin, H.; Engrand, C.; Flynn, G.; Fulle, M.; Gombosi, T.; Langevin, Y.; Lasue, J.; Mannel, T.; et al. Cometary dust. Space Sci. Rev. 2018, 214, 64. [Google Scholar]
  12. Lasue, J.; Maroger, I.; Botet, R.; Garnier, P.; Merouane, S.; Mannel, T.; Levasseur-Regourd, A.C.; Bentley, M. Flattened loose particles from numerical simulations compared to particles collected by Rosetta. Astron. Astrophys. 2019, 630, A28. [Google Scholar]
  13. Fayolle, E.C.; Öberg, K.I.; Jørgensen, J.K.; Altwegg, K.; Calcutt, H.; Müller, H.S.; Rubin, M.; van der Wiel, M.H.; Bjerkeli, P.; Bourke, T.L.; et al. Protostellar and cometary detections of organohalogens. Nat. Astron. 2017, 1, 703–708. [Google Scholar]
  14. Mannel, T.; Bentley, M.S.; Schmied, R.; Jeszenszky, H.; Levasseur-Regourd, A.C.; Torkar, J.R.K. Fractal cometary dust—A window into the early Solar system. Mon. Not. R. Astron. Soc. 2016, 462, S304–S311. [Google Scholar] [CrossRef] [Green Version]
  15. Watanabe, S.; Hirabayashi, M.; Hirata, N.; Hirata, N.; Noguchi, R.; Shimaki, Y.; Ikeda, H.; Tatsumi, E.; Yoshikawa, M.; Kikuchi, S.; et al. Hayabusa2 arrives at the carbonaceous asteroid 162173 Ryugu—A spinning top–shaped rubble pile. Science 2019, 364, 268–272. [Google Scholar]
  16. Walsh, K.J.; Ballouz, R.L.; Jawin, E.R.; Avdellidou, C.; Barnouin, O.S.; Bennett, C.A.; Bierhaus, E.B.; Bos, B.J.; Cambioni, S.; Connolly, H.C., Jr.; et al. Near-zero cohesion and loose packing of Bennu’s near subsurface revealed by spacecraft contact. Sci. Adv. 2022, 8, eabm6229. [Google Scholar]
  17. Weiss, B.P.; Elkins-Tanton, L.T. Differentiated planetesimals and the parent bodies of chondrites. Annu. Rev. Earth Planet. Sci. 2013, 41, 529–560. [Google Scholar] [CrossRef] [Green Version]
  18. Scott, E.; Krot, A. Chondrites and their components. Treatise Geochem. 2003, 1, 711. [Google Scholar]
  19. Liu, B.; Ji, J. A tale of planet formation: From dust to planets. Res. Astron. Astrophys. 2020, 20, 164. [Google Scholar]
  20. Krijt, S.; Ormel, C.W.; Dominik, C.; Tielens, A.G. A panoptic model for planetesimal formation and pebble delivery. Astron. Astrophys. 2016, 586, A20. [Google Scholar] [CrossRef] [Green Version]
  21. Birnstiel, T.; Klahr, H.; Ercolano, B. A simple model for the evolution of the dust population in protoplanetary disks. Astron. Astrophys. 2012, 539, A148. [Google Scholar]
  22. Wurm, G.; Blum, J. Experiments on preplanetary dust aggregation. Icarus 1998, 132, 125–136. [Google Scholar] [CrossRef]
  23. Blum, J.; Wurm, G. Experiments on sticking, restructuring, and fragmentation of preplanetary dust aggregates. Icarus 2000, 143, 138–146. [Google Scholar] [CrossRef]
  24. Kelling, T.; Wurm, G.; Köster, M. Experimental study on bouncing barriers in protoplanetary disks. Astrophys. J. 2014, 783, 111. [Google Scholar] [CrossRef] [Green Version]
  25. Kruss, M.; Demirci, T.; Koester, M.; Kelling, T.; Wurm, G. Failed growth at the bouncing barrier in planetesimal formation. Astrophys. J. 2016, 827, 110. [Google Scholar] [CrossRef] [Green Version]
  26. Kruss, M.; Teiser, J.; Wurm, G. Growing into and out of the bouncing barrier in planetesimal formation. Astron. Astrophys. 2017, 600, A103. [Google Scholar] [CrossRef] [Green Version]
  27. Blum, J.; Wurm, G.; Kempf, S.; Poppe, T.; Klahr, H.; Kozasa, T.; Rott, M.; Henning, T.; Dorschner, J.; Schräpler, R.; et al. Growth and form of planetary seedlings: Results from a microgravity aggregation experiment. Phys. Rev. Lett. 2000, 85, 2426. [Google Scholar] [CrossRef] [Green Version]
  28. Scheeres, D.J.; Hartzell, C.M.; Sanchez, P.; Swift, M. Scaling forces to asteroid surfaces: The role of cohesion. Icarus 2010, 210, 968–984. [Google Scholar] [CrossRef] [Green Version]
  29. Perko, H.A.; Nelson, J.D.; Sadeh, W.Z. Surface cleanliness effect on lunar soil shear strength. J. Geotech. Geoenviron. Eng. 2001, 127, 371–383. [Google Scholar] [CrossRef]
  30. Li, Z.; Zeng, X.; Wen, T.; Zhang, Y. Numerical Comparison of Contact Force Models in the Discrete Element Method. Aerospace 2022, 9, 737. [Google Scholar]
  31. Cheng, B.; Yu, Y.; Baoyin, H. Collision-based understanding of the force law in granular impact dynamics. Phys. Rev. E 2018, 98, 012901. [Google Scholar] [CrossRef]
  32. Cheng, B.; Yu, Y.; Baoyin, H. Numerical simulations of the controlled motion of a hopping asteroid lander on the regolith surface. Mon. Not. R. Astron. Soc. 2019, 485, 3088–3096. [Google Scholar] [CrossRef]
  33. Cheng, B.; Yu, Y.; Asphaug, E.; Michel, P.; Richardson, D.C.; Hirabayashi, M.; Yoshikawa, M.; Baoyin, H. Reconstructing the formation history of top-shaped asteroids from the surface boulder distribution. Nat. Astron. 2021, 5, 134–138. [Google Scholar] [CrossRef]
  34. Cheng, B.; Asphaug, E.; Ballouz, R.L.; Yu, Y.; Baoyin, H. Numerical Simulations of Drainage Grooves in Response to Extensional Fracturing: Testing the Phobos Groove Formation Model. Planet. Sci. J. 2022, 3, 249. [Google Scholar] [CrossRef]
  35. Cheng, B.; Asphaug, E.; Yu, Y.; Baoyin, H. Measuring the mechanical properties of small body regolith layers using a granular penetrometer. Astrodynamics 2023, 7, 15–29. [Google Scholar] [CrossRef]
  36. Gundlach, B.; Blum, J. Regolith grain size and cohesive strength of near-Earth Asteroid (29075) 1950 DA. Icarus 2015, 257, 126–129. [Google Scholar] [CrossRef]
  37. Walsh, K.; Jawin, E.; Ballouz, R.L.; Barnouin, O.; Bierhaus, E.; Connolly, H.; Molaro, J.; McCoy, T.J.; Delbo, M.; Hartzell, C.; et al. Craters, boulders and regolith of (101955) Bennu indicative of an old and dynamic surface. Nat. Geosci. 2019, 12, 242–246. [Google Scholar] [CrossRef] [Green Version]
  38. Somfai, E.; Roux, J.N.; Snoeijer, J.H.; Van Hecke, M.; Van Saarloos, W. Elastic wave propagation in confined granular systems. Phys. Rev. E 2005, 72, 021301. [Google Scholar] [CrossRef] [Green Version]
  39. Jiang, M.; Shen, Z.; Wang, J. A novel three-dimensional contact model for granulates incorporating rolling and twisting resistances. Comput. Geotech. 2015, 65, 147–163. [Google Scholar] [CrossRef]
  40. Sánchez, P.; Scheeres, D.J. The strength of regolith and rubble pile asteroids. Meteorit. Planet. Sci. 2014, 49, 788–811. [Google Scholar] [CrossRef] [Green Version]
  41. Sánchez, P.; Scheeres, D.J. Disruption patterns of rotating self-gravitating aggregates: A survey on angle of friction and tensile strength. Icarus 2016, 271, 453–471. [Google Scholar] [CrossRef]
  42. Zhang, Y.; Richardson, D.C.; Barnouin, O.S.; Michel, P.; Schwartz, S.R.; Ballouz, R.L. Rotational failure of rubble-pile bodies: Influences of shear and cohesive strengths. Astrophys. J. 2018, 857, 15. [Google Scholar] [CrossRef] [Green Version]
  43. Huang, C.; Yu, Y.; Cheng, B.; Zhang, K.; Qiao, D.; Baoyin, H. Sand creep motion in slow spin-up experiment: An analog of regolith migration on asteroids. Phys. Rev. E 2021, 104, L042901. [Google Scholar] [CrossRef] [PubMed]
  44. Tang, J.; Yang, T.; Chen, X.; Zhang, Z.; Tian, Y.; Zhang, W.; Jiang, S. Mechanical Characteristics of Lunar Regolith Drilling and Coring and Its Crawling Phenomenon: Analysis and Validation. Aerospace 2022, 9, 709. [Google Scholar] [CrossRef]
  45. Blum, J. Dust evolution in protoplanetary discs and the formation of planetesimals. Space Sci. Rev. 2018, 214, 52. [Google Scholar] [CrossRef] [Green Version]
  46. Ossenkopf, V. Dust coagulation in dense molecular clouds: The formation of fluffy aggregates. Astron. Astrophys. 1993, 280, 617–646. [Google Scholar]
  47. Blum, J.; Wurm, G.; Poppe, T.; Heim, L.O. Aspects of laboratory dust aggregation with relevance to the formation of planetesimals. Lab. Astrophys. Space Res. 1999, 236, 399–423. [Google Scholar]
Figure 1. Design scheme of the apparatus of experiments on sheared granular matter in a space station. The movement of particles is designed in the annular region between the inner and outer walls. The driving mechanism of shearing walls and the knocking mechanism for expelling particles attaching to the walls are depicted. Panel (a,b) are from different perspectives.
Aerospace 10 00285 g001
Figure 2. Simulation setup. The two annular walls are triangulate-meshed polyhedrons, and the radii R 1 = 150 mm , R 2 = 100 mm . The white points between the inner and outer walls represent the floating grains, which are spheres with the diameter of 1 mm and the statistical nonsphericity of 0.8. This example consists of 6939 particles. The shear velocity v s in the context is defined as v s = ω 1 R 1 ω 2 R 2 .
Aerospace 10 00285 g002
Figure 3. Classification of evolutionary paths in the parameter space spanned by the shear velocity v s and the filling factor ϕ . Different context colors and letters (A–D) indicate different evolutionary paths of particle collisions. × and the label “NEXX” denote the parameter combination where the numerical experiments are performed. For simulations in this atlas, the interparticle cohesive strength c is 4 Pa.
Aerospace 10 00285 g003
Figure 4. Intermediate state of numerical experiments belonging to different evolutionary paths. Panel (ac), respectively, show the states at 50 s, 150 s, and 300 s of simulation NE31, consisting of 6939 particles, which belong to evolutionary path A. Panel (df), respectively, present the states at 50 s, 300 s, and 480 s of simulation NE27 (10082 grains), corresponding to evolutionary path B1. Panel (g) is the state of 300 s of simulation NE38 (6939 grains), which is an example of evolutionary path B2. Panel (h,i) show the states at 100 s of simulation NE29 (evolutionary path C) and NE34 (evolutionary path D), respectively, both consisting of 18110 particles. The colors of particles indicate the velocity magnitude.
Aerospace 10 00285 g004
Figure 5. Kinetic energy curves. The panels show the total kinetic energy of particles varying with time in the 16 sets of simulations, which are divided into different evolutionary paths (labeled by black letters) in terms of the curve morphology.
Aerospace 10 00285 g005
Figure 6. Fractal characteristics in simulation NE31. Panel (ac) present the agglomerate division at 165 s. Panel (b,c) show the local zoom of the area in the white box in panel (a,b), respectively. Particles are rendered as spheres scaled in terms of particle size and in different colors to distinguish different aggregates. Panel (d) illustrates the mass–size distribution at 165 s and the fitted results of D f . Panel (e) denotes the fluctuation and average value of D f during 100∼250 s in the simulation.
Aerospace 10 00285 g006
Figure 7. Characteristics of agglomerates at the stage of growth stalling. Panel (a,b) depict the aggregates (particle number ≥ 2) between the inner and outer walls at 250 s in the simulation NE27 and NE38, respectively. Particles attaching to the walls and monomer particles in the annular gap are omitted. Points in different colors only represent particle positions, not scaling with particle radius. Panel (c) presents the tendency of the average mass of aggregates with time.
Aerospace 10 00285 g007
Figure 8. Knocking mechanism and expelling effect. Panel (a) demonstrates the acceleration impulse in a single direction. Panel (b) shows the timing to apply knocking loads. Panel (ce) present the expelling effect of knocking, among which only panel (c) is before the knocking.
Aerospace 10 00285 g008
Disclaimer/Publisher’s Note: The statements, opinions and data contained in all publications are solely those of the individual author(s) and contributor(s) and not of MDPI and/or the editor(s). MDPI and/or the editor(s) disclaim responsibility for any injury to people or property resulting from any ideas, methods, instructions or products referred to in the content.

