Article

Multi-Objective 3D Airspace Sectorization Problem Using NSGA-II with Prior Knowledge and External Archive

1
College of Civil Aviation, Nanjing University of Aeronautics and Astronautics, Nanjing 211100, China
2
National Key Laboratory of Air Traffic Flow Management, Nanjing 211100, China
3
Department of Industrial Systems Engineering and Management, National University of Singapore, Singapore 119077, Singapore
*
Author to whom correspondence should be addressed.
Aerospace 2023, 10(3), 216; https://doi.org/10.3390/aerospace10030216
Submission received: 30 January 2023 / Revised: 17 February 2023 / Accepted: 22 February 2023 / Published: 24 February 2023
(This article belongs to the Collection Air Transportation—Operations and Management)

Abstract

:
Airspace sectorization is a powerful means to balance the increasing air traffic flow and limited airspace resources, which is related to the efficiency and safety of operations. In order to divide sectors reasonably, a multi-objective optimization framework for 3D airspace sectorization is proposed in this paper, including four core modules: Flight clustering, sector generation, workload evaluation, and sector optimization. Specifically, it clusters flights and generates initial sectors using a Voronoi diagram. To further optimize sector shape, the concept of dynamic density is introduced to evaluate the controller workload, based on which a sector optimization model is constructed. The model not only considers intra-sector and inter-sector workloads as objective functions but also sets hard constraints to meet operation and safety requirements. To solve it, a Non-dominated Sorting Genetic Algorithm II (NSGA-II) with prior knowledge and an external archive is designed. By analyzing the optimization results of actual operational data in the Singapore regional airspace, our approach obtains diverse optimal sectorization schemes for decision makers to choose from. Qualitative and quantitative experimental results confirm that the initial population strategy with prior knowledge significantly accelerates the convergence process. At the same time, the mechanism of the external archive effectively enriches the diversity of solutions.

1. Introduction

In recent years, with the rapid development of civil aviation, the contradiction between limited airspace resources and excessive traffic demand has become increasingly prominent. This phenomenon has overloaded controllers during peak traffic periods, making it difficult to maintain safe and efficient air traffic operations. In order to scientifically supervise the existing airspace, it is usually divided into multiple managerial units, that is, air traffic control sectors, each of which is assigned two controllers to monitor trajectory behavior and avoid unsafe incidents [1]. A reasonable airspace sectorization scheme can not only reduce the workload of controllers but also achieve capacity–demand balance, which is of great significance to optimizing airspace resources and ensuring orderly traffic flow [2].
Sector capacity is the maximum number of aircraft that a controller can manage simultaneously. A sector is saturated when the number of aircraft exceeds its capacity [3]. The controller’s workload is a critical factor in determining the sector capacity, usually divided into three categories, namely the monitoring workload, conflict workload, and coordination workload. The first two workloads occur within a sector (i.e., intra-sector workloads), while the third workload occurs between sectors (i.e., inter-sector workloads). Past literature has demonstrated that these two workloads are coupled and conflicting in the airspace sectorization problem [4]. In order to achieve trade-offs between the two, a multi-objective optimization framework for 3D airspace sectorization is established in this paper. Under the premise of practical constraints such as operation and safety, it simultaneously minimizes the standard deviation of the intra-sector workload and the total amount of inter-sector workload. Particularly, the concept of dynamic density [5] is introduced to characterize the workload within a sector from the perspective of traffic density and complexity. To generate more realistic sectorization schemes, a Voronoi diagram is used to generate 2D sectors, on top of which the vertical division technique is adopted to generalize to 3D sectors.
To solve such an optimization problem, genetic algorithms have always been regarded as powerful tools, among which Non-dominated Sorting Genetic Algorithm II (NSGA-II) [6] is one of the most representative algorithms. It introduces concepts such as fast non-dominated sorting and crowding distance to greatly ensure the optimality and diversity of solutions. However, the performance is affected by the population size and the number of iterations, especially in scenarios where computation time is limited. A smaller population size may cause some non-dominated solutions to be lost, while a smaller number of iterations directly affects the convergence of the population. To alleviate the above problems, this paper introduces an advanced strategy and mechanism based on NSGA-II, namely prior knowledge and an external archive. In particular, the distribution of aircraft extracted by flight clustering is used as domain-specific prior knowledge to generate prophetic populations, and the external archive is used to maintain continuously updated non-dominated solutions. The proposed framework is validated on the real data of Singapore regional airspace. Experimental results demonstrate that the framework generates various optimal sectorization schemes, where prior knowledge significantly accelerates the convergence process and the external archive improves the integrity of solutions.
Overall, the main contributions are summarized as follows:
(1)
Under the realistic constraints of operation and safety, a multi-objective framework is proposed to optimize 3D airspace sectorization in terms of intra-sector workload balance and the minimum total inter-sector workload.
(2)
To improve solution diversity and model efficiency, an initial population strategy with prior knowledge and an external archive mechanism are introduced into NSGA-II.
(3)
An in-depth experimental analysis of actual operational data in the Singapore regional airspace is carried out from qualitative and quantitative perspectives, and the effectiveness of the airspace sectorization scheme is confirmed.
The rest of this paper is organized as follows. Section 2 reviews the airspace sectorization problem from multiple perspectives. In Section 3, the proposed multi-objective framework with four core modules is elaborated. Taking the Singapore regional airspace as an example, Section 4 gives the experimental analysis results. The conclusion and the prospect of future work are given in Section 5.

2. Related Works

Before optimizing sectors, it is necessary to specify the appropriate sector generation approach. Past literature primarily falls into two categories, which are top-down and bottom-up approaches. The former is to take the entire airspace as an initial object and divide it into smaller air traffic control sectors [7,8,9]. The latter defines elementary airspace blocks and combines them appropriately to form sectors [1,10,11]. Regardless of the approaches, the generated sectors must not only be fully connected but also maintain convexity to ensure that the aircraft will not repeatedly enter the same sector [12]. Considering the extra computational cost brought by these problems, this paper adopts one of the top-down representative methods, the Voronoi diagram [13], to generate sectors that can naturally satisfy connectivity and convexity.
In order to obtain reasonable and reliable airspace sectorization schemes, it is necessary to comprehensively consider the various workloads of controllers and practical constraints such as operation and safety. Early literature usually builds optimization models with only one type of workload as the objective function. Yousefi and Donohue [14] used a bottom-up design method to divide the airspace height into three fixed parts. On this basis, to balance the monitoring workload within sectors, a single-objective airspace sectorization model was constructed with sector transit time, connectivity, and convexity as constraints. However, they ignore specific implementation details. In contrast, previous research [15,16] set the optimization goal of minimizing the coordination workload between sectors and regarded the monitoring workload as a constraint. The difference is that the former simplifies the problem into 2D sectors and uses a hybrid algorithm to solve it, while the latter solves the 3D airspace sectorization problem based on the metaheuristic algorithm.
Recent literature considers multiple objective functions simultaneously and converts multiple objectives into a single objective by quantifying preferences with different weights [7,8,11,17,18]. Specifically, Delahaye and Puechmorel [8] set two optimization objectives of balancing the workload within sectors and minimizing the coordination workload between sectors. Then, it was transformed into a single-objective optimization problem through mathematical modeling, where an evolutionary algorithm was used to optimize the 3D airspace. Leiden et al. [11] proposed an airspace sectorization method by considering both the workload balance within sectors and the minimization of the number of sectors. It had two working modes, both of which used the greedy method to find the optimal solution. In addition, the transition cost between flight segments was analyzed and defined. Sabhnani et al. [17] used the intra-sector workloads defined by the peak and the average number of flights and the inter-sector workloads measured by the number of flights flying over the sector boundary as objective functions to build an airspace optimization model. However, the number of flights only represents the traffic density, and sometimes cannot reflect the actual workload. Chen et al. [18] transformed the airspace sectorization problem into a graph partitioning problem. It considered balancing the workload of different sectors, minimizing the coordination workload, and maximizing the sector average flight time as the multiple optimization objectives. They were also transformed into a single-objective optimization problem in a weighted form. Sergeeva et al. [7] proposed an automatic 3D airspace sectorization model according to EUROCONTROL requirements, where six criteria from different perspectives were designed and aggregated into one objective function. Experimental results demonstrated that the model efficiently generates multiple design options based on different combinations of weights. In particular, Gerdes et al. [19] proposed a multi-step approach for the creation of optimized sectorization, including modules such as a route generator, a preprocessor, and automatic sectorization. Although this work is somewhat similar to the pipeline proposed in this paper, it essentially still transforms multiple objectives into a single integrated objective in a weighted manner, and it is primarily oriented to 2D airspace, focusing on solving non-convex boundaries and smooth transitions between successive sectorizations in the dynamic scenes. In contrast, the proposed framework puts more emphasis on obtaining multiple solutions for 3D airspace in a limited time under the multi-objective optimization (MOO) framework to alleviate the conflict between multiple objectives. In fact, we only borrow from their work on generating initial sectors (i.e., obtaining sites of the Voronoi diagram based on fuzzy clustering). In addition, due to the lack of well-defined criteria and sufficient participation of air traffic control experts, some common evaluation methods for multiple objectives, such as qualitative methods of multicriteria analysis and methods of aggregation of criteria based on fuzzy judgments of experts, have been restricted in use.
The above methods for dealing with multi-objective optimization models often have limited application scenarios since only a unique sectorization scheme is given. Moreover, intra-sector and inter-sector workloads are inherently conflicting. In order to alleviate the problems, multi-objective optimization that generates multiple optimal solutions has better prospects, where the Pareto optimal solution set can be provided to the relevant decision makers for a preferred choice, obtaining a satisfactory sectorization scheme.

3. Multi-Objective Framework for 3D Airspace Sectorization

To achieve the automatic sectorization of 3D airspace, an intelligent framework with four core modules is proposed in this paper. The specific modules are shown in Figure 1, including flight clustering, sector generation, workload evaluation, and sector optimization. Specifically, module I performs cluster analysis on flight position data to capture the spatial distribution characteristics of flights and treats the cluster centers as prior knowledge to initialize the sites of Voronoi. With these sites in mind, module II directly generates 2D sector boundaries by calculating the Voronoi Diagram and vertically divides it to obtain the complete 3D sectors. Based on sector boundary information, module III introduces the concept of dynamic density to accurately estimate the workloads inside each sector. Considering the conflict of workloads within and between sectors, module IV establishes a multi-objective optimization model and uses pareto-archive NSGA-II algorithms to find better sites. By executing modules II, III, and IV in a loop, the optimal sites and corresponding sectors are obtained. Compared with previous work, the proposed method is a MOO framework for solving 3D airspace sectorization problems. In order to obtain diverse optimal solutions in a limited time, the advanced strategy and mechanism are integrated and designed in NSGA-II. In the following subsections, the specific details of each module are given in detail.

3.1. Flight Clustering as Prior Knowledge

In order to accurately identify the spatial pattern of traffic flow and then provide reliable prior knowledge for airspace sectorization tasks, the cluster analysis technique is regarded as an effective tool [19,20]. Specifically, due to the difficulty of clearly distinguishing the clusters to which the various flights belong, one of the most popular fuzzy clustering algorithms, i.e., fuzzy C-means (FCM) clustering, is adopted, where each flight can belong to multiple clusters according to the degree of membership. Given the position data of n flights X = { x 1 , x 2 , , x n } , FCM tries to divide them into k clusters, where C = { c 1 , c 2 , , c k } is the cluster centers and W = { w i j , i = 1 , 2 , , n , j = 1 , 2 , , k } is the corresponding membership matrix. Hereby, w i j is the degree to which flight i belongs to cluster j . It tries to minimize the following objective function:
J ( W , C ) = i = 1 n j = 1 k w i j m | | x i c j | | 2 s . t . j = 1 k w i j = 1 , w i j 0
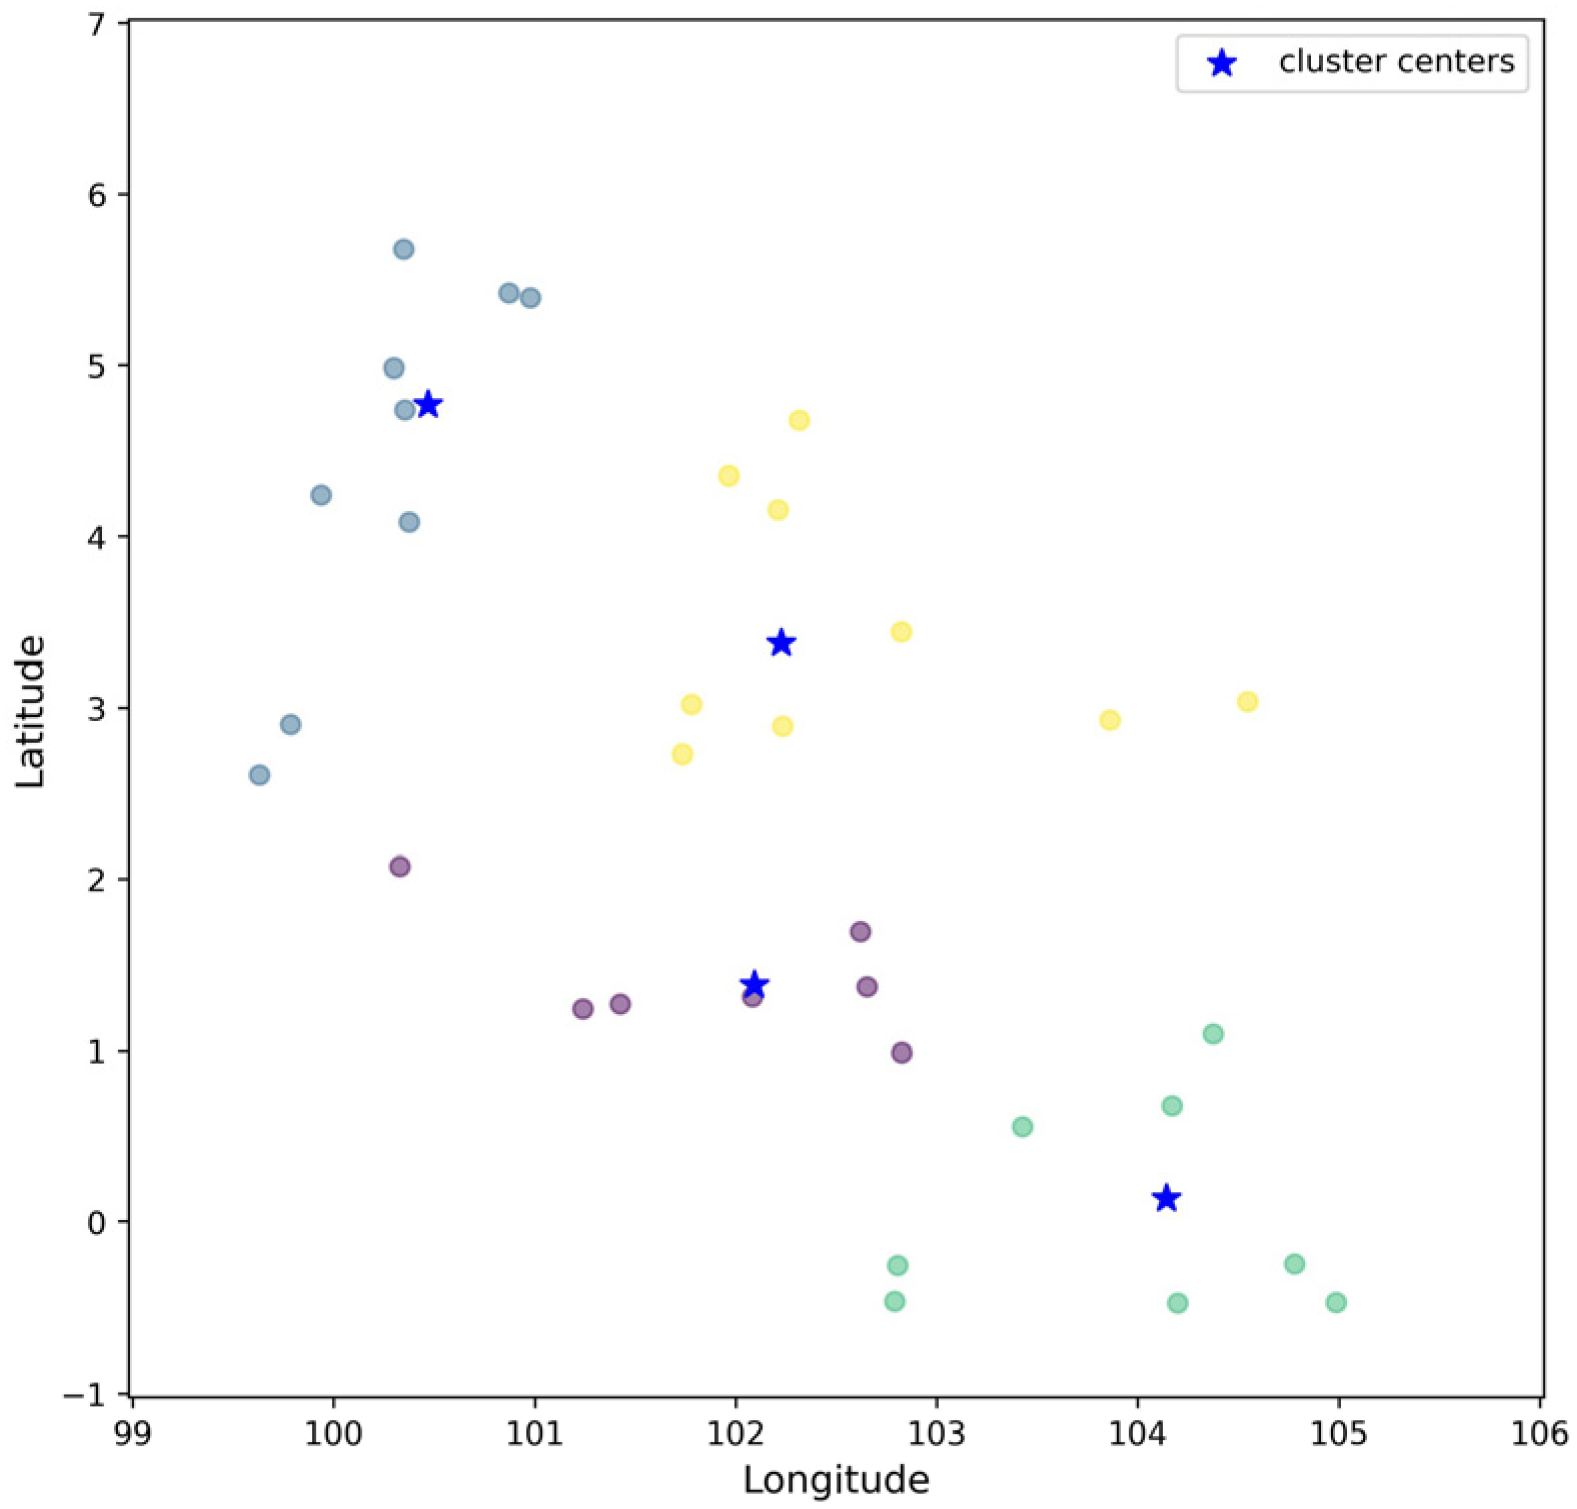
where m reflects the level of fuzziness, and the higher its value, the fuzzier the cluster. In this paper, it is set to 2. By iteratively updating the cluster centers C and the membership matrix W , FCM converges. Based on the final W , a flight is considered to belong to the cluster with the maximum degree of membership. For a more detailed description of the FCM algorithm, see [21]. Without a loss of generality, we randomly select a time interval (11:30 UTC on 1 December 2019) from the existing data to show the effect of the FCM algorithm. Figure 2 gives the corresponding clustering results of flight position data in Singapore regional airspace, where different colors correspond to different clusters, and the blue star is the cluster center. Using these cluster centers as the initial positions of subsequent sites, the initial shape of the sector can be further generated by the Voronoi diagram.

3.2. Sector Generation Based on Voronoi Diagrams

To sectorize a given airspace and generate sector boundaries, the Voronoi diagram is applied. Based on a set of generator points (also known as sites), it helps to divide a plane into different regions, where each region contains one site. For any point in a region, they are closer to the corresponding site than to other sites. Due to the natural characteristics of convexity and connectivity of the divided regions, the Voronoi diagram is widely used in the airspace sectorization problem [22].
Since a set of sites corresponds to a sector partition result, in this paper, sites S are regarded as decision variables for subsequent sector optimization modules, which can be expressed as:
S = { s 1 , s 2 , , s K } = { ( l o n 1 , l a t 1 ) , ( l o n 2 , l a t 2 ) , , ( l o n K , l a t K ) }
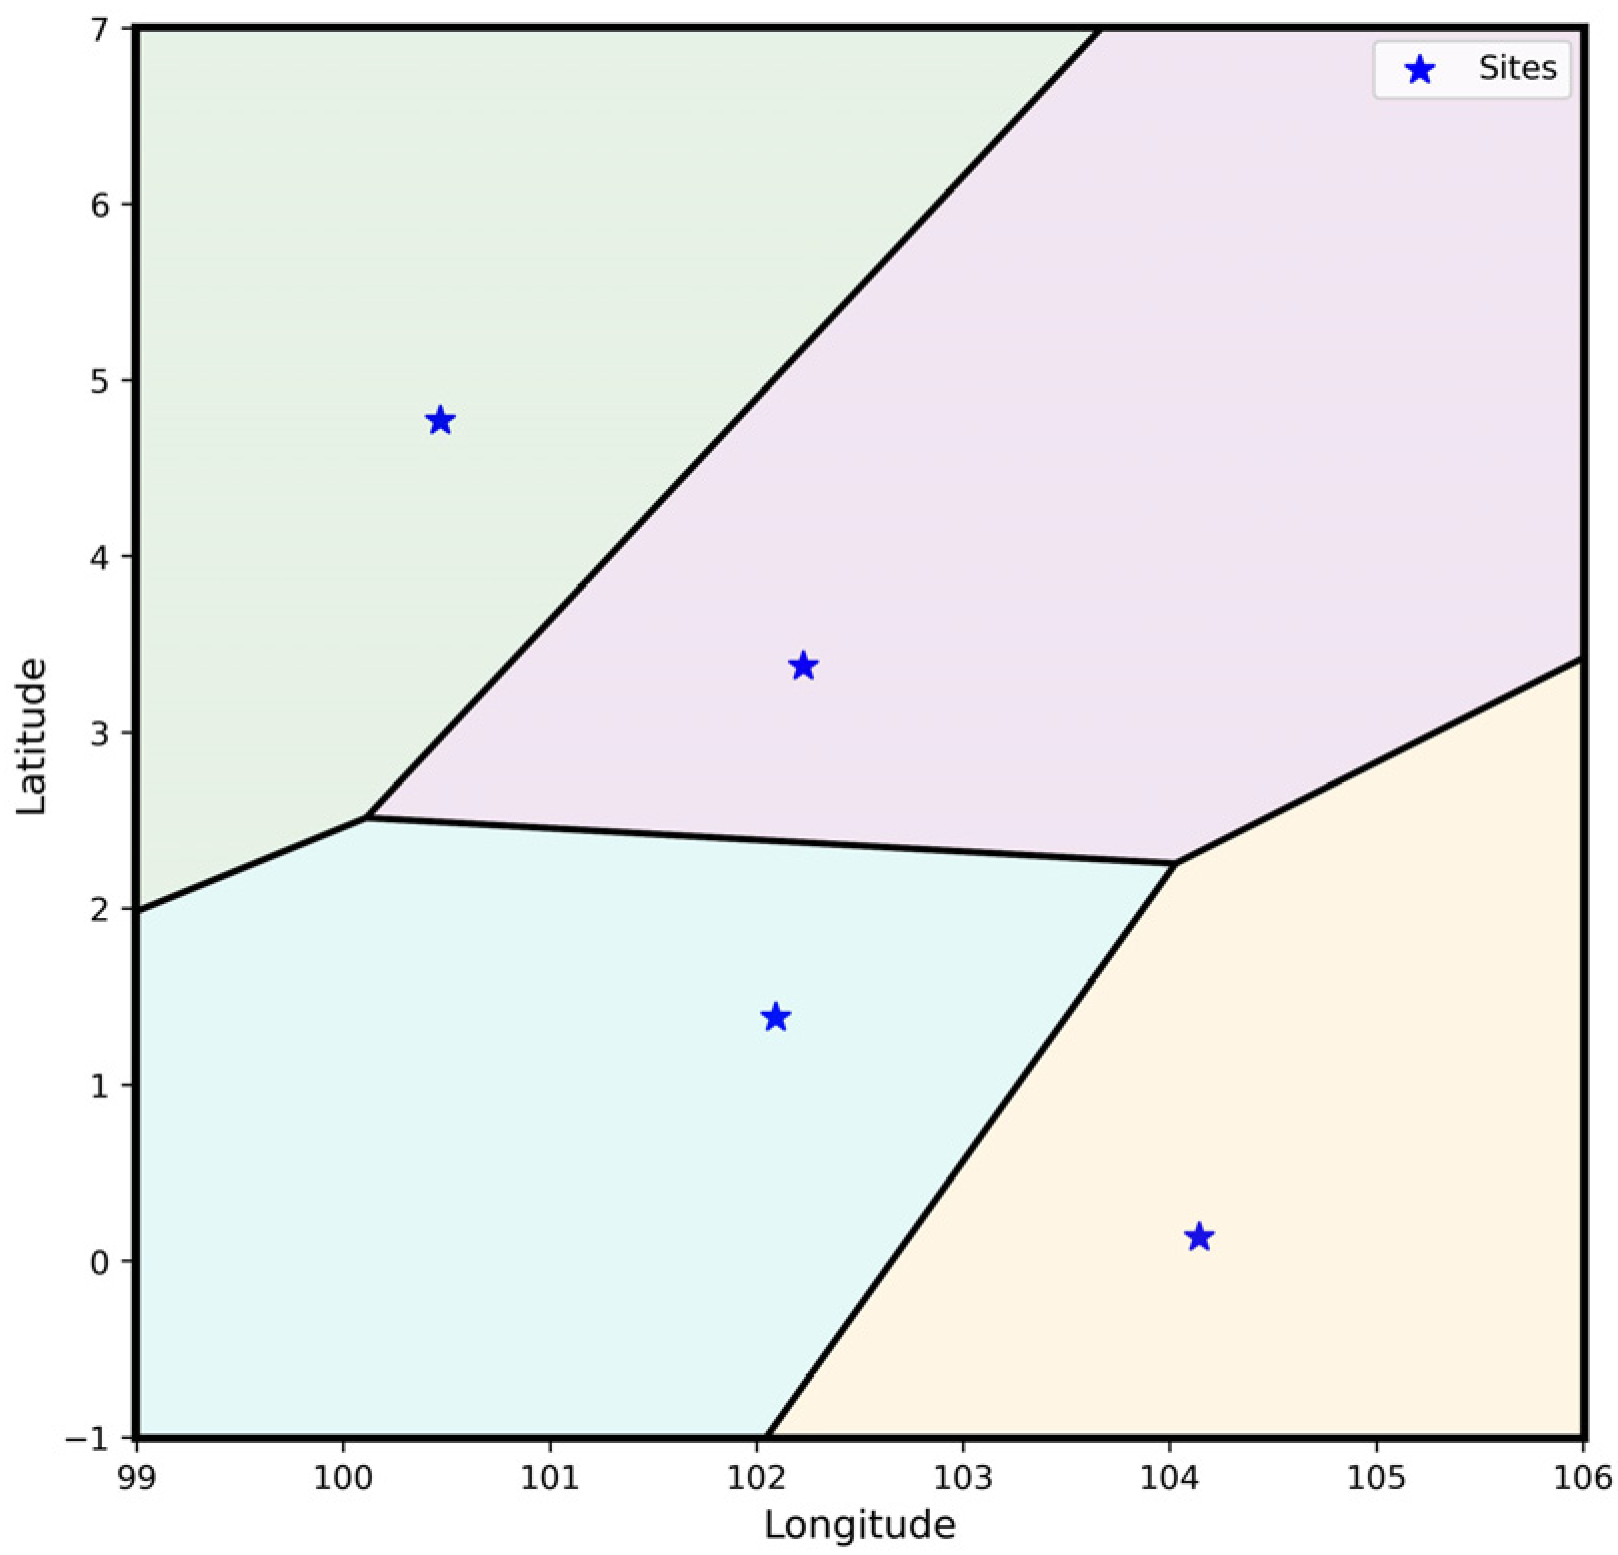
where ( l o n , l a t ) is the 2D position (i.e., longitude and latitude) of the site and K is the number of 2D sectors. Figure 3 gives a toy example of airspace sectorization using the Voronoi diagram with four sites, where different colors represent different sectors. In addition, in order to extend to 3D sectors, the vertical division method is adopted, where a specific altitude value is used to indicate the division line. In this way, the geometrically right prism constraint of the 3D sector is also ensured, which is convenient for the controller to observe their screen clearly.

3.3. Workloads Evaluation Using Dynamic Density

To reasonably evaluate the workload inside each sector, the concept of dynamic density (DD) [5] is introduced. As a well-known air traffic management metric, it takes both traffic density and traffic complexity into account and can fully reflect the monitoring workload and conflict workload of controllers within a sector.
Specifically, DD is a linear combination of 9 different traffic factors, which is calculated as follows:
D D = w 1 * n H C + w 2 * n S C + w 3 * n A C + w 4 * n M D 5 + w 5 * n M D 10 + w 6 * n C P 25 + w 7 * n C P 40 + w 8 * n C P 70 + w 9 * n T D
where n H C , n S C , and n A C are the number of flights whose heading change, speed change, and altitude change exceed their respective predefined thresholds, n M D 5 and n M D 10 are the number of flights whose three-dimensional Euclidean distance to the nearest flight are 0–5 and 5–10 nautical miles, n C P 25 , n C P 40 , and n C P 70 are the number of flights predicted to be in conflict with another flight whose lateral two-dimensional Euclidean distance is 0–25, 25–40, and 40–70 nautical miles, and n T D is the traffic density, i.e., the number of flights. It can be determined from the specific definition that DD effectively characterizes the flight behavior, density, and conflict situation in the airspace from multiple perspectives. As for setting the factor weights (i.e., w 1 to w 9 ), subjective weights are collected from survey data, where 65 qualified air traffic controllers rate each factor on a scale from 1 to 5 and the mean of the subjective scores for each factor is considered the final weight value, as shown in Table 1. A more detailed description and calculation method can be found in [5].

3.4. Sector Optimization Based on NSGA-II with Advanced Strategy and Mechanism

Past literature has confirmed that the two controllers in charge of a sector have a high coupling in their respective workloads (i.e., intra-sector workloads and inter-sector workloads) [4], so airspace sectorization is essentially a multi-objective optimization problem. In order to weigh the interests of multiple parties and provide relevant decision makers with various airspace sectorization schemes for reference, a bi-objective optimization approach considering realistic constraints is proposed. To solve it, one of the representative methods in the genetic algorithm, Non-dominated Sorting Genetic Algorithm II (NSGA-II) [6], is used, in which advanced strategy and mechanism are introduced to improve the efficiency and quality of the solutions. Relevant details are given in the next two subsections.

3.4.1. Problem Definitions: Objectives and Constraints

In general, the proposed bi-objective model considers two objective functions regarding intra-sector workloads and inter-sector workloads, as well as some operation and safety-related constraints.
(1) Objective function 1: Minimize the standard deviation of intra-sector workloads. The first objective function aims to balance the workload of radar controllers within each sector, including monitoring and conflict workloads, evaluated by the dynamic density mentioned in module III. It can be formalized as:
min f 1 = min 1 d ¯ 1 N i = 1 N ( d i d ¯ ) 2
where d i is the dynamic density of sector i , d ¯ = 1 N i = 1 N d i is the mean dynamic density of all sectors, and N is the number of 3D sectors. Note that the standard deviation is normalized based on the mean.
(2) Objective function 2: Minimize the total inter-sector workloads. The second objective function aims to minimize the overall coordination workload of planning controllers between sectors, usually measured in terms of the number of flights leaving each sector. It can be defined as:
min f 2 = min i = 1 N n i
where n i is the number of flights leaving sector i . Since the number of flights leaving sectors depends on the specific sector boundaries, this objective function can indirectly generate sector shapes that are consistent with traffic flow, and thus conforms to controller preferences.
(3) Operation constraint: Minimum workload within each sector. Due to the non-dominated properties of the solutions on the Pareto front, part of the solutions of the multi-objective optimization model often cannot meet the actual operational requirements, such as the existence of empty sectors without any flights. To avoid this phenomenon, we specify the minimum intra-sector workload for each sector with reference to the average ones, and it is formalized as:
d i α d ¯ ,     i { 1 , 2 , , N }
where α is the tolerance ratio given in advance. In addition to ensuring no empty sectors, this constraint also indirectly limits the maximum intra-sector workload (the total intra-sector workload is almost constant), which is more conducive to balancing the workload within each sector.
(4) Safety constraint: Distance from crossing point to sector boundary. In order to reserve enough time for air traffic controllers to resolve conflicts near the sector boundary, a minimum safe distance between the crossing point (CP) and the sector boundary is set. Hereby, CP is defined as a potential conflict zone where pairs of aircraft are within 10 nautical miles horizontally and 1000 feet vertically. The safety constraint is formalized as:
| | P i B j | | M ,     i { 1 , 2 , , n C P } , j { 1 , 2 , , N }
where P and B store the information of CP and the sector boundary, respectively, n C P is the number of CP, and M is the distance threshold. In subsequent experiments, it is set to 10 nautical miles.
It should be noted that some other constraints for more realistic scenarios (such as those related to runways and holding areas suggested by ICAO) are not covered in this paper. Instead, more general considerations and constraints are used to generate reasonable sectorization schemes.

3.4.2. Algorithm Designs: NSGA-II with Prior Knowledge and External Archive

Since the airspace sectorization is modeled as a nonlinear multi-objective optimization problem in this paper, the NSGA-II solver is selected as the main optimization tool. As a typical multi-objective evolutionary algorithm, NSGA-II takes ‘Pareto-optimal’ as its core concept. In order to simulate the evolution process of the survival of the fittest in the biological world, it first expresses the individual (that is, the solution to the problem) as a chromosome and forms an initial parent population based on multiple individuals. Then, the parent population undergoes the steps of selection, crossover, and mutation in turn to obtain the offspring population. Finally, to ensure the optimality and diversity of the population, a new parent population is generated from the current parent and offspring populations using non-dominated sorting, crowding distance calculation, and the elitist preservation strategy. The population iterates until a predefined maximum number of iterations is reached.
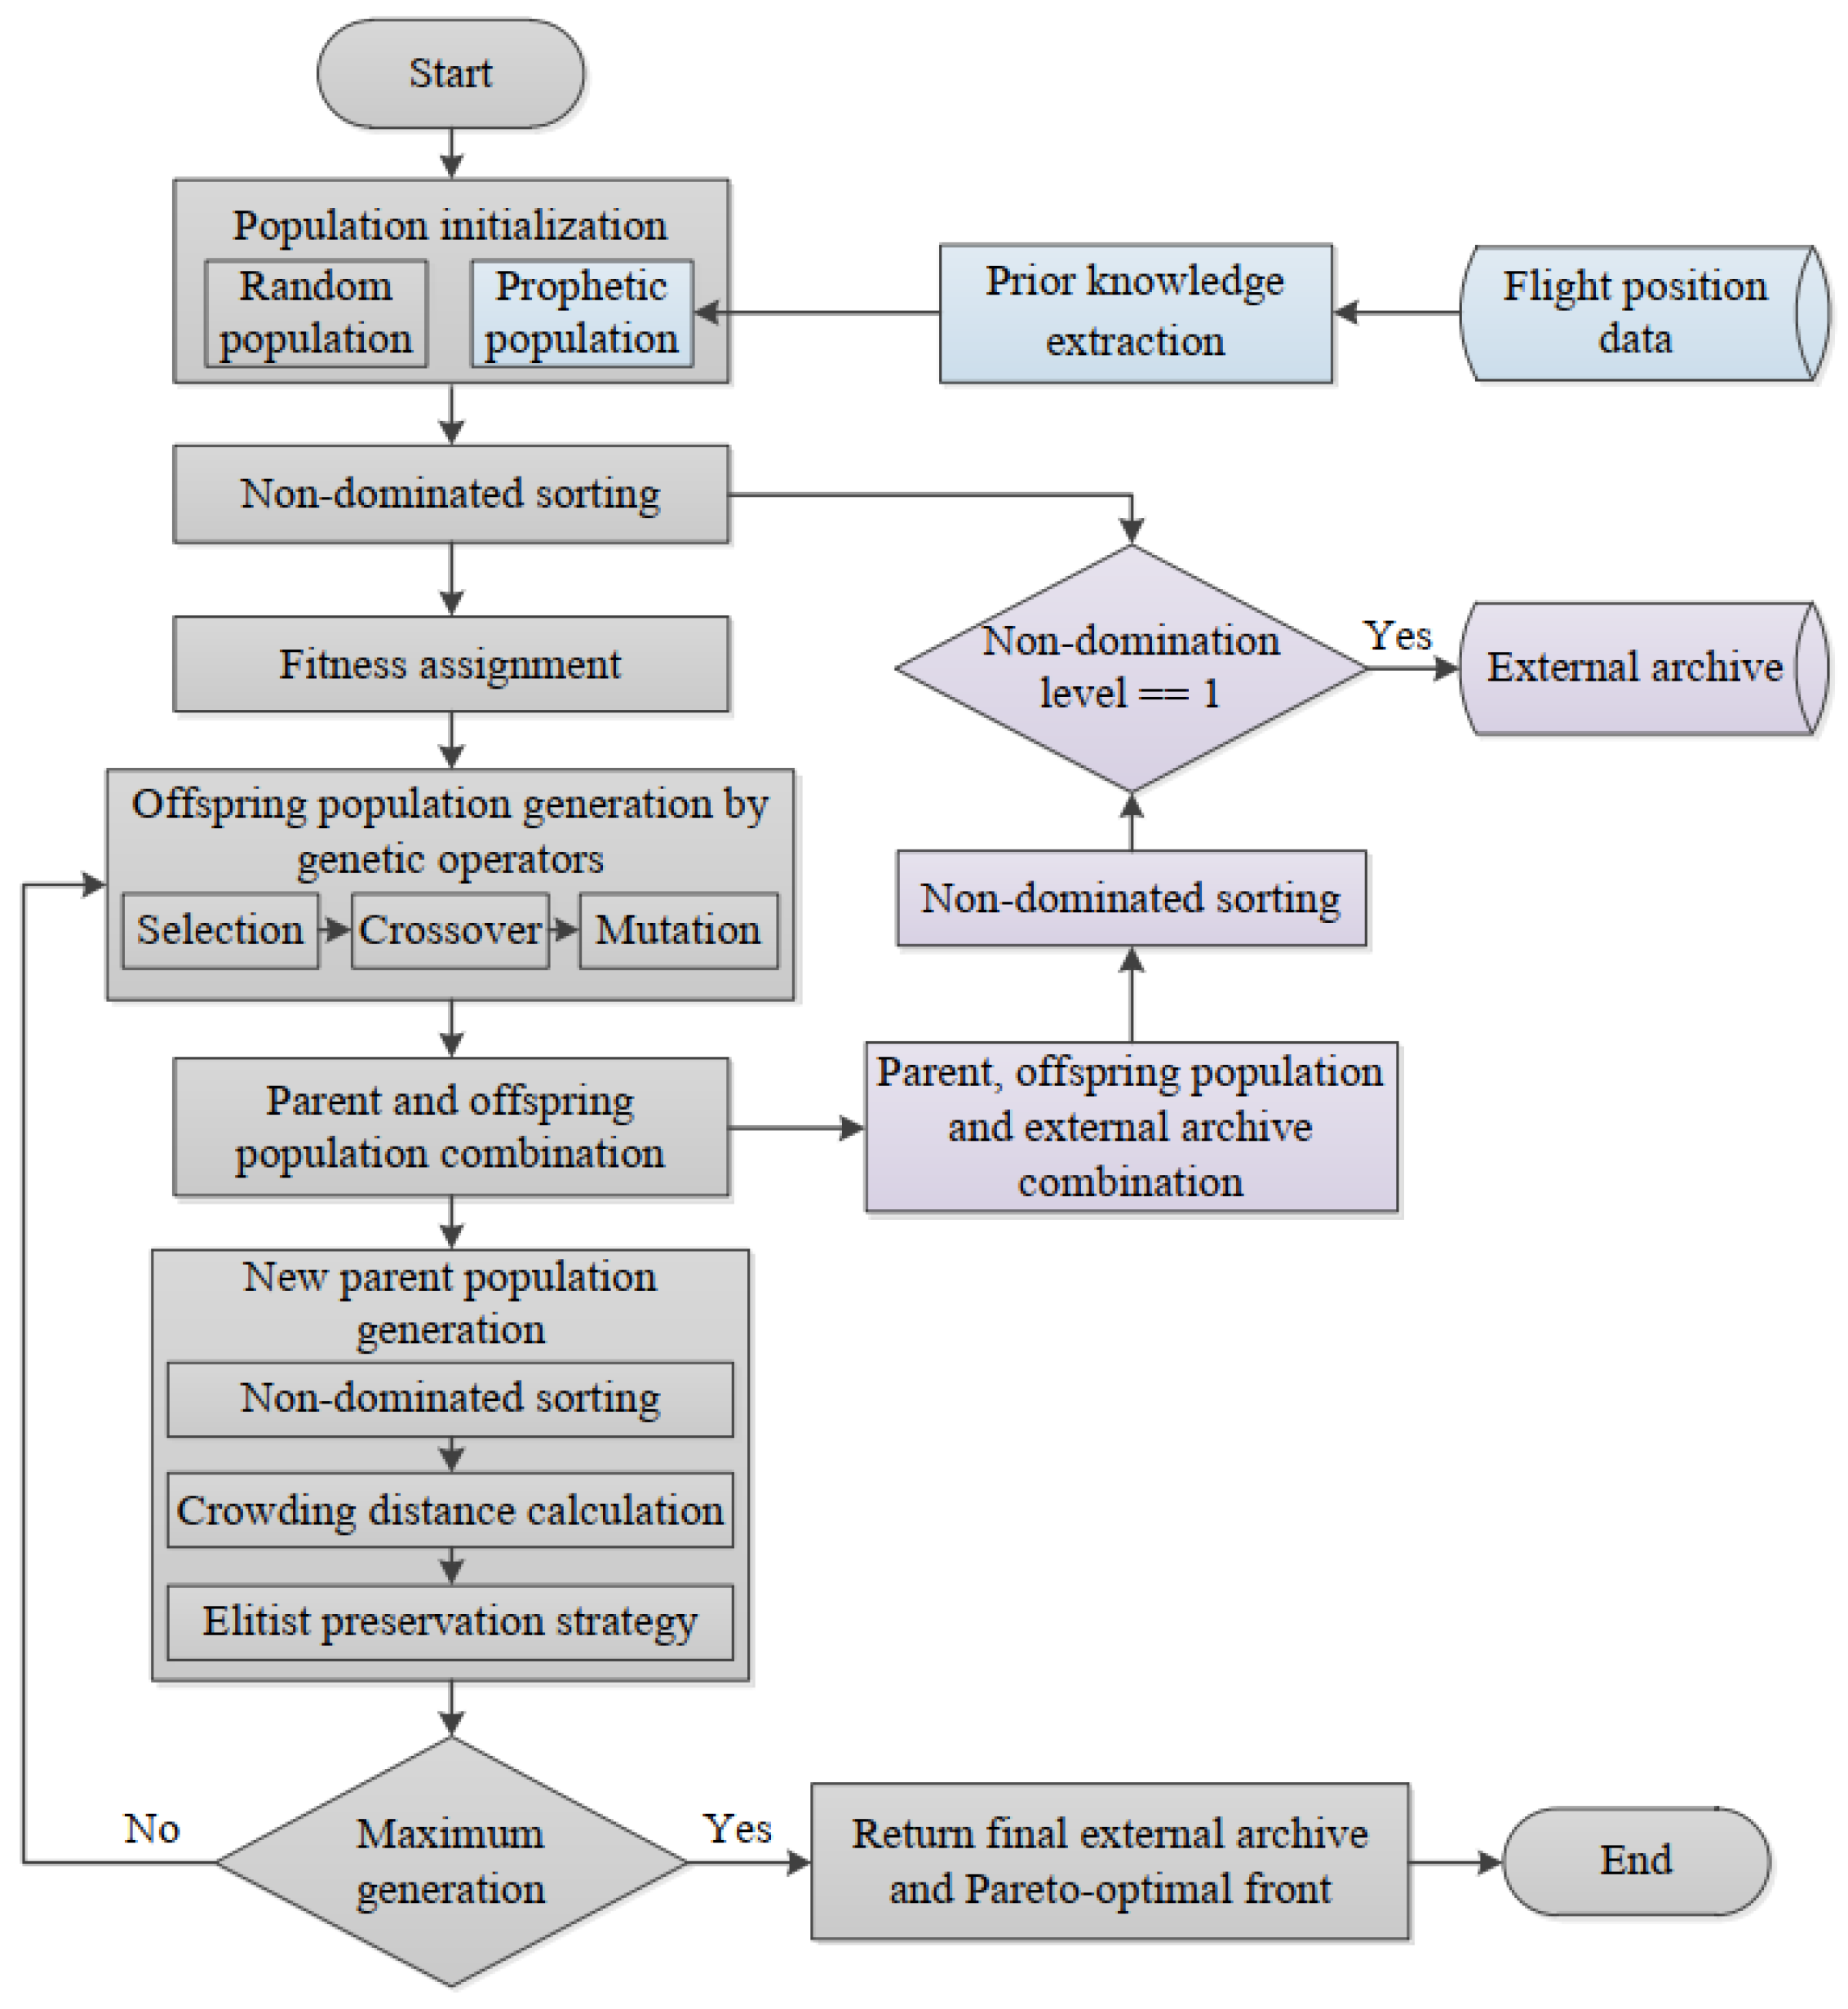
In order to further improve the solution efficiency and quality, we integrate the advanced strategy and mechanism into the NSGA-II algorithm. The first introduces domain prior knowledge in the process of population initialization to speed up convergence. The second maintains an external archive to store continuously updated global non-dominated solutions. Figure 4 shows the flowchart of the improved NSGA-II algorithm, where the gray part is the original NSGA-II, the light blue part corresponds to the strategy, and the rose-red part corresponds to the mechanism. The details of the algorithm applied to the airspace sectorization problem are as follows:
(1) Chromosome encoding: It can be understood from Section 3.2 that 3D sectors are obtained by the vertical division method on the basis of 2D sectors. Hence, the coding of chromosomes consists of two parts, as shown in Figure 5. For N 3D sectors formed by K 2D sectors, the first (red) part consists of latitude and longitude coordinates for Voronoi sites, and the second (blue) part represents the ID of the 2D sector and its corresponding height where the segmentation needs to be performed. With these two parts, the length of the whole chromosome is 2 * K + 2 * ( N K ) = 2 * N . Since longitude, latitude, and altitude are continuous variables and the sector ID is a discrete variable, this is essentially a mixed encoding method of real numbers and integers.
(2) Population initialization: The quality of the initial population affects the search efficiency of the NSGA-II algorithm to a certain extent. In the proposed method, the initial population consists of nearly equal numbers of random and prophetic populations, using random and domain-specific initialization strategies, respectively. The latter strategy first applies Module I (i.e., flight clustering) to the flight position data to obtain the spatial distribution of flights. Then, a complete chromosome containing prior knowledge is formed by taking the cluster centers as the Voronoi sites of the 2D sectors and randomly specifying the sectors and heights of vertical cuts. It is noticed that position data at different time intervals can capture different prior knowledge to enrich the diversity of the prophetic population.
(3) Genetic operators: To select good individuals, a binary tournament rule is employed, where two chromosomes are randomly selected, and the better one is left based on fitness. Here, fitness is defined as the inverse of the non-dominated level. After obtaining the same number of chromosomes as the parent population, simulated binary crossover (SBX) is used for chromosome recombination. Suppose that the values of the same gene position on the two parent chromosomes are p 1 and p 2 , the value of child c 1 and c 2 after SBX recombination is calculated by:
c 1 = 0.5 [ ( 1 + β ) p 1 + ( 1 β ) p 2 ] c 2 = 0.5 [ ( 1 β ) p 1 + ( 1 + β ) p 2 ]
where β is determined by a random number u U ( 0 , 1 ) and is set as:
β = ( 2 u ) 1 η + 1 ,                             u 0.5 [ 2 ( 1 u ) ] 1 η + 1 ,   otherwise
where η is the distribution index. The larger η is, the more likely it is to obtain ‘near-parent’ solutions. To further increase the diversity of genes, the polynomial mutation operator is applied, where the recombined gene achieves mutations with a certain probability plus a value obeying the polynomial probability distribution. More details about the operators can be found in [23].
(4) External archive: The external archive serves as global storage for non-dominated solutions that may be discarded during the generation of new parent populations. In a situation with a small population size, this problem is particularly prominent, which affects the integrity of the final solution set. It first saves individuals with a non-dominated level of 1 in the initial population. Then, after each generation of the offspring population, it mixes itself with the parent and offspring populations, based on which a non-dominated sort is performed and individuals with level 1 are stored in the external archive. It needs to be clear that the external archive does not participate in the generation process of the new parent population. When the maximum number of iterations is reached, the external archive and its corresponding Pareto-optimal front are considered the final output.

4. Empirical Analysis: A Case Study of Singapore Regional Airspace

4.1. Experimental Setup

4.1.1. Data Preparation

To validate the proposed airspace sectorization model, real flight trajectory data of the Singapore regional airspace is obtained from the OpenSky Network [24]. It is a non-profit organization that aims to provide researchers with high-quality flight trajectory information, including aircraft identifiers, 3D positions, track angles, ground speed, etc. In particular, we take the longitude [99, 106], latitude [−1, 7] and altitude [24,000, 42,000] ft as the bounding box to capture all the trajectory data from 11:00 UTC to 12:00 UTC on 1 December 2019. These trajectories are then resampled with an update frequency of 1 min for better calculation of dynamic density. A snapshot of the trajectory is shown in Figure 6. It can be clearly seen that a large number of flights change flight altitude through climbing or descending operations, which further illustrates the necessity and importance of a 3D airspace sectorization model.

4.1.2. Implementation Details

The proposed framework was implemented on a Dell G15 laptop and programmed by Python (3.7.10). The improved NSGA-II algorithm was carried out with the Geatpy toolbox [23] due to its high performance and scalability.
Without the loss of generality, the number of 3D airspace sectors is set to 5, consisting of 4 2D sectors and a vertical division. Hence, the total length of the chromosome is 10. For the relevant parameters of the constraints, the tolerance ratio α is set to 0.5, and the distance threshold M is set to 10 nautical miles. As for the NSGA-II algorithm, the probabilities of crossover and mutation are set to 1 and 0.1, respectively, and their distribution indices are set to 4 and 10, respectively. For the comprehensive consideration of convergence and running time, the population size is set to 15 and the maximum number of iterations is set to 300. Under this parameter setting, the model can sufficiently ensure convergence at an acceptable time cost. Since airspace sectorization is a real problem, in order to ensure the quality and diversity of solutions, under the same parameter settings, the optimization problem is run repeatedly 8 times, and all feasible solutions are collected to obtain the final non-dominated solutions.

4.2. Results and Discussions

4.2.1. Analysis of the Pareto Front

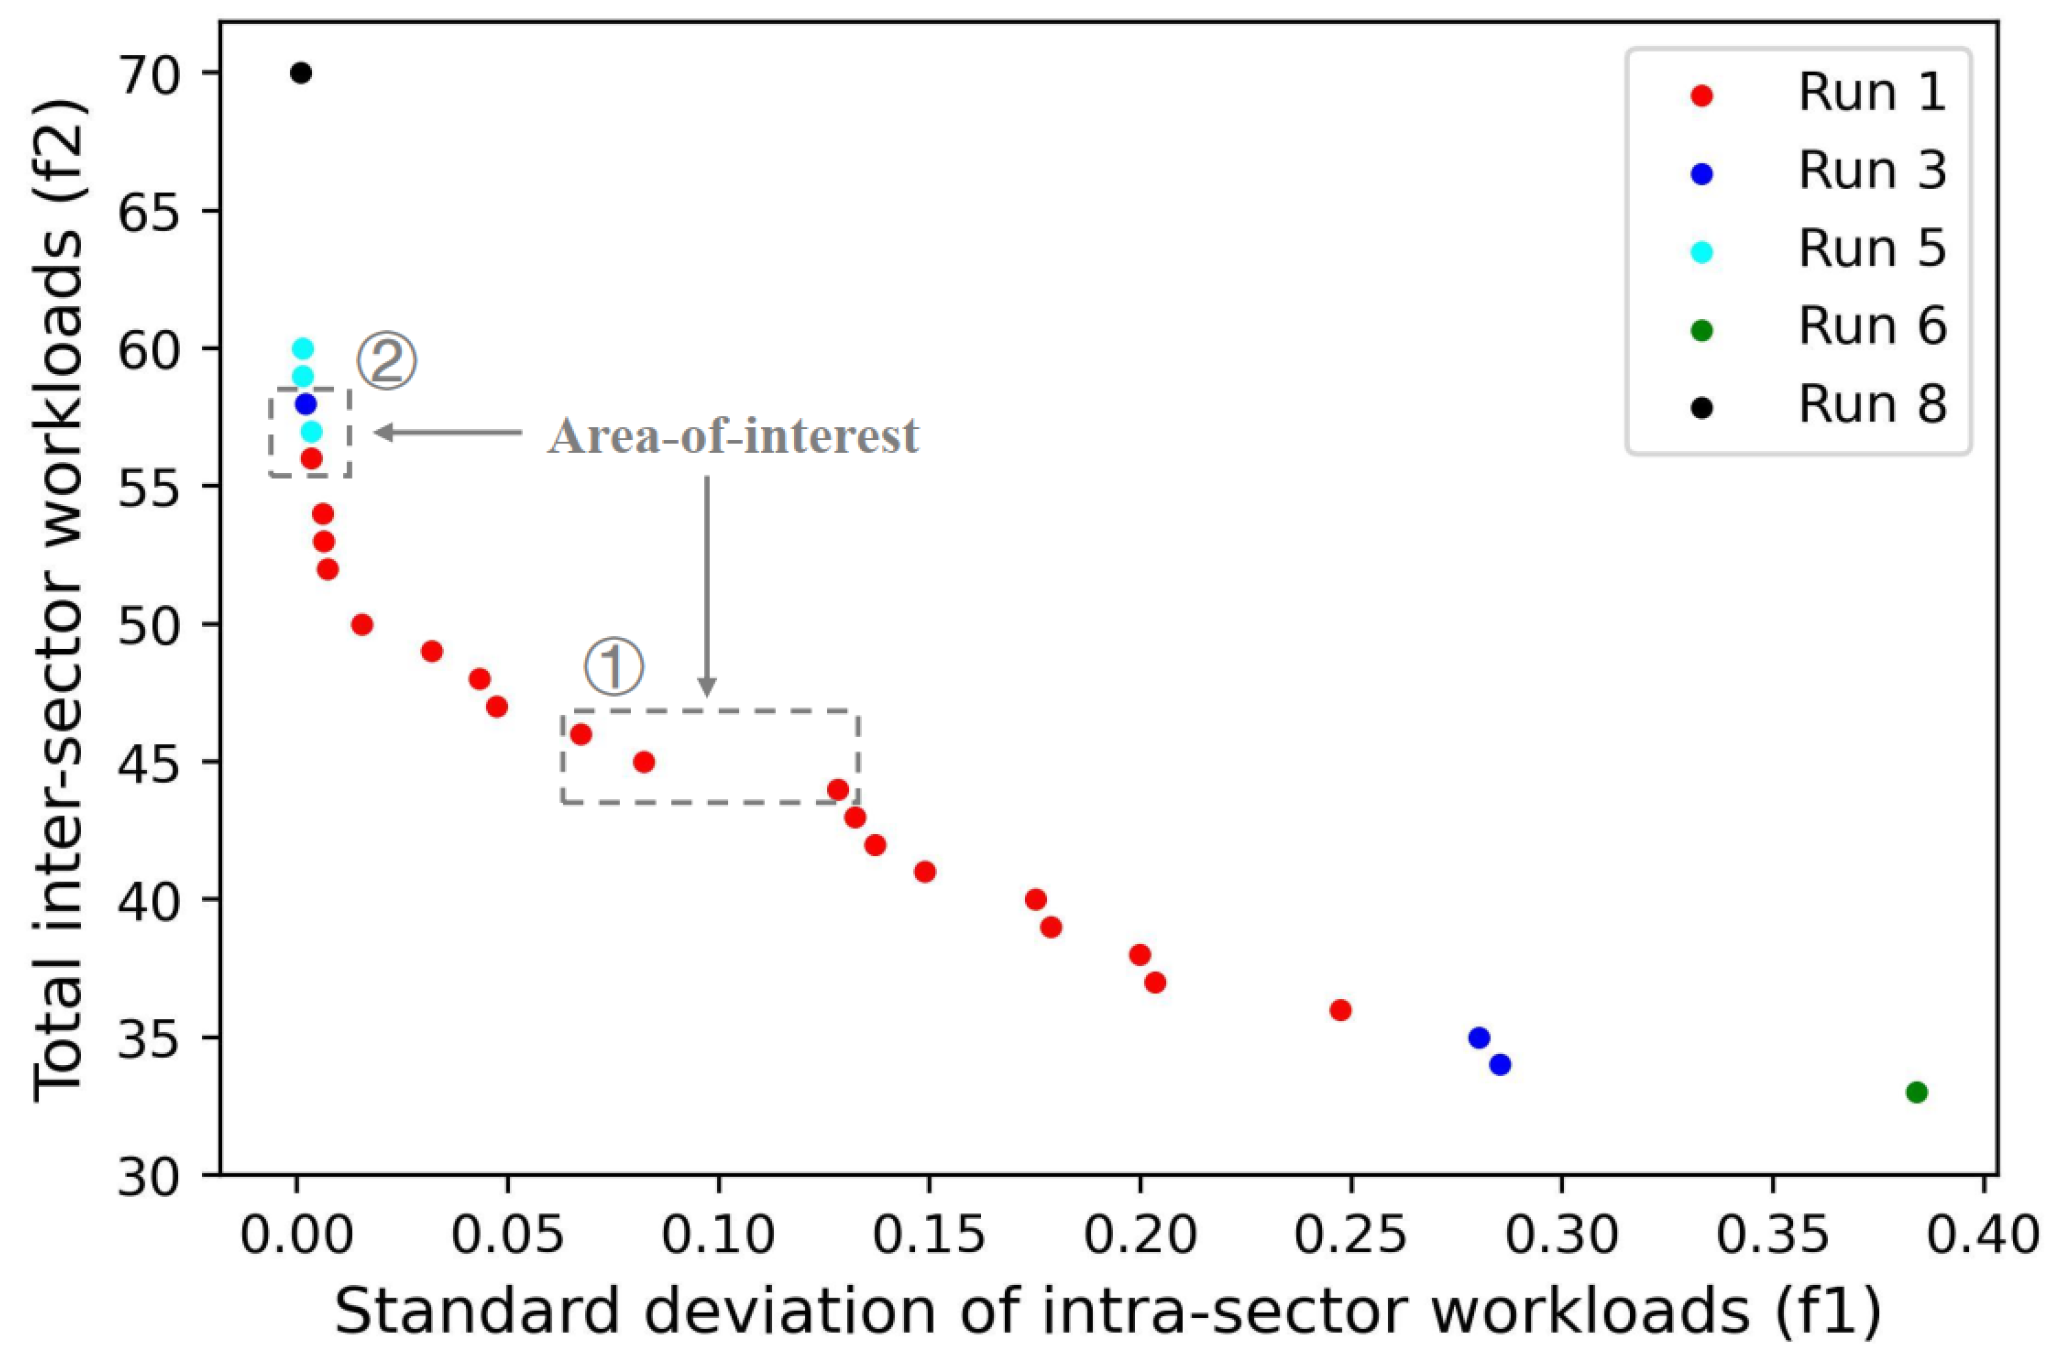
Figure 7 visualizes all non-dominated solutions of the proposed framework. It can be seen that the final Pareto front consists of five (out of eight) runs of non-dominated solutions, including a total of 27 different solutions. The solutions for run 1 are distributed in the middle part of the Pareto front, while the other runs are distributed on the sides. In order to further gain insight into the results of airspace sectorization corresponding to different solutions, we focus on analyzing two regions of interest (as shown in Figure 7), which come from the solutions of a single run and multiple runs, respectively.
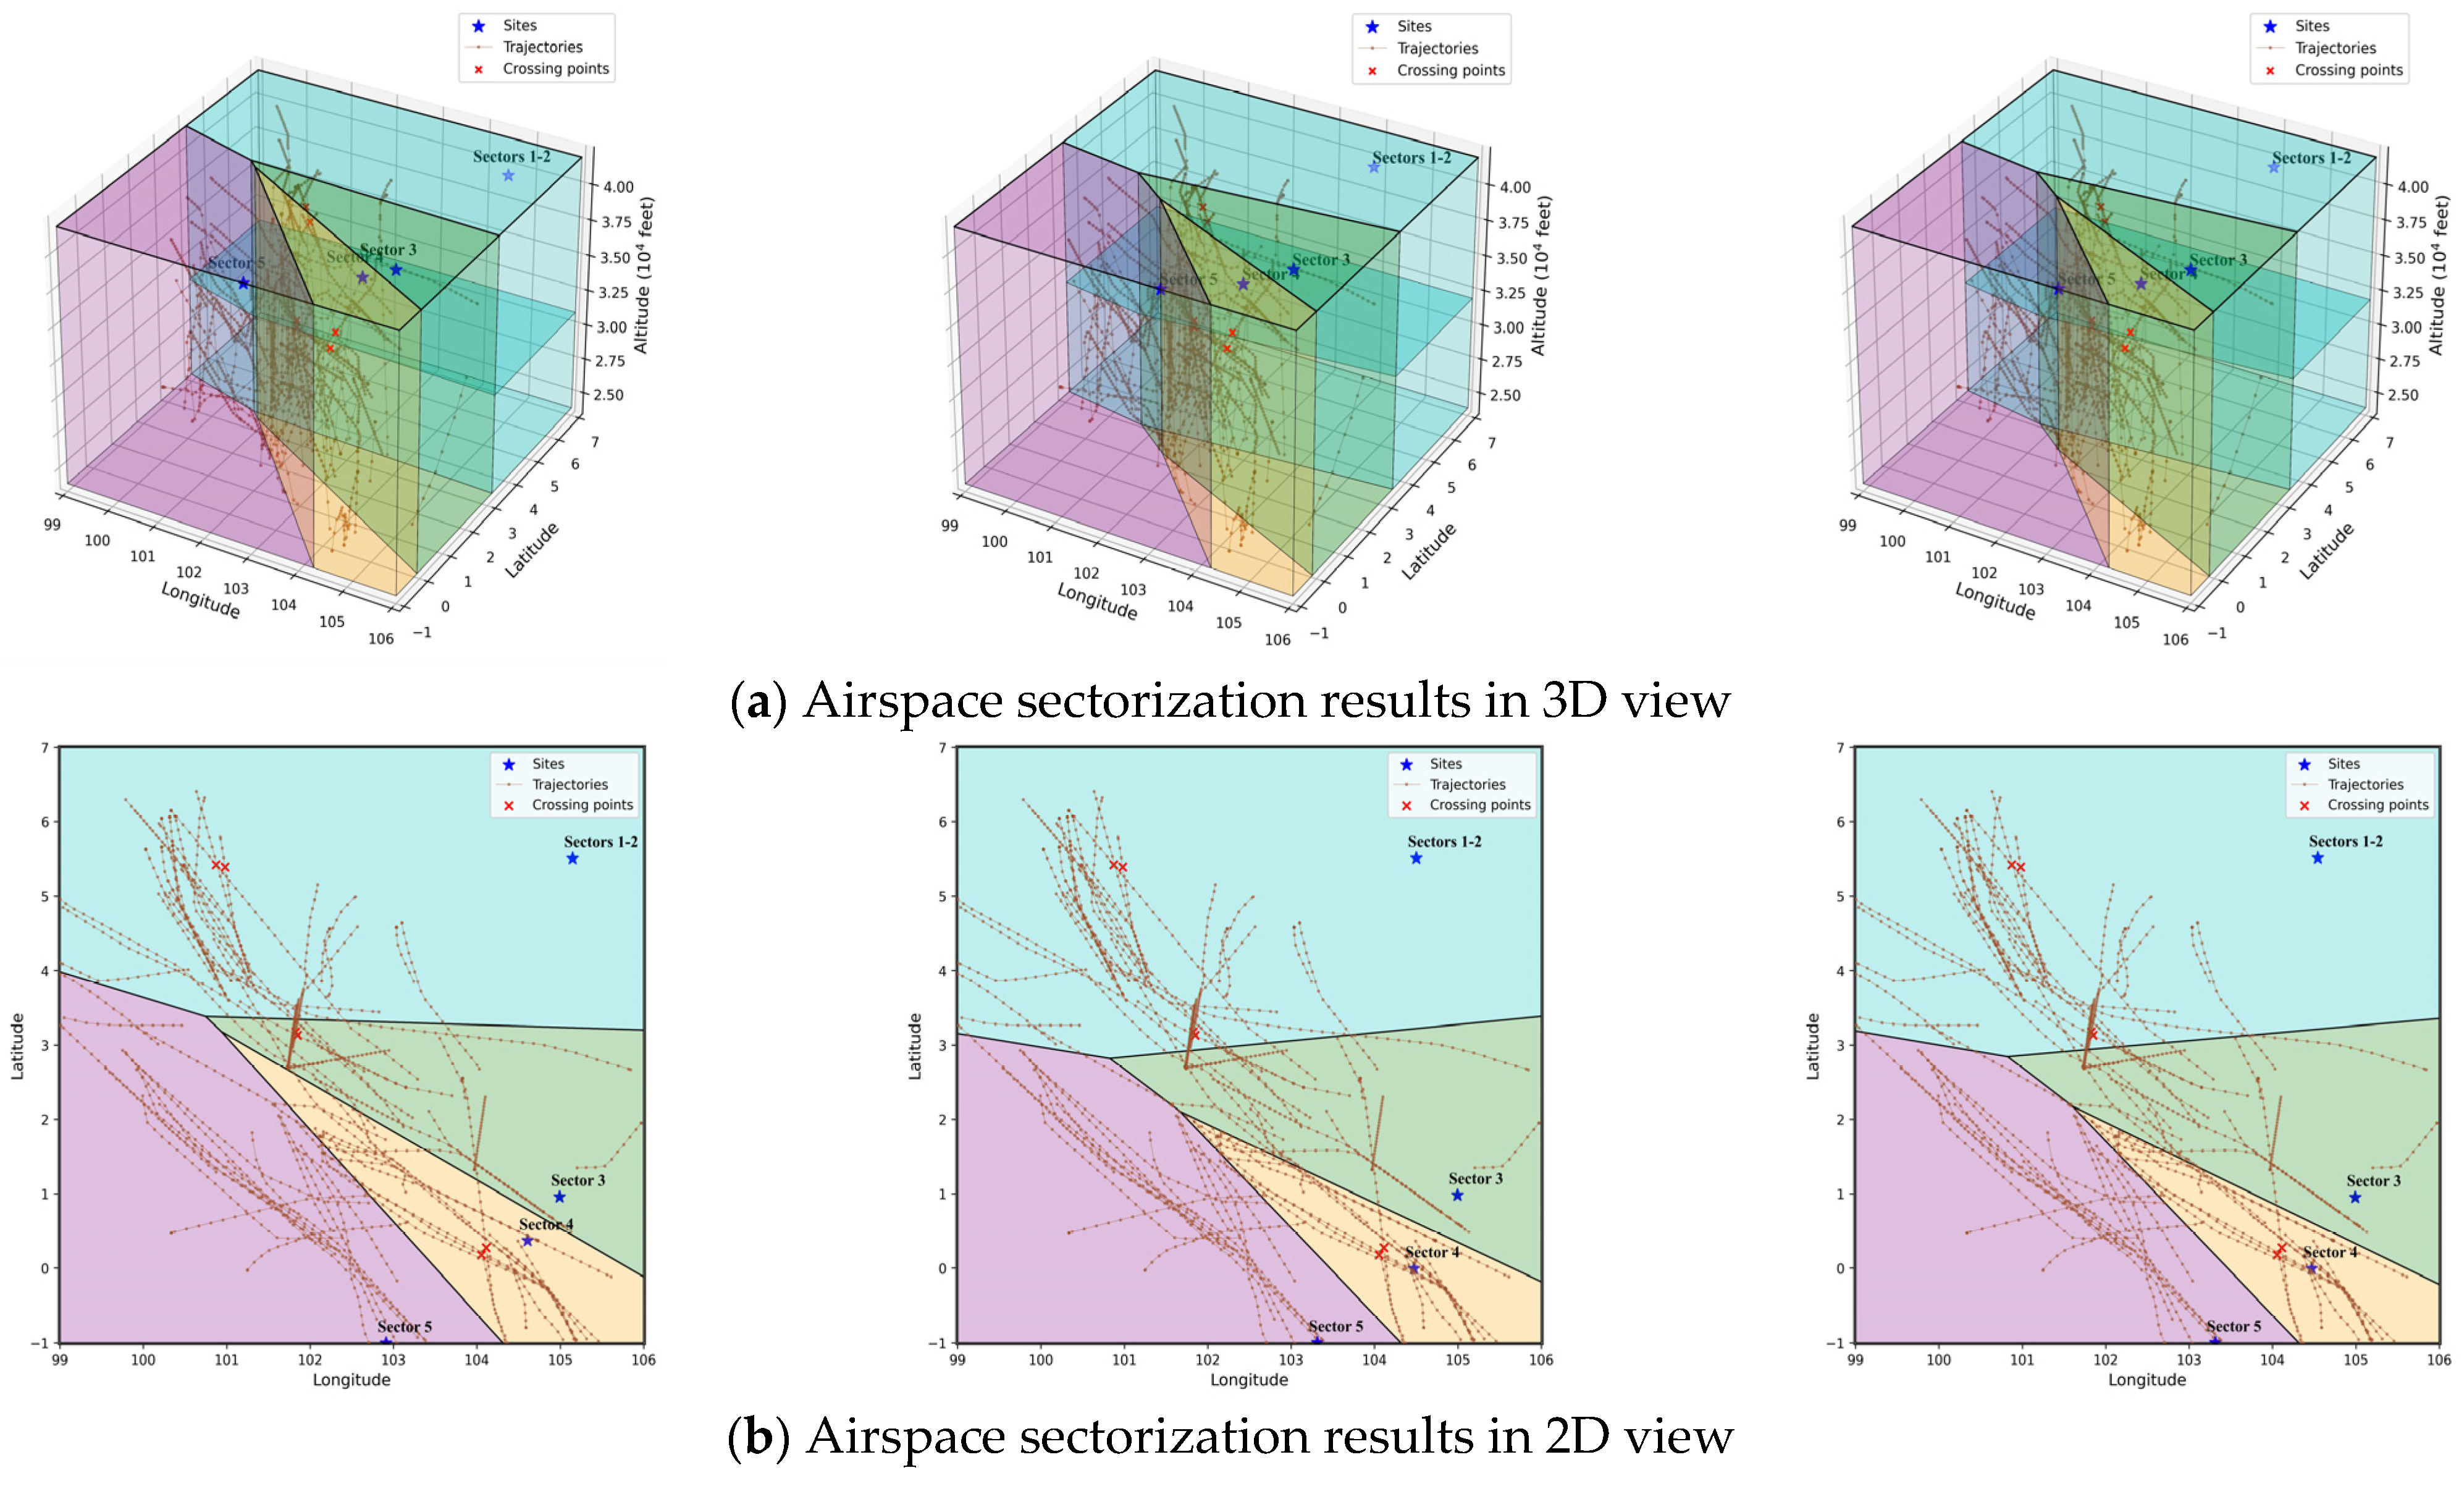
Figure 8 shows the airspace sectorization results of area 1 (i.e., three successive solutions from Run 1). Specifically, Figure 8a,b visualize the results in 3D view and 2D view, and Figure 8c gives the corresponding intra-sector and inter-sector workloads. Some meaningful conclusions were found: (1) The two objective functions corresponding to the three consecutive solutions are [0.128, 44], [0.082, 45], and [0.064, 46], respectively, confirming the mutual constraints of the workload within the sector and the workload between sectors. (2) Although the three solutions have larger differences in distribution (compared to solutions in area 2), the sectorization schemes are similar in both 2D and 3D views. This phenomenon is due to the characteristics of the NSGA-II algorithm itself. In the iterative process, the population fails to jump out of the current optimal solution, resulting in similar solutions within a single run.
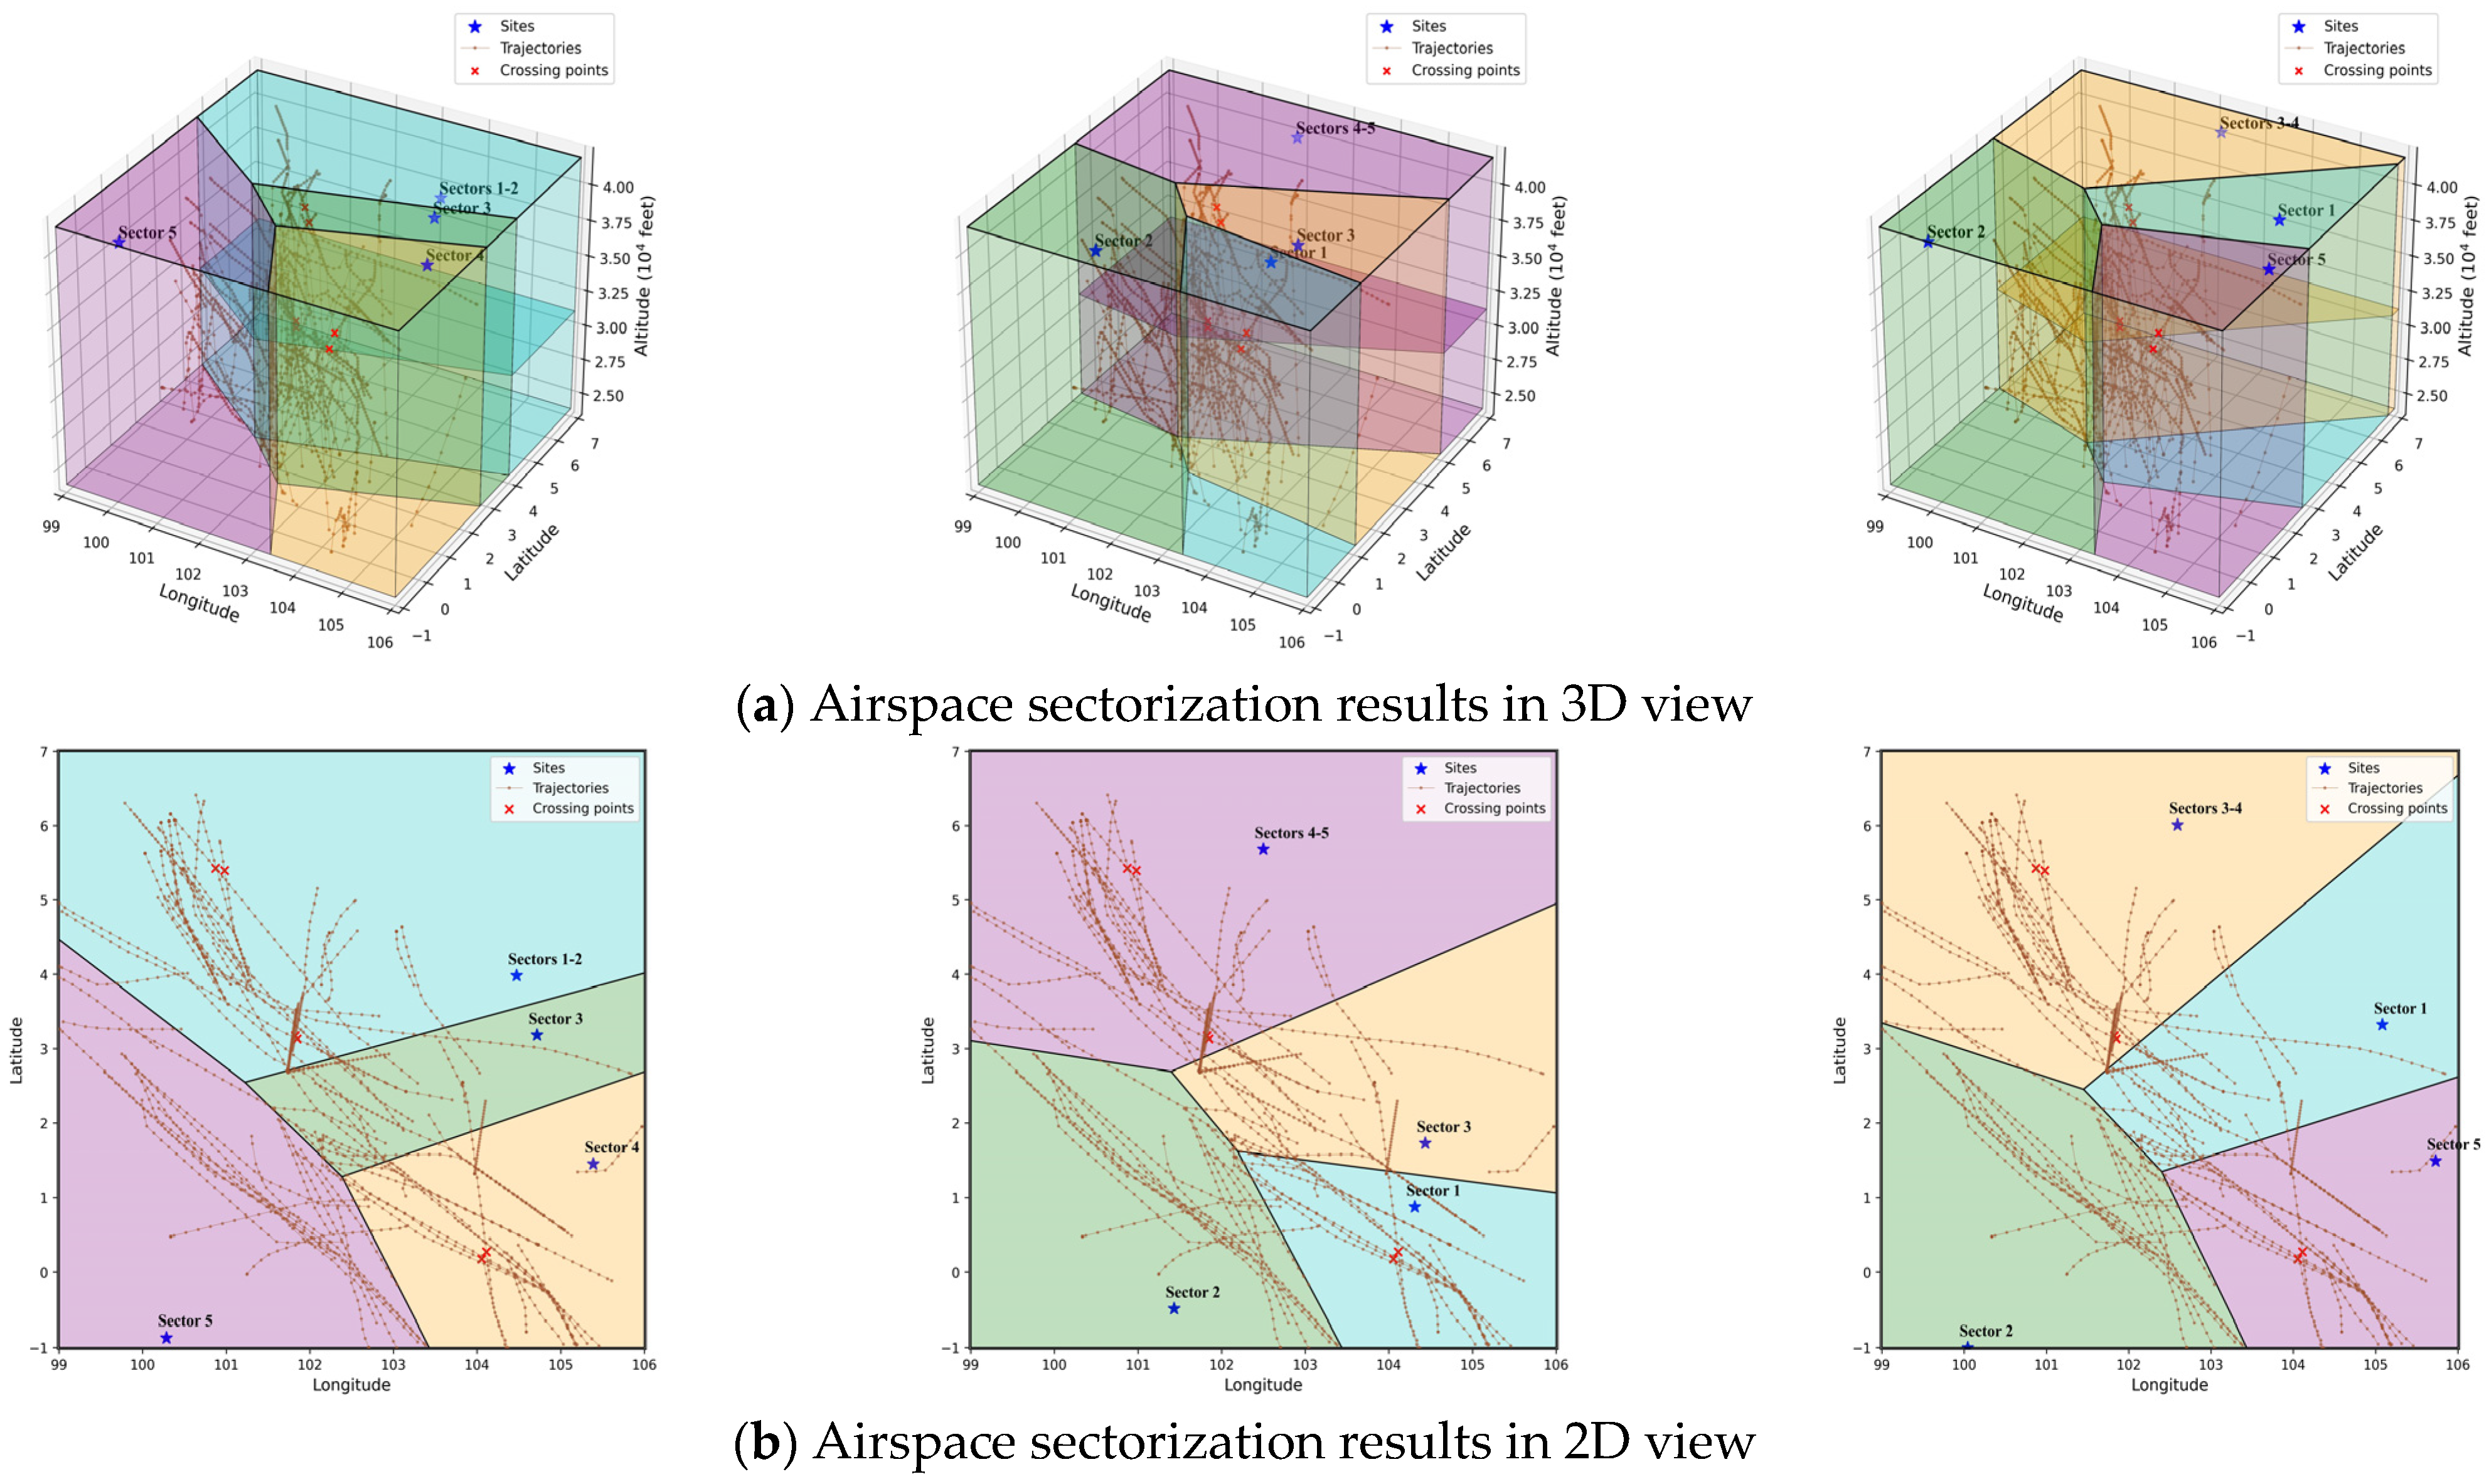
Figure 9 gives the airspace sectorization results of area 2 (i.e., three successive solutions from Runs 1, 5, and 3, respectively). Compared with the solutions of area 1, the solutions of area 2 are closer in distribution, but the difference in their sectorization schemes in 2D and 3D views is more obvious. In particular, the distribution of sites varies significantly. This phenomenon reflects that multiple independent repeated runs can not only improve the quality of non-dominated solutions but also improve the diversity of sectorization schemes, especially when different runs have different initialization populations. In order to determine the final schemes, domain experts need to make further decisions based on relevant requirements. For example, considering some additional soft constraints, such as the balance of sectors in size or coordination workload, a more balanced scheme is beneficial for operations. From the perspective of the sector size, the latter two solutions are more likely to be accepted by decision makers due to the small size of sector 3 in the first solution. On the other hand, from the perspective of the sector coordination workload, the standard deviations of the three schemes are 4.79, 5.00, and 4.76, respectively, so the first and third schemes are better.

4.2.2. Performance Comparison of Different Algorithms

In order to further analyze the impact of different algorithms on optimization performance, qualitative and quantitative comparative experiments are set up. Depending on the specific implementation, the proposed method is compared with the original NSGA-II, NSGA-II with prior knowledge (NSGA-II-pk), and NSGA-II with an external archive (NSGA-II-ea), respectively.
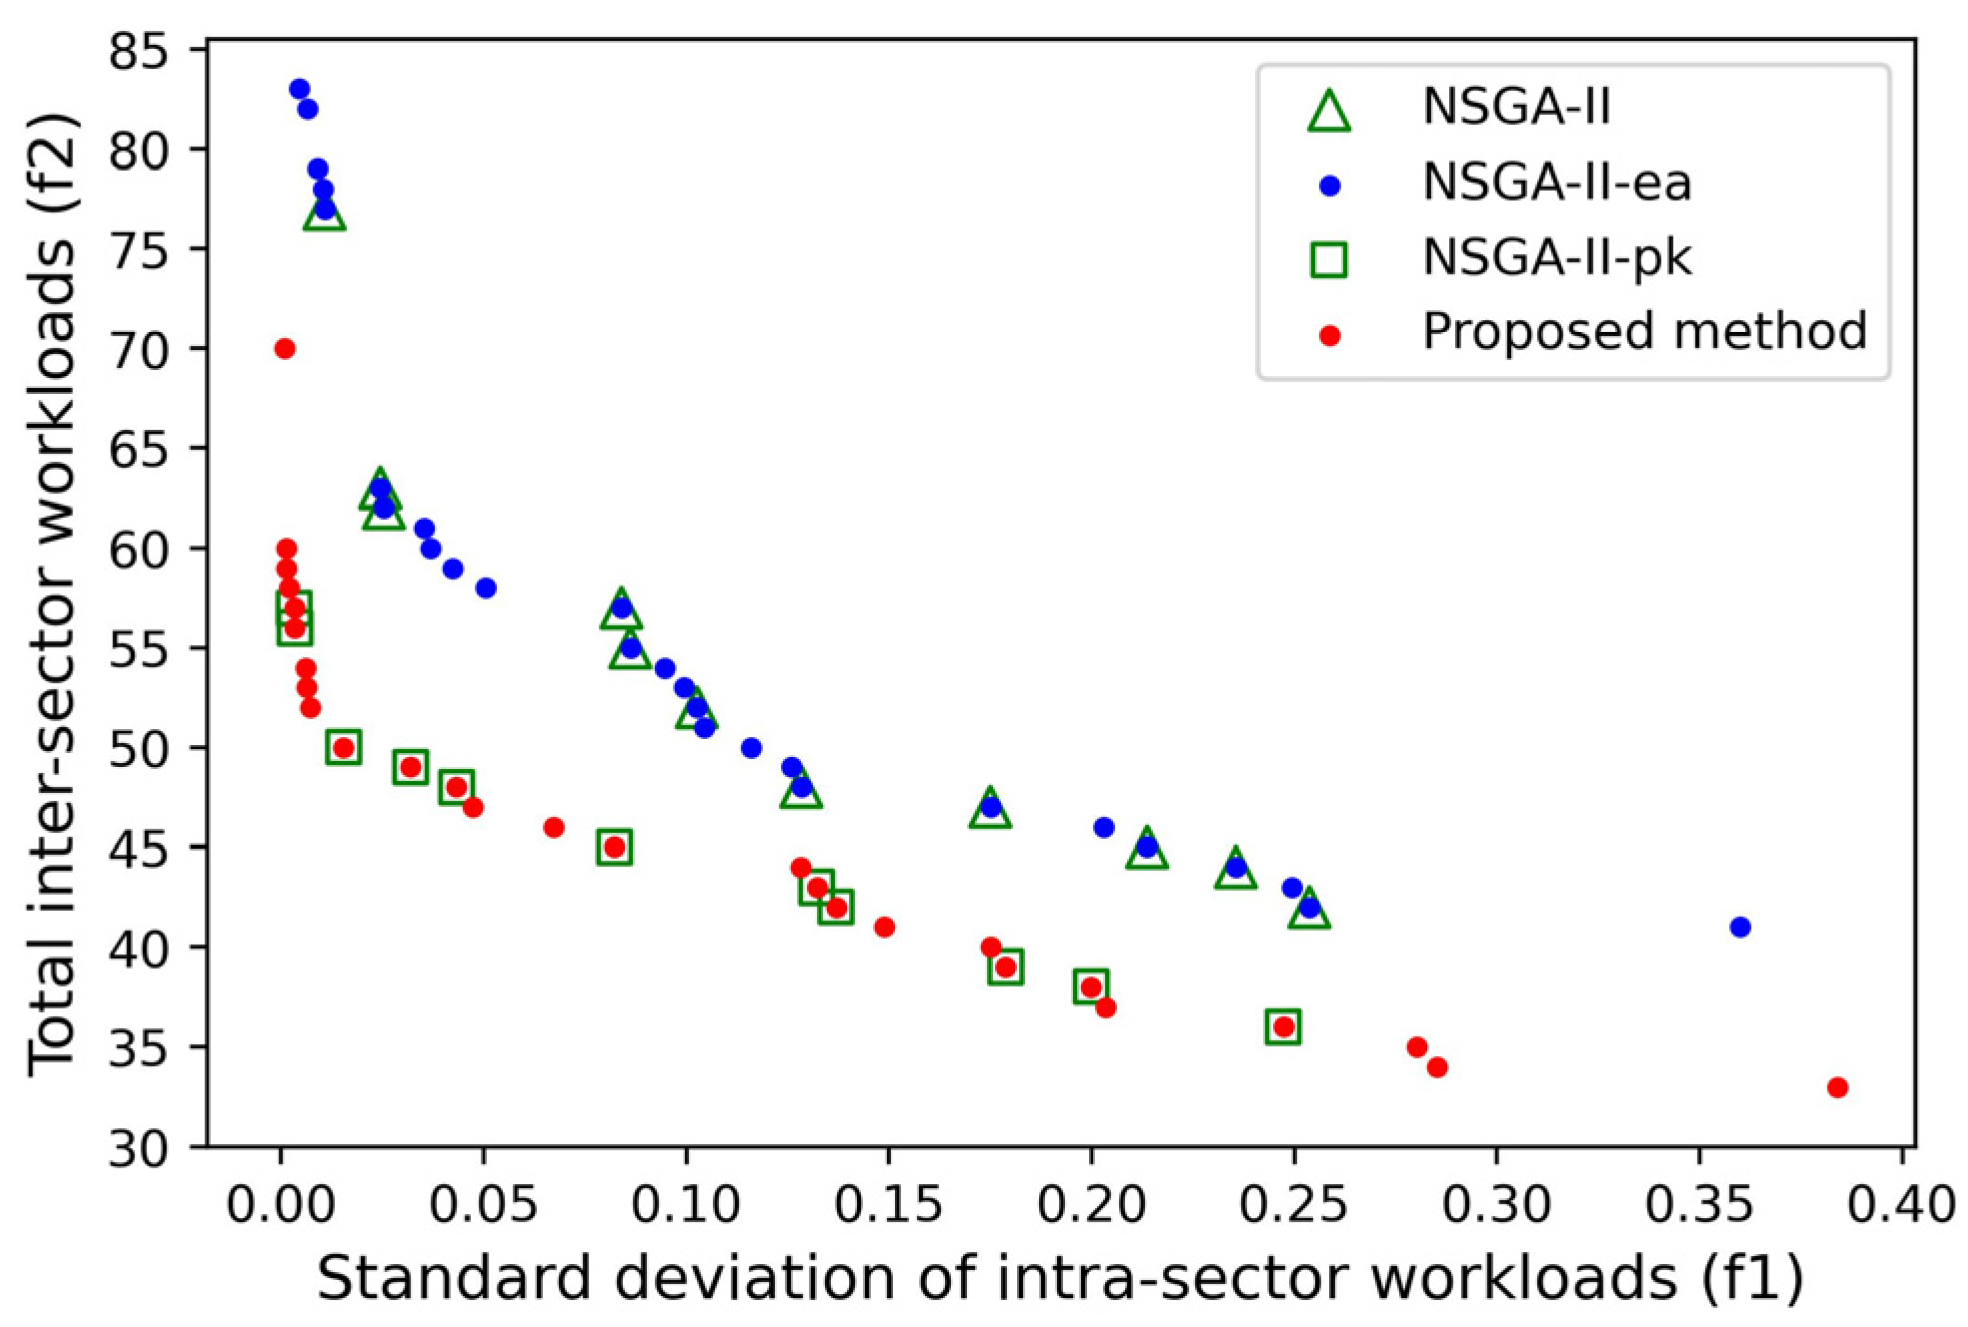
Under the same parameter settings as in Section 4.1.2, the non-dominated solutions of each algorithm are shown in Figure 10. It can be seen that the non-dominated solution sets of NSGA-II and NSGA-II-pk are subsets of NSGA-II-ea and the proposed method, respectively. This strongly confirms that the mechanism of the external archive can improve the integrity of the solution set to a certain extent. It is particularly important in scenarios where the population size is small due to computational time constraints. Furthermore, the solutions of NSGA-II-pk and the proposed method dominate the solutions of NSGA-II and NSGA-II-ea, which demonstrates that prior knowledge effectively accelerates the convergence process of the genetic algorithm with a limited number of iterations.
In addition, three evaluation indicators are used to quantitatively compare the performance of each algorithm, namely the number of solutions (NS), spacing (SP), and hypervolume (HV). Among them, SP measures the distribution of the solution set by comparing the distance between each continuous solution, and the smaller the value, the better the distribution of the solution set. HV reflects the space dominated by the solution set, and the larger the value, the better the convergence and diversity of the solution set. Usually, the calculation of HV needs to specify a reference point, and we set the point formed by 1.1 times the maximum value of each objective function. Table 2 presents the performance comparison of different algorithms, the best of which are indicated in bold. The comparative results further confirm the advantages of the proposed strategy and mechanism. It can be seen from the NS and SP that the external archive captures more solutions on a more balanced distribution. From HV, it can be deduced that the introduction of prior knowledge effectively improves the convergence and diversity of the solution set. In conclusion, b”nefi’ing from the advanced strategy and mechanism, the proposed method achieves the best performance in terms of solution quality and diversity.

5. Conclusions

Sectorization has always been an important issue in airspace management. In order to generate optimization schemes efficiently and reasonably, a bi-objective 3D airspace sectorization framework using NSGA-II with prior knowledge and an external archive was established. In terms of the modeling process, the intra-sector workload, inter-sector workload, and safety restrictions are considered comprehensively. On the basis of the 2D sector, the altitude information of the flight trajectory is introduced to solve the task of 3D airspace sectorization with more realistic significance. In order to achieve this extension and facilitate the controller’s observation, a simple and general 3D structure of sector shape is considered, where the vertical division method is applied to the 2D sector generated by the Voronoi diagram. In terms of the algorithm design, an external archive and prior knowledge are added to improve the quality and diversity of solutions. Experiments on actual operating data show that the proposed method provides a variety of optimal sectorization schemes in a limited running time, which can be used as a powerful tool for air traffic controllers to make decisions. In addition, some potential indicators (e.g., the balance of sectors in size or coordination workload) are analyzed to assist controllers in evaluating and selecting the solutions from the Pareto front.
Future work will focus on the task of dynamic airspace sectorization (DAS) for tactical air traffic management, which not only solves how to divide airspace but also when to divide airspace. Furthermore, a more reasonable weight calculation method for dynamic density, such as the median method and Delphi method, needs to be further considered to reflect the controller’s workload more effectively.

Author Contributions

Conceptualization, W.Z. and M.H.; methodology, W.Z. and J.Y.; software, W.Z. and J.D.; validation, W.Z., J.D. and J.Y.; formal analysis, J.D.; investigation, H.L., W.Z. and J.D.; resources, M.H.; data curation, J.Y.; writing—original draft preparation, W.Z. and J.D.; writing—review and editing, W.Z. and J.D.; visualization, W.Z. and J.D.; supervision, H.L. and M.H.; project administration, M.H.; funding acquisition, W.Z., J.D., M.H. and J.Y. All authors have read and agreed to the published version of the manuscript.

Funding

This research was funded by the National Key R&D Program of China (No. 2021YFB1600500), the National Natural Science Foundation of China (No. 52002178), the Postgraduate Research & Practice Innovation Program of Jiangsu Province (KYCX22_0373), and the China Scholarship Council (202106830077, 202106830100).

Data Availability Statement

Not applicable.

Acknowledgments

We would like to thank the OpenSky Network for providing rich APIs to help the authors collect the ADS-B flight trajectories data used in this paper.

Conflicts of Interest

The authors declare no conflict of interest.

References

  1. Gianazza, D. Forecasting workload and airspace configuration with neural networks and tree search methods. Artif. Intell. 2010, 174, 530–549. [Google Scholar] [CrossRef] [Green Version]
  2. Flener, P.; Pearson, J. Automatic airspace sectorisation: A survey. arXiv 2013, arXiv:1311.0653. [Google Scholar]
  3. Delahaye, D.; Schoenauer, M.; Alliot, J.M. Airspace sectoring by evolutionary computation. In Proceedings of the 1998 IEEE International Conference on Evolutionary Computation Proceedings. IEEE World Congress on Computational Intelligence (Cat. No. 98TH8360), Anchorage, AK, USA, 4–9 May 1998; pp. 218–223. [Google Scholar]
  4. Yin, C.W.S.; Venugopalan, T.K.; Suresh, S. A multi-objective approach for 3D airspace sectorization: A study on Singapore regional airspace. In Proceedings of the 2016 IEEE Symposium Series on Computational Intelligence (SSCI), Athens, Greece, 6–9 December 2016; pp. 1–8. [Google Scholar]
  5. Laudeman, I.V.; Shelden, S.G.; Branstrom, R.; Brasil, C.L. Dynamic Density: An Air Traffic Management Metric; NASA: Washington, DC, USA, 1998. [Google Scholar]
  6. Deb, K.; Pratap, A.; Agarwal, S.; Meyarivan TA, M.T. A fast and elitist multiobjective genetic algorithm: NSGA-II. IEEE Trans. Evol. Comput. 2002, 6, 182–197. [Google Scholar] [CrossRef] [Green Version]
  7. Sergeeva, M.; Delahaye, D.; Mancel, C. 3D airspace sector design by genetic algorithm. In Proceedings of the 2015 International Conference on Models and Technologies for Intelligent Transportation Systems (MT-ITS), Budapest, Hungary, 3–5 June 2015; pp. 499–506. [Google Scholar]
  8. Delahaye, D.; Puechmorel, S. 3D airspace design by evolutionary computation. In Proceedings of the 2008 IEEE/AIAA 27th Digital Avionics Systems Conference, St. Paul, MN, USA, 26–30 October 2008; pp. 3. B. 6-1–3. B. 6-13. [Google Scholar]
  9. Tang, J.; Alam, S.; Lokan, C.; Abbass, H.A. A multi-objective approach for dynamic airspace sectorization using agent based and geometric models. Transp. Res. Part C: Emerg. Technol. 2012, 21, 89–121. [Google Scholar] [CrossRef]
  10. Kulkarni, S.; Ganesan, R.; Sherry, L. Static sectorization approach to dynamic airspace configuration using approximate dynamic programming. In Proceedings of the 2011 Integrated Communications, Navigation, and Surveillance Conference Proceedings, Herndon, VA, USA, 10–12 May 2011; pp. J2-1–J2-9. [Google Scholar]
  11. Leiden, K.; Peters, S.; Quesada, S. Flight level-based dynamic airspace configuration. In Proceedings of the 9th AIAA Aviation Technology, Integration, and Operations Conference (ATIO) and Aircraft Noise and Emissions Reduction Symposium (ANERS), Hilton Head, SC, USA, 21–23 September 2009; p. 7104. [Google Scholar]
  12. Conker, R.S.; Moch-Mooney, D.A.; Niedringhaus, W.P.; Simmons, B.T. New process for “clean sheet” airspace design and evaluation. In Proceedings of the 7th US/Europe ATM Seminar, Barcelona, Spain, 2–5 July 2007; pp. 1–10. [Google Scholar]
  13. Fortune, S. Voronoi diagrams and Delaunay triangulations. Comput. Euclidean Geom. 1995, 225–265. [Google Scholar]
  14. Yousefi, A.; Donohue, G. Temporal and spatial distribution of airspace complexity for air traffic controller workload-based sectorization. In Proceedings of the AIAA 4th aviation technology, integration and operations (ATIO) forum, Chicago, IL, USA, 20–22 September 2004; p. 6455. [Google Scholar]
  15. Trandac, H.; Baptiste, P.; Duong, V. Airspace sectorization with constraints. RAIRO-Oper. Res. 2005, 39, 105–122. [Google Scholar] [CrossRef] [Green Version]
  16. Bichot, C.E.; Durand, N. A tool to design functional airspace blocks. In Proceedings of the 7th USA/Europe Seminar on Air Traffic Management Research and Development, Barcelona, Spain, 2–5 July 2007. [Google Scholar]
  17. Sabhnani, G.; Yousefi, A.; Mitchell JS, B. Flow conforming operational airspace sector design. In Proceedings of the 10th AIAA Aviation Technology, Integration, and Operations (ATIO) Conference, Fort Worth, TX, USA, 13–15 September 2010; p. 9377. [Google Scholar]
  18. Chen, Y.; Bi, H.; Zhang, D.; Song, Z. Dynamic airspace sectorization via improved genetic algorithm. J. Mod. Transp. 2013, 21, 117–124. [Google Scholar] [CrossRef] [Green Version]
  19. Gerdes, I.; Temme, A.; Schultz, M. Dynamic airspace sectorisation for flight-centric operations. Transp. Res. Part C Emerg. Technol. 2018, 95, 460–480. [Google Scholar] [CrossRef]
  20. Zhang, W.; Hu, M.; Du, J. An end-to-end framework for flight trajectory data analysis based on deep autoencoder network. Aerosp. Sci. Technol. 2022, 127, 107726. [Google Scholar] [CrossRef]
  21. Miyamoto, S.; Ichihashi, H.; Honda, K.; Ichihashi, H. Algorithms for Fuzzy Clustering; Springer: Berlin/Heidelberg, Germany, 2008. [Google Scholar]
  22. Xue, M. Airspace sector redesign based on Voronoi diagrams. J. Aerosp. Comput. Inf. Commun. 2009, 6, 624–634. [Google Scholar] [CrossRef]
  23. Jazzbin, E. Geatpy: The Genetic and Evolutionary Algorithm Toolbox with High Performance in Python. 2020. Available online: http://www.geatpy.com/ (accessed on 10 December 2022).
  24. Schäfer, M.; Strohmeier, M.; Lenders, V.; Martinovic, I.; Wilhelm, M. Bringing up OpenSky: A large-scale ADS-B sensor network for research. In Proceedings of the IPSN-14 Proceedings of the 13th International Symposium on Information Processing in Sensor Networks, Berlin, Germany, 15–17 April 2014; pp. 83–94. [Google Scholar]
Figure 1. Proposed framework for 3D airspace sectorization.
Aerospace 10 00216 g001
Figure 2. Fuzzy clustering results of flight position data at 11:30 UTC on 1 December 2019 (Singapore regional airspace).
Aerospace 10 00216 g002
Figure 3. An example of airspace sectorization using the Voronoi diagram with four sites.
Aerospace 10 00216 g003
Figure 4. Flowchart of the NSGA-II algorithm with prior knowledge and external archive.
Aerospace 10 00216 g004
Figure 5. Illustration of chromosome encoding for N 3D sectors formed by K 2D sectors.
Aerospace 10 00216 g005
Figure 6. Visualization of flight trajectory from 11:00 UTC to 12:00 UTC on 1 December 2019.
Aerospace 10 00216 g006
Figure 7. Non-dominated solutions of the proposed framework.
Aerospace 10 00216 g007
Figure 8. Airspace sectorization results for area one (i.e., solutions of [0.128, 44], [0.082, 45], and [0.064, 46] in Run 1). (a) Results in 3D view; (b) results in 2D view; (c) intra-sector and inter-sector workloads for each solution.
Aerospace 10 00216 g008aAerospace 10 00216 g008b
Figure 9. Airspace sectorization results for area two (i.e., solutions of [0.0034, 56], [0.0032, 57], and [0.0019, 58] in Runs 1, 5, and 3, respectively). (a) Results in 3D view; (b) results in 2D view; (c) intra-sector and inter-sector workloads for each solution.
Aerospace 10 00216 g009aAerospace 10 00216 g009b
Figure 10. Non-dominated solutions obtained by different algorithms.
Aerospace 10 00216 g010
Table 1. The subjective weight of each factor of dynamic density.
Factors of Dynamic Density
HCSCACMD5MD10CP25CP40CP70TD
Weight2.402.452.942.451.834.003.002.111.00
Table 2. Performance comparison of different algorithms.
MethodsEvaluation Indicators
NSSPHV
NSGA-II110.120.51
NSGA-II-ea270.060.52
NSGA-II-pk110.090.59
Proposed method270.060.61
Note that best performance is in bold.
Disclaimer/Publisher’s Note: The statements, opinions and data contained in all publications are solely those of the individual author(s) and contributor(s) and not of MDPI and/or the editor(s). MDPI and/or the editor(s) disclaim responsibility for any injury to people or property resulting from any ideas, methods, instructions or products referred to in the content.