Article

Experimental Study on Dynamic Stall of Airfoil in Rotor Reverse Flow Region

National Key Laboratory of Science and Technology on Rotorcraft Aerodynamics, Nanjing University of Aeronautics & Astronautics, Nanjing 210000, China
*
Author to whom correspondence should be addressed.
Aerospace 2023, 10(2), 170; https://doi.org/10.3390/aerospace10020170
Submission received: 9 December 2022 / Revised: 9 February 2023 / Accepted: 10 February 2023 / Published: 13 February 2023

Abstract

:
The large reverse flow region of the rotor with a high advance ratio is an important factor that affects the performance improvement of helicopters. This paper examines the dynamic stall of the airfoil in the reverse flow region of the rotor to develop a set of dynamic pressure measurement systems for the airfoil in the reverse low region. The pitch oscillation experiment of the NACA0018 airfoil in and out of the rotor reverse flow region has been carried out, and the influence of the airfoil motion parameters on dynamic stalls has been studied. The results show that the airfoil is more likely to stall in the reverse flow region under static conditions and that stall is invariant to the Reynolds number. After a stall occurs, the lift coefficient decreases more slowly with the increase of the angle of attack (about 10% of that in the forward flow state). Under the dynamic environment, in a pitching cycle, the quarter chord moment coefficient of the airfoil alternates between positive and negative frequently during reverse-blowing. The pitching oscillation in the reverse flow region is more sensitive to the changes in airfoil parameters than that under normal flow, and there is a marked difference. The alternating moment of the airfoil in the reverse flow region is significant: the greater the pitching amplitude, the greater the alternating moment. In the reverse-blowing state, with the increase in reduced frequency, the dynamic stall angle of attack increases more significantly.

1. Introduction

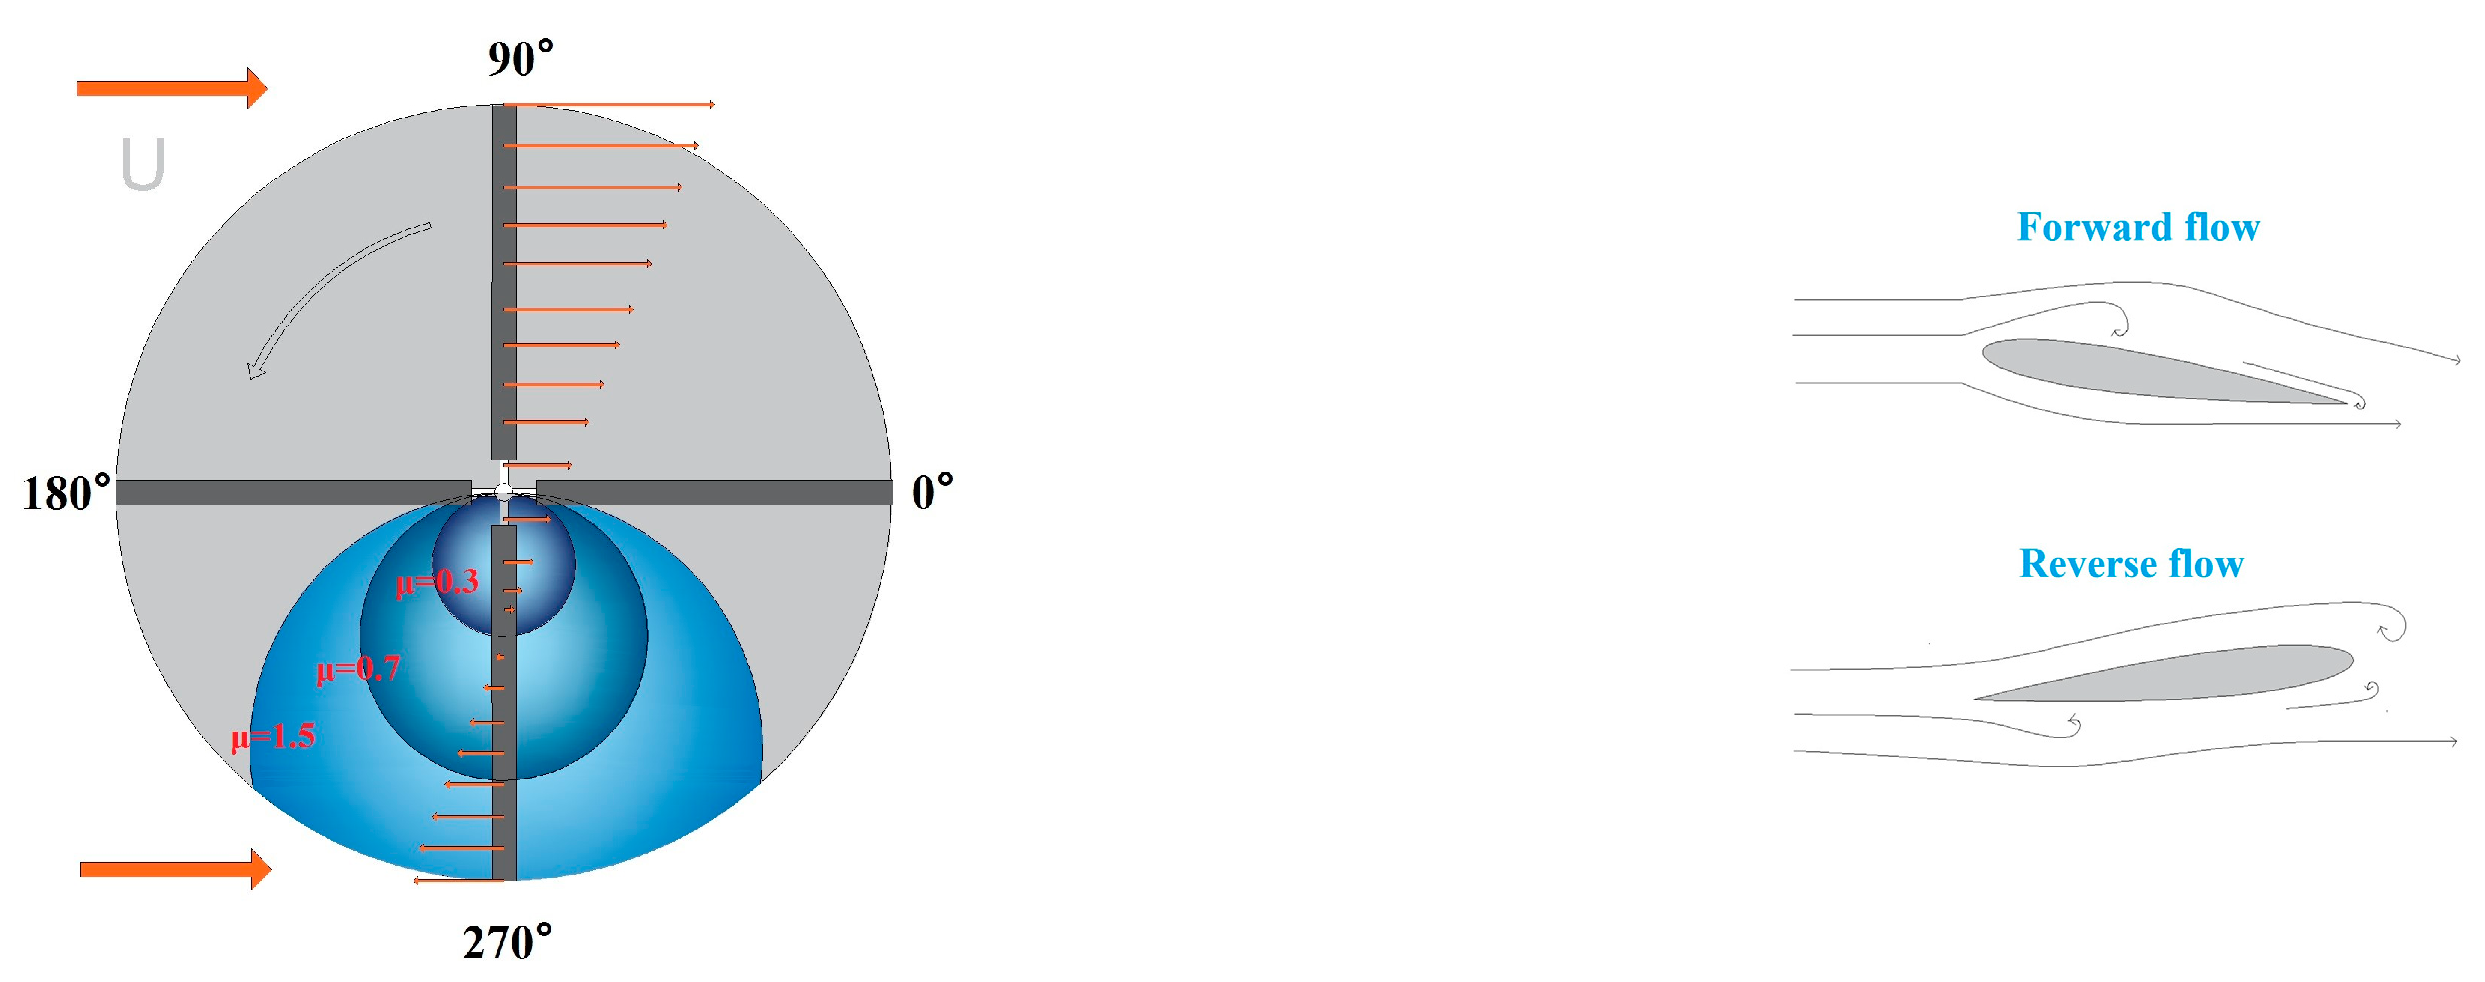
When a helicopter flies forward, the relative inflow velocity of the rotor is different between the advancing side and the retreating side, as shown in Figure 1. On the retreating side, when the circumferential velocity component of the blade caused by the incoming flow is greater than the circumferential velocity component caused by the rotor rotation, the relative airflow blows from the geometric trailing edge to the geometric leading edge, forming a reverse flow region.
As the advance ratio increases, the area of the reverse flow region also increases correspondingly. When the advance ratio is up to 0.8 or 80% of the area of the blade at the 270° azimuth is in the reverse flow region [1], the impact of the reverse flow region is significant. In the reverse flow region, the geometric trailing edge of the blade has changed from the aerodynamic trailing edge to the aerodynamic leading edge, and the airfoil’s angle of attack varies within ±180°. Compared to rotors with medium and small forward ratios, the large area of reverse flow region of rotors with high advance ratios overturns the aerodynamic environment of trailing blades and changes the dynamic characteristics of rotors [2].
During rotor rotation, the blade profile angle of attack changes constantly, and a dynamic stall will occur when the angle of attack approaches the static stall angle of attack. The dynamic stall is characterized by a sharp increase in drag relative to the static stall airfoil, while the lift increases rather than decreases. In the reverse flow region of a rotor with a high advance ratio, a dynamic stall will occur even at a very small angle of attack due to the flow from the trailing edge to the leading edge.
The research on dynamic stall characteristics of two-dimensional airfoils in forward flow has been extensive. In the 1940s, Himmelskamp [3] first discovered the dynamic stall phenomenon experimentally. Ham [4] studied the dynamic stall process of the rotor airfoil both experimentally and theoretically and found that the formation and shedding of the dynamic stall vortex separated from the leading edge of the airfoil led to the occurrence of the dynamic stall phenomenon. Later on, McCroskey et al. [5] measured the aerodynamic characteristics of NACA0012 airfoil and airfoil with leading-edge profile modification under dynamic stall state; he pointed out that the leading-edge vortex separation phenomenon is the main feature distinguishing the steady and unsteady characteristics. Leishman and Beddoes [6] developed a semi-empirical airfoil dynamic stall model based on theoretical and experimental research on rotor airfoil dynamic stalls. This model has been widely used to effectively predict the dynamic stall problem of airfoils under normal working conditions (flow from leading edge to trailing edge). Hind [7] used conventional PIV and remotely mounted pressure transducers to quantify the flow field and surface pressure distributions of the oscillating airfoils. The resulting data can be used to quantify pitching airfoils performance for static airfoils and validate computational models. Zhao Guoqing et al. [8] used the overset grid method to analyze the effects of the average angle of attack and reduced frequency on dynamic stalls in detail. Richez [9] investigated the dynamic stall characteristics of a high advance ratio rotor by means of large eddy simulations and found that turbulence existed on the blade surface at an azimuth of 110°, 270°, and 340°. Letzgus et al. [10] simulated the flap motion of a high advance ratio rotor blade by means of a large vortex simulation method and pointed out that a dynamic stall is a complex three-dimensional stall due to the presence of radial and spreading flow.
However, there are few studies on the dynamic stall of airfoils in the reverse flow region [11,12,13]. Critzos [14] used NASA’s low turbulence wind tunnel to conduct an experimental study on the reverse flow of NACA0012 and obtained the airfoil lift and moment coefficients at a full angle of attack. Lyons [15] conducted relevant research on improving the flow characteristics in the rotor countercurrent zone by circulation control. Lind [16] studied the static stall characteristics of airfoils in fully developed reverse flow and found that airfoils with blunt trailing edges can delay stall and reduce drag in reverse flow. In 2011, the National Aerodynamic Center [17] and the University of Maryland [18,19] conducted full-scale and model rotor wind tunnel tests on the rotor of the Black Hawk (UH-60A) helicopter, respectively, and the advance ratio reached 1.1 in the experiment. Johnson [20] analyzed the performance and control of high advance ratio rotors and corrected the dynamic stall resistance coefficient in the reverse flow region based on experience. Kong and Chen [21] conducted a theoretical analysis on the influence of rotor aerodynamic characteristics in the high advance ratio rotor reverse flow region, pointing out that the blade profile angle of attack changes abruptly at the boundary of the reverse flow region. Kottapalli [22] and Mark Potsdam [23] analyzed the performance and loads of a UH-60A slowed rotor at high advance ratios with CAMRADII and Helios, respectively. The overall trends for the performance and loads could be captured, but with substantial overprediction or underprediction.
In this paper, an experimental system for measuring the dynamic pressure on the surface of a two-dimensional airfoil in the reverse flow region of a high-advance ratio rotor has been developed by investigating the dynamic stall of the airfoil in the reverse flow region. Using this experimental system, the forward and reverse static and pitching oscillating blowing experiments of a two-dimensional rotor airfoil have been carried out. The aerodynamic characteristics of rotor airfoils inside and outside the reverse flow region and the influence of airfoil pitching motion parameters on dynamic stall characteristics are analyzed experimentally. The experiments will provide data and a verification basis for building a dynamic stall model of a rotor airfoil in the reverse flow region.

2. Methodology

2.1. Test Equipment and Model

This experiment was conducted in the wind tunnel at Nanjing University of Aeronautics and Astronautics. The wind tunnel experimental section is open-loop. The main technical indicators are shown in Table 1.
The experimental platform adopts a two-degree-of-freedom dynamic experimental mechanism with the model mounted vertically on the drive unit, as shown in Figure 2. The computer controls the rotation of the motor through Ethernet to create wing model pitching, which is used to simulate the pitching motion of the airfoil. The maximum range of pitch motion is ±60°, and the pitch frequency can reach 3 Hz.
According to the following Equation, the NACA 0018 airfoil model oscillates periodically around the position of the quarter chord:
α = α 0 + α m sin ( 2 π f t )
Among them, α is the instantaneous angle of attack, α 0 is the mean angle of attack, α m is the oscillation amplitude, and f is the physical oscillation frequency. The reduced frequency of the oscillating model, K, is defined as
k = π f c v
where v is the freestream velocity.
NACA0018 airfoil is selected as the experimental model. As shown in Figure 2, its chord length is 300 mm, its span length is 1000 mm, and the material is ABS plastic, which has higher strength and stiffness and a lower mass than other materials. The model is divided into three sections, and pins are used to fix the two pairs to ensure that there is no relative rotation in the experiment. The micro-dynamic pressure sensor is installed in the middle section. The left and right end section’s purpose is to increase the aspect ratio of the model, minimize the influence of factors such as wingtip vortices on the sensor data in the middle section as well as mitigate three-dimensional effects.

2.2. Pressure Sensors and Their Installation

The HPT504 miniature dynamic pressure sensor is selected as the pressure measurement element in this experiment, as shown in Figure 3. The main performance parameters are shown in Table 2; it can measure static pressure and dynamic pressure with a very short response time.
The miniature dynamic pressure sensor consists of three main parts: a pressure measuring probe, a signal line, and an amplifier. The pressure probe is installed inside the model to measure the pressure on the surface of the model in real-time, transforming the pressure signal into an electrical signal, and transmit the weak electrical signal to the amplifier through the signal line to amplify the transmission to reduce the attenuation of the electrical signal and the interference of other factors in the transmission process and then transmit the amplified electrical signal to the data acquisition card through the signal line for data acquisition.
This experiment is a two-dimensional airfoil dynamic stall experiment, which needs to measure the pressure distribution in one circular cross-section of the airfoil. This experiment focuses on the dynamic stall problem of the airfoil in the reverse flow region. It is imperative to measure the pressure value at the geometric trailing edge of the model more accurately. Therefore, the pressure sensor should be installed as closely as possible at the geometric trailing edge of the model to ensure the accuracy of the observational pressure data, which will be interpolated at a later stage. The pressure on the suction side of the model changes more drastically, so more sensors were installed on the suction side than on the pressure side. A total of 22 pressure sensors were installed, as shown in Figure 4. The detailed chordal installation locations of the pressure sensors are shown in Table 3.
Due to the thinness of the trailing edge of the airfoil model geometry, the volume of the pressure sensors, and the sharp pressure changes at the trailing edge of the airfoil geometry, the sensors need to be installed more closely. Hence, it is difficult to install all the sensors in one ring of the airfoil. In this experiment, the sensors were installed by translating the sensors along the spreading position of the model. The structure of the two surfaces of the airfoil model is shown in Figure 5: pressure sensors are mounted in the middle section, and 22 holes are dug perpendicular to the surface of the model to facilitate the installation of the miniature dynamic pressure transducer and ensure that the pressure measurement surface is parallel to the model surface. The appropriate number of recesses are dug inside the model to facilitate the arrangement of pressure conduits and signal lines for pressure sensors. Names of symbols in the figure: 1 is the left end section of the airfoil model; 2 is the middle end of the airfoil model; 3 is the right end section of the airfoil model; 4 is the front cover plate; 5 is the cavity; 6 is the cavity connection tube; 7 is the miniature dynamic pressure sensor; 8 is the first conduit; 9 is the second conduit; 10 is the signal line; 11 is the rotating shaft.
After mounting the pressure sensor on the surface of the model, the reference pressure conduit is connected to the cavity and then connected to the atmosphere outside the wind tunnel through a second conduit extending from the hole at the right end of the model. The signal line of the pressure sensor extends through the hole at the right and left ends of the model and is connected to the acquisition card for data acquisition. After all pressure sensors, cavities, etc., are installed, cover the model’s upper and lower covers to make the model’s surface complete and smooth.
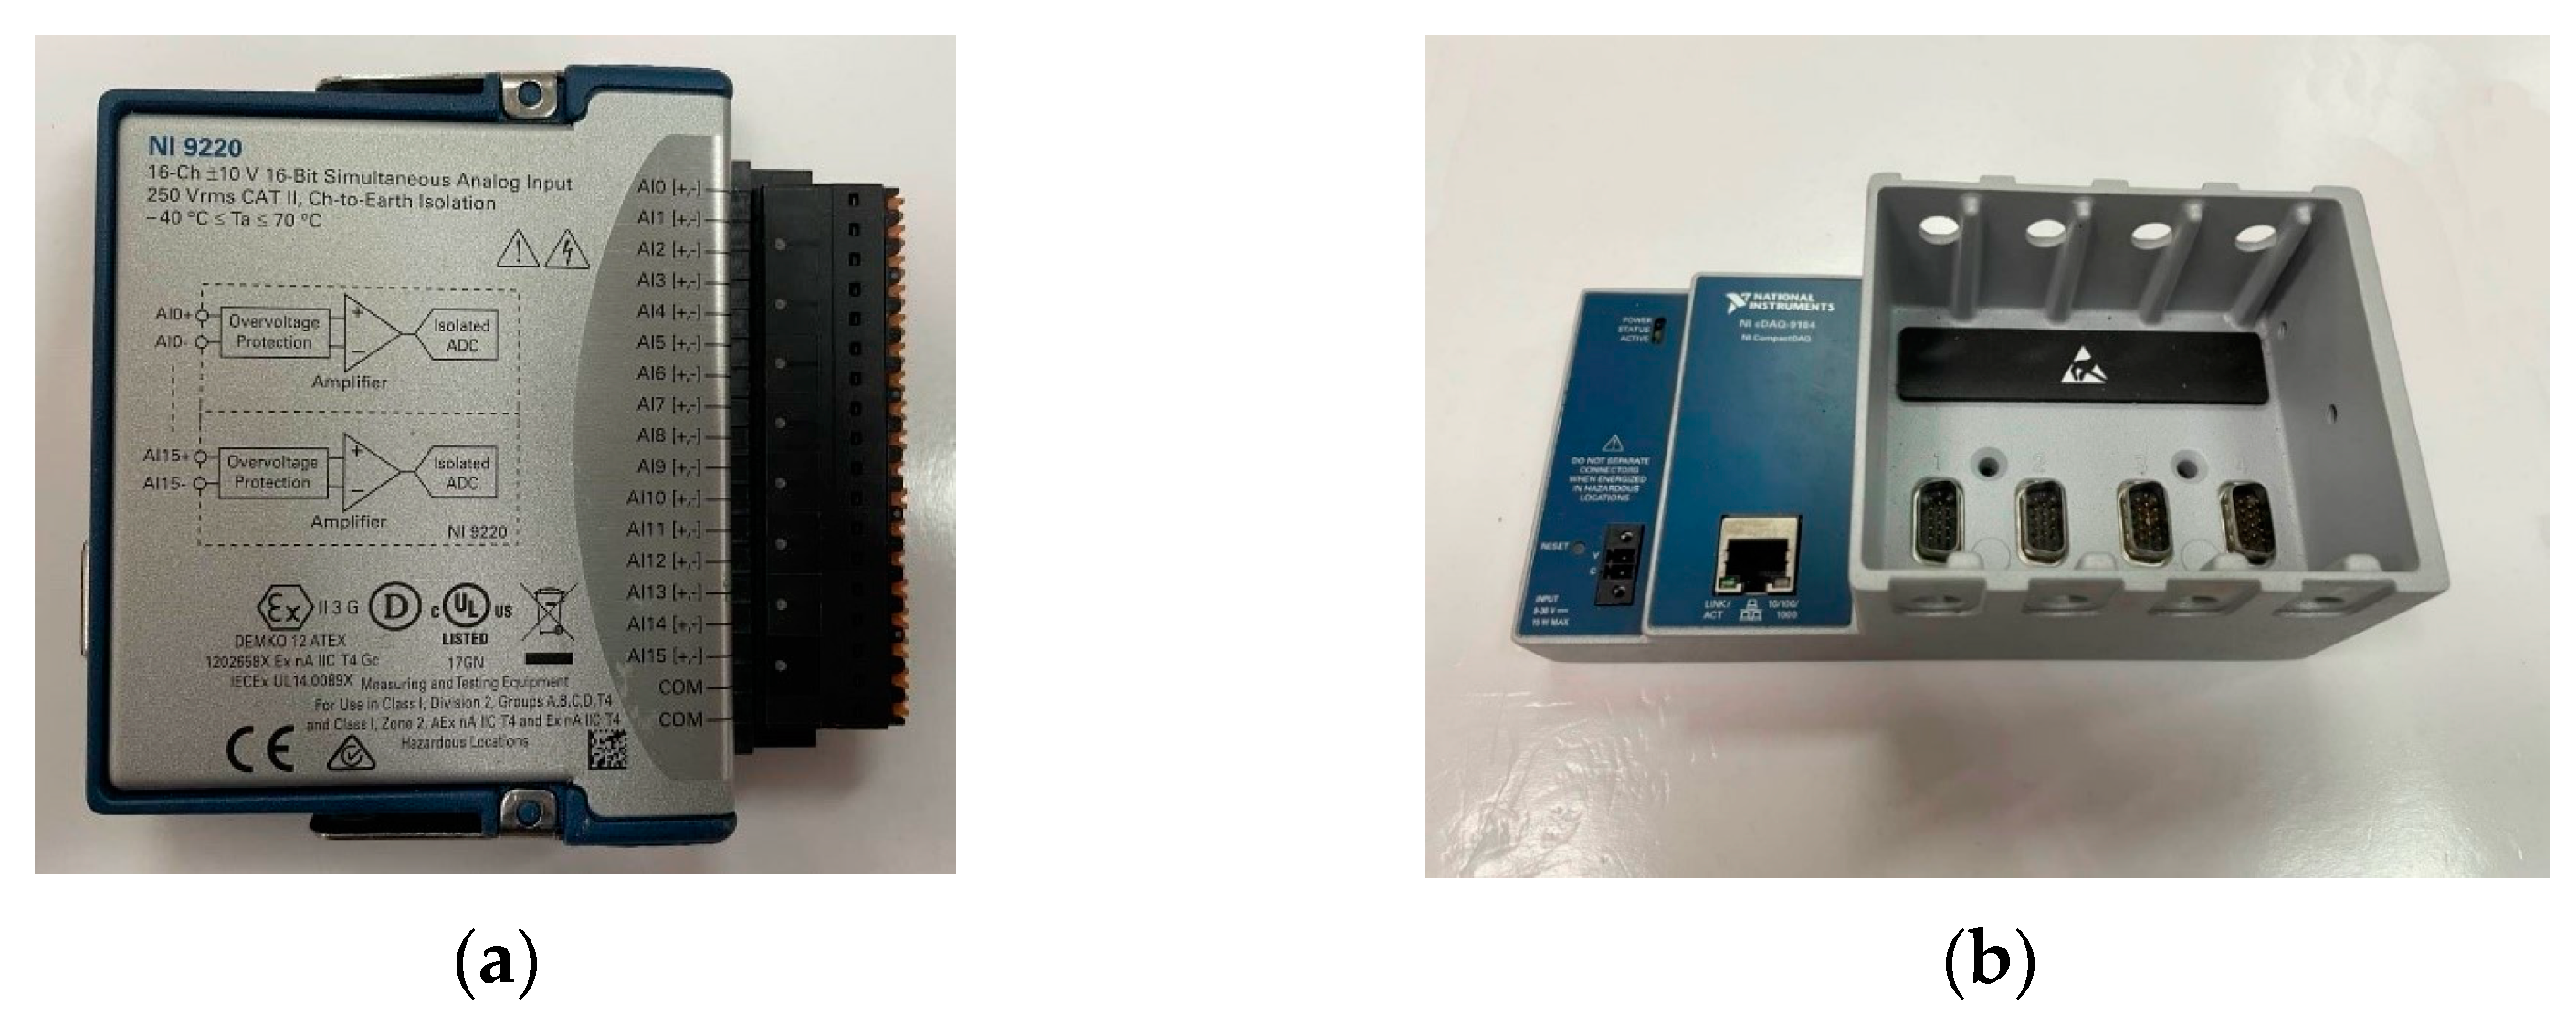
The hardware part of the data collection system consists of the Ni9220 data collection card and the NI CompactDAQ chassis, as shown in Figure 6. The main performance parameters of the NI9220 data collection card are shown in Table 4.

2.3. Experimental Method

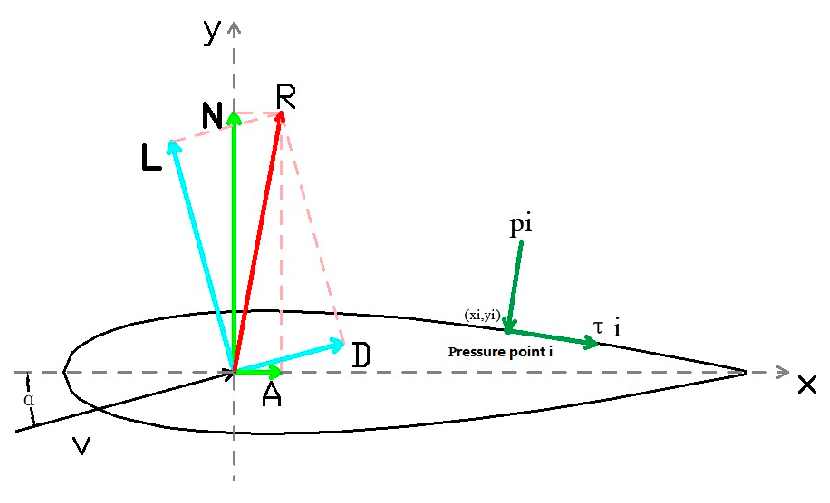
The aerodynamic force of the airfoil surface is shown in Figure 7. C N is the normal force coefficient, C A is the axial force coefficient, C L is the lift force coefficient, C D is the drag force coefficient, C m is the quarter chord moment coefficient and are all obtained by integrating the surface pressure coefficients, which can be calculated according to Formulas (3)–(8).
C p i = p o b i ρ v 2 / 2
C N = 1 c ( 0 c C p l d x 0 c C p u d x )
C A = 1 c ( y l y u C p b e d y y l y u C p a f d y )
C L = C N cos α C A sin α
C D = C N sin α + C A cos α
C m = 1 c 2 0 c ( C p l C p u ) ( c 4 x ) d x + y l y u C p b e y d y y l y u C p a f y d y
In the formula above, p o b i is the value of the pressure sensor at the pressure measuring point, C p i is the pressure coefficient of the pressure measuring point, ρ is the incoming flow density taken as 1.225 kg / m 3 and v is the inflow velocity, c is the chord length of NACA0018 airfoil, which is 300 mm, C p u and C p l are the pressure coefficient of the suction and pressure sides of the airfoil respectively. C p b e and C p a f are the pressure coefficients before and after the maximum thickness of the airfoil, respectively. y u and y l are the maximum ordinates of the suction and pressure sides of the airfoil, respectively.
The incoming flow in the experiment has both forward and reverse-blowing (the forward flow is from the geometry leading edge to the geometry trailing edge of the airfoil while the reverse flow is the opposite) [24], The lift upward is defined as positive, and the clockwise moment at 1/4 chord is defined as positive in both cases, as shown in Figure 8.

2.4. System Reliability Study under Static and Dynamic Working Conditions

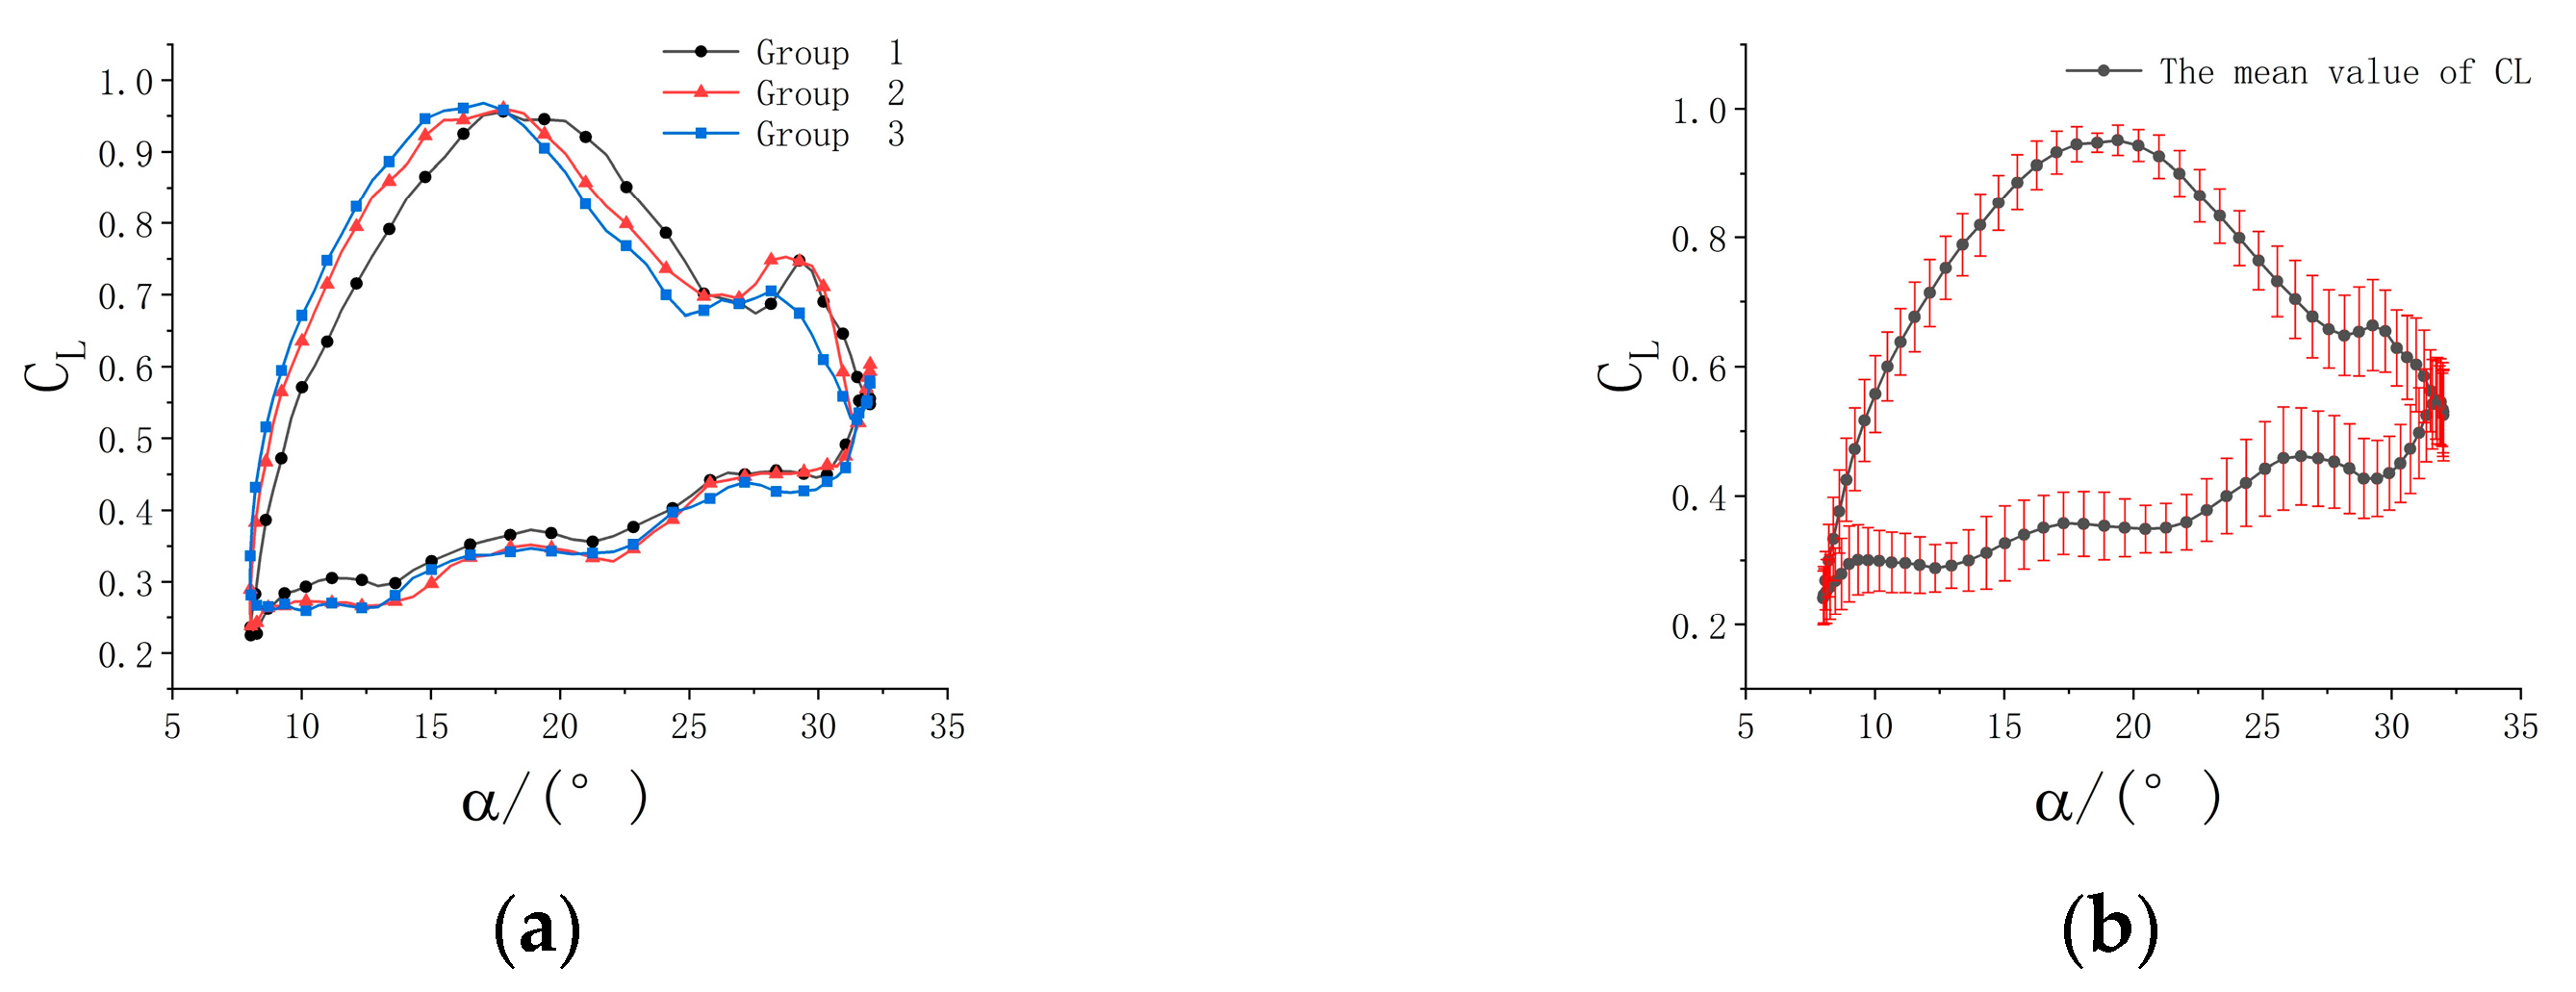
The reliability study of the static blowing experiment was first conducted. The lift coefficients were measured for the wind speed of 10 m/s during the reverse-blowing process in the range of 0° to 50° of the angle of attack. The experimental data are measured three times at the same angle, the measured data are processed to obtain the curve of the lift coefficient with the angle of attack, and the mean and standard deviation of the three sets of data are obtained to show the fluctuation range of random error in the form of error bars, as shown in Figure 9. It can be found that the wing lift coefficients of the three groups of static experiments are basically the same; for the static experiments, the pressure measurement system meets the requirements of repeatability.
Next, the reliability analysis study of the dynamic blowing experiment was conducted. The experimental conditions are set as follows: wind speed at 10 m/s, pitch frequency at 1.06 Hz; average angle of attack at 20°; pitch amplitude at 12°; the corresponding reduced frequency K is 0.10, and the range of angle of attack is 8~32°. Three experiments were conducted, and data were collected for 30 motion cycles each time.
The random error analysis of the dynamic data is performed in two steps. First, the data of the first measurement is selected, and each of its 30 cycles is calculated separately to obtain the lift coefficient of each cycle, and the lift coefficients of these 30 cycles are averaged. The periodic averaging method for dynamic data processing can reduce the influence of random errors and obtain experimental values closer to the real situation.
Further analysis of the results of multiple experiments is required to meet the requirements of experimental repeatability. After averaging the three sets of experimental data, the lift coefficient and the 1/4 chord moment coefficient were calculated, and the mean and standard deviation of the three sets of data were averaged to show the fluctuation range of random errors in the form of error bars, as shown in Figure 10. It can be found that the difference between the three experimental results of the lift coefficient is very small, which can meet the requirement of experimental repeatability, and the difference between the three results of the 1/4 chord moment coefficient is slightly larger. However, the trend remains favorable and does not affect the experimental results fundamentally. Therefore, the pressure measurement system is reliable both for static and dynamic experiments.

3. Results and Discussion

3.1. Comparison of Static Stall Characteristics of Airfoils under Forward and Reverse-Blowing

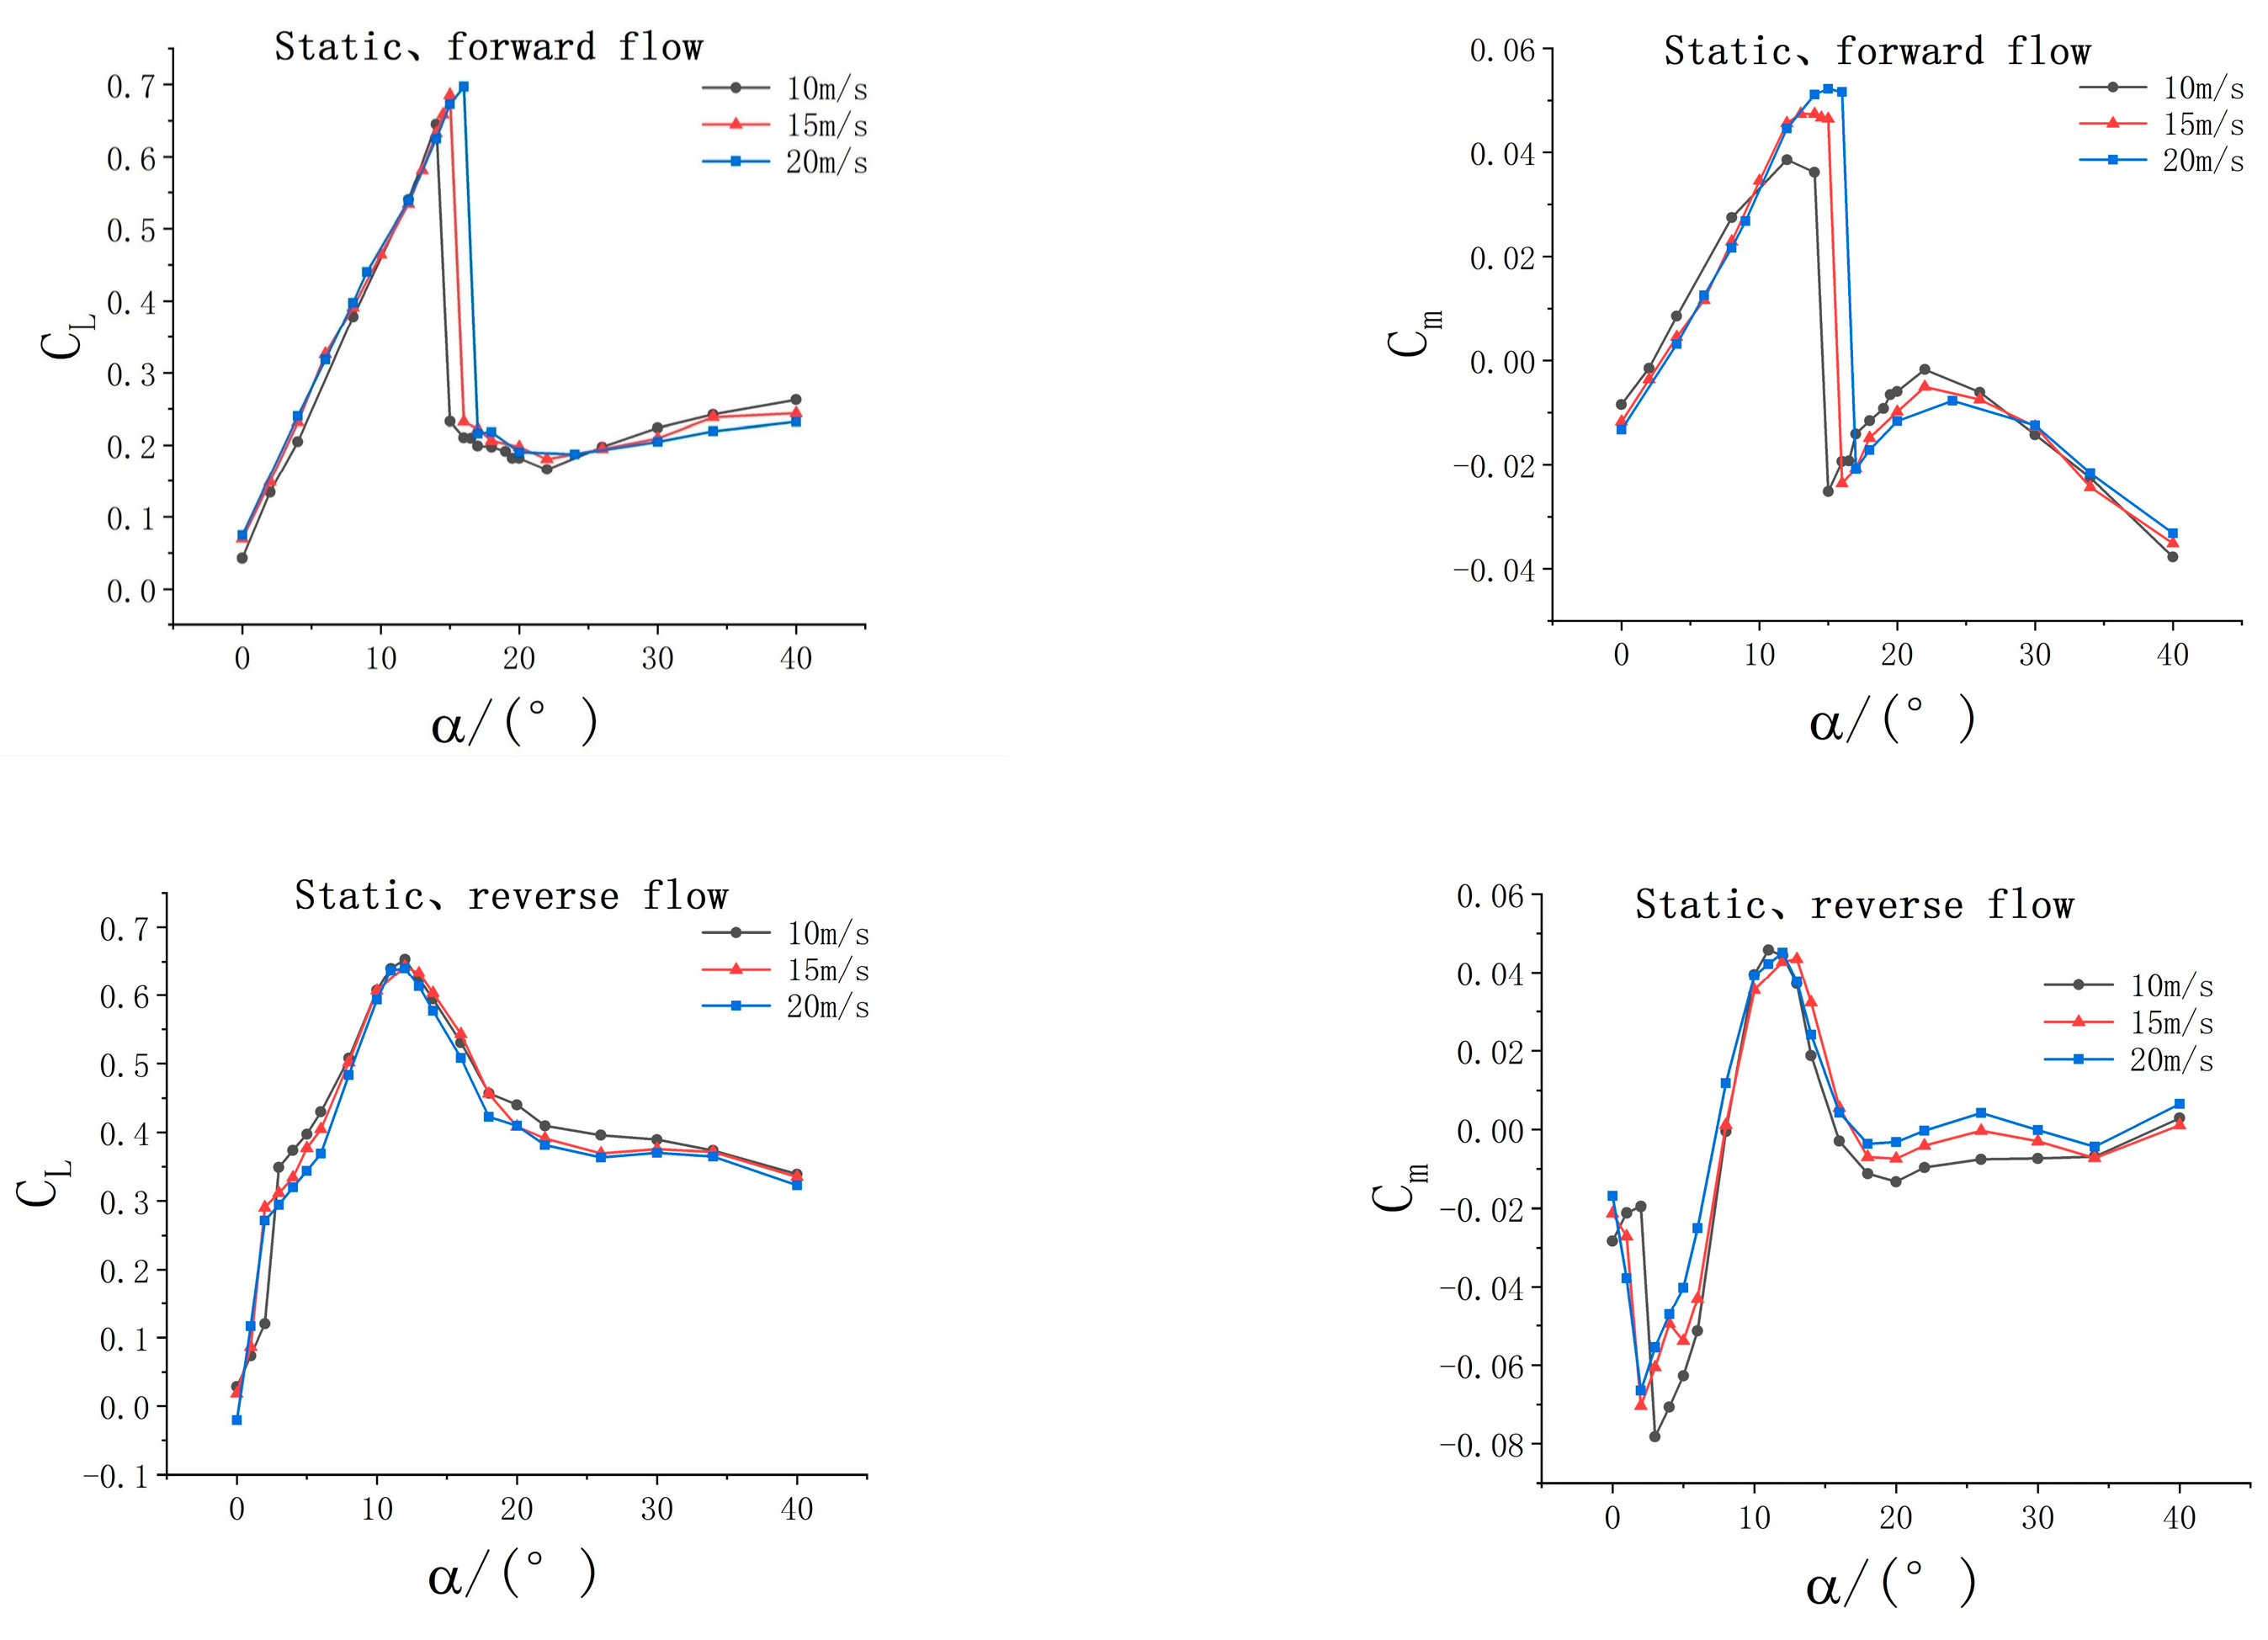
The model’s forward and reverse-blowing tests have been carried out in a static state. The test conditions are shown in Table 5, and the corresponding lift coefficient curves and moment coefficient curves are drawn, as shown in Figure 11.
By analyzing Figure 8, it can be found that there are some differences between the forward and reverse-blowing; the moment coefficient is clearly different. There are five main findings:
  • Static stall occurs earlier in reverse-blowing than in forward-blowing. It is important to note that even at the reverse-blowing, the maximum lift coefficient is almost the same. The lift coefficient at 15 and 20 m/s in reverse flow is larger than in forward flow;
  • During forward-blowing, with the increase of Reynolds number, the occurrence of static stall is delayed, and the maximum lift coefficient increases; however, in reverse-blowing, the occurrence of static stall is not sensitive to Reynolds number, which occurs at 12°, and the maximum lift coefficient basically does not change, the sharp leading edge forces flow separation, meaning that the separation point (and thus the unsteady air loads) does not depend on Reynolds number [24];
  • Before stall occurs, the slope of the lift coefficient curve remains unchanged under the forward-blowing state but changes under the reverse-blowing state. Near AoA of 0 deg, the lift curve slope is high. It is believed that this is in part due to the “cutoff” of the sharp aerodynamic leading edge. That is, this edge has a finite thickness and is not perfectly sharp, making the position of the stagnation point (and resulting pressure distribution) highly sensitive to the angle of attack [25];
  • After stall occurs, in the forward state, abrupt stall has been experienced, whereas on the reverse-blowing, smooth stall is observed;
  • Before the angle of attack of 10°, the moment coefficient increases linearly with the increase of the angle of attack when blowing in the forward direction, while it decreases at first and increases negatively when blowing in the reverse direction and then increases linearly with the increase of the angle of attack.
For the above five points, the aerodynamic pressure coefficient curves of the suction and pressure sides of the airfoil at a specific angle of attack at 10 m/s wind speed are drawn, and the stall characteristics of the airfoil under static forward and reverse-blowing are analyzed.
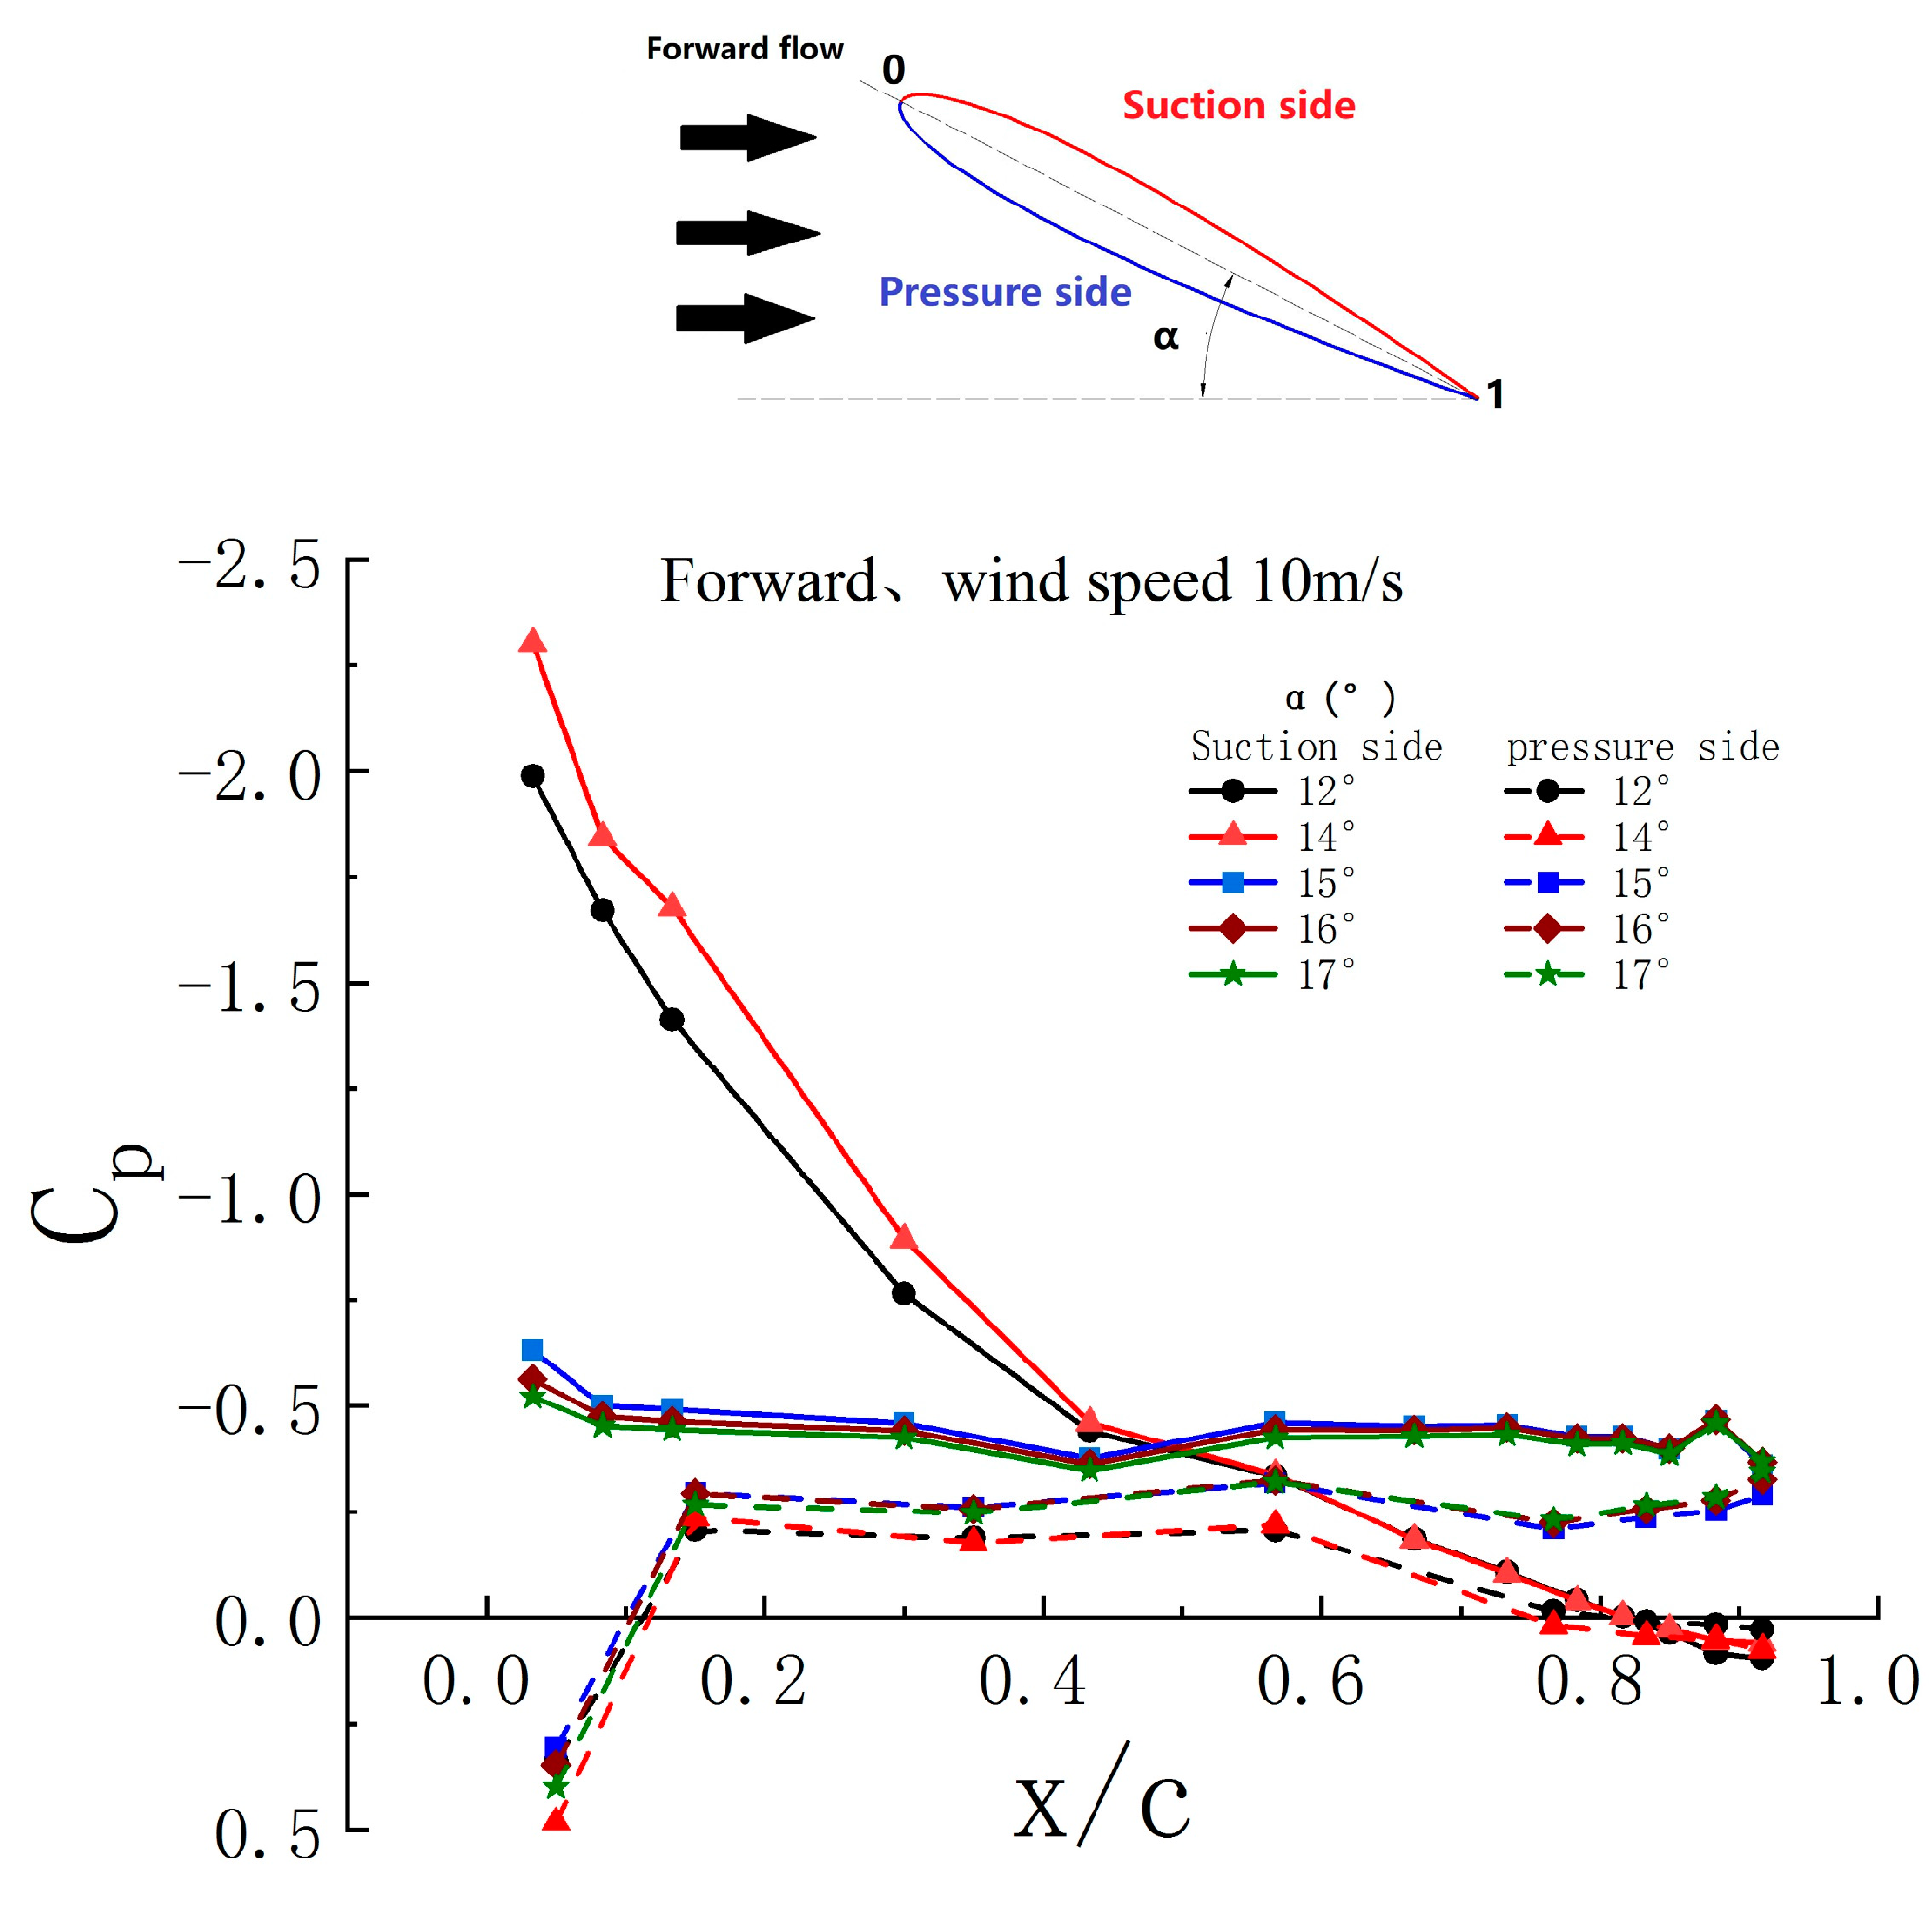
During the forward-blowing state, the pressure coefficient curves at different angles of attack are shown in Figure 12.
It is found that before stall occurs when the angle of attack is 12° and 14°, there is a strong suction peak on the aerodynamic leading edge of the airfoil suction side, and only a small part of the aerodynamic trailing edge of the entire suction side is a positive pressure zone. The pneumatic pressure side is in the low negative pressure area as a whole; only the front and rear edges of the pneumatic pressure side are in the positive pressure area, but the positive pressure area is small. Therefore, the main lift of the airfoil at this stage is generated by the leading-edge suction peak on the aerodynamic suction side.
As the angle of attack continues to increase to 15°, the pressure coefficient distribution changes significantly. At this time, the suction peak of the aerodynamic leading edge on the aerodynamic suction side of the airfoil disappears, and there is a slight backflow at the aerodynamic trailing edge, causing the pressure to change from positive pressure to negative pressure. The pressure distribution on the whole aerodynamic suction side is basically unchanged along the chord direction; the slight change indicates that air separation occurs at this time. The lift force is mainly provided by a wide range of negative pressure areas. The lift coefficient drops sharply, the 1/4 chord moment coefficient drops sharply, and stall occurs. The pressure change of the pneumatic pressure side is not as significant as before the stall, but the positive pressure of the pneumatic trailing edge changes to negative pressure, resulting in a larger range of the pneumatic pressure side in the negative pressure area. This generates a negative lift, which further leads to the reduction of lift.
With the further increase of the angle of attack to 16° and 17°, the pressure distribution will not change, which indicates that the airflow has been completely separated at this time, and the lift coefficient and 1/4 chord moment coefficient will not change greatly.
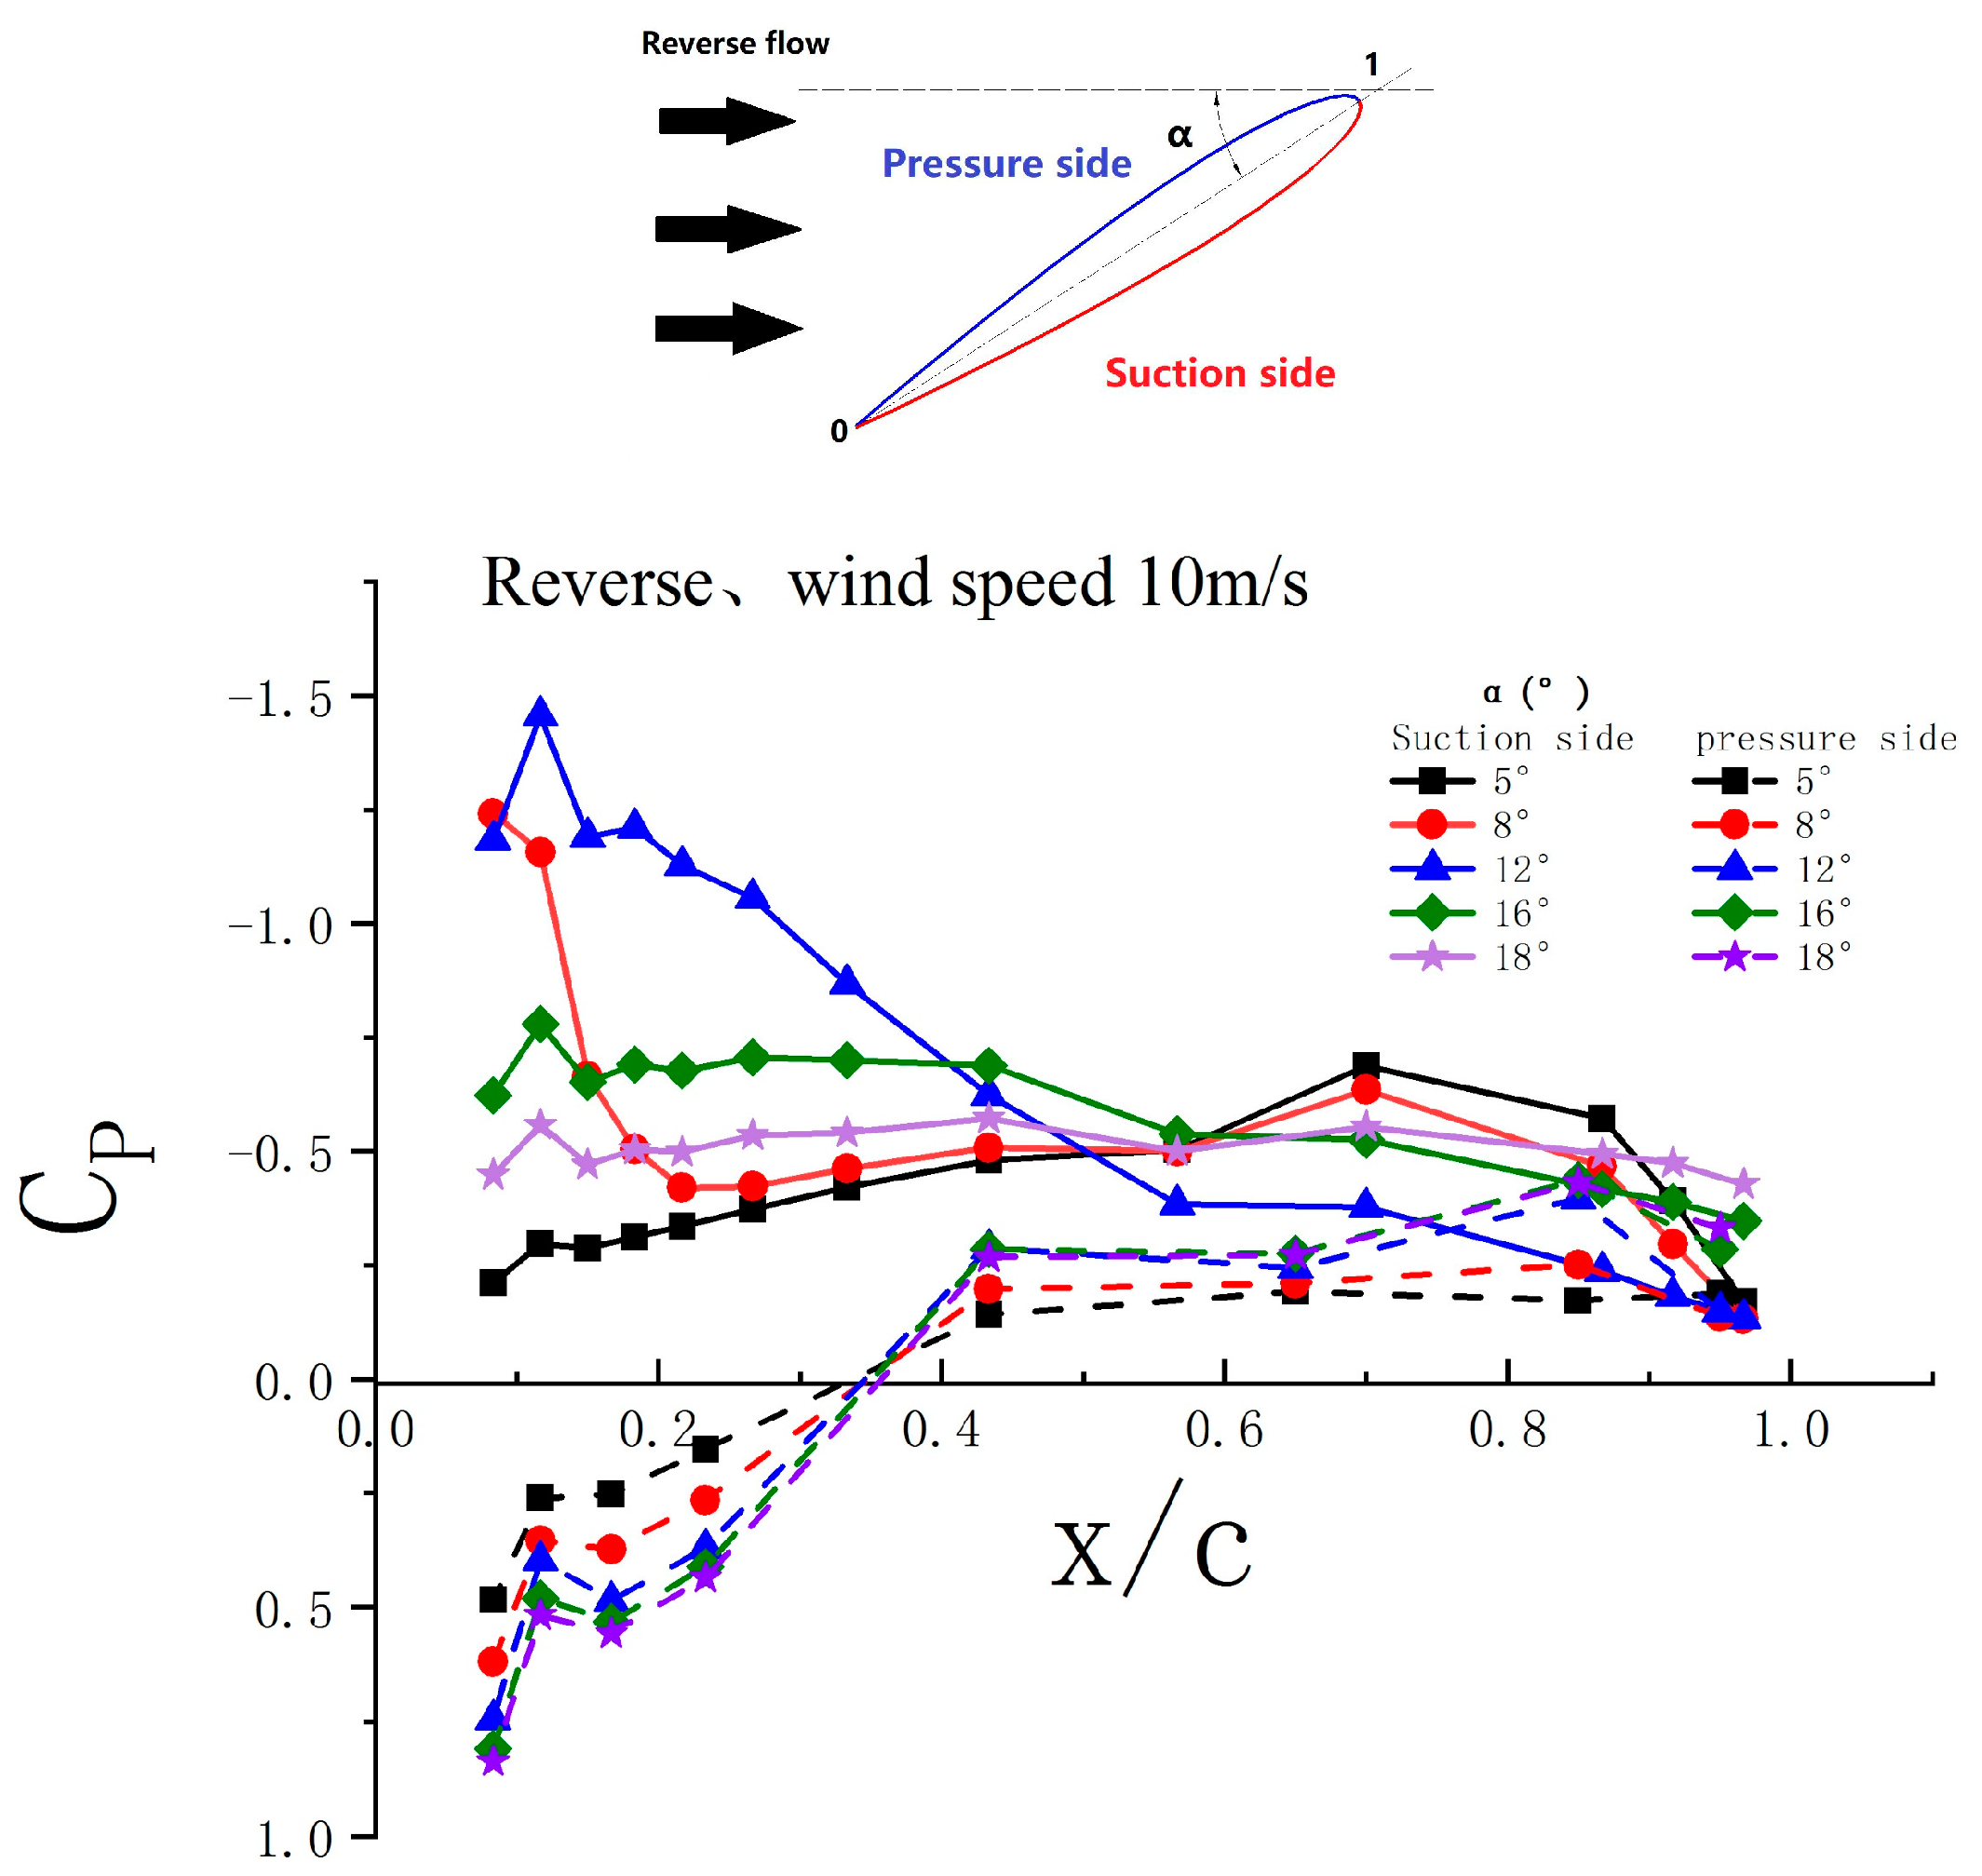
During the reverse-blowing state, pressure coefficient curves at different angles of attack are shown in Figure 13. Combined with Figure 11, it is found that the lift coefficients fall into a linear range when the angle of attack is 5° and 8°, a critical stall state when the angle of attack is 12°, and a stall range at 16° and 18°. At the angle of attack of 5°, the maximum negative suction pressure is around 0.6c to 0.9c, and a large part of the lift is provided by the negative pressure area. When the angle of attack exceeds 5°, a suction peak appears at the aerodynamic leading edge of the suction aerodynamic surface. With the increase of the angle of attack, the peak value of the suction peak continues to increase; the gradient is large, and the corresponding lift coefficient continues to increase. As the aerodynamic leading edge is a sharp geometric trailing edge during the reverse-blowing state, a large reverse pressure gradient is generated at the aerodynamic leading edge, which further leads to the separation of the laminar boundary layer at a low angle of attack. Then, the flow will attach to the airfoil surface in the form of a turbulent boundary layer, resulting in a separation bubble. Therefore, the stall angle of attack in the reverse flow state is smaller than that in the forward flow state.

3.2. Effect of the Mean Angle

3.2.1. Effect of the Mean Angle of Pitch at Different K

The NACA 0018 airfoil model oscillates periodically around the quarter chord position according to Equation (1). The influence of the mean angle of pitch, oscillation amplitude, reduced frequency k = πfc/v, and Reynolds number Re = ρ v c / μ on the dynamic airfoil stall is coupled, and the effects of various motion modes on the dynamic stall of airfoils need to be classified.
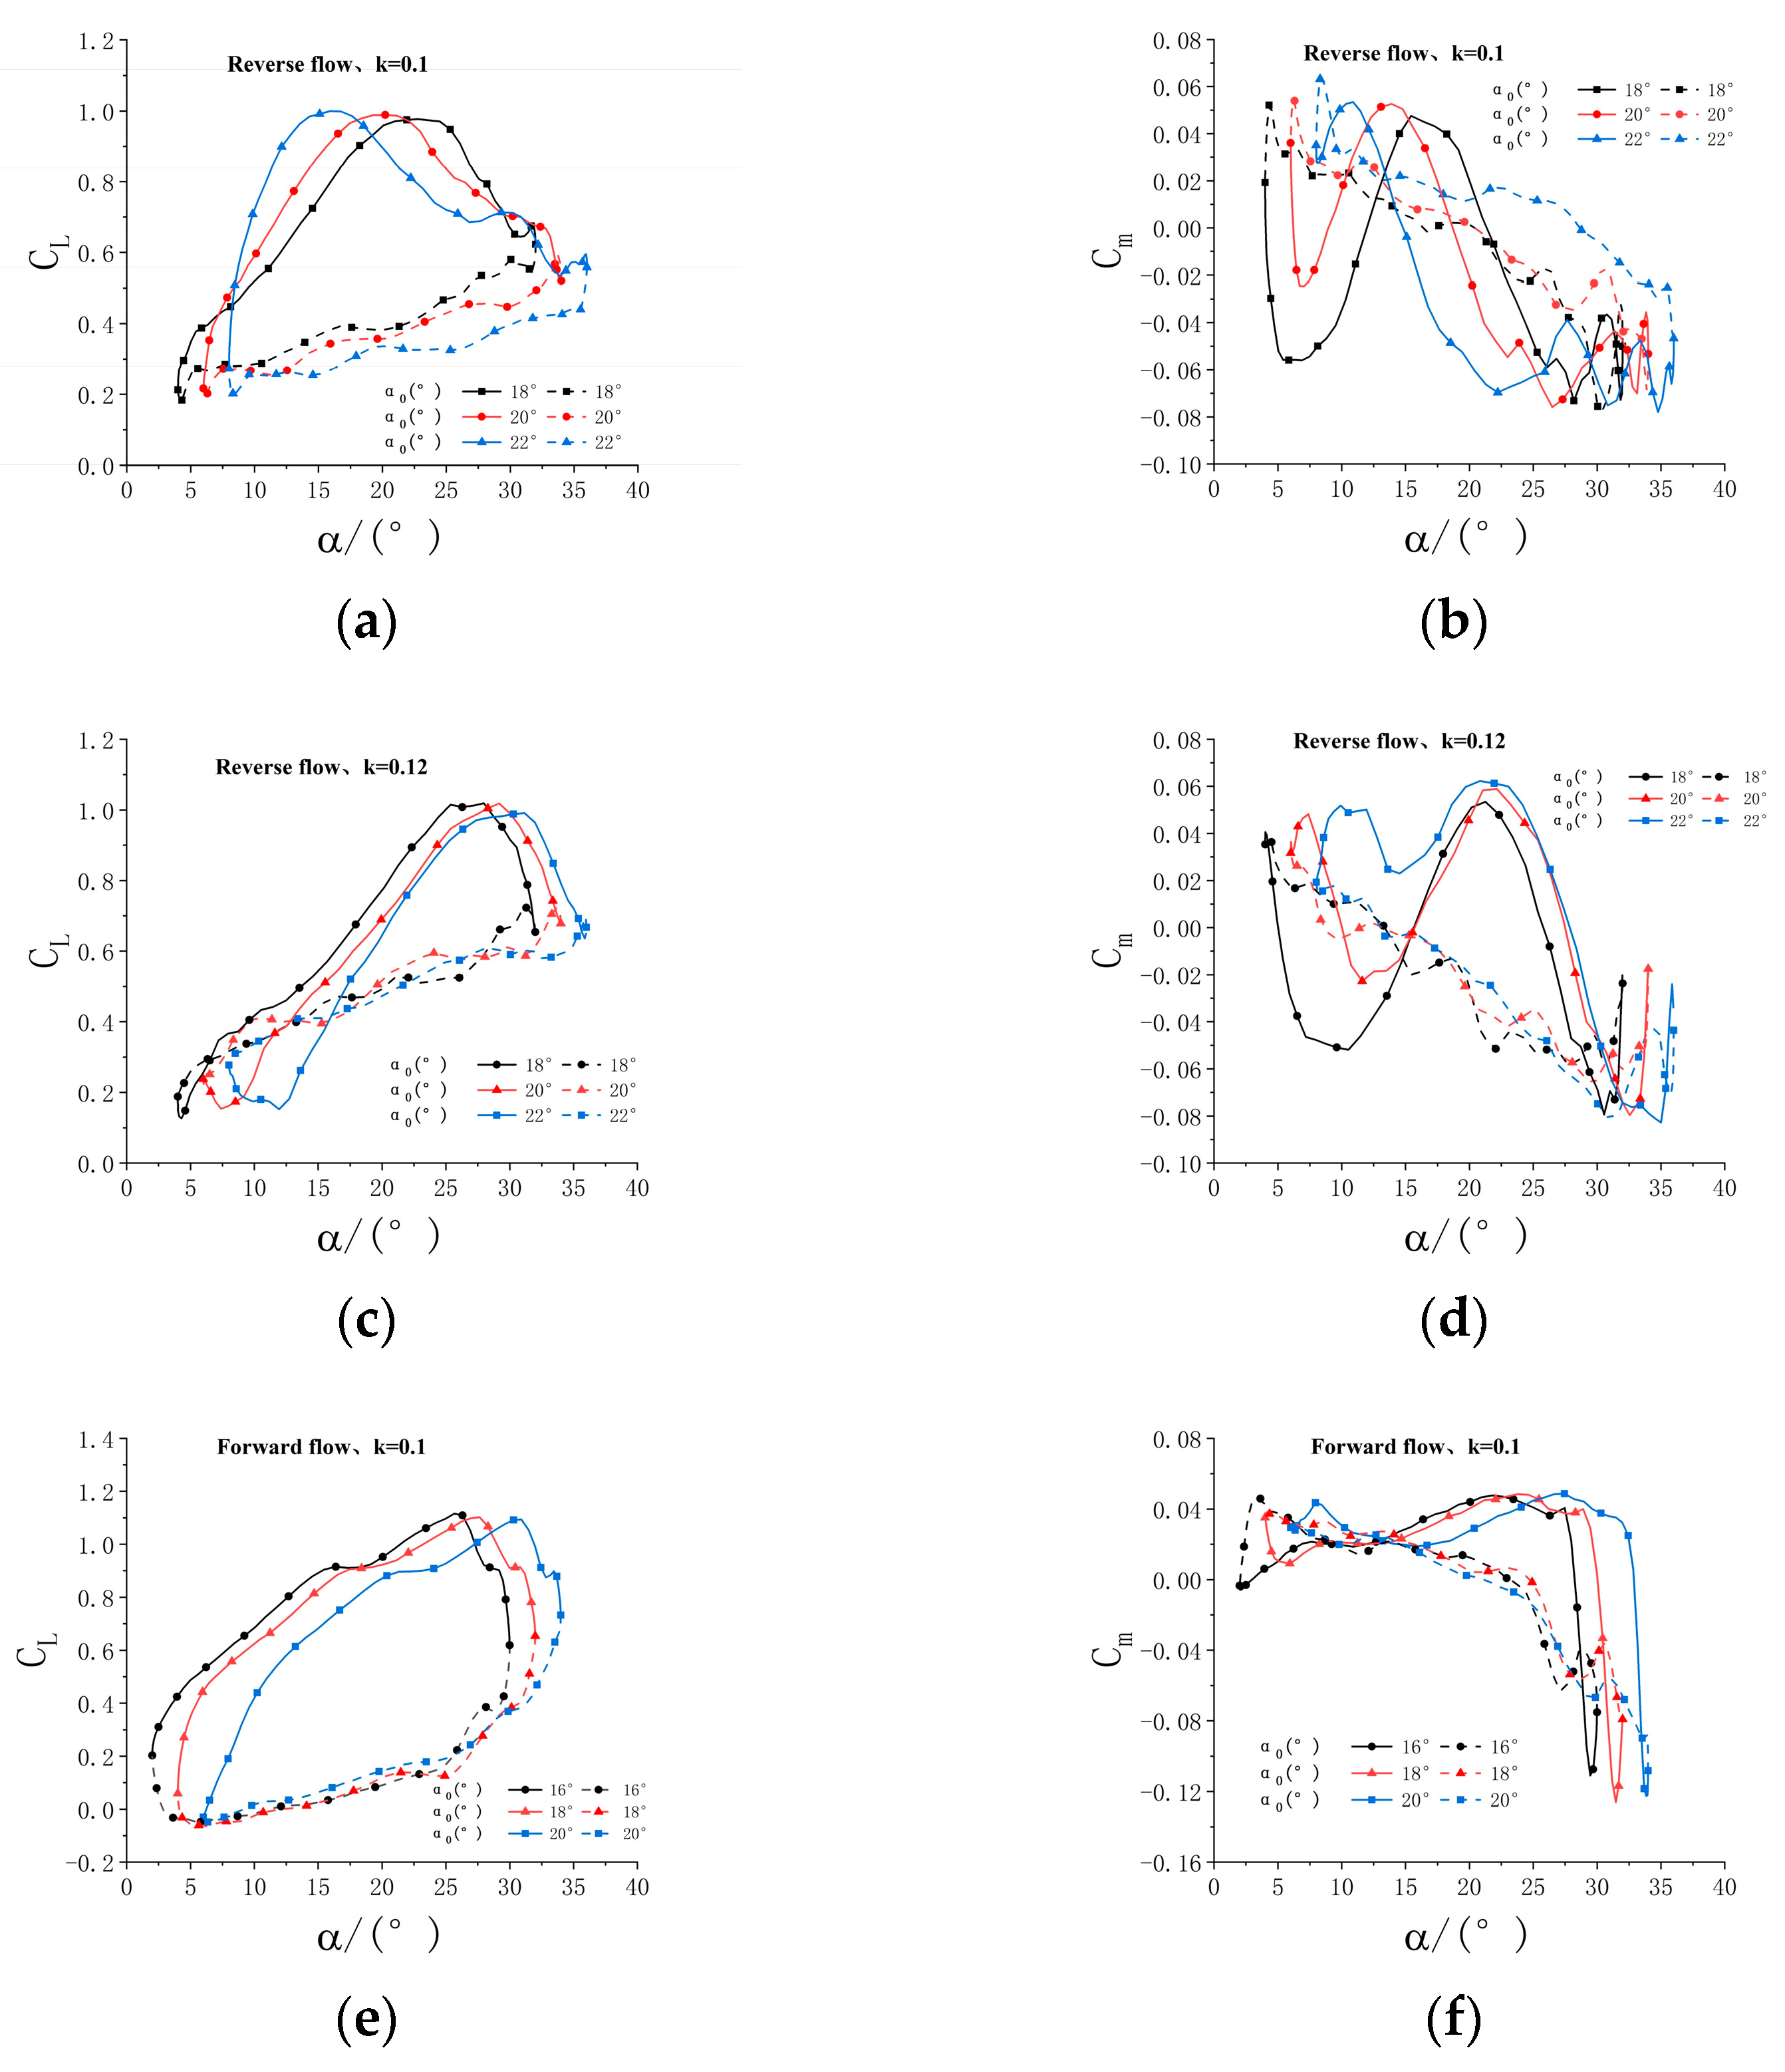
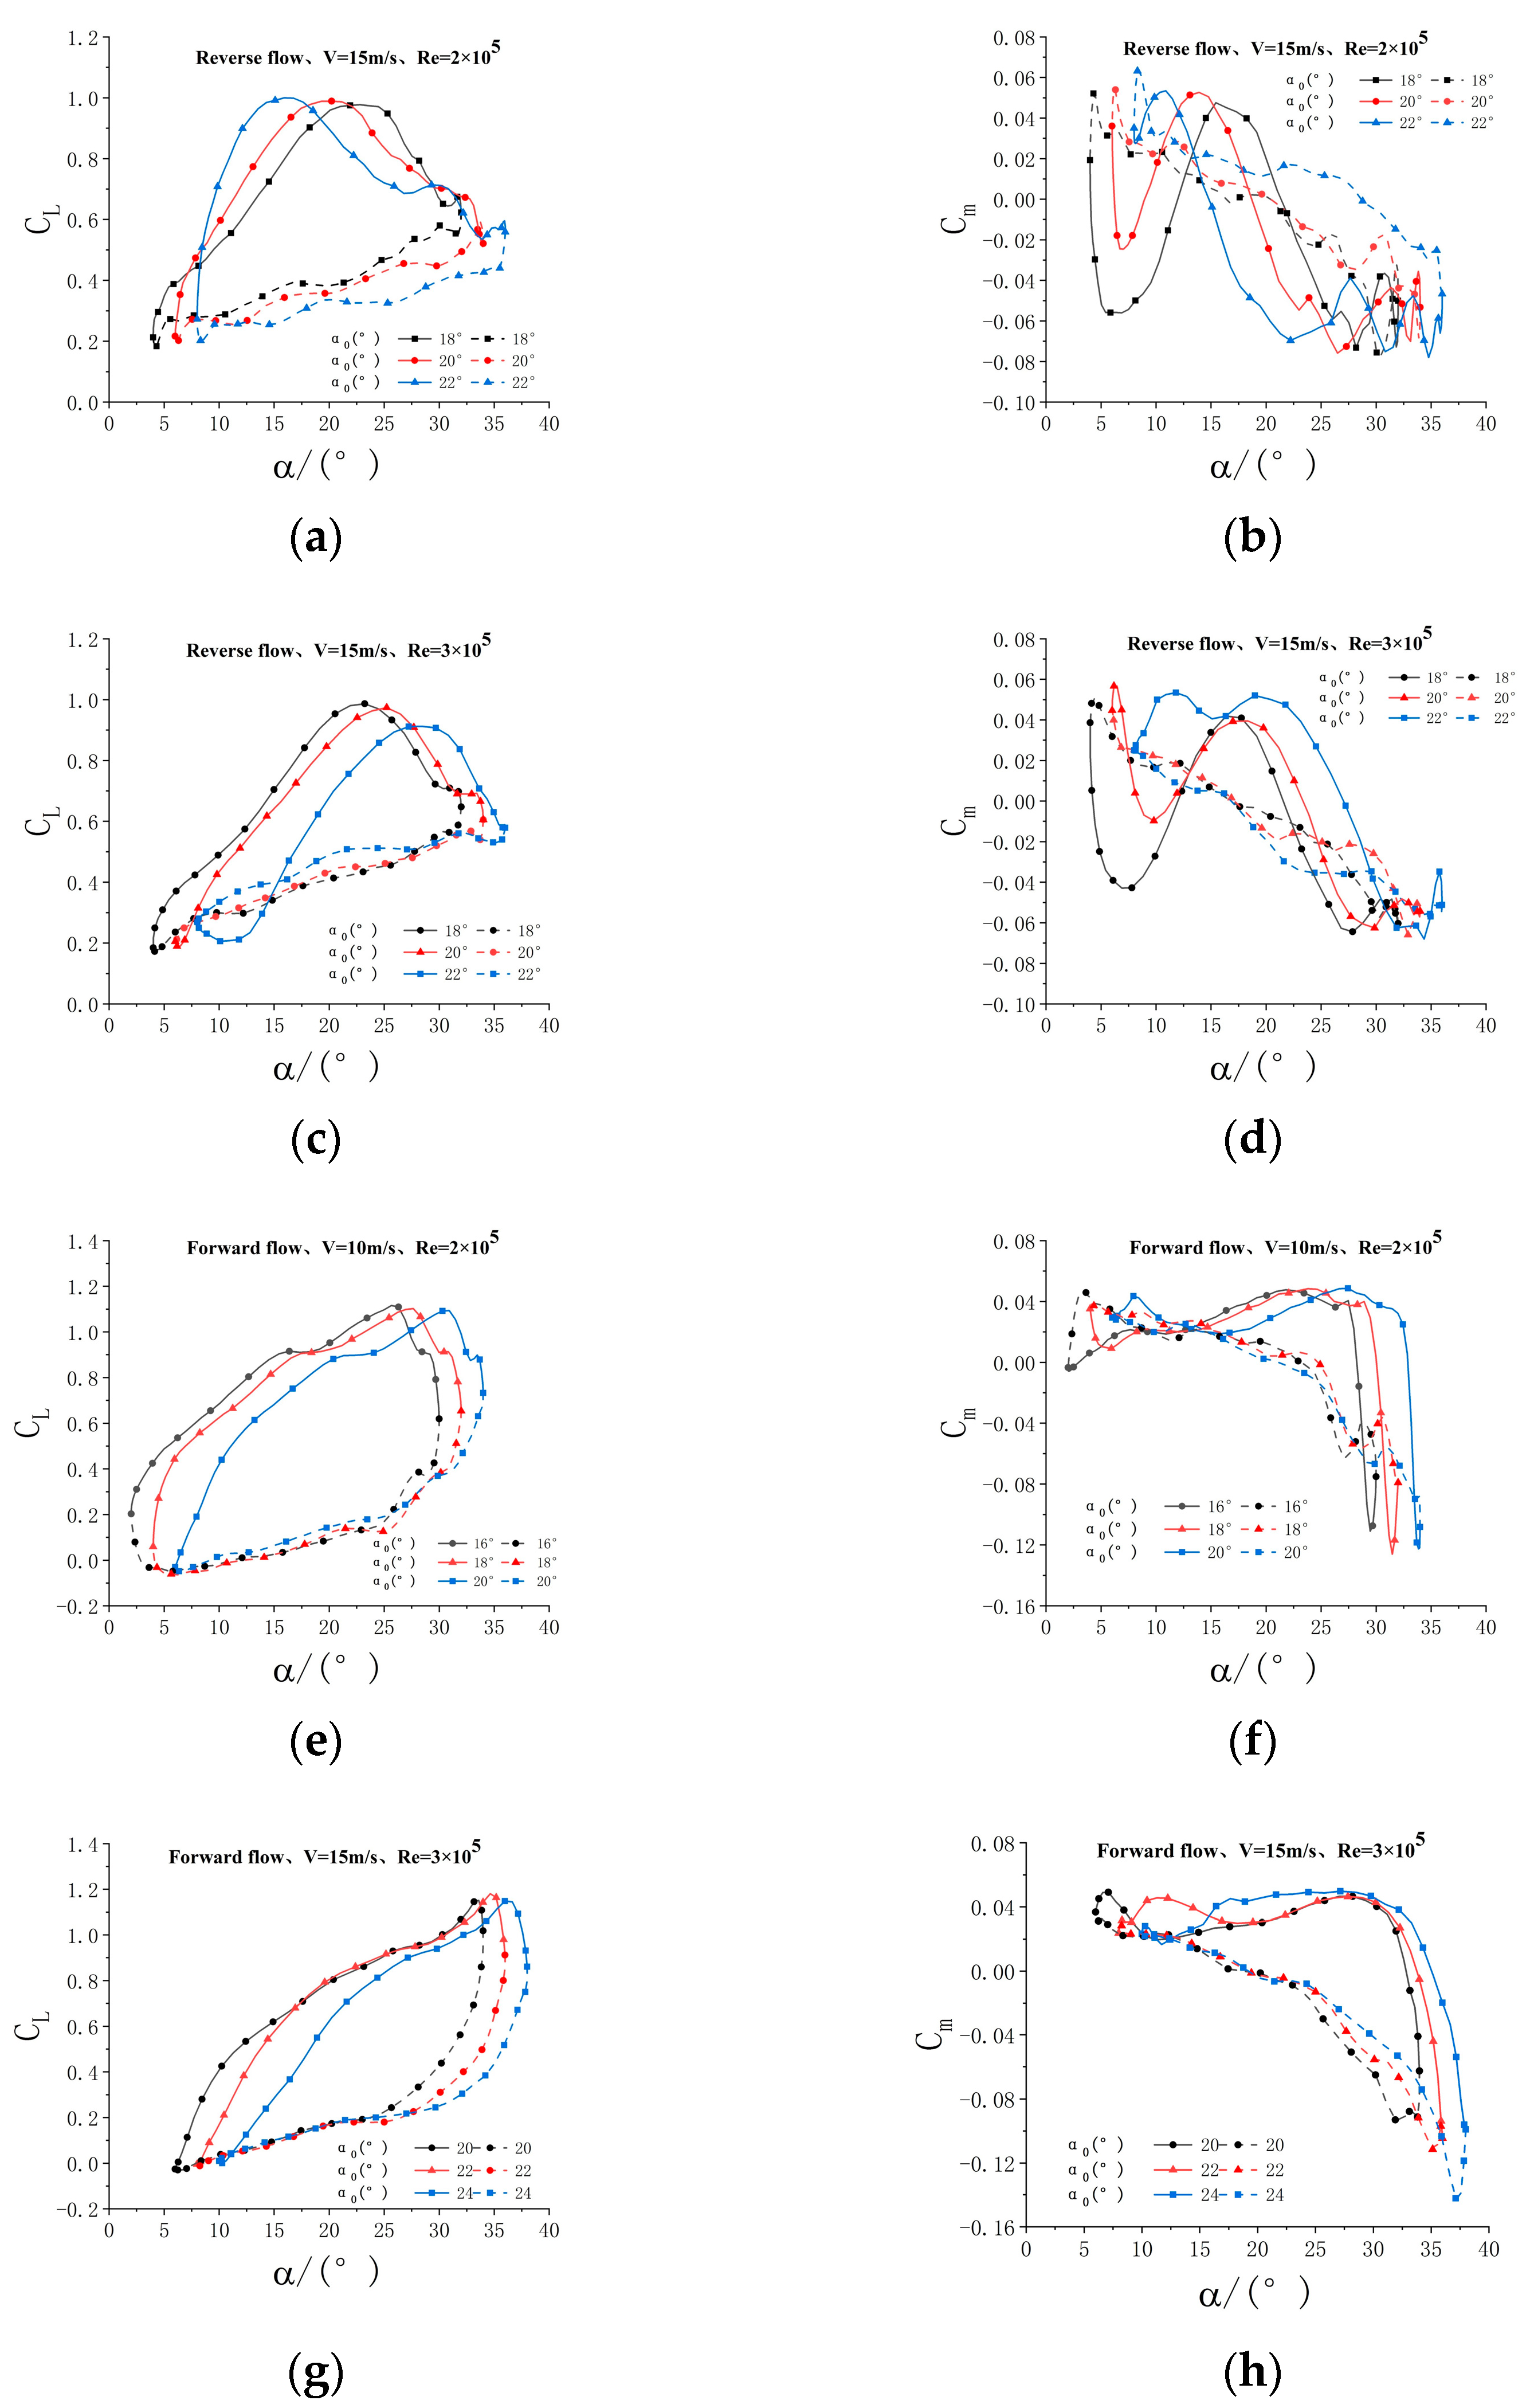
During the experiment, the oscillation amplitude α m remains constant, and the mean angle of pitch α 0 is changed to explore its effect on the dynamic stall of the airfoil. The experiment is carried out at the same wind speed v and different oscillation frequency f . Test conditions are shown in Table 6. The lift coefficient and moment coefficient obtained from experimental data processing are plotted in Figure 14. The increasing AoA is represented in solid lines, and the decreasing AoA in dashed lines (the same below).
It can be found from Figure 12 that in the reverse flow region, the alternating momentum of the airfoil is pronounced: as the average angle of attack decreases, the alternating moment is more notable. The mean angle of pitch has different effects on the dynamic stall at different reduced frequencies in the forward and reverse-blowing states.
When in reverse-blowing state, the reduced frequency is 0.1, the lift coefficient curve slope increases with the increase of the mean angle of attack, the dynamic stall occurs ahead of time, and the maximum lift coefficient remains almost unchanged. The lift coefficient decreases slowly after the dynamic stall. After the angle of attack reaches the maximum, the pitching oscillation motion of the airfoil starts to descend until the minimum angle of attack; the lift coefficients are much smaller than those in the ascending stage. This means that the airflow on the airfoil surface is always separated during the downward phase of airfoil pitching. When the reduced frequency is 0.12, there is an obvious change, where the increase of the mean angle of attack delays the occurrence of dynamic stall. The stall angle of attack is much greater than that at the reduced frequency of 0.1. In the downward phase, when the angle of attack is around 15°, the lift coefficient returns to that in the upward phase. At this time, the airflow has recovered, and the flow field becomes stable again. When the reduced frequency is 0.1, the area of the hysteresis loop of the lift coefficient curve is larger than that of 0.12, indicating that its dynamic stall is more obvious.

3.2.2. Effect of the Mean Angle of Pitch at Different Reynolds Numbers

During the experiment, the oscillation amplitude remains unchanged, and the mean angle of pitch α 0 is altered to explore its effect on the dynamic stall of the airfoil. The experiment is carried out under different wind speeds, so it is necessary to change the oscillation frequency at the same time to keep the reduced frequency at 0.1. The specific experimental conditions are shown in Table 7. The lift coefficient and moment coefficient obtained from data processing are plotted in Figure 15.
By observing Figure 15, it can be found that in the reverse flow region, the alternating moment of the airfoil is evident. As the average angle of attack decreases, the alternating moment is more pronounced. Under different Reynolds numbers, the average angle of attack has different effects on the dynamic stall during forward and reverse-blowing states.
Under the condition of reverse-blowing and the Reynolds number of 2 × 10⁵, the lift coefficient curve slope increases with the increase of the mean angle of attack, the dynamic stall occurs ahead of time, and the maximum lift coefficient remains almost unchanged. The lift coefficient decreases slowly after dynamic stall; after the angle of attack reaches the maximum, the pitching oscillation motion of the airfoil starts to descend until the minimum angle of attack. The lift coefficients are much smaller than those in the ascending stage, which shows that the airflow on the airfoil surface is always separated during the downward phase of airfoil pitching. When Reynolds number increases to 3×10⁵, there is a significant change. The increase in the average angle of attack delays the occurrence of dynamic stall, and the maximum lift coefficient decreases. The stall angle of attack is much larger than that at Reynolds number 2 × 10⁵.
During the forward-blowing state, the effect of the average angle of attack on the dynamic stall is consistent under different Reynolds numbers. The increase of the mean angle of attack delays the occurrence of dynamic stall, but it has little effect on the maximum lift coefficient.

3.3. Effect of the Oscillation Amplitude

3.3.1. Effect of the Oscillation Amplitude at Different Reduced Frequencies

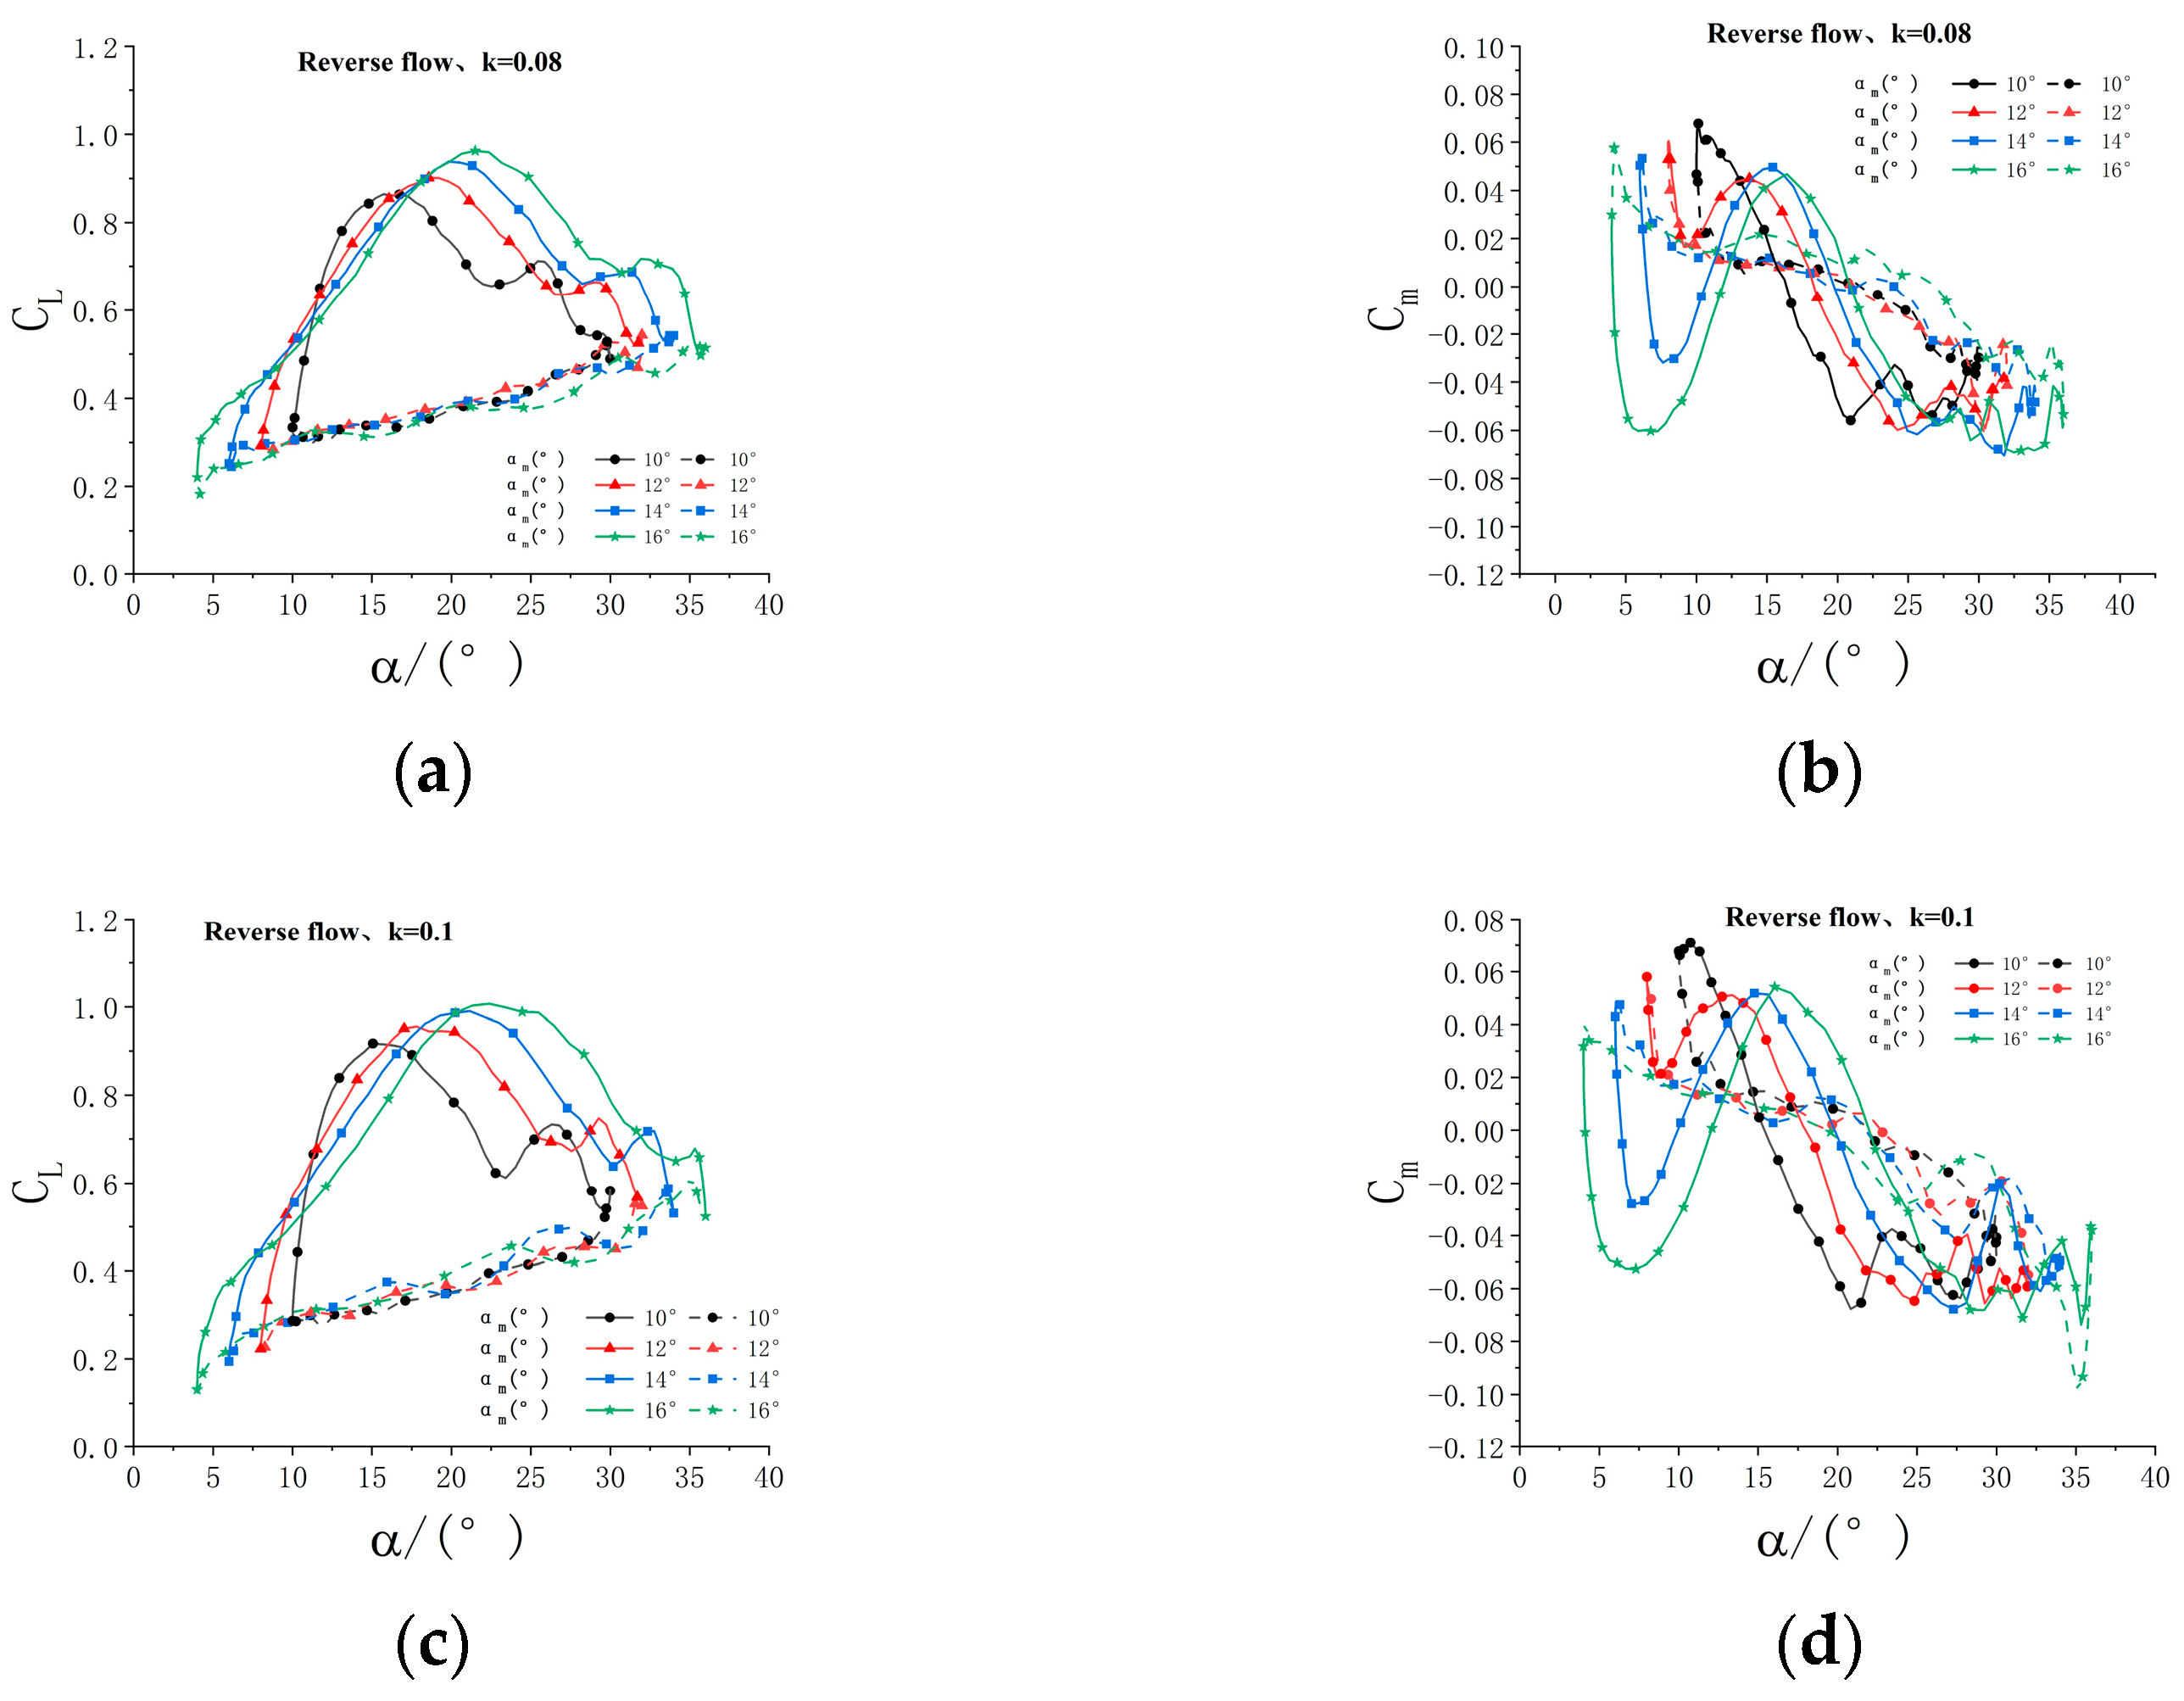
During the experiment, the mean angle of attack was kept constant, and the oscillation amplitude was varied to explore its influence on the dynamic stall. The experiment was carried out under the same wind speed and different pitch frequencies. The specific experimental conditions are shown in Table 8. The lift coefficient and moment coefficient obtained from data processing are plotted in Figure 16.
It can be seen that in the reverse flow region, the alternating moment of the airfoil is pronounced; the greater the pitch amplitude, the more notable the alternating moment. Under different reduced frequencies, the mean angle of attack has the same influence on the dynamic stall during forward and reverse-blowing states. The increase of the mean angle of attack delays the occurrence of dynamic stall, and the maximum lift coefficient increases accordingly.
In the case of reverse-blowing, during the upward phase of the pitching motion of the airfoil, the lift coefficient decreases slowly after the occurrence of dynamic stall; there are two peaks in the lift coefficient curve, indicating that a secondary stall has occurred. The lift coefficient recovers slowly in the downward phase of the pitching motion of the airfoil until the minimum angle of attack is reached, and the lift coefficient is far less than that in the ascending stage. This means that the airflow on the airfoil surface is always separated during the downward phase of the airfoil.
In the case of forward-blowing, the lift coefficient in the downward phase of airfoil pitching is always smaller than that in the upward phase, and the airflow is not adsorbed on the airfoil surface again.

3.3.2. Effect of the Oscillation Amplitude at Different Reynolds Numbers

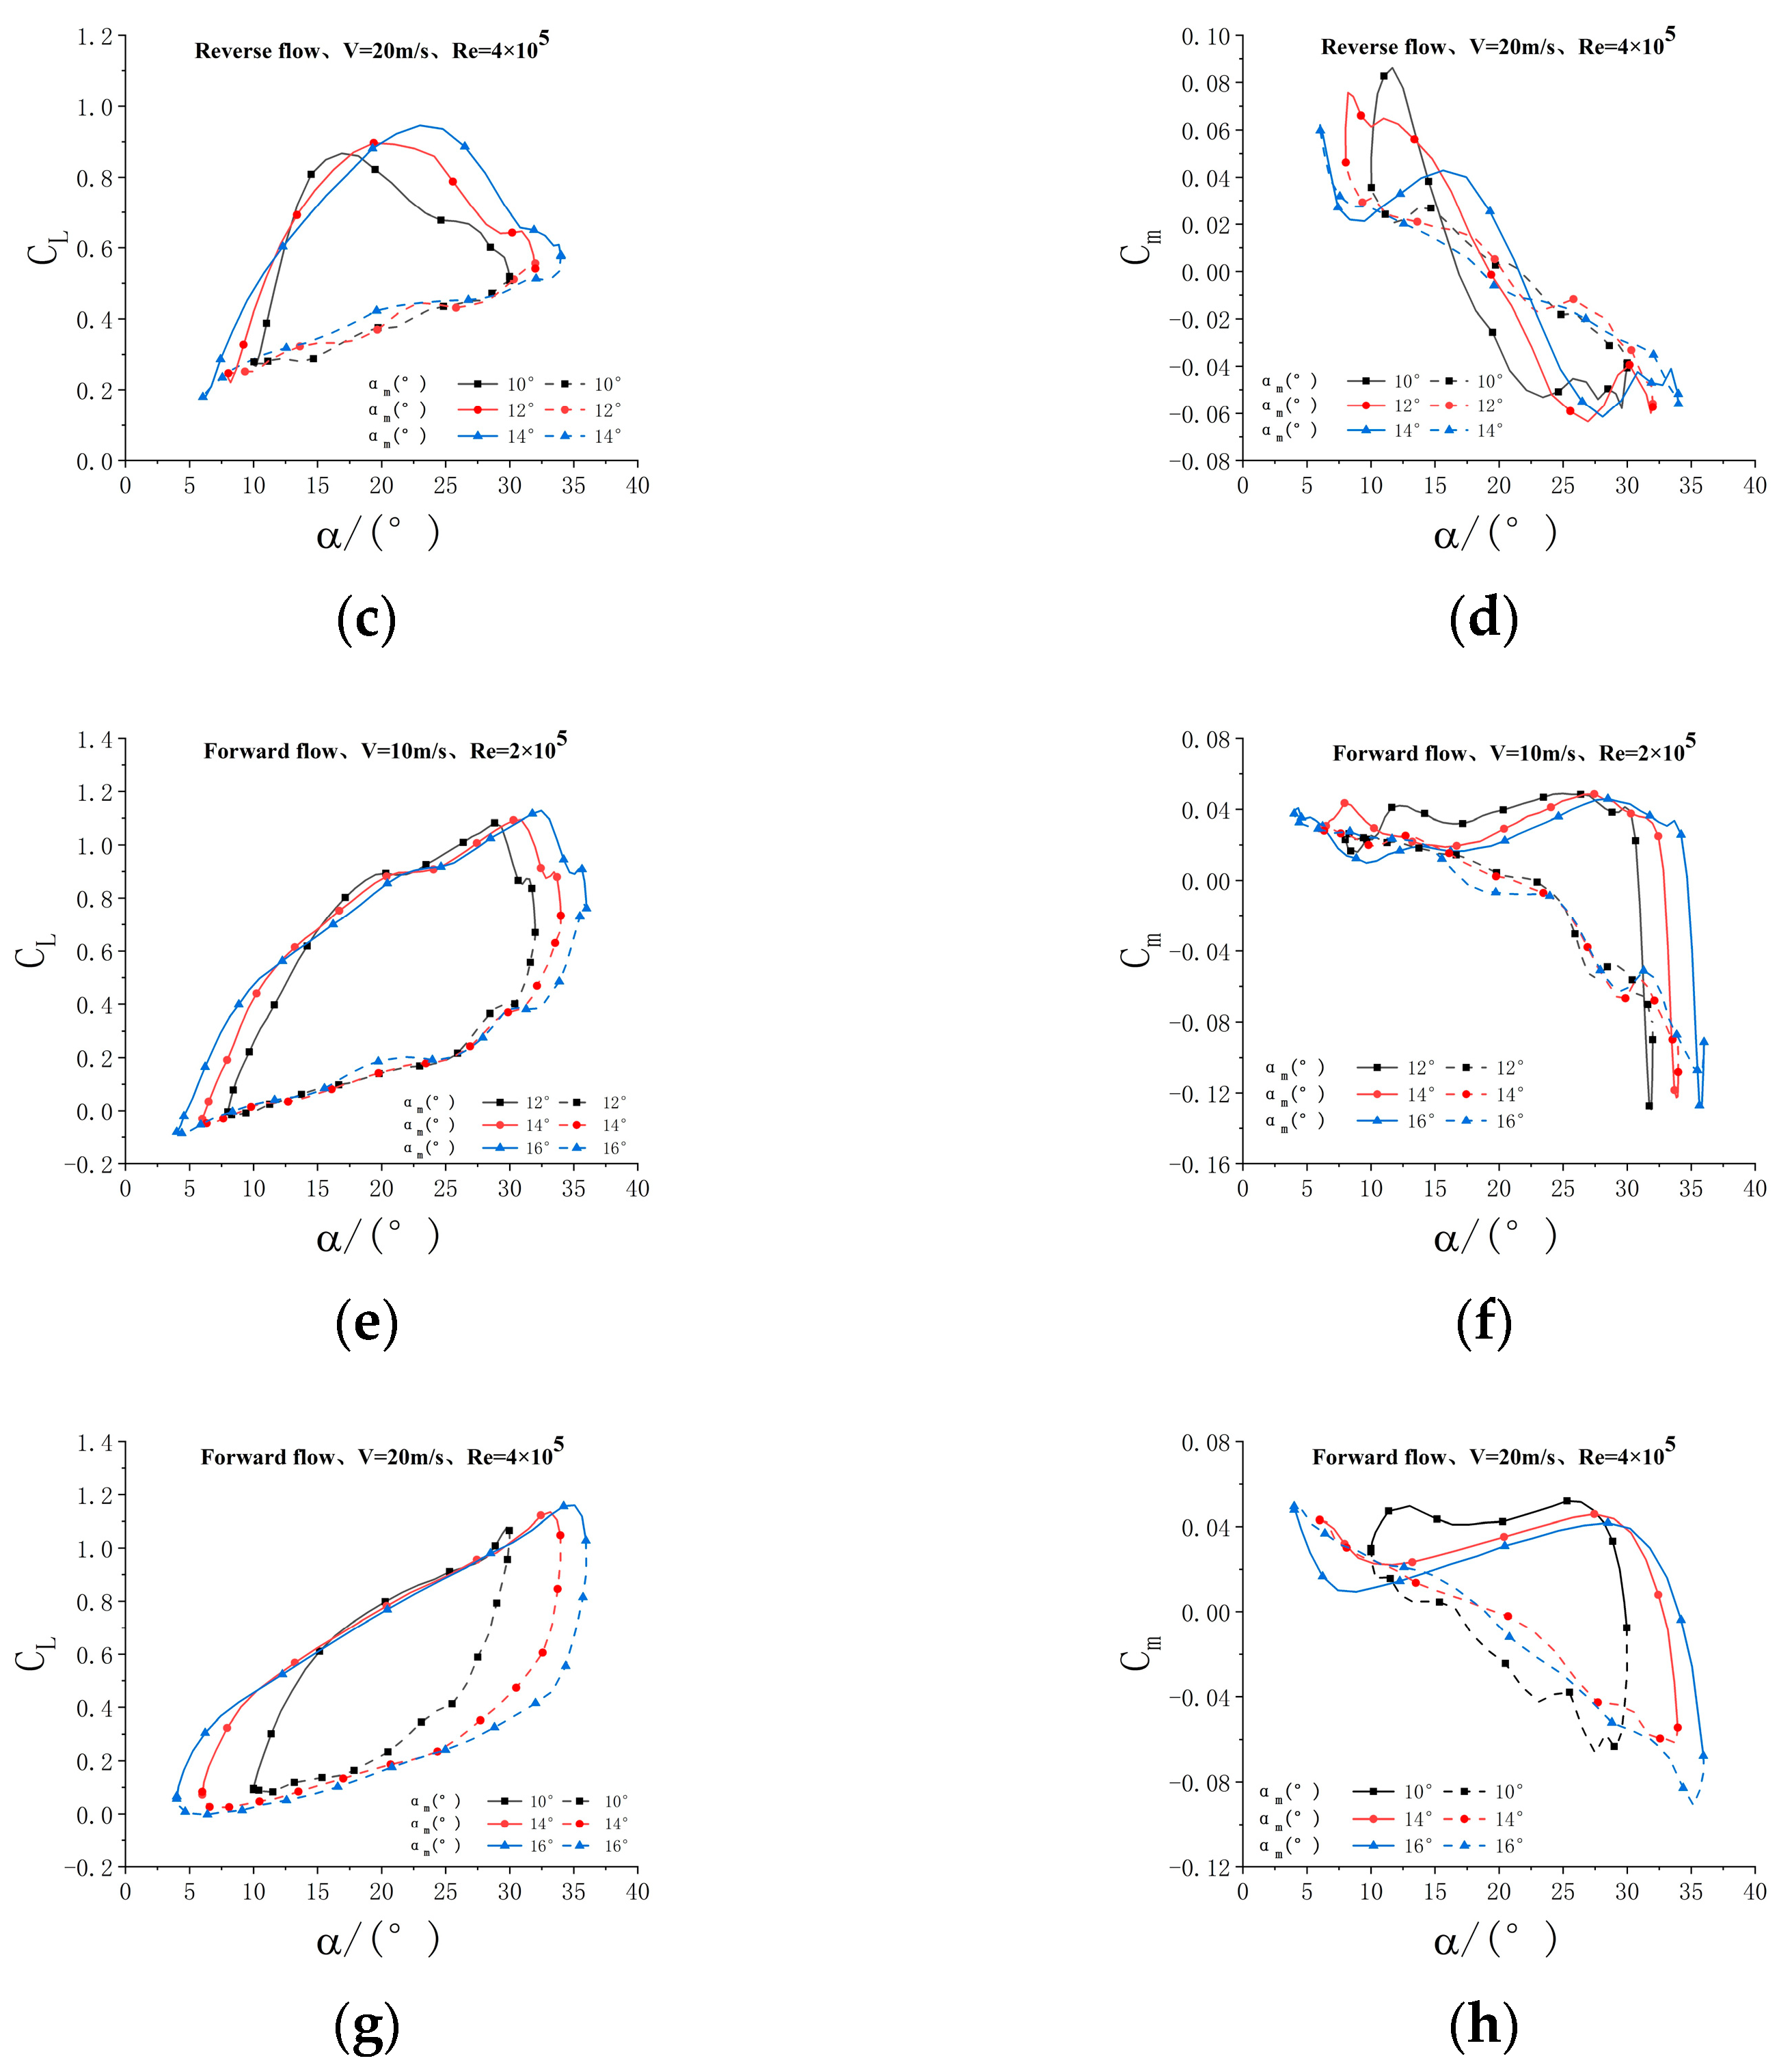
During the experiment, the mean angle of attack was kept constant, and the oscillation amplitude was altered to explore its influence on the dynamic stall. The experiment is carried out under different wind speeds, so it is necessary to change the physical oscillation frequency at the same time to ensure that the reduced frequency is 0.1 unchanged. The specific experimental conditions are shown in Table 9. The lift coefficient and moment coefficient obtained from experimental data processing are plotted in Figure 17.
It can be seen from Figure 17 that there are both similarities and differences in the influence of pitch amplitude on dynamic stall during forward and reverse-blowing. When the airfoil is in a forward or reverse-blowing state, the increase of pitch amplitude will delay the occurrence of dynamic stall and the increase of maximum lift coefficient, independent of Reynolds number. The lift coefficient decreases slowly after reaching the stall angle of attack during reverse blowing. Unlike reverse-blowing, the lift coefficient drops sharply after stalling in the forward-blowing state. In the upward phase of airfoil pitching during the reverse-blowing state, the smaller the pitching amplitude is, the higher the slope of the lift coefficient curve is, while during the forward-blowing state, the slope of the lift coefficient curve is almost independent of the pitching amplitude. The lift coefficient is basically similar in the downward pitching phase of the airfoil and has little relationship with the pitching amplitude. However, the lift coefficients are much smaller than those in the upward phase, indicating that the airflow is always in a separate state in the downward phase.

3.4. Effect of the Reduced Frequency

The reduced frequency is changed by the pitch frequency under the condition that incoming flow velocity, mean angle of attack, and pitch amplitude remain constant and the forward and reverse-blowing experiments are conducted. The specific experimental conditions are shown in Table 10. The lift coefficient and moment coefficient obtained from experimental data processing are plotted in Figure 18.
As can be seen from Figure 18, the increase in reduced frequency will delay the occurrence of dynamic stall and lead to an increase in the maximum lift coefficient. In the reverse-blowing state, the reduced frequency has a greater impact on the lift coefficient of the airfoil in the upward pitching phase. The lift coefficient of the airfoil decreases at the same angle of attack when the reduced frequency increases. After stall occurs, the lift coefficient curve with a reduced frequency of 0.08 has a crest again before the maximum angle of attack, which is obviously different from that with a reduced frequency of 0.12. The preliminary assessment is that the secondary stall is caused by the appearance of a secondary vortex. In the downward phase, the airflow with K of 0.12 recovers faster than that with K of 0.08, and the hysteresis loop area is smaller correspondingly. In the case of forward-blowing, the aerodynamic characteristics of different reduced frequencies are basically the same, and the reduced frequency in the upward phase has little effect on the lift coefficient. In the downward phase, the airflow with a reduced frequency of 0.12 recovers faster and has a smaller hysteresis loop area, similar to that in the reverse-blowing state.

3.5. Effect of the Reynolds Numbers

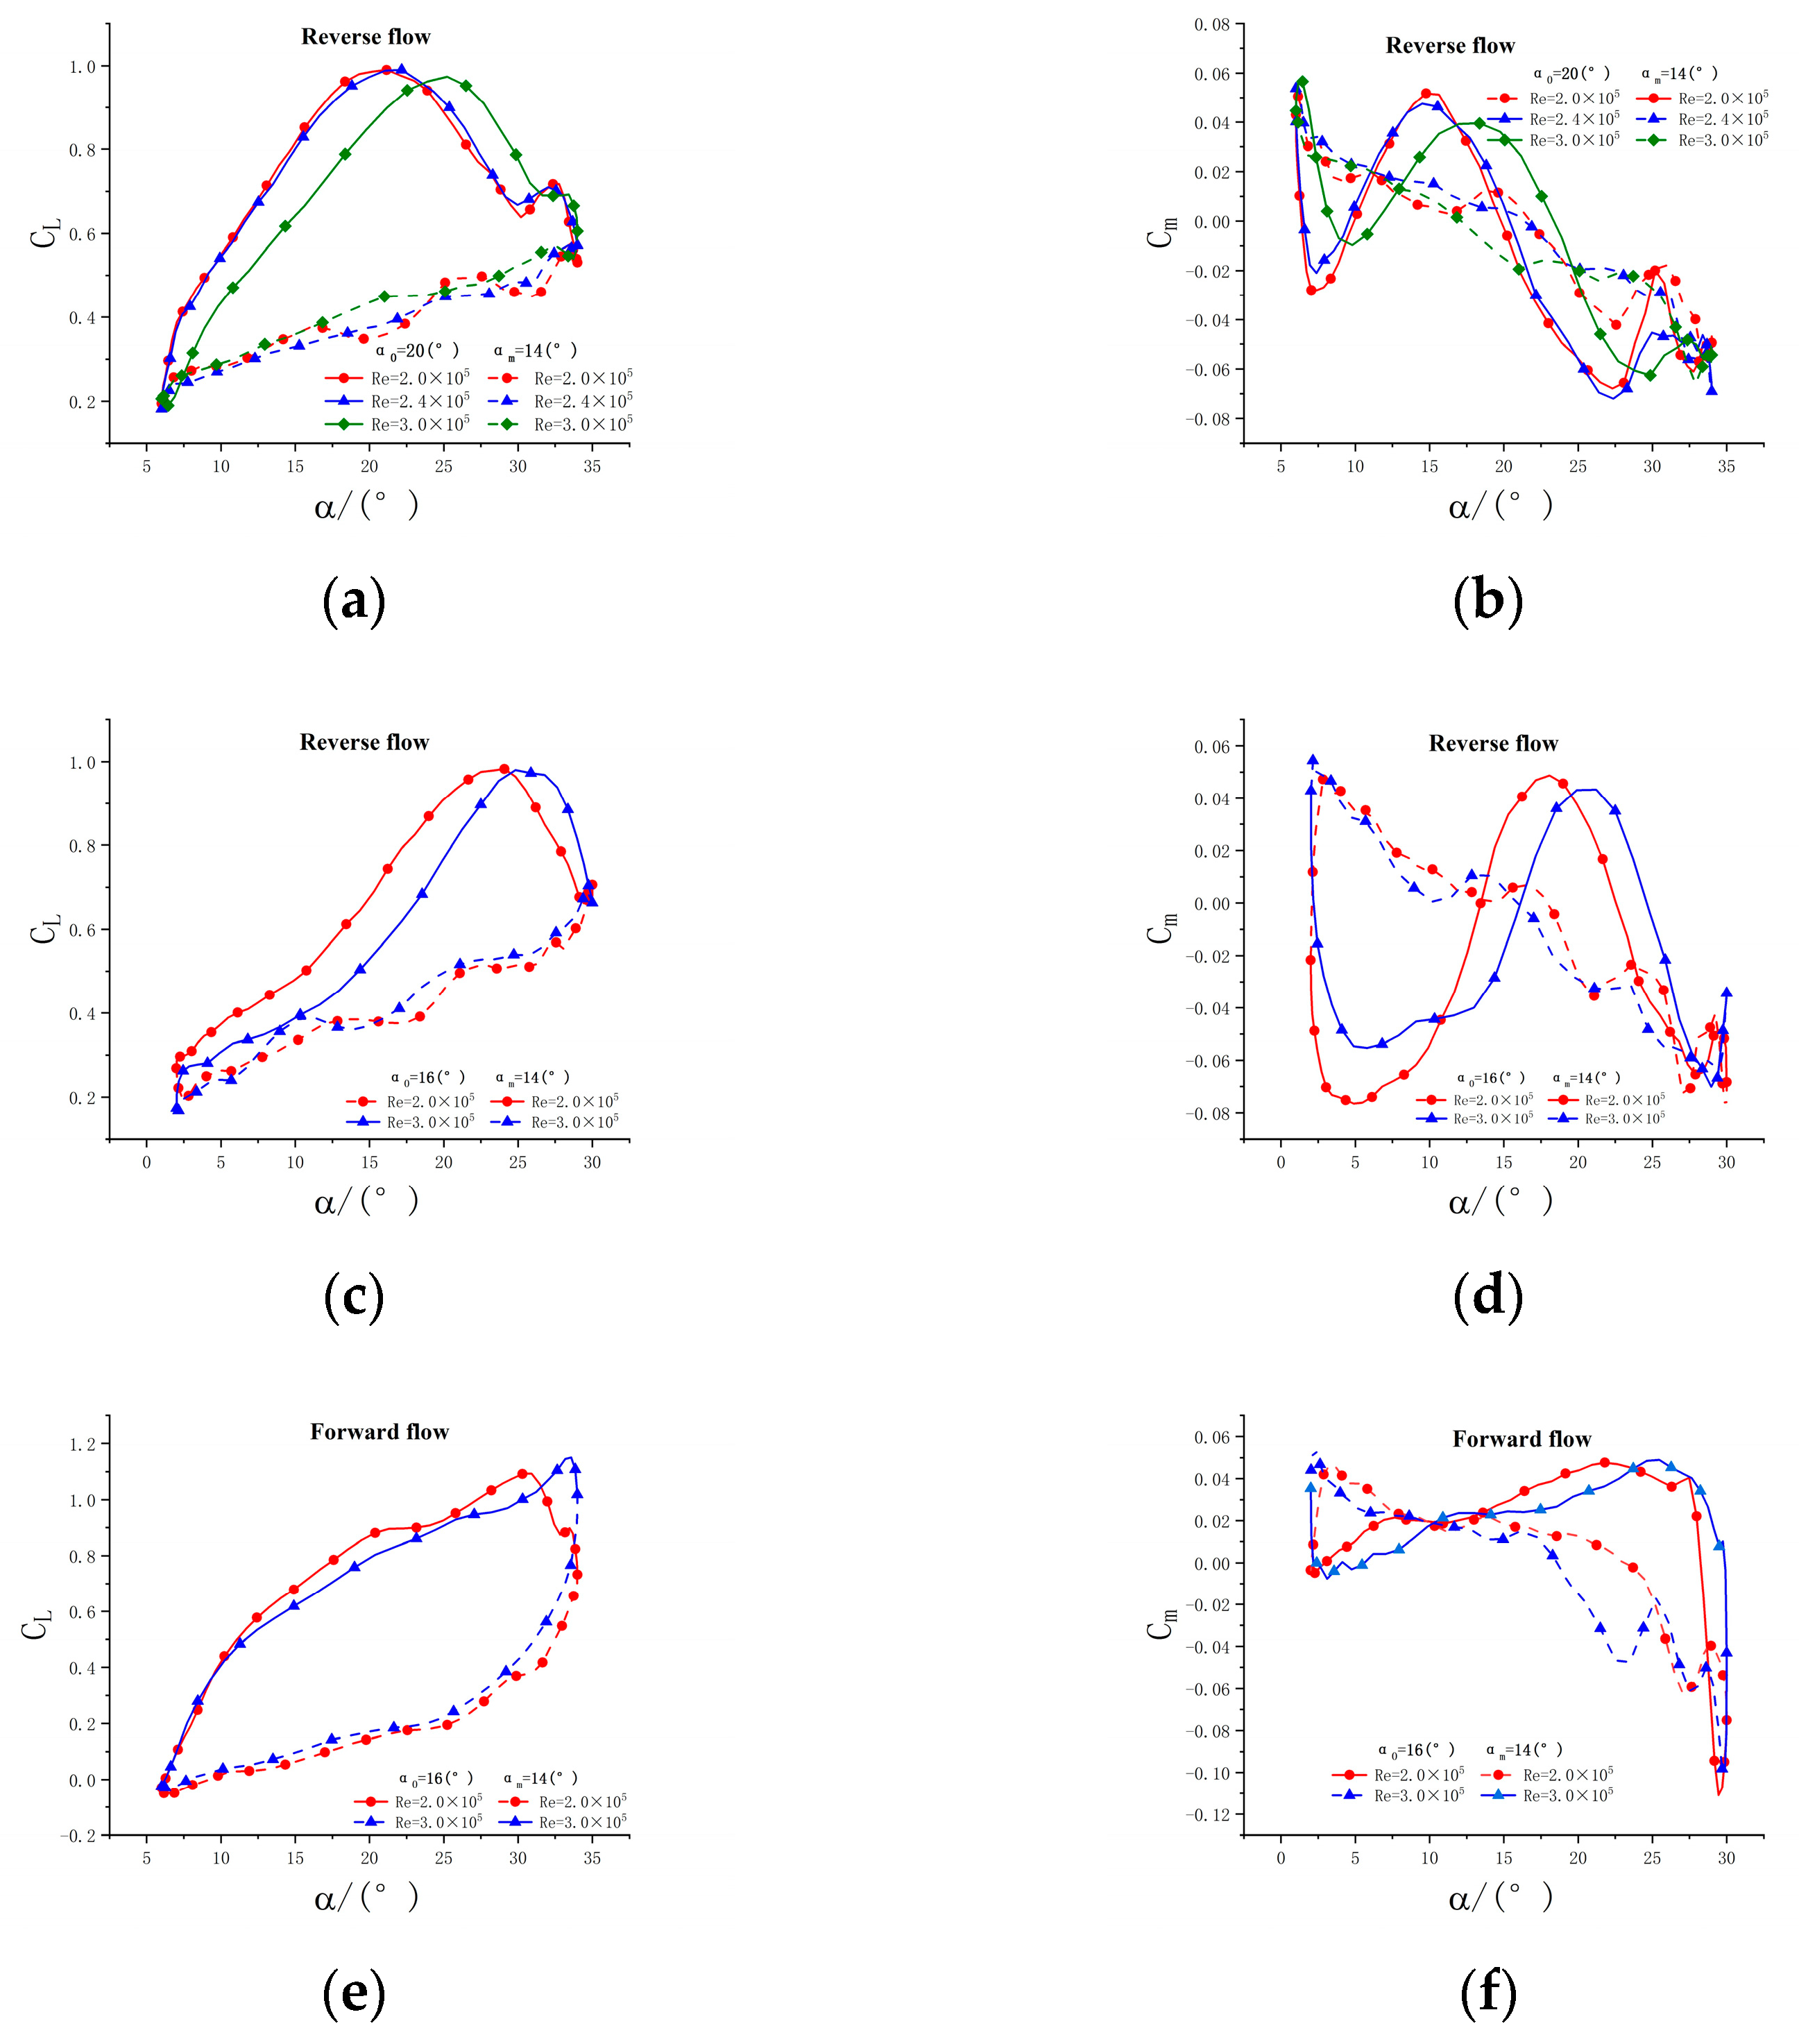
The inflow velocity varies the Reynolds number under the condition that the average angle of attack, pitch amplitude, and reduced frequency remains constant. However, since the reduced frequency is related to f and v, it is necessary to alter the pitch frequency at the same time as changing the incoming flow speed to ensure that the reduced frequency remains constant. The specific experimental conditions are shown in Table 11. The lift coefficient and 1/4 chord moment coefficient are plotted in Figure 19.
It can be found from the observation of Figure 19 that during both the reverse-blowing state and forward-blowing state, with the increase of Reynolds number, the dynamic stall occurs later, which is more pronounced than that in static blowing conditions. As the Reynolds number increases, the inertial force increases relatively, corresponding to an increase in the intensity of fluid turbulence, which has a certain inhibitory effect on the formation and generation of dynamic stall vortices. As the Reynolds number increases, lift recovery in the down pitch phase is faster, and the hysteresis loop is smaller. A high Reynolds number in the down-pitch phase means high turbulence and easy separation attachment, resulting in a faster lift recovery with a higher Reynolds number in the down-pitch phase.

3.6. Analysis of Aerodynamic Characteristics of Airfoils under Forward and Reverse Flow Switching Conditions

The profile airfoil in the large reverse flow region of the rotor with a high advance ratio continuously switches between forward and reverse flow. There is also a strong radial flow in the propeller profile, but due to the experimental conditions, only the pitch motion of the airfoil is considered here. Hence, the aerodynamic characteristics of forward and reverse flow switching of the NACA0018 airfoil were analyzed in this experiment. In this section, the lift coefficient and 1/4 chord moment coefficient were uniformly specified in the forward flow. The specific experimental conditions are shown in the following Table 12. The plotted lift coefficient curve and 1/4 chord moment coefficient curve are shown in Figure 20.
It can be found that the aerodynamic characteristics of the airfoil in the forward flow state and reverse flow state are markedly different, especially the 1/4 chord moment coefficient. At the same angle of attack, the corresponding lift coefficient and 1/4 chord moment coefficient vary greatly with different pitch strokes. Specifically, in the upward stage (solid line part), under the forward-blowing state, with the increase of the angle of attack, the lift coefficient first increases and then decreases after the dynamic stall occurs until the angle of attack reaches 90° and the lift coefficient becomes 0. Then the airfoil enters the reverse flow region, and the incoming flow flows from the geometric trailing edge of the airfoil to the geometric leading edge. At this time, the lift coefficient becomes negative, but the absolute value of the lift coefficient is less than one-half of that in the forward flow state, indicating that the aerodynamic efficiency of the rotor in the reverse flow region is lower in the upward stage. The 1/4 chord moment coefficient curve is always negative, providing a low upward moment. The 1/4 string moment coefficient curve is always negative, providing the downward moment. In the downward stage (dotted line part), the change law of the lift coefficient is similar to that in the upward stage.

4. Conclusions

In this paper, the problem of dynamic stall in the reverse flow region of a high advance ratio rotor was investigated to develop a set of dynamic pressure measurement systems for the surface of an airfoil in the reverse flow region. Static and dynamic stall experiments of the rotor airfoil inside and outside the reverse flow region are carried out, and the influence of the airfoil motion parameters on the dynamic stall is studied and analyzed. The results are as follows:
  • The aerodynamic characteristics of airfoils under static forward and reverse-blowing states are starkly different. At the same wind speed, the stall angle of attack under the reverse-blowing state is smaller than that under the forward-blowing state; After static stall occurs, the lift coefficient decreases slowly in the reverse-blowing state but sharply increases in the forward-blowing state; the Reynolds number is not significant for the static stall during the reverse-blowing state;
  • Under the same working conditions, dynamic stall is more likely to occur in the reverse-blowing state than in the forward-blowing state, indicating that dynamic stall is more likely to occur in the rotor reverse flow region. In a pitching cycle, the 1/4 chord moment coefficient alternates positive and negative many times during the reverse-blowing state but only twice during the forward-blowing state, which indicates that the rotor will bear more alternating load in the reverse flow region. After the occurrence of dynamic stall, the lift coefficient decreases slowly in the reverse-blowing state; the dynamic stall in the reverse-blowing state is caused by the slow drop and backward movement of the pressure suction peak on the suction side of the airfoil, while the dynamic stall in the forward-blowing state is caused by the sharp drop of the pressure suction peak at the aerodynamic leading edge of the airfoil;
  • With the increase of the average angle of attack, the dynamic stall is delayed in the forward-blowing state. In the reverse-blowing state, the influence of the average angle of attack on dynamic stall is coupled with other factors such as Reynolds number and reduced frequency, which shows that the influence factors of dynamic stall in the rotor reverse flow region are more complex than those of dynamic airfoil stall outside the reverse flow region. In the reverse flow region, the alternating moment is obvious, and the smaller the average angle of attack is, the more obvious the alternating moment is;
  • Whether in a forward-blowing state or reverse-blowing state, with the increase of pitch amplitude, the dynamic stall angle will increase, and the maximum lift coefficient will increase too. In the reverse flow region, the greater the pitch amplitude is, the more obvious the alternating moment is;
  • The reduced frequency has a great influence on the dynamic stall of the airfoil. Whether in a forward-blowing or reverse-blowing state, the increase in reduced frequency will delay the occurrence of dynamic stall, and the corresponding maximum lift coefficient will increase. The increase in reduced frequency is more effective in improving the dynamic stall characteristics of blades in the rotor reverse flow region;
  • During both the reverse-blowing state and forward-blowing state, with the increase of Reynolds number, the dynamic stall occurs later, which is more pronounced than that in static blowing conditions. As the Reynolds number increases, lift recovery in the down pitch phase is faster, and the hysteresis loop is smaller. A high Reynolds number in the down-pitch phase means high turbulence and easy separation attachment, resulting in a faster lift recovery with a higher Reynolds number in the down-pitch phase;
  • Under the switching conditions of forward and reverse flow, the dynamic stall of the airfoil occurs at the initial stage of the stroke, and the aerodynamic efficiency of the initial stage of the stroke is higher than that of the end of the stroke, regardless of the lift coefficient; The 1/4 chord line moment coefficient is always negative, providing the pitching down moment. The increase in pitch amplitude will lead to the increase of the maximum value of the lift coefficient and 1/4 chord moment coefficient.

Author Contributions

Conceptualization, methodology, software, writing-original draft preparation and writing-review and editing, W.K. and Y.L.; experiment data, Y.L. and W.K., supervision, project administration and funding acquisition, W.K. All authors have read and agreed to the published version of the manuscript.

Funding

This research is a project funded by the National Natural Science Foundation of China (5150051871).

Conflicts of Interest

The authors declare no conflict of interest.

References

  1. Bagai, A. Aerodynamic design of the x2 technology demonstrator™ main rotor blade. In Proceedings of the 64th Annual Forum of the AHS, Montreal, QC, Canada, 29 April–1 May 2008. [Google Scholar]
  2. Harris, F.D. Rotor Performance at High Advance Ratio: Theory versus Test; NASA CR 2008-215370; NASA: Hanover, MD, USA, 2008.
  3. Himmelskamp, H. Profile Investigations on a Rotating Airscrew; Ministry of Aircraft Production: London, England, 1947. [Google Scholar]
  4. Ham, N.D. Aerodynamic loading on a two-dimensional airfoil during dynamic stall. AIAA J. 1968, 6, 1927–1934. [Google Scholar] [CrossRef]
  5. McCroskey, W.J.; Carr, L.W.; McAlister, K.W. Dynamic stall experiments on oscillating airfoils. AIAA J. 1976, 14, 57–63. [Google Scholar] [CrossRef]
  6. Leishman, J.G.; Beddoes, T.S. A generalized method for unsteady airfoil behavior and dynamic stall using the indicial method. In Proceedings of the 42nd Annual Forumof the American Helicopter Society, Washington, DC, USA, 2–4 June 1986. [Google Scholar]
  7. Hind, M.D.; Strike, J.A.; Saini, M.S.; Naughton, J.W. Characterizing Dynamic Flow Conditions on Oscillating Airfoils. In Proceedings of the 50th AIAA Aerospace Sciences Meeting including the New Horizons Forum and Aerospace Exposition, Nashville, TN, USA, 9–12 January 2012. [Google Scholar]
  8. Zhao, G.; Zhao, Q.; Wang, Q. Simulation and Parameter Analysis on Unsteady Dynamic Stall Characteristics of Rotor Airfoils based on CFD method. J. Aerodyn. 2015, 33, 72–81. [Google Scholar]
  9. Richez, F. Analysis of Dynamic Stall Mechanisms in Helicopter Rotor Environment. J. Am. Helicopter Soc. 2018, 63, 1–11. [Google Scholar] [CrossRef]
  10. Letzgus, J.; Keßler, M.; Krämer, E. CFD-simulation of three-dimensional dynamic stall on a rotor with cyclic pitch control. In Proceedings of the 41th European Rotorcraft Forum, Munich, Germany, 1–4 September 2015. [Google Scholar]
  11. Vrishank, R.; Narayanan, K. Dynamic stall life cycle on a rotating blade in steady forward flight. In Proceedings of the AHS 70th Annual Forum, Montreal, OC, Canada, 20–22 May 2014. [Google Scholar]
  12. Michael, M.; Vrishank, R. Flow Structure on a Rotating Blade in Reverse Flow. Proceedings of ASME 2014 International Mechanical Engineering Congress & Exposition, Montreal, QC, Canada, 14–20 November 2014. [Google Scholar]
  13. Lind, A.H.; Lefebvre, J.N.; Jones, A.R. Experimental Investigation of Reverse Flow over Sharp and Blunt Trailing Edge Airfoils. In Proceedings of the 31st AIAA Applied Aerodynamics Conference, San Diego, CA, USA, 24–27 June 2013. [Google Scholar]
  14. Critzos, C.C.; Heyson, H.H.; Boswinkle, R.W., Jr.; Aerodynamic Ewans, J.; Krauss, T. Model Wind Tunnel Tests of a Reverse Velocity Rotor System; Naval Air Systems Command Report HC144R1070; U.S. Department of the Navy: Washington, DC, USA, 31 January 1973.
  15. Lyons, M.J. Circulation Control Improvements to Rotor Lift Asymmetry Due to Reverse Flow; West Virginia University: Morgantown, WV, USA, 2009. [Google Scholar]
  16. Lind, A.H.; Lefebvre, J.N.; Jones, A.R. Time-averaged aerodynamics of sharp and blunt trailing-edge static airfoils in reverse flow. AIAA J. 2014, 52, 2751–2764. [Google Scholar] [CrossRef]
  17. Datta, A.; Yeo, H.; Norman, T. Experimental Investigation and Fundamental understanding of a Slowed UH-60A Rotor at High Advance Ratios. In Proceedings of the American Helicopter Society 67th Annual Forum, Virginia Beach, VA, USA, 3–5 May 2011. [Google Scholar]
  18. Berry, B.; Chopra, I. Wind Tunnel Testing for Performance and Vibratory Loads of a Variable-Speed Mach-Scale Rotor. In Proceedings of the American Helicopter Society 67th Annual Forum, Virginia Beach, VA, USA, 3–5 May 2011. [Google Scholar]
  19. Ben, B.; Inderjit, C. High-Advance Ratio Wind Tunnel Testing of Two Mach-Scale Rotor Geometries. In Proceedings of the American Helicopter Society 69th Annual Forum, Phoenix, AZ, USA, 21–23 May 2013. [Google Scholar]
  20. Yeo, H.; Johnson, W. Aeromechanics analysis of a compound helicopter. In Proceedings of the American Helicopter Society 62nd Annual Forum, Phoenix, AZ, USA, 9–11 May 2006. [Google Scholar]
  21. Kong, W.; Chen, R. Effect of the Reflow Zone on Rotor Aerodynamic Characteristics of a Composite High Speed Helicopter. J. Aeronaut. 2011, 32, 223–230. [Google Scholar]
  22. Kottapalli, S. Performance and Loads Correlation of a UH-60A Slowed Rotor at High Advance Ratios. In Proceedings of the American Helicopter Society Vertical Lift Aircraft Design Conference, San Francisco, CA, USA, 18–20 January 2012. [Google Scholar]
  23. Mark, P.; Anubhav, D. Computational Investigation and Fundamental Understanding of a Slowed UH-60A Rotor at High Advance Ratios. In Proceedings of the American Helicopter Society 68th Annual Forum, Fort Worth, TX, USA, 1–3 May 2012. [Google Scholar]
  24. Lind, A.H.; Jones, A.R. Unsteady airloads on static airfoils through high angles of attack and in reverse flow. J. Fluids Struct. 2016, 63, 259–279. [Google Scholar] [CrossRef] [Green Version]
  25. Lind, A.H.; Smith, L.R.; Milluzzo, J.; Jones, A.R. Reynolds number effects on airfoils in reverse flow. In Proceedings of the 53rd AIAA Aerospace Sciences Meeting, Kissimmee, FL, USA, 5–9 January 2015; p. 1973. [Google Scholar]
Figure 1. Rotor reverse flow region at different advance ratios.
Aerospace 10 00170 g001
Figure 2. Schematic diagram of the experimental platform and experimental mode.
Aerospace 10 00170 g002
Figure 3. Miniature pressure sensors. (a) Miniature Dynamic Pressure Sensor Physical Drawing, (b) Pressure measuring probe form factor.
Aerospace 10 00170 g003
Figure 4. Schematic diagram of the chordal installation position of pressure sensors.
Aerospace 10 00170 g004
Figure 5. Model structure.
Aerospace 10 00170 g005
Figure 6. Data acquisition system. (a) NI9220 Data Acquisition Card, (b) NI CompactDAQ Chassis.
Aerospace 10 00170 g006
Figure 7. Aerodynamic forces on airfoil surface and their components.
Aerospace 10 00170 g007
Figure 8. Definition of lift coefficient and moment coefficient in positive and negative directions. (a) Forward-blowing, (b) reverse blowing.
Aerospace 10 00170 g008
Figure 9. Comparison of three static experimental lift coefficients at reverse-blowing. (a) Three sets of lift coefficient curves, (b) lift factor error bars.
Aerospace 10 00170 g009
Figure 10. Comparison of three sets of dynamic experimental data at reverse-blowing. (a) Three sets of lift coefficient curves, (b) lift factor error bars, (c) three sets of moment coefficient curves, and (d) moment coefficient error bars.
Aerospace 10 00170 g010aAerospace 10 00170 g010b
Figure 11. Lift coefficient and moment coefficient of static airfoil under forward-blowing and reverse-blowing.
Aerospace 10 00170 g011
Figure 12. Pressure coefficient of suction and pressure sides of airfoil under forward-blowing.
Aerospace 10 00170 g012
Figure 13. Pressure coefficient of suction and pressure sides of airfoil under reverse-blowing.
Aerospace 10 00170 g013
Figure 14. Effect of the mean angle of pitch at different K. (a) K = 0.1, CL, (b) K = 0.1, Cm, (c) K = 0.12, CL, (d) K = 0.12, Cm, (e) K = 0.1, CL, (f) K = 0.1, Cm, (g) K = 0.12, CL, (h) K = 0.12, Cm.
Aerospace 10 00170 g014aAerospace 10 00170 g014b
Figure 15. Effect of the mean angle of pitch at different Reynolds numbers. (a) Re = 2 × 10⁵, CL, (b) Re = 2 × 10⁵, Cm, (c) Re = 3 × 10⁵, CL, (d) Re = 3 × 10⁵, Cm, (e) Re = 2 × 10⁵, CL, (f) Re = 2 × 10⁵, Cm, (g) Re = 3 × 10⁵, CL, (h) Re = 3 × 10⁵, Cm.
Aerospace 10 00170 g015
Figure 16. Effect of the oscillation amplitude at different reduced frequencies. (a) K = 0.08, CL, (b) K = 0.08, Cm, (c) K = 0.10, CL, (d) K = 0.10, Cm, (e) K = 0.12, CL, (f) K = 0.12, Cm.
Aerospace 10 00170 g016aAerospace 10 00170 g016b
Figure 17. Effect of the oscillation amplitude at different Reynolds numbers. (a) Re = 2 × 10⁵, CL, (b) Re = 2 × 10⁵, Cm, (c) Re = 4 × 10⁵, CL, (d) Re = 4 × 10⁵, Cm, (e) Re = 2 × 10⁵, CL, (f) Re = 2 × 10⁵, Cm, (g) Re = 4 × 10⁵, CL, (h) Re = 4 × 10⁵, Cm.
Aerospace 10 00170 g017aAerospace 10 00170 g017b
Figure 18. Effect of the reduced frequencies. (a) CL, (b) Cm, (c) CL, (d) Cm.
Aerospace 10 00170 g018
Figure 19. Effect of the Reynolds numbers. (a) CL, (b) Cm, (c) CL, (d) Cm, (e) CL, (f) Cm.
Aerospace 10 00170 g019
Figure 20. Lift coefficient, 1/4 chord moment coefficient during forward and reverse flow switching.
Aerospace 10 00170 g020
Table 1. Main technical indicators of the wind tunnel.
Technical IndicatorData
Wide × high1.5 m × 1 m
Length of the test section1.7 m
Maximum wind speed40 m/s
Degree of turbulenceε ≤ 0.08%
Table 2. Main performance parameters of pressure sensors.
Main Performance ParametersData
Measuring range0~2 KPa
StressSurface pressure
Full range output0~5 V
Voltage±15 V
Natural frequency≥3 KHz
Zero voltage<±0.2%FS
Nonlinear<±0.2%FS
Hysteresis<±0.2%FS
Operating temperature0~70°
Table 3. Chord-wise installation position of pressure sensors.
Sensor Numberx/cSensor Numberx/c
10.0333120.8500
20.0833130.8833
30.1333140.9167
40.2000150.0500
50.3000160.1500
60.4333170.3500
70.5667180.5667
80.6667190.7667
90.7333200.8333
100.7833210.8833
110.8167220.9167
Table 4. The main performance parameters of the data collection card.
Main Performance ParametersData
Voltage±10 V
Sampling Rate100 kS/s/ch
Resolution16
Number of channels16
Table 5. Static test conditions.
α (°)v (m/s)Re (×105)
0~40102
153
204
Table 6. Experimental conditions of changing the mean angle of pitch at different reduced frequencies.
Kf (Hz)v (m/s)α0 (°)αm (°)
0.11.061016, 18, 20, 2214
0.121.271016, 18, 20, 2214
Table 7. Experimental conditions of changing the mean angle of pitch at different Reynolds numbers.
v (m/s)Re (×105)f (Hz)α0 (°)αm (°)
1021016, 18, 20, 2214
1531016, 18, 20, 2214
Table 8. Experimental conditions of varying pitch amplitude at different reduced frequencies.
Kf (Hz)v (m/s)α0 (°)αm (°)
0.080.85102010, 12, 14, 16
0.11.06102010, 12, 14, 16
0.121.27102010, 12, 14, 16
Table 9. Experimental conditions of varying pitch amplitude at different reduced frequencies.
v (m/s)Re (×105)f (Hz)α0 (°)αm (°)
1021.062010, 12, 14, 16
2042.122010, 12, 14, 16
Table 10. Experimental conditions for changing the reduced frequency.
kRef (Hz)α0 (°)αm (°)
0.082 × 10 5 0.852016
0.122 × 10 5 1.27
Table 11. Experimental conditions for changing the Reynolds numbers.
v (m/s)Ref (Hz)α0 (°)αm (°)
102 .0 × 10 5 1.062014
122 .4 × 10 5 1.27
15 3.0 × 10 5 1.59
102 .0 × 10 5 1.061614
15 3.0 × 10 5 1.59
Table 12. Experimental conditions of forward and backward flow switching of the airfoil.
Kf (Hz)v (m/s)Re (×105)α0 (°)αm (°)α (°)
0.101.19102907020~160
7515~165
8010~170
Disclaimer/Publisher’s Note: The statements, opinions and data contained in all publications are solely those of the individual author(s) and contributor(s) and not of MDPI and/or the editor(s). MDPI and/or the editor(s) disclaim responsibility for any injury to people or property resulting from any ideas, methods, instructions or products referred to in the content.