Article

On the Study of Thermal-Propulsive Systems for Regional Aircraft

1
IDMEC, Instituto Superior Técnico, Universidade de Lisboa, Av. Rovisco Pais, No. 1, 1049-001 Lisboa, Portugal
2
Department of Mechanical Engineering, University of Victoria, Stn. CSC, Victoria, BC V8W 2Y2, Canada
*
Author to whom correspondence should be addressed.
Aerospace 2023, 10(2), 113; https://doi.org/10.3390/aerospace10020113
Submission received: 21 November 2022 / Revised: 12 January 2023 / Accepted: 19 January 2023 / Published: 24 January 2023
(This article belongs to the Section Aeronautics)

Abstract

:
Life without mobility is inconceivable. To enable this connectivity, one must find a way to progress towards a more sustainable transportation. In the aviation industry, a comprehensive understanding of greening technologies such as electrification of the propulsion system for commercial aircraft is required. A hybrid-electric propulsion concept applied to a regional aircraft is studied in the context of the FutPrInt50 project. To this end, the hybrid-electric propulsive system components are modeled, validated, and evaluated using computational and experimental data presented in the literature. The components are then assembled to construct the three powertrains for the hybrid-electric propulsion systems (Series, Parallel and Turboelectric) and parametric studies are carried out to study the influence of various battery parameters and hybridization factor. The performance results for a simple mission profile are generated. Together with a thermal management system, multi-objective optimization studies for the different architectures are then performed, with the power hybridization factor as the design variable and minimization of total mass and emissions as objective functions.

1. Introduction

Modern life without air transportation is already inconceivable. However, global aviation, as it is widely known by the general public, comes with an environmental cost, which has grown as a concern, as shown in recent studies [1]. In addition, jet fuel has generally been more expensive than electricity [2,3], which has powered the exploration for clean and alternative energy sources.
With this sustainability issue in mind, several institutions have launched targets for the future to significantly mitigate the aviation impact on the environment without severely limiting either the number of flights or the economic growth, i.e., the challenge passes through finding a proper balance. NASA (National Aeronautics and Space Administration) set bold noise, fuel burn, and emission reduction goals for the new generation (N + 3) of aircraft to enter into service in 2030–2035, and funded studies suggest that electrification can mitigate the carbon footprint, noise signature, and NO x emissions [4]. In Europe, the guidelines were set by the European Commission through the Flightpath 2050 report [5]. In essence, the key aspect of these goals is to make the fleet operation more energy-efficient, reliable, and to reduce the emission and community noise related impacts [6].
Even though decarbonization is primarily an organizational and political challenge [7], there are several areas of study to consider on the road to a sustainable aviation and to reduce its environmental footprint [8]. These include not only propulsion but also aerodynamics, structures, and flight control, among other aircraft-related areas. However, combined effects from these different disciplines will be required to reach the aforementioned ambitious targets. Here, the main focus is on the propulsion side, namely on Hybrid-Electric Propulsion (HEP) [6,9], which is one of the identified possibilities for a more sustainable world in the scope of the FutPrInt50 project [10]. Despite HEP being seen as a promising solution towards aviation electrification, current battery technology [11] together with the increased need for heat dissipation [12] pose two major barriers towards this objective. Thus, a multidisciplinary effort must be sought as remarked by Freeman et al. [13].
With this in mind, the present paper aims at exploring different architectures of HEP combined with a Thermal Management System (TMS) in terms of overall mass and Green House Gas (GHG) emissions. To do so, numerical, theoretical, and semi-empirical models are integrated into a computational framework to model both propulsive and thermal management systems. Then, a multi-objective and multidisciplinary problem is stated and solved.
The subsequent sections are structured as follows: (i) firstly, a literature review on HEP and TMS is presented in Section 2; (ii) then, in Section 3, the developed models are introduced; (iii) Section 4 provides a discussion on the obtained results; and (iv) lastly, the final remarks are drawn in Section 5.

2. Literature Review

2.1. Hybrid-Electric Propulsion Architectures

Despite the fact that there are various hybrid-electric propulsion architectures, the most widely considered ones are the turboelectric, series, and parallel [6,9]. These are illustrated in Figure 1.
The turboelectric architecture, portrayed in Figure 1a, does not use any additional battery pack onboard for propulsion purposes, the electric motor is driven solely by turbo-generators (i.e., an internal combustion engine coupled with a generator), and does not necessarily have to have mechanical coupling [9]. Because this configuration lacks energy storage, the combustion engine must be sized for peak power demand, negating some of the anticipated benefits of other hybrid-electric systems. On the other side, this architecture does not rely on battery technology and once this latter is improved an adaptation to a series configuration is rather straightforward, as one can observe from Figure 1b.
On this note, the series HEPS (Hybrid-Electric Propulsion System) consists of a similar powertrain to the turboelectric one, with the exception that now the energy source can be either obtained from batteries or fuel via a turbo-generator, i.e., even the combustion branch is integrated into the electrical system, as depicted in Figure 1b. With this definition, the turboelectric configuration can be seen as a particular case of the series hybrid powertrain where there is no battery. One of the primary advantages of series HEP is the lack of a direct mechanical power line from the ICE to the transmission [14]. The main disadvantages of this configuration in comparison to the parallel architecture are the increased weight and losses due to the presence of more components in the powertrain and to the energy conversions.
Parallel hybrid architectures use a battery to drive an electric motor, which is then mechanically coupled to the output shaft of the internal combustion engine, as schematized in Figure 1c. Thus, in such an architecture, the propeller can be driven simultaneously by the gas turbine and an electric motor powered by batteries, i.e., it can be driven by either an electric motor or an internal combustion engine. Comparing this architecture to the series one, a parallel hybrid system provides more complex options than the latter, because a mechanical transmission is necessary for the distribution of mechanical energy between the internal combustion engine, the electric motor, and the propeller [9].

2.2. Thermal Management Systems

Concerning thermal management, this is a problem given the large onboard heat loads and their changing nature, thus a lot of research still needs to be conducted to enable the electrification of large aeroplanes [12]. From the recent progress in this field, one can note that synergies between different heat transfer technologies might be the way to cope with the increase in waste heat generated by hybrid-electric aircraft. These range from classical liquid cooling loops and Fuel Thermal Management Systems (FTMS) to less mature technologies such as Skin Heat eXchangers (SHX) [15], nanofluids [16] or Phase Changing Materials (PCM) [17].

2.3. Integration in Multidisciplinary Design Analysis and Optimization of Aircraft

The integration of these systems in large aircraft has been the focus of several studies [6,12]. As before stated, the main shortcomings are related to the energy storage and the increased heat load. Most of the studies focus on either one of the disciplines alone, although there are already some recent efforts on aero-propulsive integration [18,19]. Hoogreef et al. [18] presented a study comparing parallel and serial configurations alerting to the aforementioned mass and power penalties of series architectures; while Sgueglia et al. [19] in a Multidisciplinary Design Optimization (MDO) framework noted that a series architecture is advantageous for short-range flights when compared to conventional aircraft. Both articles considered 150-seater jetliners with distributed propulsion. Nevertheless, research papers combining both HEPS and TMS are rare [20]. Schiltgen et al. [20] proposed a hybrid-electric unconventional aircraft, also considering distributed propulsion and 150 passengers, that they claim to be more efficient than current aircraft generation. Their proposed TMS resorts only to liquid cooling with ram air, while ours include not only liquid cooling and ram air, but also skin heat exchanger and fuel tank as a heat sink. To the best of our knowledge papers addressing MDO of thermal-propulsive systems, the main focus of the present work, are nonexistent. Furthermore, the application of the proposed thermal-propulsive optimization process to the turboprop regional aircraft here study is a new contribution.

3. Methodology

First, the reference aircraft and mission profiles considered in the FutPrInt50 project are presented. Then, the propulsion and thermal management models are described. Lastly, the multi-objective optimization problem is stated.

3.1. Reference Aircraft

Given the fact that the ATR42-600 [21] is considered a reference for the regional aviation segment in the FutPrInt50 project, the development and modification of the computational models for this work took the characteristics of this aircraft into account. These are listed in Table 1.

3.2. Mission Segments

A simplified mission profile of the path from Edinburgh, United Kingdom, to Dublin, Ireland, with an alternate route was considered as described in [22] and illustrated in Figure 2.
Figure 2 also depicts the evolution of the drag throughout the mission which will be directly connected to the required power and thus to energy consumption. Having the C D and velocity profiles v, this force is calculated as follows,
D = 1 2 × ρ × v 2 × C D × S ,
where S represents the wing area, v is the airspeed and ρ stands for air density. It is worth mentioning that the considered drag profile was a preliminary aerodynamic estimation computed for the FutPrInt50 aircraft [22], which slightly differs from the ATR42-600. For the current work, this aerodynamic data as well as the aircraft configuration are kept the same to ensure a fair comparison between the developed thermal-propulsion models, i.e., one of the main objectives of this paper. However, as will be highlighted later, a synergistic effort with aerodynamics and other disciplines might be more adequate to fully explore the hybrid-electric potential to mitigate the carbon footprint of aviation.

3.3. Propulsion Model

3.3.1. Propeller

ATR42-600 is equipped with Hamilton Standard 568F propellers [21], that are six-bladed, have a nominal diameter of 3.93 m and a non-linear twist with swept-back tips. Since the propeller design is a complex problem on its own and given the focus of the current work on hybrid-electric propulsion, the external layout and main characteristics of the reference aircraft, as aforementioned, are kept the same, including the propellers. As such, these propellers are considered here. Nevertheless, the software chosen to model it, JBLADE [23,24], is able to analyze different propellers. This software has been validated for different types of propellers, proving that it can be used to design and optimize propellers for different purposes. Among these propellers is the NACA TR-594-“PROP C” [25], which has a diameter slightly lower than the ATR propeller and a similar advance ratio. For this propeller, JBLADE seems to follow well the behavior of the coefficients of thrust and power besides the efficiency, as displayed in [23], thus showing its adequateness for such propeller. As FutPrInt50 is designed based on the reference aircraft, one will consider the mass of the propeller to be the mass of the F568 propeller, which is 165 kg.

3.3.2. Electric Motor and Generator

Without many specifications, electric motors and generators can be modeled in the same way, as they are based on the same working principles, so only the electric motor will be presented in detail.
The motors/generators from the EMRAX supplier (10 kW/kg) [26] will be considered. According to Friedrich and Robertson [27], these electrical components scale almost linearly. Furthermore, one can stack several motors to give more power.
According to Lowry and Larminie [28], there are four groups of power losses in an electric motor: constant losses ( k c ), ohmic/copper losses ( k c o p p e r × Q 2 ), core/iron losses ( k i r o n × ω ), and friction and windage losses ( k f × ω 3 ). One can lump all of the power losses aforementioned and then define the electric motor efficiency as the ratio between the output power and the input power:
η e m = ω × Q k c + k c o p p e r × Q 2 + k f × ω 3 + k i r o n × ω + ω × Q ,
where the k parameters are loss coefficients as defined by McDonald [29], ω stands for angular speed, and Q represents torque. For the loss coefficients, data from both the electric motor and Zamboni et al. [30] were used.
A motor map is constituted by the motor operating envelope and its part-power efficiency behavior, and according to this model, for the operating range of the electric motor to be fully determined, there are three further coefficients, k P , k Q , and k w , that need to be defined. Following McDonald’s work [29], these can be established as a function of the rated (marked by the subscript r a t e d ) and ideal (denoted by ^ ) characteristics of the electric motor:
P r a t e d = k P × P ^ = ω r a t e d × Q r a t e d ,
Q r a t e d = k Q × Q ^ ,
ω r a t e d = k P k Q × ω ^ ,
ω l i m i t = k w × ω ^ .
The resulting efficiency map presents similarities to the experimental one from the EMRAX 380 kW electric motor. For comparison purposes, some points were selected from these maps to allow for an easier direct comparison of the relative error. These points are shown in Table 2, where it is possible to observe errors lower than 7%.
Using the EMRAX motor data as a basis, the variation in mass, length, and diameter with the power of the electric motor can be considered, as expected, linear.
According to Stückl [31], the scaling up of an electrical machine with increasing power comes with the consequence of a decreasing quotient between the external surface and the internal volume, which makes it difficult to cool down. This combined effect is only assessed in the multi-objective optimization problem.

3.3.3. Battery

Energy storage is essential for the majority of hybrid-electric systems and remains a challenge. Boeing 787 and Airbus 350 have used Lithium-ion (Li-ion) batteries in the commercial aviation segment [32] and the current state-of-the-art energy storage systems use Li-ion batteries that have been established for decades.
The modeling of the battery and discharging curves were developed according to the following equation, proposed by MathWorks MATLAB for the Simulink environment [33],
V ( i * , i t ) = V 0 K × C C i t × i * K × C C i t × i t + A × e x p ( B × i t ) ,
where: i * is the low-frequency current dynamics; i t represents the extracted capacity; C denotes the maximum battery capacity; A is the exponential voltage; and B is the exponential capacity. This model has some limitations, including: the no load cell voltage that is set to 0 V; the temperature dependencies are neglected; and the minimum capacity is 0 Ah and the maximum is Q .

3.3.4. Turboshaft

To model the turboshaft one used its working principles to model each of its components, depicted in Figure 3, based on their propulsion and thermodynamics governing equations, that follow classical textbooks in thermodynamics and propulsion [34,35].
The equations to calculate the total pressure p 0 and total temperature T 0 at each state of the turboshaft (identified in Figure 3) are presented in Table 3, where: C p is the specific heat at constant pressure; γ denotes specific heat ratio; η stands for efficiency; Π C is the pressure ratio at the compressor (9.45); Π T is the pressure ratio at the turbine (0.317); L H V is the low heating value (42,800,000 J/kg); Δ p represents a pressure drop in the combustion chamber (0.04 Pa); m ˙ f and m ˙ a denote the fuel and air flow rates, respectively (it is worth noting that the values between brackets are the values after the tuning of the model with the reference engine data).
To convert fluid-borne mechanical and thermal energy into shaft work ( S H P ) the following expression is used,
S H P = ( m ˙ a + m ˙ f ) × C p , g × ( T 04 T 05 ) ,
and to estimate the heat generated by the combustion engine ( q ˙ I C E ) the following equation is employed,
q ˙ I C E = m ˙ a × C p , a × ( T 05 T 02 ) .
This turboshaft model was validated with T56 turboprop engine data [36] and the relative errors are low, as can be observed in Table 4.
Regarding the mass estimation, a classical “rubber engine” method from [37] for aircraft sizing was used, also considering the T56 engine as the actual model.

3.3.5. Gearbox

A gearbox was added between the propeller and the electric motor to improve the efficiency of the powertrain. To determine the efficiency of this component, the following analytical method is considered [38]:
η g e a r b o x = 99.5 0.6771 × P g e a r b o x P s h a f t ,
where P g e a r b o x is the power of the gearbox and P s h a f t is the power of the shaft. For sizing considerations, the mass was estimated by the following equation:
m g e a r b o x = k g e a r b o x × P g e a r b o x 0.76 × n i n 0.13 n o u t 0.89 ,
where k g e a r b o x is a technology factor used to correct the mass accounting for future technology improvements. Given that these gearboxes are not yet commercialized, it may be difficult to set a value for k g e a r b o x . So, a reference assumption of 22.5, as defined by Filippone [39], was considered.

3.3.6. Architectures

Figure 4 schematizes how the above described models (at the component level) are integrated to form the three hybrid-electric architectures (at the system level) within the developed MATLAB framework.
The computational model starts with the thrust required for the propeller obtained from the drag profile. Then, with the propeller model the power required for the shaft as well as its rotational speed are calculated before entering the gearbox model, where the power required is corrected. The way the power required for the gearbox is provided differs from the architecture: (i) for the turboelectric configuration the power is provided by an electric motor; (ii) for a series architecture the power degree of hybridization ϕ assigns the percentage of power that comes from batteries, being the remainder provided by an electric motor; and (iii) for the parallel layout, the power is generated by the turboshaft controlled by the mass of fuel flow and assisted by a generator in a given percentage defined by the hybridization factor ϕ . For both turboelectric and series-hybrid architectures, the electric motor is powered by a generator which in turn is coupled to a turboshaft, yielding the mass of fuel flow needed. Regarding the generator in the parallel configuration, it is powered by batteries.

3.4. Thermal Management Model

The TMS will be responsible for regulating the temperature of aircraft subsystems by managing heat transfer between heat sources and heat sinks in order to optimize comfort, safety, and efficiency. With the intention of recurring to relatively high Technology Rediness Level (TRL) heat transfer technologies, the TMS is designed to incorporate external ram air cooling, liquid loops, the skin heat exchanger concept, and fuel as a heat sink. The TMS architecture proposed for the different propulsion layouts is shown in Figure 5.
According to Figure 5, the heat is removed from the representative heat load by a liquid cooling cycle that uses an Ethylene-Glycol and Water (EGW) mixture as the working fluid. This heat load consists of the sum of all the power losses estimated for the powertrain components. First, the heat is transferred to a fuel thermal management system, via a fuel-EGW heat exchanger. The remaining flux is dissipated to a ram air inlet, via a ram air-EGW heat exchanger (RHX). Regarding the FTMS, a mass flow of fuel leaves the tank to enter Fuel Heat Exchanger (FHX) where it collects heat from the EGW. A proportioning valve splits the incoming fuel mass flow rate into an amount that is sent to the internal combustion engine for propulsion purposes, and an amount that is recirculated back to the tank after it has rejected heat through a fuel-wing skin heat exchanger.
A summary of the methodology followed to model the different components is presented in Table 5.
The TMS presented is designed to manage half of the total heat load according to the symmetry of the different HEP architectures. To understand the impact on the aircraft, the total mass, power consumption and the number of elements will then be multiplied by two. The model was created using the MATLAB/Simulink environment and more than 100 variables were considered to obtain the different energy balances and corresponding heat transfer rates and fluid temperatures. An overview of the Simulink blocks diagram used to model the architecture in Figure 5 highlighting both SHX and fuel tank models is presented in Figure 6.
A detailed presentation of the different variables and equations used to develop the TMS used can be found in [40].

3.5. Multi-Objective Optimization with TMS (Thermal Management System)

In order to reach an optimal hybrid-electric solution that addresses different thermal-propulsive implementation issues, both the propulsion and thermal management models were considered in a combined optimization problem. This optimization problem accounts not only for the combined mass of the systems, but also for GHG emissions associated with the production and use phases of the energy source and liquid cooling. Given these two objectives, the following multi-objective optimization problem statement can be established:
Minimize f ( x ) = Mass ( x ) , GHG emissions ( x ) w . r . t . x = ϕ ,
where x is the design variable, i.e., the power hybridization factor ϕ and f ( x ) the multi-objective function The GHG emissions are calculated for a single mission by summing all contributions, i.e., battery production and recharge, fuel production and consumption, and liquid cooling production. This can be written as,
GHG emissions = e b , p 2000 + e b , r E b + e f , p × m f × e f * + e f , c × m f + e l , p × m l 2000 ,
where: e stands for emission factor; E for energy; m for mass; e * for energy density; and the subscripts b, f, p, r, c, and l are related to battery, fuel, production, recharge, combustion, and liquid cooling, respectively. To dilute the production of both batteries and liquid cooling, a constant value of 2000 which represents the number of cycles between battery replacements was assumed. This assumption does not affect GHG emissions as significantly as fuel or battery recharge, although it gains relevance as the electric mix is powered by renewable sources and the hybridization factor is increased. To reduce the environmental impact in the production phase, sustainable aviation fuels (SAFs) derived from biomass are a possibility, once these do not compete with agriculture, food, or other harvestable materials [44]. Here, the Alcohol-to-Jet (ATJ) obtained from wheat straw is considered given its considerably lower carbon footprint when compared to Jet Fuel A1 [45], although this wheat straw biomass should be sustainably produced. The emission factors considered in this study are stated in Table 6 for optimistic and pessimistic environmental scenarios.
It is worth mentioning that other environmental metrics could result in different outcomes. Furthermore, to reach sustainability, it is necessary to account for the three vertices: society, environment, and economy [50]. Even though such a study is out of the scope of the present work, it would be interesting in the future to aggregate the following three methodologies as being considered for civil engineering applications: Life Cycle Costs (LCC); environmental Life Cycle Assessment (LCA); and Social Life Cycle Assessment (S-LCA) [51].
In this research work, the Nondominated Sorting Genetic Algorithm (NSGA-II), proposed by Deb et al. [52] and documented in [53], is used for solving this thermal-propulsive optimization problem.

4. Results

The objective of this section is to present, compare and discuss the outcomes coming from the implementation of the three different architectures together with the mission profile.

4.1. Sensitivity Analysis

4.1.1. Battery Characteristics

All the other components and their characteristics are kept unchanged while the sizing parameters of the battery (internal resistance, exponential voltage, exponential capacity and the weight of the cell itself) are varied to assess their influence along the minimum and maximum values defined. To perform the analysis, only one parameter is changed at a time while the others are kept at their reference values (one considered the average between the minimum and maximum values), although their interdependence is high, all of them are presented in Table 7. The minimum values are considered to be the characteristics of the A123 cell [54] and the maximum values are considered to be the ones from the study of a pouch cell of 407 Wh/kg [55], with the exception of the internal resistance due to lack of information (one considered general values of lithium-ion batteries [56]).
Figure 7 shows linear regressions between some points considered. Among the inferences that may be derived from the produced graphs for the various attributes are the following:
  • Exponential capacity and voltage: The parcel with these two terms is an exponential parcel added to better reflect the voltage dynamics when the current varies and to account for the OCV (Open Circuit Voltage) as a function of the SoC (State of Charge). The battery mass appears to expand linearly-logarithmically as the exponential zone time constant inverse (exponential capacity) increases and drops as the exponential voltage per step increases.
  • Cell internal resistance: It determines the performance and life of the battery. A battery with low internal resistance delivers the total amount of energy available. A battery with a high internal resistance cannot provide the required amount of energy, causing the equipment to fail prematurely. As expected, battery mass grows approximately linearly with the increasing internal resistance until it no longer has an effect.
  • Cell weight: As predicted, the weight of the battery grows linearly in proportion to the increase in the weight per cell, while all other properties remain the same.
  • Cell capacity: As this concept is defined as the total amount of electricity created as a result of electrochemical processes in the battery, its increase is predicted to result in a decrease in the overall weight of the battery, as demonstrated by an exponential drop.

4.1.2. Hybridization Factor of Power

Now, considering the battery cells from the National University of Singapore [55] the influence of the power degree of hybridization is studied. As expected, this parameter presents a linear correlation with the battery mass, although care should be taken when considering high values of mass in the work since the MTOW of the aircraft is kept constant to consider the same drag profile. Given this assumption a feasibility post-processing is required as discussed later.

4.2. Baseline Analysis

In this section, the entire propulsive system is evaluated for the fixed characteristics resulted from the sensitivity analysis, to allow for the comparison between architectures. The same power hybridization factor of 10% is considered for the series and parallel hybrid configurations. It is relevant to mention that this constant value of the hybridization factor results in different propulsion system masses. Thus, the payload will be different for each architecture and care should be taken, which will be considered in the multi-objective optimization problem. In this subsection, the focus is to compare how the power required, heat dissipation, fuel flow and emissions differ for each considered powertrain.

4.2.1. Turboelectric
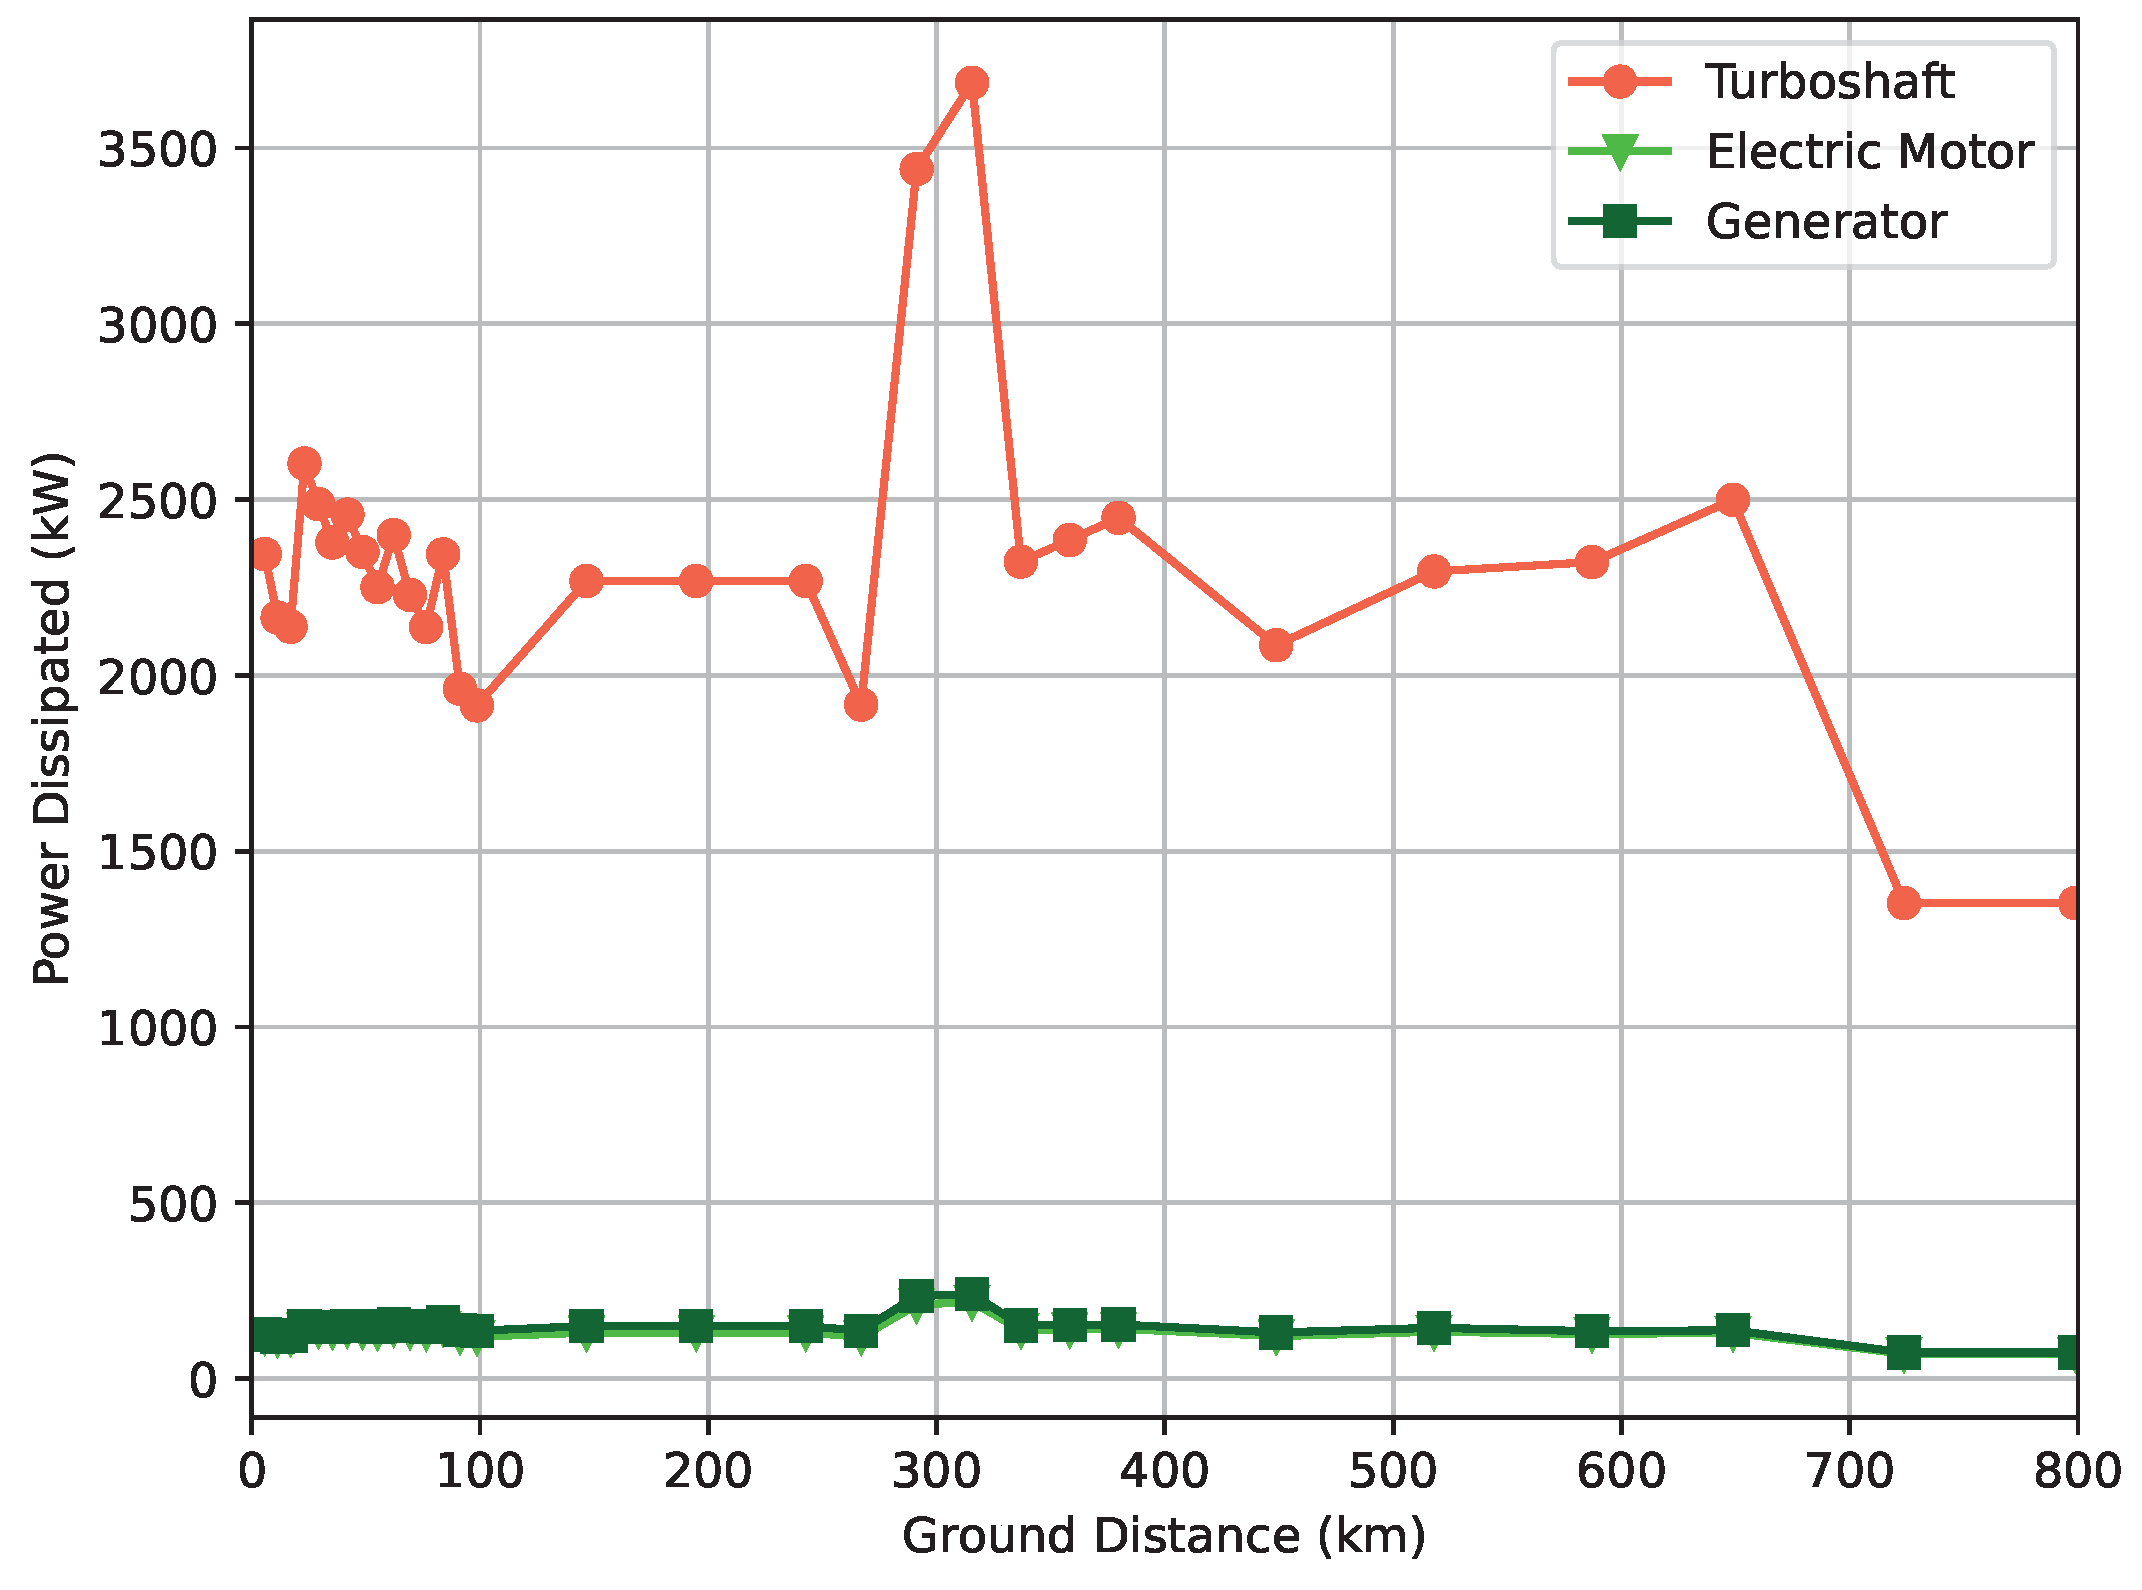
Figure 8 and Figure 9 show the power required and dissipated by the turboelectric powertrain, respectively. Overall, the results are consistent with the drag profile displayed in Figure 2, and the power output of the ICE (Internal Combustion Engine) is comparable to the engines of the ATR42-600 [21,
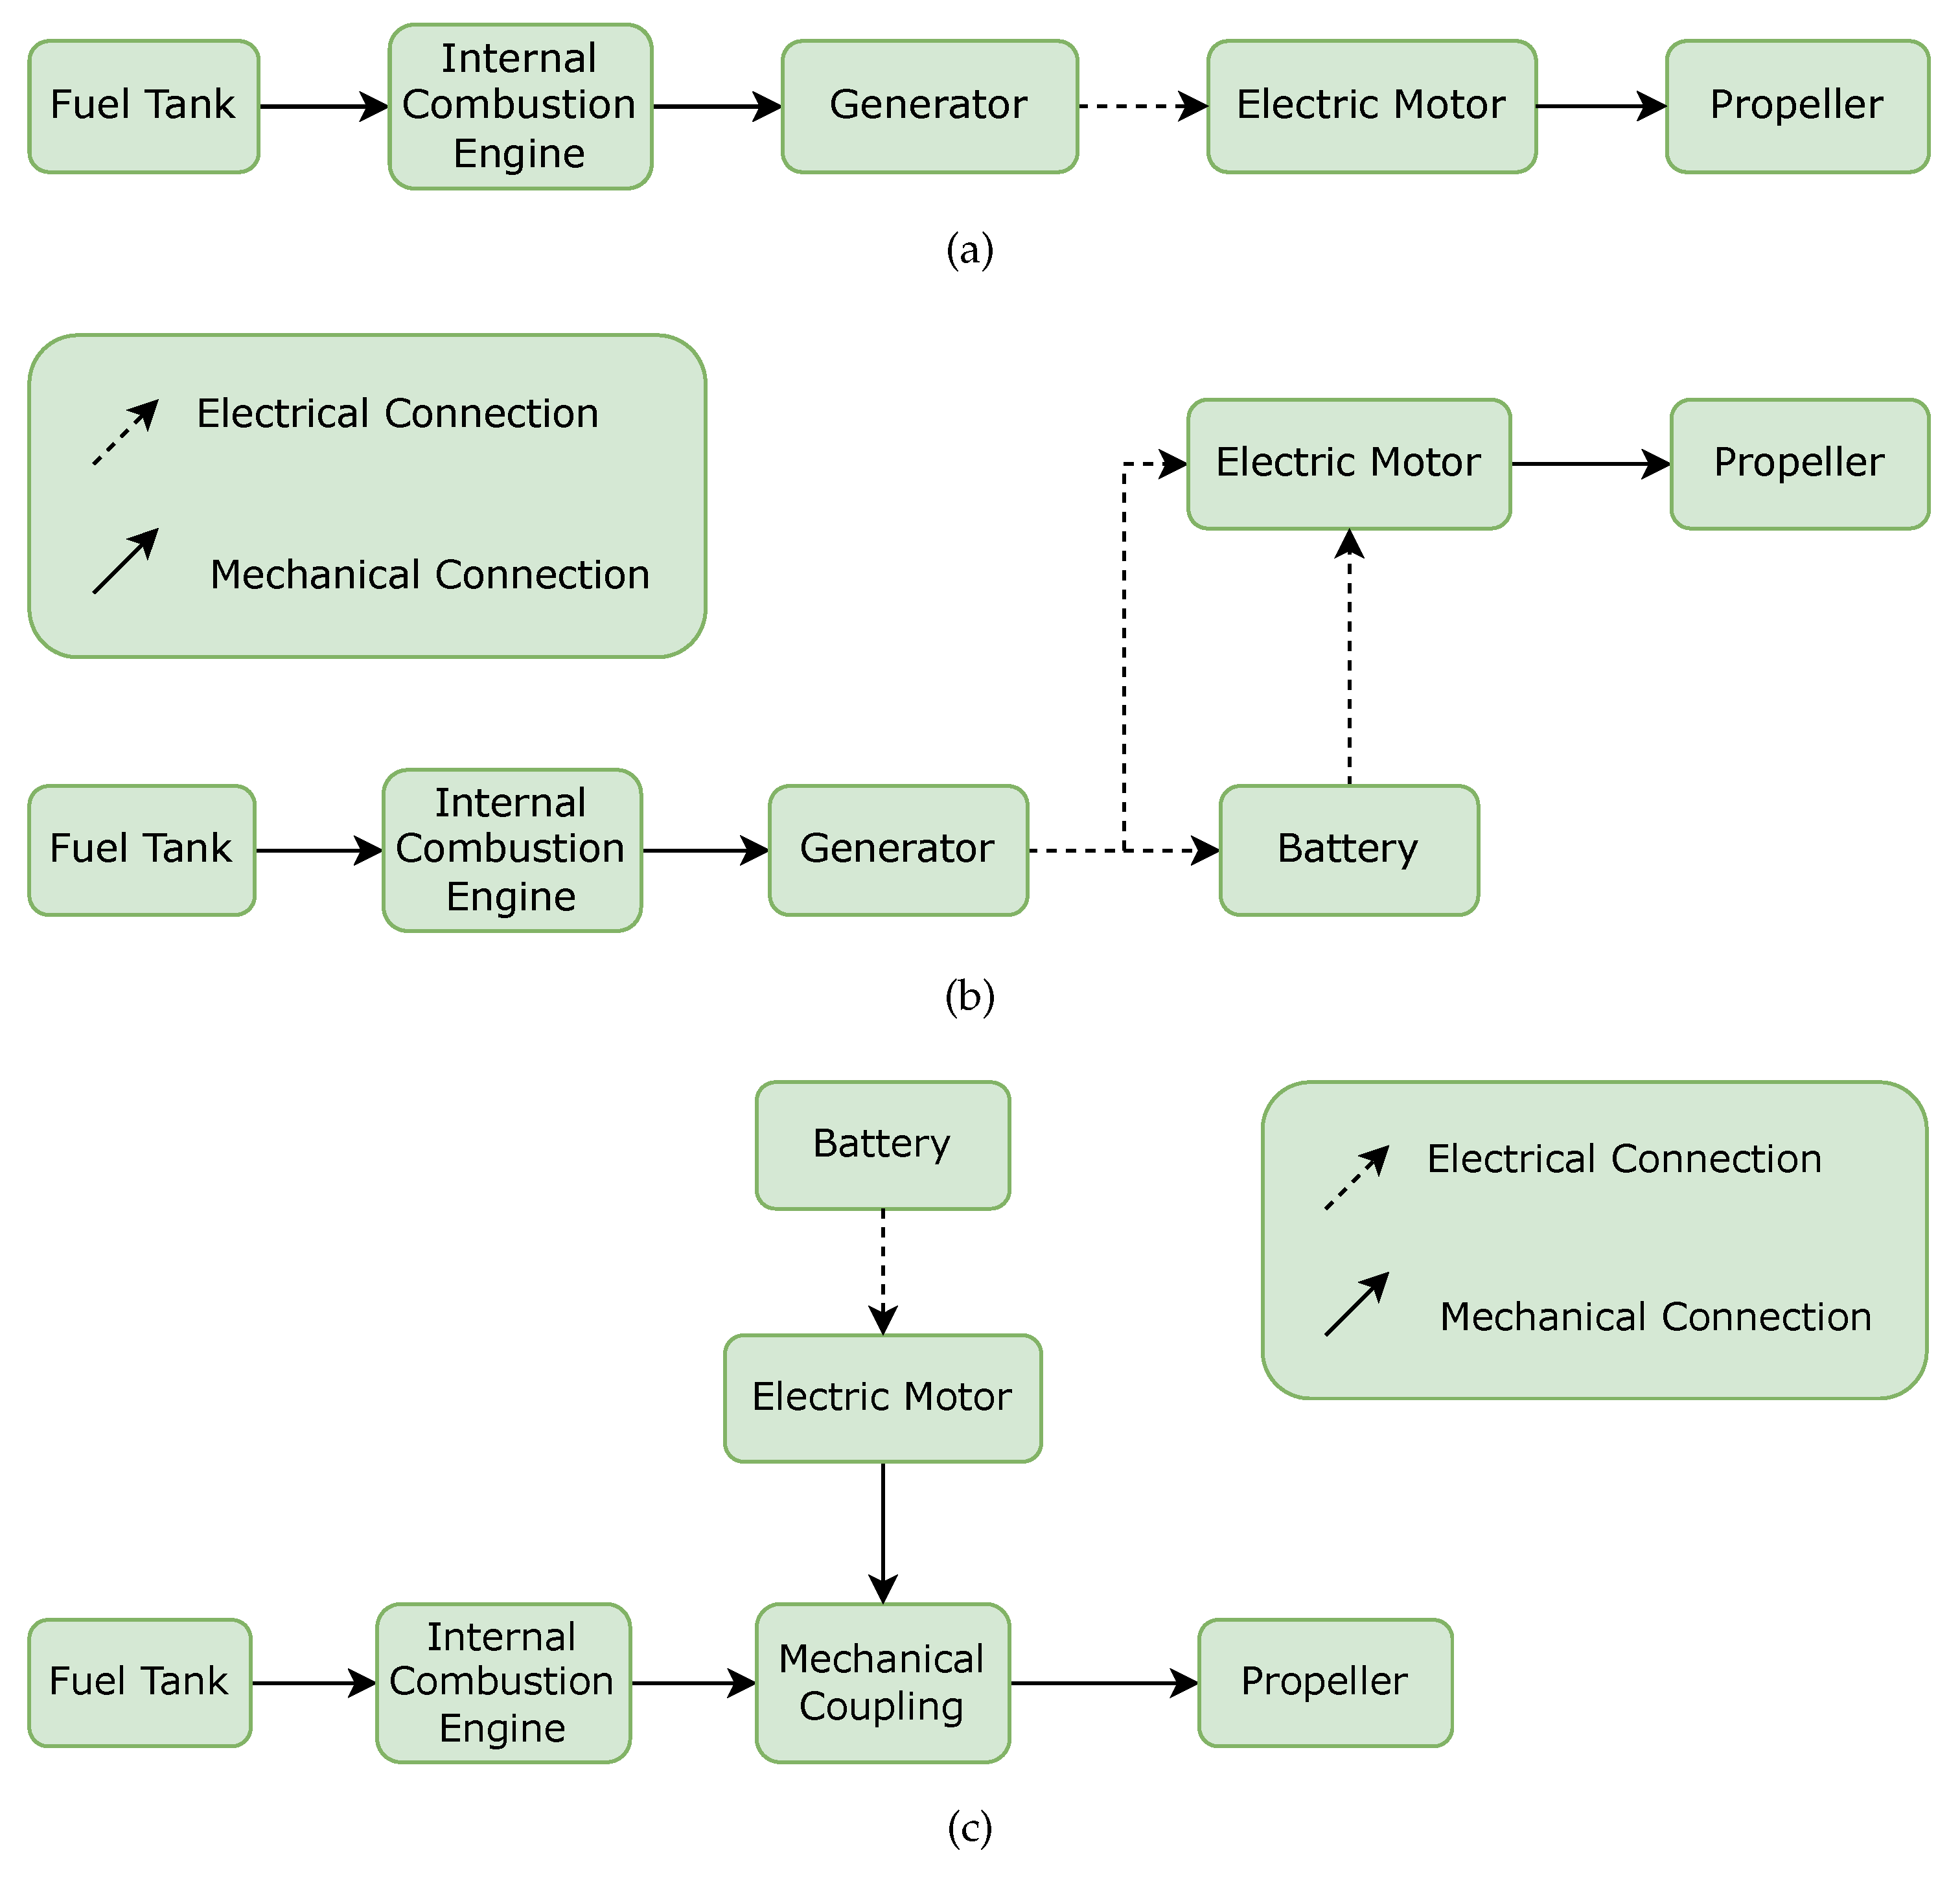
57]. The total propulsion system of the ATR42-600 generates between 2 and 4 MW of power, and when converting to a turboelectric propulsion system, the number of components required to generate this power will increase, namely the generator and the electric motor. This can improve the propulsive efficiency, but it will also be heavier and generate more heat, which will of course impact the TMS.

4.2.2. Series Hybrid-Electric

Figure 10 depicts the power required for the series hybrid-electric propulsive system. The turboshaft remains less efficient than the electrical components. As seen by this mission, it is common to observe peaks in the power demand owing to acceleration or sustained flying at the same altitude. After that, the standard landing operation begins, and the power demand is rather minimal.

4.2.3. Parallel Hybrid-Electric

Figure 11 represents the power required by the different components of the parallel hybrid-electric configuration. Given that the turboshaft and the propeller only have a gearbox between them, the power needed for these two components is now closer. The consequence of this is a reduction in power lost by the internal combustion engine. It is worth mentioning that the power required for the propeller is higher than the one required for the turboshaft in the parallel configuration since the hybridization factor considered (10%) is higher than the power loss in the gearbox.
Compared to the series hybrid-electric setup, this architecture may appear favorable because it has one less component and results in the same reduction in power loss for the same hybridization factor. However, once again care should be taken when comparing with the series architecture as will be seen in Section 4.3.
The inefficiency of the internal combustion engine relative to other components is underlined once more.

4.2.4. Comparison

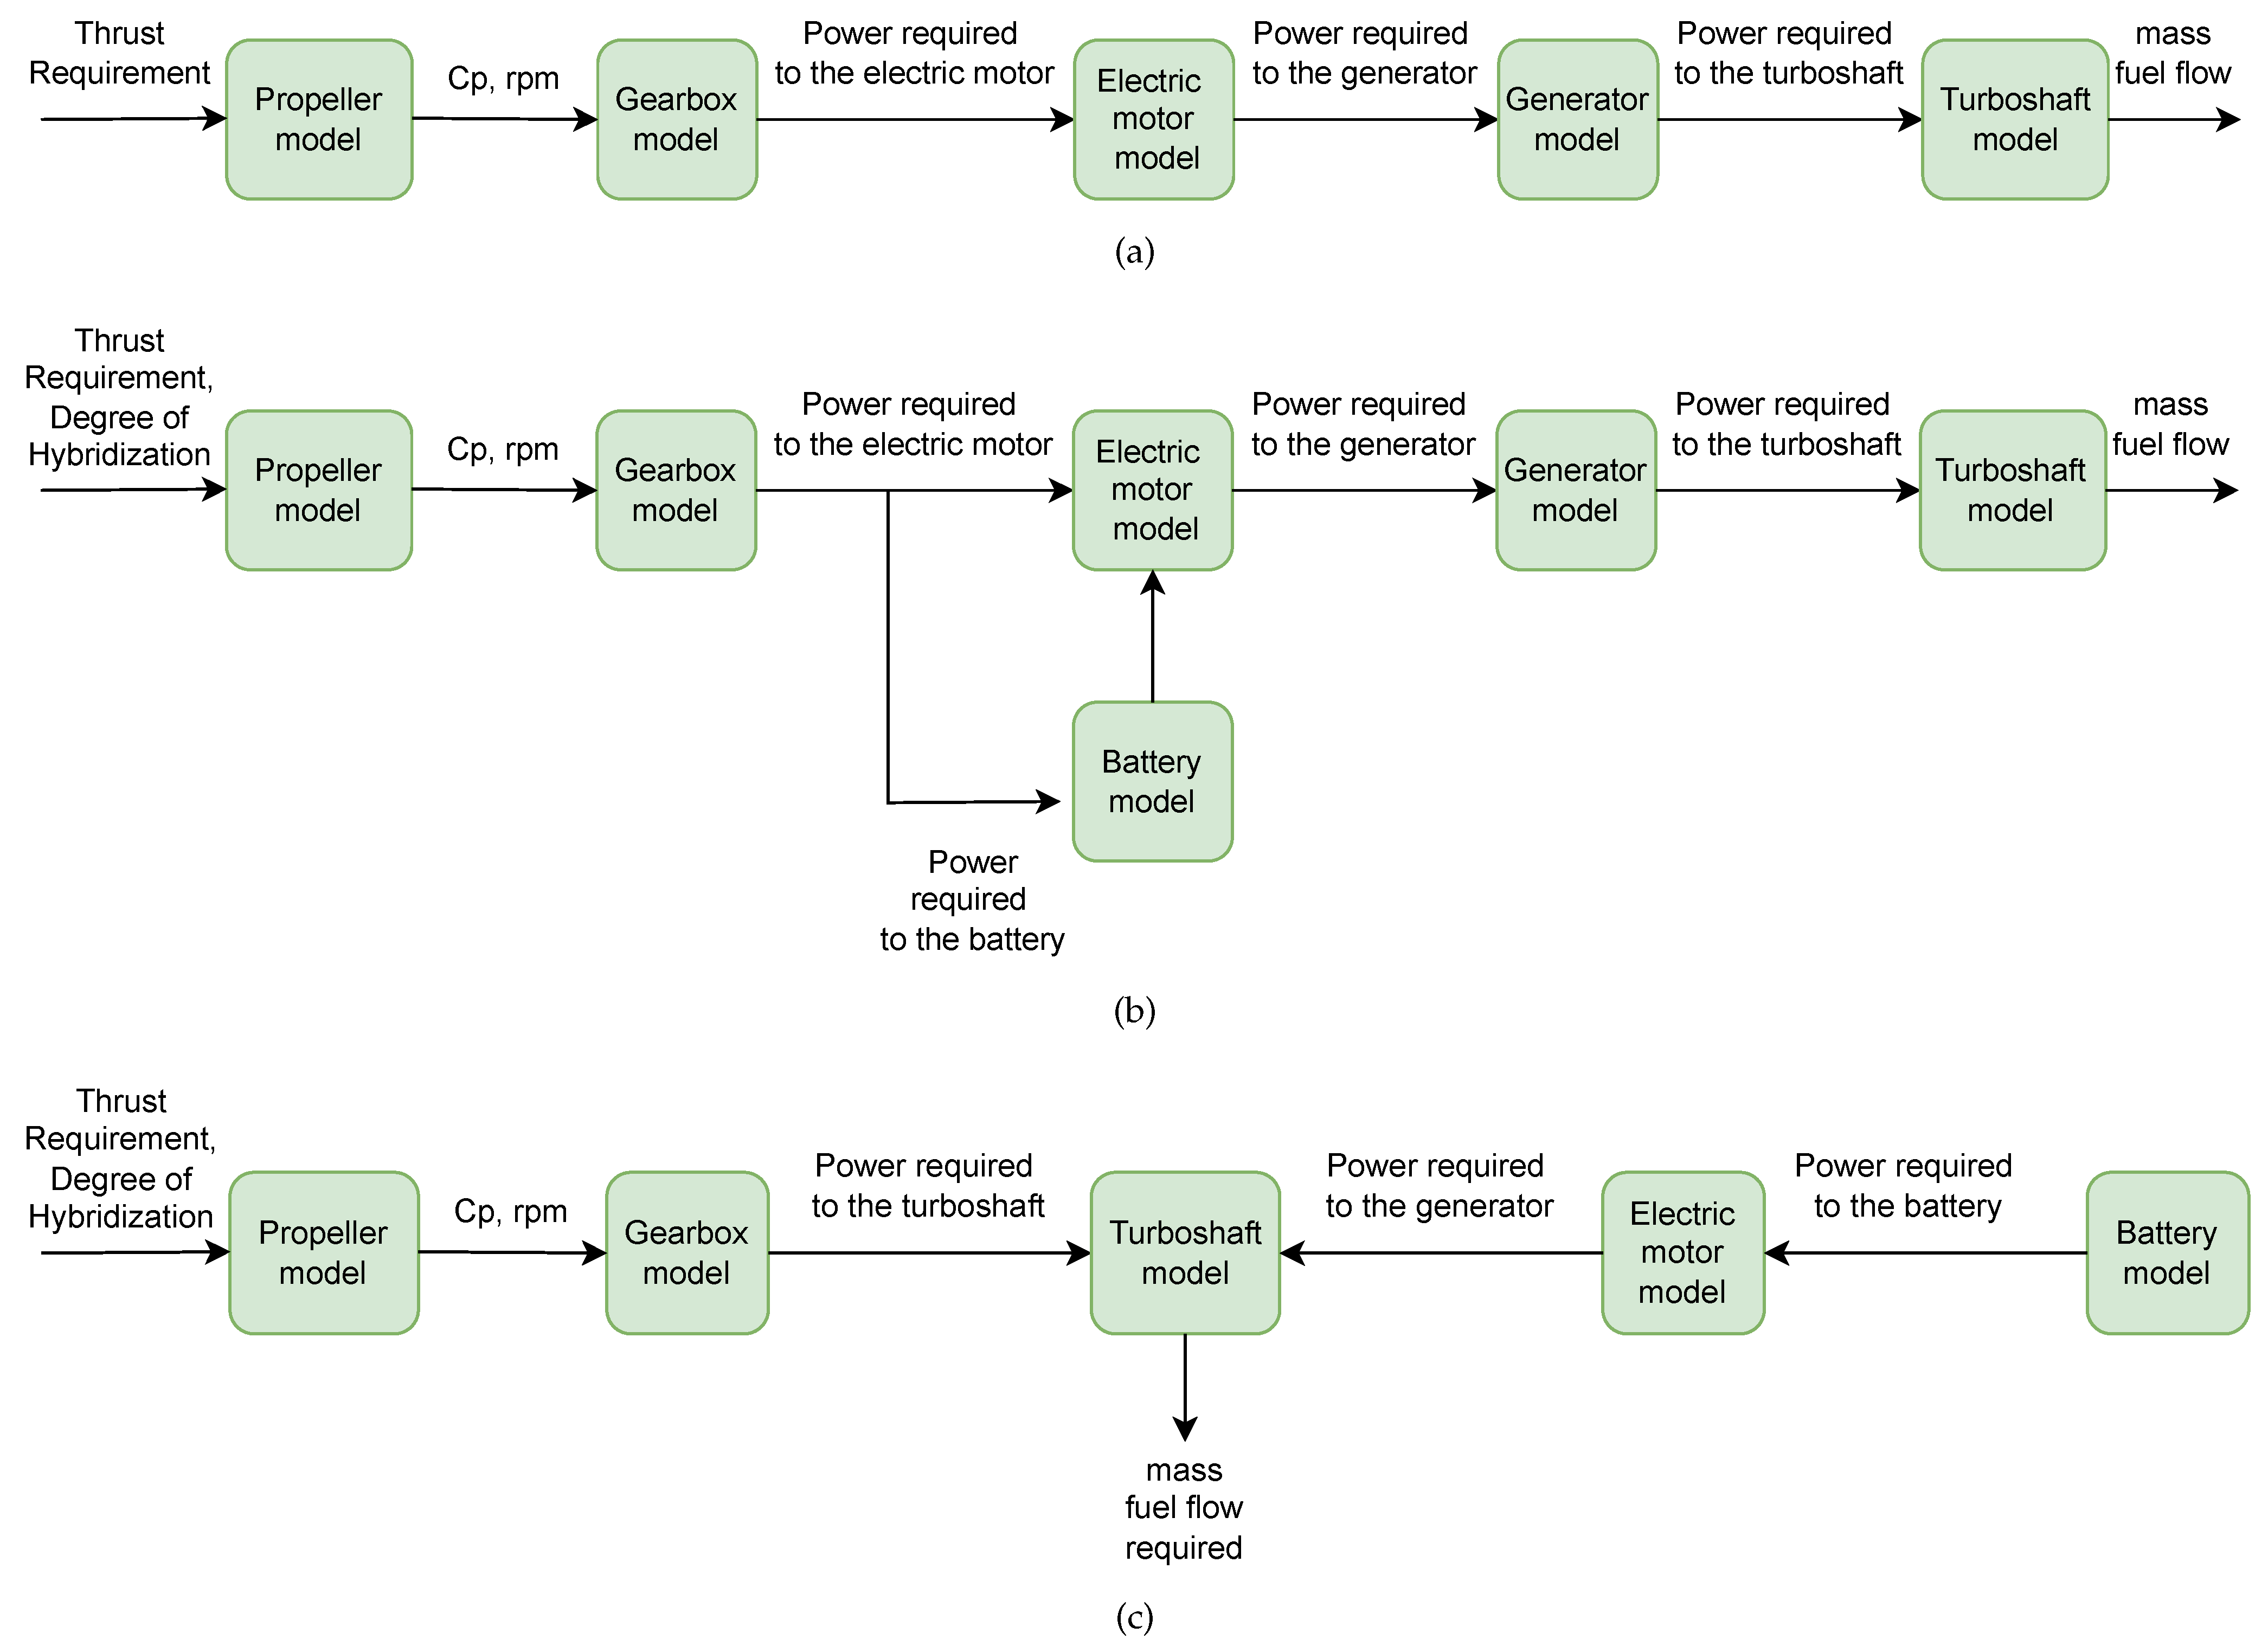
As projected, the series hybrid architecture requires less power from the internal combustion engine than the turboelectric one. Moreover, the parallel hybrid-electric configuration demands less power from the turboshaft, as portrayed in Figure 12, due to the number of components in the powertrain of this architecture and the way they are linked, as mentioned previously in Section 3.3.
A linear correlation was noted between the power required for the turboshaft and fuel consumption, and given that, the same comments made for power can be made for the fuel flow, as seen in Figure 13: although the series hybrid-electric system is more efficient than the turboelectric one, it is less efficient than the parallel hybrid system, assuming the same hybridization factor and disregarding the usable payload.
Even though the same combustion engine model, tuned for the validation test case, was used for all the propulsion systems, different power requirements are noticeable for the 3 propulsive architectures. Thus, different engine models could boost the efficiency of the turboshaft and consequently the entire powertrain.
Regarding flight emissions, from Figure 14 one can conclude that the majority of pollutants are emitted throughout the last segments after cruise, corresponding to descent, alternate, hold, and landing segments. Even though this result might seem counter-intuitive, it is the combined outcome of lower air speeds, a longer ground distance to cover, and a lower aerodynamic efficiency as denoted in the drag profile earlier depicted in Figure 2.
As previously stated, batteries do not yet possess a high enough energy density for their implementation to not significantly raise the weight of the propulsion system.
For the considered conditions the mass of the turboelectric propulsion system–including the fuel mass–for this mission is 2323.2 kg, the one of the series hybrid-electric configuration is 4098.2 kg and the one of the parallel hybrid-electric architecture is approximately 10,505 kg. For comparison purposes a reference value of 5611 kg considering the ATR42-600 aircraft is used. This value corresponds to around 31% of the MTOW and includes the fuel mass, engines and propellers (data from aircraft, engine and propeller manufacturers), which are also accounted for the developed model. Considering the MTOW of the FutPrInt50–18,100 kg, 500 kg lighter than this aircraft, the propulsion system will occupy 12.8% of the turboelectric architecture, 22.6% of the series architecture, and 58% of the parallel architecture, considering 10% of power hybridization factor in these last two configurations. The mass of the parallel hybrid system is rather larger than the ATR42-600 reference mass for the propulsion system (including fuel) and will result in an infeasible design, as will be observed in Section 4.3.
As far as TMS is concerned, most of the heat is dissipated at the RHX. This can be visualized in Figure 15 where one can note that the heat transfer rate at the RHX follows the heat load directly associated with the power generated and drag profile. As expected from the power required graph (Figure 12), the turboelectric and series hybrid architectures require a larger heat load to be rejected by the TMS which is done at the RHX. If the heat dissipated by the turboshaft would be considered for the TMS, i.e., assuming that the turbine is installed internally rather than externally, the amount of heat needed to be rejected from the aircraft increases by an order of magnitude due to the low efficiency of the thermodynamic cycle. This consideration significantly impacts the mass of the TMS as can be seen in Section 4.3. Given the lower capacity to dissipate heat from the aircraft, dependent on the amount of fuel, the FHX contribution to this aspect is consequently lower than the RHX one. This expected outcome can be noticed by comparing Figure 15 with Figure 16.
The heat transfer rate at the FHX initially decreases since the ambient air temperature is higher than the fuel temperature. Then, it increases with the raise of both altitude and airspeed, i.e., conditions favorable to the capacity of the fuel-wing skin heat exchanger to dissipate the heat load. From the peak of power onwards, the heat transfer rate reduces with the decrease in airspeed and altitude.

4.3. Multi-Objective Optimization

In this examination, the previously described TMS architecture was coupled with the propulsive models, and several optimization experiments were carried out.
The optimization model ran for both series and parallel architectures and it employs the power hybridization factor as a design variable.
Since the behavior from generation to generation was not substantially different and the Pareto front converges after a small number of generations, due to the computational cost, the algorithm ran only for one, with a population of 50. All the designs were of rank 1. This behavior is attributable to the usage of a single design variable, which drastically decreases the available design space.
More distinct scenarios are examined, with optimistic values for consumption, production, recharging of battery, fuel and cooling liquid, and the corresponding pessimistic cases: (i) case 1: optimization of the total HEPS (Hybrid-Electric Propulsive System) and TMS mass and CO 2 emissions using SAF in an optimistic scenario, with the TMS controlling the heat generated by the battery, electric motor, generator and gearbox; (ii) case 2: optimization of the combined masses of HEPS and TMS and CO 2 emissions considering SAF in the aforementioned pessimistic scenario, with the TMS in charge of controlling the heat generated by the battery, electric motor, generator and gearbox; (iii) case 3: minimization of the combined mass (HEPS and TMS) and CO 2 emissions using SAF in an optimistic scenario, considering turboshaft dissipated in the TMS besides the heat produced by the battery, electric motor, generator, gearbox; (iv) case 4: identical to case 2, but considering the Jet-A instead of a SAF. Additionally, two cases are depicted as benchmarks for both total mass and emissions: turboelectric configurations without (case 5) and with (case 6) considering the heat dissipated by the ICE.
The resulting approximated Pareto-optimal solutions are shown in Figure 17, where the expected trade-off in optimal layouts is evident.
Overall, the batteries have the greatest impact on the mass of the total system (which are substantial for high hybridization factor values), whereas the fuel required by the turboshaft has the greatest influence in terms of flight emissions. The power required to the battery will increase as the hybridization factor increases, by definition. Consequently, a higher mass penalty will appear when the flight emissions are lower.
The projected outcome is reached by comparing the optimistic and pessimistic scenarios. For the pessimistic scenario, a rise in emissions is recorded for the same mass of propulsion and thermal systems. Due to the larger dependence on fossil fuels for battery recharging, this rise is greater for hybridization factors that are higher.
The typical efficiency of a thermodynamics cycle is low: specifically, in this case, it is of around 30%. Thus, for all the cases that include the heat dissipated of the ICE, this low efficiency translates into a TMS that has significantly more heat that must be managed. Consequently, the impact on emissions and mass will also be substantially higher in these cases (3 and 6) than in cases 1, 2, 4 or 5. When the hybridization factor is reduced, the propulsion system generates additional waste heat - due to the lower efficiency of the turboshaft compared to the higher efficiency assumed for the battery - that must be eliminated. With greater heat that must be handled for a lower hybridization factor, the TMS mass and the CO 2 -eq emissions associated to liquid cooler production are increased.
As expected, the use of Jet-A has a larger impact on the environment than SAF as can be observed by comparing cases 2 and 4.
Considering again the same reference fraction of 31% of the overall mass for the propulsion module, a vertical line has also been added to the graph to represent a realistic mass limit. The zone on the right side of the reference line provides ambitious pollutant emissions by increasing the power required by the battery and also unrealistic maximum propulsive mass values. This feasible range is between 0 and 9% for the series-hybrid architecture.
By analyzing the different propulsive architectures, important remarks can be taken. The parallel powertrain is preferable when compared to the series case in terms of emissions as can be noticed from the curve slope in Figure 17, even though it has a higher mass penalty. Consequently, the parallel architecture results in a lower usable payload and larger CO 2 -eq emissions per kilogram of payload carried, as can be seen in Table 8. This, again, can be justified by the battery impact. According to the electrical branch chain, the power required by the battery pack is higher in the parallel case. This way, the system will be heavier for all the hybridization factors and the turboshaft will be downsized, leading to fewer emissions. When comparing the turboelectric case and the lowest hybridization factor series case, it can be seen that the CO 2 emissions and the overall mass are identical. This is because the series case for a hybridization factor of 0% corresponds to the turboelectric architecture, where no battery is included in the powertrain. In the optimization simulation, the random design space ended up not including a hybridization factor of 0%. Otherwise, the corresponding series result would coincide with the turboelectric result.
Another mass reference added - the continous line - denotes a new feasible zone for the mass of the whole system if the passengers and their respective payload were removed (5000 kg). In this scenario, both configurations (series and parallel hybrid-electric) are acceptable for some range of hybridization factors, until hybridization factors of 37% and 6%, respectively.

5. Concluding Remarks

The primary aim of this work was to create a hybrid-electric propulsion model for studying different propulsive system architectures within the scope of the EU-funded FutPrInt50 project. To accomplish this goal, a framework for the conceptual design of a hybrid-electric powertrain was proposed, with application to the ATR42-600 as the reference aircraft. The proposed solution is based on modeling the various powertrain components and integrating them to form different architectures. In addition to the performance aspect, the sizing aspect was also taken into account, and some of the limitations resulted from mass constraints.
Additionally, sensitivity analyses of battery properties and the hybridization factor of power were incorporated into the full aircraft sizing procedure, highlighting the increased significance of this mass parameter at the aircraft level.
This research work concludes with a multi-objective optimization that combines the fields of propulsion and thermal management, yielding valuable insights, namely: (i) pointing out that there is still room for progress toward a progressive electrification of the aviation sector; and (ii) giving reference values for what is feasible for a regional aircraft. The results showed that for any condition, the hybrid-electric configurations can require less power and, consequently, emit less pollutants than the turboelectric one. However, this is achieved at the cost of increased battery mass which is outside the feasible region for most of the hybridization factors, and only small values (≈9%) were found compatible when keeping the same payload of the baseline aircraft. Moreover, it is worth mentioning that the same drag profile was employed and, consequently, the aircraft mass was also maintained the same for all hybrid-electric architectures considered. This was done to ensure a fair comparison between architectures without including more disciplines and, thus, adding extra complexity to the developed computational framework.
Therefore, the design framework could be extended to include other important disciplines, namely aerodynamics and structures, whose integration alongside propulsion and thermal management systems may enable a clearer path to regional aviation electrification. Eventual synergies between these disciplines might be enabled through efficient numerical strategies, namely multidisciplinary design optimization. Other considerations, such as volume or noise, should also be incorporated in the multidisciplinary effort.

Author Contributions

Conceptualization, I.F., M.C., F.A. and A.S.; methodology, I.F., M.C. and F.A.; software, I.F. and M.C.; validation, I.F., M.C. and F.A.; formal analysis, I.F. and M.C.; investigation, I.F., M.C. and F.A.; data curation, I.F., M.C. and F.A.; writing—original draft preparation, I.F., M.C. and F.A.; writing—review and editing, A.S.; visualization, I.F., M.C. and F.A.; supervision, F.A. and A.S.; project administration, A.S. All authors have read and agreed to the published version of the manuscript.

Funding

This work was supported by Fundação para a Ciência e a Tecnologia (FCT), through IDMEC, under LAETA, project UIDB/50022/2020. Part of this work was carried out in the scope of the FutPrInt50 project, which is funded by the European Union’s Horizon 2020 research and innovation program under grant agreement No. 875551.

Informed Consent Statement

Not applicable.

Data Availability Statement

The data presented in this study is available on request.

Acknowledgments

A.S. acknowledges the NSERC Canada Research Chair Program.

Conflicts of Interest

The authors declare no conflict of interest.

References

  1. Lee, D.; Fahey, D.; Skowron, A.; Allen, M.; Burkhardt, U.; Chen, Q.; Doherty, S.; Freeman, S.; Forster, P.; Fuglestvedt, J.; et al. The contribution of global aviation to anthropogenic climate forcing for 2000 to 2018. Atmos. Environ. 2021, 244, 117834. [Google Scholar] [CrossRef] [PubMed]
  2. Petroleum & Other Liquids–U.S. Energy Information Administration (EIA). Available online: https://www.eia.gov/petroleum/ (accessed on 23 March 2022).
  3. U.S. Energy Information Administration (EIA)–Ap. Available online: https://www.eia.gov/electricity/wholesale/ (accessed on 23 March 2022).
  4. Follen, G.J.; Del Rosario, R.; Wahls, R.; Madavan, N. NASA’s fundamental aeronautics subsonic fixed wing project: Generation N+3 technology portfolio. SAE Tech. Pap. 2011. [Google Scholar] [CrossRef]
  5. European Commission. Flightpath 2050 Vision for European Aviation; Report of the High Level Group on Aviation Research; Publications Office of the European Union: Luxembourg, 2011; ISBN 978-92-79-19724-6. [Google Scholar]
  6. Brelje, B.J.; Martins, J.R.R.A. Electric, hybrid, and turboelectric fixed-wing aircraft: A review of concepts, models, and design approaches. Prog. Aerosp. Sci. 2019, 104, 1–19. [Google Scholar] [CrossRef]
  7. Meckling, J.; Sterner, T.; Wagner, G. Policy sequencing toward decarbonization. Nat. Energy 2017, 2, 918–922. [Google Scholar] [CrossRef]
  8. Afonso, F.; Sohst, M.; Diogo, C.M.A.; Rodrigues, S.S.; Ferreira, A.; Ribeiro, I.; Marques, R.; Rego, F.F.C.; Sohouli, A.; Portugal-Pereira, J.; et al. Strategies towards a more sustainable aviation: A systematic review. Prog. Aerosp. Sci. 2023, 137, 100878. [Google Scholar] [CrossRef]
  9. Sahoo, S.; Zhao, X.; Kyprianidis, K. A Review of Concepts, Benefits, and Challenges for Future Electrical Propulsion-Based Aircraft. Aerospace 2020, 7, 44. [Google Scholar] [CrossRef] [Green Version]
  10. Eisenhut, D.; Moebs, N.; Windels, E.; Bergmann, D.; Geiß, I.; Reis, R.; Strohmayer, A. Aircraft Requirements for Sustainable Regional Aviation. Aerospace 2021, 8, 61. [Google Scholar] [CrossRef]
  11. Viswanathan, V.; Knapp, B.M. Potential for electric aircraft. Nat. Sustain. 2019, 2, 88–89. [Google Scholar] [CrossRef]
  12. van Heerden, A.; Judt, D.; Jafari, S.; Lawson, C.; Nikolaidis, T.; Bosak, D. Aircraft thermal management: Practices, technology, system architectures, future challenges, and opportunities. Prog. Aerosp. Sci. 2022, 128, 100767. [Google Scholar] [CrossRef]
  13. Freeman, J.; Osterkamp, P.; Michael Green, A.G.; Schiltgen, B. Challenges and opportunities for electric aircraft thermal management. Aircr. Eng. Aerosp. Technol. 2014, 86, 519–524. [Google Scholar] [CrossRef]
  14. Tebaldi, D.; Zanasi, R. Modeling control and simulation of a series hybrid propulsion system. In Proceedings of the 2020 IEEE Vehicle Power and Propulsion Conference (VPPC), Gijon, Spain, 18 November–16 December 2020. [Google Scholar] [CrossRef]
  15. Kellermann, H.; Habermann, A.L.; Hornung, M. Assessment of Aircraft Surface Heat Exchanger Potential. Aerospace 2020, 7, 1. [Google Scholar] [CrossRef] [Green Version]
  16. Yetik, O.; Karakoc, T.H. Thermal and electrical analysis of batteries in electric aircraft using nanofluids. J. Energy Storage 2022, 52, 104853. [Google Scholar] [CrossRef]
  17. Zhao, J.; Rao, Z.; Liu, C.; Li, Y. Experimental investigation on thermal performance of phase change material coupled with closed-loop oscillating heat pipe (PCM/CLOHP) used in thermal management. Appl. Therm. Eng. 2016, 93, 90–100. [Google Scholar] [CrossRef]
  18. Hoogreef, M.; Vos, R.; de Vries, R.; Veldhuis, L.L. Conceptual Assessment of Hybrid Electric Aircraft with Distributed Propulsion and Boosted Turbofans. In Proceedings of the AIAA Scitech 2019 Forum, San Diego, CA, USA, 7–11 January 2019. [Google Scholar] [CrossRef] [Green Version]
  19. Sgueglia, A.; Schmollgruber, P.; Bartoli, N.; Benard, E.; Morlier, J.; Jasa, J.; Martins, J.R.R.A.; Hwang, J.T.; Gray, J.S. Multidisciplinary Design Optimization Framework with Coupled Derivative Computation for Hybrid Aircraft. J. Aircr. 2020, 57, 715–729. [Google Scholar] [CrossRef]
  20. Schiltgen, B.T.; Freeman, J. Aeropropulsive Interaction and Thermal System Integration within the ECO-150: A Turboelectric Distributed Propulsion Airliner with Conventional Electric Machines. In Proceedings of the 16th AIAA Aviation Technology, Integration, and Operations Conference, Washington, DC, USA, 13–17 June 2016. [Google Scholar] [CrossRef]
  21. ATR 42-600. Available online: https://www.atr-aircraft.com/wp-content/uploads/2020/07/Factsheets_-_ATR_42-600.pdf (accessed on 16 November 2022).
  22. dos Reis, R.; Odaguil, F.; Windels, E.; Teeuwen, Y.; van der Pols, J.; Laskaridis, P.; Bergmann, D.; Eisenhut, D.; Moebs, N. Requirements and Reference Aircraft. Deliverable 2.1. 2021. Available online: https://cordis.europa.eu/project/id/875551/results (accessed on 18 October 2022).
  23. Morgado, J.; Silvestre, M.A.R.; Páscoa, J.C. Validation of New Formulations for Propeller Analysis. J. Propuls. Power 2015, 31, 467–477. [Google Scholar] [CrossRef]
  24. Morgado, J.; Silvestre, M.A.R.; Páscoa, J.C. A comparison of post-stall models extended for propeller performance prediction. Aircr. Eng. Aerosp. Technol. 2016, 88, 540–549. [Google Scholar] [CrossRef]
  25. Theodorsen, T.; Stickle, G.W.; Brevoort, M. Characteristics of six propellers including the high-speed range. Annu. Rep. Natl. Advis. Comm. Aeronaut. 1937, 401–438. [Google Scholar]
  26. Lorenz, L.; Seitz, A.; Kuhn, H. Hybrid Power Trains for Future Mobility. In Proceedings of the Deutscher Luft-und Raumfahrtkongress, Stuttgart, Germany, 10–12 September 2013. [Google Scholar] [CrossRef]
  27. Friedrich, C.; Robertson, P.A. Hybrid-Electric Propulsion for Aircraft. J. Aircr. 2015, 52, 176–189. [Google Scholar] [CrossRef]
  28. Larminie, J.; Lowry, J. Electric Vehicle Technology Explained, 2nd ed.; John Wiley & Sons: Chichester, West Sussex, UK, 2012. [Google Scholar]
  29. McDonald, R.A. Electric motor modeling for conceptual aircraft design. In Proceedings of the 51st AIAA Aerospace Sciences Meeting including the New Horizons Forum and Aerospace Exposition, Grapevine, TX, USA, 7 January–10 January 2013. [Google Scholar] [CrossRef] [Green Version]
  30. Zamboni, J.; Vos, R.; Emeneth, M.; Schneegans, A. A Method for the Conceptual Design of Hybrid Electric Aircraft. In Proceedings of the AIAA Scitech 2019 Forum, San Diego, CA, USA, 7–11 January 2019. [Google Scholar] [CrossRef] [Green Version]
  31. Stückl, S. Methods for the Design and Evaluation of Future Aircraft Concepts Utilizing Electric Propulsion Systems. Ph.D. Thesis, Technische Universität München, München, Germany, 2016. [Google Scholar]
  32. Chemali, E.; Preindl, M.; Malysz, P.; Emadi, A. Electrochemical and Electrostatic Energy Storage and Management Systems for Electric Drive Vehicles: State-of-the-Art Review and Future Trends. IEEE J. Emerg. Sel. Top. Power Electron. 2016, 4, 1117–1134. [Google Scholar] [CrossRef]
  33. Generic Battery Model–Simulink. Available online: https://www.mathworks.com/help/physmod/sps/powersys/ref/battery.html (accessed on 24 May 2022).
  34. Moran, M.J.; Shapiro, H.N.; Boettner, D.D.; Bailey, M.B. Fundamentals of Engineering Thermodynamics, 7th ed.; John Wiley & Sons: Hoboken, NJ, USA, 2010. [Google Scholar]
  35. Hill, P.G.P.G.; Peterson, C.R. Mechanics and Thermodynamics of Propulsion, 2nd ed.; Addison-Wesley Pub. Co: Reading, MA, USA, 1992. [Google Scholar]
  36. Balli, O.; Hepbasli, A. Energetic and exergetic analyses of T56 turboprop engine. Energy Convers. Manag. 2013, 73, 106–120. [Google Scholar] [CrossRef]
  37. Raymer, D. Aircraft Design: A Conceptual Approach; American Institute of Aeronautics and Astronautics, Inc.: Washington, DC, USA, 1992. [Google Scholar]
  38. Anderson, N.E.; Loewenthal, S.H.; Black, J.D. An Analytical Method to Predict Efficiency of Aircraft Gearboxes. J. Mech. Transm. Autom. Des. 1986, 108, 424–432. [Google Scholar] [CrossRef] [Green Version]
  39. Filippone, A. Advanced Aircraft Flight Performance; Cambridge Aerospace Series; Cambridge University Press: Cambridge, UK, 2012. [Google Scholar] [CrossRef]
  40. Coutinho, M. On the Study and Design of Thermal Management Systems for Hybrid-Electric Aircraft. Master’s Thesis, Aerospace Engineering. Instituto Superior Técnico, Lisboa, Portugal, 2022. [Google Scholar]
  41. Incropera, F.P.; DeWitt, D.P. Fundamentals of Heat and Mass Transfer, 7th ed.; John Wiley & Sons: New York, NY, USA, 2011. [Google Scholar]
  42. Pang, L.; Li, S.; Liu, M.; Li, A.; Meng, F. Influence of the Design Parameters of a Fuel Thermal Management System on Its Thermal Endurance. Energies 2018, 11, 1677. [Google Scholar] [CrossRef] [Green Version]
  43. Manna, R.; Ravikumar, N.; Harrison, S.; Goni Boulama, K. Aircraft Fuel Thermal Management System and Flight Thermal Endurance. Trans. Can. Soc. Mech. Eng. 2022, 46. [Google Scholar] [CrossRef]
  44. Battaglia, M.; Thomason, W.; Fike, J.H.; Evanylo, G.K.; von Cossel, M.; Babur, E.; Iqbal, Y.; Diatta, A.A. The broad impacts of corn stover and wheat straw removal for biofuel production on crop productivity, soil health and greenhouse gas emissions: A review. GCB Bioenergy 2021, 13, 45–57. [Google Scholar] [CrossRef]
  45. Neuling, U.; Kaltschmitt, M. Techno-economic and environmental analysis of aviation biofuels. Fuel Process. Technol. 2018, 171, 54–69. [Google Scholar] [CrossRef]
  46. Xu, C.; Dai, Q.; Gaines, L.; Hu, M.; Tukker, A.; Steubing, B. Future material demand for automotive lithium-based batteries. Commun. Mater. 2020, 1, 99. [Google Scholar] [CrossRef]
  47. Xu, S.; Li, Z.; Yang, Q.; Chu, G.; Zhang, J.; Zhang, D.; Zhou, H.; Gao, M. Comparative Life Cycle Assessment of Energy Consumption, Pollutant Emission, and Cost Analysis of Coal/Oil/Biomass to Ethylene Glycol. ACS Sustain. Chem. Eng. 2021, 9, 15849–15860. [Google Scholar] [CrossRef]
  48. ICAO Carbon Emissions Calculator. Available online: https://www.icao.int/environmental-protection/Carbonoffset/Pages/default.aspx (accessed on 8 October 2022).
  49. Greenhouse Gas Emission Intensity of Electricity Generation in Europe. Available online: https://www.eea.europa.eu/ims/greenhouse-gas-emission-intensity-of-1 (accessed on 8 October 2022).
  50. Purvis, B.; Mao, Y.; Robinson, D. Three pillars of sustainability: In search of conceptual origins. Sustain. Sci. 2019, 14, 681–695. [Google Scholar] [CrossRef] [Green Version]
  51. Larsen, V.G.; Tollin, N.; Sattrup, P.A.; Birkved, M.; Holmboe, T. What are the challenges in assessing circular economy for the built environment? A literature review on integrating LCA, LCC and S-LCA in life cycle sustainability assessment, LCSA. J. Build. Eng. 2022, 50, 104203. [Google Scholar] [CrossRef]
  52. Deb, K.; Pratap, A.; Agarwal, S.; Meyarivan, T. A fast and elitist multiobjective genetic algorithm: NSGA-II. IEEE Trans. Evol. Comput. 2002, 6, 182–197. [Google Scholar] [CrossRef] [Green Version]
  53. NSGA - II: A Multi-Objective Optimization Algorithm–File Exchange–MATLAB Central. Available online: https://www.mathworks.com/matlabcentral/fileexchange/10429-nsga-ii-a-multi-objective-optimization-algorithm (accessed on 8 October 2022).
  54. High Power Lithium Ion APR18650M1A. Available online: https://html.alldatasheet.com/html-pdf/1132192/ETC1/APR18650M1A/115/1/APR18650M1A.html (accessed on 6 June 2022).
  55. Zhang, K.; Liu, W.; Gao, Y.; Wang, X.; Chen, Z.; Ning, R.; Yu, W.; Li, R.; Li, L.; Li, X.; et al. A High-Performance Lithium Metal Battery with Ion-Selective Nanofluidic Transport in a Conjugated Microporous Polymer Protective Layer. Adv. Mater. 2021, 33. [Google Scholar] [CrossRef]
  56. Chen, L.; Zhang, M.; Ding, Y.; Wu, S.; Li, Y.; Liang, G.; Li, H.; Pan, H. Estimation the internal resistance of lithium-ion-battery using a multi-factor dynamic internal resistance model with an error compensation strategy. Energy Rep. 2021, 7, 3050–3059. [Google Scholar] [CrossRef]
  57. Palladino, V.; Bartoli, N.; Dubreuil, S.; Bénard, E.; Pommier-Budinger, V.; Jordan, A.; Schmollgruber, P.; Defoort, S. A comparative study of different propulsion models for hybrid electric aircraft. In Proceedings of the 3AF Aerospace Europe Conference 2020, Bordeaux, France, 25–28 February 2020. [Google Scholar]
Figure 1. Hybrid-electric propulsion architectures: (a) turboelectric; (b) series; and (c) parallel.
Aerospace 10 00113 g001
Figure 2. Considered mission profile in terms of altitude (top left graph), airspeed (top right graph), and total drag force and coefficient (bottom graph, identified by blue and green colors, respectively).
Aerospace 10 00113 g002
Figure 3. Turboshaft flow diagram.
Aerospace 10 00113 g003
Figure 4. Flowchart of the implemented MATLAB models for the turboelectric (a), series (b), and parallel (c) hybrid-electric architectures.
Aerospace 10 00113 g004
Figure 5. Proposed TMS Architecture 5. Regarding the fuel tank, the following nomenclature is considered: the heat fluxes entering and leaving are represented by Q ˙ and the fuel mass flows are represented by m ˙ [40].
Aerospace 10 00113 g005
Figure 6. Architecture 5 blocks diagram.
Aerospace 10 00113 g006
Figure 7. Sensitivity analysis of exponential voltage (top-left), exponential capacity (top-right), internal resistance (mid-left), weight of the cell (mid-right) and capacity (bottom).
Aerospace 10 00113 g007
Figure 8. Power required to the turboelectric propulsive system.
Aerospace 10 00113 g008
Figure 9. Power dissipated in the turboelectric propulsive system.
Aerospace 10 00113 g009
Figure 10. Power required to the series hybrid propulsive system.
Aerospace 10 00113 g010
Figure 11. Power required to the parallel hybrid propulsive system.
Aerospace 10 00113 g011
Figure 12. Comparison of the power required to the turboshaft between the two configurations.
Aerospace 10 00113 g012
Figure 13. Comparison of the fuel flow required between the two configurations.
Aerospace 10 00113 g013
Figure 14. Comparison of the emissions between the three configurations.
Aerospace 10 00113 g014
Figure 15. Comparison of the heat transfer rate at the ram air heat exchanger between the three configurations.
Aerospace 10 00113 g015
Figure 16. Comparison of the heat transfer rate at the fuel heat exchanger between the three configurations.
Aerospace 10 00113 g016
Figure 17. Resulting Pareto-optimal solutions. Feasibility regions 1 and 2 represent limit masses for a reference propulsive system (including fuel) without and with considering payload, respectively. The acronyms SH, PH and TE stand for series-hybrid, parallel-hybrid and turboelectric, respectively. Cases 3 and 1 correspond, respectively, to optimistic scenarios with and without accounting for the heat dissipated by the combustion engine. Cases 2 and 4 are pessimistic scenarios, considering sustainable aviation fuel and Jet-A, respectively. The arrows indicate the hybridization factors ( ϕ ) closest to the feasibility boundaries.
Aerospace 10 00113 g017
Table 1. Main characteristics of the ATR42-600, data from [21].
Parameter/VariableValue
MTOW [kg]18,600
EnginesPW127M
PropellersHamilton Standard 568F
Cruising Speed [km/h]556
Length [m]22.67
Wing span [m]24.57
Wing area [m 2 ]54.5
Height [m]7.59
Passengers48
Table 2. Comparison of some points (rotational speed ω and torque Q) of the efficiency maps from EMRAX manual [26] and the developed code.
ω [rpm]Q [Nm]EMRAX η em [%] η em [%]Error [%]
50012086926.98
50020088935.68
100020090966.67
1500100090944.44
200025094973.19
200050098971.02
250038096982.08
300028594984.26
Table 3. Summary of the equations for pressure and temperature at each state of the turboshaft.
StatePressureTemperature
01 p 01 = 1 2 × ρ × v 2 + p a T 01 = v 2 2 × C p , a + T a
02 p 02 = η Intake × p 01 T 02 = T 01
03 p 03 = Π C × p 02 T 03 = 1 η C × T 02 × Π C ( ( γ 1 ) / γ ) T 02 + T 02
04 p 04 = p 03 × 1 Δ p T 04 = T 03 + η b × m ˙ f × L H V ( m ˙ a + m ˙ f ) × C p , a
05 p 05 = Π T × p 04 T 05 = T 04 × ( 1 η T ) ( 1 1 Π T ( ( γ 1 ) / γ ) )
Table 4. Relative errors of the turboshaft model.
ComponentRelative Error Exit PressureRelative Error Exit Temperature
Air Compressor1.81%6.88%
Combustion Chamber2.82%9.03%
Turbine-7.92%
Table 5. Component methodology summary. Regarding the fuel tank modeling the following nomenclature is considered: the energy of the control volume is denoted by E c v ; the heat fluxes entering and leaving the fuel tank are represented by Q ˙ 2 and Q ˙ 1 , respectively; and Q ˙ l o s s stands for heat flux losses.
ComponentModeling ApproachReference
Heat loadFirst law of thermodynamics[34]
PumpPower to compensate liquid pressure loss assuming a typical efficiency[34]
Heat ExchangersFirst law of thermodynamics Newton’s law of cooling using the Log Mean Temperature Difference (LMTD)[41]
Ram air inlet and outletStandard ideal isentropic relations[35]
SHXFirst law of thermodynamics sides Newton’s law of cooling using LMTD Flat plate external flow analogy Internal laminar flow in circular tubes[41]
Fuel tank d E c v d t = Q ˙ 2 Q ˙ 1 Q ˙ loss [42,43]
Table 6. Different emission factors (optimistic and pessimistic scenarios).
PhaseComponentEmission FactorReference
ProductionBiofuel ATJ from wheat straw31 gCO 2 -eq/MJfuel[45]
Jet Fuel A187.5 gCO 2 -eq/MJ-fuel[45]
Li-ion battery (LFP-Graphite)40 kgCO 2 -eq/(kWh)[46]
EGW (from a biomass source)3489 kgCO 2 -eq/ton-EG[47]
EGW (from coal)7538 kgCO 2 -eq/ton-EG[47]
UseBiofuel and fuel3.16 kgCO 2 -eq/kg-fuel[48]
Electric Mix (EU-27, 2020)229 gCO 2 -eq/(kWh)[49]
Electric Mix (Sweden, 2020)8 gCO 2 -eq/(kWh)[49]
Table 7. Parameter variations for sensitivity analysis.
ParameterUnitsReference ValueMinimum ValueMaximum Value
Maximum CapacityAh5.551.110
Internal resistance Ω 0.16450.0090.32
Exponential capacity, B(Ah) −10.3650.130.6
Exponential voltage, AV3.4252.953.9
Cell weightkg0.06830.0390.0975
Table 8. Usable payload, HEPS mass, TMS mass, and CO 2 -eq emissions per kilogram of payload near the feasibility limits 1 and 2 for the analyzed cases, excluding infeasible results.
Case ϕ [%]Usable Payload [kg]HEPS Mass [kg]TMS Mass [kg]Emissions/Payload [kgCO 2 -eq/kg-Payload]
1 - SH8.850274184.71399.30.81
1 - PH5.33779834.7399.76.17
2 - SH8.351044110.01397.10.81
2 - PH5.92589943.2410.29.32
4 - SH9.748584348.91403.91.29
Disclaimer/Publisher’s Note: The statements, opinions and data contained in all publications are solely those of the individual author(s) and contributor(s) and not of MDPI and/or the editor(s). MDPI and/or the editor(s) disclaim responsibility for any injury to people or property resulting from any ideas, methods, instructions or products referred to in the content.

