Article

Coastal Wave Extremes around the Pacific and Their Remote Seasonal Connection to Climate Modes

1
Laboratoire d’Etudes en Géophysique et Océanographie Spatiales (LEGOS), CNRS, University Paul Sabatier, 14 av. Edouard Belin, 31400 Toulouse, France
2
Department of Atmospheric Sciences, School of Ocean and Earth Science and Technology (SOEST), University of Hawai’i at Mānoa, 2525 Correa Road, Honolulu, HI 96822, USA
3
Laboratoire d’Etudes en Géophysique et Océanographie Spatiales (IRD), CNRS, University Paul Sabatier, 14 av. Edouard Belin, 31400 Toulouse, France
*
Author to whom correspondence should be addressed.
Climate 2021, 9(12), 168; https://doi.org/10.3390/cli9120168
Submission received: 25 September 2021 / Revised: 2 November 2021 / Accepted: 22 November 2021 / Published: 26 November 2021
(This article belongs to the Special Issue Climate Change Dynamics and Modeling: Future Perspectives)

Abstract

:
At first order, wind-generated ocean surface waves represent the dominant forcing of open-coast morpho-dynamics and associated vulnerability over a wide range of time scales. It is therefore paramount to improve our understanding of the regional coastal wave variability, particularly the occurrence of extremes, and to evaluate how they are connected to large-scale atmospheric regimes. Here, we propose a new “2-ways wave tracking algorithm” to evaluate and quantify the open-ocean origins and associated atmospheric forcing patterns of coastal wave extremes all around the Pacific basin for the 1979–2020 period. Interestingly, the results showed that while extreme coastal events tend to originate mostly from their closest wind-forcing regime, the combined influence from all other remote atmospheric drivers is similar (55% local vs. 45% remote) with, in particular, ~22% coming from waves generated remotely in the opposite hemisphere. We found a strong interconnection between the tropical and extratropical regions with around 30% of coastal extremes in the tropics originating at higher latitudes and vice-versa. This occurs mostly in the boreal summer through the increased seasonal activity of the southern jet-stream and the northern tropical cyclone basins. At interannual timescales, we evidenced alternatingly increased coastal wave extremes between the western and eastern Pacific that emerge from the distinct seasonal influence of ENSO in the Northern and SAM in the Southern Hemisphere on their respective paired wind-wave regimes. Together these results pave the way for a better understanding of the climate connection to wave extremes, which represents the preliminary step toward better regional projections and forecasts of coastal waves.

1. Introduction

Wind-generated ocean surface waves represent the principal driver of open littoral vulnerability over a wide range of scales including long interannual timescales [1]. In particular, coastal breaking waves have been shown to contribute significantly to extreme coastal water-level episodes and associated flooding and erosion [2,3,4,5,6], therefore strongly impacting littoral socio-economic systems and human activities, e.g., coastal infrastructures’ maneuverability [7], energy resources [8], marine/mangrove ecosystems [9,10], water quality [11,12], aquaculture, and oil industries [13,14].
Coastal breaking waves can originate from long-wavelength wind-waves (swell) able to propagate across entire ocean basins [15,16,17] as well as from short-period wind seas. Therefore, they can be spawned from both local and remote storms that are produced by a large variety of large-scale atmospheric regimes. A recent study [18] used a statistical clustering method on historical simulations of ocean surface waves to classify mean global wave climates according to their atmospheric forcing. Overall, their results emphasize that coastal wave climates may be grouped in two main categories, i.e., with:
Tropical origins: trade wind regimes and tropical cyclones.
Extra-tropical origins: jet-streams’ intensity associated with the polar front.
To identify the main seasonal atmospheric patterns responsible for regional coastal wave activity Almar et al. [19] used lag-correlations between significant daily wave energy in the Atlantic (Dakar, Senegal) and large-scale surface wind amplitude anomalies for different seasons. Their results highlight in particular that remote extra-tropical winter waves from both the Northern and Southern hemisphere tend to reach tropical coastlines with an oblique incidence. This promotes larger destabilizing effects and increased coastal erosion due to a stronger longshore sediment transport compared to the more shore-normal incidence of waves originating from tropical regimes. This stresses the importance of evaluating the influence of different local vs. remote large-scale atmospheric regimes on coastal waves variability for a better assessment of regional coastal vulnerability and thus better predictions for more adapted local resiliency procedures.
The relationships between global ocean surface waves and large-scale atmospheric climate variability have been extensively investigated [20,21,22,23,24,25,26,27,28]. To summarize, changes in wave activity induced by large-scale wind regimes activity arise from the natural ocean–atmosphere-coupled variability that operates at timescales ranging from intra-seasonal to multi-decadal. However, the Pacific basin is predominantly under the influence of the El Niño Southern Oscillation (ENSO), the dominant mode of global variability at interannual timescales [29]. Building upon the recent theoretical progress made in ENSO research [30,31,32] showed that accounting for the full variety of ENSO teleconnection pathways to tropical and extra-tropical storm activity allowed explaining, on average, ~35% of Pacific coastal wave interannual variability (~20% in the Southern Hemisphere and up to 55% in the Northern Hemisphere) Hemer et al. [23] identified that the principal mode of interannual variability of the Southern Hemisphere wave variability was significantly related to the Southern Annular Mode (SAM). A follow-up study by [33] showed that the local wind-generated forcing in the Southern Hemisphere extra-tropics can produce waves that significantly propagate equatorward, far from their region of generation, and they potentially affect coastal regions even all the way to the Northern Hemisphere. This is a strong incentive to quantify the respective origins of coastal wave extremes, i.e., locally vs. remotely forced, in the context of the dominant control of Pacific climate modes on storm activity and associated wave generation, with a specific focus on ENSO and SAM.
In particular, a new “2-ways wave tracking” algorithm was introduced to evaluate the open-ocean origins and associated atmospheric forcing of local coastal wave extremes all around the Pacific Rim. Once the mean connection between coastal wave extremes and basin-scale atmospheric regimes are comprehensively quantified, the seasonal and interannual modulation of these paired atmospheric patterns and regional wave climates is examined. The remainder of the article is structured as follows: in Section 2, we present the data along with the main steps of the methodological framework employed to track open-ocean wave extremes down to the Pacific basin shorelines. Section 3 describes quantitatively the mean, seasonal, and interannual connections between the Pacific regional coastal extremes and the basin-scale wave regimes. In particular, we evaluated their variability in the context of ENSO and SAM, the dominant seasonally modulated climate modes in the Pacific. Finally, Section 4 provides a summary and a discussion on the relevance of our approach in view of more accurate regional projections and forecasts of coastal wave extremes.

2. Data and Methodology

2.1. Wave and Wind Data

Surface wave data [significant height Hs, peak period Tp, and direction Dp) and 10-m winds were extracted from the fifth generation of the European Centre for Medium-Range Weather Forecasts (ECMWF) Re-Analysis (ERA5) at a 1-day temporal resolution between 1979 and 2020 and a 0.5° × 0.5° horizontal resolution (30 km × 30 km for the atmospheric variables, i.e., wind speed and direction) over the Pacific basin (100° E–300° E; 90° S–90° N). ERA5 combines vast amounts of historical observations into global estimates using advanced modelling and data assimilation systems [34]. To characterize coastal wave activity specifically, ERA5 wave data were re-sampled equidistantly, via a nearest neighbor interpolation, along the Pacific coast at a spatial resolution of 0.5° using the Global Self-consistent Hierarchical High-resolution Geography dataset (GSHHG version 2.3.6) [35].
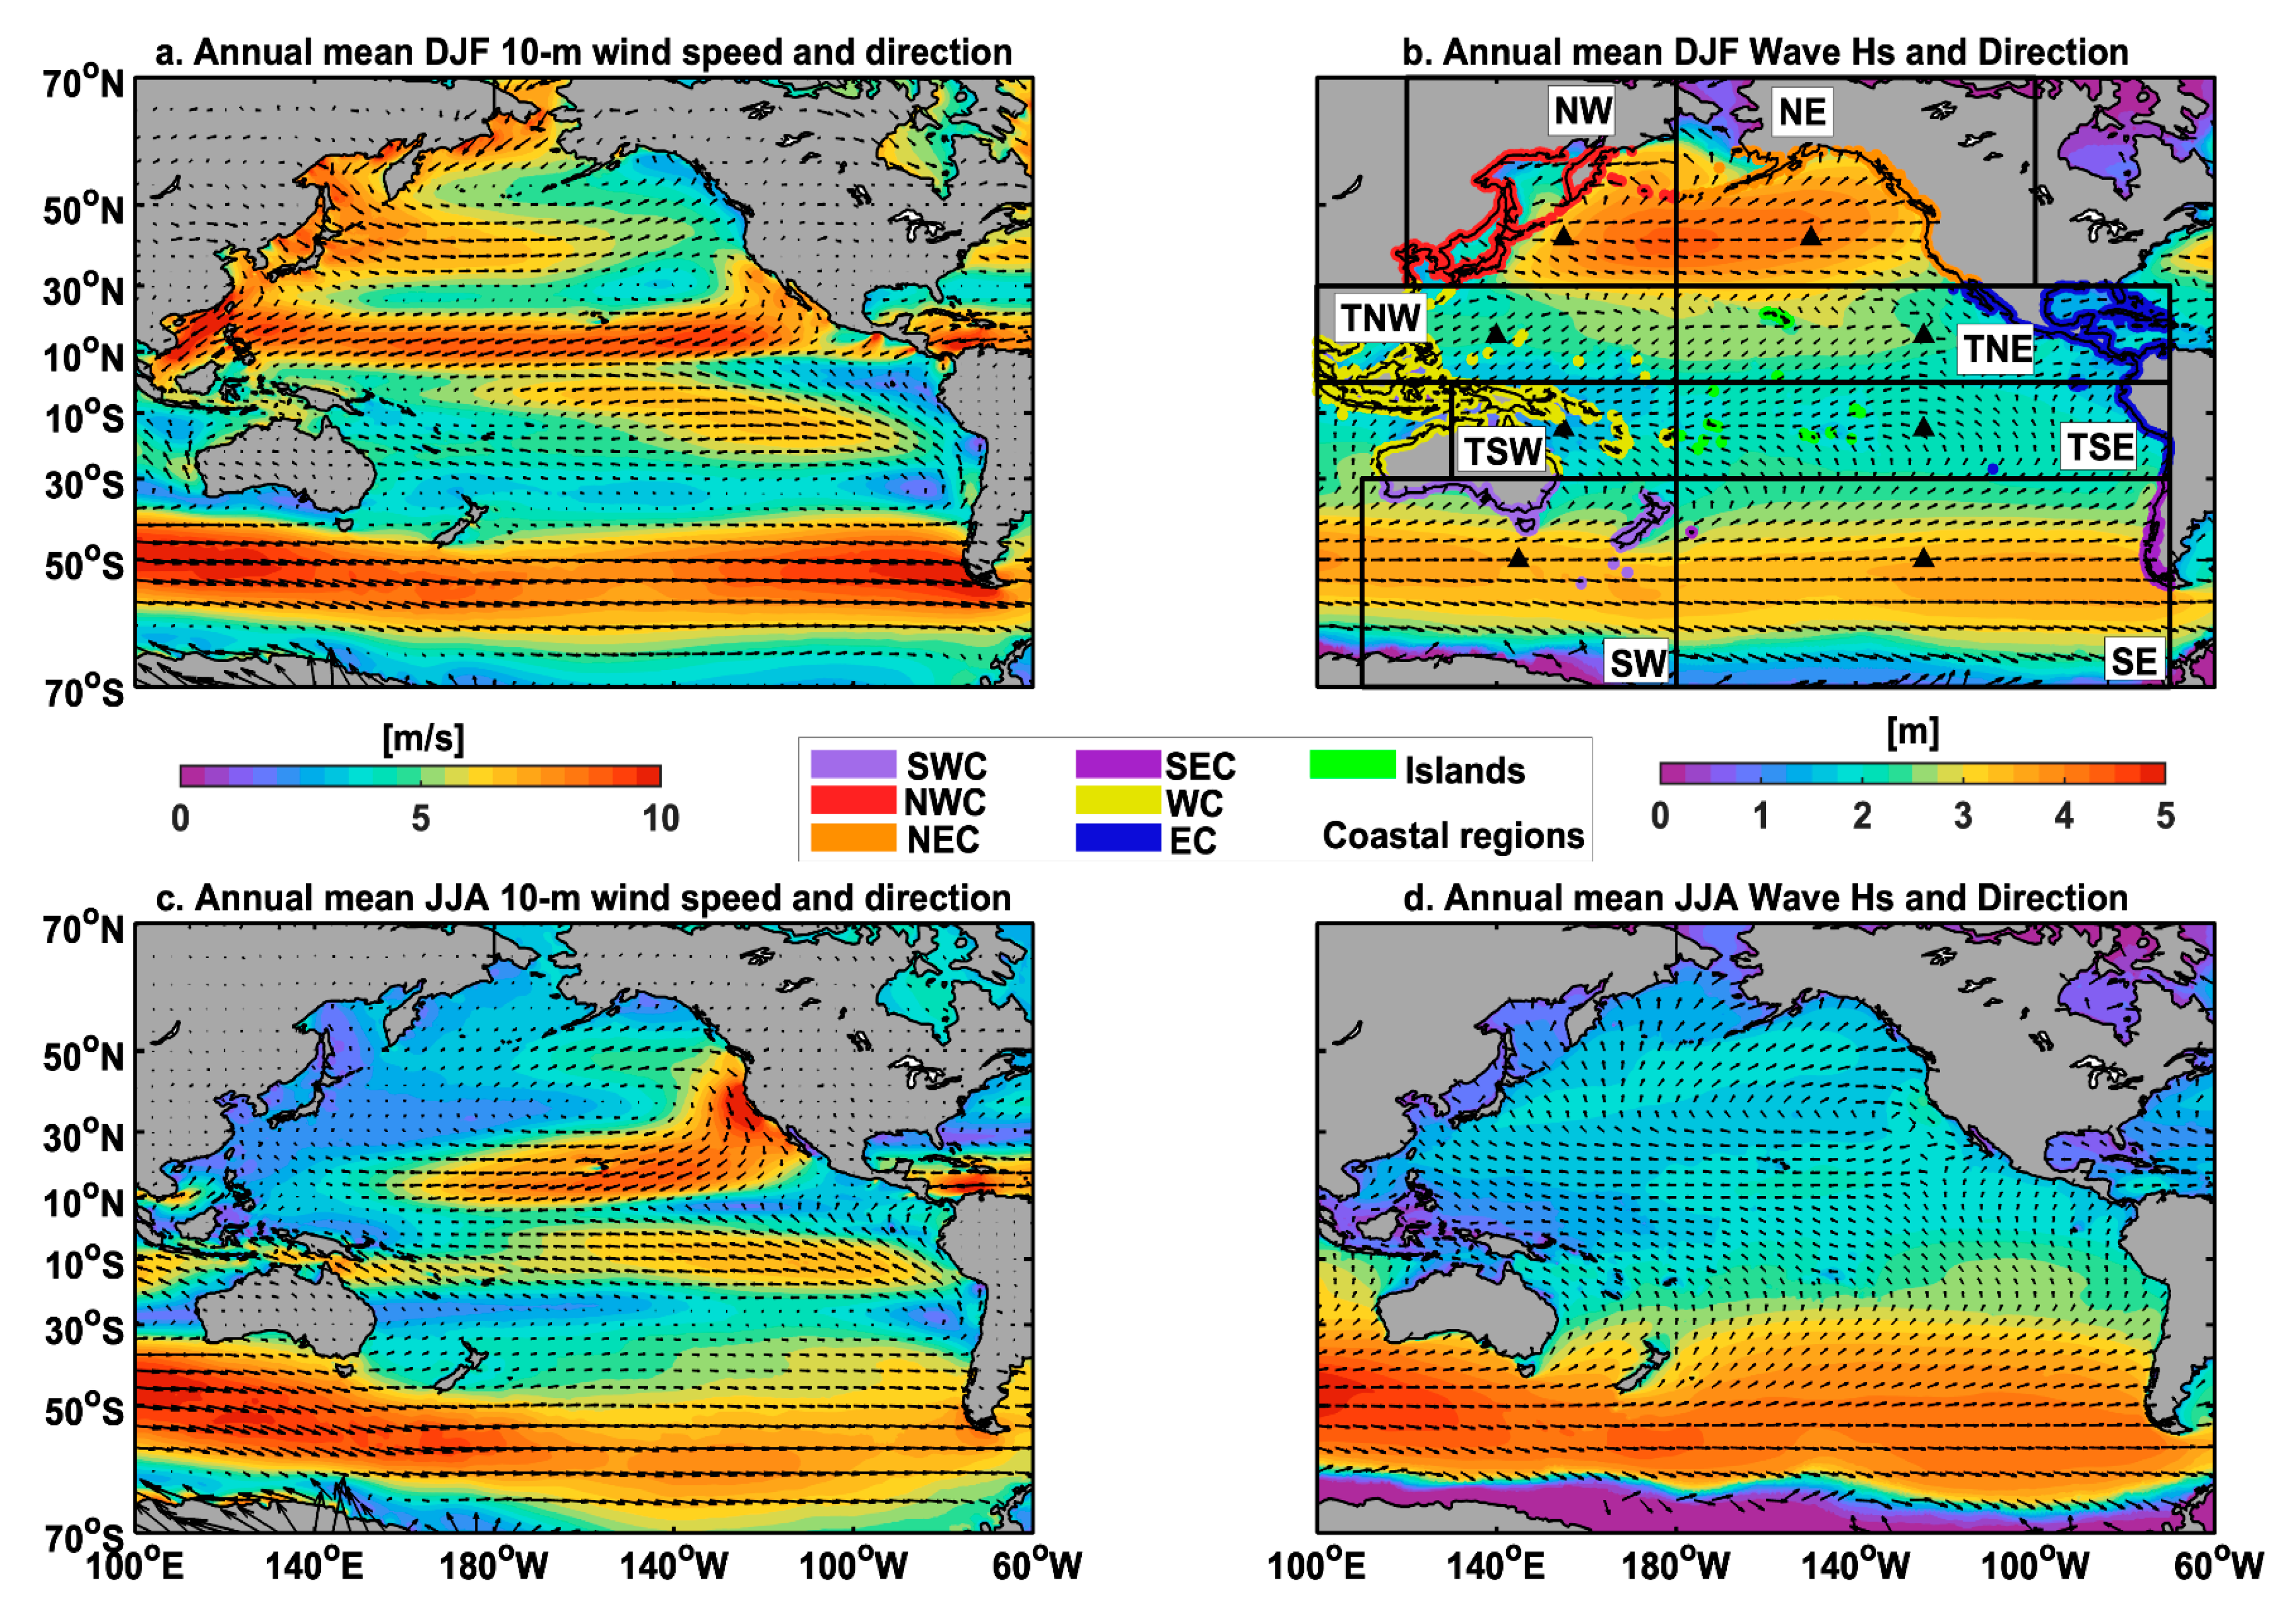
To illustrate how large-scale atmospheric regimes are seasonally paired with open-ocean wave patterns, Figure 1 presents climatology maps of 10-meters wind speeds and significant wave heights (shading) and their direction (arrows) averaged in the boreal winter (December–February, DJF, Figure 1a and Figure 1c respectively) and summer (June–August, JJA, Figure 1b and Figure 1d respectively). We can observe the strong westerlies between 30 and 50° N, a signature of the strengthened northern hemisphere polar front and easterlies or trade winds (10–30° N) associated with the intensified Aleutian low and subtropical high-pressure system, respectively, in the boreal winter (Figure 1a). Both regimes coincide with stronger ocean surface wave patterns located directly underneath (Figure 1c). There is a seasonal reversal with increased westerlies and trade winds in the southern hemisphere in the boreal summer (Figure 1b). It is noteworthy that although subject to a seasonal modulation, the polar front and associated extratropical open-ocean wave activity (Figure 1d) in the Southern Ocean remains strong all year round.

2.2. Open Ocean Origins of Coastal Waves

To evaluate the different origins of coastal wave extremes around the Pacific, the basin was divided into eight regions to isolate the essential paired large-scale wind and wave patterns (cf. black boxes on Figure 1), in particular the Pacific:
  • North-West (NW) that includes the western part of the northern hemisphere polar and sub-tropical fronts as well as the west Asian monsoonal system,
  • North-East (NE) that includes the eastern part of the northern hemisphere polar and sub-tropical fronts,
  • Tropical North-West (TNW) that includes the western part of the northern hemisphere trade wind system and the Pacific North-West tropical cyclone basin,
  • Tropical North-East (TNE) that includes the western part of the northern hemisphere trade wind system (i.e., the Inter Tropical Convergence Zone) and the Pacific North-East tropical cyclone basin,
  • Tropical South-West (TSW) that includes the western part of the southern hemisphere trade wind system (i.e., the South Pacific Convergence Zone) and the South Pacific tropical cyclone basin,
  • Tropical South-East (TSE) that includes the eastern part of the southern hemisphere trade wind system,
  • South-West (SW) that includes the western part of the southern hemisphere polar and sub-tropical fronts,
  • South-East (SE) that includes the eastern part of the southern hemisphere polar and sub-tropical fronts.

2.3. Detection of Open-Ocean Extreme Waves

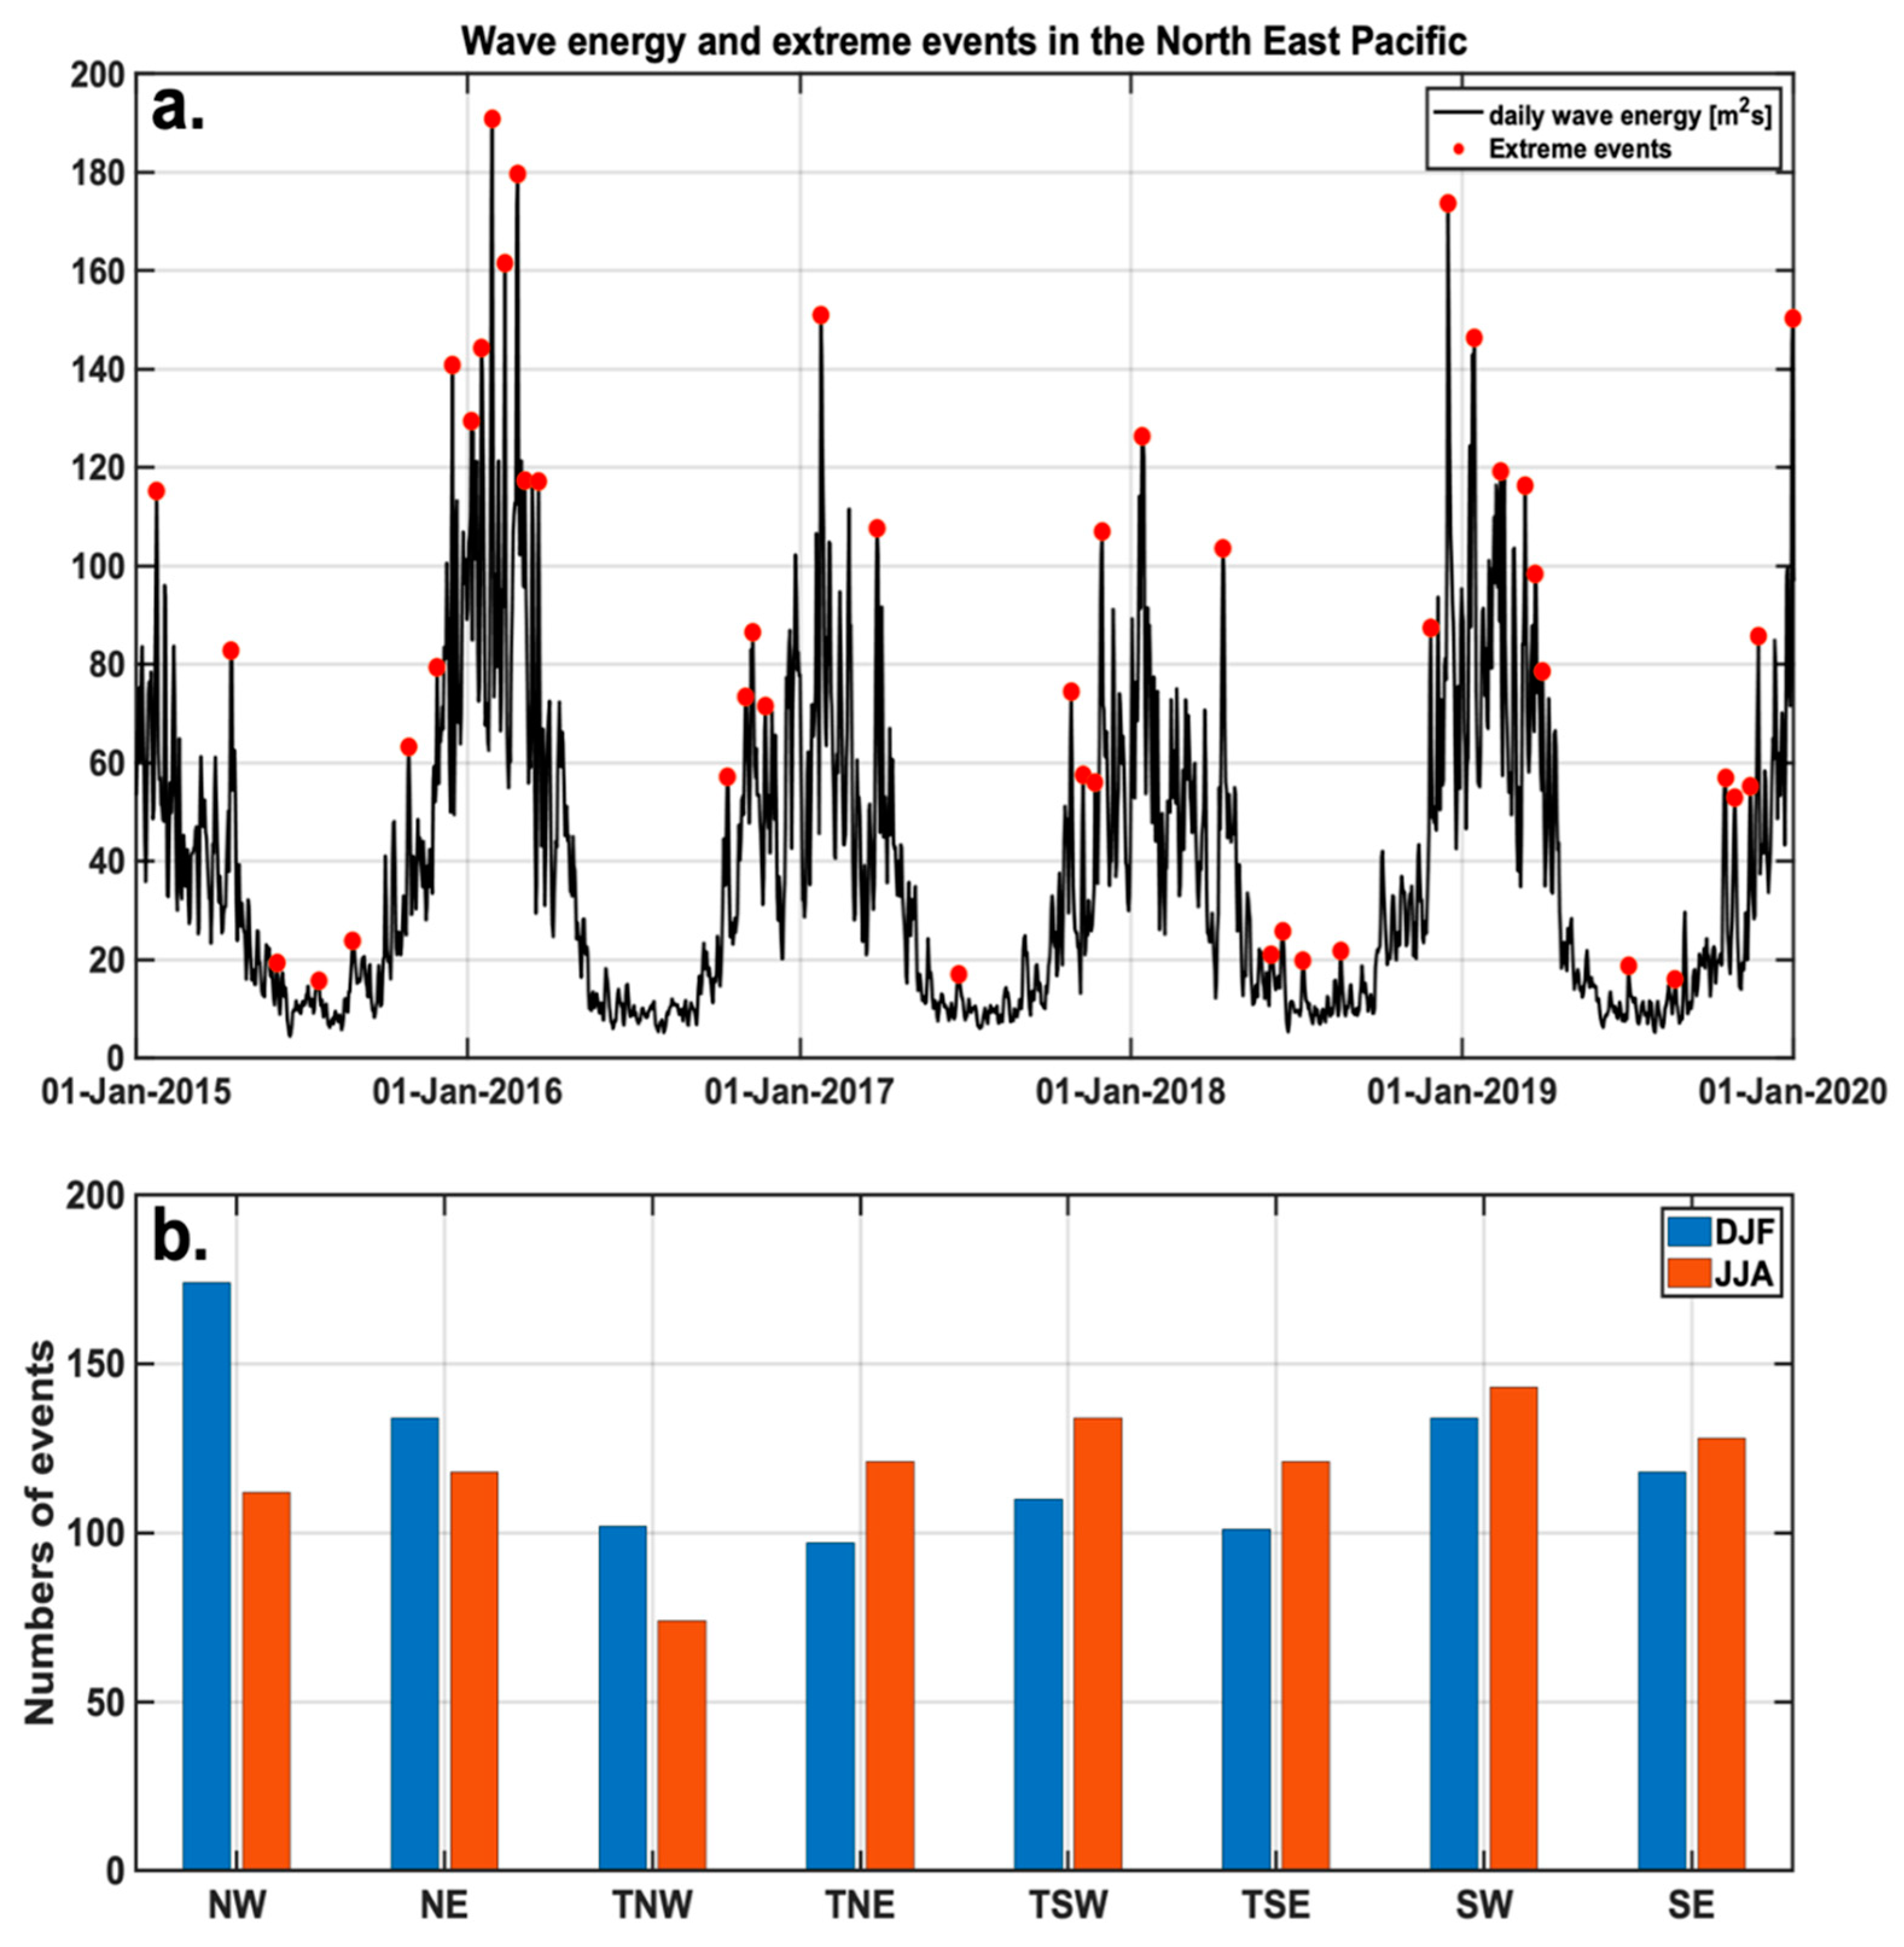
The deep-water wave energy flux, proportional to and here simply defined as Hs2TP [36], was then spatially averaged in each of these regions. As an example, Figure 2 presents the resultant wave energy time series averaged in the Pacific North-East region zoomed in on the period of 2015–2019, which showcases in particular the typical strong seasonal variability in the northern hemisphere characterized by increased (decreased) wave energy during the boreal winter (summer). Note that we assumed that the centroid of each box, evaluated as the spatial barycenter of the box considering only oceanic points and represented by the back triangles in Figure 1b, displays the spatial origin of all extreme events occurring in this region. A wave energy event was then considered extreme if the daily anomaly, calculated as the departure from the wave energy 1-month running mean, was above 120% of its 1-month running standard deviation. As compared to using a fixed criterion for the entire period, this “sliding threshold” allowed accounting for the strong seasonal variability and detecting extreme events even during the boreal summers characterized by a smaller wave energy. In addition, since waves are generated by storms that usually extend over the course of several days (e.g., the typical return period of extra tropical storms in the boreal winter is around 7–10 days) and therefore to not count the same event twice, a minimum of 7 days was set between the detection of two extremes. Red dots in Figure 2a show all extreme events identified over the period of 2015–2019 in the Pacific North-East open ocean.

2.4. Tracking Down the Extreme Events from the Open Ocean to the Pacific Coastlines

In the next step, we evaluated how different coastal regions of the Pacific basin (defined by the colored dots along the Pacific coastline in Figure 2b) are affected by extreme wave events generated in a given oceanic region or, in other words, towards which coastlines and in which proportion these large ocean waves propagate. To do so, a “2-ways wave tracking” algorithm was introduced. The main steps of this method are summarized in the following.
  • Space-time criterion: Based on the distance between the centroid of an open-ocean region (i.e., the assumed origin of waves) and each coastal point around the Pacific basin and using the equation of group velocity under the deep-water approximation to infer the wave speed, i.e., c = 1.56 T P 2 , where TP is the wave peak period, we can approximate a temporal window during which the waves generated off-shore are likely to reach the coast. This interval was estimated using a minimum (maximum) period TP of 8 s (20 s).
  • Wave incidence direction criterion: Since waves can be generated by a multitude of local and remote storms, it remains uncertain if the wave events identified at the coast using only the previous space-time criterion actually originate from the considered oceanic region and not from another area (i.e., from a different atmospheric forcing; e.g., a local storm or another remote swell). To distinguish events with potential different off-shore origins, we filtered out coastal waves characterized by a direction of incidence not comprised within a certain directional interval/cone defined by the lines linking each coastal point in the Pacific to the two opposite corners of the oceanic box considered.
  • Lag-correlation criterion: Once the coastal events were narrowed down to only those with reasonable directions of incidence with regard to their potential off-shore origin, a lag-correlation criterion was applied to (i) evaluate/quantify the coherency between the open ocean and coastal wave events and (ii) if appropriate, estimate the lag (i.e., the time of propagation between the open-ocean wave origin and the coastline). In particular, we calculated the different lag-correlations between the offshore wave extremes and the coastal event within the temporal window and considered the waves at the coast as actually generated by the open-ocean extreme event only if the p-values of the maximum lag-correlation were below 0.05 (i.e., correlation significant at the 95% confidence level according to a Student t-test).

2.5. Climate Mode Indices and Related Storm Activity

As mentioned earlier, the modulation of surface wave activity in the Pacific basin at interannual time scales is dominated by ENSO in the Northern Hemisphere and tropical regions and SAM in the Southern Hemisphere. To characterize ENSO variations, we used the classic monthly Niño3.4 index calculated as the interannual anomalies related to the monthly mean climatology of sea surface temperatures (SST) averaged in the region (170°–120° W; 5° N–5° S). The Southern Annular Mode variability is described by the SAM monthly index and calculated as the zonal pressure difference between the latitudes 40° S and 65° S.

3. Results

3.1. Mean Coastal Extremes Climate

This tracking algorithm is now applied to evaluate towards which coastlines the extreme events identified in each open-ocean region significantly propagate. Figure 2b shows the total number of extreme events detected in December–February (DJF, blue bars) and June–August (JJA, orange bars) for each oceanic region. Unsurprisingly, more extreme waves were seen to be generated in winter, but the methodology described above also successfully detects anomalously strong events in the summer. Figure 3 presents the repartition around the Pacific Rim of the number of extreme coastal events (i.e., days) that were generated in each oceanic area over the total period of 1979–2020. These spatial patterns reveal that coastlines are mostly under the influence of wave extremes generated in the neighboring open-ocean region by their associated paired large-scale atmospheric forcing. Yet, waves generated in the strong polar jet-streams at the higher latitudes (Figure 3a,b,g,h) seem to also propagate to a large extent towards the tropical regions. In particular, large waves formed in the Southern Ocean are seen to propagate significantly even towards the remote tropical regions of the Northern Hemisphere (Figure 3g,h). While the propagation of extreme waves generated in the tropical band tends to stay confined within this region, waves can however widely propagate away from their individual area of generation towards other remote tropical locations. They can even, to some extent, reach extra-tropical coastlines (Figure 3c–f), in particular in the North-West and North-East tropical Pacific, potentially through large waves formed by tropical storms in these extremely active hurricane basins.
To quantify their local versus remote origins, Table 1 distinguishes the repartition (in %) of all coastal extremes accumulated along nine different coastal regions, delineated by the colored dots on Figure 1, according to their oceanic origin. Note that we split, in Table 1, both the tropical Pacific West and East coasts up into a northern and southern region to distinguish their respective hemispheric contributions. These statistics confirm that the largest individual number of coastal wave extremes originates from the closest open-ocean generating region (i.e., an average of 54% local origin). However, the summed-up influence of all other oceanic regions yields to a rather similar contribution from remote locations (i.e., 46%), highlighting the wide diversity in origins (and thus characteristics) of extreme coastal waves around the Pacific basin. Overall, 22% of extreme events in the Pacific coastal regions are generated remotely in the opposite hemisphere. Around 35% of coastal extremes in the tropics are generated at higher latitudes with the breakdown per hemisphere revealing a significant asymmetry with an average of 14% (10%) of large waves in the Tropics originating from the Southern (Northern) Hemisphere jet-stream, most likely a consequence of the year-round storm activity in the Southern Ocean. In particular, the strongest extratropical contribution to coastal extremes in the tropics (16%) comes from the South-Eastern Pacific. Similarly, ~30% of coastal extremes impacting the higher latitudes originates from the tropical band. Interestingly, we observed also a significant hemispheric asymmetry with 13% of coastal extremes in the southern extratropical regions coming from the northern tropical band as compared to 7% of large waves in the northern higher latitudes originating from the southern tropical regions.
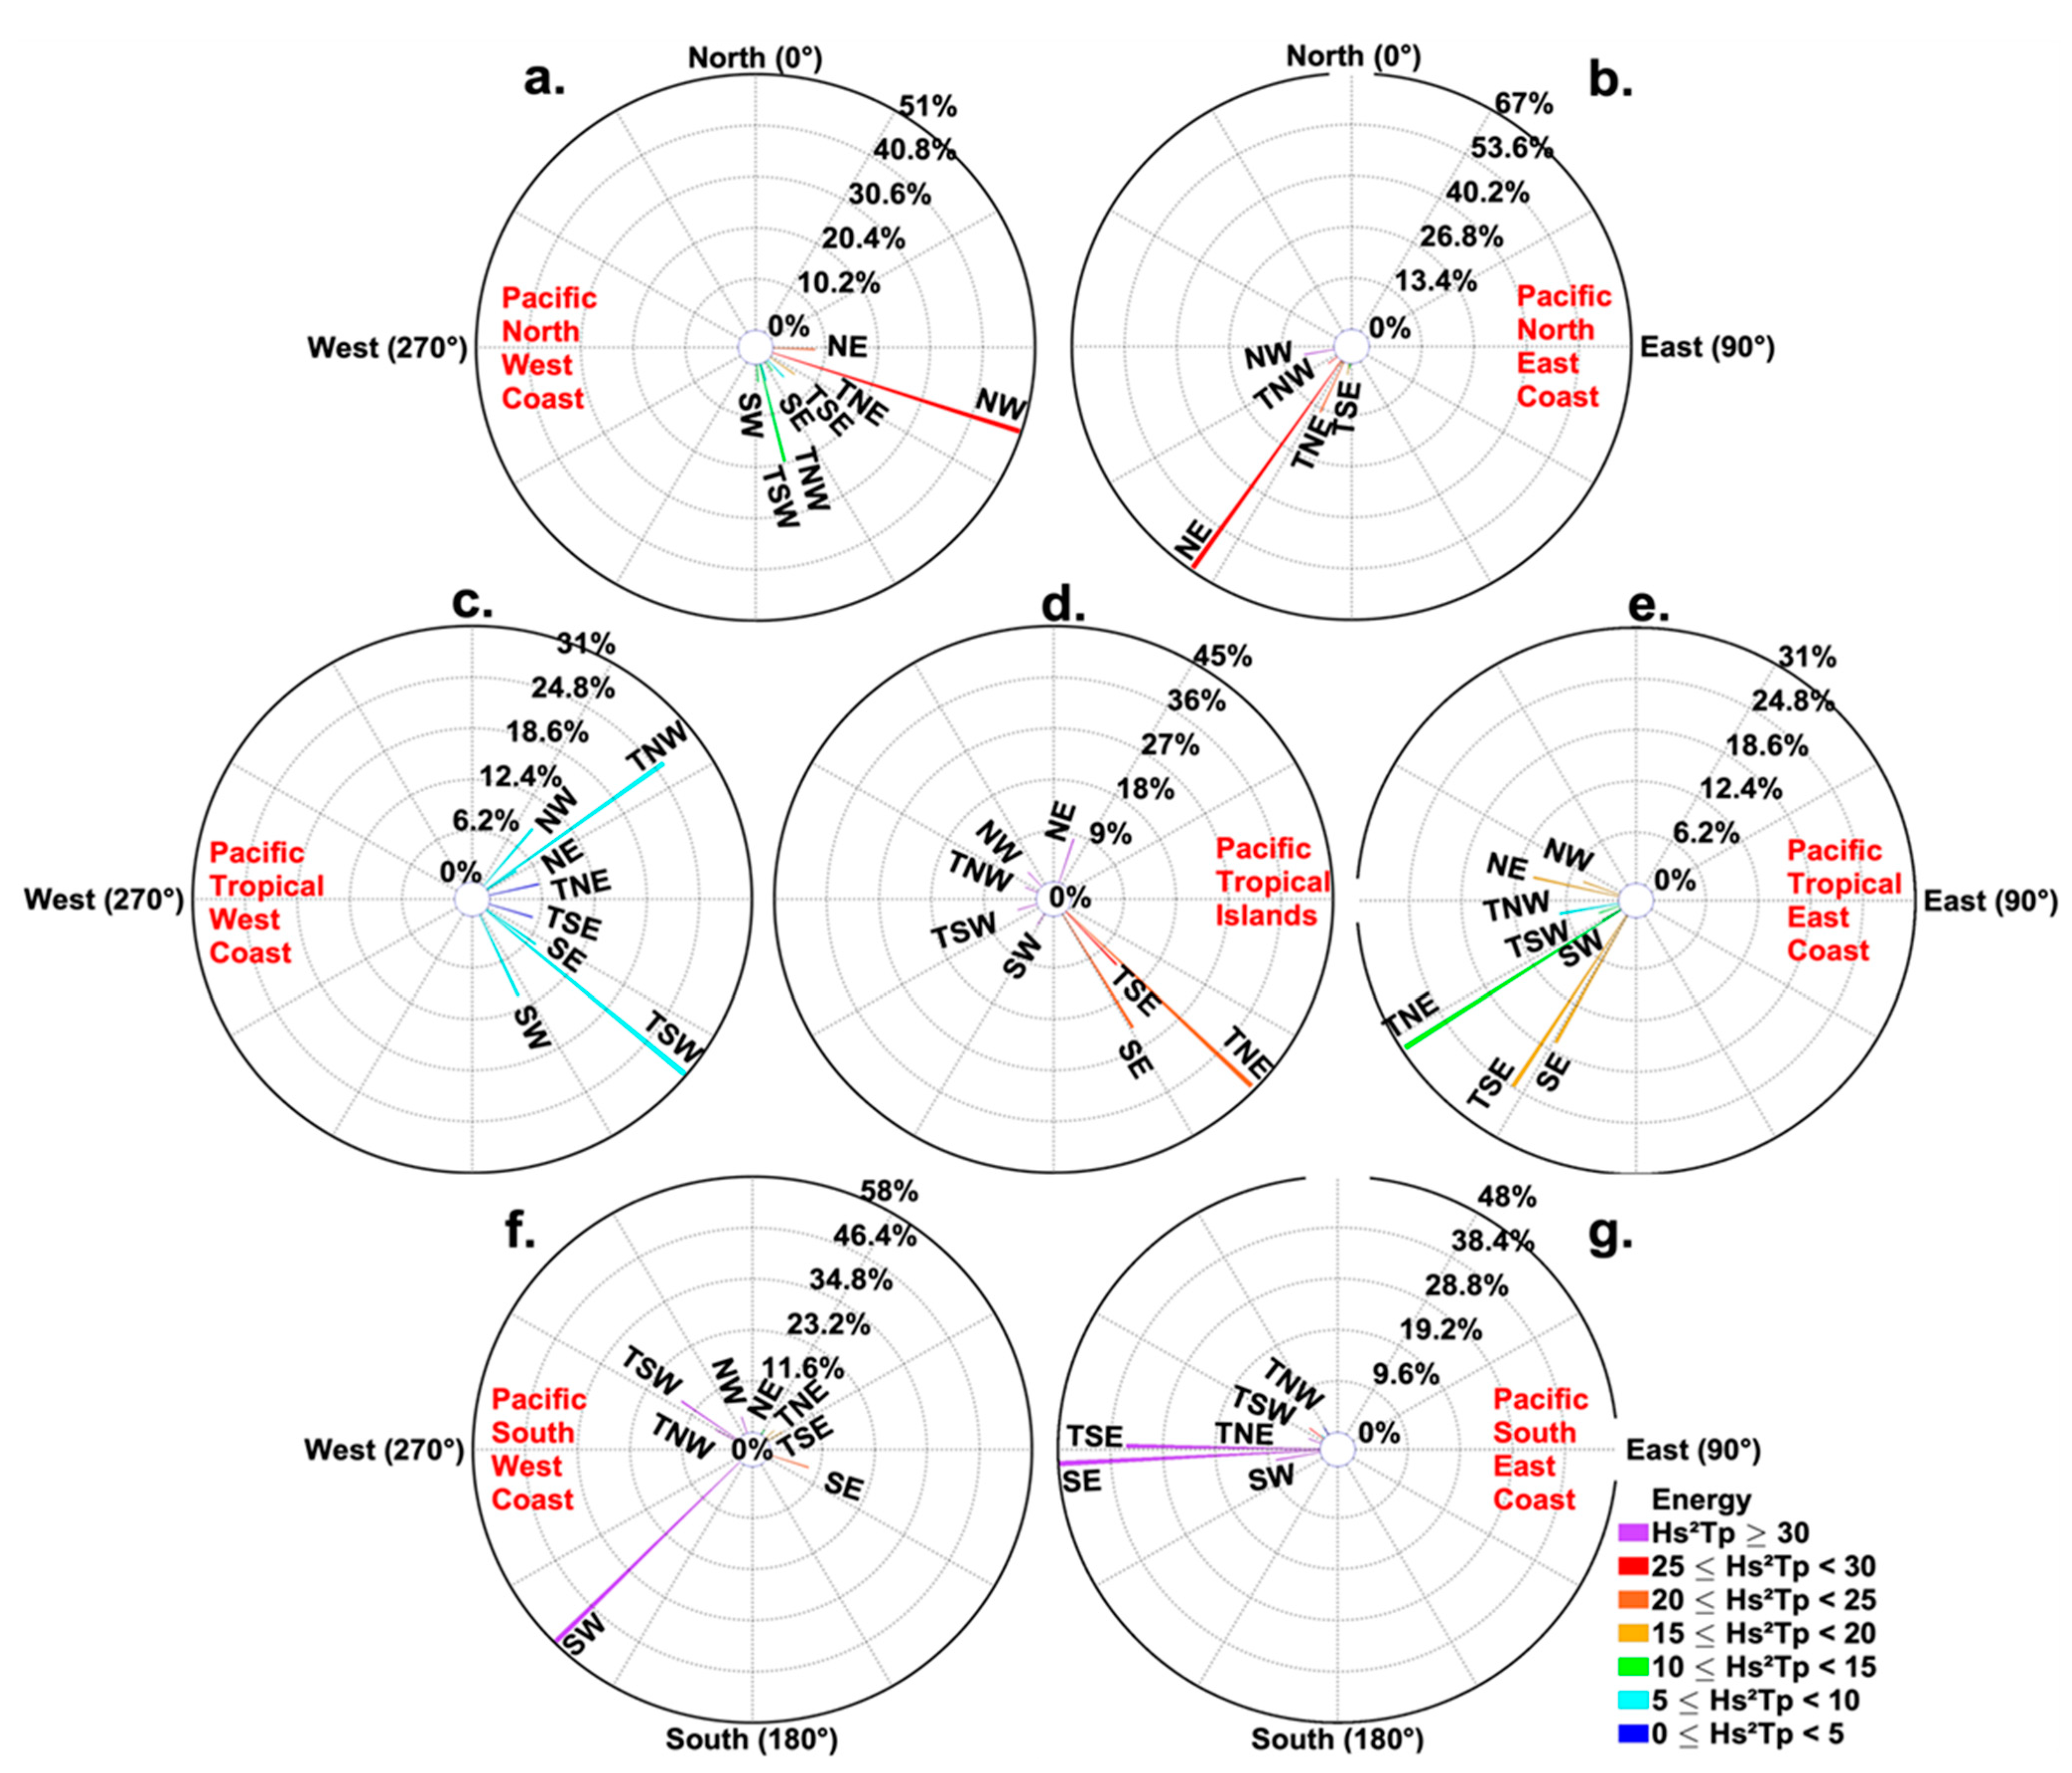
For a more in-depth statistical description of coastal wave extremes’ characteristics, Figure 4 displays bulk parameters of wave extremes, namely, their mean energy and direction of incidence, averaged over all events detected within each of the coastal regions and classified according to their oceanic origin. A preliminary visual inspection reveals that extratropical coastlines face more energetic swells and particularly in the Southern Pacific, most likely because the open Southern Ocean produces larger waves year-round. In addition, coastal regions in the eastern Pacific seaboard, particularly in the tropics, are under the influence of more energetic waves originating from the dominant extratropical westerlies (Figure 4b,e,g) as compared to east-facing shores (Figure 4a,b), with a notable exception in the Pacific South-West with its south-west-facing shores open to the strong extratropical storms generated year-round in the Southern Ocean. While extratropical coastlines are unsurprisingly impacted by extreme energetic wave events originating mostly from the northern and southern polar jet-streams, their incidence tends to be restricted to a smaller cone of influence (Figure 4a,b,g), as compared to the wide directional diversity found along tropical coastlines. This is particularly striking in the Pacific tropical islands, which are, even more so than the tropical continental coastlines, under the significant influence of both tropical and extratropical wave regimes from both hemispheres.

3.2. Seasonal Variability of Coastal Extremes’ Origins

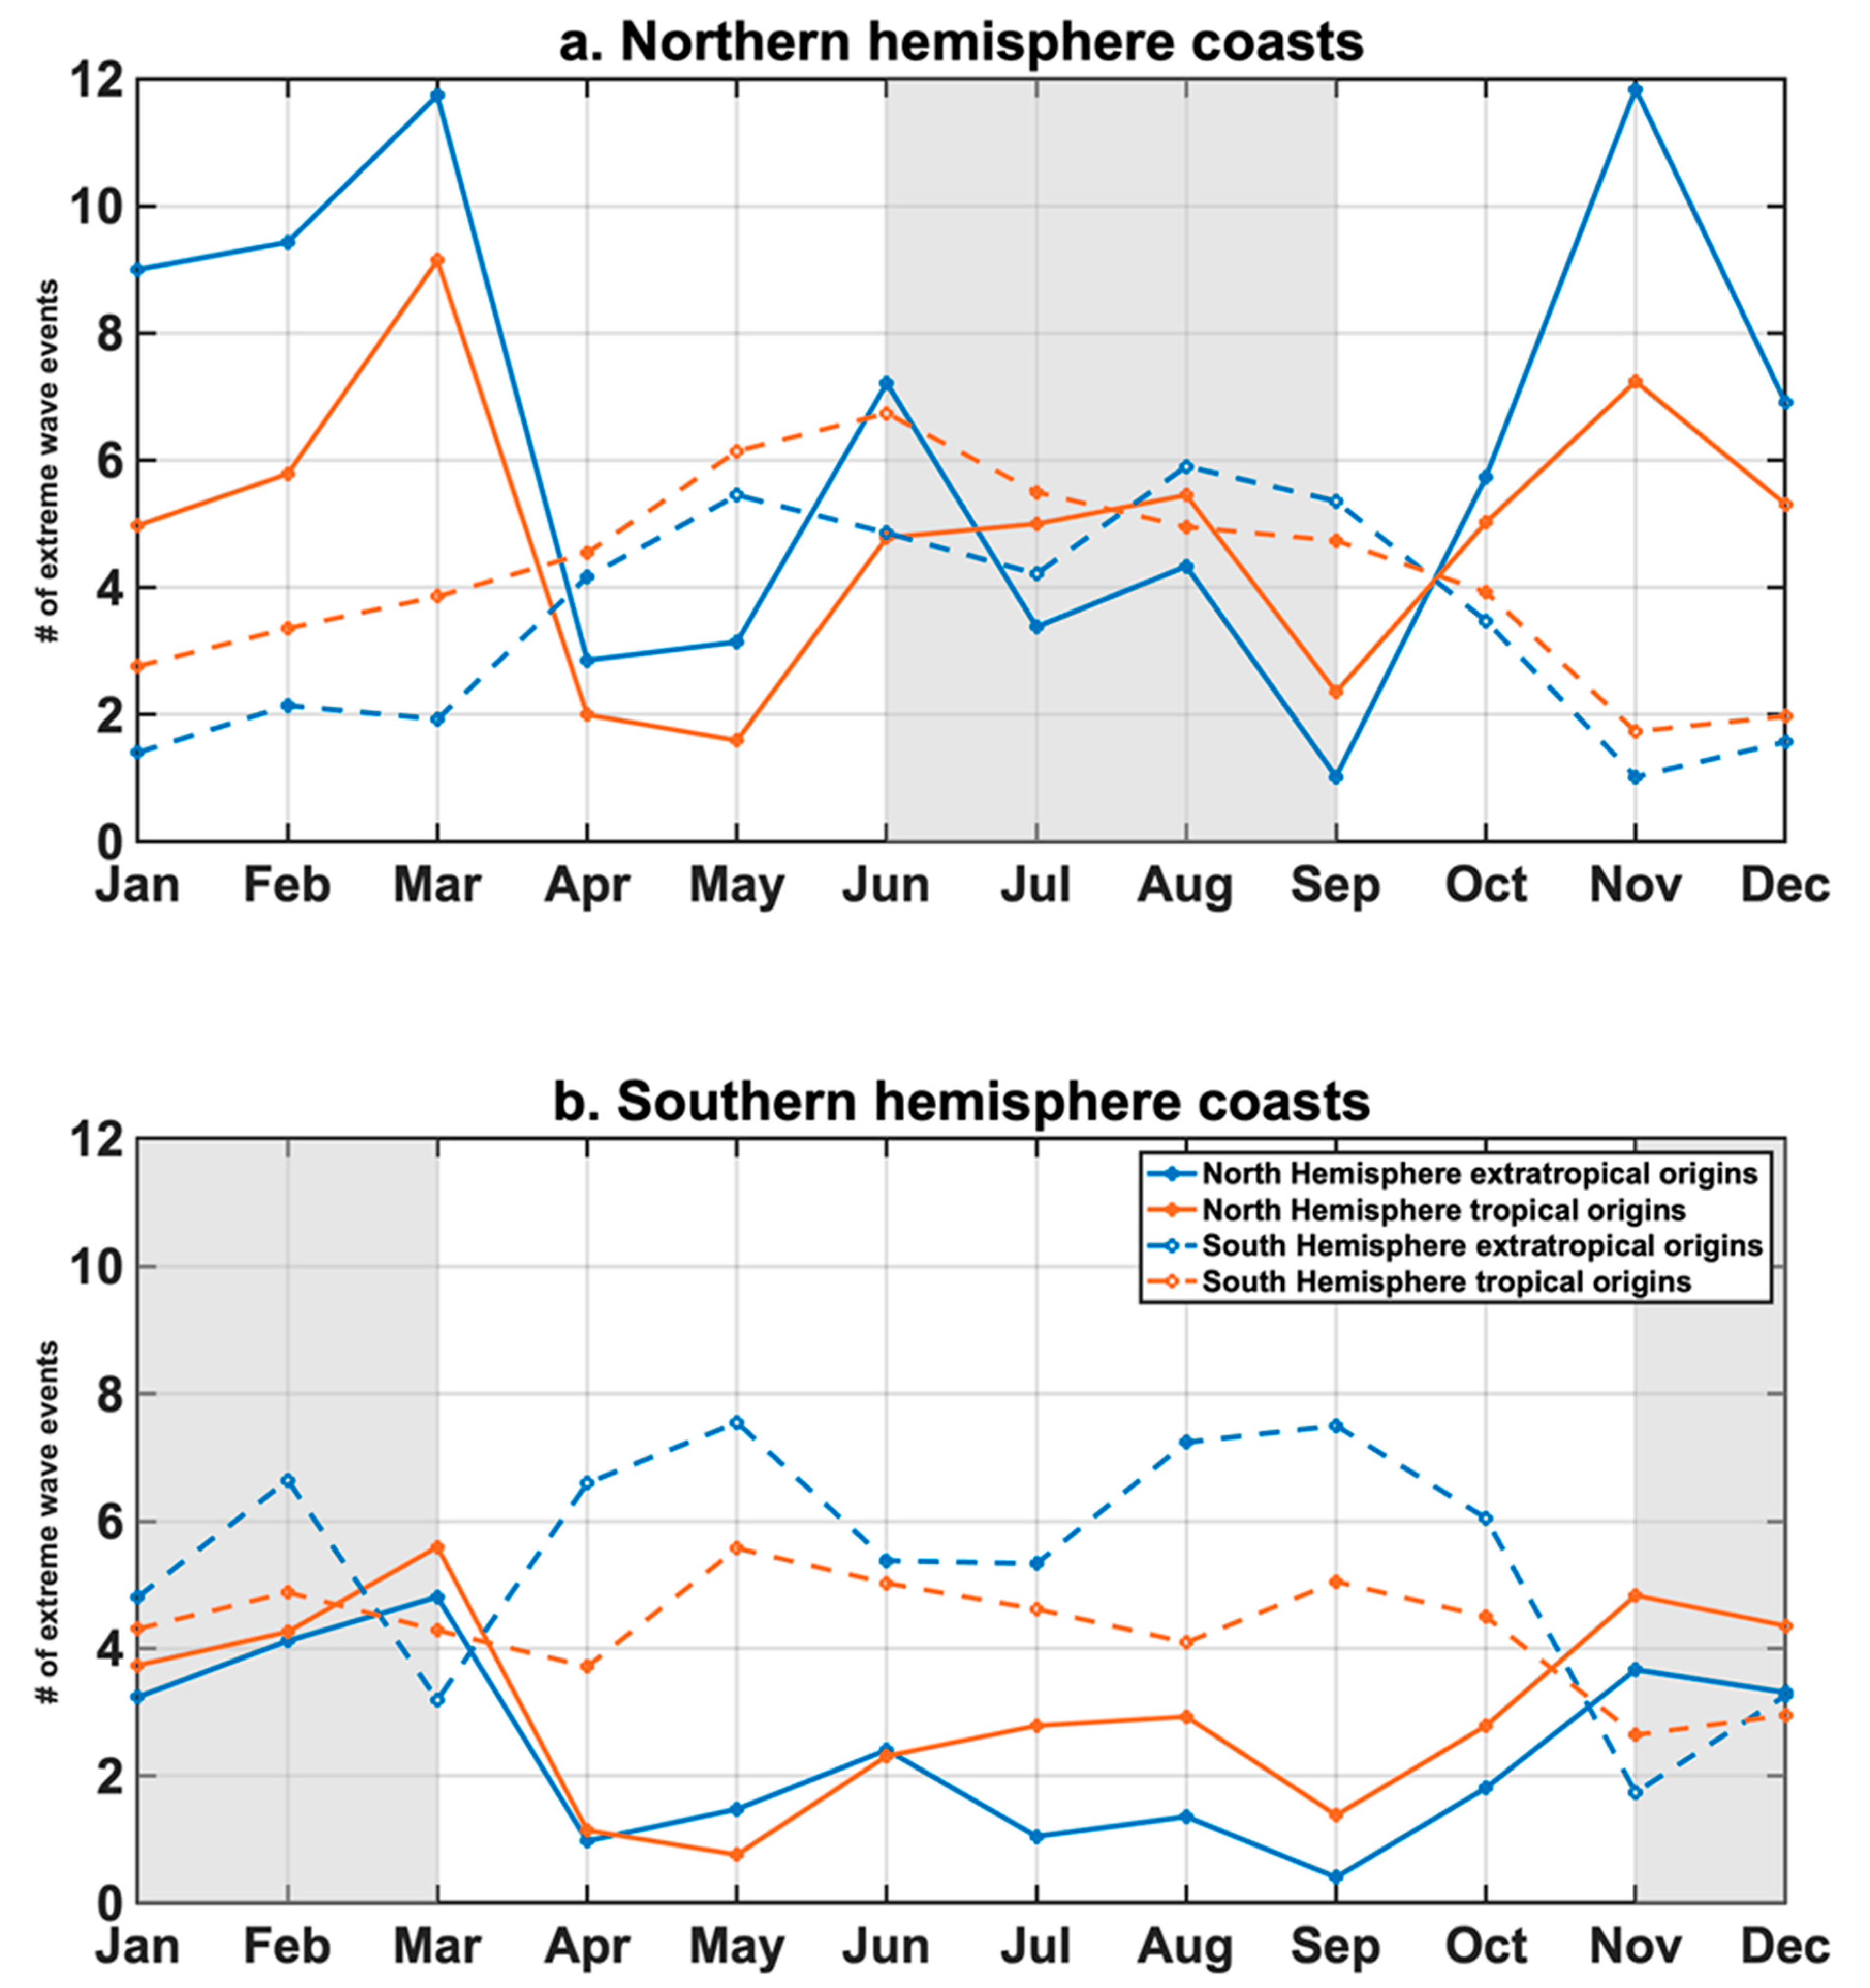
To explore the seasonality of these across-hemispheric and tropical–extratropical waves’ propagation, Figure 5 shows annual cycles of the total number of extreme coastal events per hemisphere according to their Northern vs. Southern and tropical vs. extratropical origins. Note that the eastern and western part of each tropical and extratropical basins were combined together to facilitate a comprehensive evaluation of the paired atmospheric-wave regimes in both hemispheres. Coastal wave extremes impacting the Northern Hemisphere mostly originate from the northern tropical and extratropical regions in the boreal winter consistently with the increase in trade and westerly winds activity during this season (Figure 1a and Figure 5a). Conversely, coastal waves in the boreal summer tend to originate rather equally from the tropical and extratropical regions of both the Southern and Northern Hemispheres, which is consistent with the increase in the southern trade and westerly winds activity and potentially of the northern tropical cyclone activity during this time of year. In the Southern Hemisphere, coastal waves are seen to mostly originate year-round from their tropical and extratropical regions (Figure 5b). However, we observed a significant contribution of the northern tropical region to wave extremes in this hemisphere in particular in the boreal winter and to some extent in the summer. This could reflect the strong ENSO control on the Northern Hemisphere extratropical storm activity and the seasonal increase in Northern-Hemisphere tropical cyclone activity, respectively. This interannual modulation of paired wind regimes and wave extremes is tackled in the next section.

3.3. Climate Modes—Driven Interannual Variability of Pacific Wind-Wave Regimes

Now, the respective control of the two dominant Pacific climate modes, namely, ENSO and SAM, on the interannual variability of atmospheric regimes and their induced extreme wave activity is examined. First, Table 2 shows correlations between seasonally averaged interannual anomalies of extreme wave occurrence averaged in different open–ocean regions and the typical indices characterizing ENSO and SAM variability, Niño3.4, and SAM.
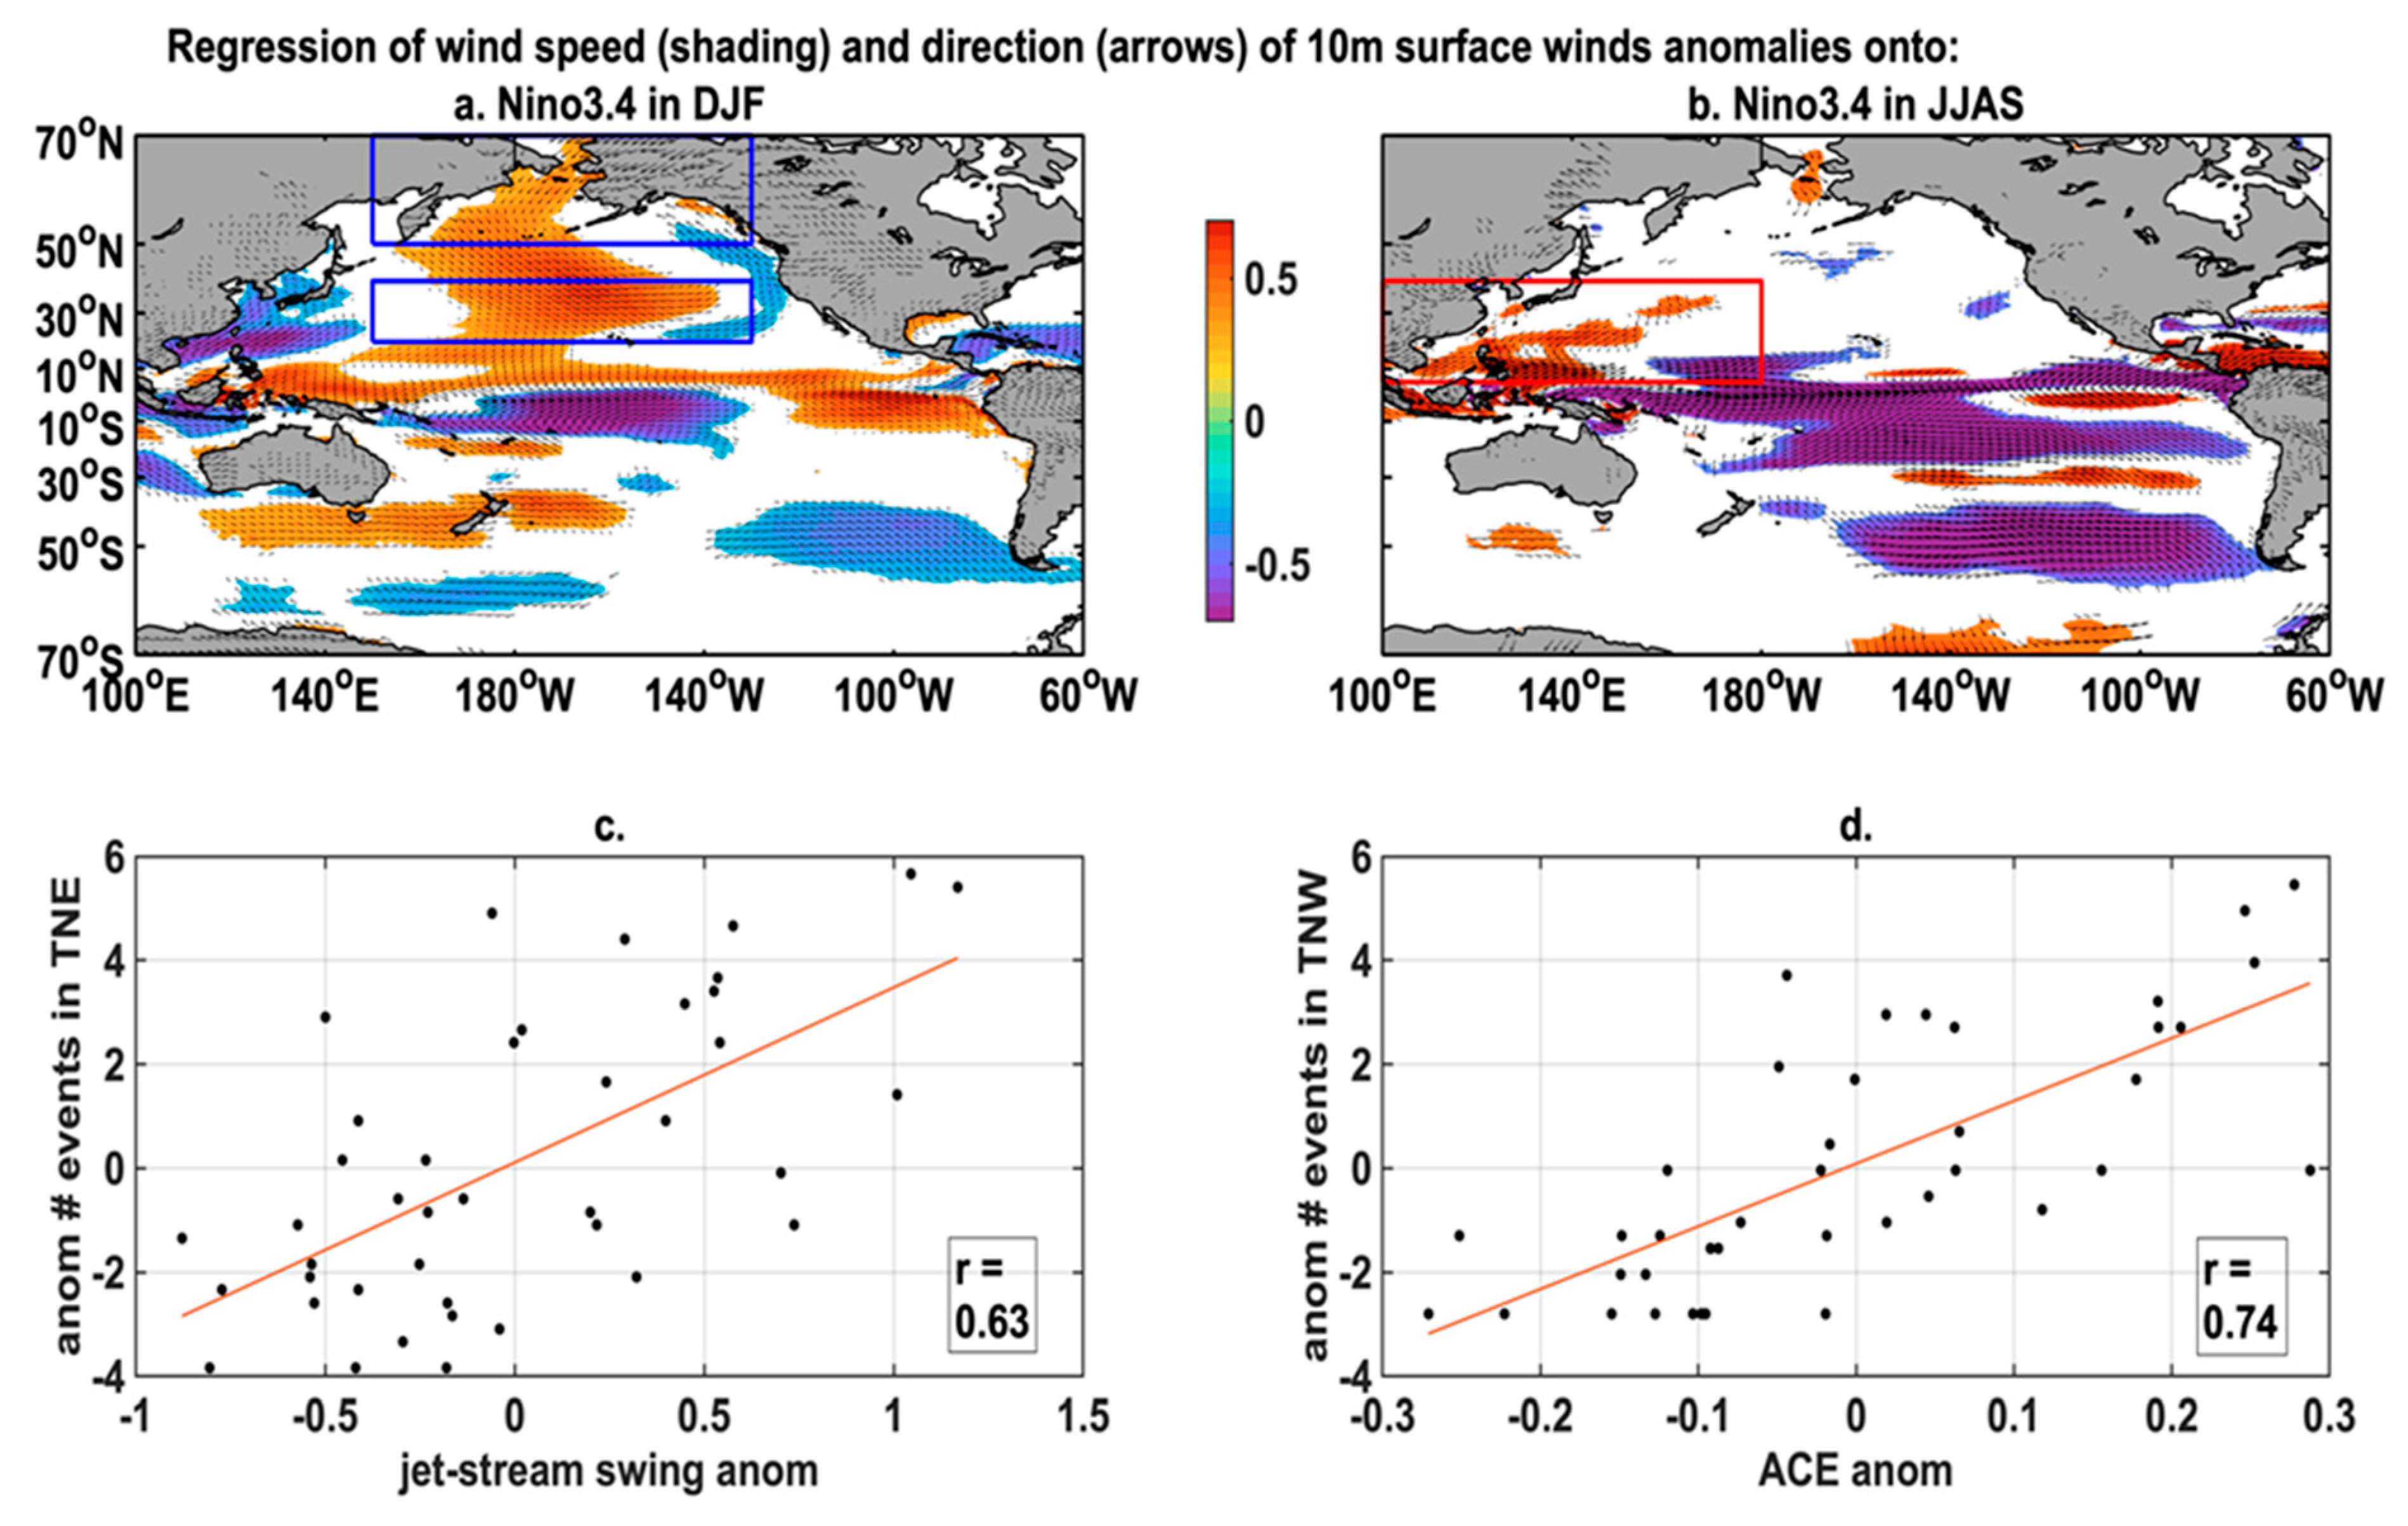
  • ENSO: The ENSO control on the eastern Pacific wave regimes, and in particular in the tropical northeastern region (Table 2, r = 0.55), is strong in the boreal winter when El Niño events reach their maximum. The peak of El Niño events is characterized by a reduction/reversal of the trade winds in the central equatorial Pacific, which triggers strong positive (negative) SST anomalies in the tropical eastern (western) Pacific, which can induce, through atmospheric teleconnections, a shrinking of the Hadley circulation extent in the middle and lower troposphere and expansion (shrinking) of the Hadley circulation extent in the upper troposphere [37]. This in turn promotes a strengthening of the Aleutian low-pressure system associated with an equatorward shift of the westerlies into the eastern subtropical region as indicated by the regression pattern of surface winds onto Niño3.4 in DJF on Figure 6a. This will induce an increased activity in the tropical northeastern Pacific wave regime as evidenced by the strong relationship (cf. Figure 6c) between the anomalous occurrence of extreme wave events in this region and an index characterizing the meridional displacement of the northern hemisphere jet-stream (calculated as the difference in surface wind speed between the subtropical and the high-latitudes region delineated by the blue boxes on Figure 6a). In the boreal summer, we observed a strong influence of ENSO on the western Pacific wave regimes and, in particular, in the Tropical North-West region (Table 2, r = 0.60). However, the regression pattern of surface winds onto Niño3.4 in JJAS (Figure 6b) displayed a reduction in trade winds activity related to the onset of El Niño events, which suggests that the increase in extreme waves in this region is not related to this typical climatological wind pattern. Instead, the regression showcases an increase in cyclonic surface winds (and associated vorticity) and a decrease in vertical wind shear (not shown), implying a potential strong control of ENSO on wave extremes in the western Pacific through its modulation of tropical cyclone activity [38]. To quantify the tropical cyclone activity in the northwestern Pacific, we calculated the monthly interannual anomalies of the accumulated cyclone energy (ACE), which represents an integrated measure of tropical storms intensity [39], averaged over the entire cyclonic basin (the red box on Figure 6b) following the method described in [40]. This ACE index anomalies are strongly correlated with the anomalous occurrence of wave extreme in this region (cf. Figure 6d), confirming the ENSO control on wave activity through the seasonally modulated increase in Tropical cyclone activity that can even affect the Pacific North-West extratropical coastlines (Table 2).
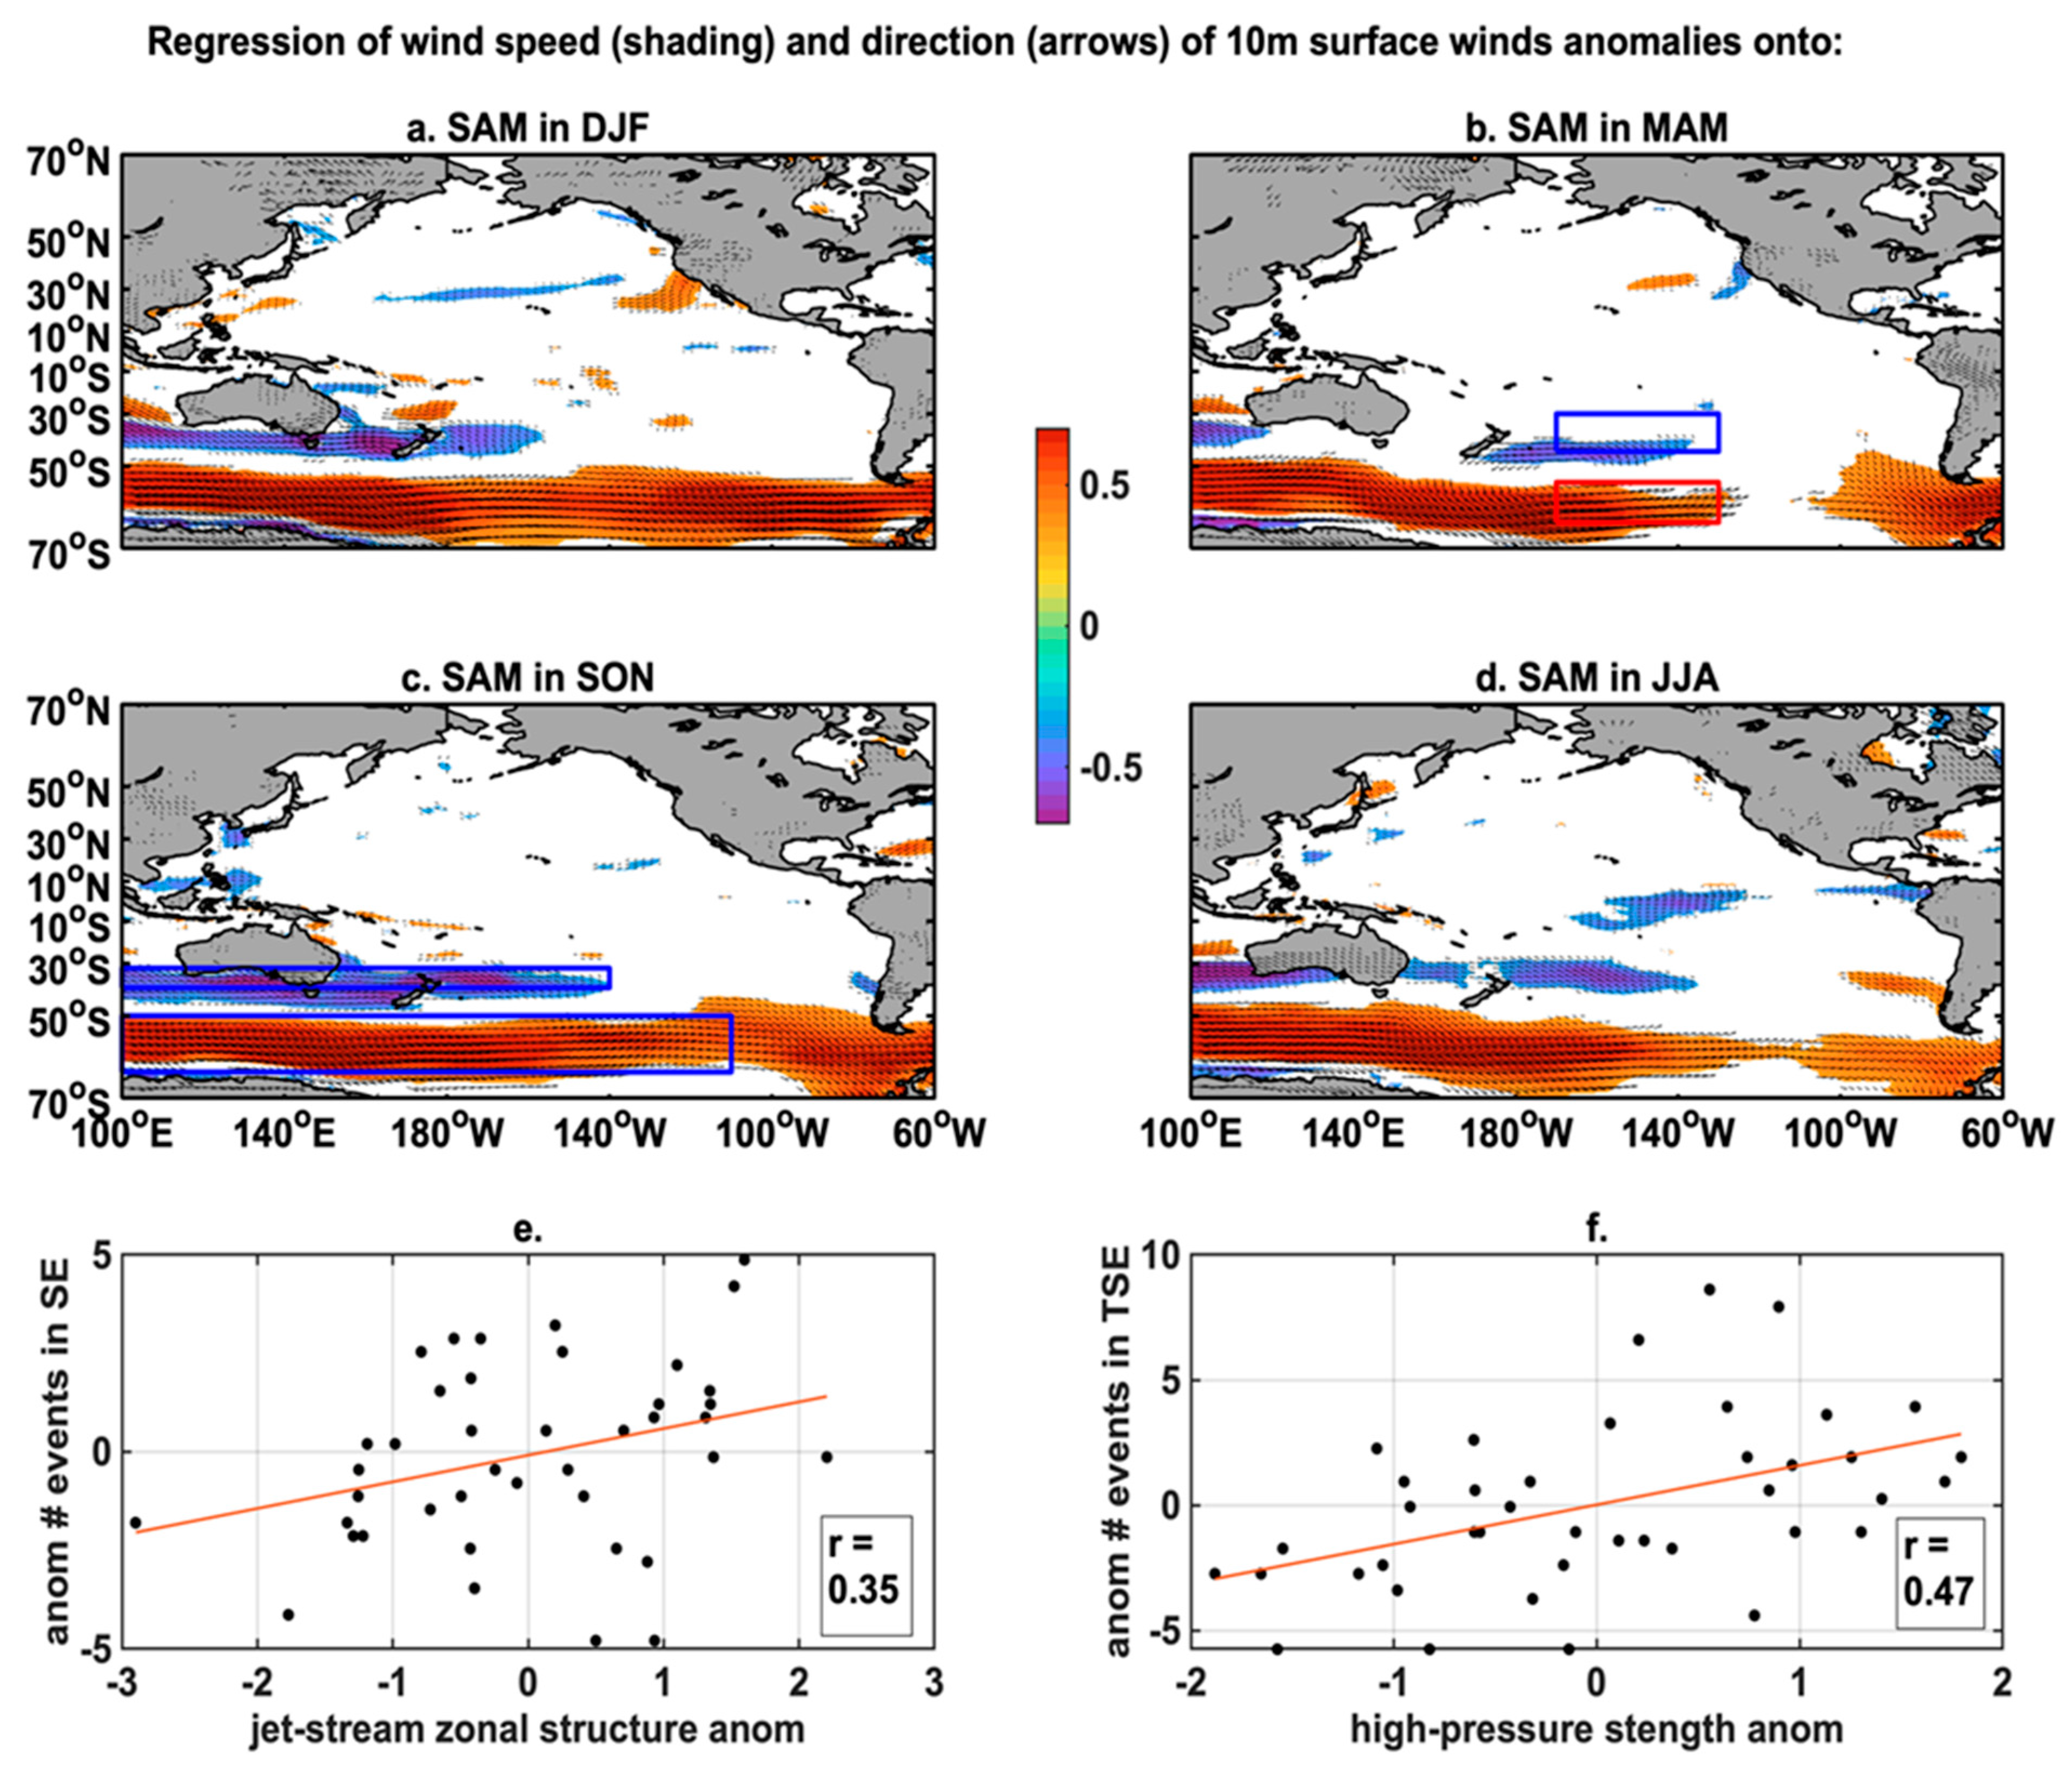
  • SAM: The occurrence of extreme waves in the extratropical south Pacific is significantly linked to SAM interannual variability year-round with the exception of the Pacific South-West in September–November and December–February (Table 2). The regressions of surface wind speed in austral spring and summer (Figure 7a,c) are indeed characterized by a strong meridional dipole of the jet-related zonal wind structure marked in particular by a decrease and reversal in the westerlies south of Australia, preventing the generation of large waves in this area (i.e., the Pacific South-West). This pattern is concurrent with an increased intensity, a poleward confinement, and zonal extension of the polar jet into the Pacific South-East, which promotes an increased generation of large waves affecting this region. This is shown by the significant correlation between an index characterizing the strength of the zonal surface wind dipole (the difference in wind speed between the two blue boxes on Figure 7e) and the anomalous occurrence of extreme waves in the southeastern Pacific region (Figure 7e). Conversely, significant correlations were observed between anomalous occurrence of extreme waves in the Pacific South-West and SAM in March–May and June–August (Table 2). The regressions of surface winds onto SAM during these seasons displayed a more meandering polar jet-stream, which, in particular, moved closer to Australia and can therefore generate large waves more likely to affect the Pacific South-West (Figure 7b,d). Interestingly, this meandering structure is also associated with a more northwest wind direction in the Pacific South-East that is less likely to affect coastal regions in this area and with an intensification of the high-pressure system in the central south Pacific. This anomalous anticyclonic circulation promotes more southwesterly winds and associated waves that can reach the tropical Pacific South-East. This is confirmed by the strong relationship between an index characterizing the strength of this high-pressure system calculated as the sum of the surface wind zonal velocity averaged in the red and blue boxes on Figure 7b and the anomalous occurrence of large waves in the tropical Pacific South-East.

4. Summary and Discussion

In this study, a new method was introduced to quantify the connections between the occurrence of large waves in the open ocean and coastal wave events all around the Pacific rim over the period 1979–2020. This allowed the evaluations of the oceanic origins and associated large-scale wind regimes of coastal waves in the Pacific basin and therefore a comprehensive assessment of the mean climate and seasonal and interannual variability of coastal extreme episodes with regard to their local vs. remote generations. This statistical analysis revealed a relatively even distribution of large coastal wave events origins with 54% generated locally and 46% coming from a distant source. In particular, we evidenced a significant proportion of extreme waves propagating across the equator, with 22% of large coastal waves that originate from the opposite hemisphere. In addition, while large waves generated at higher latitudes were known to affect tropical coastlines in winter, this analysis uncovered a similar amount of extratropical coastal extremes originating from paired wind-wave tropical regimes (~30%). This extratropical↔tropical propagation of large waves occurs mostly in the austral winter/boreal summer and is related to the seasonally increased activity of both the southern jet-stream, which can spawn extreme waves able to spread towards the eastern tropical Pacific shorelines, and the Northern-Hemisphere cyclonic basins where strong northward reclining tropical storms can produce waves energetic enough to reach the northern extratropical regions. Regardless, we found that, compared to the extratropical shorelines, tropical coastlines tend to be under the influence of a wider variety of waves in terms of direction and energy in particular related to the seasonally alternated activation of waves propagating from the opposite hemisphere and/or extratropical regions. This suggests potentially more important destabilizing morphodynamical effects through more drastic changes in longshore drift in tropical areas as compared to the extratropical regions where waves have a narrower window of incidence year-round.
At interannual timescales, alternatingly increased coastal wave extremes between the Western and Eastern Pacific were seen to emerge from the distinct seasonal influence on wave regimes from ENSO in the Northern and SAM in the Southern Hemisphere. In particular, ENSO was shown to promote, through atmospheric bridges, an intensification and equatorward shift of the northern jet-stream into the tropical band, which induces a significant increase in large coastal waves along the eastern seaboard in the boreal winter at the peak of El Niño events. Conversely, the El Niño summer onset is characterized by a more intense cyclonic circulation in the tropical western Pacific, driving a more active hurricane season and thus larger tropical-storm waves affecting the western Pacific facade. In the Southern Ocean, we similarly observed a seasonal east–west seesaw in large waves’ occurrence associated with the SAM influence on the polar jet-stream and the extratropical wave regime. In particular, SAM drives a poleward shift and a meridionally homogeneous zonal extension of the jet stream into the Pacific South-East associated with more extreme waves in this region in the austral spring and winter. On the contrary, SAM’s influence in the austral fall and winter is characterized by a meandering jet stream moving closer to the Australian region and favoring occurrences of large waves in the Pacific South-West. Interestingly, this snaking circulation also induces a strengthening of the south central Pacific subtropical high-pressure system associated with an increase in southwesterly waves that can spread towards the eastern Pacific tropical regions.
Due to the strong societal impacts of coastal flooding and erosion on a worldwide increasing littoral population, there is an urgency to better understand the complex connections between large-scale climate variability and regional coastal dynamics for more adapted sustainable littoral management procedures [41,42,43]. This study provides a simple framework and a methodology easily implementable to achieve such a goal. In particular, it allows a rigorous and exhaustive quantification of the statistical relationships between the occurrence of local coastal wave extremes and large-scale wind/wave regimes not only restricted to the extratropical forcing patterns, which have long been the focus, but also encompassing the atmospheric forcing related to tropical cyclones’ basin-scale activity considered as an integrated wave regime. This comprehensive examination of coastal wave origins emphasized the significant and widely underrated effect of remote wave regimes, which are known for their large destabilizing influence on beach morphology [19,44]. For instance, Ranasinghe et al. [45] and Anderson et al. [46] observed shoreline rotation at embayed beaches, and Trombetta et al. [47] observed an alongshore sediment drift reversal with large consequences for coastal zone management and infrastructures. These remote swells can also drive dramatic overtopping [6] even at storm-free areas, such as in the Gulf of Guinea [1,48], facing the South Atlantic storm track, and in the Pacific due to distant tropical cyclones [17,49,50,51].
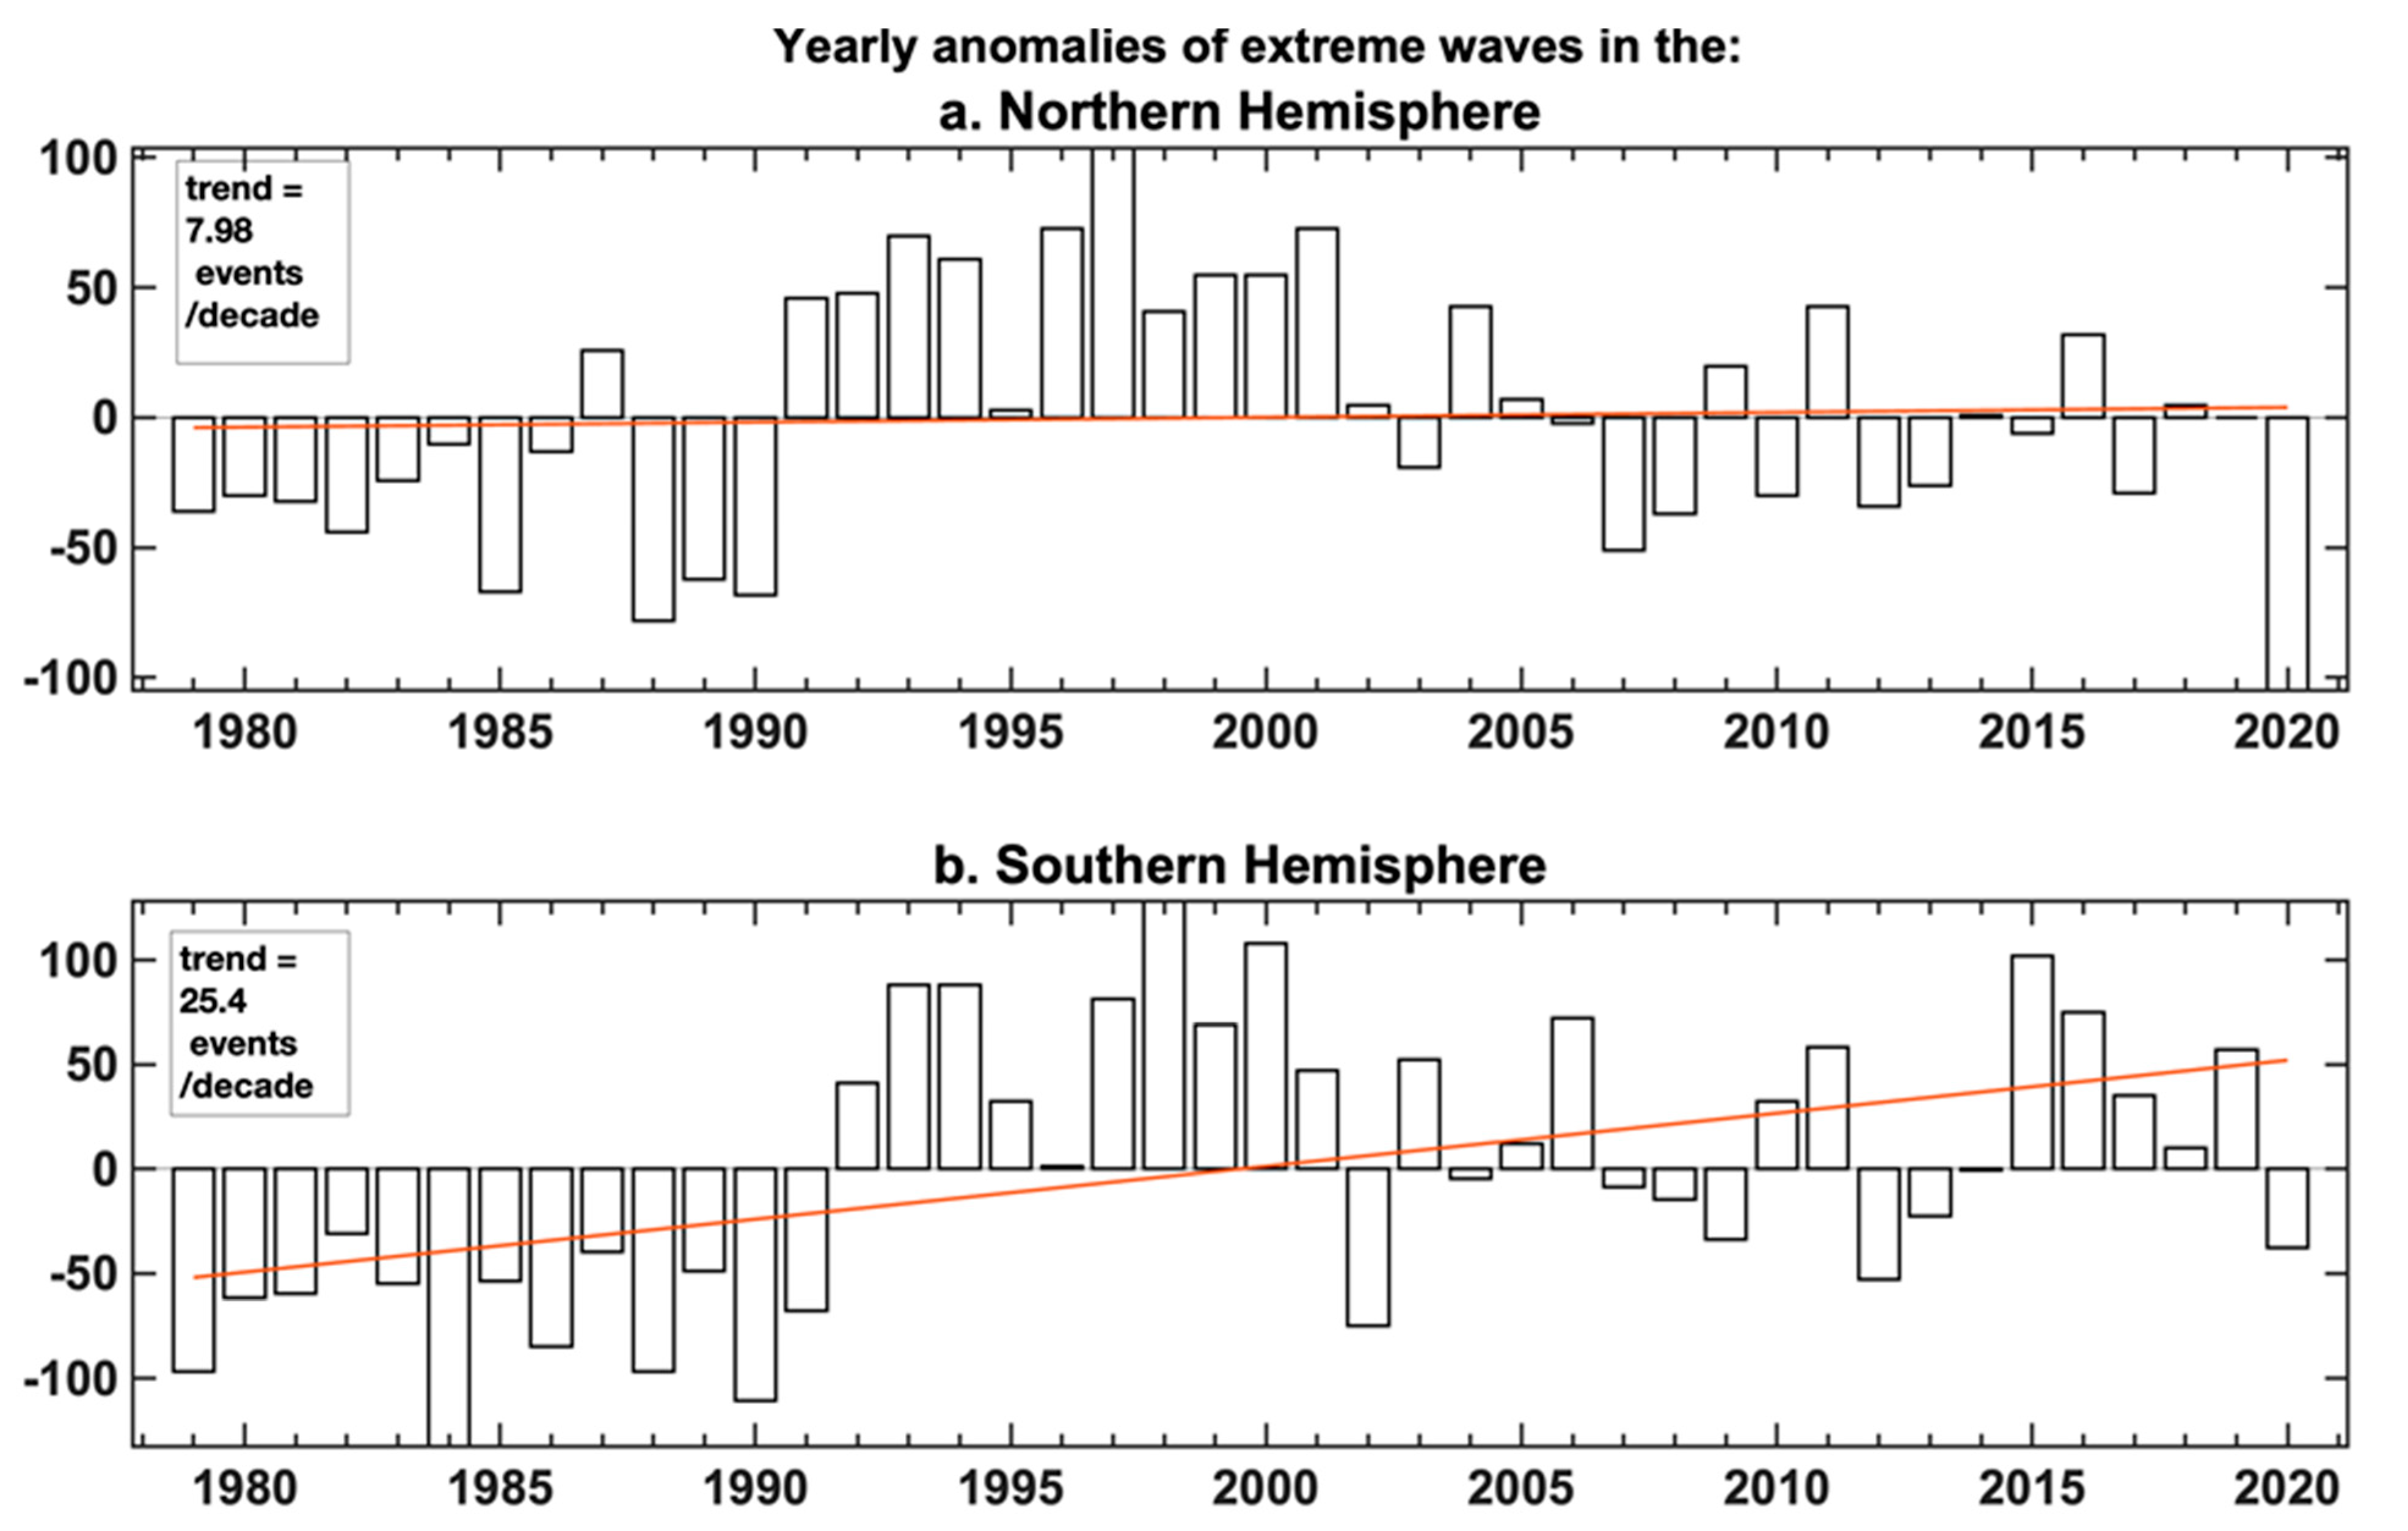
Once the connections between open-ocean wave regimes and regional coastal extremes established, it becomes possible to apprehend their modulation in the context of global climate variability, in particular, with respect to the dominant climate modes. Interestingly, these results highlight the strong difference in the wave-extremes–climate-modes relationships between summer and winter, through the seasonally modulated effect on the interannual variability of tropical and extratropical wave regimes associated with ENSO and SAM. This not only confirms a potentially strong deterministic variability in the Northern-Hemisphere wave activity operating from the nonlinear resonance between El Niño frequencies and the annual cycle as discovered recently (31) but also suggests that a similar mechanism might potentially play out in the Southern Ocean through a SAM–annual-cycle combination mode. Exploring such phase-locked relationships in SAM behavior may shed light on a new range of deterministic variability in the Southern Hemisphere, which might help constrain wave variability, seasonal forecasts, and future climate projection in a region already marked by a strong upward trend in wave extremes (Figure 8). Because climate modes are usually predictable at seasonal timescales with relatively good confidence, these results pave the way for reliable forecasts of coastal waves and related hazards. For instance, the lead-time of state-of-the-art ENSO forecasts is ~3–6 months [52], which therefore offers valuable anticipation for littoral and islands’ communities particularly vulnerable in the Pacific basin. In addition, since ENSO’s influence on both extratropical and tropical wave regimes extends beyond the Pacific through its control on the planetary jet-streams and tropical cyclone activity respectively [38,53], the framework described here can be replicated in other oceanic basins to evaluate the pantropical ENSO influence on global wave regimes.

Author Contributions

Conceptualization, J.B. and R.A.; methodology, L.S.; data curation, E.K.; writing—original draft preparation, J.B.; writing—review and editing, J.B. All authors have read and agreed to the published version of the manuscript.

Funding

French Agence Nationale de la Recherche Project MOPGA “Trocodyn” (ANR-17-MPGA-0018).

Acknowledgments

J. Boucharel is funded by the French Agence Nationale de la Recherche Project MOPGA “Trocodyn” (ANR-17-MPGA-0018). The authors would like to thank the Région Occitanie.

Conflicts of Interest

The authors declare no conflict of interest.

References

  1. Melet, A.; Almar, R.; Meyssignac, B. What dominates sea level at the coast: A case study for the Gulf of Guinea. Ocean. Dyn. 2016, 66, 623. [Google Scholar] [CrossRef]
  2. Rueda, A.S.; Vitousek, P.; Camus, A.; Tomas, A.; Espejo, I.J.; Losada, P.L.; Barnard, L.H.; Erikson, P.; Ruggiero, B.G.; Reguero, F.J.; et al. Global classification of coastal flood hazard climates associated with large-scale oceanographic forcing. Sci. Rep. 2017, 7, 5038. [Google Scholar] [CrossRef]
  3. Serafin, K.A.; Ruggiero, P.; Stockdon, H.F. The relative contribution of waves, tides, and non-tidal residuals to extreme total water levels on US West Coast sandy beaches. Geophys. Res. Lett. 2017, 44, 1839–1847. [Google Scholar] [CrossRef]
  4. Vitousek, S.; Barnard, P.L.; Fletcher, C.H.; Frazer, N.; Erikson, L.; Storlazzi, C.D. Doubling of coastal flooding frequency within decades due to sea-level rise. Sci. Rep. 2017, 7, 1399. [Google Scholar] [CrossRef]
  5. Vousdoukas, M.I.; Mentaschi, L.; Voukouvalas, E.; Verlaan, M.; Jevrejeva, S.; Jackson, L.; Feyen, L. Global probabilistic projections of extreme sea levels. Nat. Commun. 2018, 9, 2360. [Google Scholar] [CrossRef] [Green Version]
  6. Almar, R.; Ranasinghe, R.; Bergsma, E.W.J.; Diaz, H.; Melet, A.; Papa, F.; Vousdoukas, M.; Athanasiou, P.; Dada, O.; Almeida, L.P.; et al. A global analysis of extreme coastal water levels with implications for potential coastal overtopping. Nat. Commun. 2021, 12, 3775. [Google Scholar] [CrossRef]
  7. Izaguirre, C.; Losada, I.J.; Camus, P.; Vigh, J.L.; Stenek, V. Climate change risk to global port operations. Nat. Clim. Chang. 2021, 11, 14–20. [Google Scholar] [CrossRef]
  8. Fairley, I. A classification system for global wave energy resources based on multivariate clustering. Appl. Energy 2020, 262, 114515. [Google Scholar] [CrossRef]
  9. Fraser, C.I.; Morrison, A.K.; Hogg, A.M.; Macaya, E.C.; van Sebille, E.; Ryan, P.G.; Padovan, A.; Jack, C.; Valvidia, N.; Water, J.M. Antarctica’s ecological isolation will be broken by storm-driven dispersal and warming. Nat. Clim. Chang. 2018, 8, 704–708. [Google Scholar] [CrossRef] [Green Version]
  10. Odériz, I.; Silva, R.; Mortlock, T.R.; Mori, N. ENSO Impacts on Global Wave Climate and Potential Coastal Hazards. J. Geophys. Res. Ocean. 2020, 125, e2020JC016464. [Google Scholar] [CrossRef]
  11. Erftemeijer, P.L.A.; Riegl, B.; Hoeksema, B.W.; Todd, P.A. Environmental impacts of dredging and other sediment disturbances on corals: A review. Mar. Pollut. Bull. 2012, 64, 1737–1765. [Google Scholar] [CrossRef]
  12. Huizer, S.; Luijendijk, A.P.; Bierkens, M.F.P.; Oude Essink, G.H.P. Global potential for the growth of fresh groundwater resources with large beach nourishments. Sci. Rep. 2019, 9, 12451. [Google Scholar] [CrossRef]
  13. Burkett, V. Global climate change implications for coastal and offshore oil and gas development. Energy Policy 2011, 39, 7719–7725. [Google Scholar] [CrossRef]
  14. Callaway, R.; Shinn, A.P.; Grenfell, S.E.; Bron, J.E.; Burnell, G.; Cook, E.J.; Crumlish, M.; Culloty, S.; Davidson, K.; Ellis, R.P.; et al. Review of climate change impacts on marine aquaculture in the UK and Ireland. Aquat. Conserv. Mar. Freshw. Ecosyst. 2012, 22, 389–442. [Google Scholar] [CrossRef]
  15. Delpey, M.T.; Ardhuin, F.; Collard, F.; Chapron, B. Space-time structure of long ocean swell fields. J. Geophys. Res. 2010, 115, C12037. [Google Scholar] [CrossRef] [Green Version]
  16. Munk, W.H.; Miller, G.R.; Snodgrass, F.E.; Barber, N.F. Directional recording of swell from distant storms. Philos. Trans. R. Soc. Lond. Ser. A Math. Phys. Sci. 1963, 255, 505–584. [Google Scholar] [CrossRef]
  17. Hoeke, R.K.; McInnes, K.L.; Kruger, J.C.; McNaught, R.J.; Hunter, J.R.; Smithers, S.G. Widespread inundation of Pacific islands triggered by distant-source wind-waves. Glob. Planet Chang. 2012, 108, 128–138. [Google Scholar] [CrossRef] [Green Version]
  18. Odériz, I.; Silva, R.; Mortlock, T.R.; Mori, N.; Shimura, T.; Webb, A.; Padilla-Hernandez, R.; Villers, S. Natural variability and warming signals in global ocean wave climates. Geophys. Res. Lett. 2021, 48, e2021GL093622. [Google Scholar] [CrossRef]
  19. Almar, R.; Kestenare, E.; Boucharel, J. On the key influence of the remote climate variability from Tropical Cyclones, North and South Atlantic mid-latitude storms on the Senegalese coast (West Africa). Environ. Res. Comm. 2019, 1, 071001. [Google Scholar] [CrossRef] [Green Version]
  20. Kushnir, Y.; Cardone, V.J.; Greenwood, J.G.; Cane, M. On the recent increase in North Atlantic wave heights. J. Clim. 1997, 10, 2107–2113. [Google Scholar] [CrossRef] [Green Version]
  21. Wang, X.L.; Swail, V.R. Changes of extreme wave heights in Northern Hemisphere Oceans and related atmospheric circulation regimes. J. Clim. 2001, 14, 2204–2221. [Google Scholar] [CrossRef]
  22. Dodet, G.; Bertin, X.; Taborda, R. Wave climate variability in the North-East Atlantic Ocean over the last six decades. Ocean Model. 2010, 31, 120–131. [Google Scholar] [CrossRef]
  23. Hemer, M.A.; Church, J.A.; Hunter, J.R. Variability and trends in the directional wave climate of the Southern Hemisphere. Int. J. Climatol. 2010, 30, 475–491. [Google Scholar] [CrossRef]
  24. Izaguirre, C.; Méndez, F.J.; Menéndez, M.; Losada, I.J. Global extreme wave height variability based on satellite data. Geophys. Res. Lett. 2011, 38, L10607. [Google Scholar] [CrossRef]
  25. Bosserelle, C.; Pattiaratchi, C.; Haigh, I. Inter-annual variability and longer-term changes in the wave climate of Western Australia between 1970 and 2009. Ocean Dyn. 2011, 62, 63–76. [Google Scholar] [CrossRef]
  26. Semedo, A.; Suselij, K.; Rutgersson, A.; Sterl, A. A global view on the wind sea and swell climate and variability from ERA-40. J. Clim. 2011, 24, 1461–1479. [Google Scholar] [CrossRef]
  27. Fan, Y.; Lin, S.-J.; Held, I.M.; Yu, Z.; Tolman, H.L. Global ocean surface wave simulation using a coupled atmosphere-wave model. J. Clim. 2012, 25, 6233–6252. [Google Scholar] [CrossRef]
  28. Stopa, J.E.; Cheung, K.-F.; Tolman, H.L.; Chawla, A. Patterns and cycles in the climate forecast system reanalysis wind and wave data. Ocean Model. 2013, 70, 207–220. [Google Scholar] [CrossRef]
  29. McPhaden, M.J.; Zebiak, S.E.; Glantz, M.H. ENSO as in integrating concept in earth science. Science 2006, 314, 1740–1745. [Google Scholar] [CrossRef] [Green Version]
  30. Timmermann, A.; An, S.; Kug, J.; Jin, F.-F.; Cai, W.; Capotondi, A.; Cobb, K.M.; Lengaigne, M.; McPhaden, J.M.; Stuecker, M.F.; et al. El Niño–Southern Oscillation complexity. Nature 2018, 559, 535–545. [Google Scholar] [CrossRef]
  31. Capotondi, A.; Wittenberg, A.T.; Newman, M.; Di Lorenzo, E.; Yu, J.-Y.; Braconnot, P.; Cole, J.; Dewitte, D.; Giese, B.; Guilyardi, E.; et al. Understanding ENSO Diversity. Bull. Am. Meteor. Soc. 2015, 96, 921–938. [Google Scholar] [CrossRef]
  32. Boucharel, J.; Almar, R.; Kestenare, E.; Jin, F.-F. On the influence of ENSO complexity on Pan-Pacific coastal wave extremes. Proc. Natl. Acad. Sci. USA 2021, 118, e2115599118. [Google Scholar] [CrossRef]
  33. Marshall, A.; Hemer, M.; Hendon, H.; Mcinnes, K. Southern Annular Mode impacts on global ocean surface waves. Ocean. Model. 2018, 129, 58–74. [Google Scholar] [CrossRef]
  34. Hersbach, H.; Bell, B.; Berrisford, P.; Hirahara, S.; Horanyi, A.; Munoz-Sabater, J.; Nicolas, J.; Peubey, C.; Radu, R.; Schepers, D.; et al. The ERA5 global reanalysis. Q. J. R. Meteorol. Soc. 2020, 146, 1999–2049. [Google Scholar] [CrossRef]
  35. Wessel, P.; Smith, W.H.F. A global, self-consistent, hierarchical, high-resolution shoreline database. J. Geophys. Res. 1996, 101, 8741–8743. [Google Scholar] [CrossRef] [Green Version]
  36. Mentaschi, L.; Vousdoukas, M.I.; Voukouvalas, E.; Dosio, A.; Feyen, L. Global changes of extreme coastal wave energy fluxes triggered by intensified teleconnection patterns. Gephys. Res. Lett. 2017, 44, 2416–2426. [Google Scholar] [CrossRef]
  37. Guo, Y.P.; Li, J.P. Impact of ENSO events on the interannual variability of Hadley circulation extents in boreal winter. Adv. Clim. Chang. Res. 2016, 7, 46–53. [Google Scholar] [CrossRef]
  38. Lin, I.-I.; Camargo, S.; Patricola, C.; Boucharel, J.; Chand, S.; Klotzbach, P.; Chan, J.; Wang, B.; Chang, P.; Li, T. Chapter ENSO and Tropical Cyclones. In El Niño Southern Oscillation in a Changing Climate; McPhaden, M., Santoso, A., Cai, W., Eds.; American Geophysical Union: Washington, DC, USA, 2020; Volume 253, 377p. [Google Scholar]
  39. Bell, G.D.; Halpert, M.S.; Schnell, R.C.; Higgins, R.W.; Lawrimore, J.; Kousky, V.E.; Tinker, R.; Thiaw, W.; Chelliah, M.; Artusa, A. Climate Assessment for 1999. Bull. Am. Meteor. Soc. 2000, 81, S1–S50. [Google Scholar] [CrossRef]
  40. Boucharel, J.; Jin, F.-F.; England, M.E.; Lin, I.-I. Modes of hurricane activity variability in the Eastern Pacific: Implications for the 2016 season. Geophys. Res. Lett. 2016, 43, 11358–11366. [Google Scholar] [CrossRef]
  41. Nicholls, R.J.; Cazenave, A. Sea-level rise and its impact on coastal zones. Science 2010, 328, 1517–1520. [Google Scholar] [CrossRef]
  42. Nicholls, R.J.; Lincke, D.; Hinkel, J.; Brown, S.; Vafeidis, A.T.; Meyssignac, B.; Hanson, S.E.; Merkens, J.-L.; Fang, J. A global analysis of subsidence, relative sea-level change and coastal flood exposure. Nat. Clim. Chang. 2021, 11, 338–342. [Google Scholar] [CrossRef]
  43. Ranasinghe, R. On the need for a new generation of coastal change models for the 21st century. Sci. Rep. 2020, 10, 2010. [Google Scholar] [CrossRef]
  44. Sadio, M.; Anthony, E.J.; Diaw, A.T.; Dussouillez, P.; Fleury, J.T.; Kane, A.; Almar, R.; Kestenare, E. Shoreline changes on the wave-influenced Senegal River delta, West Africa: The roles of natural processes and human interventions. Water 2017, 9, 357. [Google Scholar] [CrossRef] [Green Version]
  45. Ranasinghe, R.; McLoughlin, R.; Short, A.; Symonds, G. The southern oscillation index, wave climate, and beach rotation. Mar. Geol. 2004, 204, 273–287. [Google Scholar] [CrossRef]
  46. Anderson, D.; Ruggiero, P.; Antolínez, J.A.A.; Méndez, F.J.; Allan, J. A climate index optimized for longshore sediment transport reveals interannual and multidecadal littoral cell rotations. J. Geophys. Res. Earth Surf. 2018, 123, 1958–1981. [Google Scholar] [CrossRef]
  47. Trombetta, T.B.; Marques, W.C.; Guimarães, R.C.; Costi, J. An overview of longshore sediment transport on the Brazilian coast. Reg. Stud. Mar. Sci. 2020, 35, 101099. [Google Scholar] [CrossRef]
  48. Dada, O.A.; Almar, R.; Oladapo, M.I. Recent coastal sea-level variations and flooding events in the Nigerian Transgressive Mud coast of Gulf of Guinea. J. Afr. Earth Sci. 2020, 161, 103668. [Google Scholar] [CrossRef]
  49. Almeida, L.P.M.; Almar, R.; Meyssignac, B.; Viet, N.T. Contributions to coastal flooding events in southeast of Vietnam and their link with global mean sea level rise. Geosciences 2018, 8, 437. [Google Scholar] [CrossRef] [Green Version]
  50. Cagigal, L.; Rueda, A.; Ricondo, A.; Pérez, J.; Ripoll, N.; Goco, G.; Méndez, F.J. Climate-Based Emulator of Distant Swell Trains and Local Seas Approaching a Pacific Atoll. JGR Oceans 2021, 126, e2020JC016919. [Google Scholar] [CrossRef]
  51. Hoeke, R.K.; Damlamian, H.; Aucan, J.; Wandres, M. Severe Flooding in the Atoll Nations of Tuvalu and Kiribati Triggered by a Distant Tropical Cyclone Pam. Front. Mar. Sci. 2021, 7, 539646. [Google Scholar] [CrossRef]
  52. L’Heureux, M.L.; Levine, A.F.Z.; Newman, M.; Ganter, C.; Luo, J.; Tippett, M.K.; Stockdale, T.N. Chapter ENSO Predictions. In El Niño Southern Oscillation in a Changing Climate; McPhaden, M., Santoso, A., Cai, W., Eds.; American Geophysical Union: Washington, DC, USA, 2020; Volume 253, 377p. [Google Scholar]
  53. Taschetto, A.S.; Ummenhofer, C.C.; Stuecker, M.F.; Dommenget, D.; Ashok, K.; Rodrigues, R.R.; Yeh, S.-W. Chapter “ENSO atmospheric teleconnection”. In El Niño Southern Oscillation in a Changing Climate; McPhaden, M., Santoso, A., Cai, W., Eds.; American Geophysical Union: Washington, DC, USA, 2020; Volume 253, 377p. [Google Scholar]
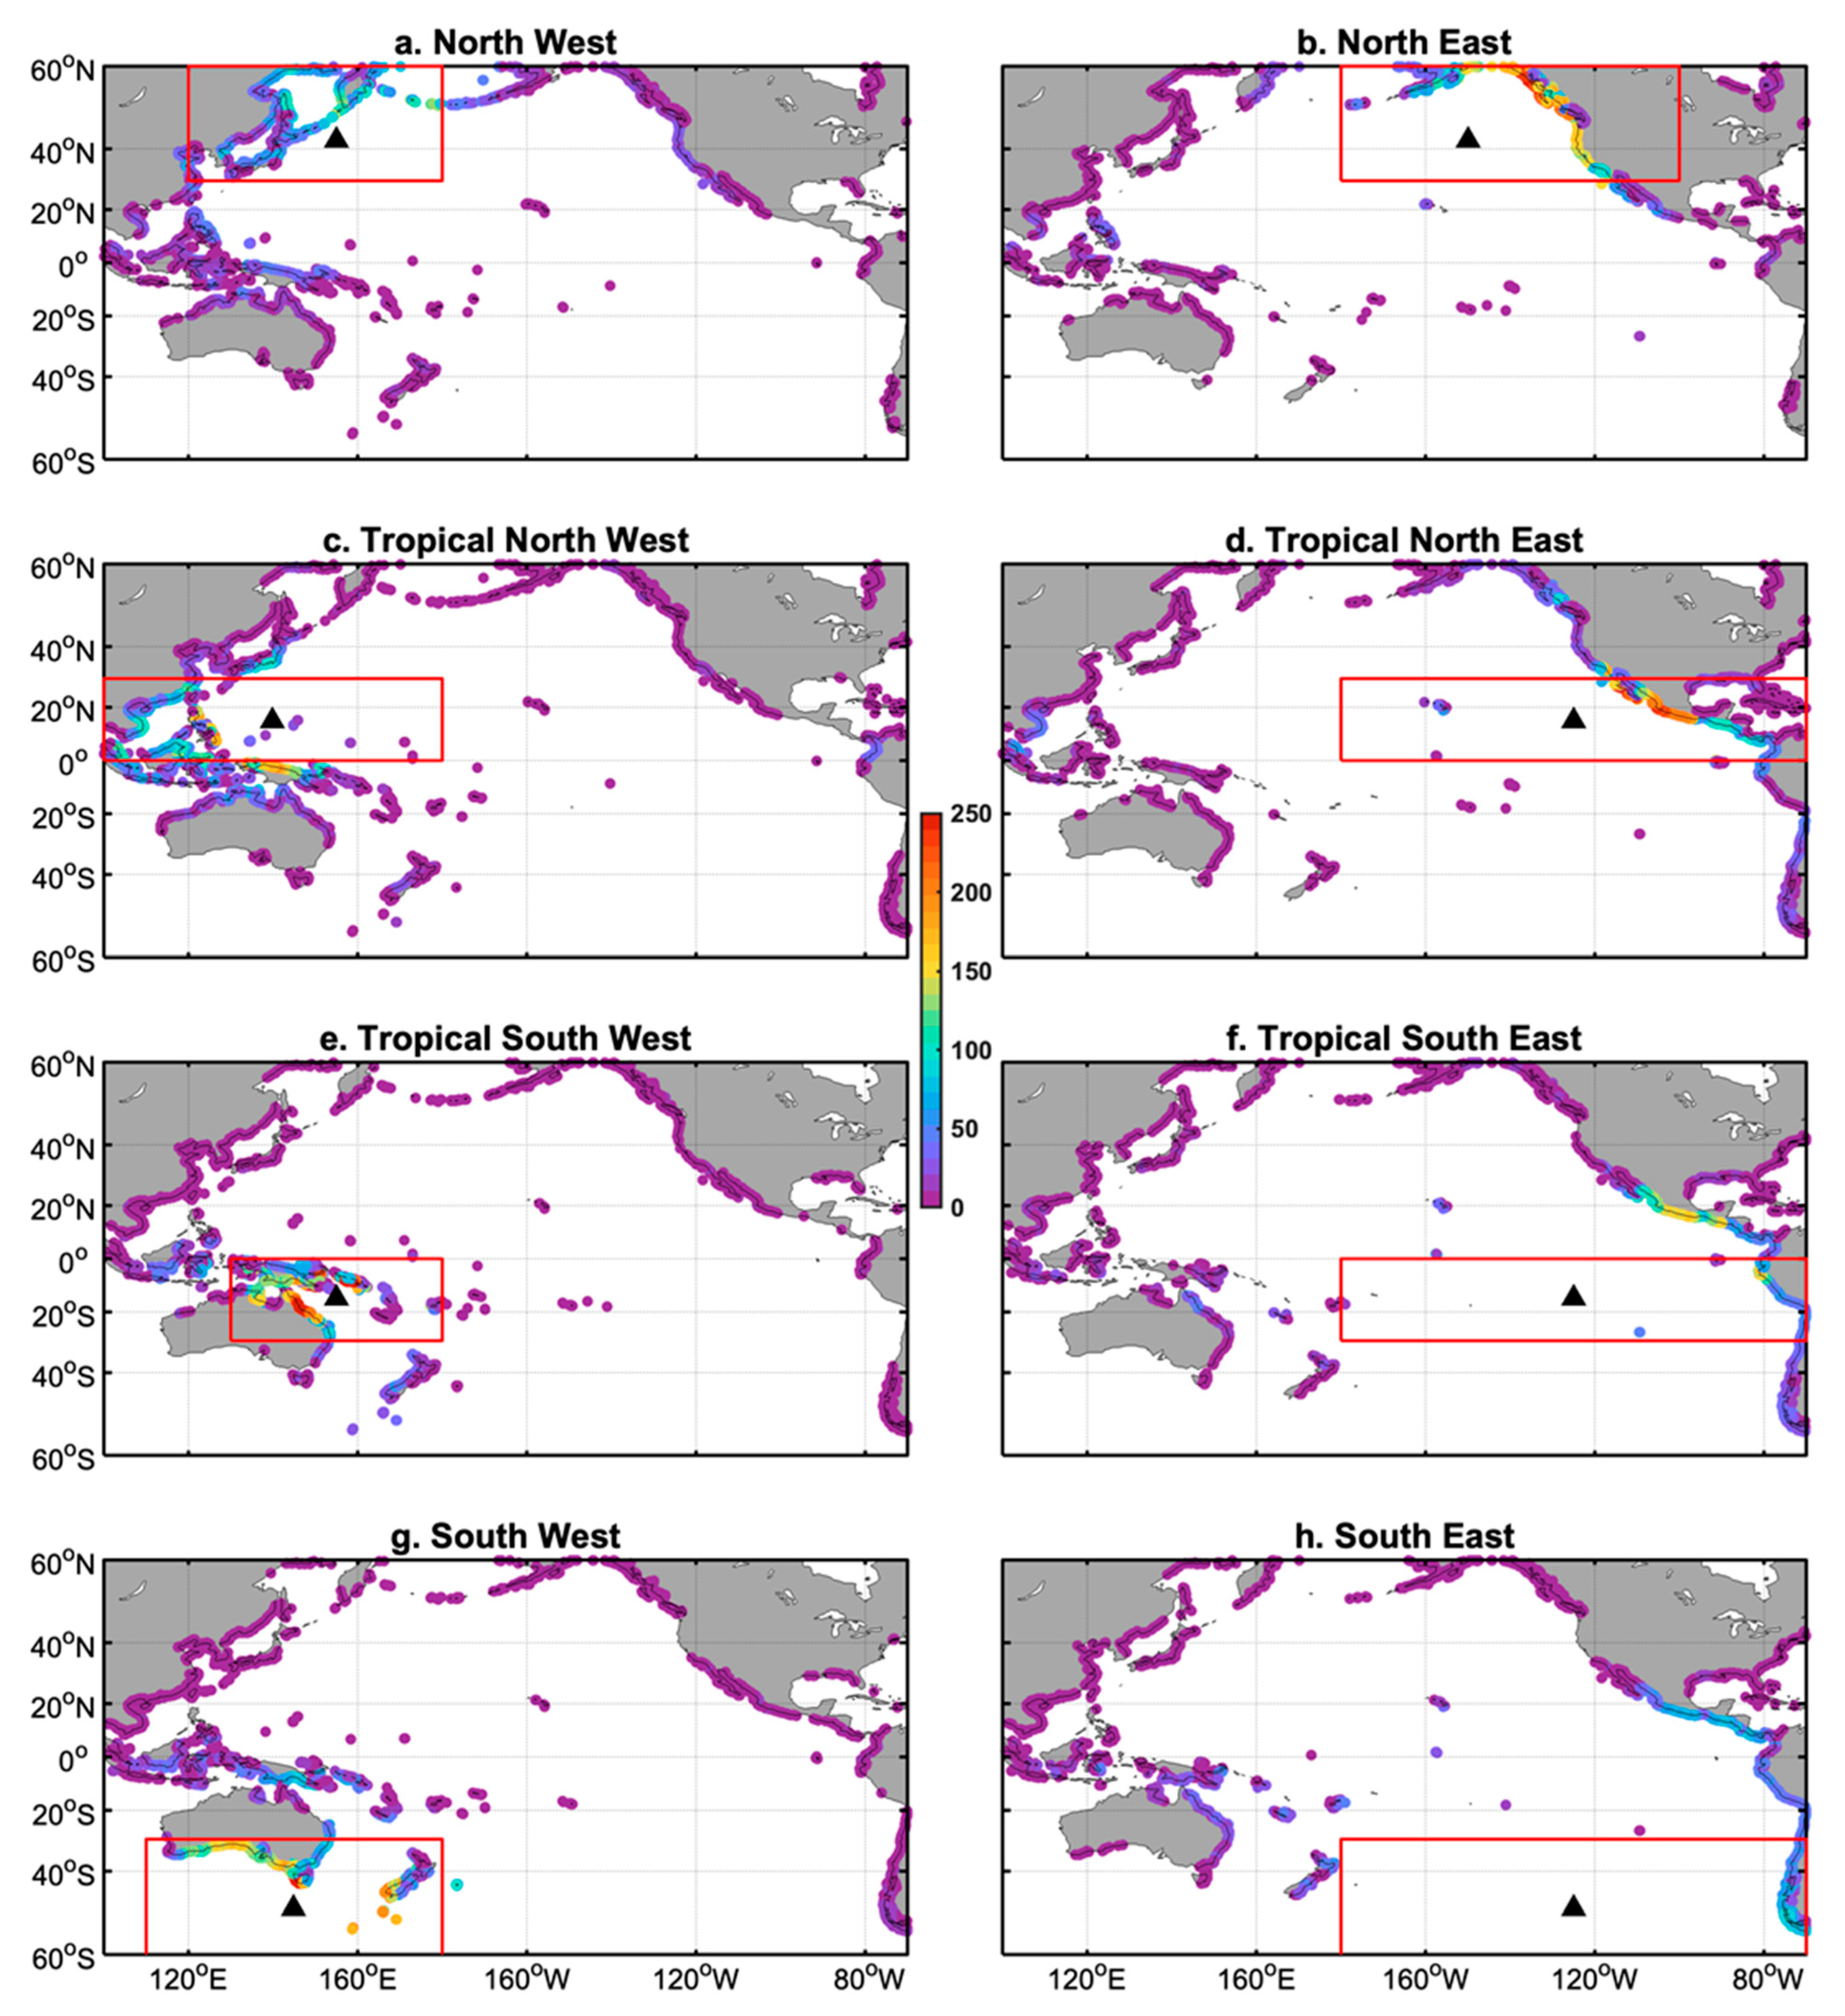
Figure 1. Climatology of 10 meters wind speeds (shading) and direction (arrows) (a) and of significant wave height (shading) and direction (arrows) (b) averaged in boreal winter (December–February, DJF) over the period 1979–2020. Panels (c) and (d) are the same but averaged in boreal summer (June–August, JJA). Delineations of open-ocean wave generation (black boxes) and coastal regions (colored dots) in the Pacific are shown in panel (b). The centroid of each open-ocean region, evaluated as the spatial barycenter of the region considering only oceanic points and represented by the black triangles in panel (b), displays the spatial origin of all extreme events occurring in this region.
Climate 09 00168 g001
Figure 2. (a) Daily wave energy (Hs2TP in m2s) timeseries (zoomed in on the period of 2015–2019) in the Pacific North-East oceanic region (black line) and extreme wave events (red dots) identified using the method described in Section 2.3. (b) Total number of extreme events detected in December–February (DJF, blue bars) and June–August (JJA, orange bars) for each oceanic region.
Climate 09 00168 g002
Figure 3. Spatial repartition around the Pacific Rim of the number of extreme coastal events that were generated in each open-ocean region (delineated by the red box in the corresponding panel) over the total period of 1979–2020. In the Pacific North-West (a), North-East (b), Tropical North-West (c), Tropical North-East (d), Tropical South-West (e), Tropical South-East (f), South-West (g), and South-East (h).
Climate 09 00168 g003
Figure 4. Mean characteristics (% of occurrence, direction of incidence and energy in m2s) of extreme wave events detected in each coastal region delineated by the colored dots in Figure 1b, i.e., the Pacific North-West coast (a), North-East coast (b), Tropical West coast (c), Tropical Islands (d), Tropical East coast (e), South-West coast (f), and South-East coast (g), according to their open-ocean origin (Pacific North-West (NW), North-East (NE), Tropical North-West (TNW), Tropical North-East (TNE), Tropical South-West (TSW), Tropical South-East (TSE), South-West (SW), and South-East (SE)).
Climate 09 00168 g004
Figure 5. Monthly mean climatology of the number of extreme coastal events along the northern (a) and southern (b) hemisphere coastlines according to their oceanic origins: Northern (thick lines) vs. Southern (dashed lines) Hemisphere and tropical (orange lines) vs. extratropical (blue lines) origins. The boreal and austral tropical cyclone seasons are shaded in light grey on panels a and b, respectively.
Climate 09 00168 g005
Figure 6. Regression of wind speed (shading) and direction (arrows) of 10 meters surface winds anomalies onto the Niño3.4 index averaged in December–February (a) in June–September (b). Only regressions significant at the 95% level according to a Student t-test are displayed. Relationships (c) between the interannual anomalies of extreme open-ocean wave occurrence in the Pacific Tropical North-East in December–February and an index characterizing the ENSO-induced meridional swing of the Northern-Hemisphere jet stream and (d) between the interannual anomalies of extreme open-ocean wave occurrence in the Pacific Tropical North-West in June–September and an index characterizing the anomalous tropical cyclone activity in the region delineated by the red box on panel b (Accumulated Cyclone Energy anomalies, “ACE anom”).
Climate 09 00168 g006
Figure 7. Regression of wind speed (shading) and direction (arrows) of 10-m surface winds anomalies onto the SAM index averaged in December–February (a), March–May (b), September–November (c), and June–August (d). Only regressions significant at the 95% level according to a Student t-test are displayed. Relationships (e) between the interannual anomalies of extreme open-ocean wave occurrence in the Pacific South-East in September–November and an index characterizing the SAM-induced zonal structure of the Southern-Hemisphere jet stream and (f) between the interannual anomalies of extreme open-ocean wave occurrence in the Pacific Tropical South-East in March–May and an index characterizing the jet-stream meandering and related strength of the southern subtropical high-pressure system.
Climate 09 00168 g007
Figure 8. Yearly accumulated anomalies (bars) and long-term linear trends (orange lines) of extreme events occurrence in the Northern (a) and Southern (b) Hemispheres. The observed trend in the Southern Hemisphere was significant at the 95% confidence level according to a Mann-Kendall test.
Climate 09 00168 g008
Table 1. Repartition (in %) of all extreme coastal wave occurrences accumulated along nine different coastal regions, delineated by the colored dots on Figure 1b, according to their oceanic origin.
Oceanic RegionsNort-WestNorth-EastTropical North-WestTropical North-EastTropical South-WestTropical South-EastSouth-WestSouth-East
Coastal Regions
North-West51%8%21%5%4%5%3%3%
North-East8%66%3%15%2%3%1%1%
Tropic North-West14%9%47%11%6%5%5%3%
Tropic North-East4%11%8%33%3%22%3%16%
Islands3%8%2%13%3%44%2%24%
Tropic South-West7%2%15%2%42%6%15%10%
Tropic South-East6%4%3%17%3%38%3%26%
South-West4%1%6%2%15%4%58%9%
South-East1%1%3%14%2%22%8%48%
Table 2. Correlations between seasonally averaged interannual anomalies of extreme wave occurrence averaged in different open-ocean regions and climate modes. Correlations significant at the 95% level according to a Student t-test are displayed in bold.
Oceanic RegionsNorth-WestNorth-EastTropical North-WestTropical North-EastTropical South-WestTropical South-EastSouth-WestSouth-East
Climate Modes (Season)
Niño3.4 (DJF)−0.020.30−0.090.550.100.320.06−0.13
Niño3.4 (JJAS)0.320.130.600.230.25−0.130.43−0.10
SAM (DJF)−0.25−0.050.020.070.080.100.210.34
SAM (MAM)0.20−0.020.240.280.280.490.380.38
SAM (JJA)−0.13−0.140.050.190.180.200.470.27
SAM (SON)−0.350.01−0.11−0.050.000.13−0.060.39
Publisher’s Note: MDPI stays neutral with regard to jurisdictional claims in published maps and institutional affiliations.