Article

Ecosystem Services Provided by Urban Forests in the Southern Caucasus Region: A Modeling Study in Tbilisi, Georgia

1
Faculty of Social and Political Sciences, Ivane Javakhishvili Tbilisi State University, 1 Ilia Tchavtchavadze Avenue, Academic Building I, Tbilisi 0179, Georgia
2
Institute of Research on Terrestrial Ecosystems (IRET), National Research Council (CNR), Via G. Marconi 2, 05010 Porano, Italy
*
Author to whom correspondence should be addressed.
Climate 2021, 9(11), 157; https://doi.org/10.3390/cli9110157
Submission received: 30 September 2021 / Revised: 22 October 2021 / Accepted: 26 October 2021 / Published: 28 October 2021
(This article belongs to the Special Issue Climate Ecosystems Nexus)

Abstract

:
All cities globally are growing considerably as they are experiencing an intensive urbanization process that leads to high soil consumption and pollution of environmental components. For this reason, cities are required to adopt measures to reduce these impacts and tree planting has been suggested as a cost-effective strategy. In our study, we implemented for the first time in a Southern Caucasus city the i-Tree Eco model to quantify the main ecosystem services provided by urban forests. Trees in two parks in Tbilisi, EXPO Park (694 trees) and RED Park (1030 trees), have been measured, and a model simulation was performed for the year 2018. These green infrastructures store large amounts of carbon in their woody tissues (198.4 t for EXPO Park and 126.5 t for RED Park) and each year they sequester 4.6 and 4.7 t of CO2 for EXPO Park and RED Park. They also remove 119.6 and 90.3 kg of pollutants (CO, NO2, O3, PM2.5, SO2), and reduce water runoff of 269.5 and 200.5 m3, respectively. This analysis highlights the key role of urban forests in improving the environmental sustainability of the city of Tbilisi and provides important decision support for tree species selection in this geographic area.

Graphical Abstract

1. Introduction

The fast urbanization process occurring globally has emphasized the importance of interactions between people and nature. Urbanization has enhanced human detachment from nature and drastically reduced natural areas inside city limits. Green spaces such as parks, gardens, and tree-lined streets are typically the only chance for citizens to enjoy and connect with nature [1] and supply essential services for people and the environment [2].
Currently, urbanized areas (built-up areas with human settlement and high population density) cover only a small fraction of the global surface area, ranging from approximately 1% to 3% [3], although they account for a large share of anthropogenic impacts on the biosphere [4]. Urban sprawl (a city development without proper planning) causes large negative effects on the environment in terms of increased energy consumption, greenhouse emissions and degradation of the natural environment [5]. Cities produce only a small fraction of total goods and ecosystem services compared to the ever-increasing demand from urbanized areas [6], where half the global population currently lives and about 60% of humanity will live in 2030 [5].
The major threat to urbanized areas is posed by climate change, and cities are expected to be among the most affected ecosystems [7]. Urban areas are characterized by high-levels of air pollution caused by anthropogenic sources such as from stationary (manufacturing, home heating, energy generation, other industrial sources) and mobile sources (automobiles and transport) [8]. In addition to polluted air, the Urban Heat Island Effect (UHI) contributes to increased temperatures in cities, further deteriorating the negative results of global climate change [9]. Urban expansion plays significant role in changing and degrading rural lands surrounding the urban areas, resulting in large-scale land acquisitions for new development, changes in land use status, and further inclusion of semi-natural and agricultural lands in urban sprawl, as a collateral process of the intensive urbanization [10].
Urban forests and green spaces contribute to the uptake of carbon dioxide, remove gaseous pollutants and fine particulate matter from the air [11], mitigate extreme temperatures [12] by shading and evapotranspiration [13], and slow down soil erosion processes, reducing water run-off and facilitating the filtration process in the soil [14]. Furthermore, urban trees can reduce stormwater runoff, which is particularly evident in cities due to the high presence of impervious areas, through canopy rainfall interception, soil water infiltration, and evapotranspiration [15], reducing flood hazards [16]. They also preserve the animal and plant biodiversity, promoting the pollination process and the biological control of populations [17], and the presence of mixed vegetation and tree cover in city settlements provides a significant barrier to reducing and masking offensive noise from busy urban areas [18]. In addition to environmental services, urban green spaces have an important social function as they are essential recreational and cultural spaces for the city [19], providing positive impacts on human health and wellbeing [20].
Most studies on ecosystem services and urban greenery come from the USA, UK, Australia, Germany, and China [21], and are focused on North American, Western/Central European, East Asian, and Australian countries/territories. At the same time, the research about these topics is very rare in Southern/Eastern Mediterranean countries [22] and in the former Soviet states, especially in the South Caucasus region.
Forests in Georgia cover an area of 2.6 million hectares, which represents 40% of the land area, a value comparable to European average [23]. Around 95–98% of Georgian forests are natural and about 98% are located on the slopes of the Greater and Smaller Caucasus Mountain ranges [24].
During the last two centuries, Tbilisi has experienced several phases of urban development and expansion, transforming from a strategically located trading town into a city with over a million inhabitants, with its own distinctive culture and an important socio-economic role in the Caucasus. Along with the processes of economic downfall, nationalism, and dramatic changes of the social fabric, which are characteristic of the post-Soviet transition process (in the states of former USSR), Tbilisi today is a modern globalized metropolis. The expansion of Tbilisi’s territory started during the Soviet Era (1921–1991), when intensive urbanization occurred and the municipal area increased tenfold, and the population sixfold [25].
The urban green spaces of Tbilisi are mainly represented by man-made and natural green zones, such as parks, public gardens, and tree-lined streets. Green areas include about 145 km2, which is 28.9% of the total area of Tbilisi Municipality (502 km2), and are lower than the impervious (i.e., urbanized) areas (158 km2, or 31.47% of the total) [26]. Other land use areas of Tbilisi municipality include water bodies (2.86% of total), agricultural lands (3.29% of total) and the category of other areas (32.88%), comprising bare soil, rocks, grassland, etc. [27]. Moreover, the major parks (Mtatsminda Park, Lisi Lake Park and Tbilisi Dendrological Park) in Tbilisi are mainly located in suburbs and places with complex topography, and therefore are difficult for the population to access on a daily basis.
The impact of climate change in Georgia and Tbilisi was recently discussed by the United Nations Framework Convention on Climate Change [28], reporting a 1.3 °C increase in average temperature (12.7 °C) and 60 mm in annual precipitation (about 500 mm annual rainfall) over the past 25 years (1990–2015). The highest greenhouse gas emitting categories in Georgia are transport (38%), oil and natural gas (17%), energy industries (15%), manufacturing industries and construction (10%) and other sectors (18%) [28].
The transport sector is a major air polluter in Tbilisi, the main hub of social and economic activities in Georgia (51.2% of Gross Domestic Product of Georgia) [29]. The increasing number of second-hand passenger vehicles, manufactured before the year 2000 (48% of approximately 1.4 million vehicles, registered in the country) is further exacerbating the air quality. According to air pollution data of 2017, the average annual concentration of particulate matter in some locations of Tbilisi exceeded, in given periods, the EU standard norm for PM2.5 and PM10 in ambient air (0.025 mg/m3 and 0.04 mg/m3, respectively). High concentrations of particulates have been detected near construction sites (1.5 of the standard norm) and busy urban road intersections [30].
In Georgia’s context, until recent years, green infrastructure as an essential part of the complex and diverse fabric of the city was not considered as part of the agenda for urban spatial planning, design and/or as a necessary tool for city resilience. However, in 2019, the Tbilisi Land Use Plan was approved, including priorities for urban green infrastructure development. This document envisages the protection of natural and man-made landscapes, supporting their protective and restorative functions, enhancing biodiversity protection measures, and minimizing natural and industrial hazards. Furthermore, the increase in and development of new green recreational areas along the Kura River and in densely populated residential zones is also planned. In this regard, Tbilisi City Hall adopted a list of recommended tree species, best suited to the Tbilisi municipal landscape and climate, as a guidance for urban green infrastructure planning and development, distinguishing tree species marked as “priority” species, and others, marked as “recommended” [31].
This study aims to evaluate and quantify the air quality and climate-related ecosystem services of two public parks of Tbilisi and the role of urban forests in improving the environmental quality of the city. The analysis has been carried out using i-Tree Eco model, which for the first time has been applied in a scientific study of urban ecosystem services in the South Caucasus. This software uses detailed field-measured tree data to calculate urban forest structure and the multiple ecosystem services they provide to the city. The model is widely used because of its adaptability to add new locations, it is freely available, and requires no programming experience for parametrization compared to other models (ENVI-met, CFD) [32]. Based on this thorough assessment of the multiple environmental benefits of urban trees, most common species were evaluated and compared, for a detailed selection for future afforestation programs.

2. Materials and Methods
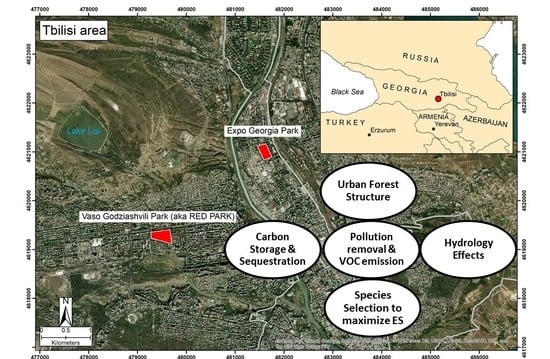
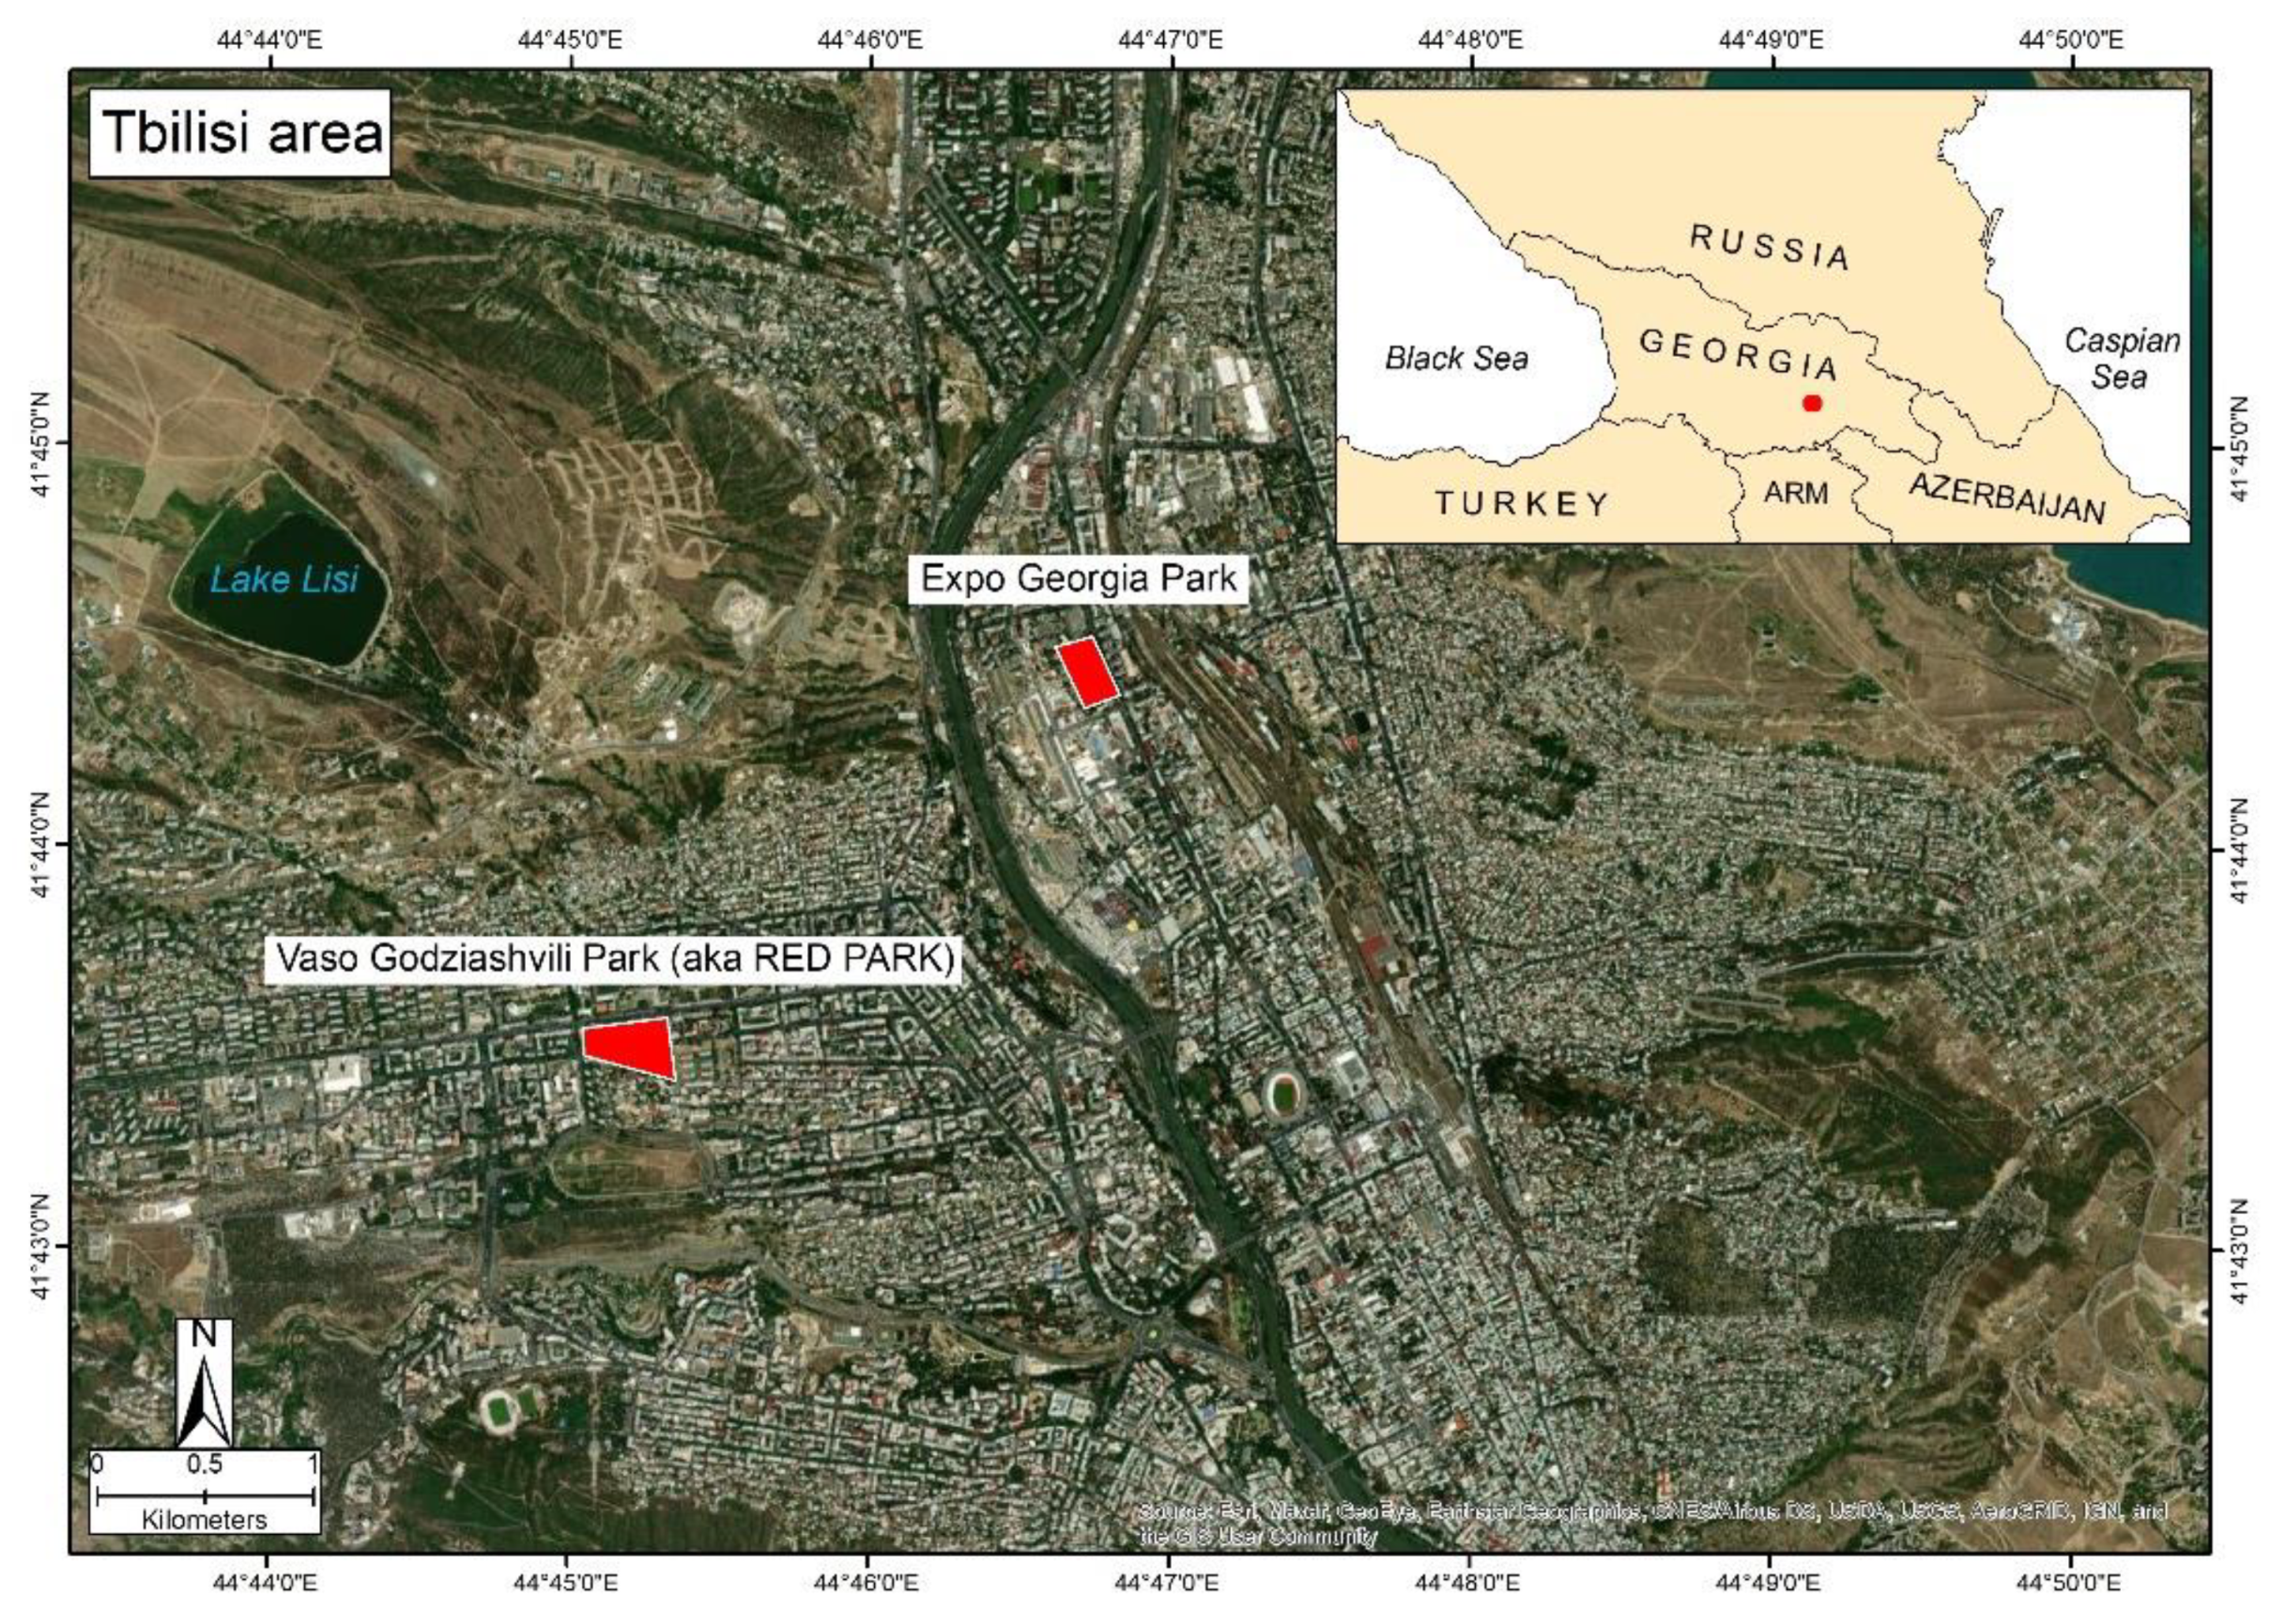
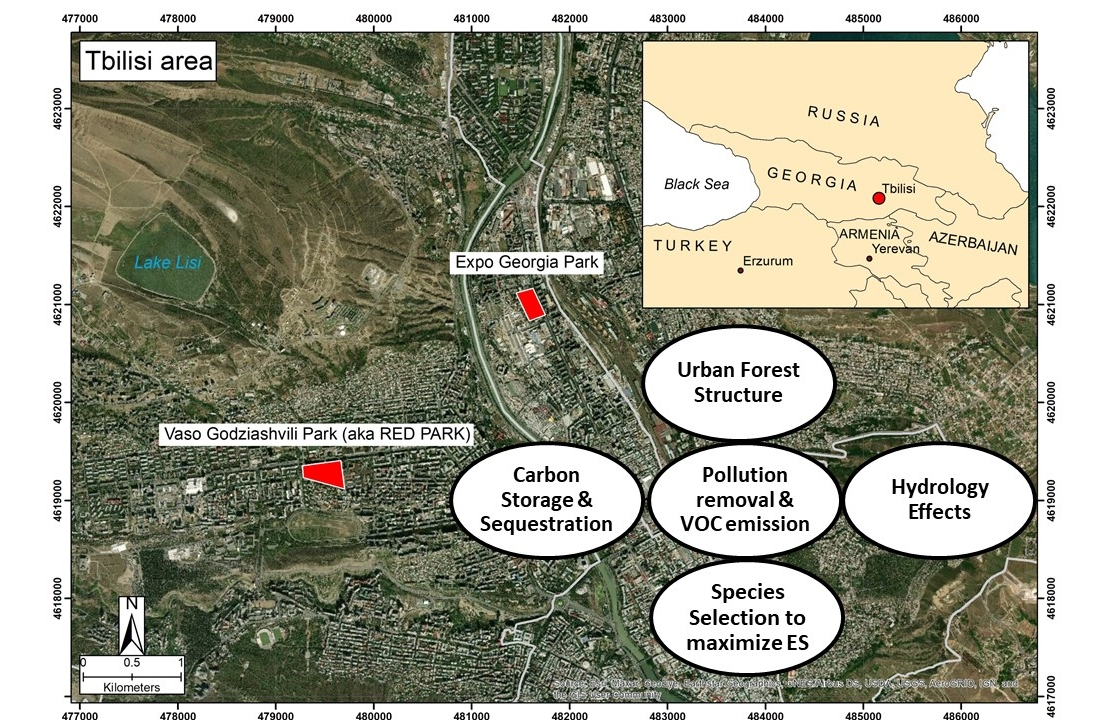
2.1. Study Area

The city of Tbilisi presents a stretched geographical layout (from North to South-East), with most of the built-up area squeezed between the mountains. In 2019, Tbilisi Municipality had a population of 1.171 million inhabitants, which is about 31.45% of the total population of Georgia (3.723 million in 2019) [33].
Tbilisi is situated in the valley terraces of the Mtkvari (Kura) river at altitudes of 410–370 m above sea level (a.s.l.). The Mtkvari river divides the city into two distinct parts, the left and right banks, surrounded by the mountain gorges. On the right bank, the Trialeti Range (770 m, part of the Lesser Caucasus Mountains) sharply descents to the river valley shaping the highest part of the city, while the left bank is limited by the Makhata mountain (630 m) forming the widest part of the river valley.
Tbilisi has a humid subtropical climate (Köppen climate classification: Cfa) with considerable continental and semi-arid influences. The average annual temperature is 12.7 °C, with average temperature of 0.9 °C in January, and 24.4 °C in July. The absolute minimum and maximum temperatures, historically recorded, were −23 °C, and +40 °C. The annual precipitation varies from 400 to 560 mm. The rainiest month is May (90 mm), and the driest month is January (about 20 mm). The snowfalls may happen for 15–25 days per year, without forming a stable snow cover. Tbilisi has experienced many catastrophic events due to heavy rains; on 6 June 1969, 330 mm of rain (more than half of the annual amount) fell in 3 h. The most recent flash flood was recorded on 13 June 2015, which, accompanied by the destructive flooding of Tbilisi Zoo with human and animal fatalities [34]. North-westerly winds dominate in most parts of Tbilisi throughout the year, but south-easterly winds are common as well. Generally, given the proximity of The Greater Caucasus Mountains Range (further to the north), which prevents the intrusion of cold air masses from Russian planes, Tbilisi experiences a mild and pleasant climate.
The study area includes two urban forests, Vaso Godziashvili Park (also known as a ‘RED Park’) with a total area of around 3.3 ha (on the right bank of the river Kura, 455 m a.s.l.), and Expo Georgia Park with an area of around 3.2 ha (on the left bank of the river Kura, 418 m a.s.l.). They are located within the urban area of Tbilisi and are 2.7 km apart from each other (Figure 1).
These two parks were designed in the 1950s–1960s. RED Park is an urban public park, developed in the densely populated district of Saburtalo and mainly used for recreational and sports activities. EXPO Park is located in the Didube district and is a part of Georgia EXPO, an exhibition space owned by a private company with free access for the public. The area of EXPO Georgia consists of buildings, exposition pavilions and the park, created for the exhibition space in 1958.

2.2. Tree Inventory

Field work was conducted during the 2019 growing season (July–September) and was designed according to the i-Tree Eco v6 guidelines [35]. A complete tree inventory was sampled in both RED Park (Vaso Godziashvili Park) and EXPO Park (EXPO Georgia Park). This project approach allows to quantify the complete structure of the urban forest and calculate a total output for each ecosystem service. Tree parameters collected from field data included species identification (scientific names), diameter at breast height (DBH), tree height, height to live top of crown, crown base height, crown width, percentage of canopy missing (relative to crown volume), percentage canopy dieback, and crown light exposure [36]. Model equations are described in detail in Nowak 2020 [37].

2.3. Model Settings

The city of Tbilisi was introduced in the i-Tree database, including location information, weather and pollution data, and is openly available in the software for simulations (http://www.itreetools.org/ accessed on 1 August 2021).
Model simulation was performed for 2018, the latest year available in i-Tree Eco, using hourly meteorological data (air temperature, radiation, wind speed) registered at the Tbilisi Airport weather station (Tbilisi/Lochini Airport) and hourly precipitation data, provided by the National Environmental Agency (NEA) of Georgia.
Hourly air pollution concentration data (2018) were provided by NEA, from the operational monitoring station at Kazbegi Avenue in Tbilisi. The station is located at the entrance of RED Park, ensuring accurate data for air pollution concentration of O3, NO2, SO2, PM10 and PM2.5 (fine particulate matter that is 10 microns and with a diameter equal or less than 2.5 microns). Tree inventory information, air pollution concentrations, and meteorological data were processed using i-Tree Eco software (i-Tree Eco v6).
These two datasets (Supplementary Materials) were used to analyze ecosystem services provided by urban forests in sequestering and storing the carbon, improving the air quality (pollution removal), and avoiding rainwater runoff.
Finally, the performance of tree species occurring in these parks and selected for future reforestation programs in the city of Tbilisi in providing environmental services was evaluated and compared based on the model results.

3. Results

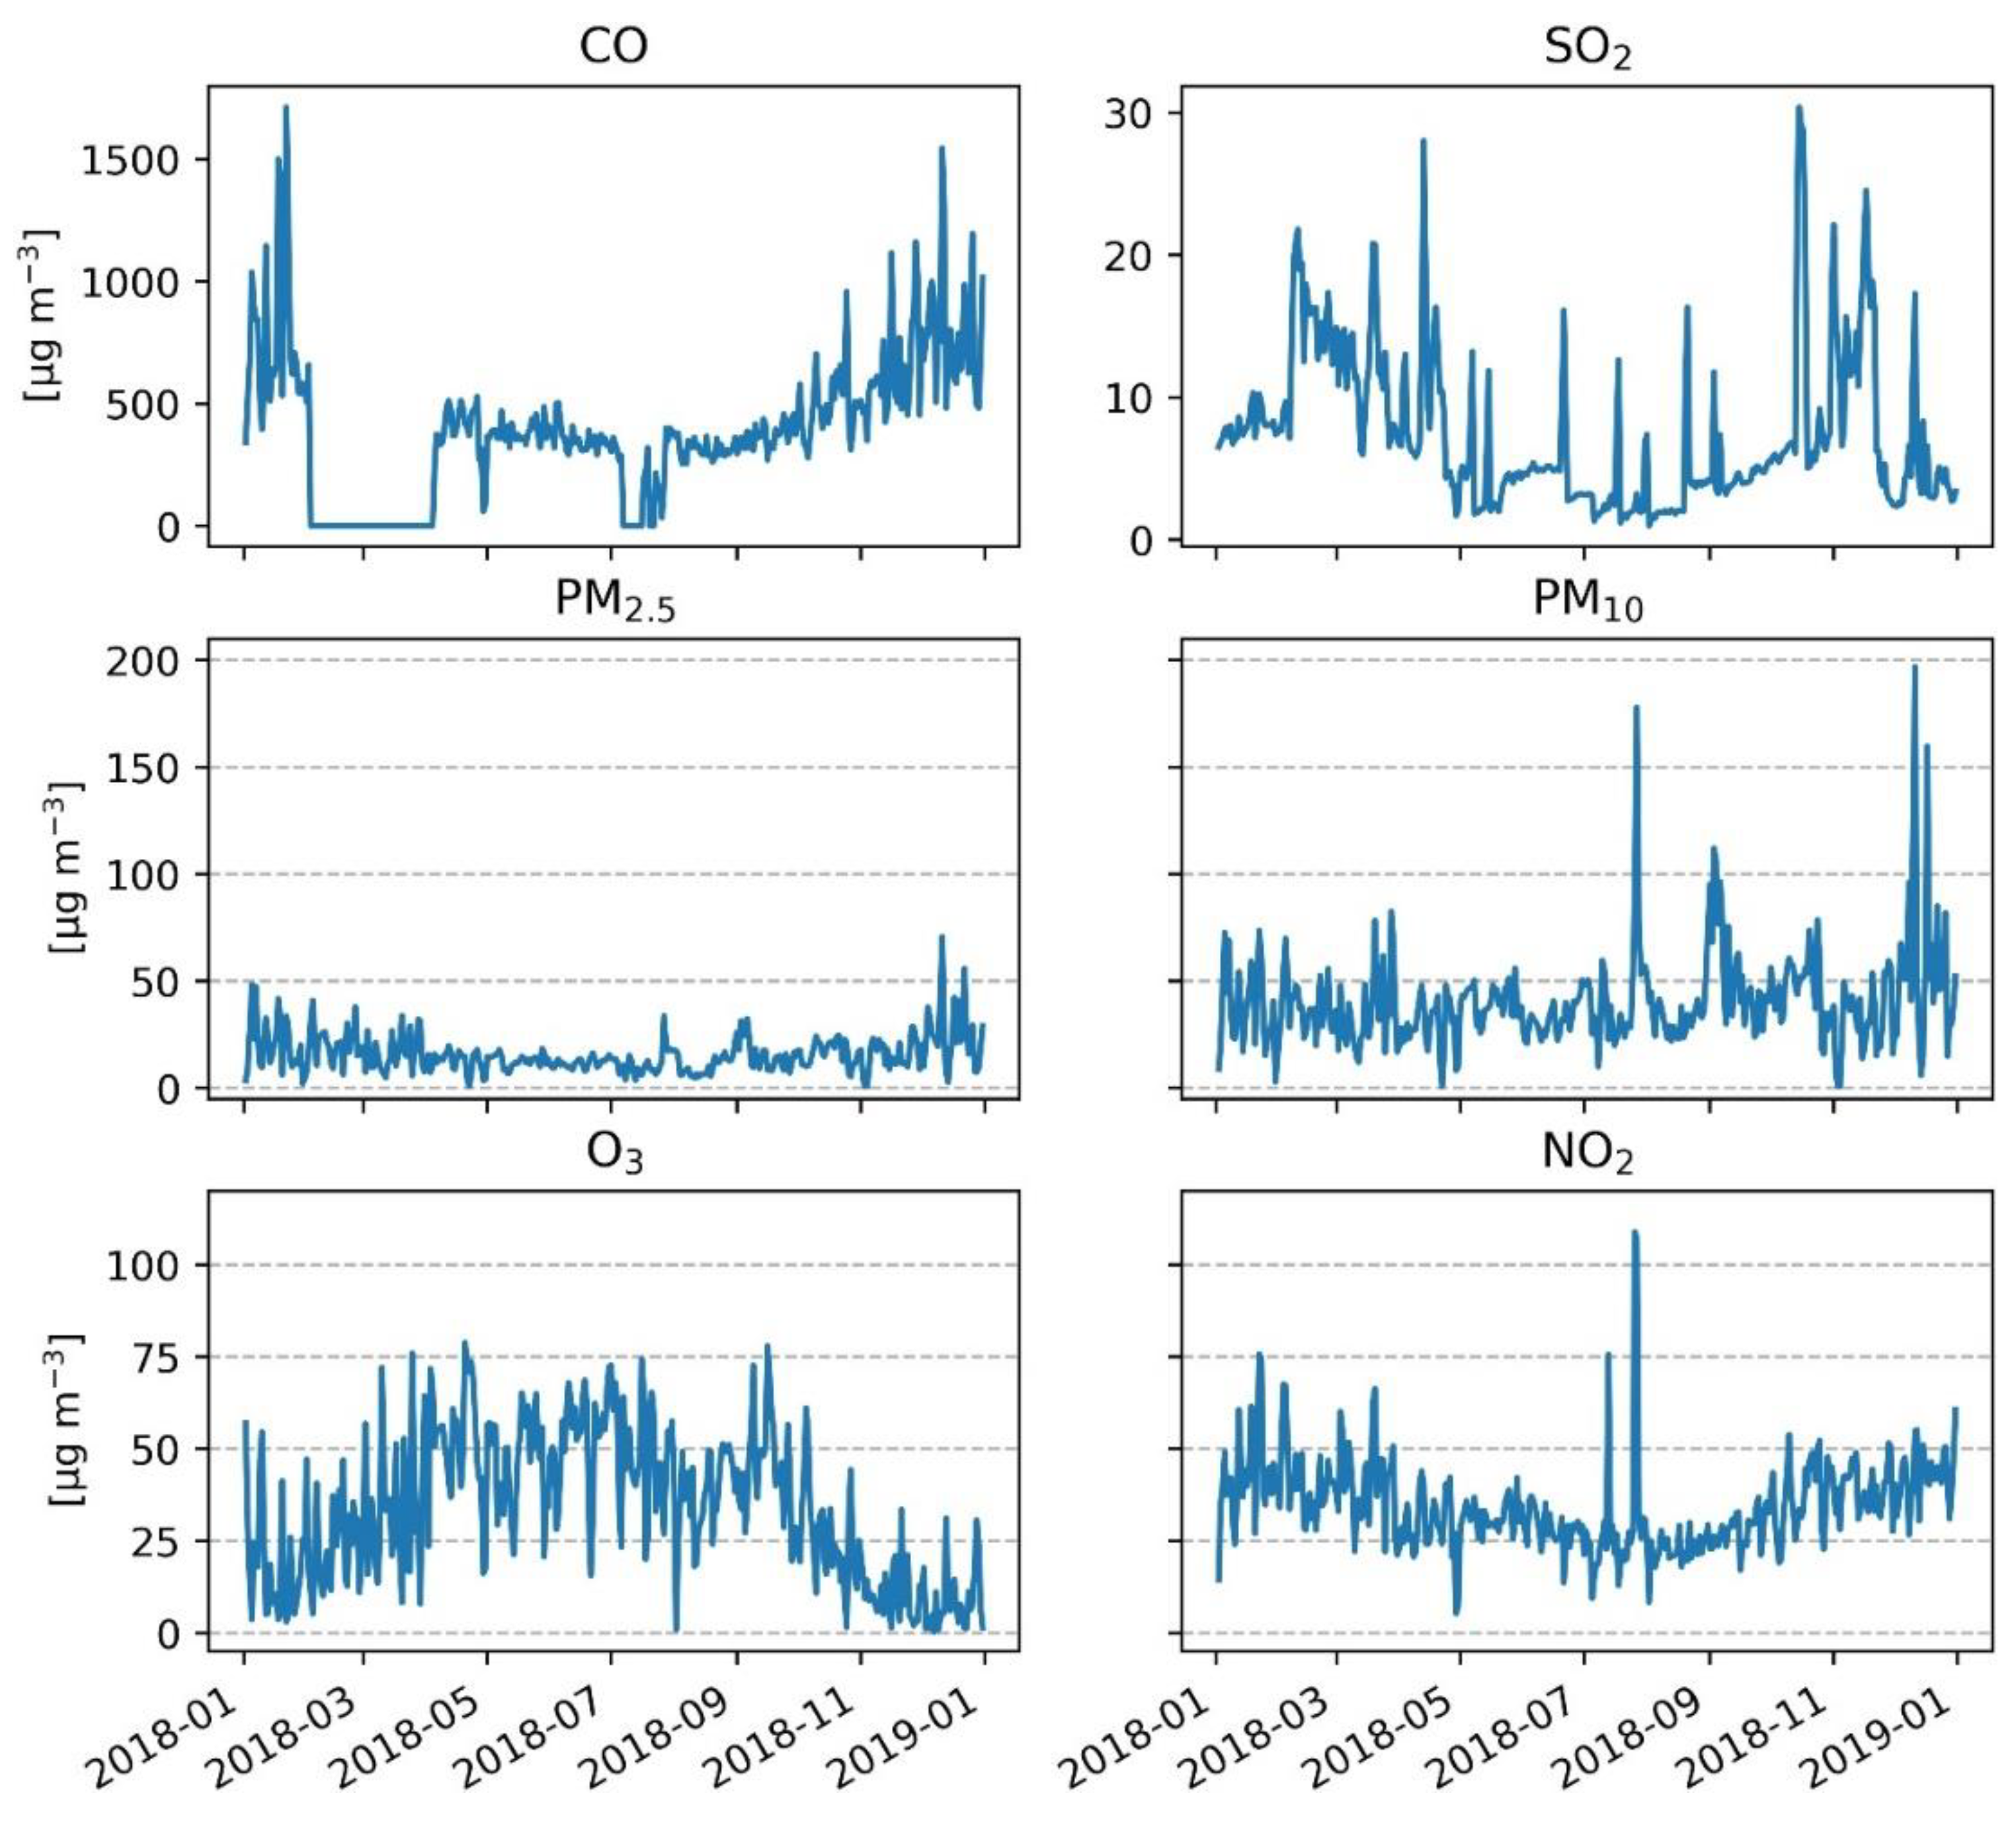
3.1. Weather and Pollution Data

In 2018, the average daily temperature in Tbilisi was 15.3 °C, with a minimum daily average at the end of December (−0.6 °C) and a maximum in July (31.2 °C). The mean Photosynthetically Active Radiation (PAR) was 330.1 W m−2, with the lowest value in December (77.5 W m−2) and the highest in June (572.5 W m−2). Precipitation was distributed relatively evenly (a monthly average of 33 mm) though with seasonal features, with maximums in June, August, and November (73.2, 64.4, 63 mm, respectively), and the lowest value in February (6.2 mm) (Figure 2).
The average CO concentration in 2018 was 388 µg m−3 with higher values in the winter months (max value = 1712.5 µg m−3). SO2 showed average values of 7 µg m−3 with frequent peaks during the year up to 30.4 µg m−3. The concentration of PM2.5 and PM10 was relatively constant throughout the year (15.8 and 40.3 µg m−3 on average, respectively) with the highest values in December (70.8 and 196.9 µg m−3, respectively). Additionally, another peak (177.9 µg m−3) was registered for PM10 on 27 July due to the spread of the dusty air masses from the south in all Eastern Georgia, including Tbilisi (NEA, Georgia). O3 annual mean was 33.8 µg m−3 with higher values in spring and summer (max value = 78.8 µg m−3). On the other hand, NO2 showed an opposite trend with higher values in the winter months (75.7 µg m−3) and an annual average of 34.5 µg m−3. A peak concentration of NO2 (108.8 µg m−3), as with PM10, was recorded on 27 July (Figure 3).

3.2. Urban Forests

For the evaluation of ecosystem services provided by urban forests, we analyzed their structural characteristics. A total of 1030 trees (tree cover: 1.5 ha) for RED Park (Table 1) and 694 trees (tree cover: 1.8 ha) for EXPO Park (Table 2) were measured.
In RED Park there are 52 different tree species. The most common tree species are Italian cypress (Cupressus sempervirens, 12.1% of total tree population), Pomegranate (Punica granatum, 7.9%), Arizona cypress (Cupressus arizonica, 7.7%) and Oriental arborvitae (Platycladus orientalis, 7.7%). The overall tree density in RED Park is 312 trees/ha with a tree cover of 44.3%. Dominant species in terms of canopy cover, leaf area, and basal area are Deodar cedar (Cedrus deodara), Italian cypress (C. sempervirens), White poplar (Populus alba), and Oriental plane tree (Platanus orientalis) (Table 1).
EXPO Park’s tree population includes 62 different species. The most abundant species are Italian cypress (16.7% of total), Deodar cedar (8.4%), and Horse chestnut (Aesculus hippocastanum) (7.8%). The overall tree density in EXPO Park is about 217 trees/ha with a tree cover of 55.8%. Dominant species in terms of canopy cover, leaf area, and basal area are the Deodar cedar, Italian cypress, Oriental plane tree, and Horse chestnut (Table 2).

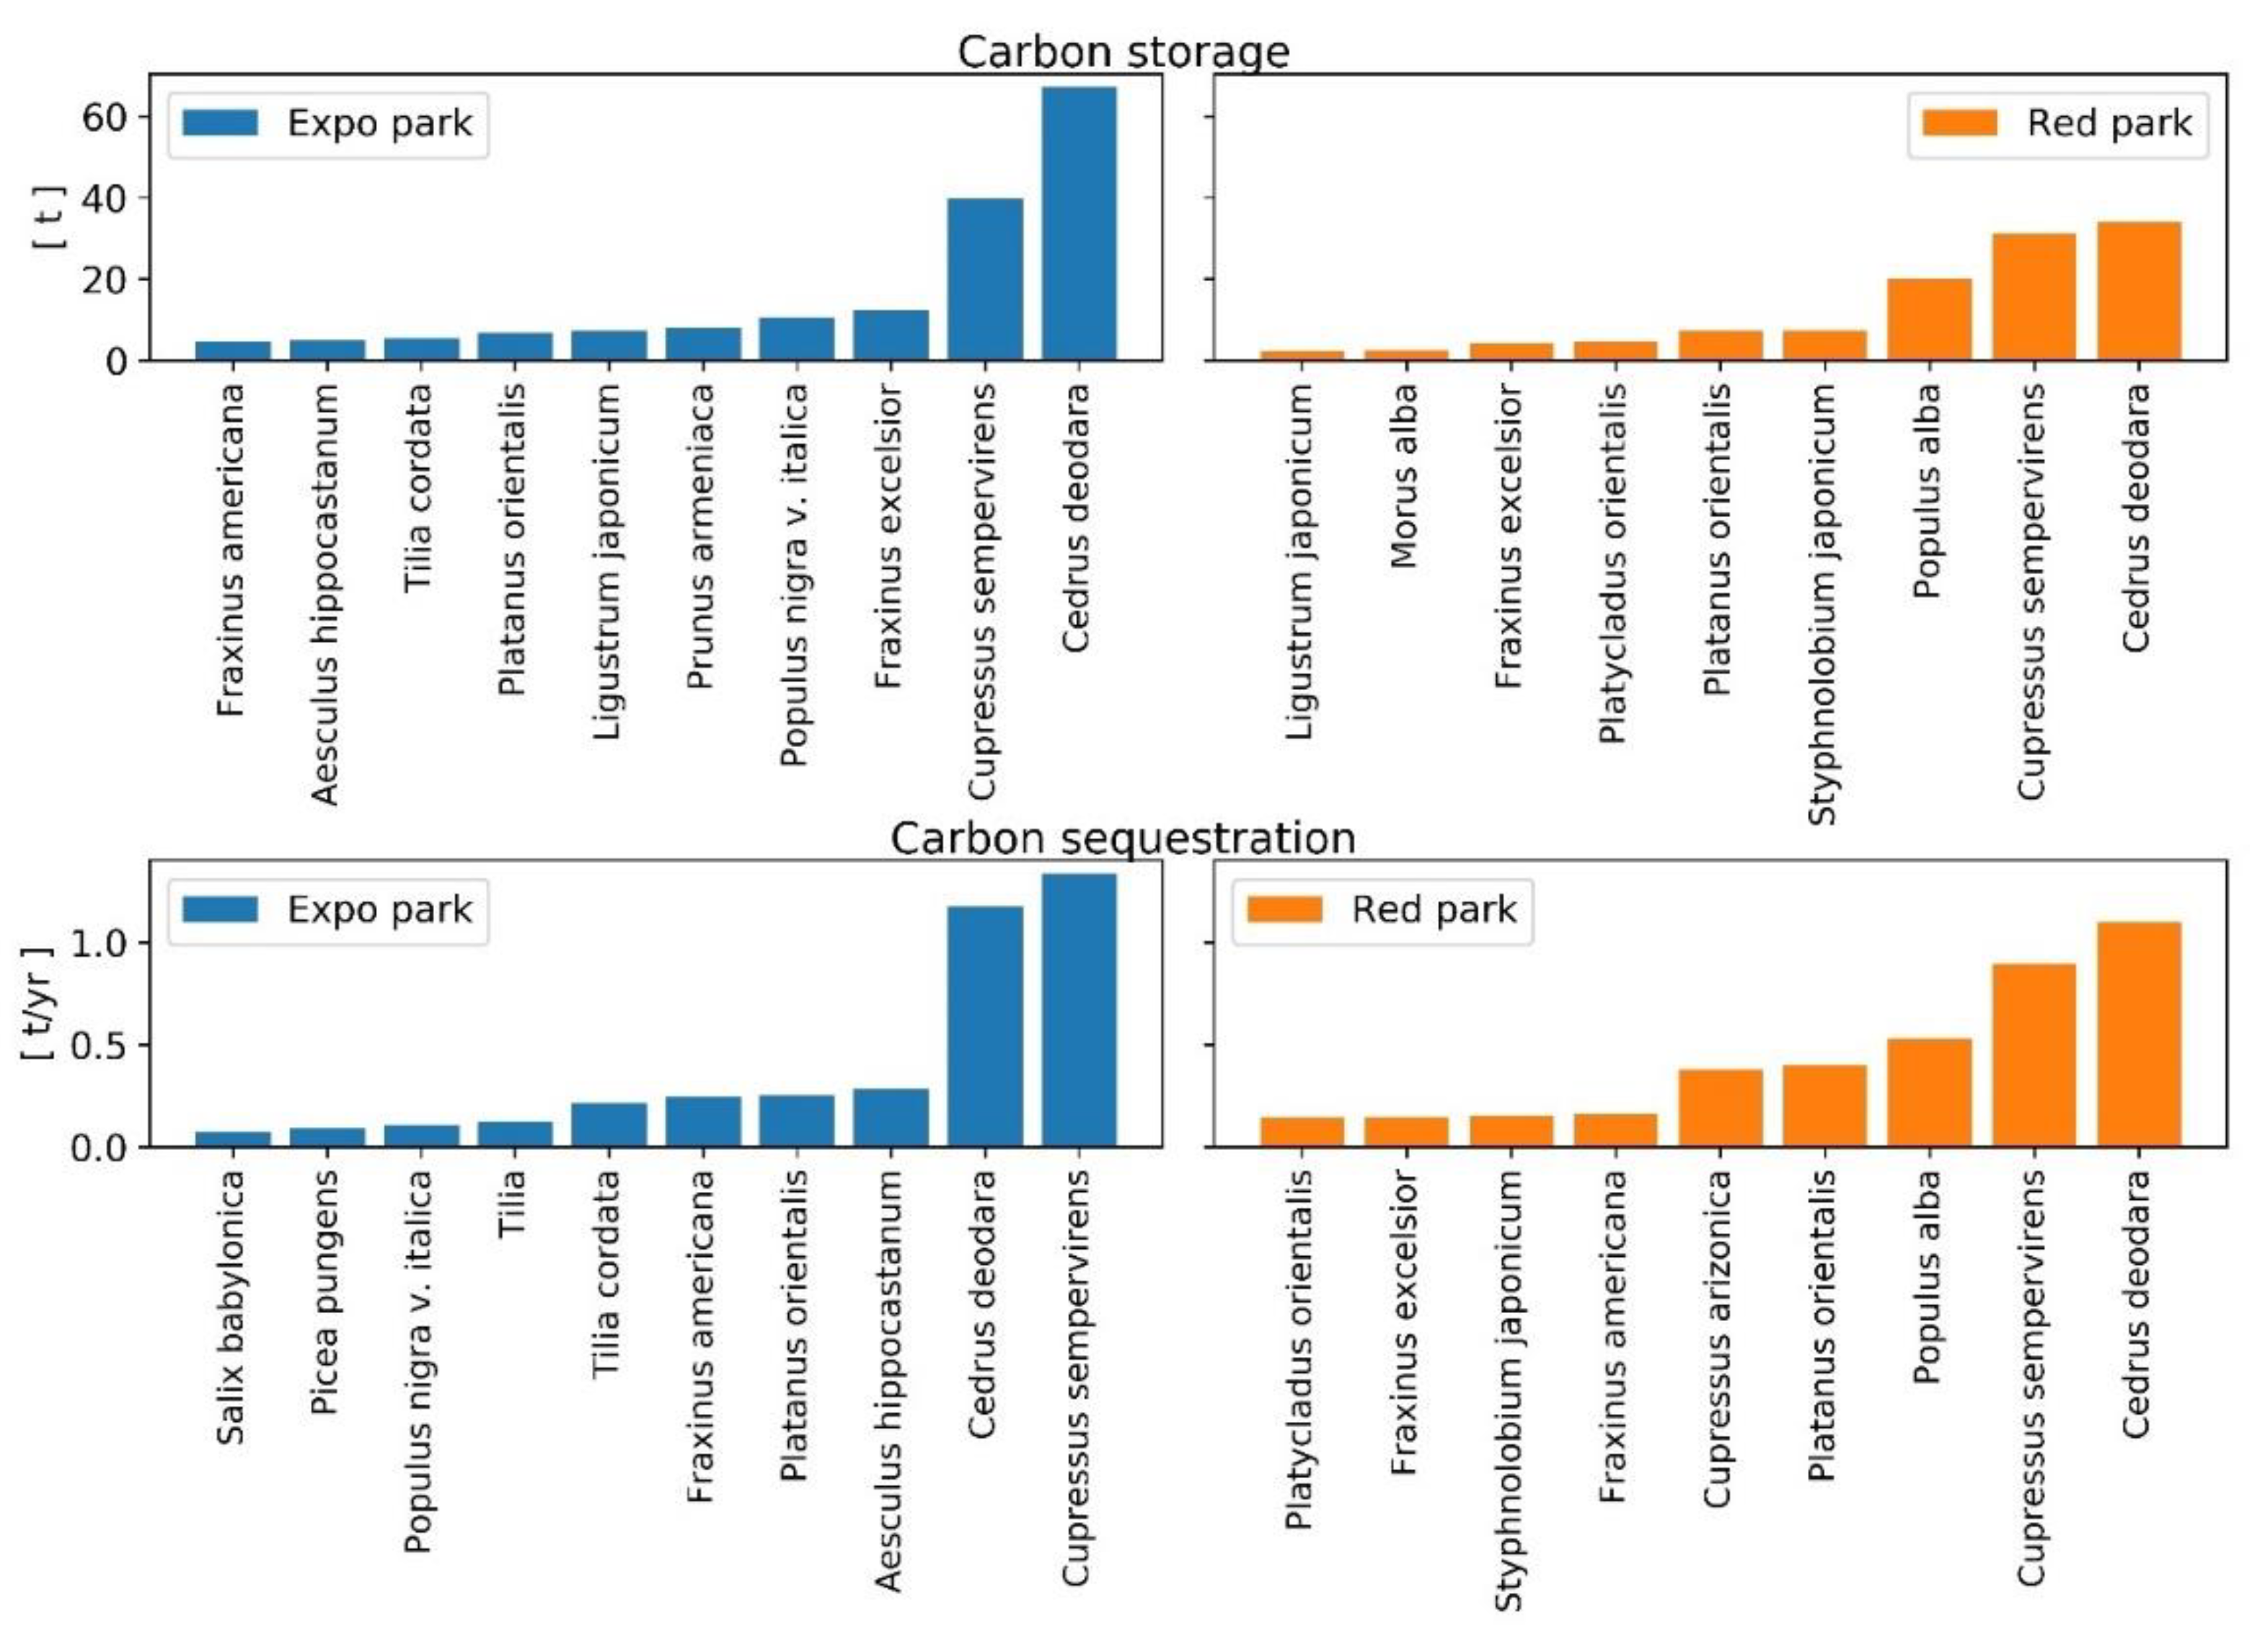
3.3. Carbon Storage and Sequestration

Trees are estimated to store 126.5 and 198.4 t of carbon in RED and EXPO Parks, respectively. C. deodara (27%), C. sempervirens (24.6%), and P. alba (15.8%) are the species that accumulated the most carbon in RED Park. In EXPO Park, C. deodara (33.8%) and C. sempervirens (20%) store more than half of the total carbon (Figure 4).
The gross sequestration is about 4.7 and 4.6 t of carbon per year for RED and EXPO Parks, respectively. Similar to carbon storage, C. deodara (23.4%), C. sempervirens (19.1%), and P. alba (11.3%) in RED Park; and C. sempervirens (29%) and C. deodara (25.6%) in EXPO Park, are the species that sequester more than half of the total carbon per year (Figure 4).

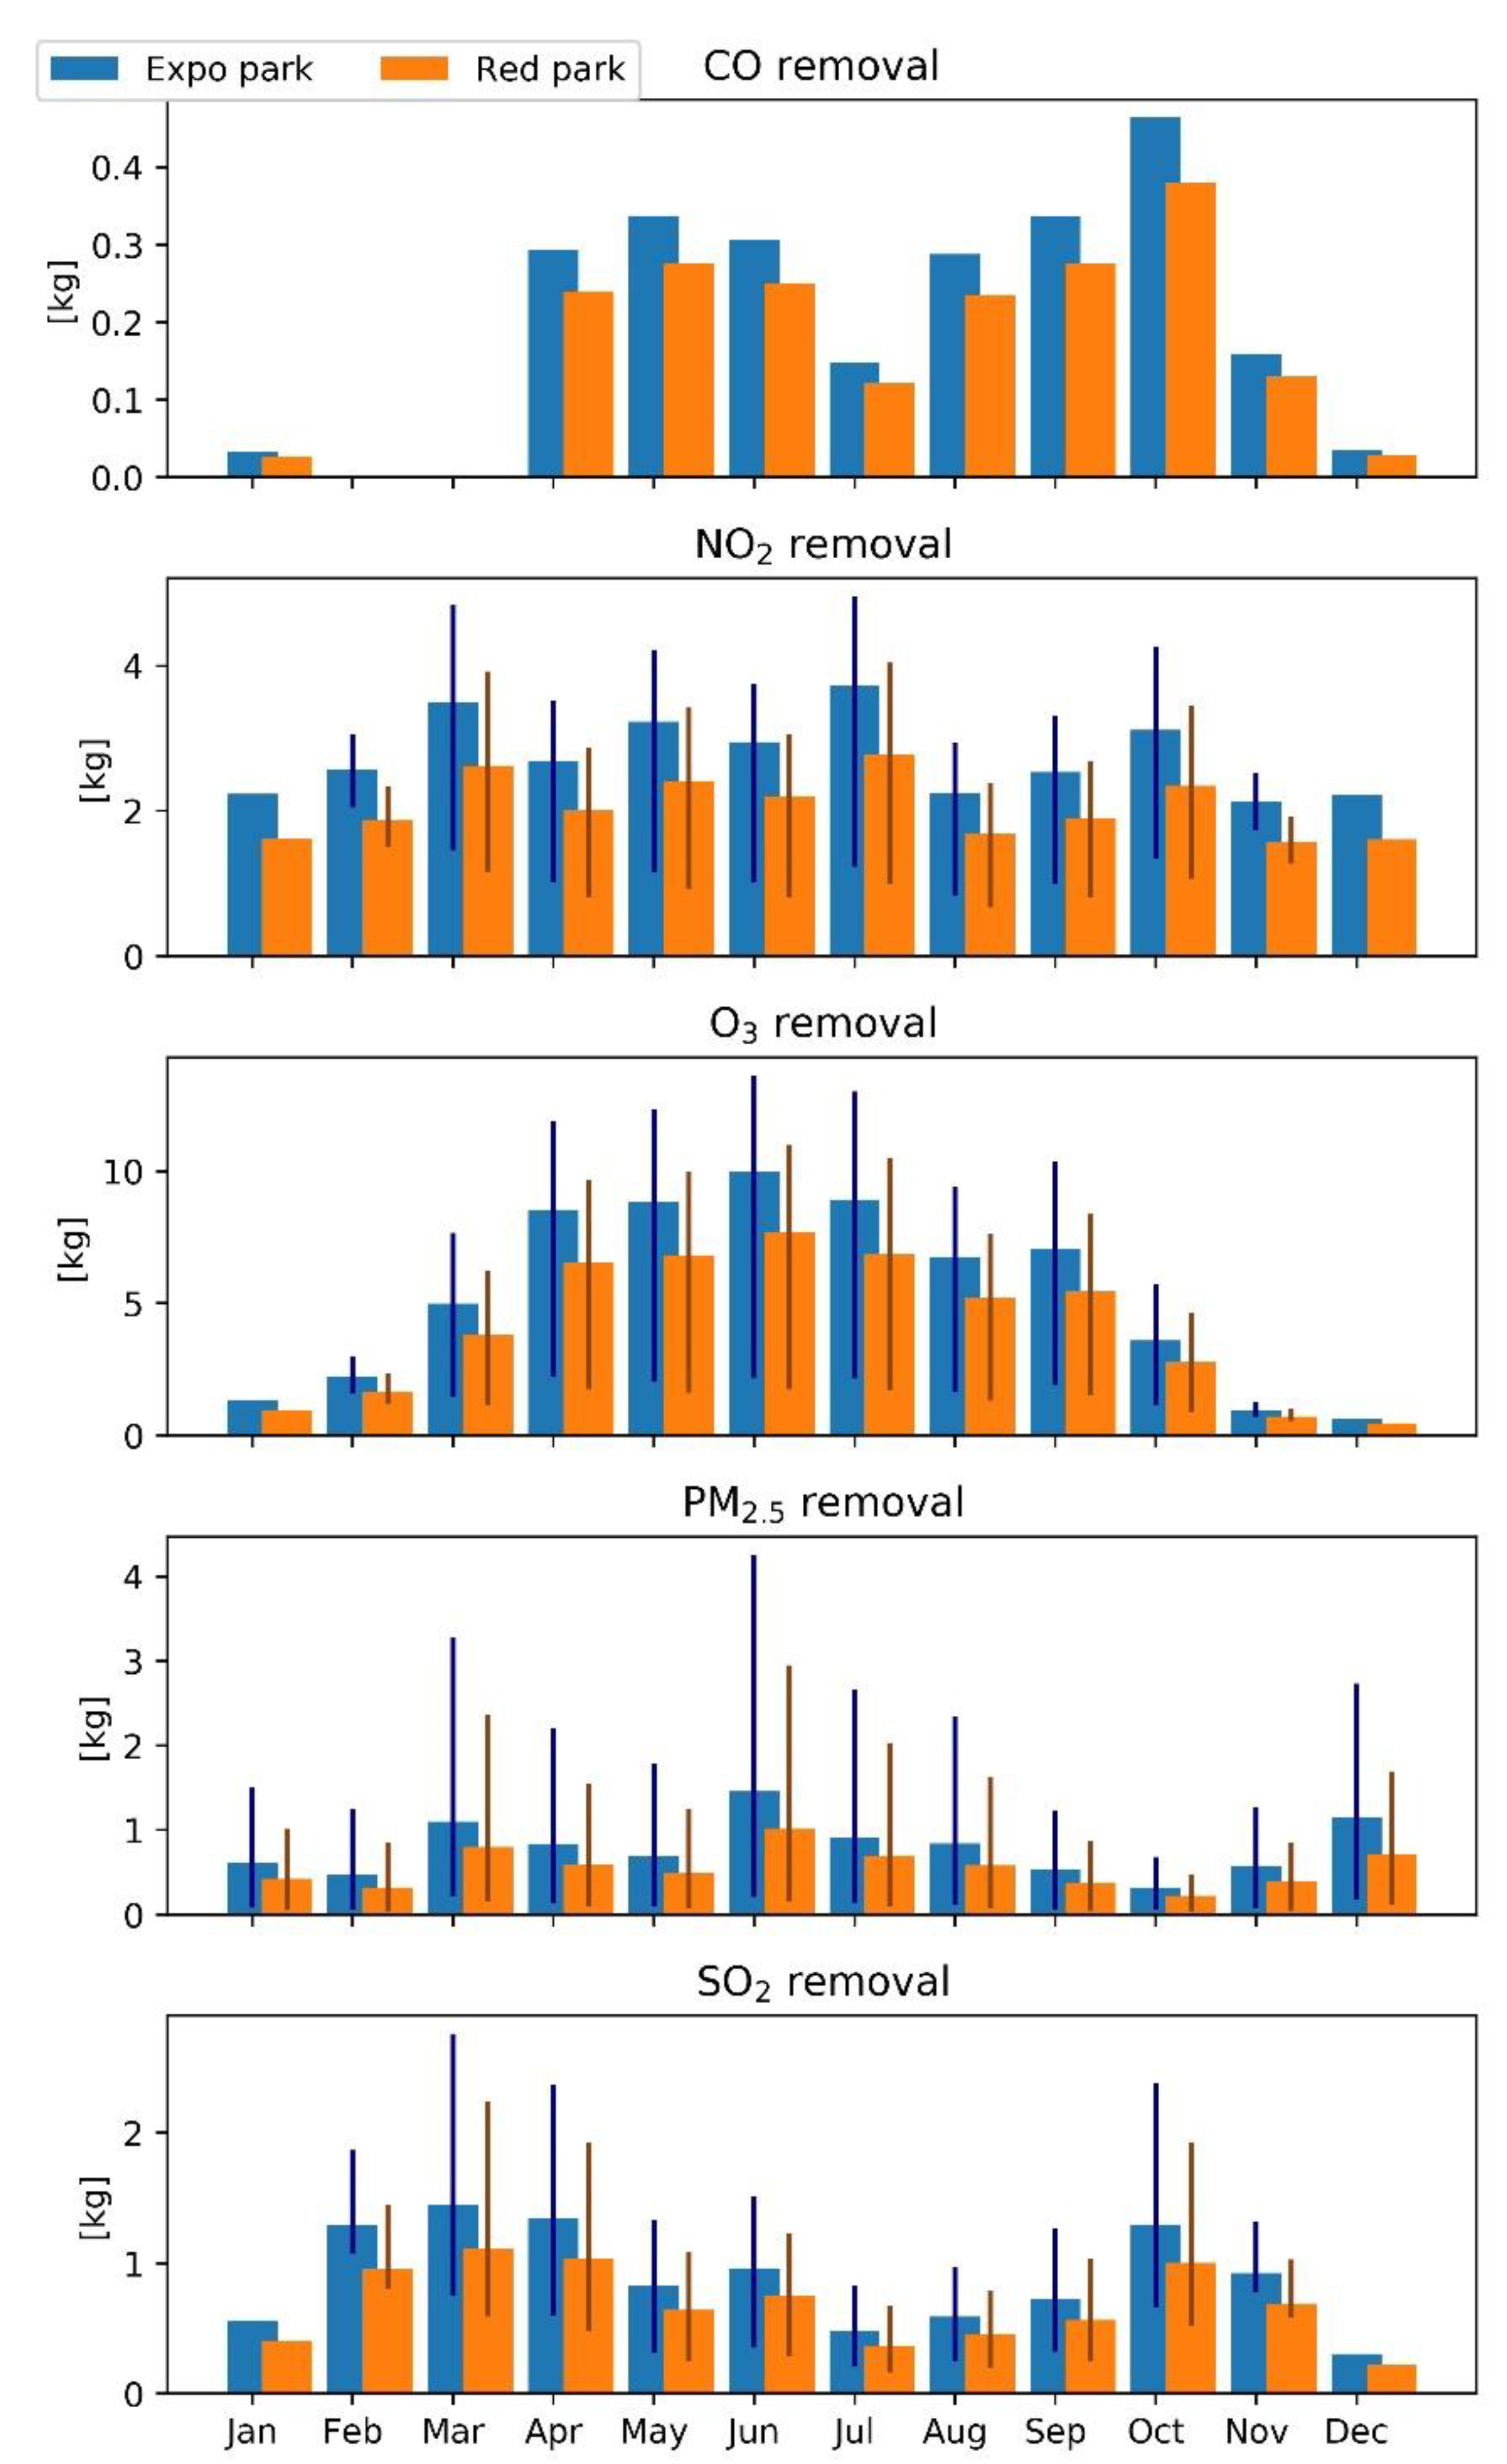
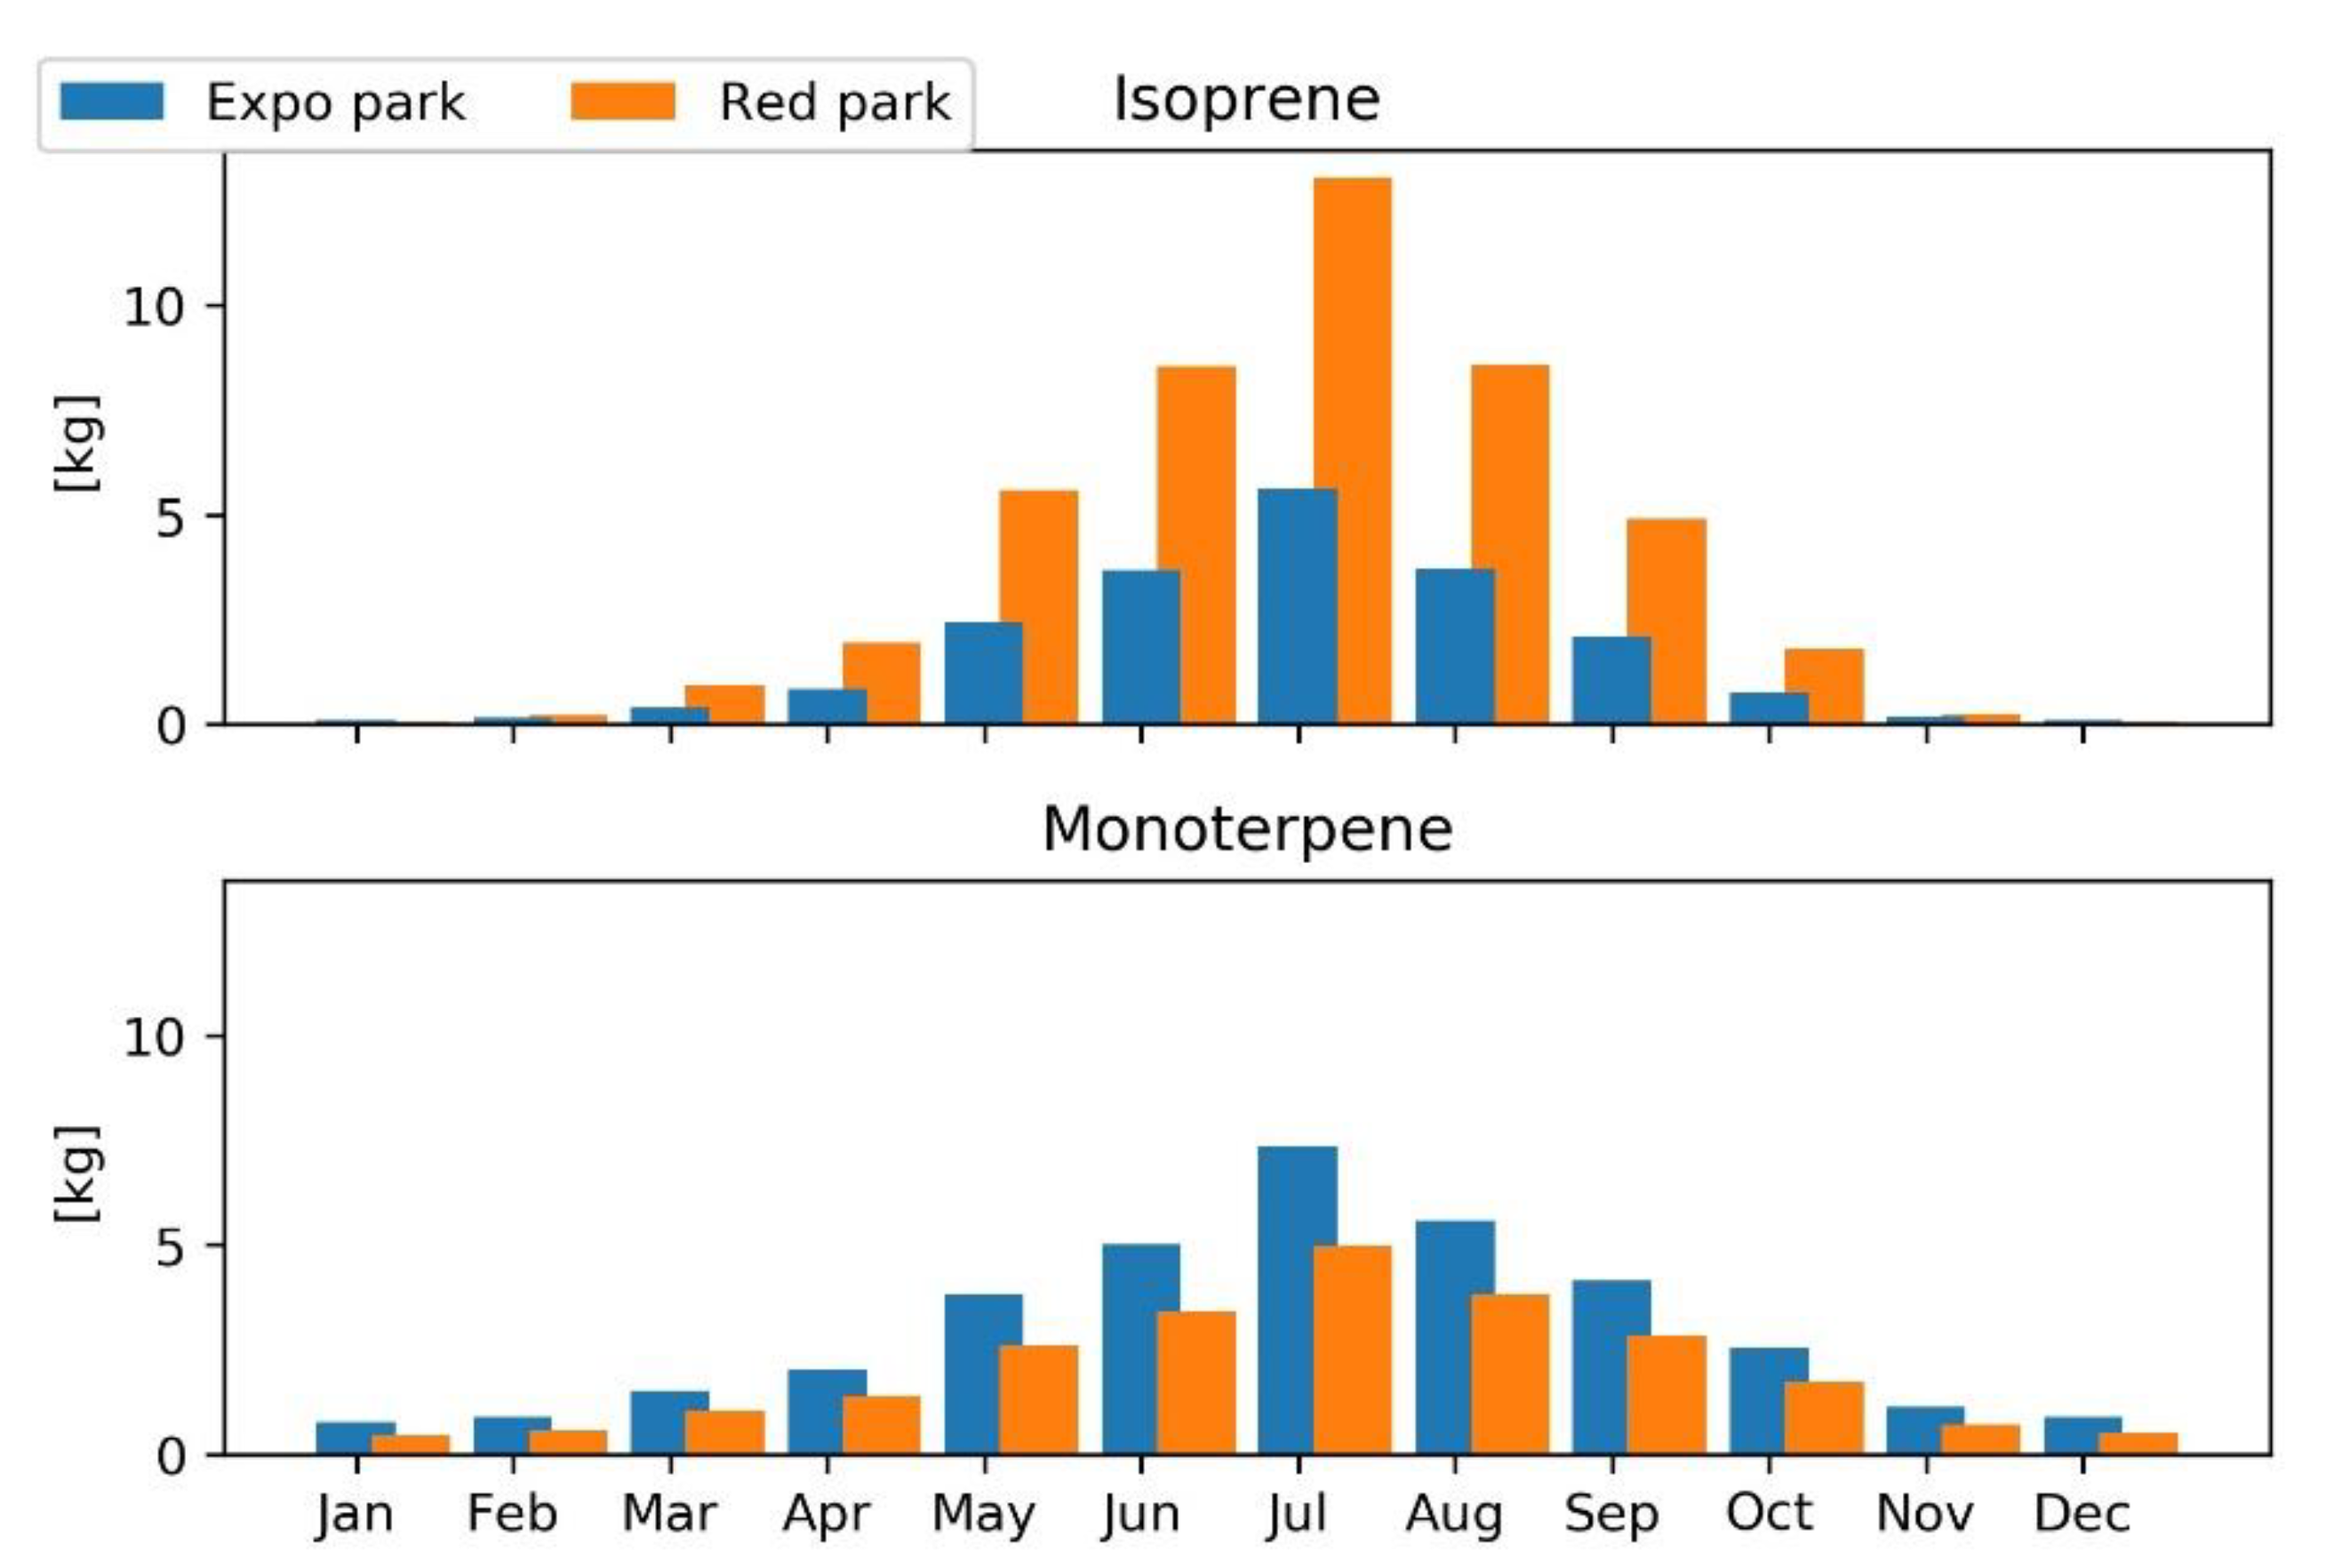
3.4. Pollution Removal

The i-Tree Eco model calculates pollution removal considering a deposition velocity range for all pollutants (the bar in Figure 5) except for CO removal that is not related to transpiration compared to other gaseous pollutants [38]. Additionally, for the removal of fine particulate matter (PM2.5), the model considers an average deposition velocity based on wind speed and a range (max and min) based on the standard error calculated from the deposition differences of several tree species. The larger bar width for PM2.5 is due to the effect of resuspension, which reduces the accumulation of particulate matter on leaves and thus net removal [39].
In 2018, trees in RED Park and EXPO Park, remove 90.3 and 119.6 kg of pollutants, respectively. Ozone (O3) is the most removed pollutant from trees (48.9 kg in RED Park and 63.8 kg in EXPO Park), particularly in summer, with a maximum in June (7.7 kg in RED Park and about 10 kg in EXPO Park). Nitrogen dioxide (NO2) removal is nearly constant during the year with an average of 2.1 ± 0.4 kg (in total 24.6 kg) for the RED Park and 2.8 ± 0.5 kg (in total 33.1 kg) for the EXPO Park. The annual amount of total fine particulate matter (PM2.5) removed, is 6.6 kg for RED Park and 9.5 kg for EXPO Park, with the highest values in June, March, and December (1, 0.8, 0.7 kg for RED Park and 1.5, 1.1, 1.2 kg for EXPO Park). Additionally, trees remove 8.2 and 10.8 kg of sulfur dioxide (SO2) in RED Park and EXPO Park, respectively, with the highest values in February, March, April, and October. Finally, carbon monoxide (CO) is mostly removed during the growing season of trees (in total 2 kg in RED Park and 2.4 kg EXPO Park) with a peak in October (Figure 5).
In 2018, trees emitted an estimated 69.9 (45.9 kg of isoprene and 24 kg of monoterpenes) and 55.7 kg (20 kg of isoprene and 35.7 kg of monoterpenes) of volatile organic compounds (VOCs) in RED and EXPO Parks, respectively. About half of the VOC emissions from urban forests were from P. alba, C. deodara in RED Park, and C. sempervirens and C. deodara in EXPO Park (Figure 6).

3.5. Hydrology Effects

Trees in RED and EXPO Parks, in 2018, transpired 3039.6 and 3334.2 m3 of water, respectively, with the highest values in July (651.8 m3 for RED Park and 715.6 m3 for EXPO Park). The presence of impervious surfaces in urban areas can generate water runoff that is prevented by the interception and evaporation from tree canopies [40]. The model calculates the amount of rainwater intercepted, based on LAI, and that evaporates, according to the potential evapotranspiration (Figure S1). The annual avoided runoff was 200.5 m3 in RED Park and 269.5 m3 in EXPO Park, with the highest values in Summer, particularly in June (28.6 and 37.5 m3 for RED and EXPO Parks, respectively) (Figure 7).

3.6. Selected Species Performance for Urban Reforestation in Tbilisi

Some of the suggested tree species in the list of Tbilisi City Hall are also among the dominant species in the RED and EXPO parks and marked as “recommended” or ”priority” for future afforestation programs (Table 3). The results showed that for carbon sequestration, C. deodara, C. sempervirens, and Fraxinus americana are the species that accumulate more carbon per unit of canopy cover. F. americana, Picea pungens and P. orientalis, allow for a greater reduction in stormwater runoff; F. americana, P. pungens and Tilia cordata contribute to the removal of higher amounts of air pollutants; F. americana, Fraxinus excelsior, T. cordata, and Tilia platyphyllos are non-emitting species of VOCs, thus contributing to lower levels of ozone concentration.

4. Discussion

4.1. Urban Forest Structure and Ecosystem Services Provision

Our modeling analysis shows that RED and EXPO Parks supply important environmental services to the city of Tbilisi. These urban forests are located in the urban fabric and have a similar size (3.3 ha for RED Park vs. 3.2 ha for EXPO Park) but have a different number of trees (1030 for RED Park vs. 694 for EXPO Park). There are more species in the EXPO Park (62) than the RED Park (52), although with only a few trees each, and about half (≈47%) are evergreen in both urban forests, with some conifers dominating such as C. sempervirens and C. deodara.
Despite the different tree density (312 trees/ha for RED Park vs. 217 trees/ha for EXPO park), tree cover in EXPO Park (1.8 ha) is greater than RED Park (1.5 ha) because there are larger trees as shown by basal area (32.7 m2 for RED Park vs. 53.6 m2 for EXPO Park) and this clearly affects the amount of carbon stored by the forests (126.5 t for RED Park and 198.4 t for EXPO Park) [11]. However, RED park’s annual carbon sequestration (4.7 t) is slightly higher than EXPO Park (4.6 t). This result is mainly due to a higher number of trees in open light conditions (Crown light exposure (CLE) 4–5) which have a larger growth base (Nowak et al. 2008) (RED Park, CLE 0–1: 125, CLE 2–3: 535, CLE 4–5: 370 vs. EXPO Park, CLE 0–1: 98, CLE 2–3: 338, CLE 4–5: 258). Despite the higher tree density, the smaller size of the trees reduces the competition for light, which promotes growth in diameter and thus, carbon sequestration.
The total pollution removal rate was 6.1 and 6.7 g m−2 for RED and EXPO Park, respectively. The highest removal rate was for O3 (3.3 g m−2 for RED Park and 3.6 g m−2 for EXPO Park), then NO2 (1.7 g m−2 for RED Park and 1.9 g m−2 for EXPO Park), SO2 (0.6 g m−2), PM2.5 (0.5 g m−2), and CO (0.1 g m−2). Comparing these values with other modeling studies, the total removal rate per unit tree cover is higher than in other European cities, such as Munich (5.3 g m−2) [41] or Strasbourg (5.1 g m−2) [42], but lower than in London (8.7 g m−2) [43] or the calculated average for the US cities (7.5 g m−2) [44] considering PM2.5 removal rate instead of PM10 [39]. Regarding the VOC emissions from trees, it is interesting to note that the two parks, which have similar composition, differ greatly in isoprene emissions (20 vs. 45.9 kg) due to the presence of P. alba in RED Park as the dominant species, which is a high emitter [45].
Trees in RED and EXPO Park also provide a beneficial cooling effect by transpiring in the warmer months up to 1.7 L m−2 day−1 in July. Similar results have been modeled [46] and measured in Germany on broadleaves, showing an energy reduction through cooling of 75 W m−2 and an air temperature reduction of 3° within the canopies [47]. Furthermore, the presence of these green infrastructures within the city, promotes soil infiltration and reduced water runoff [48] (35.9 and 33.7 m3 ha−1 yr−1 per unit of leaf area in RED and EXPO Park, respectively). These values are high in terms of efficiency, considering the total precipitation of 397.6 mm in 2018, and are in the same range of London (32.6 m3 ha−1 yr−1) [43], but lower than Kyoto (130.3 m3 ha−1 yr−1) [49], where the amount of precipitation is higher (1770 mm per annum).

4.2. Tree Measurements and Model Uncertainties

Tree measurements are essential to properly assess the urban forest structure (leaf area, biomass, basal area) which is directly related to ecosystem services (pollution removal, carbon storage and sequestration, rainfall interception) provided by trees in cities [50]. Several parameters per individual tree, such as their size (height and diameter), canopy size-conditions, as well as species, are required by i-Tree Eco. Data can be collected, as in this study, through a complete inventory of the population, in which all trees are measured, or with sample plots, where subsets of the population are measured to estimate total forest value. The complete tree inventory is adopted to measure parks and urban forests with a limited area, while the sample area approach is used to quantify the structure and ecosystem services of the citywide urban forest. In the first case, there is no estimation of variance or sampling error in the total population because all trees are measured, whereas in the second, the model calculates the standard error of the population estimate [37]. The number and size of sample plots affects the precision of the estimate, but at the same time increases the time and cost of sampling. It has been assessed that on average two people can measure around 200 (0.04 ha) plots during 14 field weeks resulting in a relative standard error of about 12% on the total number of trees [51].
Accurate tree measurements are also important because these data, along with environmental variables, influence model outputs [52]. For example, VOC emissions are strongly related to genus, and it is evident from our analysis how a different dominant species, within the park, can affect the total value. Diameter at breast height influences carbon storage and sequestration, but also tree condition and crown light exposure (CLE) play an important role [41].
Based on the results of a study that analyzed i-Tree Eco model outputs from 15 U.S. cities, an uncertainty of 12.3% was observed for leaf area, 13.4% for carbon storage, 11.1% for carbon sequestration, 40.7% for isoprene emissions, and 25.0% for monoterpene emissions, summing the input, sampling, and model contributions [53]. Furthermore, in addition to potential errors related to sampling methods or model functioning, it is critical to validate results with experimental studies to improve parameterization and estimates of ecosystem services. Only a few studies in the literature have compared the model-calculated pollutant deposition flux for gaseous and particulate pollutants. Morani et al. 2014 [54] compared ozone deposition flux with Eddy covariance measurements showing a larger error during the dry summer period in a Mediterranean forest, due to stomatal closure of leaves and thus less O3 uptake. A similar result was also observed by Pace et al. 2021 [55] in a comparison with sap flow measurements in two squares in Munich, showing that taking into account the soil water balance results in a better match with the assessments by improving the calculation of transpiration and cooling effect of trees. Regarding particulate matter removal, a recent study compared the calculation of i-Tree Eco with the accumulation of fine particulate matter on Quercus ilex leaves measured by vacuum filtration and scanning electron microscopy, highlighting the need to improve the current model parameterization by taking into account the different leaf traits on deposition, resuspension, and washing [56].
In our study, tree species with greater basal area accumulate and sequester more carbon in both urban forests, in particular C. deodara, C. sempervirens and P. alba for the RED Park, and C. deodara and C. sempervirens for the EXPO Park. Some species (e.g., C. arizonica, F. americana for the RED Park and A. hippocastanum for the EXPO Park), while relatively smaller in diameter, remove a greater amount of carbon, because there are enough trees in a better light and health condition [36,52]. However, the model dependence of tree growth solely on light conditions, represents a strong assumption, because especially in cities, additional factors such as drought [57] or high ozone concentration [58] can negatively affect the tree growth. Furthermore, regional and urban tree-specific allometric equations for urban trees can improve the estimates of urban forest biomass [59]. To increase the reliability of the model estimates and for greater awareness of the limitations and uncertainties of the outputs, it would be desirable to integrate these improvements into the parameterization and processes of the model, highlighting the degree of error associated with the estimation of each ecosystem service.

4.3. Urban Green Planning in Tbilisi and Future Perspectives

Increasing tree cover in cities can mitigate the extreme health effects of climate change, such as extreme heat [60] or the impact of flooding in urban areas due to heavy rainfall [61], which also result in significant economic implications.
Decision support tools, such as the i-Tree Eco model, allow quantifying the amount of ecosystem services provided by trees and thus help in the management and species selection for planning effective urban green spaces [62].
Our analysis showed that evergreen species in Tbilisi, despite an extended leaf-on season and thus the possibility of longer interaction with pollutants and precipitation, are not able to provide more ecosystem services than deciduous species. For example, rainfall is abundant in the spring–summer season, which allows for greater fine particulate matter removal [39,56,63], as well as greater rain interception and thus reduced runoff (Figure 5, Figure 6 and Figure 7). Furthermore, rainfall allows to increase the soil water content and ensures a higher stomatal conductance and therefore, a cooling effect and uptake of gaseous pollutants [55]. Another important selection criterion is the choice of non-VOC emitting species [64], such as the species within the genus Acer, Fraxinus and Tilia, to ensure high ozone removal [65] by preventing its formation [66]. Some species within these genera are already included in the list of suitable trees for the landscape and climate of Tbilisi (Table 3) and according to their environmental services should therefore be supported in establishing new urban forests in the city.
The development of green areas in the city of Tbilisi requires thorough planning based on quantitative criteria, such as the ability of trees in providing essential ecosystem services, to effectively mitigate the effects of climate change and air pollution. In the current landscape, green spaces are confined to surrounding areas of the city, thus reducing the accessibility of people and potential benefits to human health and the environment. Urban forests such as RED and EXPO parks, represent limited spots in the urban fabric, but the results of this study demonstrate how capable these green infrastructures are of providing multiple environmental benefits. In light of the current urban planning policy, the use of software such as i-Tree Eco can help to quantify the current urban forest structure of the city and its ecosystem services and support future afforestation programs. In particular, it is recommended to increase tree cover in the downtown area, in densely populated residential areas, and near sources of pollution such as busy roads through a specific plant selection [67]. Although the i-Tree Eco model was developed in the United States, the simulation presented in this study was performed with input data (meteorological and pollution) measured in Tbilisi. Additionally, all measured species were parameterized in the model database, opening up the chances to utilize the model for the research of bigger parks of Tbilisi, such as Mtatsminda Park (approx. 150 ha), Tbilisi Dendrological Park (about 163 ha) and National Botanical Garden in Tbilisi (161 ha), located in the suburbs of Tbilisi. The future use of the i-Tree Eco model for studying the bigger parks of Tbilisi, may become a good example of transferability of the modeling exercise, for evaluating the ecosystem services provided by the urban parks. In the cases of Tbilisi Dendrological Park and The National Botanical Garden, the modeling could give different results due to richer and more diverse composition of tree species in those two sites.

4.4. The Value and Role of Urban Forests

The concepts of green infrastructure, urban forests, and ecosystem services, defined as the multiple benefits flowing from nature to society, are relatively new topics in scientific research. Despite their inclusiveness and participation, these approaches often find difficulty in implementation and applicability, especially in urban planning and management stages [68].
Urban parks, gardens and other green areas give cities a greater identity and uniqueness by contrasting with the surrounding urban fabric. Notable examples are the Englischer Garten in Munich, Germany, or Central Park in New York City, USA. Nevertheless, they are very often, not considered as drivers or determinants in the city’s land use policies, city development, or sustainable urban practices.
The ecological value and capacity of urban parks to provide ecosystem services, based on the type or quality of vegetation, is often neglected, and the presence of green spaces in cities is generally described only as a per capita share [69]. However, relatively small urban forests, such as EXPO Park, can offset CO2 emitted by more than 80 Georgian citizens (2.14 t per capita, www.worldometers.info accessed on 1 August 2021) and fine particles of more than 200 diesel cars EURO VI (PM limits of 4.5 mg/km according to Commission Regulation (EU) No 459/2012 of 29 May 2012) with an annual mileage of 20,000 km (assuming the concentration of PM2.5 is half of the total mass of particles).
These results show a limited ability of urban trees to mitigate greenhouse gas emissions and air pollution in light of tree canopy space constraints and the magnitude of emissions [70]. Therefore, tree planting should be part of the integrated planning of cities that aim to reduce environmental impacts and introduce proper management of urban forest to maximize their benefits and reduce possible disservices [71]. The Sustainable Development Goals (SDGs) focus much attention on reducing the impact of cities on the environment and mitigating the effects of climate change. In this regard, the study of the biotic component of urban forests and their ecosystem services will be of great support for de-carbonization and minimization of pollution in urban areas.
The effects of climate change have strong economic impacts, particularly in cities and surrounding areas. Extreme events such as floods, hurricanes, wildfires, severe drought, air pollution and related impacts on the health of city dwellers, increased infrastructure and disaster recovery costs, leading to an overall increase in public spending [72].
Moreover, it is also very important to consider the contribution of urban parks to human health and well-being, producing multiple benefits such as increasing physical activity, increasing life expectancy, reducing health problems, and promoting psychological wellness [73,74]. These essential social and psychological services contribute directly and indirectly to the liveability, comfort, positive image, and attractiveness of the city [75]. Therefore, the provision and availability of urban green spaces, as a common and shared natural good for all city residents, raises the questions of ethics and environmental justice, equitable distribution of urban green infrastructure, and its accessibility to various urban population groups [76].
Urban trees produce multiple benefits for people and the environment, producing externalities with a positive economic impact such as reduced health care costs, energy use or stormwater control [77]. On the other hand, urban trees can lead to disservices and thus costs, such as asthma due to pollen emission or infrastructure damage [78], which can be minimized through comprehensive urban forest planning [71], including the costs of maintenance (planting, management, removal) [79].
The assessment of economic impact and socio-environmental services provided by urban green spaces in Tbilisi, Georgia, deserves further investigation in future studies, to ensure effective green infrastructures and sustainable development of the city.

5. Conclusions

Urban forests and trees contribute to improving air quality and mitigating climate change and its effects in cities. These services of urban vegetation are well recognized though less implemented in urban planning decisions from local administrations. In this study, we showed the impact and the environmental importance of two parks in Tbilisi by implementing the i-Tree Eco model for the first time in a Southern Caucasus city. Another finding of this study is the utmost need to preserve old and develop new parks and other green infrastructures in Tbilisi, where the availability of green space is insufficient (per capita values, or overall accessibility). Scientific studies and economic evaluation of ecosystem services, provided by parks and urban vegetation, can support decision-making processes in urban planning and development, thus contributing to increased attention and more effective efforts for sustainable environmental management in Tbilisi. Accurate field measurements and the implementation of tools such as models, allow quantifying the urban forest structure and related environmental benefits. These results support the selection of suitable and effective tree species for future reforestation and afforestation programs. Through comprehensive and quantitative assessments of trees, proper planning and management of urban green spaces can be adopted, providing detailed information on the type, quality, and services of vegetation, contributing to the sustainable development of rapidly expanding and growing cities such as Tbilisi.

Supplementary Materials

The following are available online at https://www.mdpi.com/article/10.3390/cli9110157/s1.

Author Contributions

L.A. designed the research, carried out the field measurements, and wrote the text. R.P. contributed significantly to the design, model implementation, analysis, discussion of results, and writing of the text. All authors have read and agreed to the published version of the manuscript.

Funding

This research was funded by a research grant to LA from the Shota Rustaveli National Science Foundation of Georgia: PHDF-18-360. RP was supported by the project “EUFORICC”—Establishing Urban Forest based solutions In Changing Cities (PRIN 20173RRN2S: “Projects of National Interest”).

Institutional Review Board Statement

Not applicable.

Informed Consent Statement

Not applicable.

Data Availability Statement

Tree datasets used for the model simulations are available in the Supplementary Materials. Additional data are available on request to the authors.

Acknowledgments

The authors thank Stephan Pauleit, Ruediger Grote, Antonio Castelbranco and Joseph Salukvadze for their valuable advice and support in research design, Alexis Ellis, and Alejandro Zelaya for their kind support during the model data input and analysis, Grigol Deisadze, Giorgi Kirkitadze and Mamuka Mirtskhulava for their input in the field study and the research process, and the students of Human Geography at Tbilisi State University for helping in data collection during fieldwork in Tbilisi urban parks.

Conflicts of Interest

The authors declare no conflict of interest.

References

  1. Beatley, T. Biophilic Urbanism: Inviting Nature Back to Our Communities and Into Our Lives. William Mary Environ. Law Policy Rev. 2009, 34, 209. [Google Scholar]
  2. Unterweger, P.; Schrode, N.; Betz, O. Urban Nature: Perception and Acceptance of Alternative Green Space Management and the Change of Awareness after Provision of Environmental Information. A Chance for Biodiversity Protection. Urban Sci. 2017, 1, 24. [Google Scholar] [CrossRef] [Green Version]
  3. Liu, Z.; He, C.; Zhou, Y.; Wu, J. How much of the world’s land has been urbanized, really? A hierarchical framework for avoiding confusion. Landsc. Ecol. 2014, 29, 763–771. [Google Scholar] [CrossRef]
  4. Gómez-Baggethun, E.; Gren, Å.; Barton, D.N.; Langemeyer, J.; McPhearson, T.; O’Farrell, P.; Andersson, E.; Hamstead, Z.; Kremer, P. Urban Ecosystem Services. In Urbanization, Biodiversity and Ecosystem Services: Challenges and Opportunities: A Global Assessment; Elmqvist, T., Fragkias, M., Goodness, J., Güneralp, B., Marcotullio, P.J., McDonald, R.I., Parnell, S., Schewenius, M., Sendstad, M., Seto, K.C., et al., Eds.; Springer: Dordrecht, The Netherlands, 2013; pp. 175–251. ISBN 978-94-007-7088-1. [Google Scholar]
  5. UN-Habitat. World Cities Report 2020: The Value of Sustainable Urbanization; UN-Habitat: Nairobi, Kenya, 2020. [Google Scholar]
  6. Kampelmann, S. Urban Ecosystem Services: Literature Review and Operationalization for the Case of Brussels; Université Libre de Bruxelles: Brussels, Belgium, 2014. [Google Scholar]
  7. Breuste, J.; Schnellinger, J.; Qureshi, S.; Faggi, A. Urban Ecosystem services on the local level: Urban green spaces as providers. Ekológia (Bratisl.) 2013, 32, 290–304. [Google Scholar] [CrossRef] [Green Version]
  8. Shaddick, G.; Thomas, M.L.; Mudu, P.; Ruggeri, G.; Gumy, S. Half the world’s population are exposed to increasing air pollution. NPJ Clim. Atmos. Sci. 2020, 3, 1–5. [Google Scholar] [CrossRef]
  9. McCarthy, M.P.; Best, M.J.; Betts, R.A. Climate change in cities due to global warming and urban effects. Geophys. Res. Lett. 2010, 37, 1–5. [Google Scholar] [CrossRef] [Green Version]
  10. Simpson, G.B.; Jewitt, G.P.W. The development of the water-energy-food nexus as a framework for achieving resource security: A review. Front. Environ. Sci. 2019, 7, 8. [Google Scholar] [CrossRef] [Green Version]
  11. Nowak, D.J.; Crane, D.E. Carbon storage and sequestration by urban trees in the USA. Environ. Pollut. 2002, 116, 381–389. [Google Scholar] [CrossRef]
  12. Santamouris, M.; Osmond, P. Increasing Green Infrastructure in Cities: Impact on Ambient Temperature, Air Quality and Heat-Related Mortality and Morbidity. Buildings 2020, 10, 233. [Google Scholar] [CrossRef]
  13. Rahman, M.A.; Stratopoulos, L.M.F.; Moser-Reischl, A.; Zölch, T.; Häberle, K.H.; Rötzer, T.; Pretzsch, H.; Pauleit, S. Traits of trees for cooling urban heat islands: A meta-analysis. Build. Environ. 2020, 170, 106606. [Google Scholar] [CrossRef]
  14. Grey, V.; Livesley, S.J.; Fletcher, T.D.; Szota, C. Establishing street trees in stormwater control measures can double tree growth when extended waterlogging is avoided. Landsc. Urban Plan. 2018, 178, 122–129. [Google Scholar] [CrossRef]
  15. Coville, R.; Endreny, T.; Nowak, D.J. Modeling the Impact of Urban Trees on Hydrology. In Forest-Water Interactions; Levia, D.F., Carlyle-Moses, D.E., Iida, S., Michalzik, B., Nanko, K., Tischer, A., Eds.; Springer International Publishing: Cham, Switzerland, 2020; pp. 459–487. ISBN 978-3-030-26086-6. [Google Scholar]
  16. Lama, G.F.C.; Rillo Migliorini Giovannini, M.; Errico, A.; Mirzaei, S.; Padulano, R.; Chirico, G.B.; Preti, F. Hydraulic Efficiency of Green-Blue Flood Control Scenarios for Vegetated Rivers: 1D and 2D Unsteady Simulations. Water 2021, 13, 2620. [Google Scholar] [CrossRef]
  17. Dwyer, J.F.; Nowak, D.J.; Noble, M.H. Sustaining Urban Forests. J. Arboric. 2003, 29, 49–55. [Google Scholar]
  18. Biocca, M.; Gallo, P.; Di Loreto, G.; Imperi, G.; Pochi, D.; Fornaciari, L. Noise attenuation provided by hedges. J. Agric. Eng. 2019, 50, 113–119. [Google Scholar] [CrossRef]
  19. Andersson, E.; Tengö, M.; McPhearson, T.; Kremer, P. Cultural ecosystem services as a gateway for improving urban sustainability. Ecosyst. Serv. 2015, 12, 165–168. [Google Scholar] [CrossRef]
  20. Higgins, S.L.; Thomas, F.; Goldsmith, B.; Brooks, S.J.; Hassall, C.; Harlow, J.; Stone, D.; Völker, S.; White, P. Urban freshwaters, biodiversity, and human health and well-being: Setting an interdisciplinary research agenda. WIREs Water 2019, 6, e1339. [Google Scholar] [CrossRef]
  21. Wang, B.; Zhang, Q.; Cui, F. Scientific research on ecosystem services and human well-being: A bibliometric analysis. Ecol. Indic. 2021, 125, 107449. [Google Scholar] [CrossRef]
  22. Krajter Ostoić, S.; Salbitano, F.; Borelli, S.; Verlič, A. Urban forest research in the Mediterranean: A systematic review. Urban For. Urban Green. 2018, 31, 185–196. [Google Scholar] [CrossRef]
  23. FAO. Global Forest Resources Assessment 2020: Main Report; FAO: Rome, Italy, 2020; ISBN 978-92-5-132974-0. [Google Scholar]
  24. Ministry of Environmental Protection and Agriculture of Georgia. Third National Environmental Action Programme of Georgia 2017–2021; Ministry of Environmental Protection and Agriculture of Georgia: Tbilisi, Georgia, 2018.
  25. Salukvadze, J.; Golubchikov, O. City as a geopolitics: Tbilisi, Georgia—A globalizing metropolis in a turbulent region. Cities 2016, 52, 39–54. [Google Scholar] [CrossRef] [Green Version]
  26. Tbilisi City Hall. Tbilisi in Figures 2018; Tbilisi City Hall: Tbilisi, Georgia, 2018.
  27. Gadrani, L.; Lominadze, G.; Tsitsagi, M. F assessment of landuse/landcover (LULC) change of Tbilisi and surrounding area using remote sensing (RS) and GIS. Ann. Agrar. Sci. 2018, 16, 163–169. [Google Scholar] [CrossRef]
  28. Ministry of Environmental Protection and Agriculture of Georgia. Georgia’s Second Biennial Update Report under the United Nations Framework Convention on Climate Change; Ministry of Environmental Protection and Agriculture of Georgia: Tbilisi, Georgia, 2019.
  29. National Accounts Department of National Statistics Office of Georgia. National Accounts of Georgia 2019 (Statistical Publication); National Accounts Department of National Statistics Office of Georgia: Tbilisi, Georgia, 2021.
  30. Parliament of Georgia. Thematic Inquiry Report of the Environment Protection and Natural Resources Committee of the Parliament of Georgia on Air Quality in Tbilisi; Parliament of Georgia: Tbilisi, Georgia, 2019.
  31. Tbilisi City Hall List of Selected Tree Species. Available online: https://tbilisi.gov.ge/img/original/2018/3/20/05.14.147-Kheebis-Sia.pdf (accessed on 21 May 2021).
  32. Lin, J.; Kroll, C.N.; Nowak, D.J.; Greenfield, E.J. A review of urban forest modeling: Implications for management and future research. Urban For. Urban Green. 2019, 43, 126366. [Google Scholar] [CrossRef]
  33. National Statistics Office of Georgia Population as of 1 January by Regions and Self-Governed Units. Available online: https://www.geostat.ge/en/modules/categories/41/population (accessed on 10 May 2021).
  34. Gaprindashvili, G.; Gaprindashvili, M.; Tsereteli, E. Natural Disaster in Tbilisi City (Riv. Vere Basin) in the Year 2015. Int. J. Geosci. 2016, 7, 1074–1087. [Google Scholar] [CrossRef] [Green Version]
  35. I-Tree. I-Tree Eco Field Guide v.6; I-Tree: 2020. Available online: https://www.itreetools.org/documents/274/EcoV6.FieldManual.2021.10.06.pdf (accessed on 21 May 2021).
  36. Nowak, D.J.; Crane, D.E.; Stevens, J.C.; Hoehn, R.E.; Walton, J.T.; Bond, J. A Ground-Based Method of Assessing Urban Forest Structure and Ecosystem Services. Arboric. Urban For. 2008, 34, 347–358. [Google Scholar]
  37. Nowak, D.J. Understanding i-Tree: Summary of Programs and Methods; US Department of Agriculture, Forest Service, Northern Research Station: Madison, WI, USA, 2020.
  38. Hirabayashi, S.; Kroll, C.N.; Nowak, D.J. Development of a distributed air pollutant dry deposition modeling framework. Environ. Pollut. 2012, 171, 9–17. [Google Scholar] [CrossRef] [PubMed]
  39. Nowak, D.J.; Hirabayashi, S.; Bodine, A.; Hoehn, R. Modeled PM2.5 removal by trees in ten U.S. cities and associated health effects. Environ. Pollut. 2013, 178, 395–402. [Google Scholar] [CrossRef]
  40. Hirabayashi, S. i-Tree Eco Precipitation Interception Model Descriptions; US Department of Agriculture Forest Service: Washington, DC, USA, 2013.
  41. Pace, R.; Biber, P.; Pretzsch, H.; Grote, R. Modeling ecosystem services for park trees: Sensitivity of i-tree eco simulations to light exposure and tree species classification. Forests 2018, 9, 89. [Google Scholar] [CrossRef] [Green Version]
  42. Selmi, W.; Weber, C.; Rivière, E.; Blond, N.; Mehdi, L.; Nowak, D. Air pollution removal by trees in public green spaces in Strasbourg city, France. Urban For. Urban Green. 2016, 17, 192–201. [Google Scholar] [CrossRef] [Green Version]
  43. Kenton, R.; Sacre, K.; Goodenough, J.; Doick, K. Valuing London’s Urban Forest; Treeconomics: London, UK, 2015; ISBN 9780957137110. [Google Scholar]
  44. Nowak, D.J.; Crane, D.E.; Stevens, J.C. Air pollution removal by urban trees and shrubs in the United States. Urban For. Urban Green. 2006, 4, 115–123. [Google Scholar] [CrossRef]
  45. Fitzky, A.C.; Sandén, H.; Karl, T.; Fares, S.; Calfapietra, C.; Grote, R.; Saunier, A.; Rewald, B. The Interplay Between Ozone and Urban Vegetation—BVOC Emissions, Ozone Deposition, and Tree Ecophysiology. Front. For. Glob. Chang. 2019, 2, 1–17. [Google Scholar] [CrossRef]
  46. Rötzer, T.; Rahman, M.A.; Moser-Reischl, A.; Pauleit, S.; Pretzsch, H. Process based simulation of tree growth and ecosystem services of urban trees under present and future climate conditions. Sci. Total Environ. 2019, 676, 651–664. [Google Scholar] [CrossRef] [PubMed]
  47. Rahman, M.A.; Moser, A.; Rötzer, T.; Pauleit, S. Within canopy temperature differences and cooling ability of Tilia cordata trees grown in urban conditions. Build. Environ. 2017, 114, 118–128. [Google Scholar] [CrossRef]
  48. Berland, A.; Shiflett, S.A.; Shuster, W.D.; Garmestani, A.S.; Goddard, H.C.; Herrmann, D.L.; Hopton, M.E. The role of trees in urban stormwater management. Landsc. Urban Plan. 2017, 162, 167–177. [Google Scholar] [CrossRef] [Green Version]
  49. Tan, X.; Hirabayashi, S.; Shibata, S. Estimation of ecosystem services provided by street trees in Kyoto, Japan. Forests 2021, 12, 311. [Google Scholar] [CrossRef]
  50. Pace, R.; Masini, E.; Giuliarelli, D.; Biagiola, L.; Tomao, A.; Guidolotti, G.; Agrimi, M.; Portoghesi, L.; De Angelis, P.; Calfapietra, C. Tree measurements in the urban environment: Insights from traditional and digital field instruments to smartphone applications. Arboric. Urban For. 2021, accepted. [Google Scholar]
  51. Nowak, D.J.; Walton, J.T.; Stevens, J.C.; Crane, D.E.; Hoehn, R.E. Effect of plot and sample size on timing and precision of urban forest assessments. Arboric. Urban For. 2008, 34, 386–390. [Google Scholar]
  52. Lin, B.J.; Kroll, C.N.; Nowak, D.J. Ecosystem service-based sensitivity analyses of i-Tree Eco. Arboric. Urban For. 2020, 46, 287–306. [Google Scholar] [CrossRef]
  53. Lin, J.; Kroll, C.N.; Nowak, D.J. An uncertainty framework for i-Tree eco: A comparative study of 15 cities across the United States. Urban For. Urban Green. 2021, 60, 127062. [Google Scholar] [CrossRef]
  54. Morani, A.; Nowak, D.; Hirabayashi, S.; Guidolotti, G.; Medori, M.; Muzzini, V.; Fares, S.; Scarascia Mugnozza, G.; Calfapietra, C. Comparing i-Tree modeled ozone deposition with field measurements in a periurban Mediterranean forest. Environ. Pollut. 2014, 195, 202–209. [Google Scholar] [CrossRef]
  55. Pace, R.; De Fino, F.; Rahman, M.A.; Pauleit, S.; Nowak, D.J.; Grote, R. A single tree model to consistently simulate cooling, shading, and pollution uptake of urban trees. Int. J. Biometeorol. 2021, 65, 277–289. [Google Scholar] [CrossRef]
  56. Pace, R.; Guidolotti, G.; Baldacchini, C.; Pallozzi, E.; Grote, R.; Nowak, D.J.; Calfapietra, C. Comparing i-Tree Eco Estimates of Particulate Matter Deposition with Leaf and Canopy Measurements in an Urban Mediterranean Holm Oak Forest. Environ. Sci. Technol. 2021, 55, 6613–6622. [Google Scholar] [CrossRef]
  57. Moser, A.; Rötzer, T.; Pauleit, S.; Pretzsch, H. The urban environment can modify drought stress of small-leaved lime (Tilia cordata Mill.) and black locust (Robinia pseudoacacia L.). Forests 2016, 7, 71. [Google Scholar] [CrossRef] [Green Version]
  58. Grantz, D.A.; Gunn, S.; Vu, H.B. O3 impacts on plant development: A meta-analysis of root/shoot allocation and growth. Plant Cell Environ. 2006, 29, 1193–1209. [Google Scholar] [CrossRef]
  59. McHale, M.R.; Burke, I.C.; Lefsky, M.A.; Peper, P.J.; McPherson, E.G. Urban forest biomass estimates: Is it important to use allometric relationships developed specifically for urban trees? Urban Ecosyst. 2009, 12, 95–113. [Google Scholar] [CrossRef]
  60. Sinha, P.; Coville, R.C.; Hirabayashi, S.; Lim, B.; Endreny, T.A.; Nowak, D.J. Modeling lives saved from extreme heat by urban tree cover✰. Ecol. Modell. 2021, 449, 109553. [Google Scholar] [CrossRef]
  61. Nowak, D.J.; Coville, R.; Endreny, T.; Abdi, R.; Van Stan, J.T., II. Valuing Urban Tree Impacts on Precipitation Partitioning. In Precipitation Partitioning by Vegetation: A Global Synthesis; Van Stan John, T., II, Gutmann, E., Friesen, J., Eds.; Springer International Publishing: Cham, Switzerland, 2020; pp. 253–268. ISBN 978-3-030-29702-2. [Google Scholar]
  62. Pretzsch, H.; Moser-Reischl, A.; Rahman, M.A.; Pauleit, S.; Rötzer, T. Towards sustainable management of the stock and ecosystem services of urban trees. From theory to model and application. Trees—Struct. Funct. 2021. [Google Scholar] [CrossRef]
  63. Pace, R.; Grote, R. Deposition and Resuspension Mechanisms Into and From Tree Canopies: A Study Modeling Particle Removal of Conifers and Broadleaves in Different Cities. Front. For. Glob. Chang. 2020, 3, 26. [Google Scholar] [CrossRef] [Green Version]
  64. Churkina, G.; Grote, R.; Butler, T.M.; Lawrence, M. Natural selection? Picking the right trees for urban greening. Environ. Sci. Policy 2015, 47, 12–17. [Google Scholar] [CrossRef] [Green Version]
  65. Sicard, P.; Agathokleous, E.; Araminiene, V.; Carrari, E.; Hoshika, Y.; De Marco, A.; Paoletti, E. Should we see urban trees as effective solutions to reduce increasing ozone levels in cities? Environ. Pollut. 2018, 243, 163–176. [Google Scholar] [CrossRef]
  66. Calfapietra, C.; Fares, S.; Manes, F.; Morani, A.; Sgrigna, G.; Loreto, F. Role of Biogenic Volatile Organic Compounds (BVOC) emitted by urban trees on ozone concentration in cities: A review. Environ. Pollut. 2013, 183, 71–80. [Google Scholar] [CrossRef] [PubMed]
  67. Barwise, Y.; Kumar, P. Designing vegetation barriers for urban air pollution abatement: A practical review for appropriate plant species selection. NPJ Clim. Atmos. Sci. 2020, 3, 1–19. [Google Scholar] [CrossRef] [Green Version]
  68. Turkelboom, F.; Leone, M.; Jacobs, S.; Kelemen, E.; García-Llorente, M.; Baró, F.; Termansen, M.; Barton, D.N.; Berry, P.; Stange, E.; et al. When we cannot have it all: Ecosystem services trade-offs in the context of spatial planning. Ecosyst. Serv. 2018, 29, 566–578. [Google Scholar] [CrossRef]
  69. Badiu, D.L.; IojǍ, C.I.; PǍtroescu, M.; Breuste, J.; Artmann, M.; NiţǍ, M.R.; GrǍdinaru, S.R.; Hossu, C.A.; Onose, D.A. Is urban green space per capita a valuable target to achieve cities’ sustainability goals? Romania as a case study. Ecol. Indic. 2016, 70, 53–66. [Google Scholar] [CrossRef]
  70. Pataki, D.E.; Alberti, M.; Cadenasso, M.L.; Felson, A.J.; McDonnell, M.J.; Pincetl, S.; Pouyat, R.V.; Setälä, H.; Whitlow, T.H. The Benefits and Limits of Urban Tree Planting for Environmental and Human Health. Front. Ecol. Evol. 2021, 9, 155. [Google Scholar] [CrossRef]
  71. Roman, L.A.; Conway, T.M.; Eisenman, T.S.; Koeser, A.K.; Ordóñez Barona, C.; Locke, D.H.; Jenerette, G.D.; Östberg, J.; Vogt, J. Beyond ‘trees are good’: Disservices, management costs, and tradeoffs in urban forestry. Ambio 2021, 50, 615–630. [Google Scholar] [CrossRef] [PubMed]
  72. Borowski, P.F.; Patuk, I. Environmental, social and economic factors in sustainable development with food, energy and eco-space aspect security. Present Environ. Sustain. Dev. 2021, 15, 153–169. [Google Scholar] [CrossRef]
  73. Lafortezza, R.; Davies, C.; Sanesi, G.; Konijnendijk, C.C. Green infrastructure as a tool to support spatial planning in European urban regions. IForest 2013, 6, 102–108. [Google Scholar] [CrossRef] [Green Version]
  74. Carrus, G.; Scopelliti, M.; Lafortezza, R.; Colangelo, G.; Ferrini, F.; Salbitano, F.; Agrimi, M.; Portoghesi, L.; Semenzato, P.; Sanesi, G. Go greener, feel better? The positive effects of biodiversity on the well-being of individuals visiting urban and peri-urban green areas. Landsc. Urban Plan. 2015, 134, 221–228. [Google Scholar] [CrossRef]
  75. Yessoufou, K.; Sithole, M.; Elansary, H.O. Effects of urban green spaces on human perceived health improvements: Provision of green spaces is not enough but how people use them matters. PLoS ONE 2020, 15, e0239314. [Google Scholar] [CrossRef]
  76. Selmi, W.; Selmi, S.; Teller, J.; Weber, C.; Rivière, E.; Nowak, D.J. Prioritizing the provision of urban ecosystem services in deprived areas, a question of environmental justice. Ambio 2021, 50, 1035–1046. [Google Scholar] [CrossRef] [PubMed]
  77. Nowak, D.J. Assessing the benefits and economic values of trees. In Routledge Handbook of Urban Forestry; Ferrini, F., van den Bosch, C.C.K., Fini, A., Eds.; Routledge: London, UK, 2017; pp. 152–163. [Google Scholar]
  78. Roy, S.; Byrne, J.; Pickering, C. A systematic quantitative review of urban tree benefits, costs, and assessment methods across cities in different climatic zones. Urban For. Urban Green. 2012, 11, 351–363. [Google Scholar] [CrossRef] [Green Version]
  79. Vogt, J.; Hauer, R.J.; Fischer, B.C. The costs of maintaining and not maintaining the urban forest: A review of the urban forestry and arboriculture literature. Arboric. Urban For. 2015, 41, 293–323. [Google Scholar]
Figure 1. Vaso Godziashvili and EXPO Georgia parks, based on Tbilisi aerial photograph.
Climate 09 00157 g001
Figure 2. Weather data used for model simulation of Tbilisi in 2018. From top to bottom: daily average photosynthetically active radiation (PAR), daily average air temperature, and total monthly precipitation.
Climate 09 00157 g002
Figure 3. Daily average pollution concentration of CO, SO2, PM2.5, PM10, O3, and NO2 in Tbilisi (year: 2018).
Climate 09 00157 g003
Figure 4. Species that store (carbon storage) and sequester (carbon sequestration) the most carbon in EXPO and RED park.
Climate 09 00157 g004
Figure 5. Monthly pollution removal of CO, NO2, O3, PM2.5, and SO2 from EXPO and RED Park of Tbilisi in 2018. The range indicated by the bar for all pollutants (except CO) shows the removal calculated by the model using a minimum and maximum deposition velocity.
Climate 09 00157 g005
Figure 6. Monthly isoprene and monoterpenes emitted by EXPO and RED park of Tbilisi in 2018.
Climate 09 00157 g006
Figure 7. Monthly transpiration and avoided runoff by trees in EXPO and RED Park of Tbilisi in 2018.
Climate 09 00157 g007
Table 1. Dominant species in RED Park with a relative number, canopy cover, leaf area, and basal area greater or equal to 1%, 300 m2, 1000 m2, and 0.3 m2.
SpeciesNumber
Trees (N°)
Canopy
Cover (m2)
Leaf
Area (m2)
Basal
Area (m2)
Italian cypress (Cupressus sempervirens L.)1252265.59496.26.3
Oriental arborvitae (Platycladus orientalis (L.) Franco)79406.51105.10.4
Deodar cedar (Cedrus deodara (Roxb.) G. Don)612327.210,895.510.7
European ash (Fraxinus excelsior L.)60595.11749.21.1
White ash (Fraxinus americana L.)41475.41631.40.3
Bigleaf linden (Tilia platyphyllos Scop.)32306.51028.30.4
Japanese pagoda tree (Styphnolobium japonicum (L.) Schott)30844.52679.22.2
Oriental planetree (Platanus orientalis L.)231462.48757.83.3
White mulberry (Morus alba L.)17612.42768.41.2
White poplar (Populus alba L.)151478.16942.25.6
TOT urban forest103014,62555,917.632.7
TOT dominant species48310,773.647,053.331.5
Relative number of dominant species (%)46.973.784.196.3
Table 2. Dominant species in EXPO Georgia park with a relative number, canopy cover, leaf area, and basal area at least 1%, 300 m2, 1000 m2, and 0.3 m2, respectively.
SpeciesNumber
Trees (N°)
Canopy
Cover (m2)
Leaf
Area (m2)
Basal
Area (m2)
Italian cypress (Cupressus sempervirens L.)1163311.317,373.010.3
Deodar cedar (Cedrus deodara (Roxb.) G. Don)583726.714,477.120.9
Horse chestnut (Aesculus hippocastanum L.)541090.55883.61.3
Japanese privet (Ligustrum japonicum Thunb.)47909.33307.80.6
Oriental planetree (Platanus orientalis L.)231142.36913.02.9
Blue spruce (Picea pungens Engelm.)13297.01930.80.9
White ash (Fraxinus americana L.)12616.54454.91.3
White mulberry (Morus alba L.)11399.91629.40.9
Little leaf linden (Tilia cordata Mill.)11621.43401.21.6
European ash (Fraxinus excelsior L.)7713.92983.23
TOT urban forest69417,866.479,992.253.6
TOT dominant species35212,828.862,35443.7
Relative number of dominant species (%)50.771.878.081.5
Table 3. Results per unit of canopy cover of dominant species in RED and EXPO parks. [** EXPO Park, * RED Park; R = Recommended, P = Priority].
Dominant Species ParksSuggestion
Tbilisi City
Hall
Carbon
Sequestration
(g m−2 yr−1)
Avoided
Runoff
(l m−2 yr−1)
Pollution
Removal
(g m−2 yr−1)
Total
VOCs
(g m−2 yr−1)
Aesculus hippocastanum **R259.118.28.10.3
Cedrus deodara *P473.416.87.64
Cupressus sempervirens **R403.117.77.84.1
Fraxinus americana ** 397.924.310.80
Fraxinus excelsior **P242.810.54.70
Ligustrum japonicum **P1012.35.412.9
Morus alba * 212.116.27.31.8
Picea pungens **R314.821.99.714.5
Platanus orientalis **P219.420.47.64.5
Platycladus orientalis * 352.89.74.41.7
Styphnolobium japonicum *P181.911.45.15.9
Tilia cordata ** 349.418.48.20
Tilia platyphyllos *P248125.40
Publisher’s Note: MDPI stays neutral with regard to jurisdictional claims in published maps and institutional affiliations.

