1. Introduction
The main component of the terrestrial biosphere is vegetation and it plays an active role in the climate system through the exchange of energy, carbon, water and momentum between the biosphere and the atmosphere [
1,
2]. In recent decades, land use change and climate variability have been affecting the terrestrial biosphere through changing the energy balance [
3]. Human-induced land use change and climate variability could have pronounced effects on agricultural production, forestry, natural ecosystems and biodiversity in the future [
4]. Commonly, precipitation and temperature are two important climate drivers that affect plant growth and distribution, albeit other climate drivers such as soil moisture, solar radiation, atmospheric CO
2 concentrations and nutrients, among others also regulate the vegetative growth. Over the Indian continental regions, average temperatures during the summer monsoon season (June–September) have increased by 0.25 °C since the mid-1990s [
5] and are projected to rise by up to 2.8–3.8 °C in the future in response to the build-up greenhouse gases in the atmosphere [
6,
7].
From a climate point of view, India receives more than 75% of rain during the monsoon (June–September) season. A shift in precipitation pattern can have a profound impact on agriculture, forestry and water resources in India. The vegetation growth pattern and responses are highly dependent on the monsoon-dominant climate over the Indian subcontinent [
6,
8] and the spatial patterns of precipitation are highly shaped by the peculiar orographic features, such as the Himalayas, the Karakoram and the Hindukush [
6]. The southwest monsoon originating from the Bay of Bengal is also a primary source of rainfall over South Asian countries such as Pakistan, Bangladesh, Myanmar, Nepal and Sri Lanka [
9]. The seasonal trends of monsoon rainfall in India during the past three decades (1980–2010) have been different over the eastern and western parts of the country. Previous findings suggested that the increasing rainfall trends are more profound west of 80°E, whereas largely negative or decreasing trends are present towards the eastern region [
10]. This asymmetry in trends of monsoon rainfall between eastern and western segments is mostly associated with changes in large scale thermodynamic parameters, such as wind speed and moisture content [
11].
Vegetation starts growing mainly from the onset of summer monsoon over the Indian subcontinent and within the growing season vegetation greenness is largely influenced by summer monsoon rainfall activities across large parts of the continent. The vegetation growth pattern is commonly used to monitor the productivity of natural forests and agricultural lands, and trends such as “declining or browning” and “increasing or greening” have been commonly used, including assessment of the climate feedback mechanism [
12,
13,
14,
15]. These trends are not constantly monotonic but can change from positive to negative trends and vice versa.
Several studies have used the remotely sensed vegetation indices, such as the normalized difference vegetation index (NDVI) and leaf area index (LAI) to determine variations and trends in vegetation growth [
13,
16,
17]. Changes of NDVI trend can be either gradual or abrupt, or more rarely, non-existent [
13], and the shift from one to another one can be computed using the breakpoints (change points) in trends [
18]. Regardless of changes in NDVI trend spatially and temporally, the critical issue is detecting the changes for understanding the process in the context of broader global change. Commonly, a browning trend (decreasing NDVI) of vegetation greenness is considered to indicate a decrease in the plant growth rate as an indicator of phenological change [
19], crop status [
20], inter-annual dynamics of vegetation [
21], land cover change [
22], stress and land degradation [
23], temperature-induced drought stress or insect disturbances [
24,
25], fire activity [
26] and ocean circulation anomalies [
27]; assessment of vegetation response to climate change should be considered is such cases [
28]. In contrast to browning trends, a greening trend (increasing NDVI) of vegetation greenness is interpreted as increase photosynthesis and plant growth and attributed to increasing temperatures [
29], earlier spring onset [
18,
30], lengthening of the growing season [
31,
32], rainfall or reduced snow cover [
33,
34], the atmospheric CO
2 fertilization effect [
35], decreasing cloud cover with associated increases in solar radiation [
36], El Nino-Southern Oscillation (ENSO) and the positive phase of the Arctic Oscillation (AO) signal [
37]. Thus, the greening trend helps to account for the increase of carbon drawdown in the terrestrial biosphere [
38].
Typically, NDVI is used to monitor vegetation growth and is known as a surrogate measurement of plant photosynthetic activity [
31]. NDVI is related to structural properties of plants, such as LAI, green biomass, chlorophyll content, foliar nitrogen and productivity [
39,
40]. The NDVI normalizes green leaf scattering in the near-infrared range and chlorophyll absorption in the red wavelengths. NDVI is a scalable index derived from the near-infrared (0.72–1.0 µm) and red bands (0.58–0.68 µm) and is commonly linked to a variety of vegetation properties and may have multiple explanations for a change in greenness signals. The third generation of the GIMMS NDVI (NDVI3g) data is the only global vegetation record which spans over three decades [
41] and allows the quantification and assessment of vegetation changes as a result of changes in ecosystem properties and changes in climate conditions. The most vulnerable ecosystems to climate change are forest and agriculture in South Asia [
42] because climate change affects agriculture and food system performance by shifting the spatial and temporal patterns of temperature, rainfall and water availability, land use land cover (LULC), biodiversity and other resources. Climate change and land degradation are particularly important drivers of food insecurity [
43,
44], and thus, climatic-driven agriculture ecosystems and food security are emerging as pressing issues across the subcontinent.
Agriculture is the most important livelihood activity in the Indian subcontinent region, providing a substantial source of rural income, employment and food. About 50–75 % of the total work force which belongs to low income, poor and vulnerable sections of society are still engaged in various land-based activities [
45]. The growth in food grain production and water facilities are not able to meet the population explosion. Furthermore, the dramatic climatic and environmental changes over the Indian subcontinent will change the conditions for food production, and thereby the critical scenario poses many challenges to achieving food security. A key aspect of this challenge is that ongoing and future climate changes are projected to have an adverse effect on agricultural production, especially in the Indian subcontinent where water scarcity is of immense concern [
46,
47]. Agricultural production is a key indicator for food security and several studies have explored the connection between crop yields, NDVI and food security [
48]. Typically, satellite-derived remote sensing indices such as NDVI and LAI are used as indicators of variation in food production [
5,
17,
49]. These studies suggested that mid-to-late season NDVI characterizes crop yields better than seasonal integrations or maximum NDVI values. Thereby, yield and reflectance relationships are typically robust after mid-season or during peak growing season [
49]. Moreover, their relationships can be strongest by masking the influence of non-agricultural vegetation’s signals based on LULC classifications derived from satellite data [
50,
51].
Based on earlier version of satellite vegetation records (1982–2003) derived from Advanced Very High Resolution Radiometer (AVHRR), Jeyaseelan et al. [
52] indicated the greening trend of NDVI (based-on annual average of NDVI) attributed to advancement in agricultural practices, especially during the 1980–1990s. However, the greening trend of NDVI started declining after 1998 in most of the meteorological subdivisions in India [
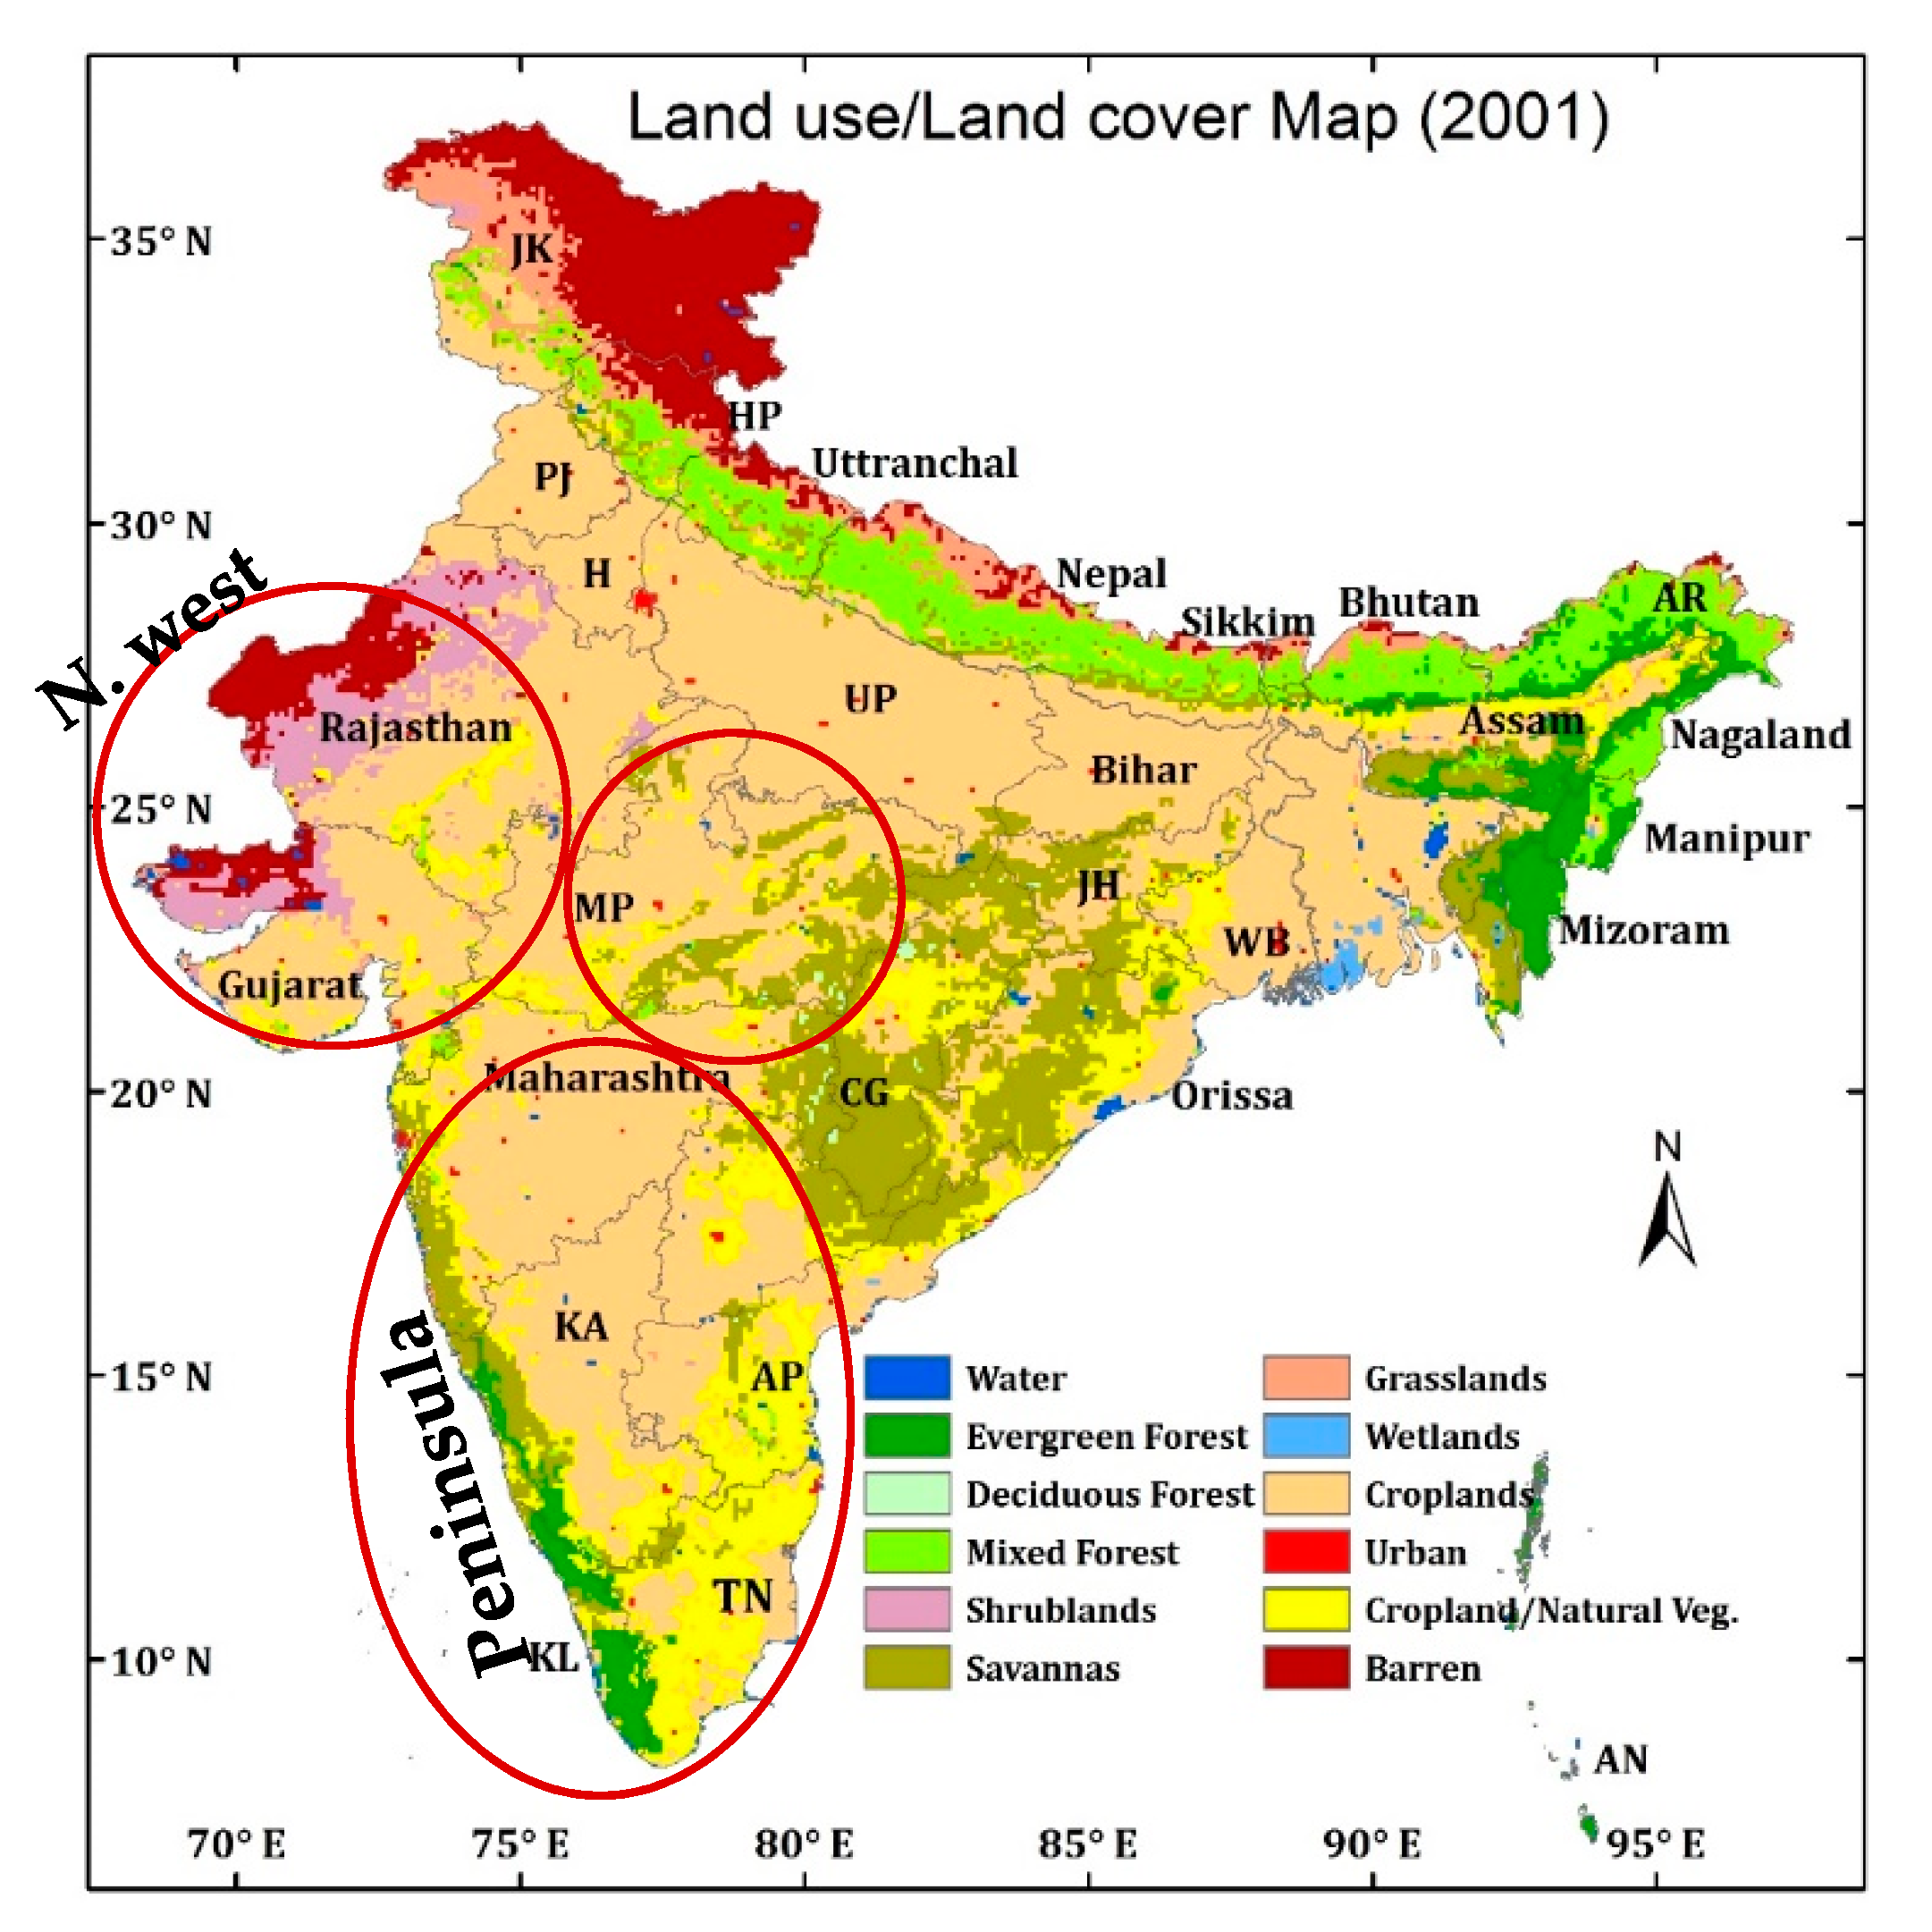
52]. It is still unclear how the natural forests and croplands have been responding to climatic and non-climatic drivers in recent decades. Thereby, the overarching objectives of this study were: (1) to analyze the inter-annual and seasonal vegetation trends (i.e., greening and browning) using unprecedented long-term NDVI3g records over the span of 1981/82–2015 with trend analysis carried out separately for two focal periods, the earlier period (1982–2000) and later period (2000–2015), and (2) to relate them with key driving factors (both climatic and non-climatic) and mechanisms leading to changes in forests and agriculture ecosystems in India with special focuses on the Northwestern Plain, Central India, and South Peninsula ecoregions. The analysis was performed by utilizing the unprecedented more than three decades (1981/82–2015) of satellite vegetation records of NDVI3g [
15,
53], climatic data (i.e., precipitation, temperature, solar radiation, and soil moisture), and historical long-term agriculture statistics (i.e., crop area, production, irrigated area, fertilizer use, among others). Unlike other studies those are mostly based on annual average of NDVI, here we analyzed annual average and the peak growing season of NDVI (July–October as kharif season and January–March as rabi season) because NDVI-yield relationships may be more significant by filtering out leaf-off seasons NDVI noise [
49]. Specifically, we emphasized changes of NDVI across the major ecosystems, such as forests, shrublands, savannas and agriculture across 5°N–40°N since these ecosystems are influenced by ongoing climate change and are also subject to water stress during peak growing seasons [
7].
4. Discussion
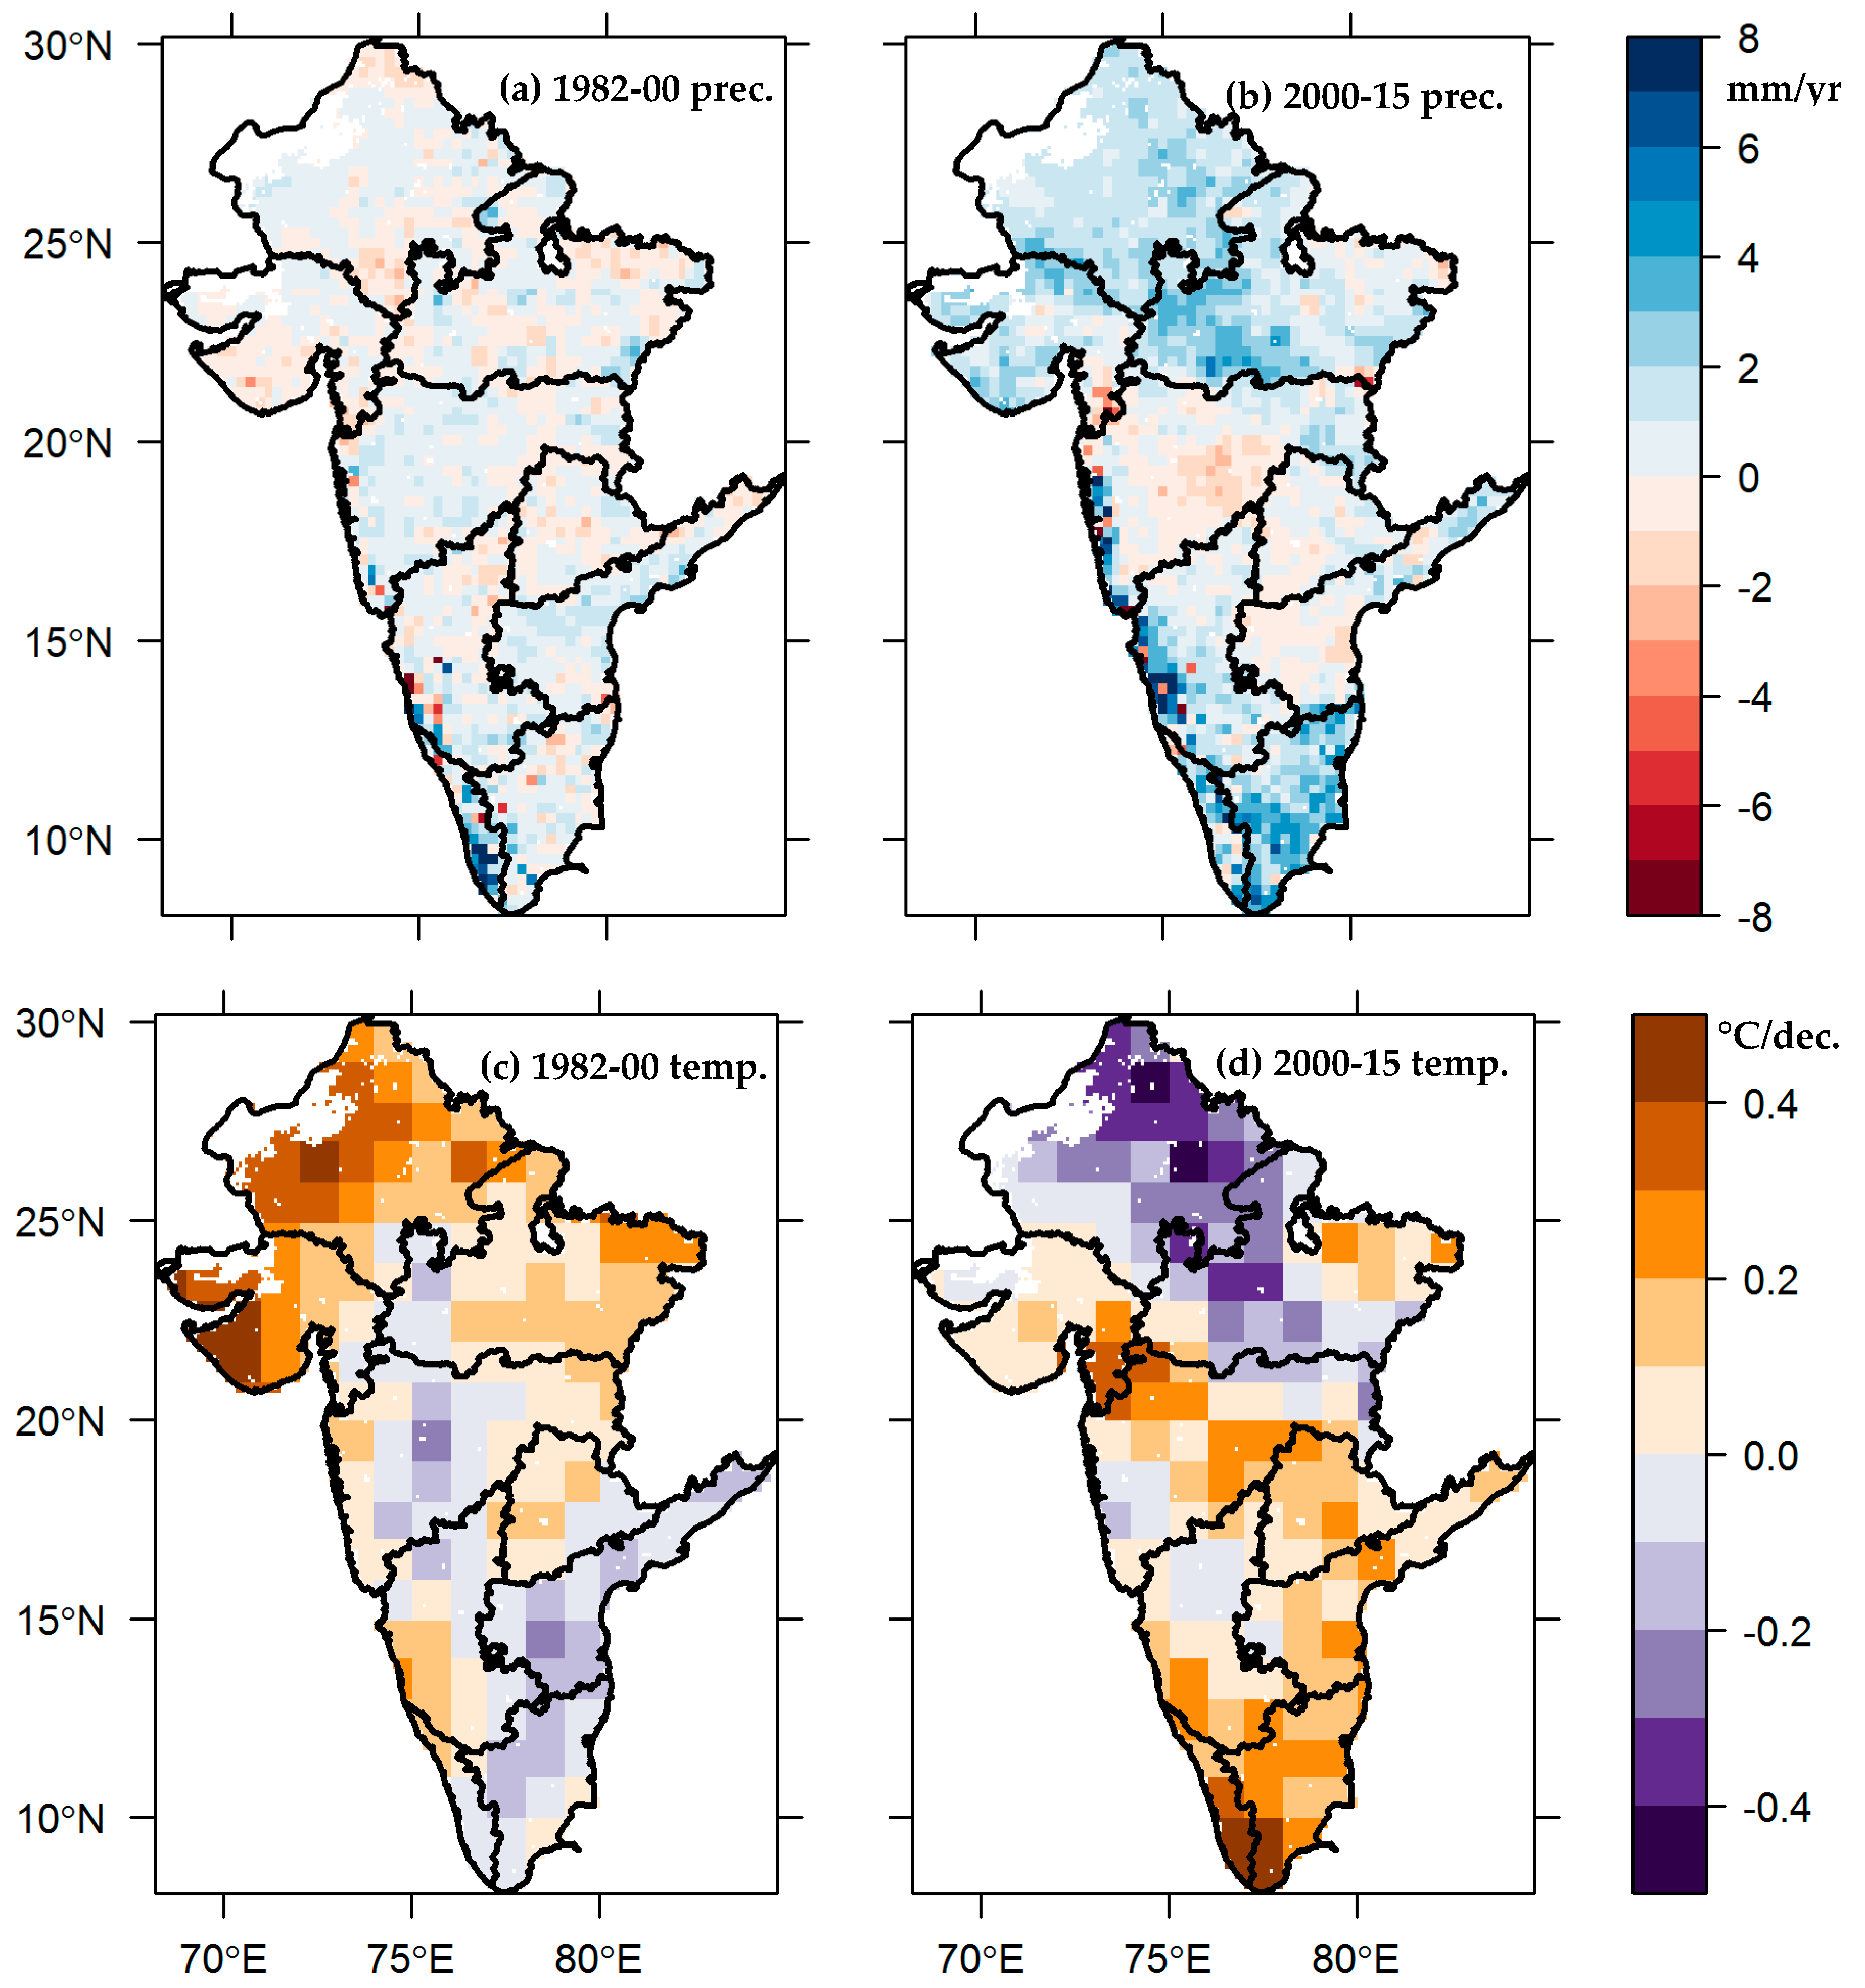
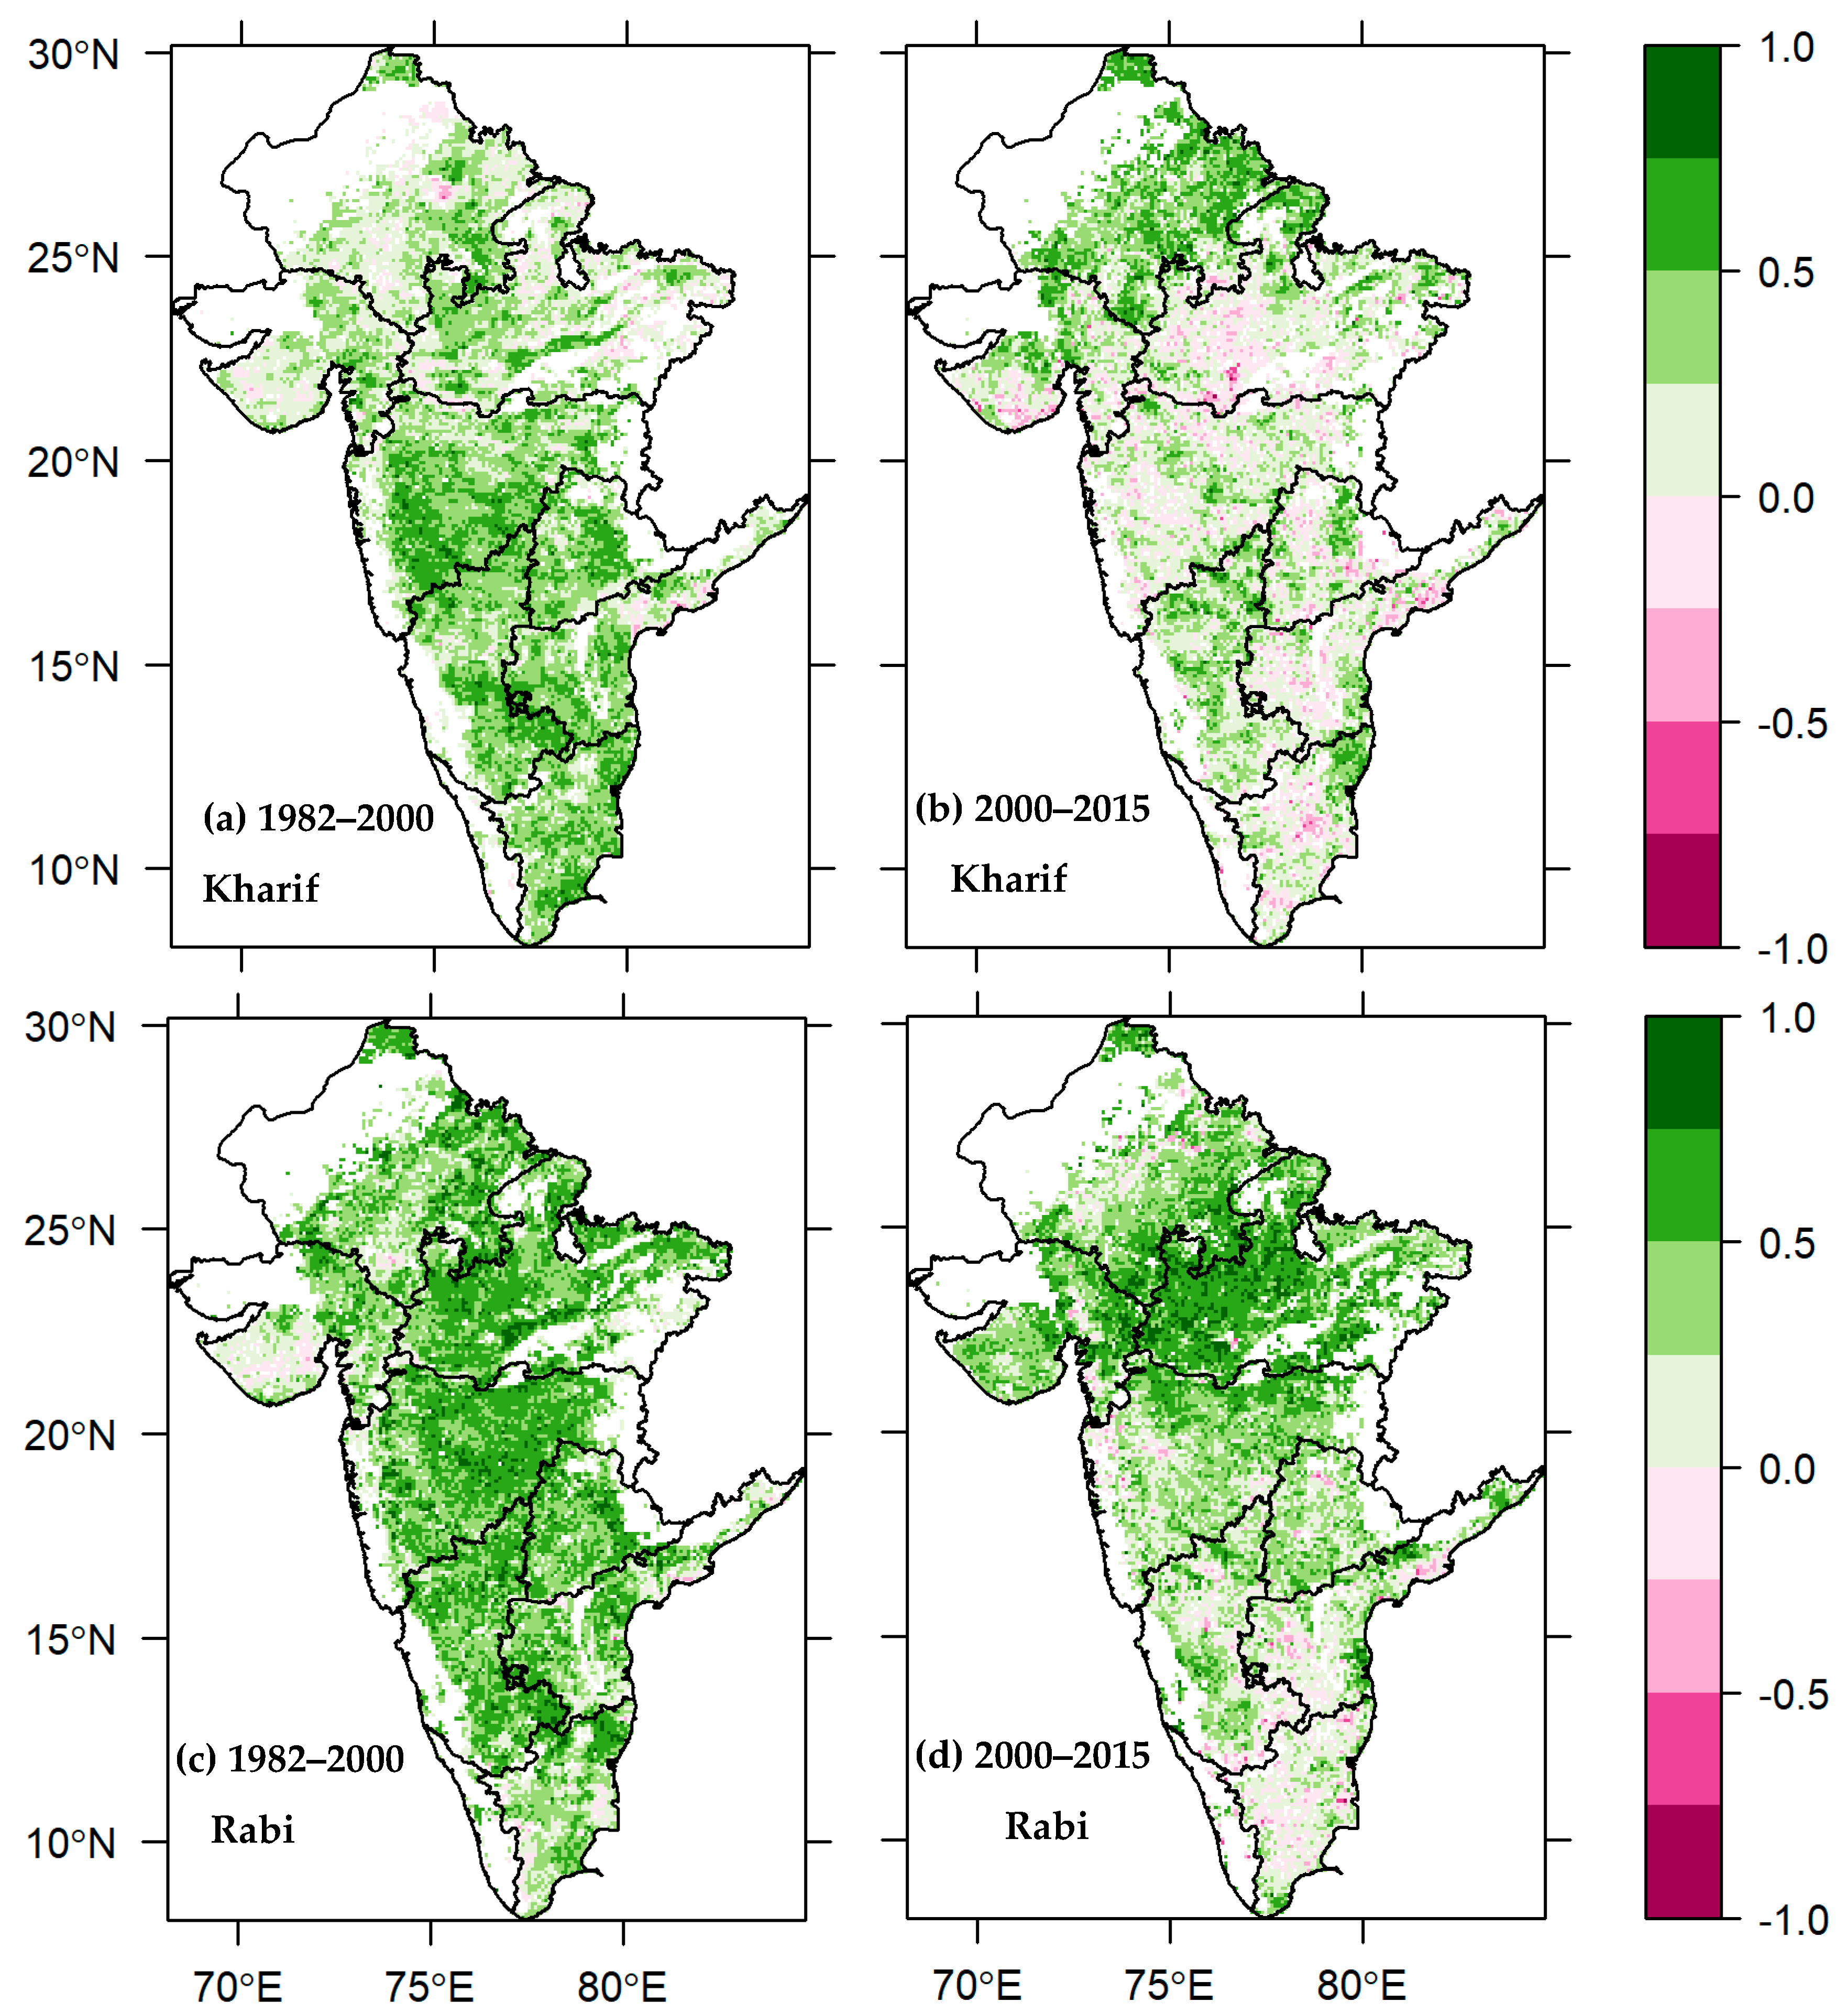
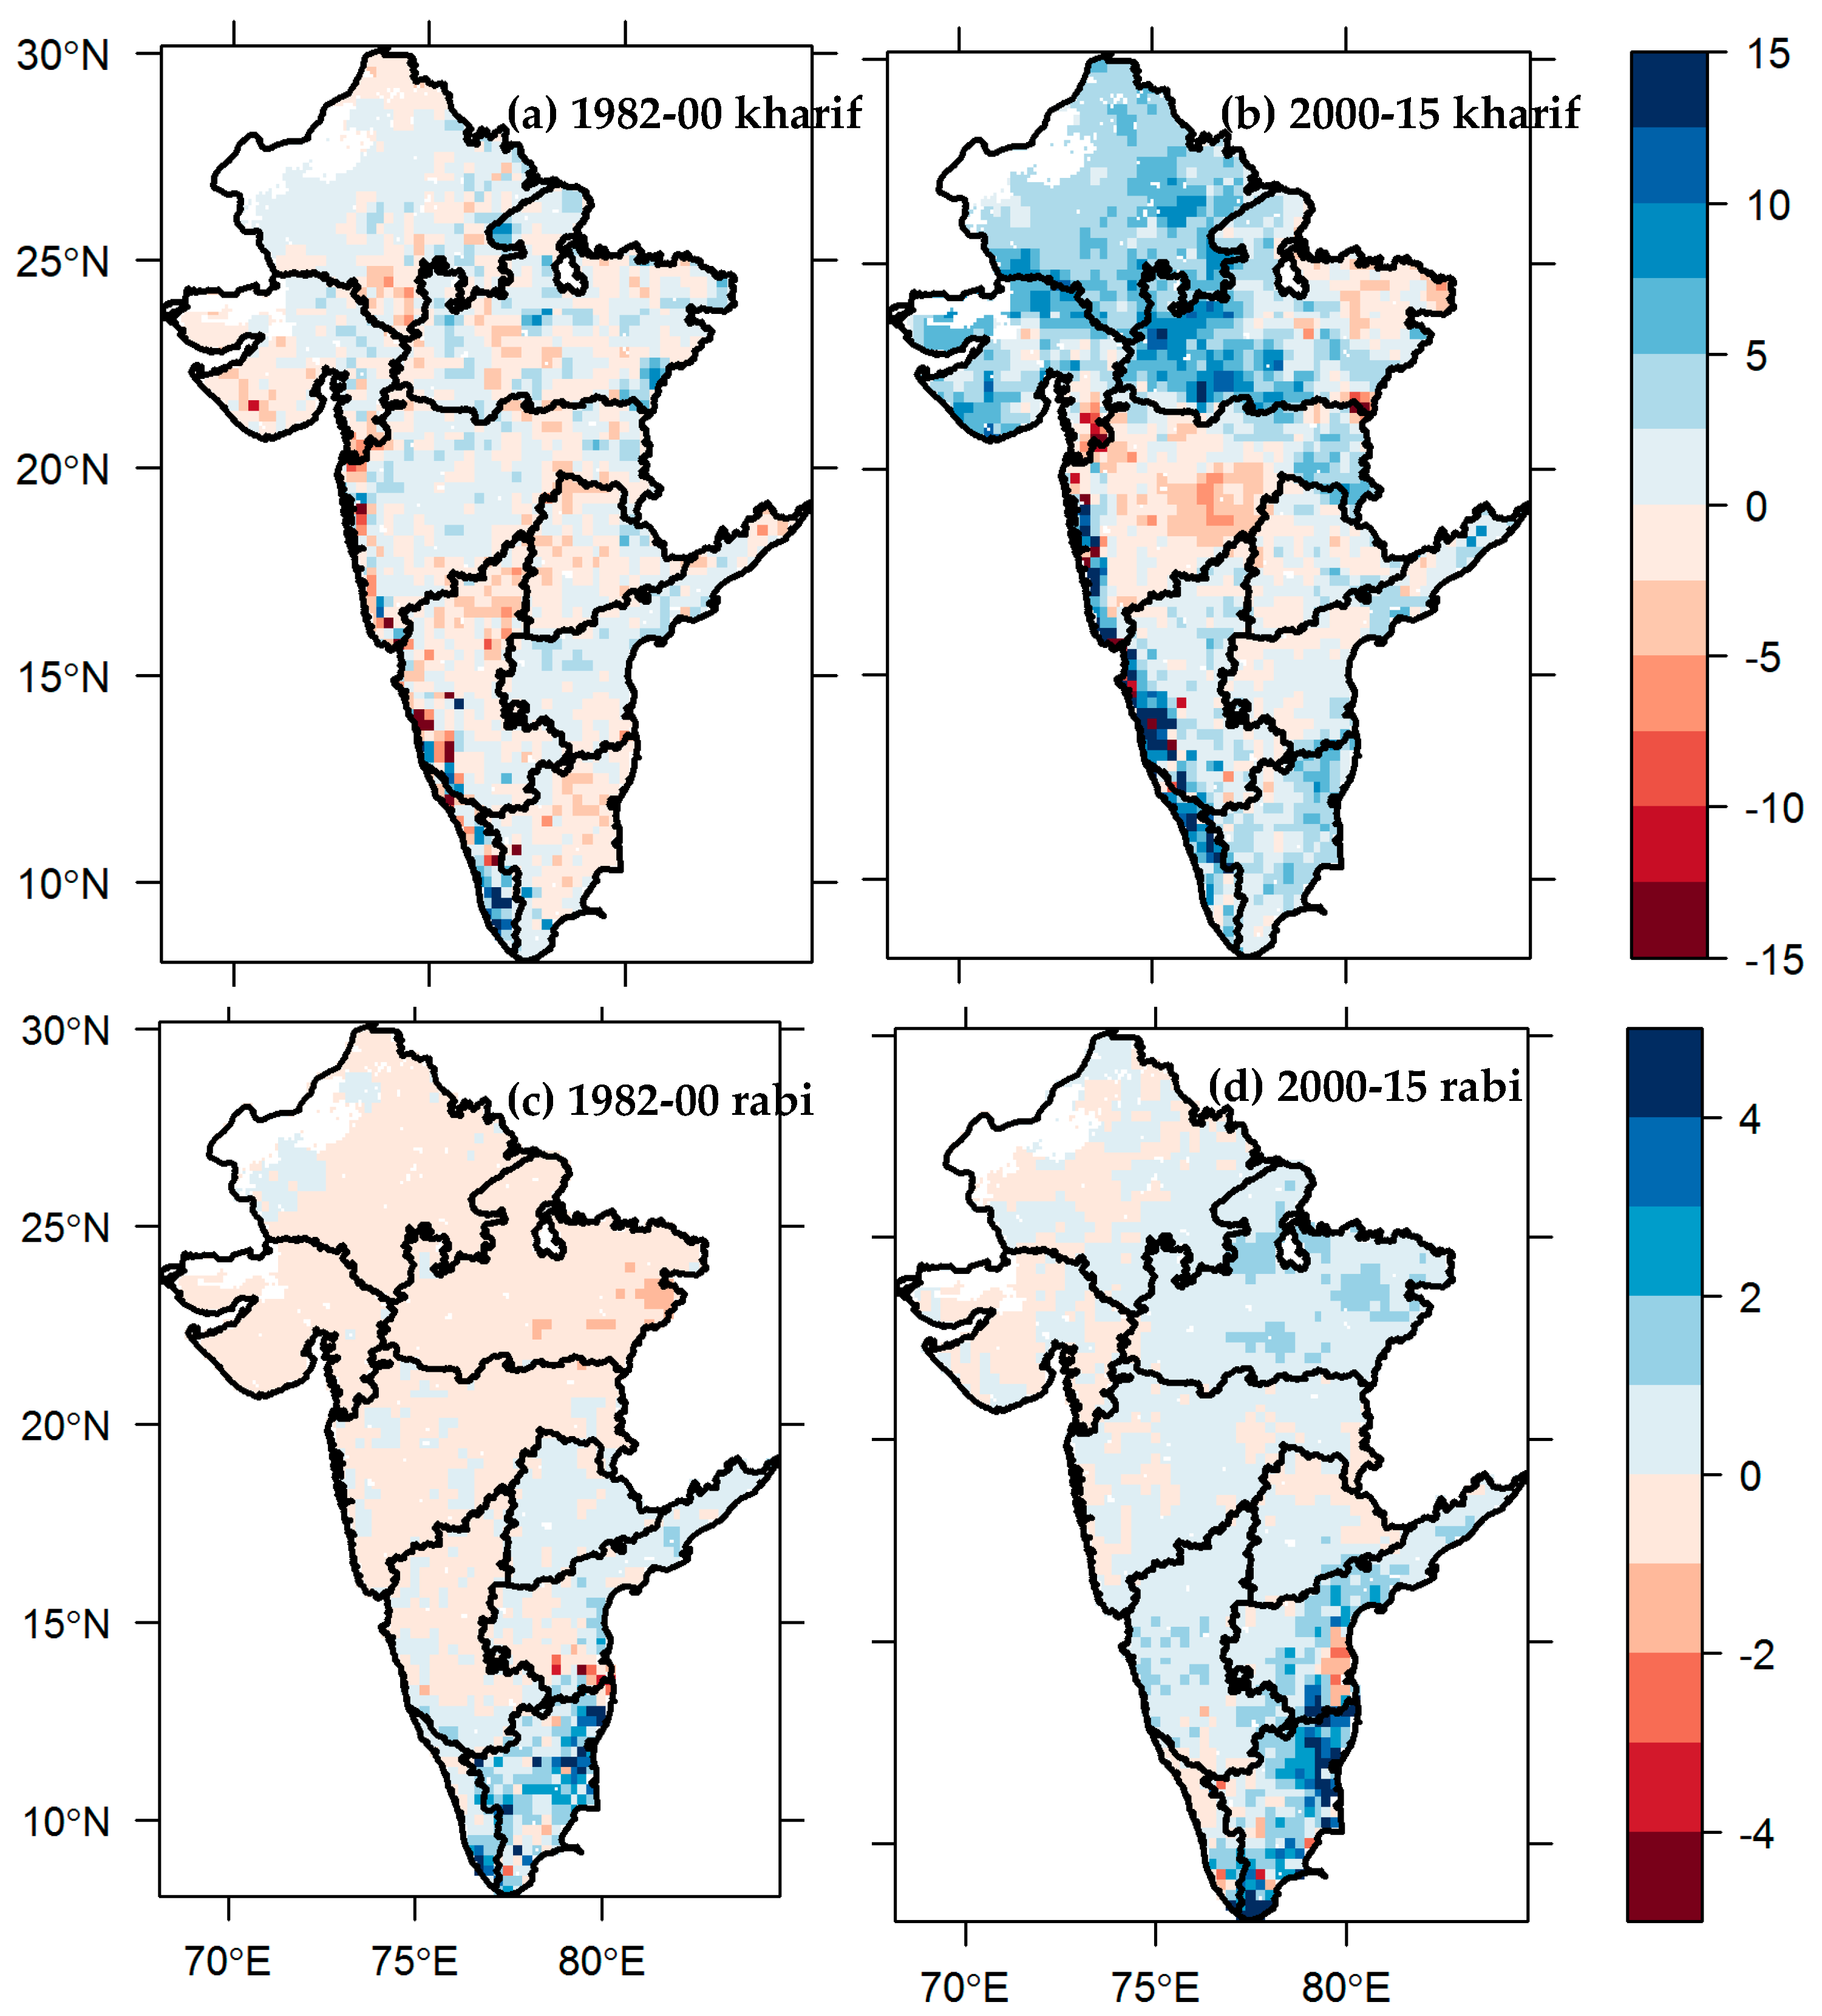
This study utilized satellite-derived NDVI time-series (1981/82–2015) data to characterize inter-annual and seasonal trends in vegetation (i.e., forests, woodlands, shrublands) and croplands over India to understand the both climatic and non-climatic drivers behind the observed changes. Both Mann–Kendall and Sen’s slope regression techniques were performed for every pixel to acquire the spatial patterns of linear trends of NDVI and climatic variables, and furthermore, correlation was computed among NDVI and climatic variables. Plants in the Northwestern Plain, Central India, and the South Peninsula are generally sensitive to climatic warming and the biomes, including croplands, were typically water-limited and not temperature-limited. Notably, in the more recent years (2000–2015), temperature increases (up to 1.0 °C/decade) were observed over these regions with pronounced warming in kharif season, In contrast, pronounced cooling trends of temperature (up to –1.0 °C/decade) were seen in the Rabi season. The warming trends in kharif season led to reductions in crop growth, which caused no trends or even browning trends in some parts of Central India, and the South Peninsula. The diminished crop growth pattern was stronger in the South Peninsula than in the Northwestern Plain and Central India. These outcomes are also consistent with some earlier studies that reported declined crop growth from the rabi and kharif seasons’ crops and mostly over the majorly water-limited foodgrain-producing states of India that show resilience for water shortage [
5,
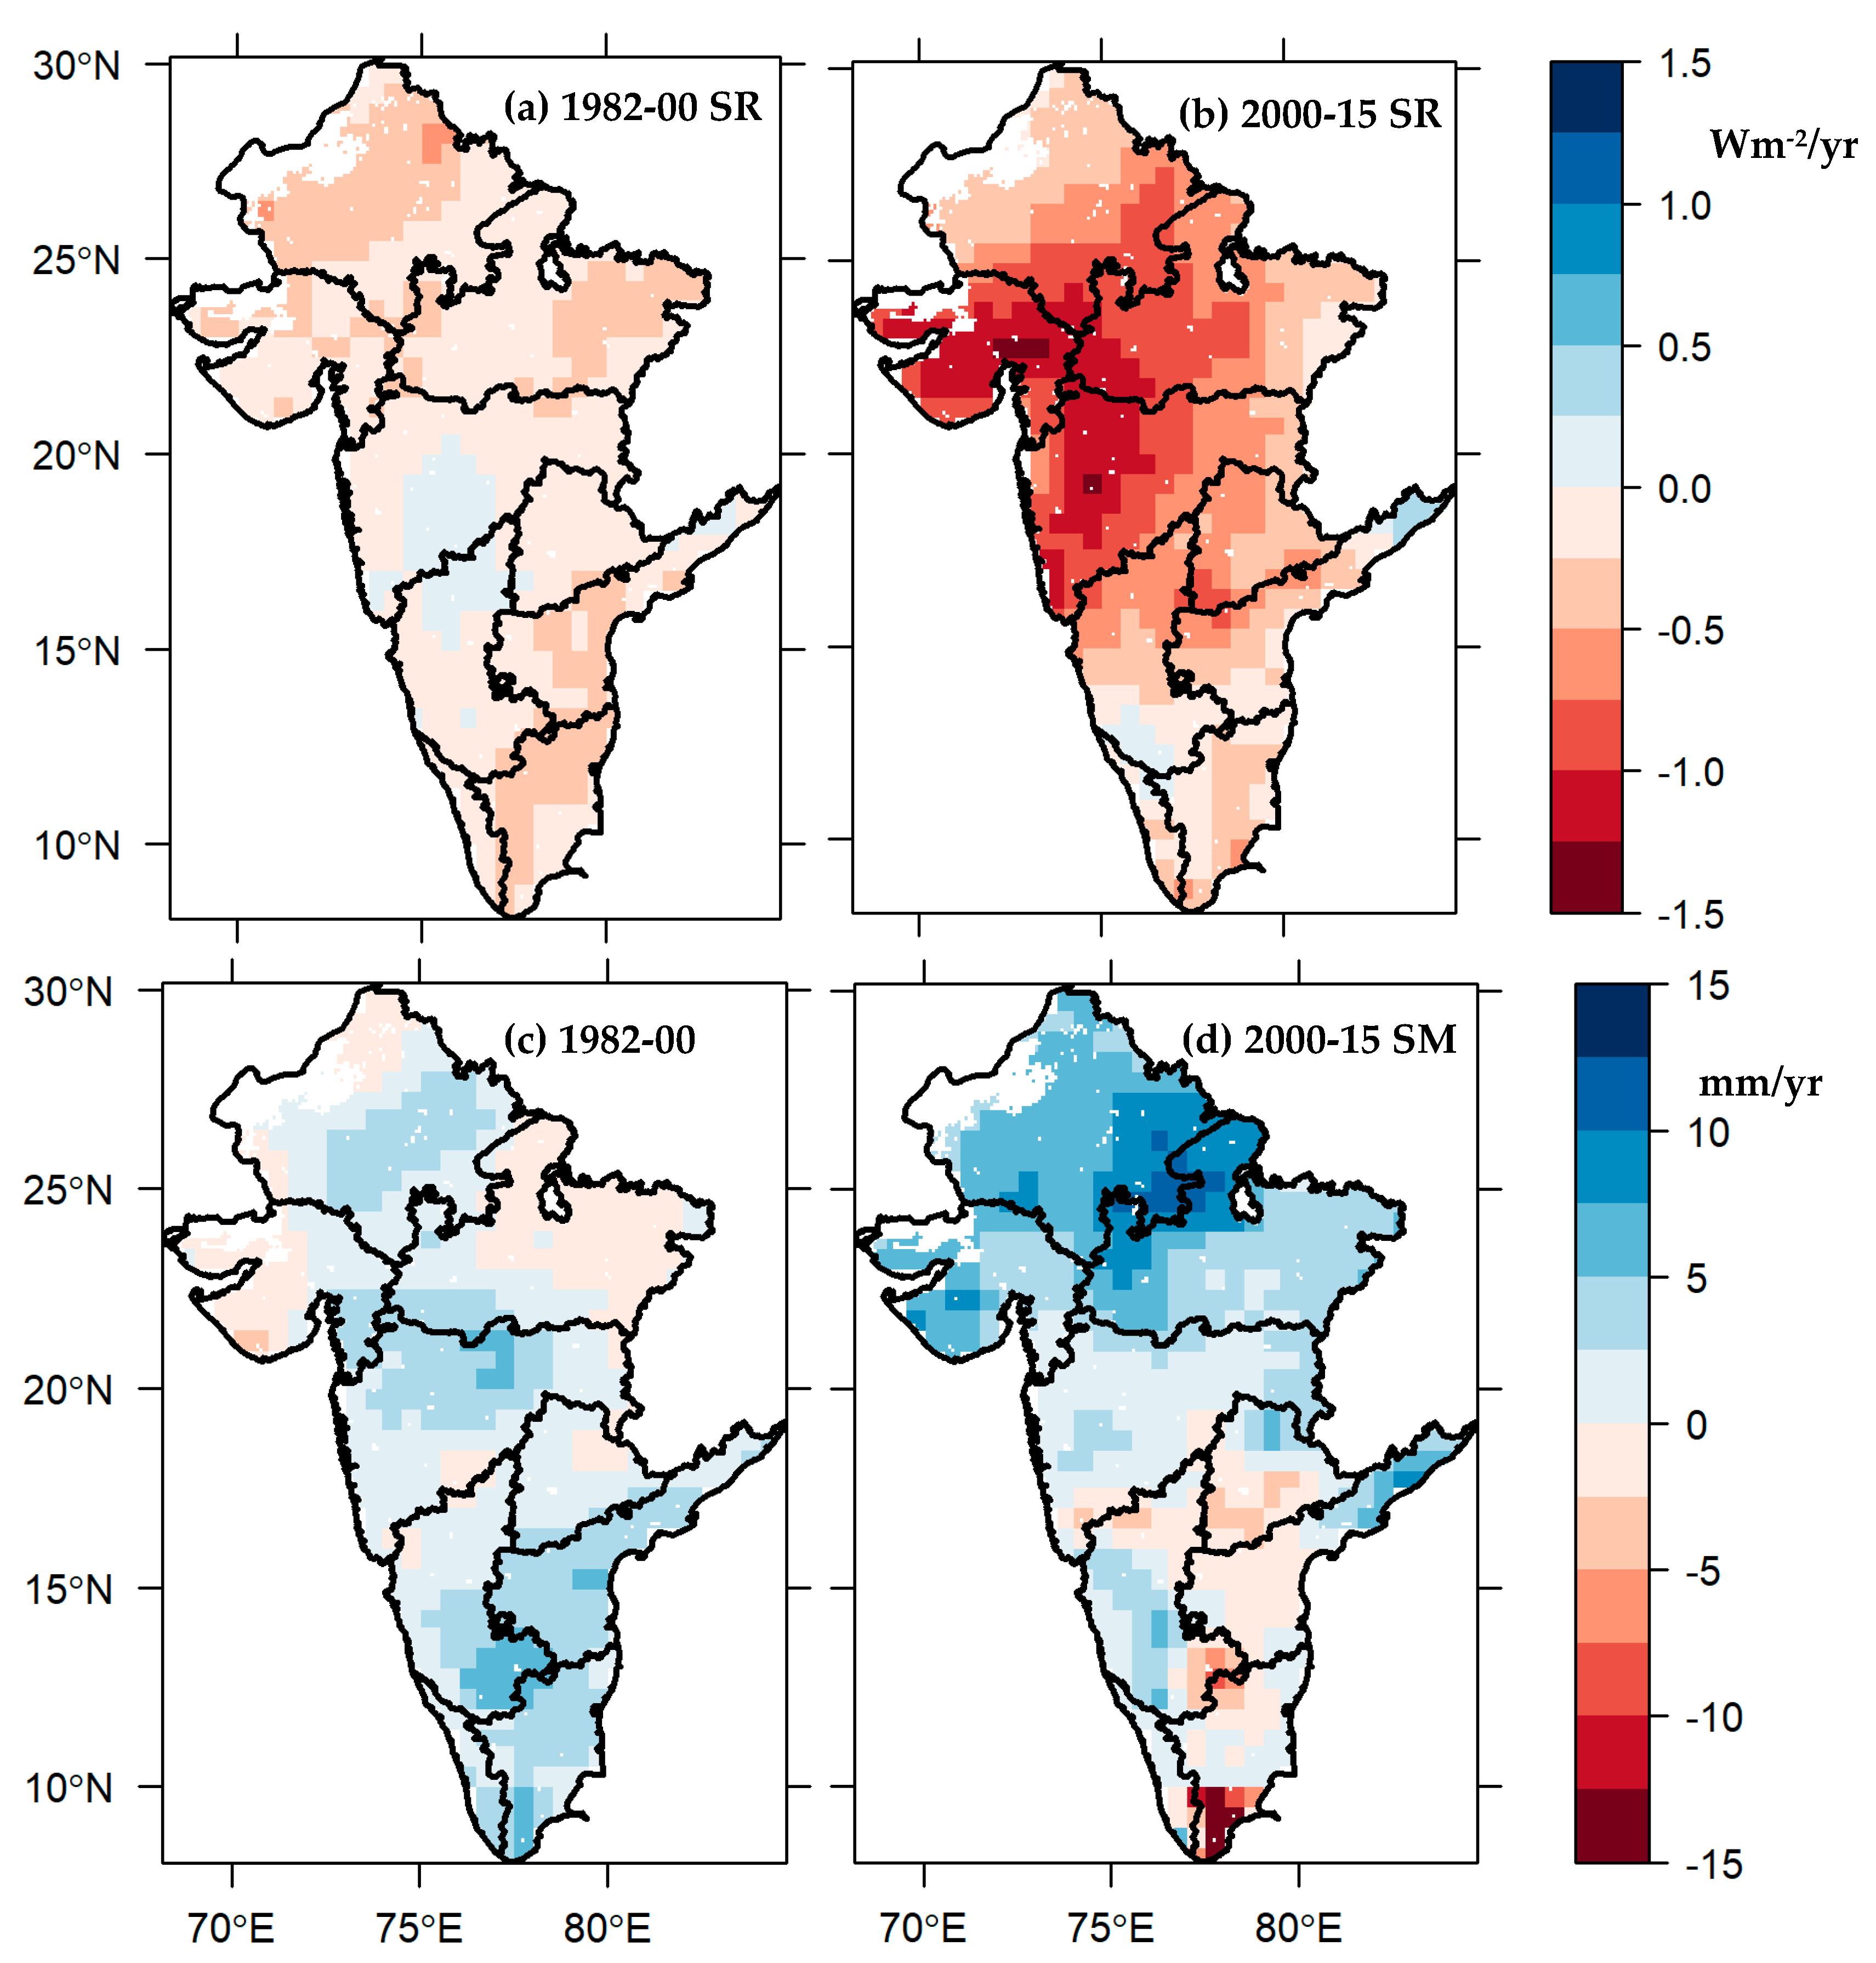
14]. Moreover, some parts of the Northwestern Plain and Central India (MP) displayed a continued greening trend in the later period (2000–2015), which can be associated with increasing trends of precipitation and soil moisture, a phenomenon known as moisture-induced greening. Furthermore, anthropogenic practices such as technology gains (new crop varieties and hybrids), expansion of irrigation facilities and increased access to surface waters have also supported the continued greening trends of croplands (
Table A1;
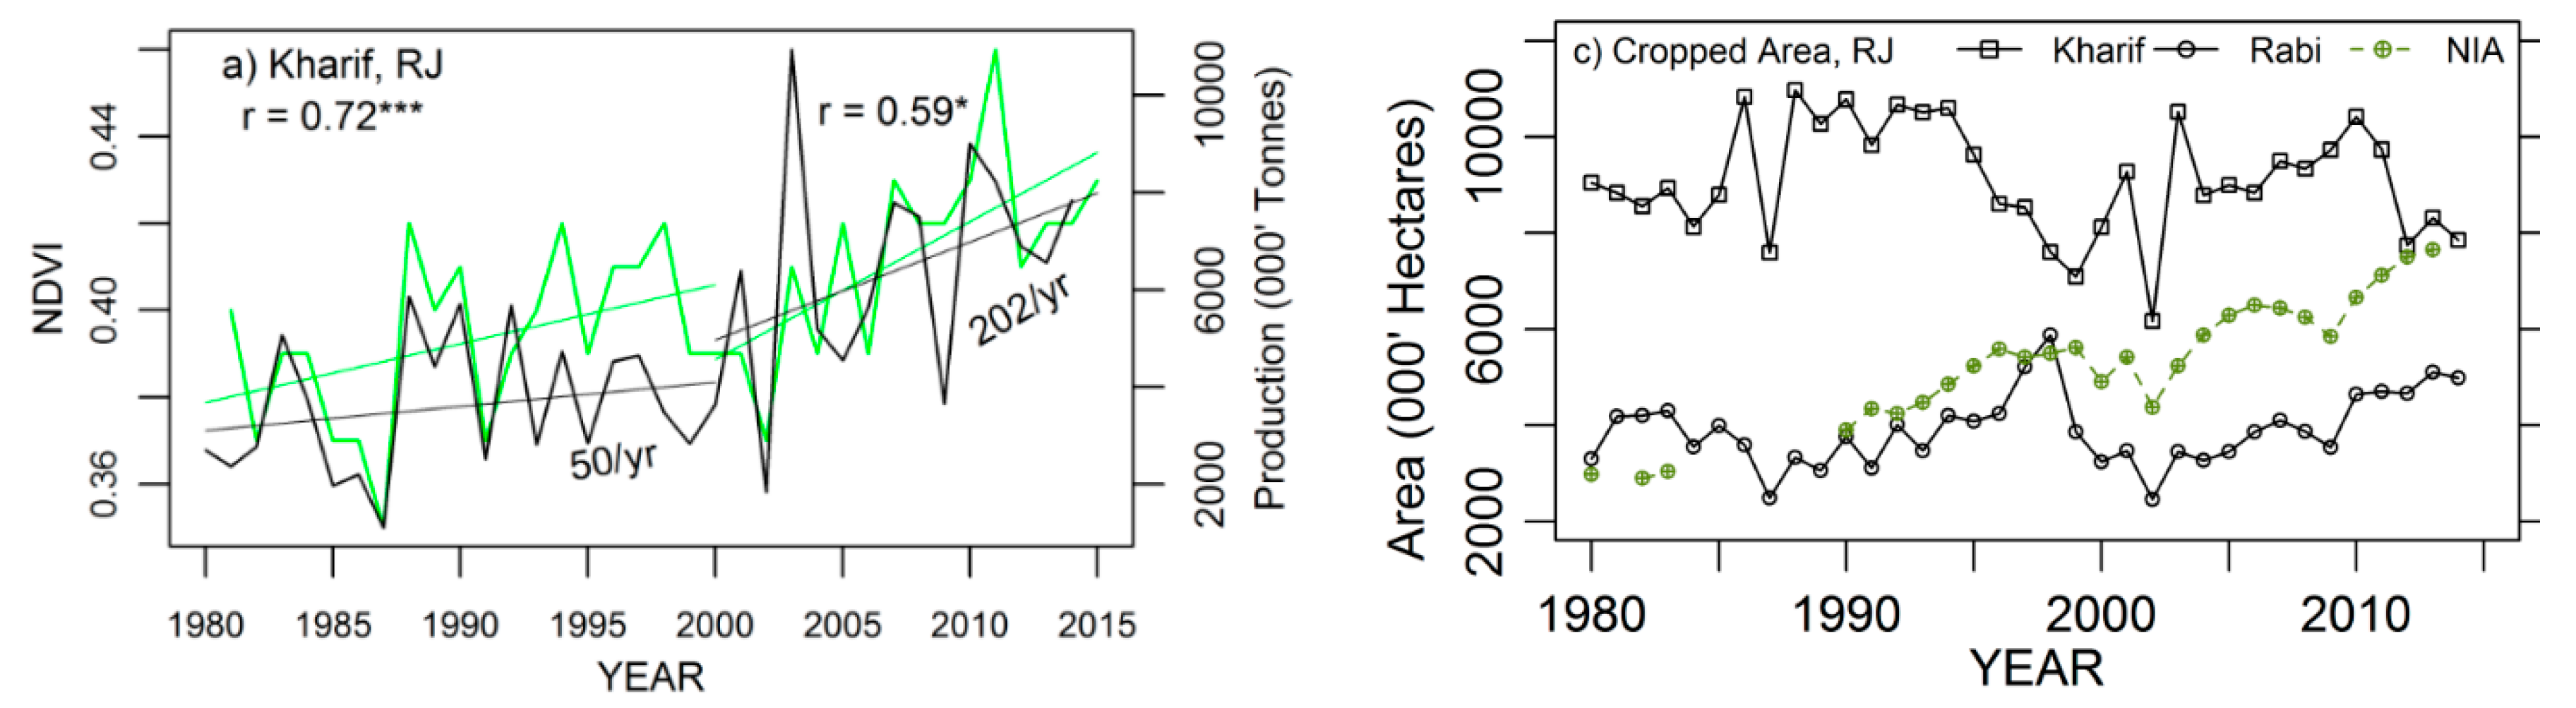
Figure 9c). A significant increase in kharif and rabi season foodgrain production was observed in Central India (Madhya Pradesh) owing to increasing trends of cropping and irrigated area with access to surface waters from the Gandhi Sagar Dam in the Chambal river. These findings are in line with the earlier studies which concluded kharif season growth enhanced over MP in the Chambal valley [
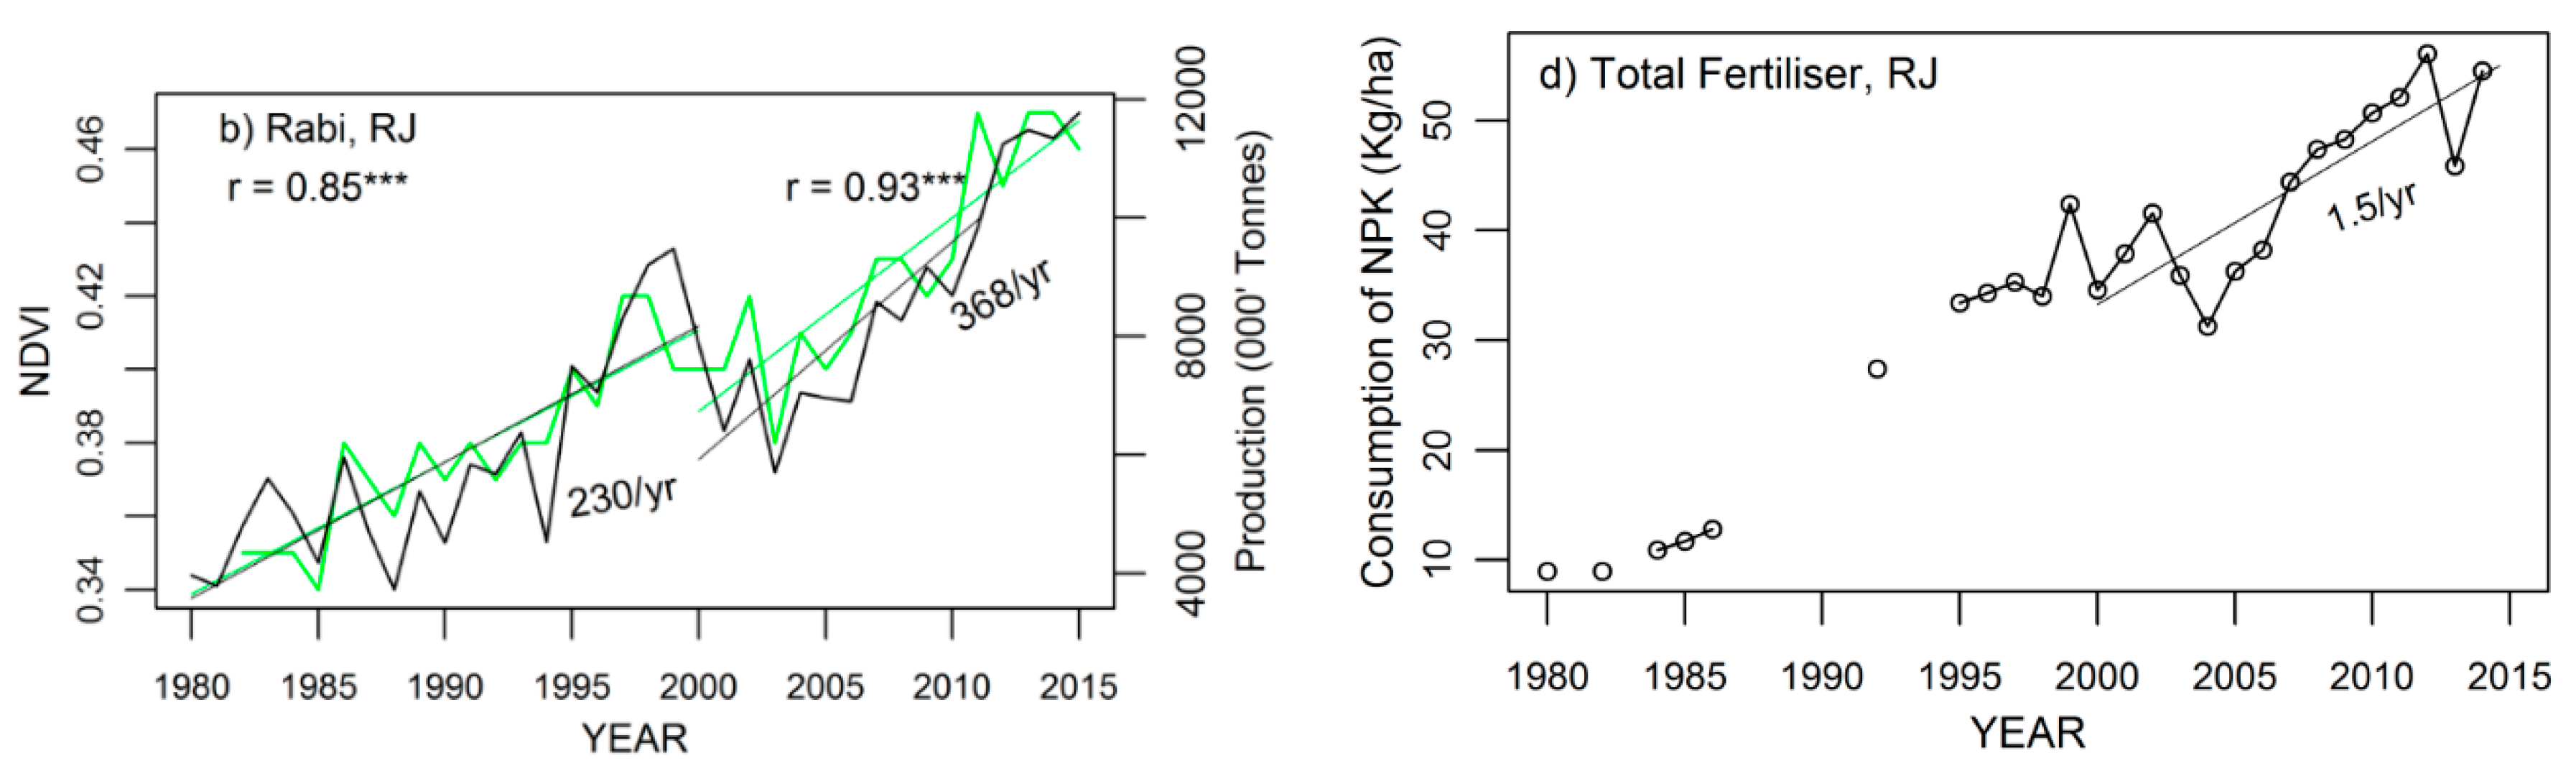
5]. It was also observed that there was an increased trend in consumption of fertilizers (3.8 kg/ha in a year) and has a positive relationship with crop growth.
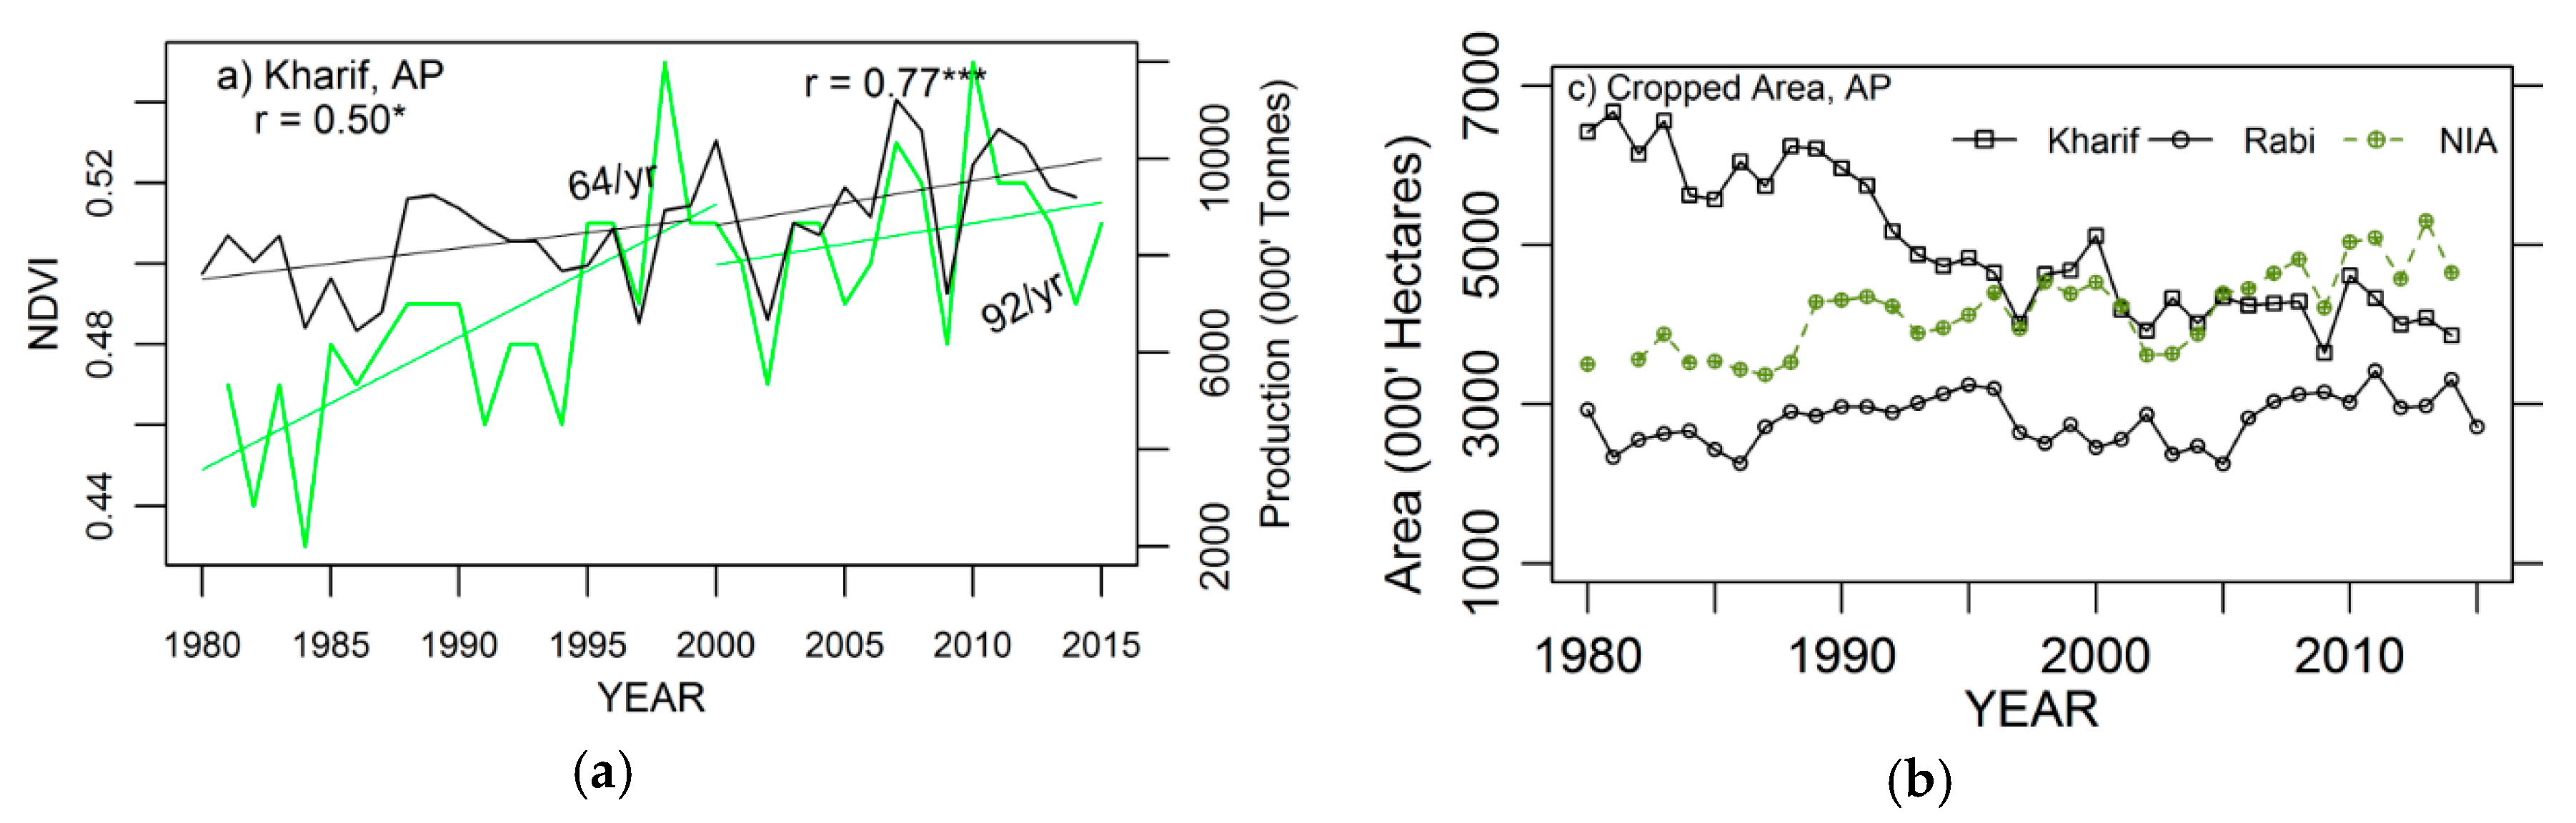
In the case of the South Peninsula, the greening trends of the earlier period during kharif season switched to large-scale absences of trends or browning trends in some parts of peninsula, which can be explained by warming trends of temperature and decreasing trends of precipitation and soil moisture, a phenomenon known as temperature-induced moisture stress [
72,
73], combined with human-induced LULC changes with clearance of natural vegetation for expansion of urban infrastructures. In rabi season, cooling trends of temperature and also increasing trends of precipitation/soil moisture were attributed to an increase in crop growth, especially over the Northwestern Plain and Central India. However, especially over the South Peninsula, the cooling trends of temperature was not beneficial for crop growth due to water limitation (i.e., negative trend of precipitation/soil moisture). In general, it was observed that greening trends were either sustained or even increased during the rabi season over the kharif season. It can be inferred that the winter season climatic factors contributed greater variability to the vegetation greenness in the Northwestern Plain, Central India and the South Peninsula. These observations are quite similar to those of Sarmah et al. [
16], who concluded that higher positive slopes or greening are persistent during the winter season.
Most of the earlier studies related to greening and browning trends have analyzed NDVI data over the Northern parts of India and South Asia by using either the 1982–2005 period, or in some cases 2001–2017 using either NDVI3g data or MODIS-based NDVI and LAI data [
16,
17,
71,
74,
75,
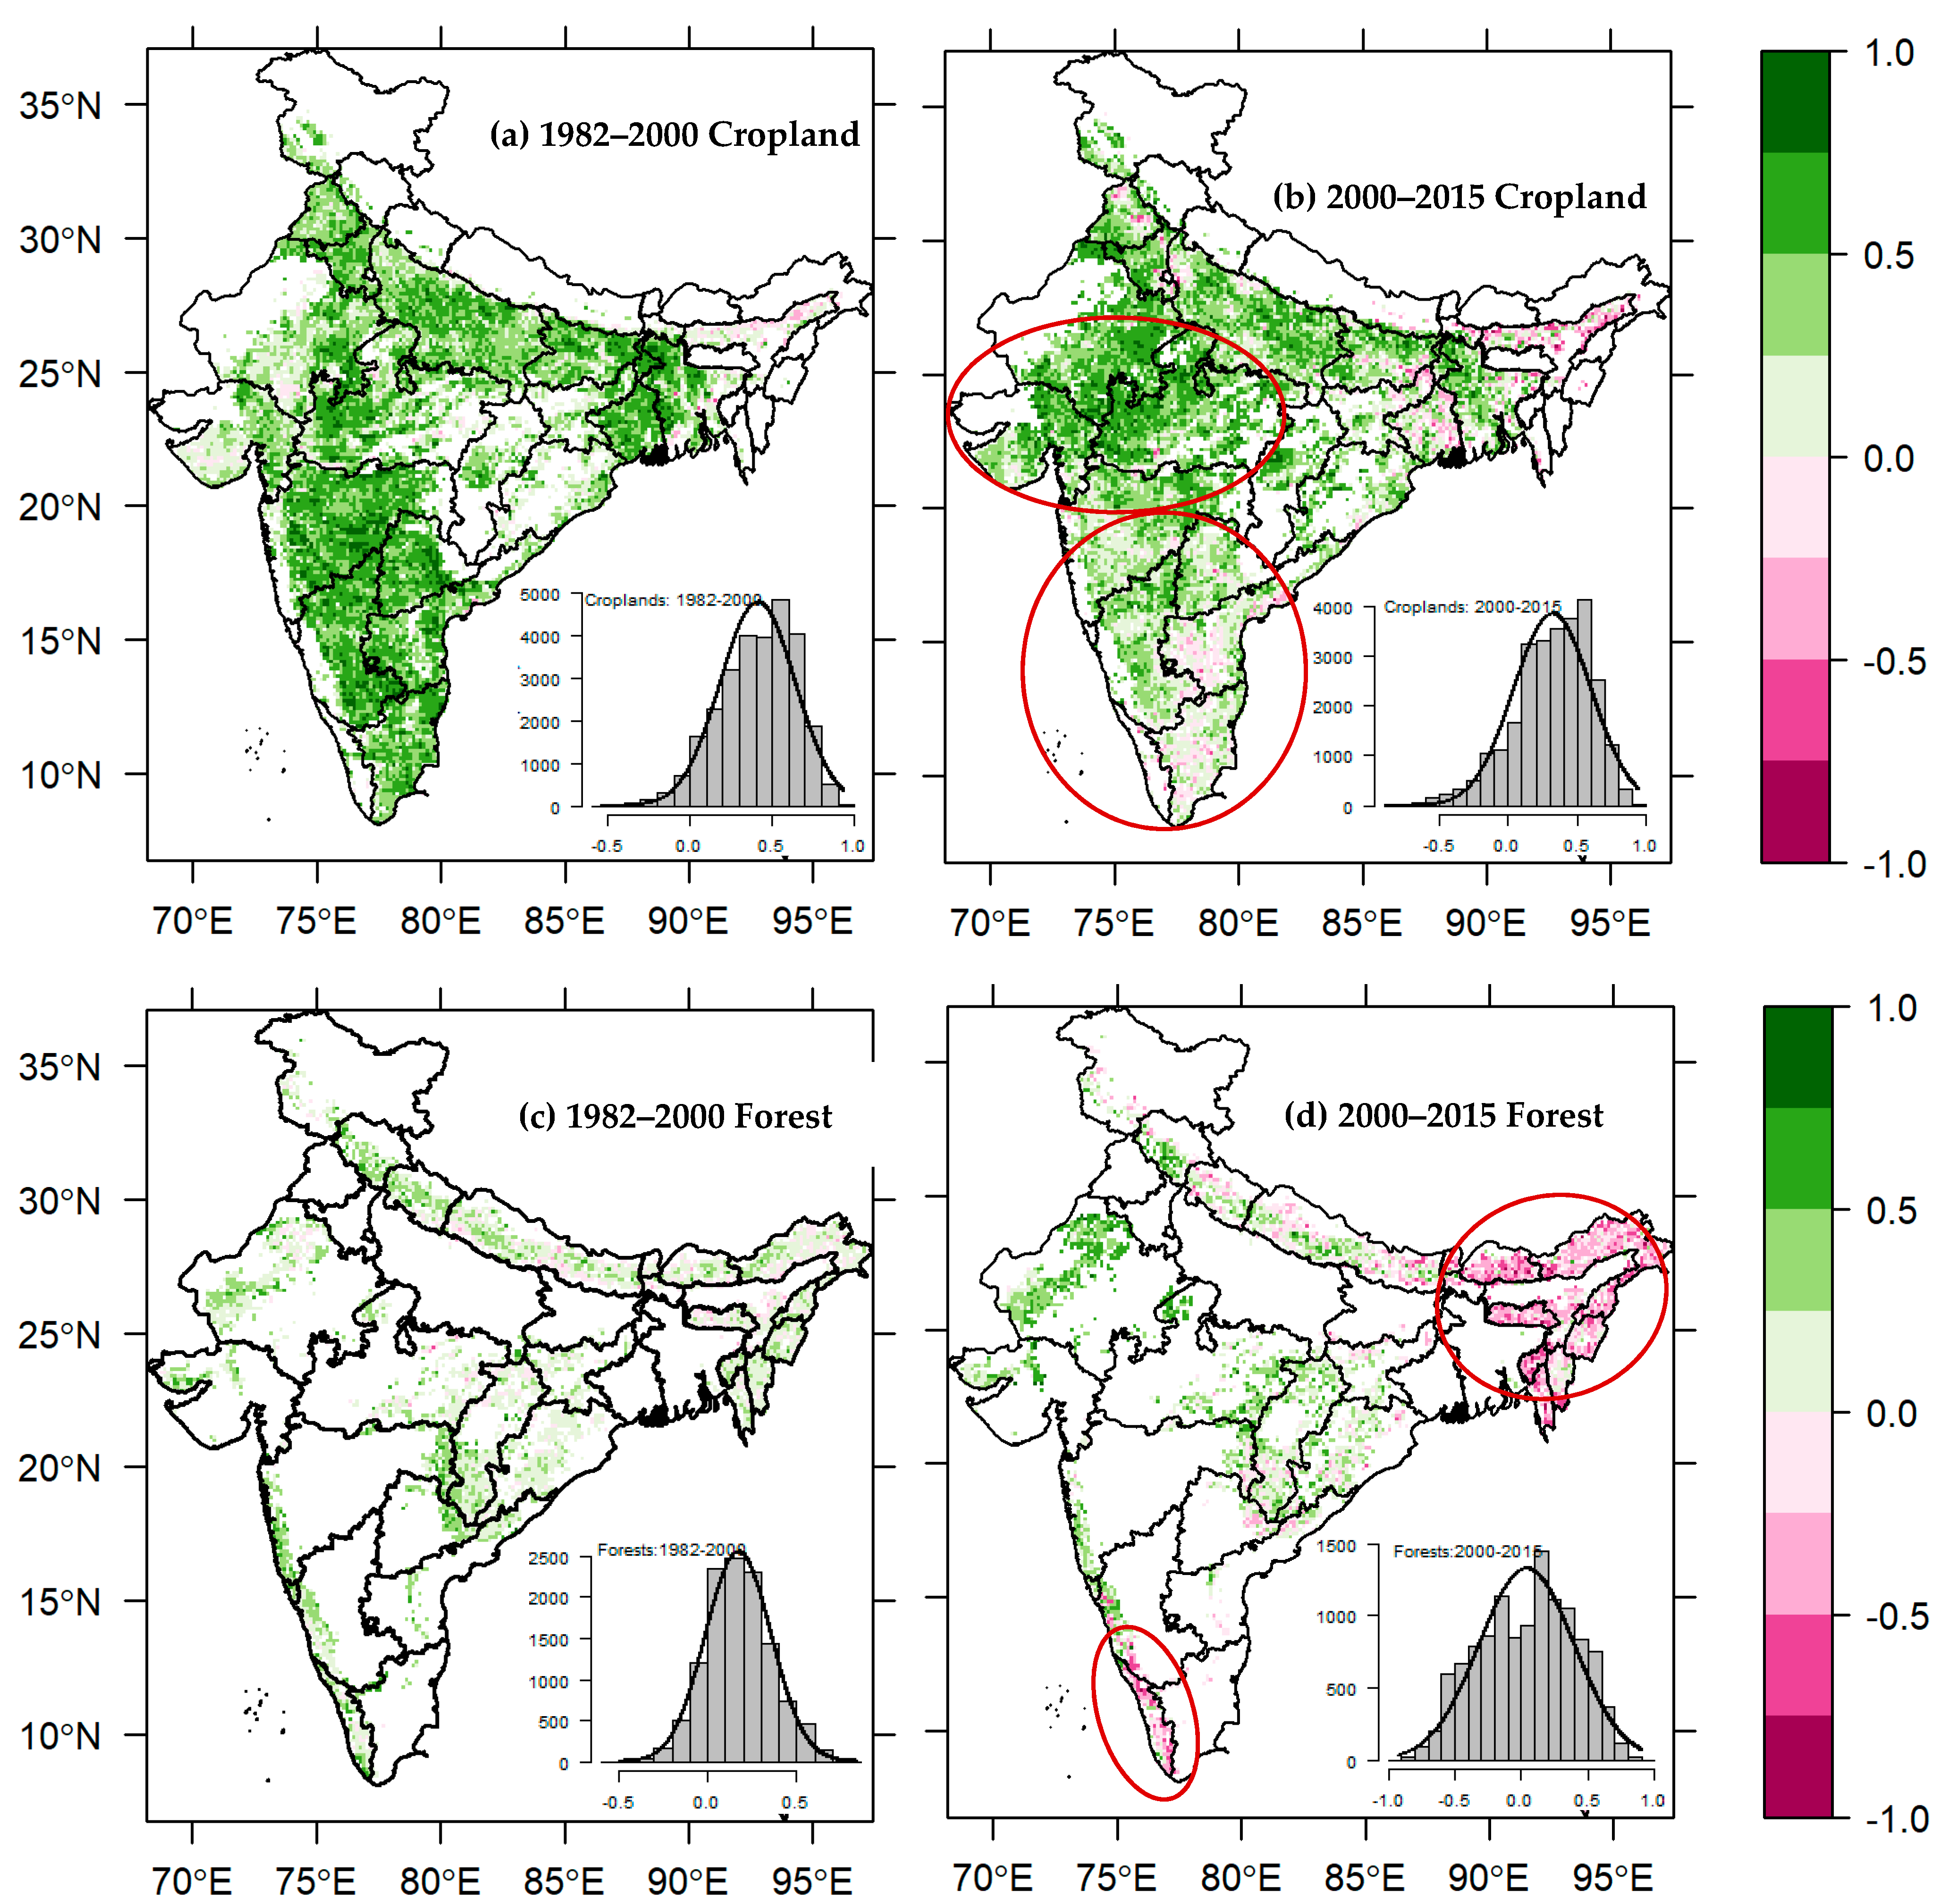
76]. None of the studies have analyzed NDVI trends of vegetation by using long-term time series vegetation data (1981–2015) separately before and after 2000 in response to climatic variables over the climatic sub-regions, such as the South Peninsula, Northwest India, Central India, and North and North-East India. Thus, in the present study, NDVI and climatic trends statistics were presented for the Indian subcontinent and for India’s aforementioned climatic sub-regions. The key findings revealed that nearly 88% of the greening trend was from croplands when whole-period NDVI data were employed (1982–2015) for the Indian subcontinent, and forests accounted for nearly 56% of greening trends. A recent study by [
17] analyzed the whole of India using MODIS-based LAI records over the span of 2001–2017 and concluded that the greening is mainly from croplands (82%) with minor contributions from forests (4.4%) in India. In contrast, Chakraborty et al. [
74] indicated 12% browning trends and 67% greening trends in natural vegetation (mostly forests and woody trees) in India by using MODIS NDVI data over the span of 2001–2014 [
17]. Our results depicted that vegetation over Northeast India and Himalayas had a browning trend over the period 2000–2015 because of declined precipitation/moisture and solar radiation trends with increased warming trend, a phenomenon known as temperature-induced moisture stress or temperature-induced drought stress (
Figure S1 and
Figure S2). These findings are also consistent with negative trends suggested by other studies [
14,
76] which were attributed to deforestation, shifting cultivation and human-induced land use conversion for urban expansion. In the Uttarakhand Himalayas, browning of vegetation was also reported by Mishra and Chaudhari [
75] associated with temperature-induced moisture stress which arose due to increased temperature with declines or no changes in precipitation. This phenomenon has an adverse impact on vegetation productivity [
72,
73] along with rising forest fires in Himalayan states [
77]. The key findings also depicted a greening of nearly 47% of vegetation in the early period (1982–2000) which continued and increased up to 80% in the later period (2000–2015) over the Northwestern Plain and Central India, and that can be attributed to increased vegetation productivity related to shrublands due to favorable environmental variables such as increased rainfall with decreased temperatures. In contrast, in the South Peninsula and the western peninsula (Maharashtra), greening of 71% vegetation area switched to 34% in the later period, and it was mostly associated with browning of vegetation in the Western Ghats due to temperature-induced moisture stress which was also reported by [
14,
16]. For instance, nearly 62% of forest pixels depicted a negative trend according to NDVI3g during 2002–2014 [
14].
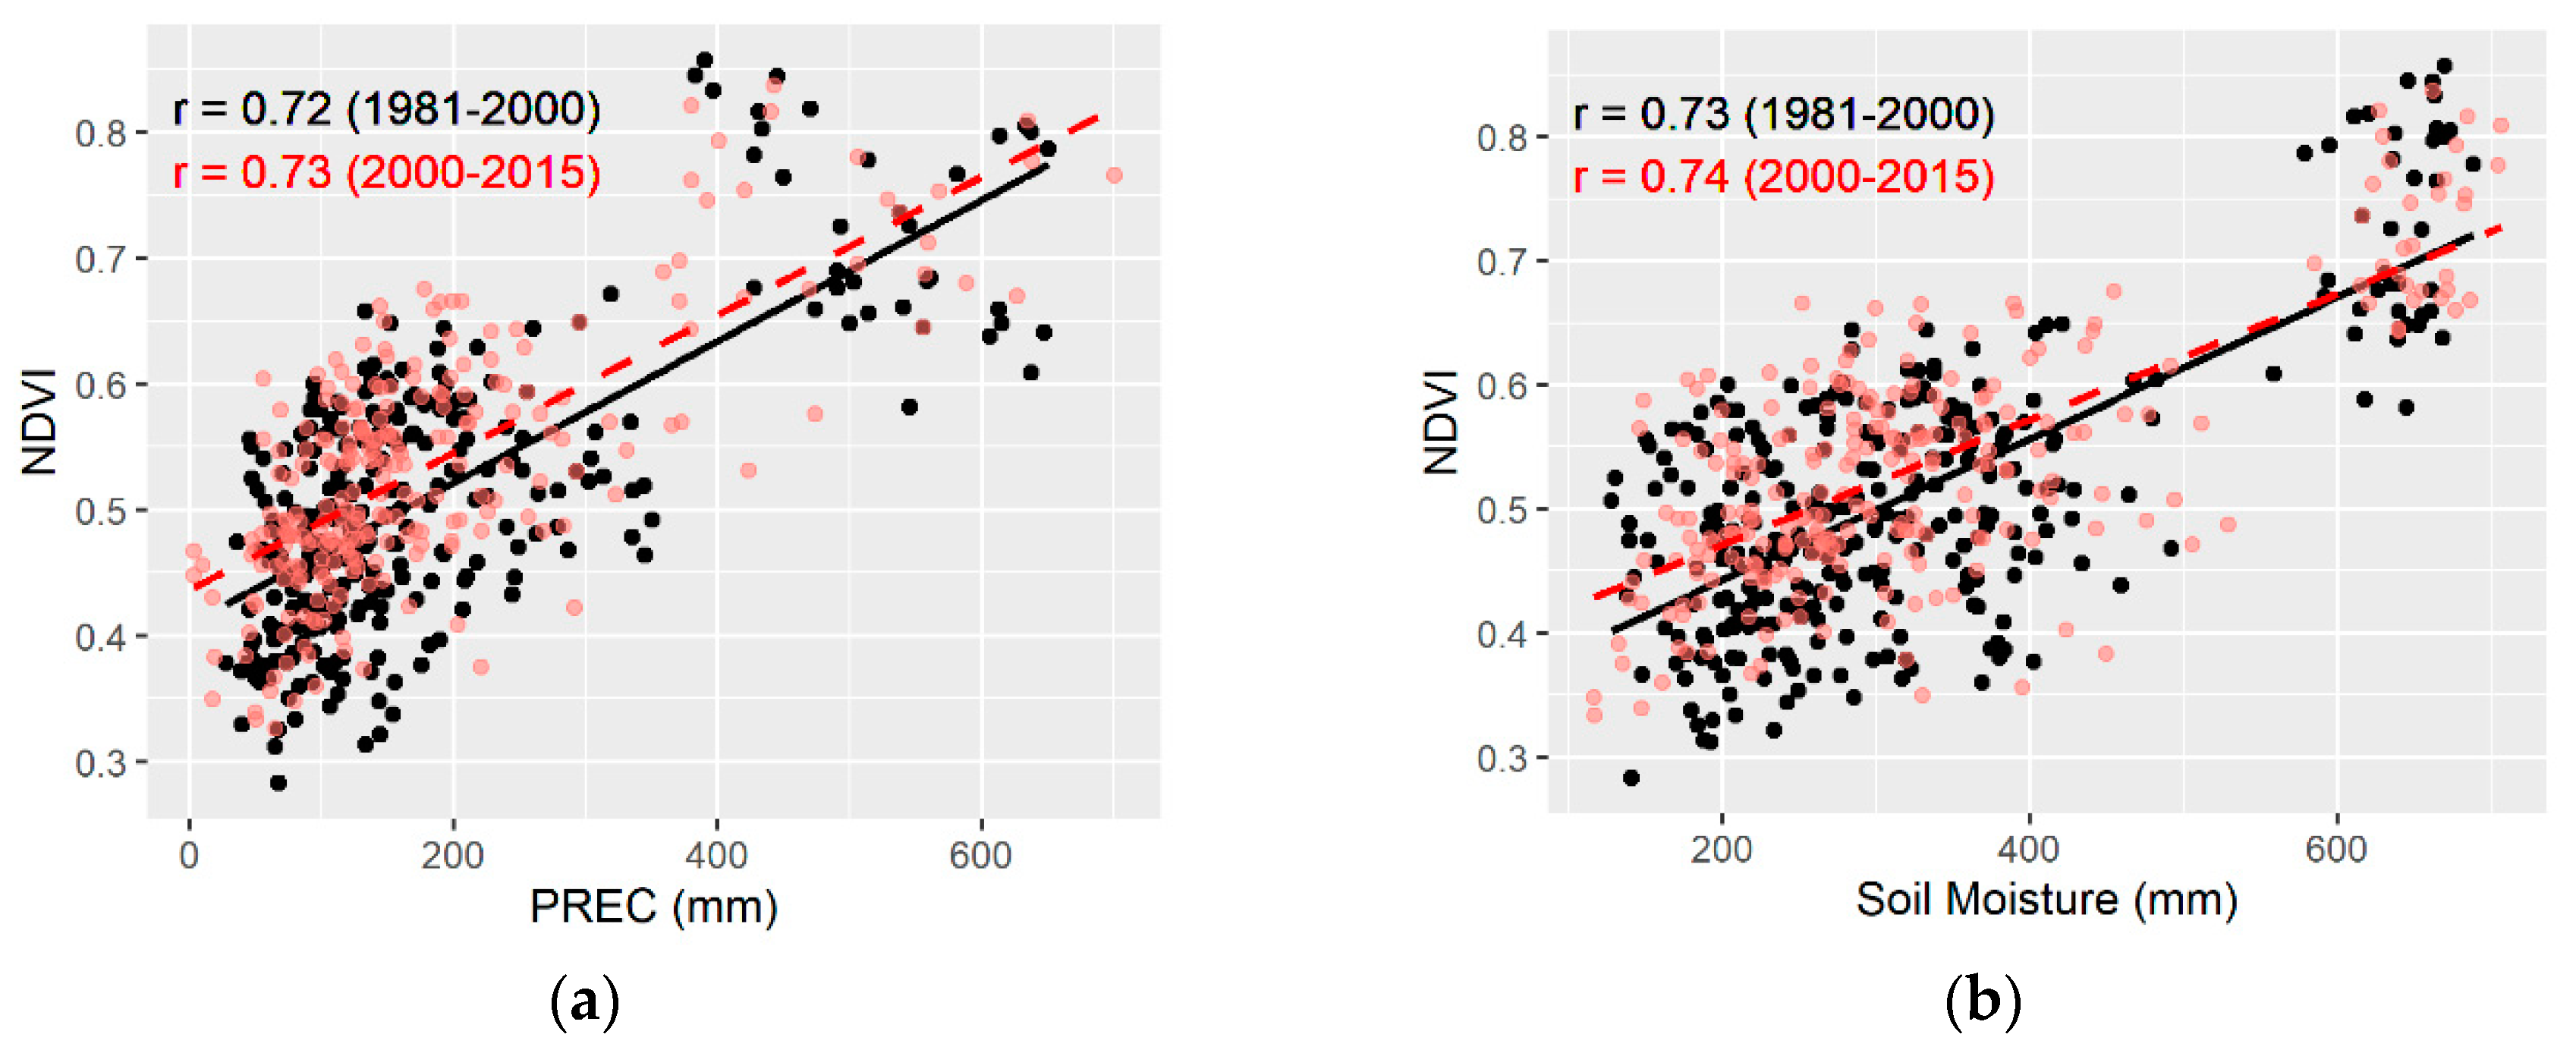
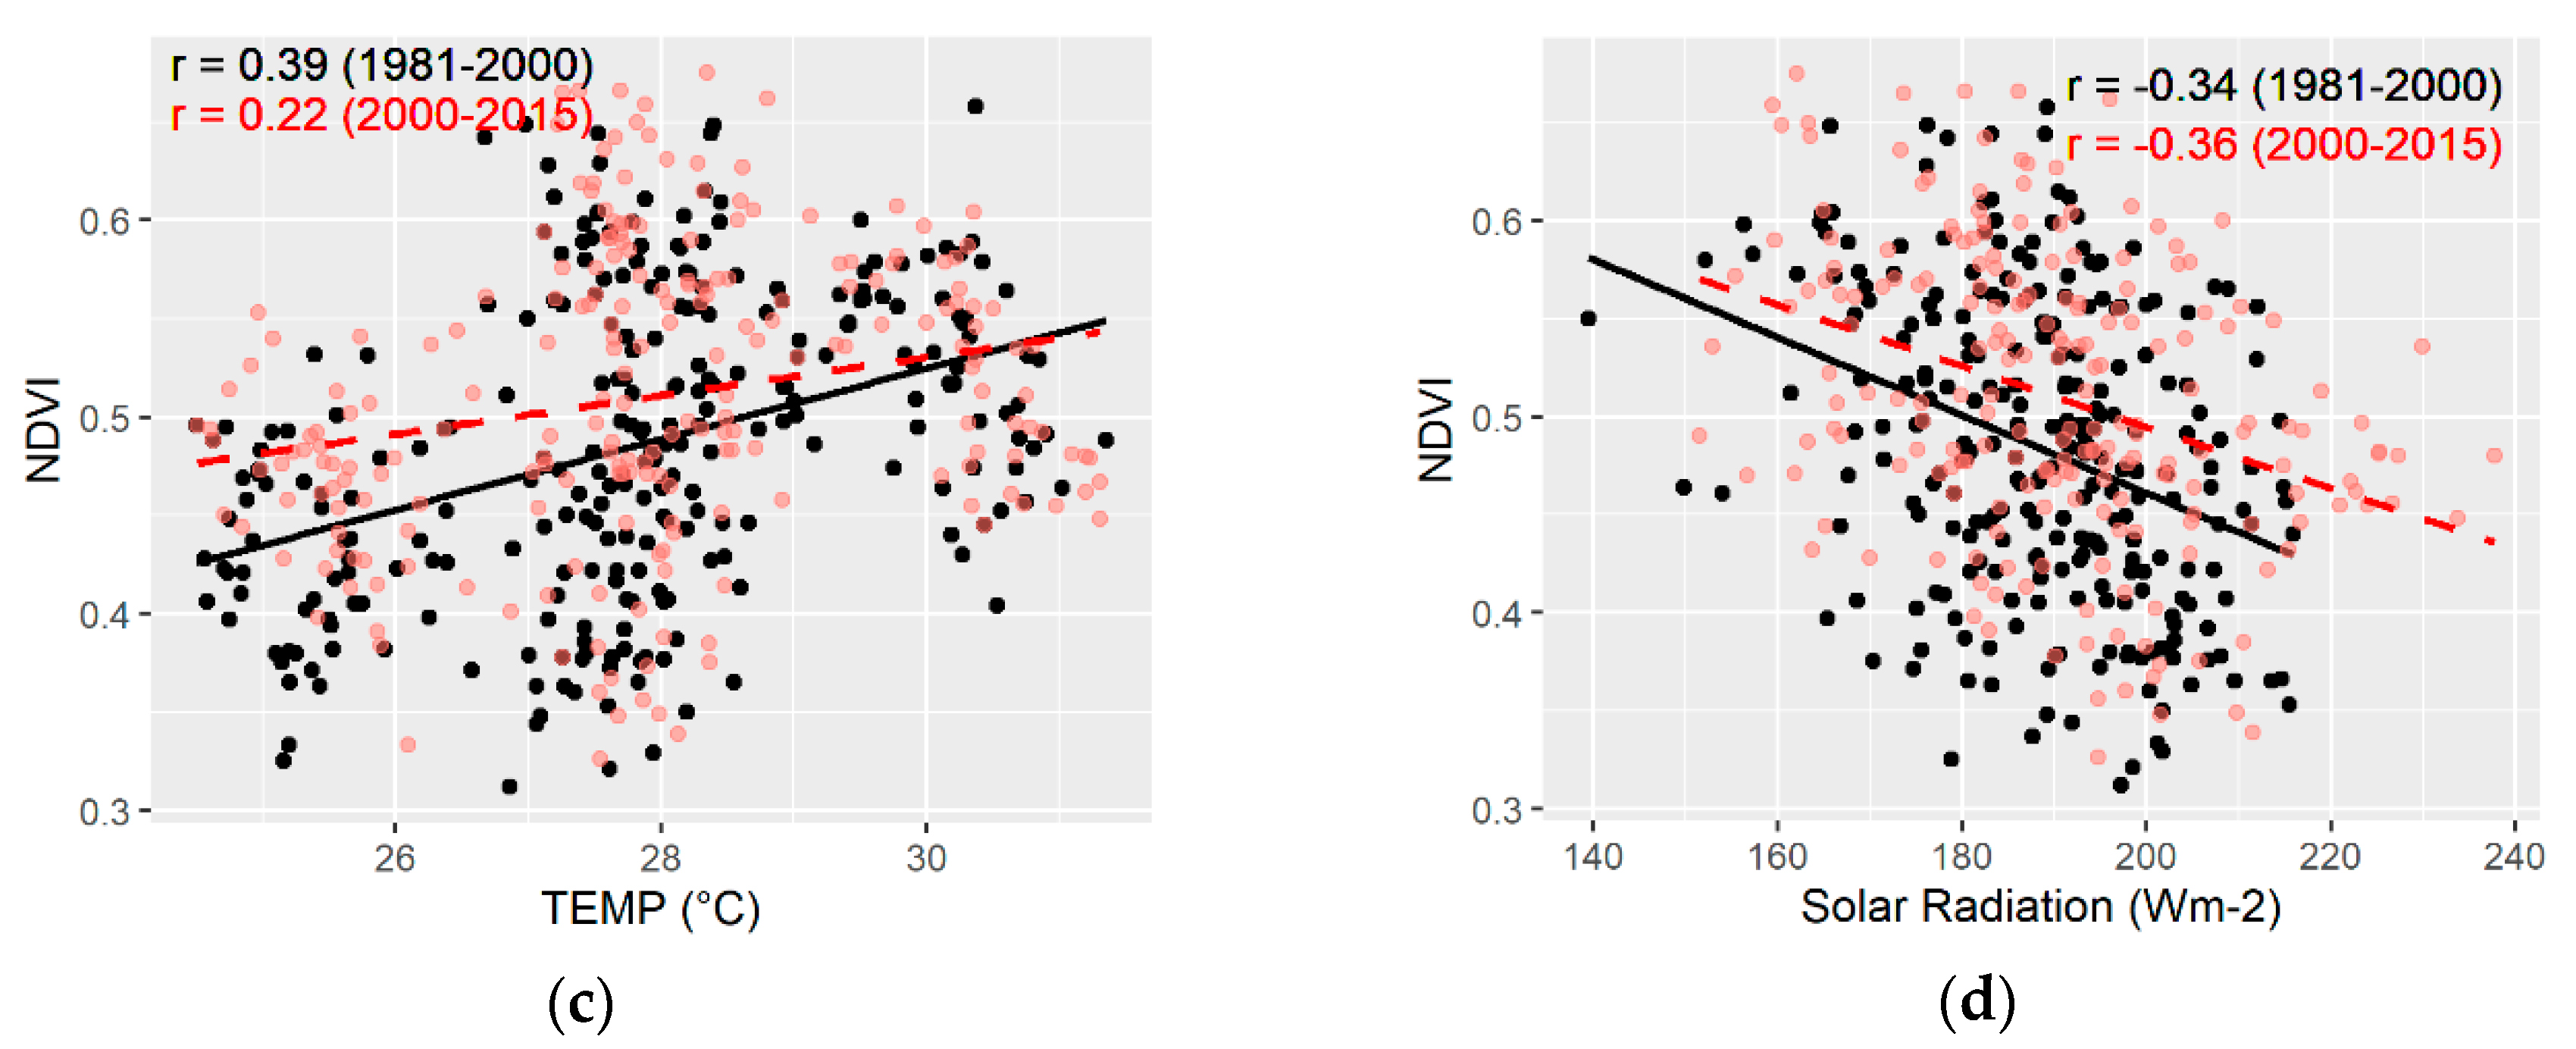
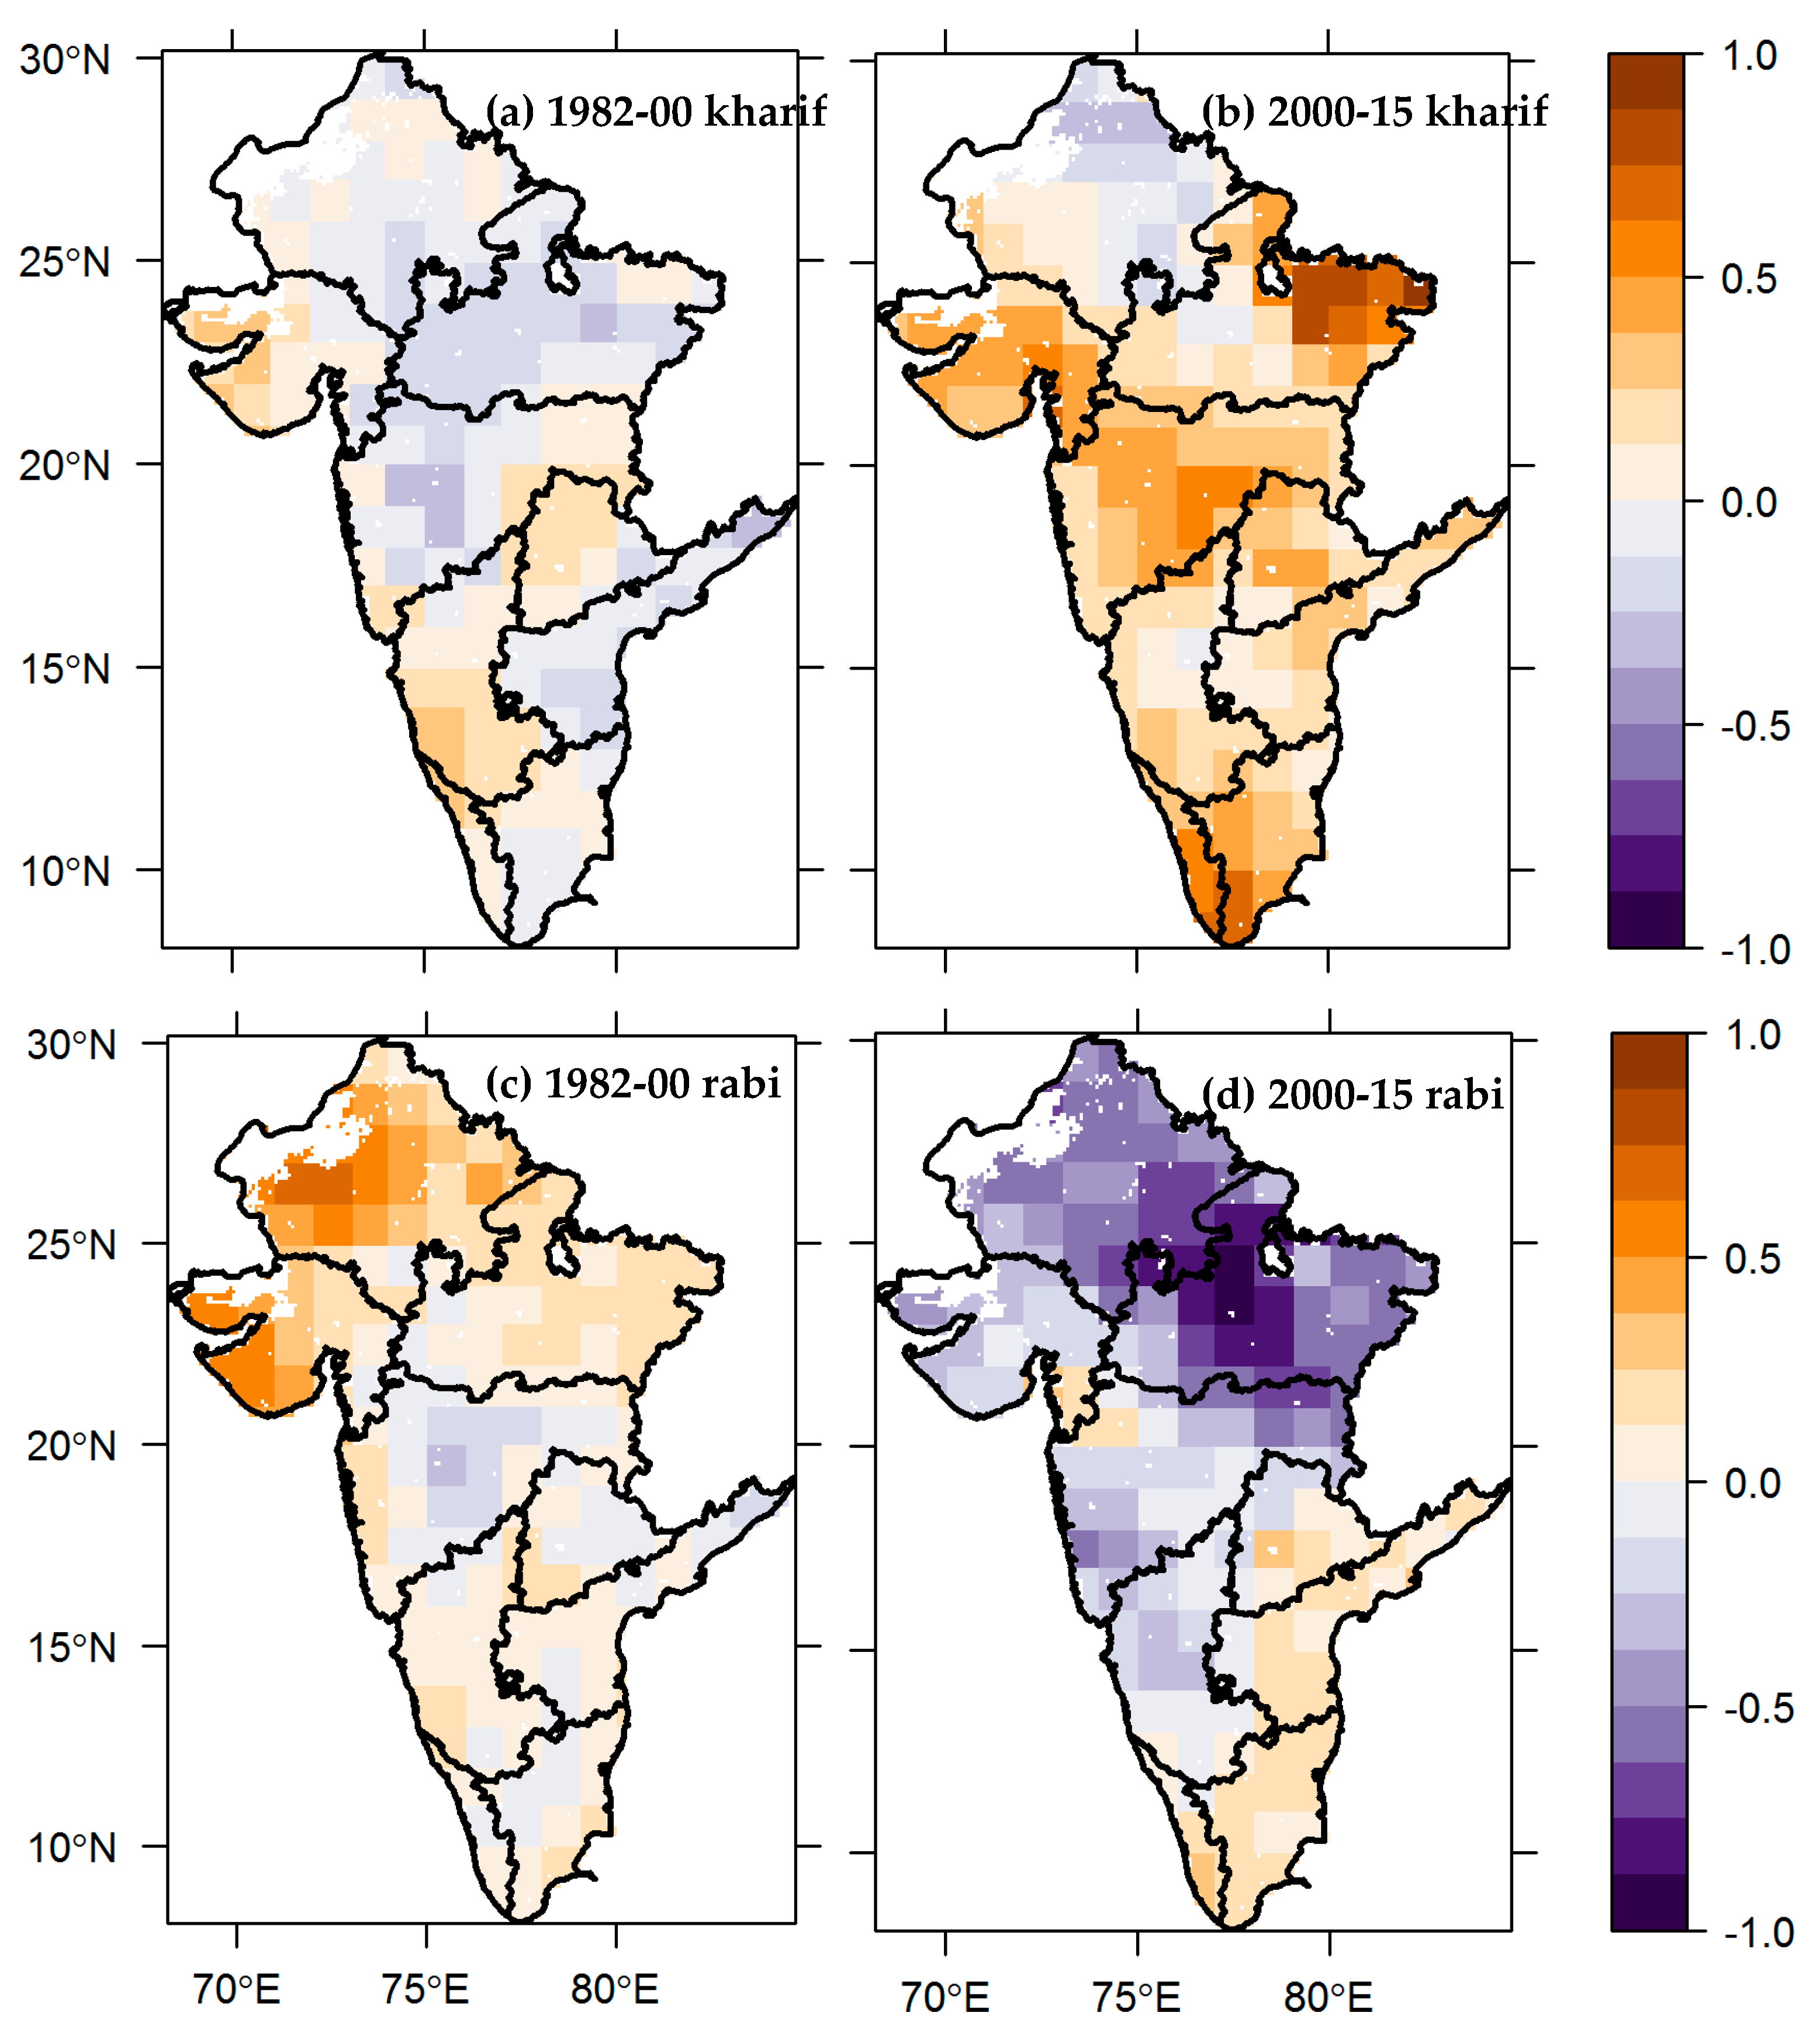
Among the four climatic factors, namely, precipitation, temperature, solar radiation and soil moisture, it was observed that precipitation and soil moisture played greater roles for greening trends of vegetation growth in the Northwestern Plain, Central India and the South Peninsula. The NDVI and these two climatic factors were positively correlated with r ranging from 0.72 to 0.83 (
p < 0.001). The NDVI and temperature including solar radiation displayed negative correlations in the Northwestern Plain and Central India with r values ranging from 0.71 to 0.82 (
p < 0.001). In the case of the South Peninsula, the NDVI and temperature and the NDVI and solar radiation displayed weak positive and negative correlations, respectively. It was reported by various studies that a positive correlation between precipitation and NDVI was prevalent over most of these regions in India, including a negative correlation between temperature and NDVI [
14,
16].
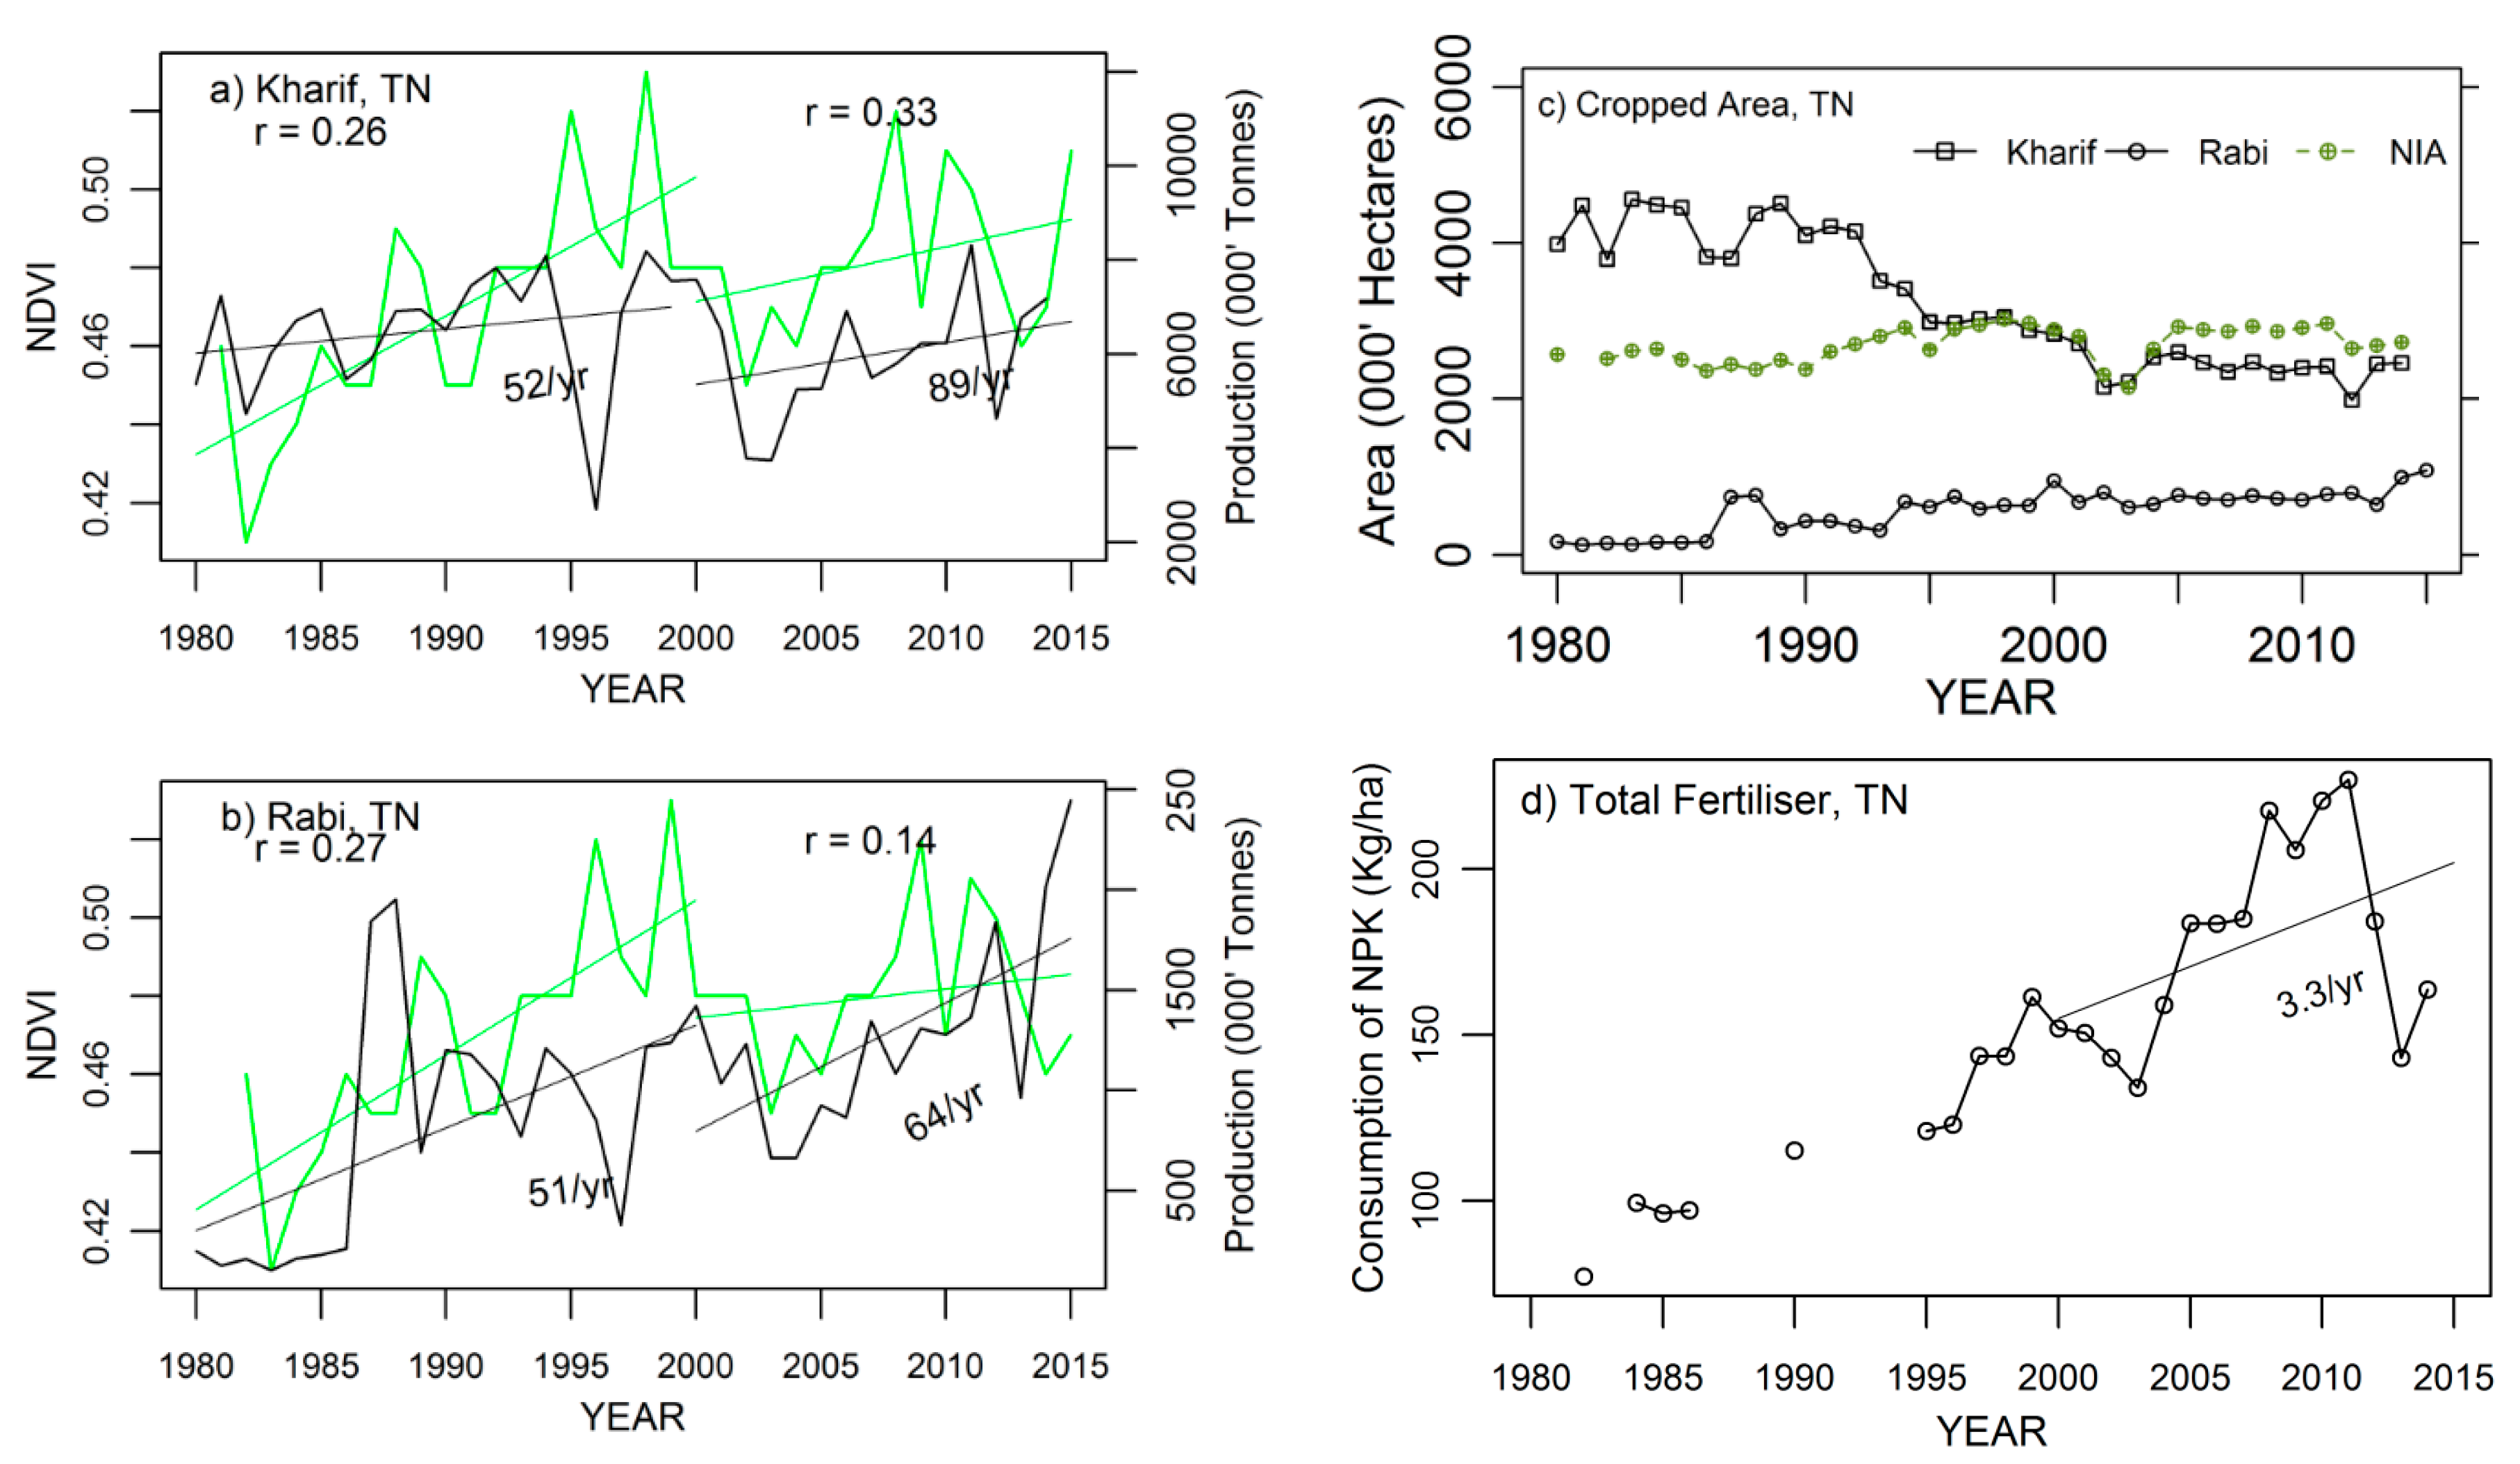
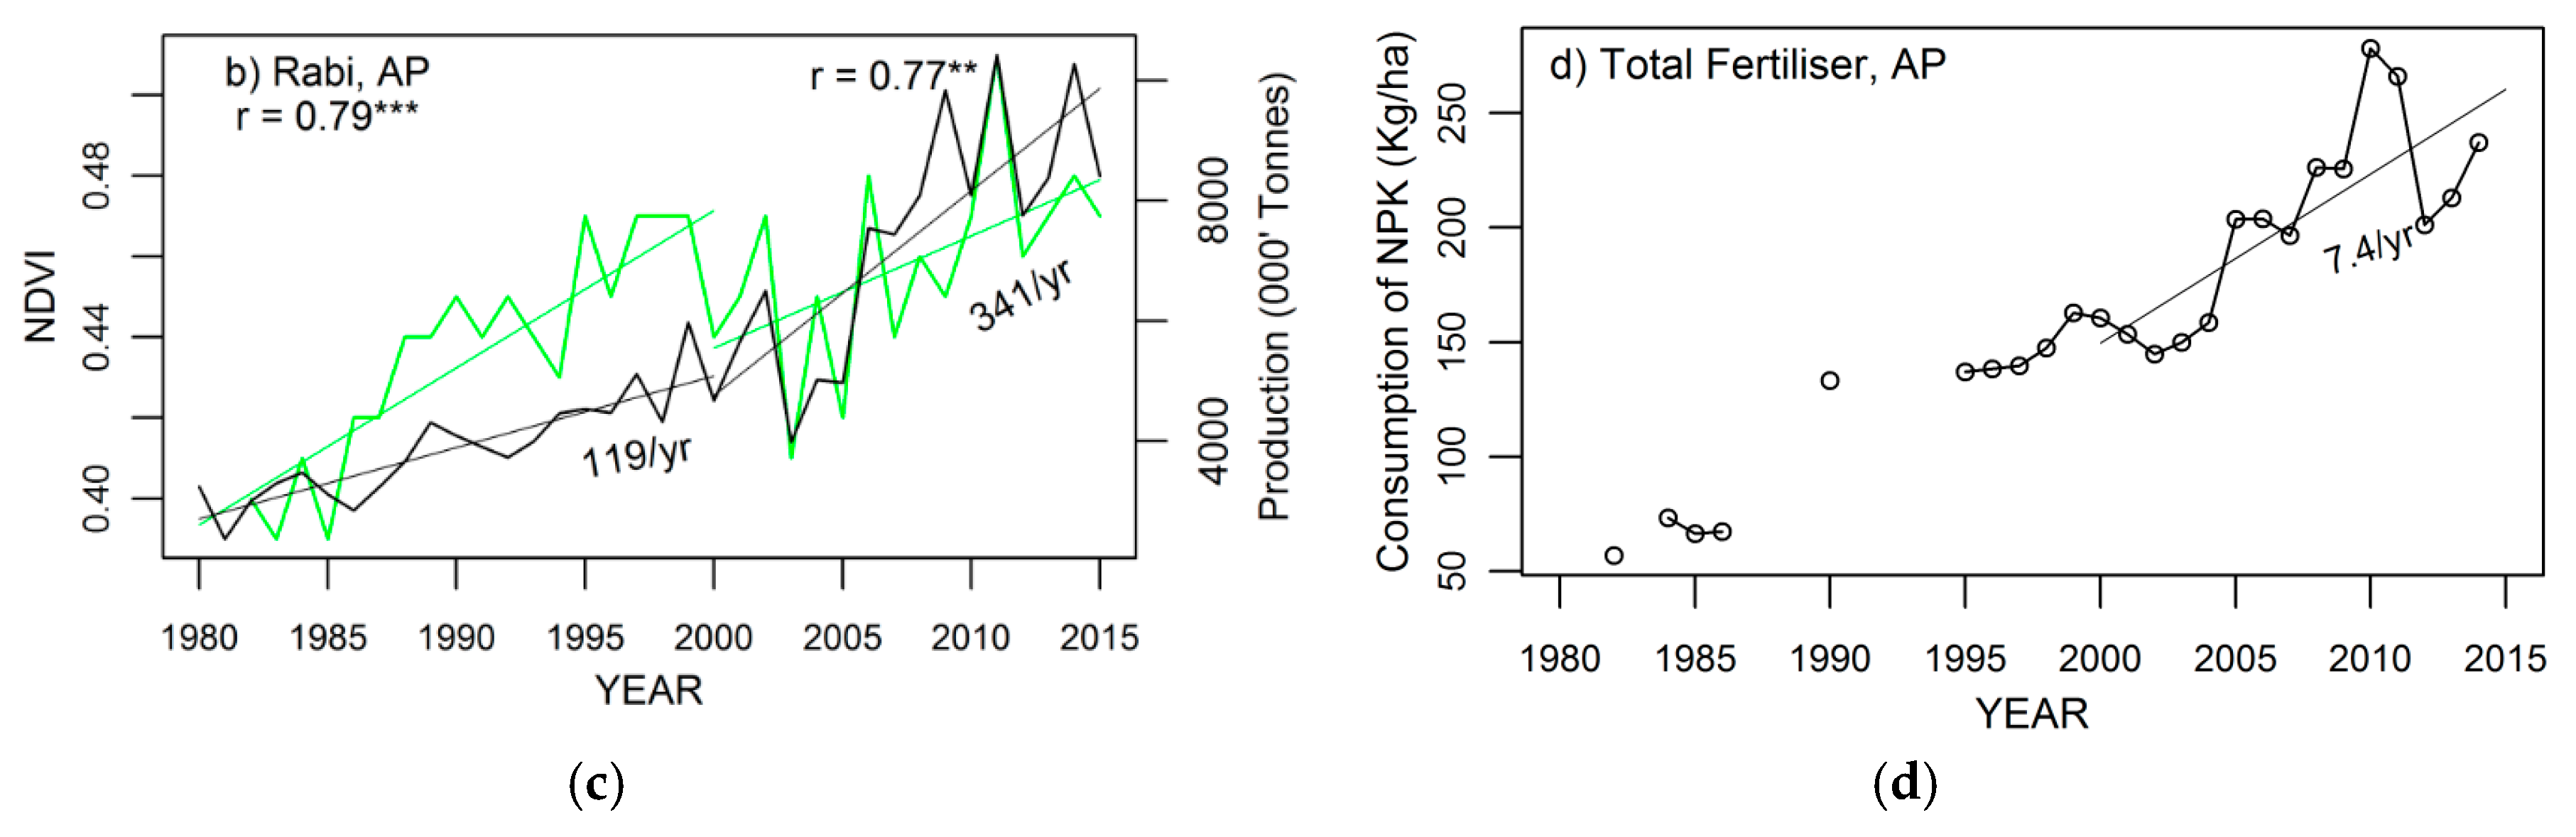
The non-climatic factors such as NIA and consumption of NPK fertilizer showed positive correlations with NDVI (
Table 6) across all the states, and most of the relationships were statistically significant at
p < 0.01. Other factors, such as land use change, as indicated by changes in kharif and rabi cropping areas, were reduced substantially over the period 1982–2015 across the Northwestern Plain, Central India and the South Peninsula. However, such changes have adverse effects on vegetation growth patterns, especially over the South Peninsula compared to the Northwestern Plain and Central India. Moreover, the land use change impacts were higher for the kharif season than the rabi season.
The findings of this study demonstrate that inter-seasonal trends provide better spatial patterns of changes in agriculture ecosystems, whilst inter-annual trends of vegetation are better in forest ecosystems and responses of vegetation to global climatic changes and other climatic and non-climatic drivers. The identified mechanisms such as temperature-induced moisture stress and moisture-induced greening were operating at larger spatial scales in India, and exhibited changes in vegetation productivity and also varied among different sub-climatic regions in India. Such large-scale changes in vegetation productivity have implications for societal impacts (e.g., employment, wealth and food security). Declining growth rates of crop production have been reported from various water-limited ecoregions of India which can also be confirmed with declining growth rates of NDVI [
5]. Among water-limited ecoregions, the main foodgrain-producing states located in the Indo-Gangetic Plain (IGP), the Northwestern Plain (RJ, GJ) and the southern peninsula (MH, AP, KA) exhibited declining growth rates of agriculture area and food production. In this context, it was estimated that at least 50% increases in yields of major cereal crops are needed to accomplish food security under the existing population projections by 2050 [
78]. Increments of crop yields driven by technological changes may be offset by increasing competition for water with non-agricultural sectors, increasing temperature-induced drought stress and loss of croplands to desertification and urbanization, which poses challenges to national food security and could have societal impacts. There could be a yield gap between domestic food production (i.e., supply) and demand which can be made for with imports. However, food imports may have adverse impacts on domestic prices, employment and farmer livelihoods. It was projected that sustainable food security in India would face a severe risk of domestic food supply by 2050 [
79] and thereby there could be a substantial challenge in achieving basic nutritional needs under the second Sustainable Development Goal (SDG2). In regard to accelerated global environmental changes, the identified mechanisms such as temperature-induced moisture stress and moisture-induced greening are not well understood across many sub-climatic ecoregions in India and at global-scale, so persistent efforts will have to be made to monitor vegetation changes using both satellite and in-situ observations. The understanding of changes in vegetation growth and productivity over time at a broader spatial level are also crucial for the management of ecosystems and identifying adaptation options to global climatic changes. Moreover, these findings are very constructive to policymakers and climate change awareness-raising campaigns at the national level.


