Urban Overheating and Cooling Potential in Australia: An Evidence-Based Review


 ,
,  and
and 
Abstract
1. Introduction
2. The Magnitude and Characteristics of Urban Overheating
3. Impacts of Urban Overheating
3.1. Health and Well-Being
3.2. Energy Consumption and Demand
3.3. Economy and Productivity
4. Impact of Mitigation Strategies on Cooling Cities
4.1. Use of Water
4.2. Urban Green Technologies and Strategies
4.2.1. Urban Green Spaces
4.2.2. Green Roofs
4.2.3. Green Walls
4.3. Use of Reflective Materials
4.3.1. Cool Roofs and Façades
4.3.2. Cool Pavements
4.4. Combined Mitigation Strategies
5. Conclusions
Author Contributions
Funding
Acknowledgments
Conflicts of Interest
References
- Schell, L.M.; Smith, M.T.; Bilsborough, A. Human Biological Approaches to the Study of Third World Urbanism; Cambridge University Press: New York, NY, USA, 1993. [Google Scholar]
- United Nations, Department of Economic and Social Affairs (UN-DESA). World Urbanization Prospects; United Nations, Department of Economic and Social Affairs: New York, NY, USA, 2014. [Google Scholar]
- Emmanuel, R.; Krüger, E. Urban heat island and its impact on climate change resilience in a shrinking city: The case of Glasgow, UK. Build. Environ. 2012, 53, 137–149. [Google Scholar] [CrossRef]
- Santamouris, M.; Haddad, S.; Fiorito, F.; Osmond, P.; Ding, L.; Prasad, D.; Zhai, X.; Wang, R. Urban Heat Island and Overheating Characteristics in Sydney, Australia. An Analysis of Multiyear Measurements. Sustainability 2017, 9, 712. [Google Scholar] [CrossRef]
- Haddad, S.; Ulpiani, G.; Paolini, R.; Synnefa, A.; Santamouris, M. Experimental and Theoretical analysis of the urban overheating and its mitigation potential in a hot arid city—Alice Springs. Arch. Sci. Rev. 2019, 63, 425–440. [Google Scholar] [CrossRef]
- Yun, G.Y.; Ngarambe, J.; Duhirwe, P.N.; Ulpiani, G.; Paolini, R.; Haddad, S.; Vasilakopoulou, K.; Santamouris, M. Predicting the magnitude and the characteristics of the urban heat island in coastal cities in the proximity of desert landforms. The case of Sydney. Sci. Total Environ. 2020, 709, 136068. [Google Scholar] [CrossRef] [PubMed]
- Santamouris, M. On the energy impact of urban heat island and global warming on buildings. Energy Build. 2014, 82, 100–113. [Google Scholar] [CrossRef]
- Taylor, J.; Wilkinson, P.; Davies, M.; Armstrong, B.; Chalabi, Z.; Mavrogianni, A.; Symonds, P.; Oikonomou, E.; Bohnenstengel, S.I. Mapping the effects of urban heat island, housing, and age on excess heat-related mortality in London. Urban Clim. 2015, 14, 517–528. [Google Scholar] [CrossRef]
- Chien, L.-C.; Guo, Y.; Zhang, K. Spatiotemporal analysis of heat and heat wave effects on elderly mortality in Texas, 2006–2011. Sci. Total Environ. 2016, 562, 845–851. [Google Scholar] [CrossRef] [PubMed]
- Salata, F.; Golasi, I.; Petitti, D.; Vollaro, E.D.L.; Coppi, M.; Vollaro, A.D.L. Relating microclimate, human thermal comfort and health during heat waves: An analysis of heat island mitigation strategies through a case study in an urban outdoor environment. Sustain. Cities Soc. 2017, 30, 79–96. [Google Scholar] [CrossRef]
- Sarrat, C.; Lemonsu, A.; Masson, V.; Guédalia, D. Impact of urban heat island on regional atmospheric pollution. Atmos. Environ. 2006, 40, 1743–1758. [Google Scholar] [CrossRef]
- Chapman, L.; Azevedo, J.A.; Prieto-Lopez, T. Urban heat & critical infrastructure networks: A viewpoint. Urban Clim. 2013, 3, 7–12. [Google Scholar]
- O’Malley, C.; Piroozfarb, P.A.E.; Farr, E.R.P.; Gates, J. An Investigation into Minimizing Urban Heat Island (UHI) Effects: A UK Perspective. Energy Procedia 2014, 62, 72–80. [Google Scholar] [CrossRef]
- Chen, D.; Ren, Z.; Wang, C.H.; Thatcher, M.; Wang, X. Urban Heat Island on Australian Housing Energy Consumption; Healthy Buildings: Brisbane, Queensland, Australia, 2012. [Google Scholar]
- van Raalte, L.; Nolan, M.; Thakur, P.; Xue, S.; Parker, N. Economic Assessment of the Urban Heat Island Effect; AECOM Australia Pty Ltd.: Melbourne, Australia, 2012. [Google Scholar]
- Torok, S.J.; Morris, C.J.G.; Skinner, C.; Plummer, N. Urban heat island features of southeast Australian towns. Aust. Meteorol. Mag. 2001, 50, 1–13. [Google Scholar]
- Erell, E.; Williamson, T.J. Intra-urban differences in canopy layer air temperature at a mid-latitude city. Int. J. Climatol. 2007, 27, 1243–1255. [Google Scholar] [CrossRef]
- Nunez, M. The Urban Heat Island; University of Tasmania: Hobart, Australia, 1979; p. 46. [Google Scholar]
- Haddad, S.; Paolini, R.; Ulpiani, G.; Synnefa, A.; Hatvani-Kovacs, G.; Garshasbi, S.; Fox, J.; Vasilakopoulou, K.; Nield, L.; Santamouris, M. Holistic approach to assess co-benefits of local climate mitigation in a hot humid region of Australia. Sci. Rep. 2020, 10, 1–17. [Google Scholar] [CrossRef] [PubMed]
- Rogers, C.D.; Gallant, A.J.; Tapper, N.J. Is the urban heat island exacerbated during heatwaves in southern Australian cities? Theor. Appl. Climatol. 2019, 137, 441–457. [Google Scholar] [CrossRef]
- Santamouris, M. Analyzing the heat island magnitude and characteristics in one hundred Asian and Australian cities and regions. Sci. Total Environ. 2015, 512–513, 582–598. [Google Scholar] [CrossRef] [PubMed]
- O’Malley, C.; Piroozfar, P.; Farr, E.R.P.; Pomponi, F. Urban Heat Island (UHI) mitigating strategies: A case-based comparative analysis. Sustain. Cities Soc. 2015, 19, 222–235. [Google Scholar] [CrossRef]
- Santamouris, M. Cooling the cities—A review of reflective and green roof mitigation technologies to fight heat island and improve comfort in urban environments. Sol. Energy 2014, 103, 682–703. [Google Scholar] [CrossRef]
- Khan, H.S.; Paolini, R.; Santamouris, M.; Caccetta, P. Exploring the Synergies between Urban Overheating and Heatwaves (HWs) in Western Sydney. Energies 2020, 13, 470. [Google Scholar] [CrossRef]
- Livada, I.; Synnefa, A.; Haddad, S.; Paolini, R.; Garshasbi, S.; Ulpiani, G.; Fiorito, F.; Vassilakopoulou, K.; Osmond, P.; Santamouris, M. Time series analysis of ambient air-temperature during the period 1970–2016 over Sydney, Australia. Sci. Total Environ. 2019, 648, 1627–1638. [Google Scholar] [CrossRef]
- Byrne, M.; Yeates, D.; Joseph, L.; Kearney, M.; Bowler, J.; Williams, M.; Cooper, S.; Donnellan, S.; Keogh, J.S.; Leys, R. Birth of a biome: Insights into the assembly and maintenance of the Australian arid zone biota. Mol. Ecol. 2008, 17, 4398–4417. [Google Scholar] [CrossRef]
- Masouleh, Z.P.; Walker, D.J.; McCauley Crowther, J. A Long-Term Study of Sea-Breeze Characteristics: A Case Study of the Coastal City of Adelaide. J. Appl. Meteorol. Climatol. 2019, 58, 385–400. [Google Scholar] [CrossRef]
- Rajagopalan, P.; Lim, K.C.; Jamei, E. Urban heat island and wind flow characteristics of a tropical city. Sol. Energy 2014, 107, 159–170. [Google Scholar] [CrossRef]
- Lazzarini, M.; Molini, A.; Marpu, P.R.; Ouarda, T.B.; Ghedira, H. Urban climate modifications in hot desert cities: The role of land cover, local climate, and seasonality. Geophys. Res. Lett. 2015, 42, 9980–9989. [Google Scholar] [CrossRef]
- Potchter, O.; Goldman, D.; Kadish, D.; Iluz, D. The oasis effect in an extremely hot and arid climate: The case of southern Israel. J. Arid. Environ. 2008, 72, 1721–1733. [Google Scholar] [CrossRef]
- Alonso, M.; Fidalgo, M.; Labajo, J. The urban heat island in Salamanca (Spain) and its relationship to meteorological parameters. Clim. Res. 2007, 34, 39–46. [Google Scholar] [CrossRef]
- Camilloni, I.; Barrucand, M. Temporal variability of the Buenos Aires, Argentina, urban heat island. Theor. Appl. Climatol. 2012, 107, 47–58. [Google Scholar] [CrossRef]
- Rchid, A. The Effects of Green Spaces (Palme Trees) on the Microclimate in Arides Zones, Case Study: Ghardaia, Algeria. Energy Procedia 2012, 18, 10–20. [Google Scholar]
- Haddad, S.; Paolini, R.; Ulpiani, G.; Synnefa, A.; Hatvani-Kovacs, G.; Garshasbi, S.; Fox, J.; Vasilakopoulou, K.; Neild, L.; Santamouris, M. Holistic approach towards urban sustainability: Co-benefits of urban heat mitigation in a hot humid region of Australia. Sci. Rep. 2020, in press. [Google Scholar] [CrossRef]
- Hatvani-Kovacs, G.; Belusko, M.; Pockett, J.; Boland, J. Can the Excess Heat Factor Indicate Heatwave-Related Morbidity? A Case Study in Adelaide, South Australia. EcoHealth 2016, 13, 100–110. [Google Scholar] [CrossRef] [PubMed]
- Commonwealth Scientific and Industrial Research Organisation (CSIRO). The Report—State of the Climate 2014; Commonwealth Scientific and Industrial Research Organisation (CSIRO): Canberra, Australia, 2015.
- Bureau of Meteorology (BoM). Annual Climate Statement 2015; Bureau of Meteorology, Commonwealth of Australia: Melbourne, Australia, 2016.
- Bambrick, H.J.; Dear, K.; Woodruff, R.; Hanigan, I.; McMichael, A. The Impacts of Climate Change on Three Health Outcomes: Temperature-Related Mortality and Hospitalisations, Salmonellosis and other Bacterial Gastroenteritis, and Population at Risk from Dengue; Australian Government: Canberra, Australia, 2008; p. 47.
- Adams, M.; Duc, H.; Trieu, T. Impacts of Land-Use Change on Sydney’s Future Temperatures; State of New South Wales and Office of Environment and Heritage: Sydney, Australia, 2015; p. 25.
- Tong, S.; Fitzgerald, G.; Wang, X.-Y.; Aitken, P.; Tippett, V.; Chen, D.; Wang, X.; Guo, Y. Exploration of the health risk-based definition for heatwave: A multi-city study. Environ. Res. 2015, 142, 696–702. [Google Scholar] [CrossRef]
- Anderson, G.B.; Bell, M.L. Heatwaves in the United States: Mortality risk during heatwaves and effect modification by heatwave characteristics in 43 US communities. Environ. Health Perspect. 2011, 119, 210–218. [Google Scholar] [CrossRef]
- Barnett, A.; Hajat, S.; Gasparrini, A.; Rocklöv, J. Cold and heatwaves in the United States. Environ. Res. 2012, 112, 218–224. [Google Scholar] [CrossRef] [PubMed]
- Perkins, S.E.; Alexander, L.V. On the measurement of heatwaves. J. Clim. 2013, 26, 4500–4517. [Google Scholar] [CrossRef]
- Lam, C.K.C.; Gallant, A.J.; Tapper, N.J. Perceptions of thermal comfort in heatwave and non-heatwave conditions in Melbourne, Australia. Urban Clim. 2018, 23, 204–2186. [Google Scholar] [CrossRef]
- Founda, D.; Santamouris, M. Synergies between urban heat island and heatwaves in Athens (Greece), during an extremely hot summer (2012). Sci. Rep. 2017, 7, 1–11. [Google Scholar] [CrossRef]
- Ao, X.; Wang, L.; Zhi, X.; Gu, W.; Yang, H.; Li, D. Observed synergies between urban heat islands and heatwaves and their controlling factors in Shanghai, China. J. Appl. Meteorol. Climatol. 2019, 58, 1955–1972. [Google Scholar] [CrossRef]
- Brázdil, R.; Budíková, M. An urban bias in air temperature fluctuations at the Klementinum, Prague, The Czech Republic. Atmos. Environ. 1999, 33, 4211–4217. [Google Scholar] [CrossRef]
- Ramamurthy, P.; Bou-Zeid, E. Heatwaves and urban heat islands: A comparative analysis of multiple cities. J. Geophys. Res. Atmos. 2017, 122, 168–178. [Google Scholar] [CrossRef]
- Rizvi, S.H.; Alam, K.; Iqbal, M.J. Spatio-temporal variations in urban heat island and its interaction with heatwave. J. Atmos. Sol.-Terr. Phys. 2019, 185, 50–57. [Google Scholar] [CrossRef]
- Li, D.; Sun, T.; Liu, M.; Yang, L.; Wang, L.; Gao, Z. Contrasting responses of urban and rural surface energy budgets to heatwaves explain synergies between urban heat islands and heatwaves. Environ. Res. Lett. 2015, 10, 054009. [Google Scholar] [CrossRef]
- Li, D.; Bou-Zeid, E. Synergistic interactions between urban heat islands and heatwaves: The impact in cities is larger than the sum of its parts. J. Appl. Meteorol. Climatol. 2013, 52, 2051–2064. [Google Scholar] [CrossRef]
- Ulpiani, G.; Ranzi, G.; Santamouris, M. Experimental evidence of the multiple microclimatic impacts of bushfires in affected urban areas: The case of Sydney during the 2019/2020 Australian season. Environ. Res. Commun. 2020, 2, 065005. [Google Scholar] [CrossRef]
- Ulpiani, G. On the linkage between urban heat island and urban pollution island: Three-decade literature review towards a conceptual framework. Sci. Total Environ. 2020, 751, 141727. [Google Scholar] [CrossRef]
- Williams, S.; Nitschke, M.; Weinstein, P.; Pisaniello, D.L.; Parton, K.A.; Bi, P. The impact of summer temperatures and heatwaves on mortality and morbidity in Perth, Australia 1994–2008. Environ. Int. 2012, 40, 33–38. [Google Scholar] [CrossRef]
- Loughnan, M.E.; Tapper, N.J.; Phan, T.; Lynch, K.; McInnes, A.J. A Spatial Vulnerability Analysis of Urban Populations during Extreme Heat Events in Australian Capital Cities; National Climate Change Adaptation Research Facility: Gold Coast, Australia, 2013; p. 128. [Google Scholar]
- Williams, S.; Nitschke, M.; Sullivan, T.; Tucker, G.R.; Weinstein, P.; Pisaniello, D.L.; Parton, K.A.; Bi, P. Heat and health in Adelaide, South Australia: Assessment of heat thresholds and temperature relationships. Sci. Total Environ. 2012, 414, 126–133. [Google Scholar] [CrossRef]
- Tong, S.; Ren, C.; Becker, N. Excess deaths during the 2004 heatwave in Brisbane, Australia. Int. J. Biometeorol. 2010, 54, 393–400. [Google Scholar] [CrossRef]
- Santamouris, M.; Paolini, R.; Haddad, S.; Synnefa, A.; Garshasbi, S.; Hatvani-Kovacs, G.; Gobakis, K.; Yenneti, K.; Vasilakopoulou, K.; Feng, J. Heat mitigation technologies can improve sustainability in cities. An holistic experimental and numerical impact assessment of urban overheating and related heat mitigation strategies on energy consumption, indoor comfort, vulnerability and heat-related mortality and morbidity in cities. Energy Build. 2020, 217, 110002. [Google Scholar]
- Vaneckova, P.; Beggs, P.J.; De Dear, R.J.; McCracken, K.W.J. Effect of temperature on mortality during the six warmer months in Sydney, Australia, between 1993 and 2004. Environ. Res. 2008, 108, 361–369. [Google Scholar] [CrossRef]
- Inglis, S.C.; Clark, R.A.; Shakib, S.; Wong, D.T.; Molaee, P.; Wilkinson, D.; Stewart, S. Hot summers and heart failure: Seasonal variations in morbidity and mortality in Australian heart failure patients (1994–2005). Eur. J. Heart Fail. 2008, 10, 540–549. [Google Scholar] [CrossRef]
- Tong, S.; Wang, X.Y.; Barnett, A.G. Assessment of Heat-Related Health Impacts in Brisbane, Australia: Comparison of Different Heatwave Definitions. PLoS ONE 2010, 5, e12155. [Google Scholar] [CrossRef]
- Loughnan, M.E.; Nicholls, N.; Tapper, N.J. The effects of summer temperature, age and socioeconomic circumstance on Acute Myocardial Infarction admissions in Melbourne, Australia. Int. J. Health Geogr. 2010, 9, 41. [Google Scholar] [CrossRef]
- Gosling, S.N.; McGregor, G.R.; Páldy, A. Climate change and heat-related mortality in six cities Part 1: Model construction and validation. Int. J. Biometeorol. 2007, 51, 525–540. [Google Scholar] [CrossRef]
- Tong, S.; Wang, X.Y.; Yu, W.; Chen, D.; Wang, X. The impact of heatwaves on mortality in Australia: A multicity study. BMJ Open 2014, 4, e003579. [Google Scholar] [CrossRef]
- Santamouris, M. Regulating the damaged thermostat of the cities—Status, impacts and mitigation challenges. Energy Build. 2015, 91, 43–56. [Google Scholar] [CrossRef]
- Burton, A.; Bambrick, H.; Friel, S. If you don’t know how can you plan? Considering the health impacts of climate change in urban planning in Australia. Urban Clim. 2015, 12, 104–118. [Google Scholar] [CrossRef]
- Yu, W.; Mengersen, K.; Hu, W.; Guo, Y.; Pan, X.; Tong, S. Assessing the relationship between global warming and mortality: Lag effects of temperature fluctuations by age and mortality categories. Environ. Pollut. 2011, 159, 1789–1793. [Google Scholar] [CrossRef]
- Commonwealth Scientific and Industrial Research Organisation (CSIRO). Pathways to Climate Adapted and Healthy Low Income Housing, Final Report; CSIRO, National Climate Change Adaptation Research Facility: Canberra, Australia, 2013.
- Byrne, J.; Matthews, T.; Ambrey, C. Comment: Why Poorer Suburbs Are More at Risk in Warming Cities. Available online: http://www.sbs.com.au/topics/science/earth/article/2016/10/18/comment-why-poorer-suburbs-are-more-risk-warming-cities (accessed on 25 April 2019).
- Zografos, C.; Anguelovski, I.; Grigorova, M. When exposure to climate change is not enough: Exploring heatwave adaptive capacity of a multi-ethnic, low-income urban community in Australia. Urban Clim. 2016, 17, 248–265. [Google Scholar] [CrossRef]
- Santamouris, M.; Haddad, S.; Saliari, M.; Vasilakopoulou, K.; Synnefa, A.; Paolini, R.; Ulpiani, G.; Garshasbi, S.; Fiorito, F. On the energy impact of urban heat island in Sydney: Climate and energy potential of mitigation technologies. Energy Build. 2018, 166, 154–164. [Google Scholar] [CrossRef]
- Guan, H.; Soebarto, V.; Bennett, J.; Clay, R.; Andrew, R.; Guo, Y.; Gharib, S.; Bellette, K. Response of office building electricity consumption to urban weather in Adelaide, South Australia. Urban Clim. 2014, 10, 42–55. [Google Scholar] [CrossRef]
- Jamei, E.; Rajagopalan, P. Urban development and pedestrian thermal comfort in Melbourne. Sol. Energy 2017, 144, 681–698. [Google Scholar] [CrossRef]
- Zander, K.K.; Botzen, W.J.; Oppermann, E.; Kjellstrom, T.; Garnett, S.T. Heat stress causes substantial labor productivity loss in Australia. Nat. Clim. Chang. 2015, 5, 647–651. [Google Scholar] [CrossRef]
- Hanna, E.G.; Kjellstrom, T.; Bennett, C.; Dear, K. Climate Change and Rising Heat: Population Health Implications for Working People in Australia. Asia Pac. J. Public Health 2011, 23, 14S–26S. [Google Scholar] [CrossRef] [PubMed]
- Kjellstrom, T.; Gabrysch, S.; Lemke, B.; Dear, K. The ‘Hothaps’ programme for assessing climate change impacts on occupational health and productivity: An invitation to carry out field studies. Glob. Health Action 2009, 2, 2. [Google Scholar] [CrossRef]
- Garnaut, R. The Garnaut Climate Change Review—Update 2011: Australia in the Global Response to Climate Change Summary; Cambridge University Press: Melbourne, Australia, 2011. [Google Scholar]
- Chhetri, P.; Hashemi, A.; Basic, F.; Manzoni, A.; Jayatilleke, G. Bushfire, Heatwave and Flooding Case Studies from Australia; School of business IT and Logistics, RMIT University: Melbourne, Australia, 2012. [Google Scholar]
- Chen, D.; Wang, X.; Khoo, Y.B.; Thatcher, M.; Lin, B.B.; Ren, Z.; Wang, C.; Barnett, G. (Eds.) Assessment of Urban Heat Island and Mitigation by Urban Green Coverage; Springer: Berlin/Heidelberg, Germany, 2013. [Google Scholar]
- Jacobs, S.J.; Gallant, A.J.; Tapper, N.J.; Li, D. Use of Cool Roofs and Vegetation to Mitigate Urban Heat and Improve Human Thermal Stress in Melbourne, Australia. J. Appl. Meteorol. Climatol. 2018, 57, 1747–1764. [Google Scholar] [CrossRef]
- Chen, D.; Thatcher, M.; Wang, X.; Barnett, G.; Kachenko, A.; Prince, R. Summer cooling potential of urban vegetation—A modeling study for Melbourne, Australia. Cities 2015, 27, 35–38. [Google Scholar] [CrossRef]
- Chapman, S.; Thatcher, M.; Salazar, A.; Watson, J.E.; McAlpine, C.A. The Effect of Urban Density and Vegetation Cover on the Heat Island of a Subtropical City. J. Appl. Meteorol. Climatol. 2018, 57, 2531–2550. [Google Scholar] [CrossRef]
- Zhang, J. A Study of Parks’ Thermal Performances and Their Influential Factors in Urban Heat Island Mitigation for the City of Gold Coast. Master’s Thesis, Griffith University, Queensland, Australia, 2019. [Google Scholar]
- Soltani, A.; Sharifi, E. Daily variation of urban heat island effect and its correlations to urban greenery: A case study of Adelaide. Front. Arch. Res. 2017, 6, 529–538. [Google Scholar] [CrossRef]
- Razzaghmanesh, M.; Beecham, S.; Salemi, T. The role of green roofs in mitigating Urban Heat Island effects in the metropolitan area of Adelaide, South Australia. Urban For. Urban Green. 2016, 15, 89–102. [Google Scholar] [CrossRef]
- Bruse, M.; Skinner, C.J. Rooftop greening and local climate: A case study in Melbourne. In Proceedings of the International Conference on Urban Climatology & International Congress of Biometeorology, Sydney, Australia, 8 November 1999. [Google Scholar]
- Mitchell, V.G.; Cleugh, H.A.; Grimmond, C.S.; Xu, J. Linking urban water balance and energy balance models to analyse urban design options. Hydrol. Process. An Int. J. 2008, 22, 2891–2900. [Google Scholar] [CrossRef]
- Razzaghmanesh, M.; Razzaghmanesh, M. Thermal performance investigation of a living wall in a dry climate of Australia. Build. Environ. 2017, 112, 45–62. [Google Scholar] [CrossRef]
- Santamouris, M.; Ding, L.; Fiorito, F.; Oldfield, P.; Osmond, P.; Paolini, R.; Prasad, D.; Synnefa, A. Passive and active cooling for the outdoor built environment—Analysis and assessment of the cooling potential of mitigation technologies using performance data from 220 large scale projects. Sol. Energy 2017, 154, 14–33. [Google Scholar] [CrossRef]
- Qi, J.; Ding, L.; Lim, S. Planning for cooler cities: A framework to support the selection of urban heat mitigation techniques. J. Clean. Prod. 2020, 275, 122903. [Google Scholar] [CrossRef]
- Oke, T.R. Boundary Layer Climates; Routledge: Abingdon-on-Thames, UK, 2002. [Google Scholar]
- Gunawardena, K.; Wells, M.; Kershaw, T. Utilising green and bluespace to mitigate urban heat island intensity. Sci. Total Environ. 2017, 584, 1040–1055. [Google Scholar] [CrossRef]
- Manteghi, G.; Bin Limit, H.; Remaz, D. Water Bodies an Urban Microclimate: A Review. Mod. Appl. Sci. 2015, 9, 1–10. [Google Scholar] [CrossRef]
- Ulpiani, G. Water mist spray for outdoor cooling: A systematic review of technologies, methods and impacts. Appl. Energy 2019, 254, 113647. [Google Scholar] [CrossRef]
- Razzaghmanesh, M.; Beecham, S.; Kazemi, F. Impact of green roofs on stormwater quality in a South Australian urban environment. Sci. Total Environ. 2014, 470–471, 651–659. [Google Scholar] [CrossRef]
- Akbari, H.; Kolokotsa, D. Three decades of urban heat islands and mitigation technologies research. Energy Build. 2016, 133, 834–842. [Google Scholar] [CrossRef]
- Armson, D.; Stringer, P.; Ennos, A. The effect of tree shade and grass on surface and globe temperatures in an urban area. Urban For. Urban Green. 2012, 11, 245–255. [Google Scholar] [CrossRef]
- Niachou, A.; Papakonstantinou, K.; Santamouris, M.; Tsangrassoulis, A.; Mihalakakou, G. Analysis of the green roof thermal properties and investigation of its energy performance. Energy Build. 2001, 33, 719–729. [Google Scholar] [CrossRef]
- Afshari, A. A new model of urban cooling demand and heat island—Application to vertical greenery systems (VGS). Energy Build. 2017, 157, 204–217. [Google Scholar] [CrossRef]
- Narita, K.-I.; Mikami, T.; Sugawara, H.; Honjo, T.; Kimura, K.; Kuwata, N. Cool-island and Cold Air-seeping Phenomena in an Urban Park, Shinjuku Gyoen, Tokyo. Geogr. Rev. Jpn. 2004, 77, 403–420. [Google Scholar] [CrossRef]
- Brown, R.D.; Vanos, J.; Kenny, N.; Lenzholzer, S. Designing urban parks that ameliorate the effects of climate change. Landsc. Urban Plan. 2015, 138, 118–131. [Google Scholar] [CrossRef]
- Gill, S.; Rahman, M.; Handley, J.; Ennos, A. Modelling water stress to urban amenity grass in Manchester UK under climate change and its potential impacts in reducing urban cooling. Urban For. Urban Green. 2013, 12, 350–358. [Google Scholar] [CrossRef]
- Skoulika, F.; Santamouris, M.; Kolokotsa, D.; Boemi, N. On the thermal characteristics and the mitigation potential of a medium size urban park in Athens, Greece. Landsc. Urban Plan. 2014, 123, 73–86. [Google Scholar] [CrossRef]
- Vijayaraghavan, K. Green roofs: A critical review on the role of components, benefits, limitations and trends. Renew. Sustain. Energy Rev. 2016, 57, 740–752. [Google Scholar] [CrossRef]
- Bianchini, F.; Hewage, K. How “green” are the green roofs? Lifecycle analysis of green roof materials. Build. Environ. 2012, 48, 57–65. [Google Scholar] [CrossRef]
- Cuce, E. Thermal regulation impact of green walls: An experimental and numerical investigation. Appl. Energy 2017, 194, 247–254. [Google Scholar] [CrossRef]
- Pérez, G.; Rincón, L.; Vila, A.; González, J.M.; Cabeza, L.F. Green vertical systems for buildings as passive systems for energy savings. Appl. Energy 2011, 88, 4854–4859. [Google Scholar] [CrossRef]
- Nugroho, A.M. The Impact of Living Wall on Building Passive Cooling: A Systematic Review and Initial Test. IOP Conf. Ser. Earth Environ. Sci. 2020, 448, 012120. [Google Scholar] [CrossRef]
- Akbari, H.; Matthews, H.D. Global cooling updates: Reflective roofs and pavements. Energy Build. 2012, 55, 2–6. [Google Scholar] [CrossRef]
- Santamouris, M.; Yun, G.Y. Recent development and research priorities on cool and super cool materials to mitigate urban heat island. Renew. Energy 2020, 161, 792–807. [Google Scholar] [CrossRef]
- Synnefa, A.; Santamouris, M.; Apostolakis, K. On the development, optical properties and thermal performance of cool colored coatings for the urban environment. Sol. Energy 2007, 81, 488–497. [Google Scholar] [CrossRef]
- Paolini, R.; Terraneo, G.; Ferrari, C.; Sleiman, M.; Muscio, A.; Metrangolo, P.; Poli, T.; Destaillats, H.; Zinzi, M.; Levinson, R. Effects of soiling and weathering on the albedo of building envelope materials: Lessons learned from natural exposure in two European cities and tuning of a laboratory simulation practice. Sol. Energy Mater. Sol. Cells 2020, 205, 110264. [Google Scholar] [CrossRef]
- Santamouris, M. Using cool pavements as a mitigation strategy to fight urban heat island—A review of the actual developments. Renew. Sustain. Energy Rev. 2013, 26, 224–240. [Google Scholar] [CrossRef]
- Yang, J.; Kumar, D.L.M.; Pyrgou, A.; Chong, A.; Santamouris, M.; Kolokotsa, D.; Lee, S.E. Green and cool roofs’ urban heat island mitigation potential in tropical climate. Sol. Energy 2018, 173, 597–609. [Google Scholar] [CrossRef]


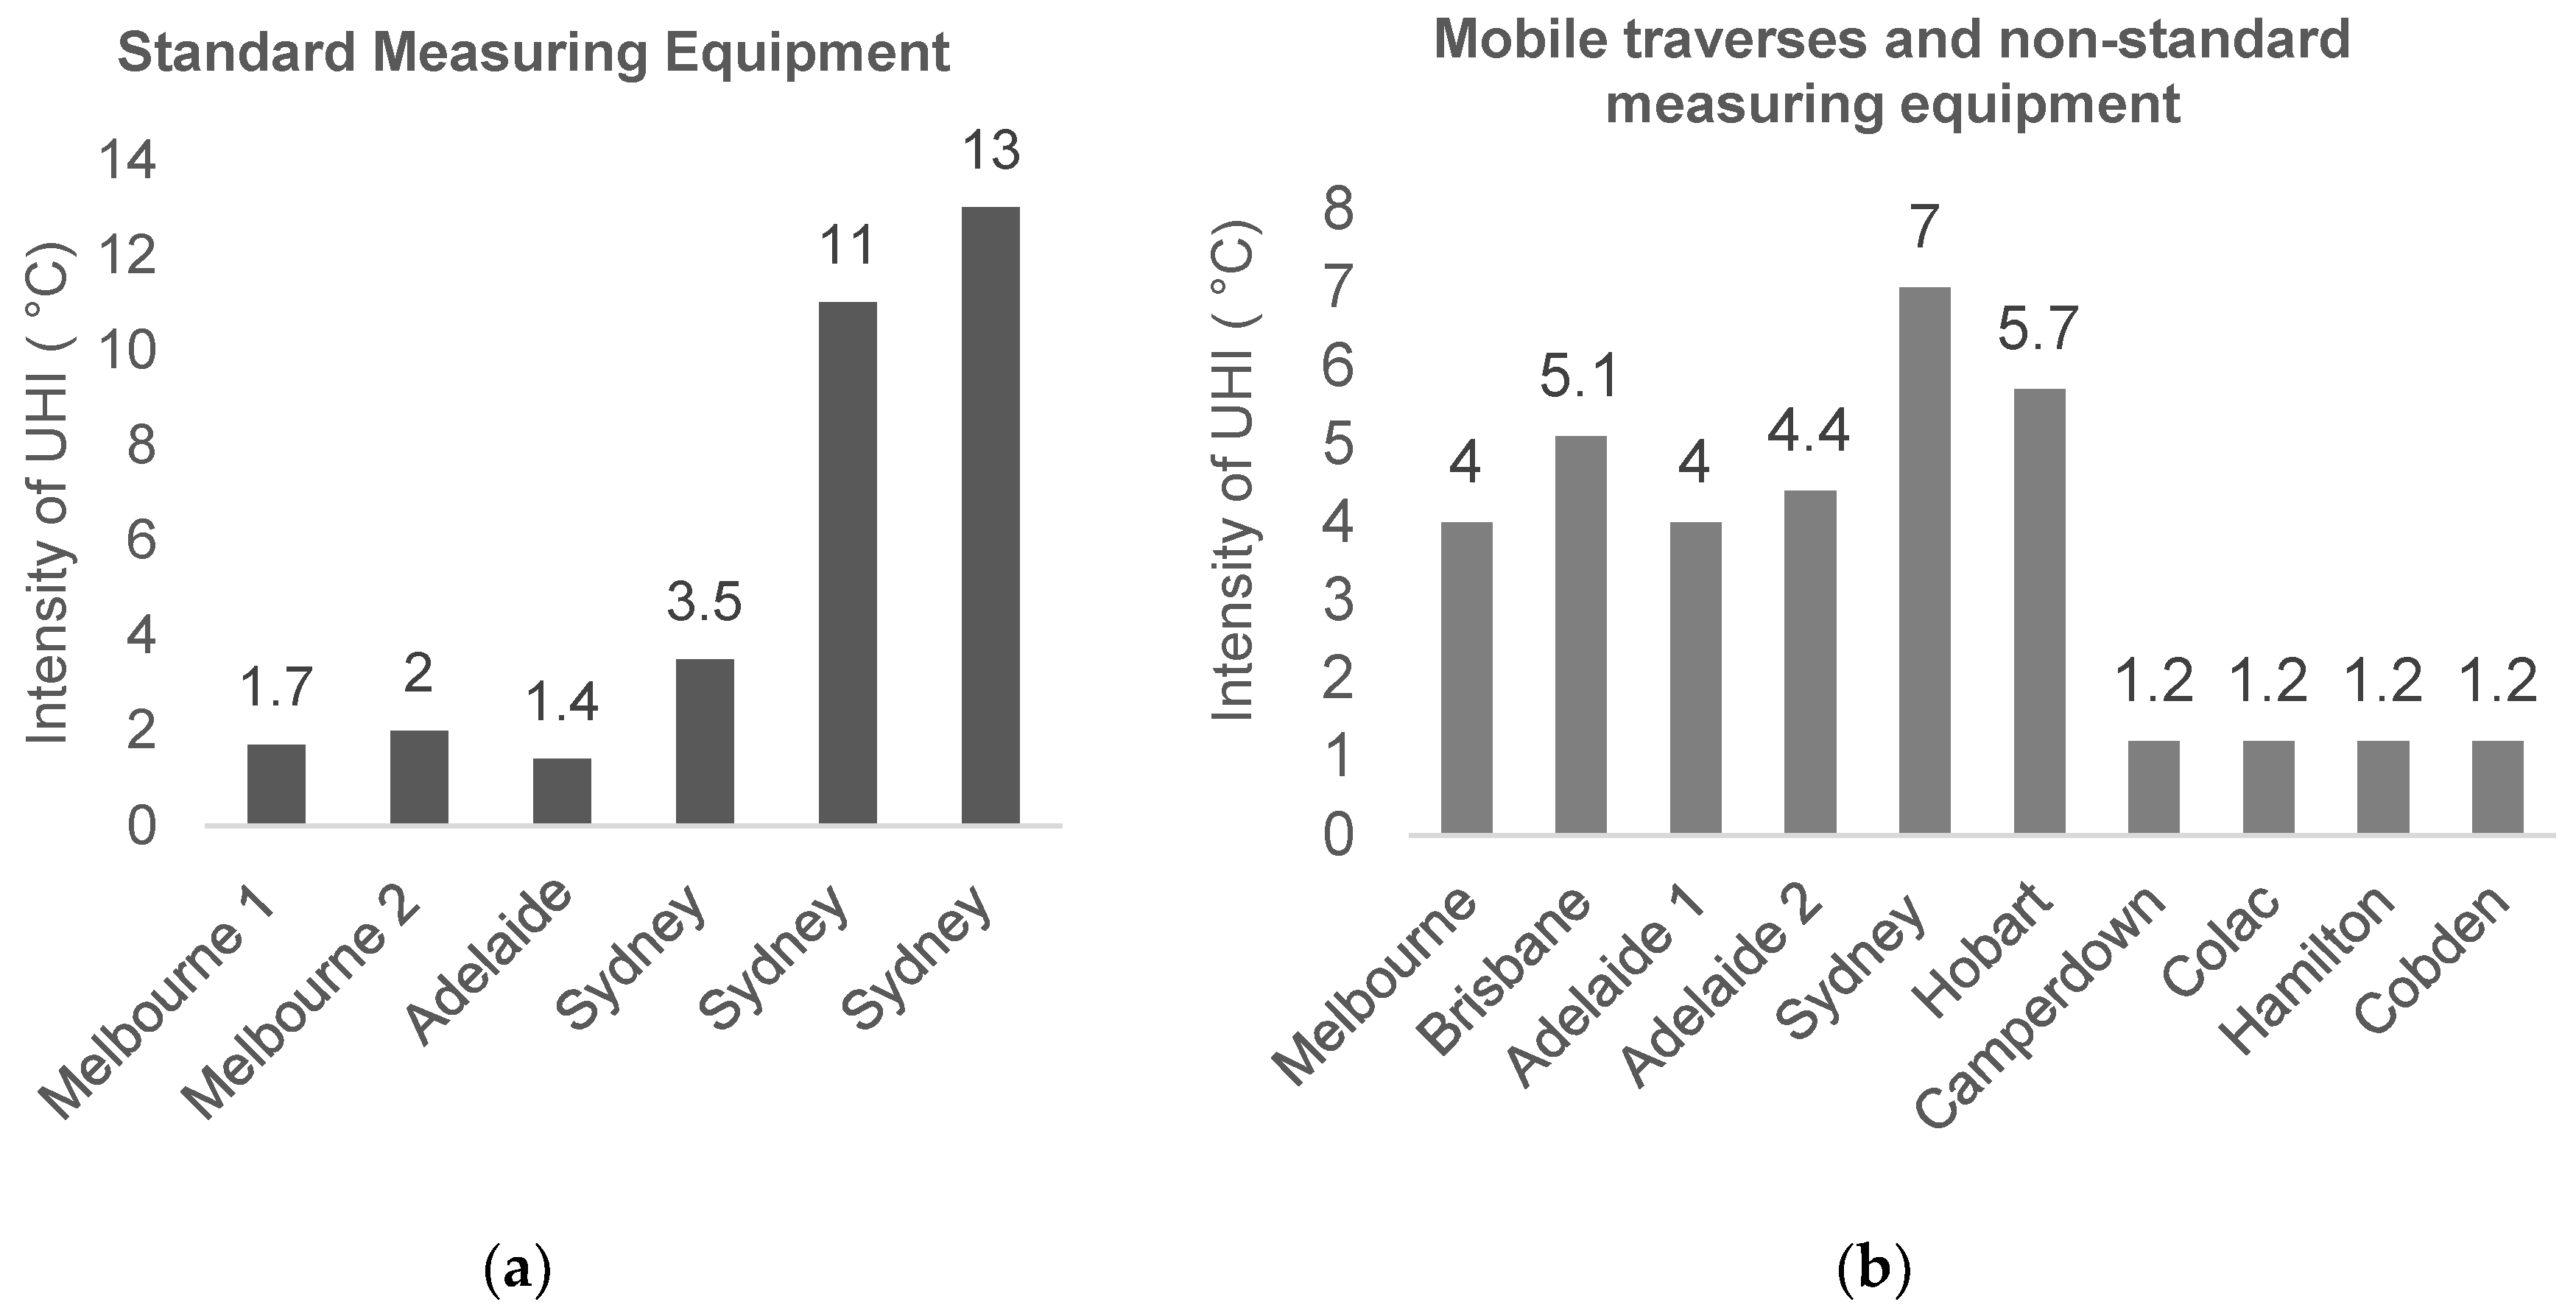
| No. | City | Population Density (People/sq.km: 2016) | Intensity of the Heat Island (ºC) | Details of Data Sources | Reference |
|---|---|---|---|---|---|
| 1 | Melbourne | 17,506 | annual average: 1.4 | one urban and one rural weather stations | [14] |
| annual average (depending on summer or winter): 0.5–2 | one central business district (CBD) and three sorrounding non-CBD area weather stations | [15] | |||
| average mean maximum intensity: 4 | mobile traverse from the western fringe, approximately 2 km south of the city center, through the CBD to the northern fringe | [16] | |||
| annual average: 1.4 | two urban and two rural reference stations | [17] | |||
| 2 | Sydney | 1171 | maximum intensity: 11 | six meteorological stations distributed across the city | [4] |
| maximum intensity: 13 | eight different stations within the city | [6] | |||
| 3 | Alice Springs | 85 | UHI is evident at night. Average intensity: 4.1 | ten sensors installed within the city center | [5] |
| 4 | Camperdown | 4362 | average intensity: 1.2 | mobile transect from a position in the rural area through town center to a rural area on the other side of the town | [16] |
| 5 | Colac | 520 | |||
| 6 | Hamilton | 480 | |||
| 7 | Hobart | 131 | maximum intensity: 5.7 | mobile sensors | [18] |
| 8 | Darwin | 703 | maximum intensity: 2 | weather station at airport | [19] |
| 9 | Perth | 317 | UHI is evident at night. maximum intensity: 0.8 | one urban, two urban fringe and three rural stations | [20] |
| 10 | Adelaide | 400 | UHI is evident at night. maximum intensity: 1.3 | one urban, two urban fringe and two rural stations | [20] |
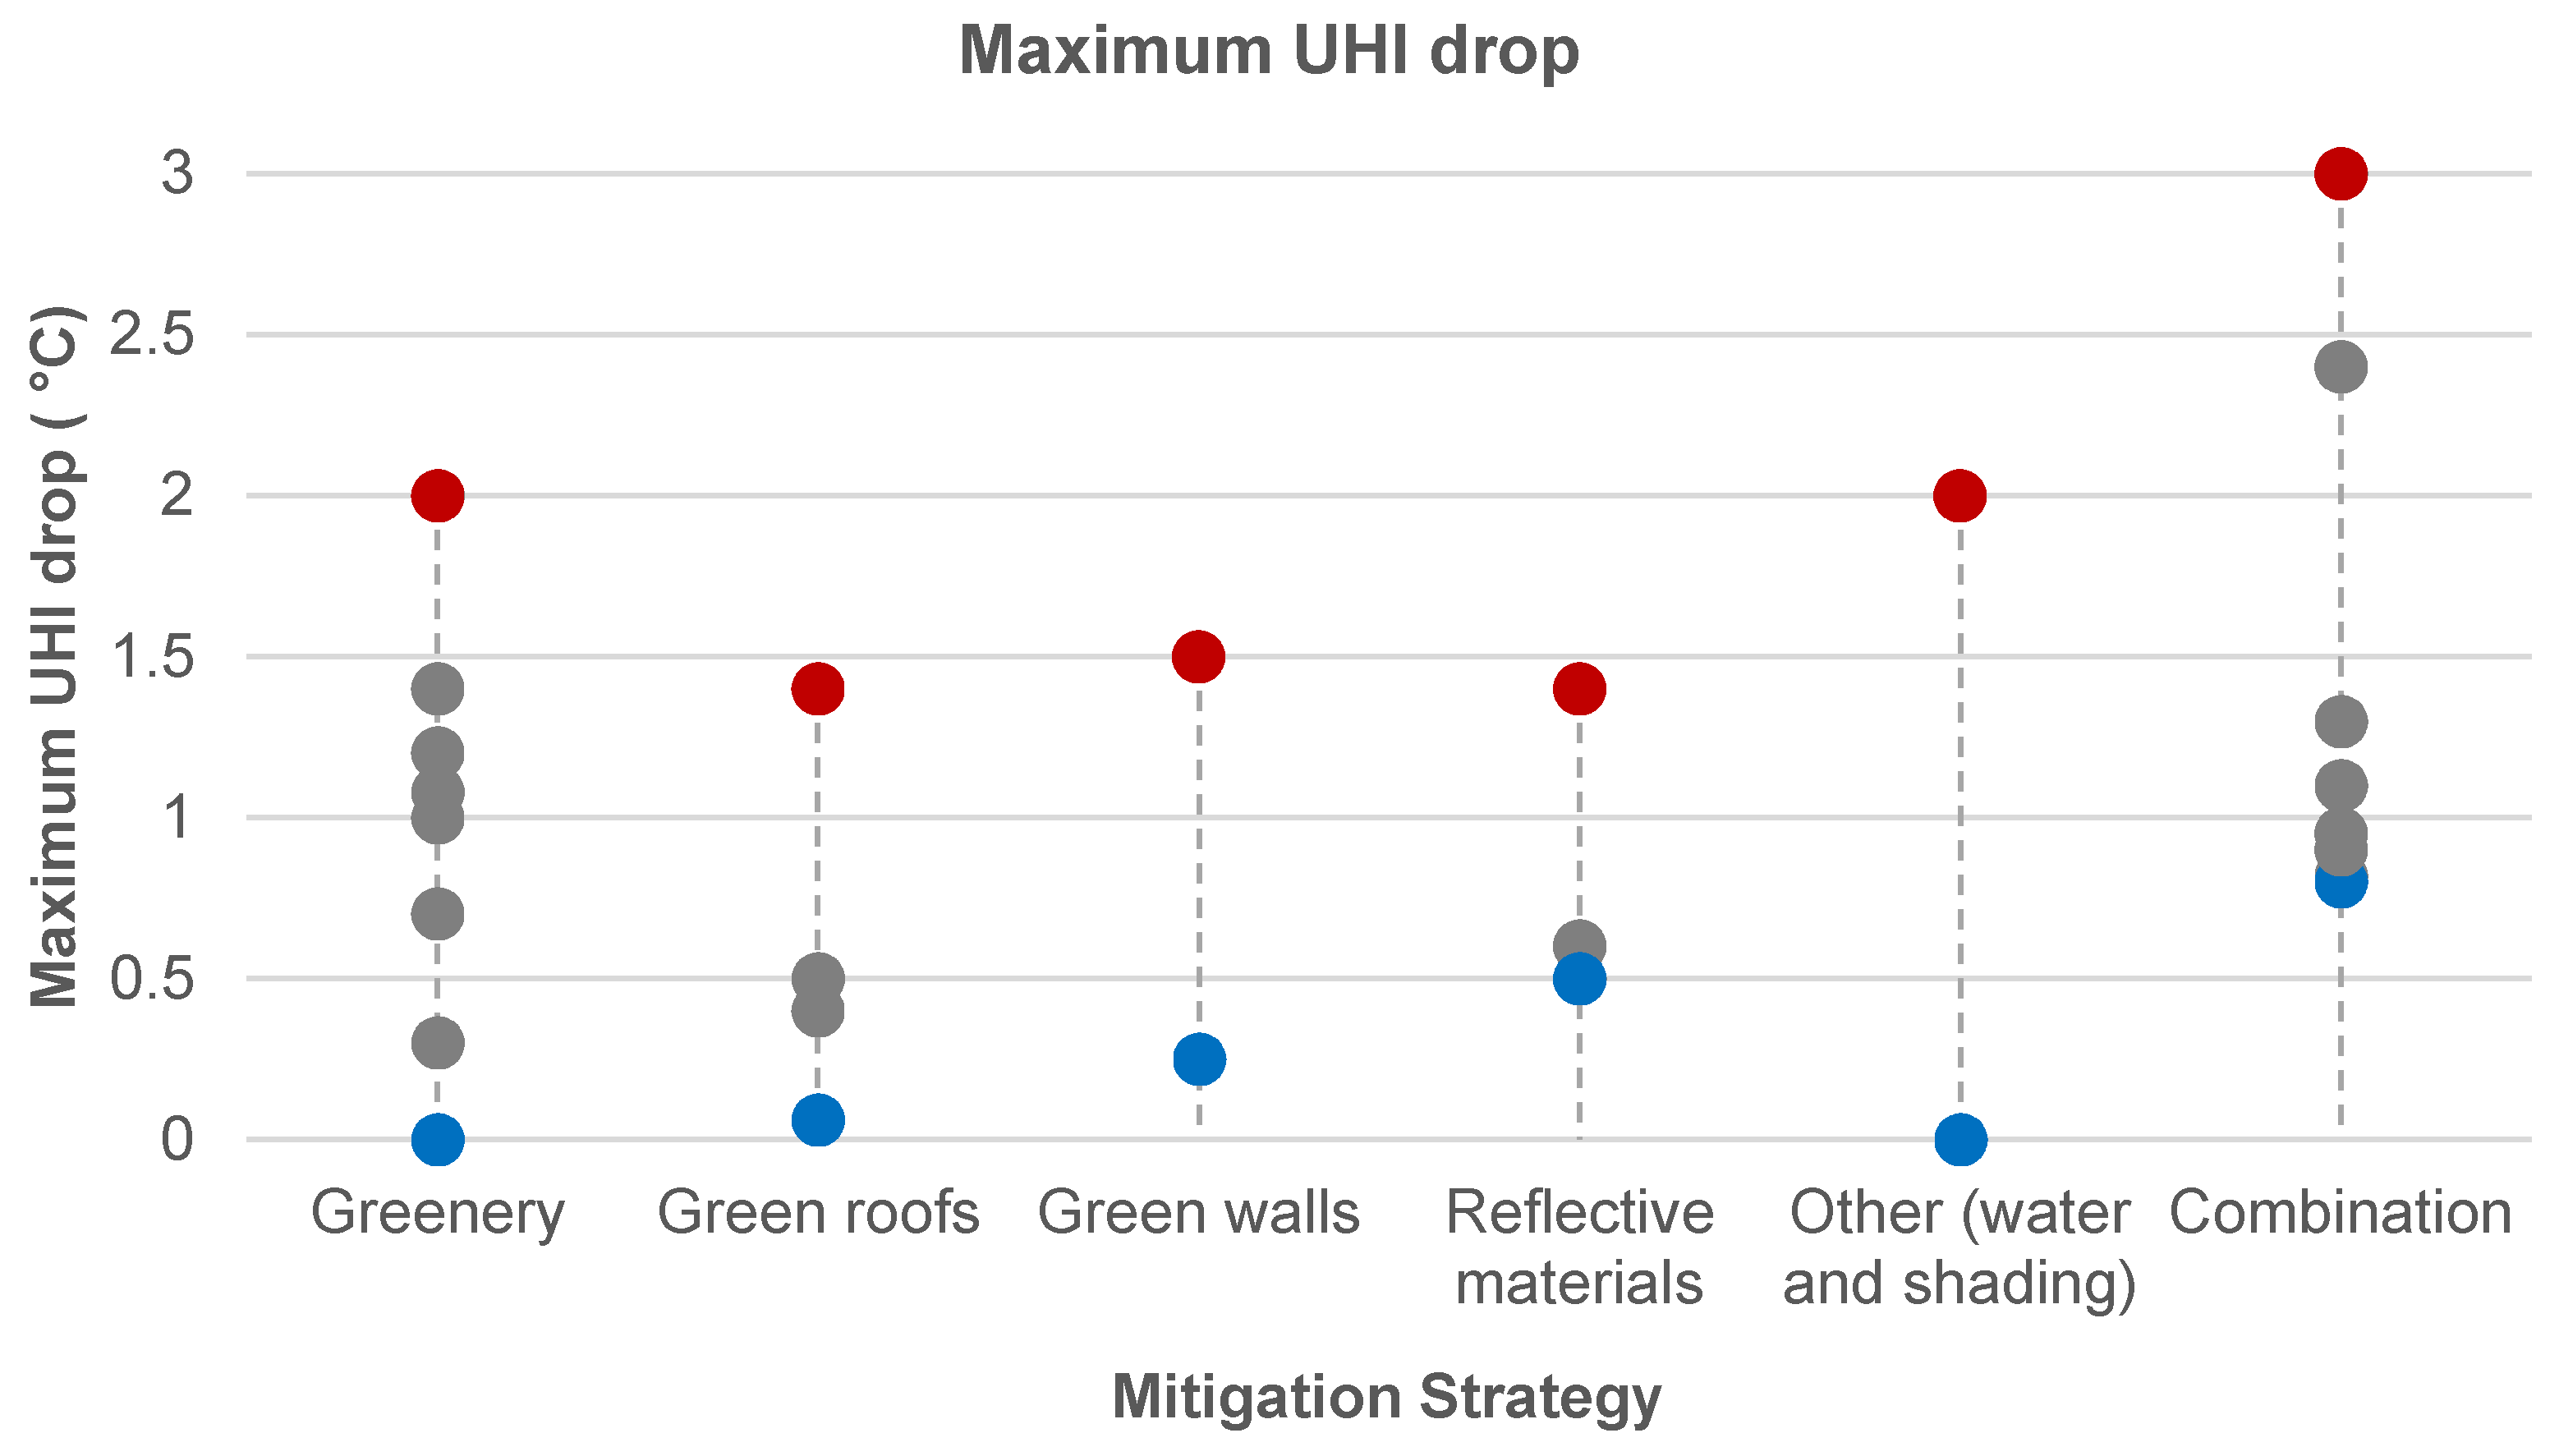
| S.No | Mitigation Strategy | Location | Maximum UHI Mitigation Potential | Reference |
|---|---|---|---|---|
| Urban Green Spaces | ||||
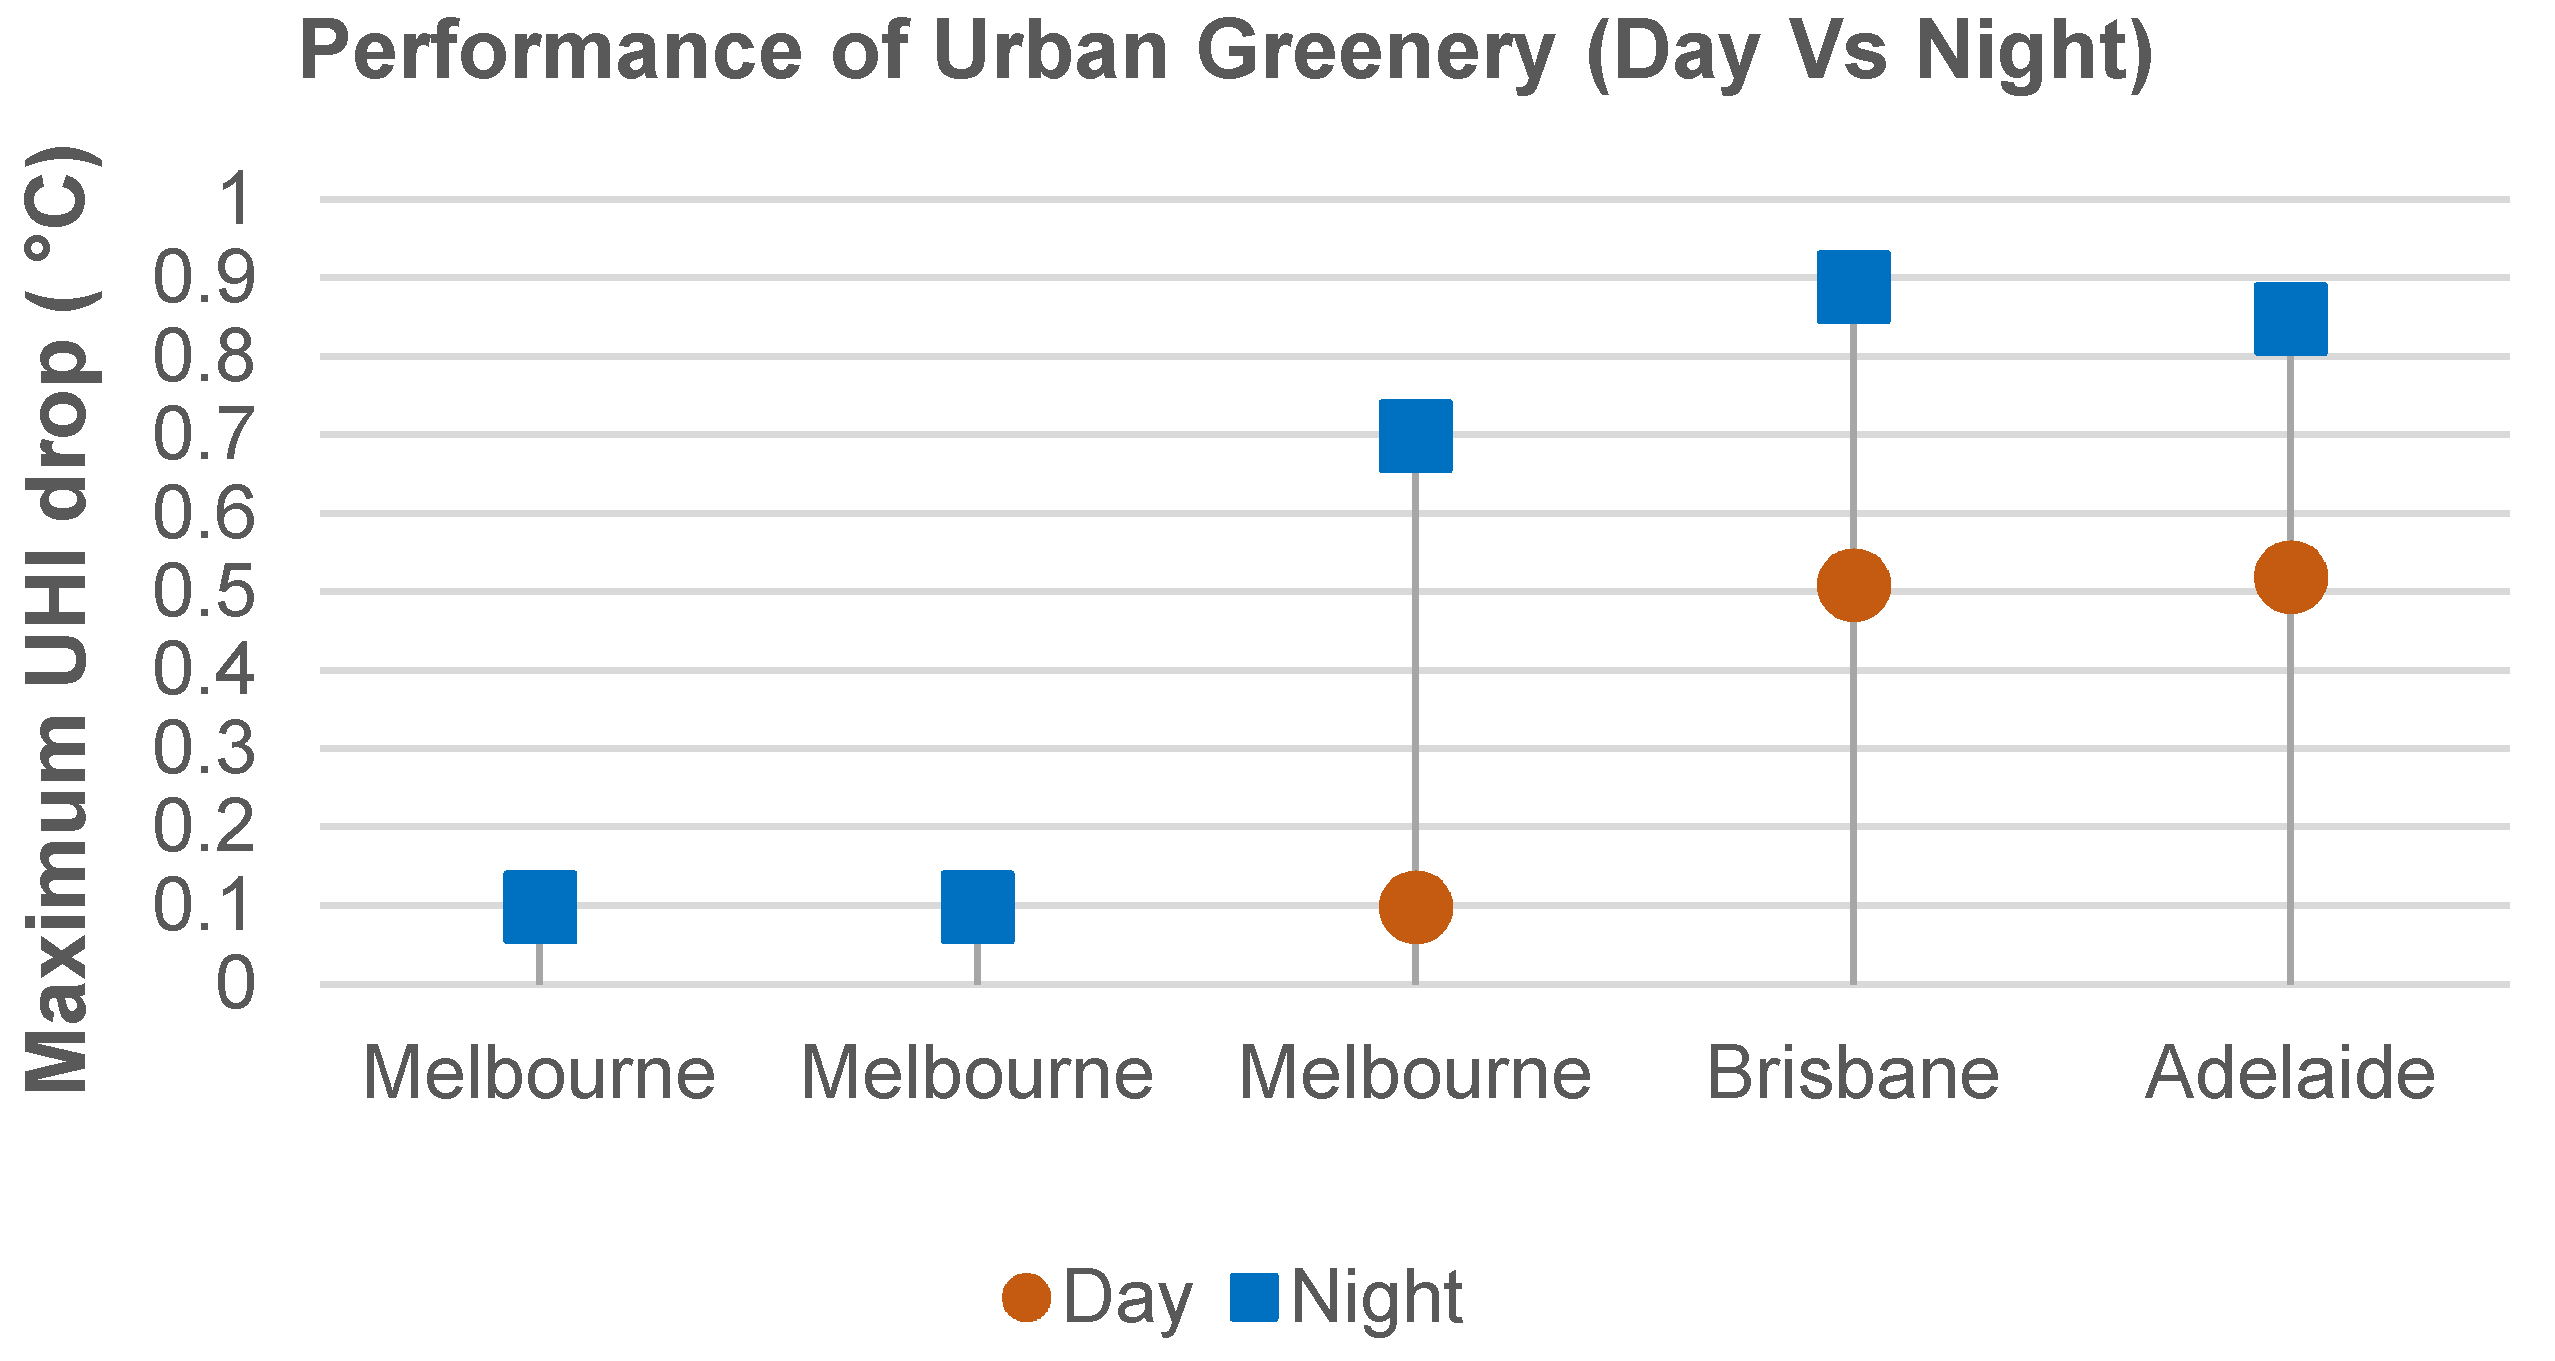
| 1 | Urban greenery | Sydney | 1.4 | [71] |
| 2 | Urban parks | Melbourne | 0.3 | [79] |
| 3 | Urban vegetation | Melbourne | 1 | [80] |
| 4 | Urban vegetation | Melbourne | 2 | [81] |
| 5 | Urban vegetation | Brisbane | 1.08 | [82] |
| 6 | Urban greenery | Alice Springs | 0 | [5] |
| 7 | Urban parks (trees) | Gold Coast (Brisbane) | 1.2 | [83] |
| 8 | Urban parks (grass) | Gold Coast (Brisbane) | 0.7 | [83] |
| 9 | Urban greenery | Adelaide | 2 | [84] |
| Green roofs | ||||
| 10 | Green roofs | Adelaide | 0.06 | [85] |
| 13 | Green roofs | Melbourne | 1.4 | [86] |
| 14 | Green roofs | Canberra | 0.4 | [87] |
| 15 | Green roofs | Sydney | 0.5 | [71] |
| Green Walls | ||||
| 16 | Green wall | Adelaide | 0.25 | [85] |
| 17 | Living wall | Adelaide | 1.5 | [88] |
| Reflective Materials | ||||
| 18 | Cool streets | Sydney | 1.4 | [71] |
| 19 | Cool pavements | Sydney | 0.5 | |
| 20 | Cool roofs | Sydney | 0.6 | |
| 21 | Cool roofs | Melbourne | 0.5 | [80] |
| Water | ||||
| 23 | Water sprinklers | Alice Springs | 0 | [5] |
| Shading | ||||
| 24 | Street shading | Alice Springs | 0 | [5] |
| Combination | ||||
| 25 | Greenery and Reflective materials | 0.95 | [89] | |
| 26 | Water and Shading | 3 | ||
| 27 | Reflective materials (roofs, pavements, streets) | Sydney | 3 | [71] |
| 28 | Urban vegetation and Cool roofs | Melbourne | 0.82 | [80] |
| 29 | Trees, Reflective materials (roofs and pavements), Evaporative cooling systems and Shading | Alice Springs | 1.1 | [5] |
| 30 | Trees and Green roofs | Melbourne | 2.4 | [86] |
| 31 | Trees and Grass | Canberra | 0.8 | [87] |
| 32 | Reflective materials (buildings and pavement) | Alice Springs | 0.9 | [5] |
| 33 | Reflective materials (roofs, pavements) and trees | Sydney | 1.3 | [90] |
Publisher’s Note: MDPI stays neutral with regard to jurisdictional claims in published maps and institutional affiliations. |
© 2020 by the authors. Licensee MDPI, Basel, Switzerland. This article is an open access article distributed under the terms and conditions of the Creative Commons Attribution (CC BY) license (http://creativecommons.org/licenses/by/4.0/).
Share and Cite
Yenneti, K.; Ding, L.; Prasad, D.; Ulpiani, G.; Paolini, R.; Haddad, S.; Santamouris, M. Urban Overheating and Cooling Potential in Australia: An Evidence-Based Review. Climate 2020, 8, 126. https://doi.org/10.3390/cli8110126
Yenneti K, Ding L, Prasad D, Ulpiani G, Paolini R, Haddad S, Santamouris M. Urban Overheating and Cooling Potential in Australia: An Evidence-Based Review. Climate. 2020; 8(11):126. https://doi.org/10.3390/cli8110126
Chicago/Turabian StyleYenneti, Komali, Lan Ding, Deo Prasad, Giulia Ulpiani, Riccardo Paolini, Shamila Haddad, and Mattheos Santamouris. 2020. "Urban Overheating and Cooling Potential in Australia: An Evidence-Based Review" Climate 8, no. 11: 126. https://doi.org/10.3390/cli8110126
APA StyleYenneti, K., Ding, L., Prasad, D., Ulpiani, G., Paolini, R., Haddad, S., & Santamouris, M. (2020). Urban Overheating and Cooling Potential in Australia: An Evidence-Based Review. Climate, 8(11), 126. https://doi.org/10.3390/cli8110126