The Antarctic Centennial Oscillation: A Natural Paleoclimate Cycle in the Southern Hemisphere That Influences Global Temperature


Abstract
1. Introduction
2. Methods
3. Results
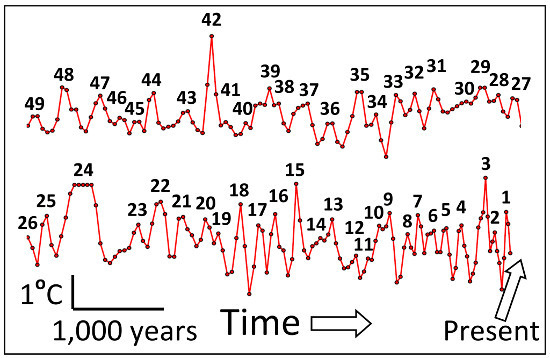
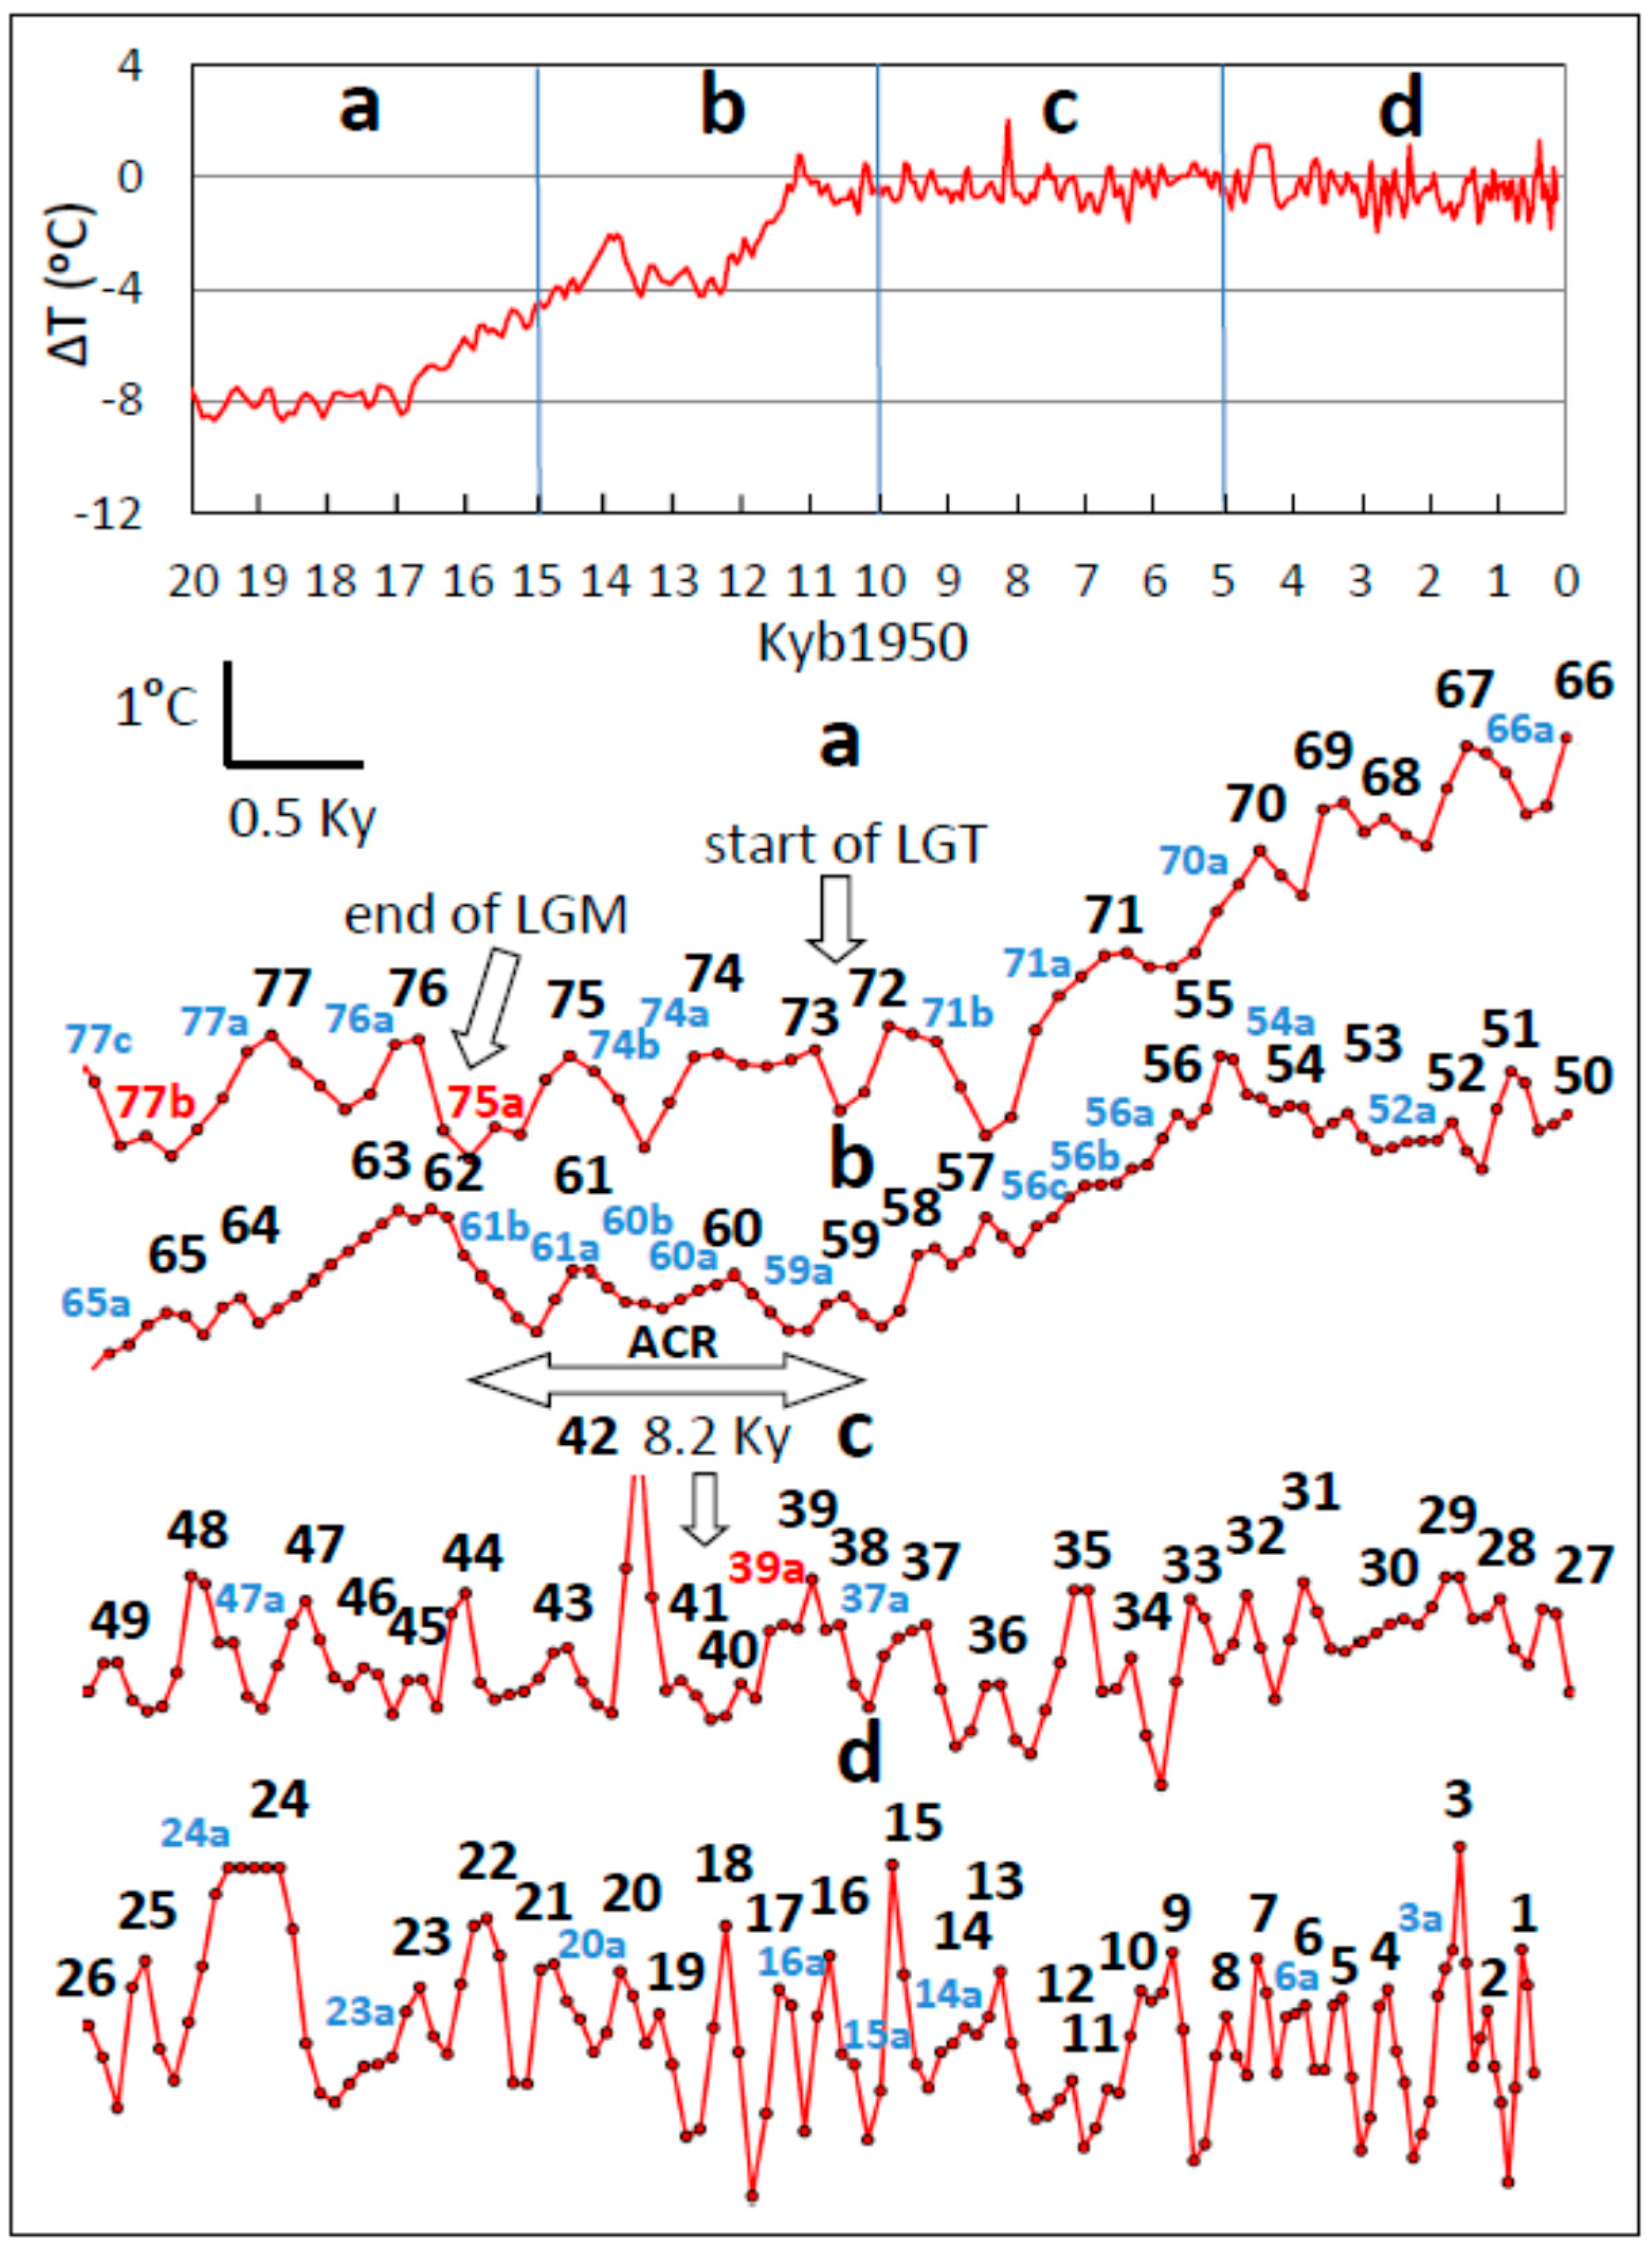
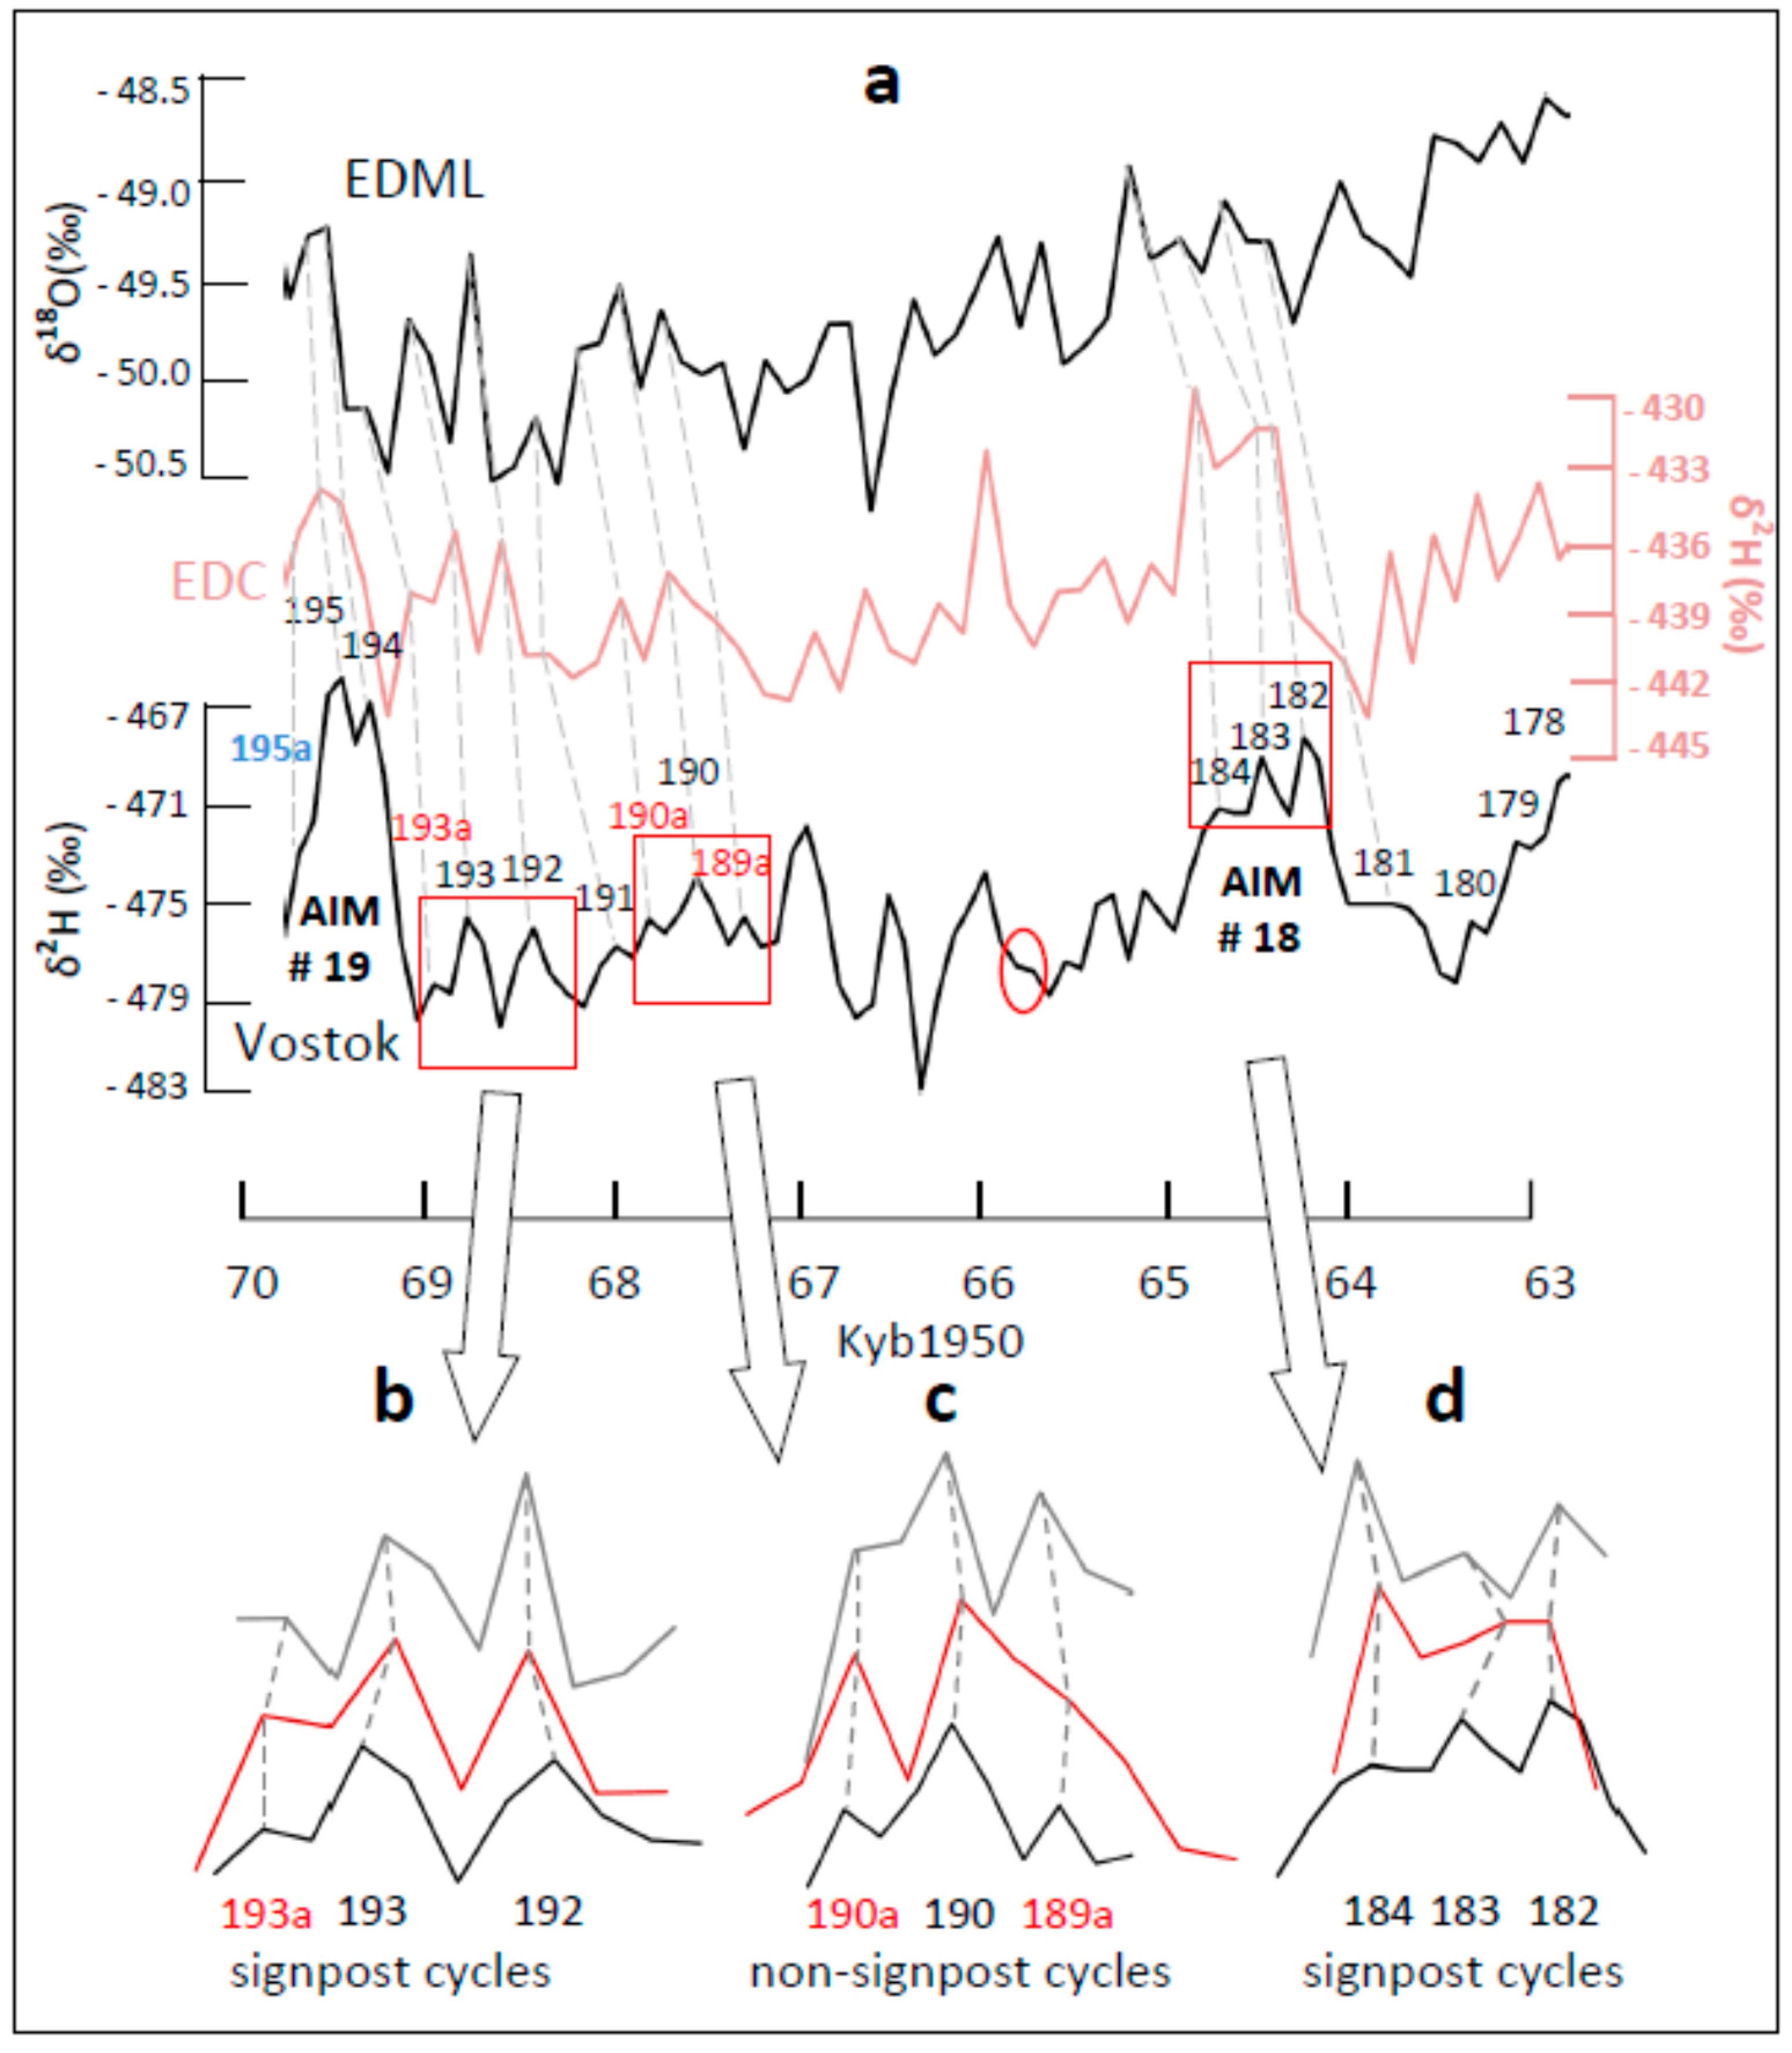
3.1. Cycle Nomenclature
3.2. Cycle Form
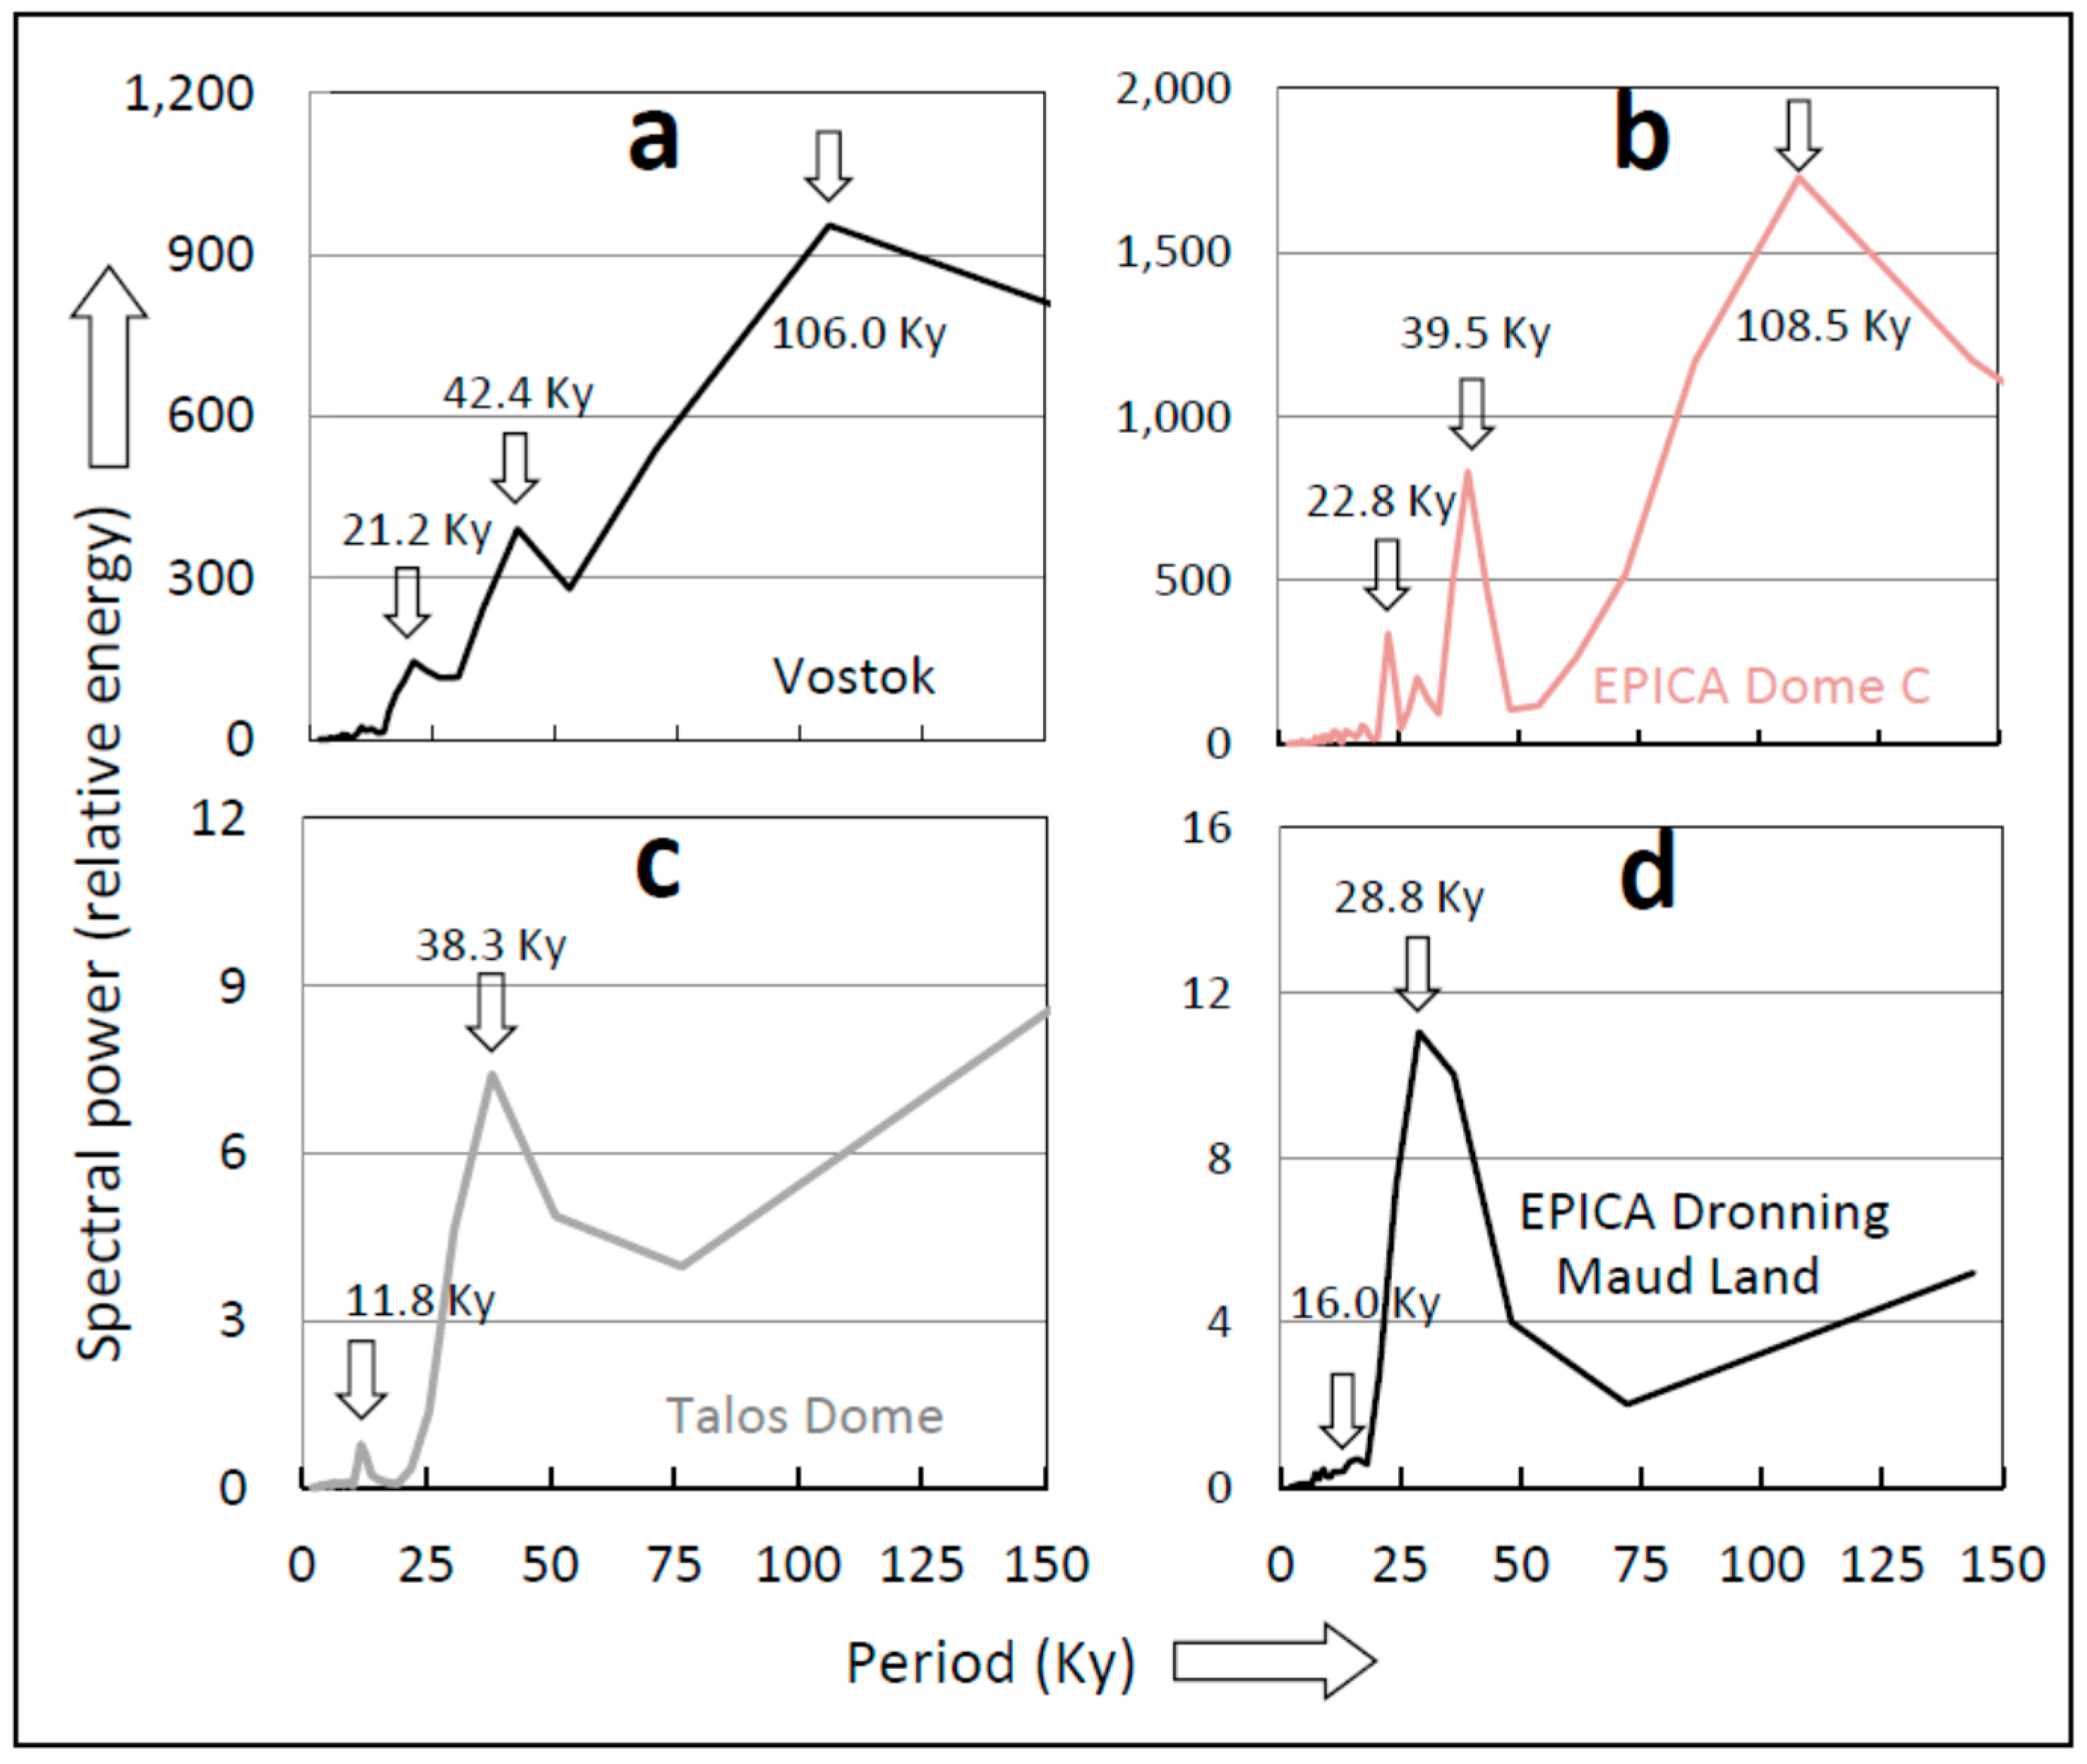
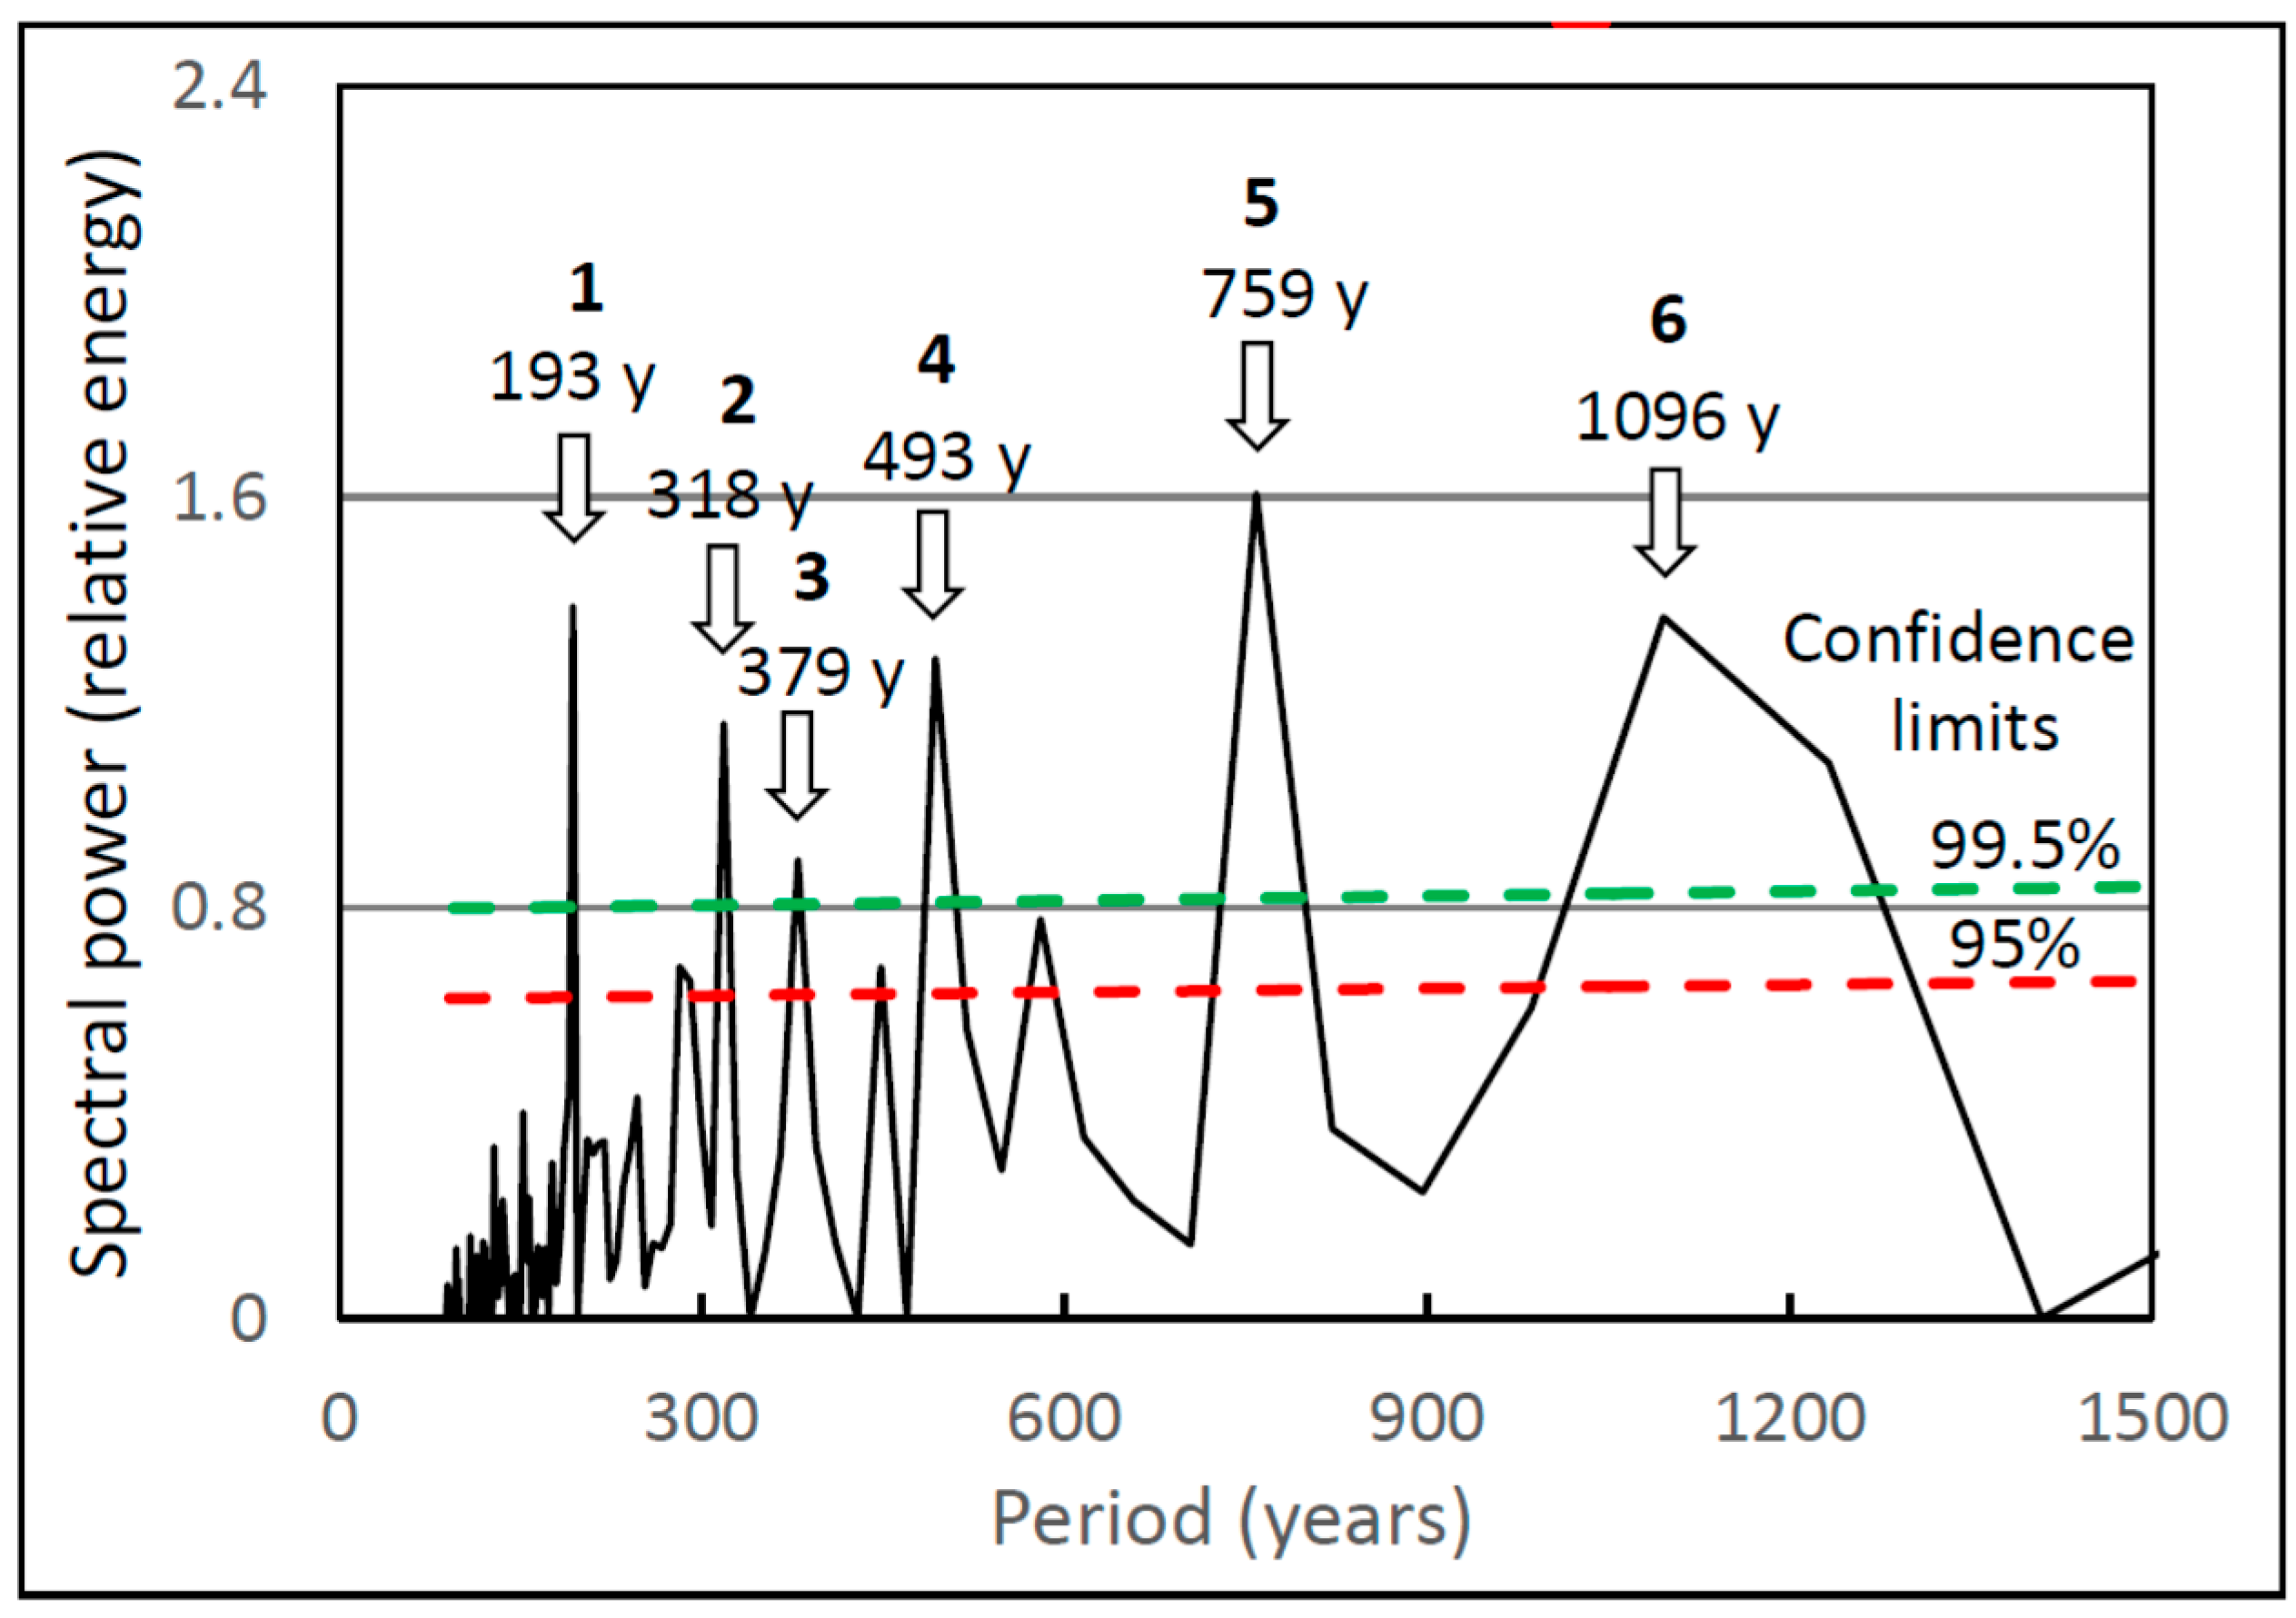
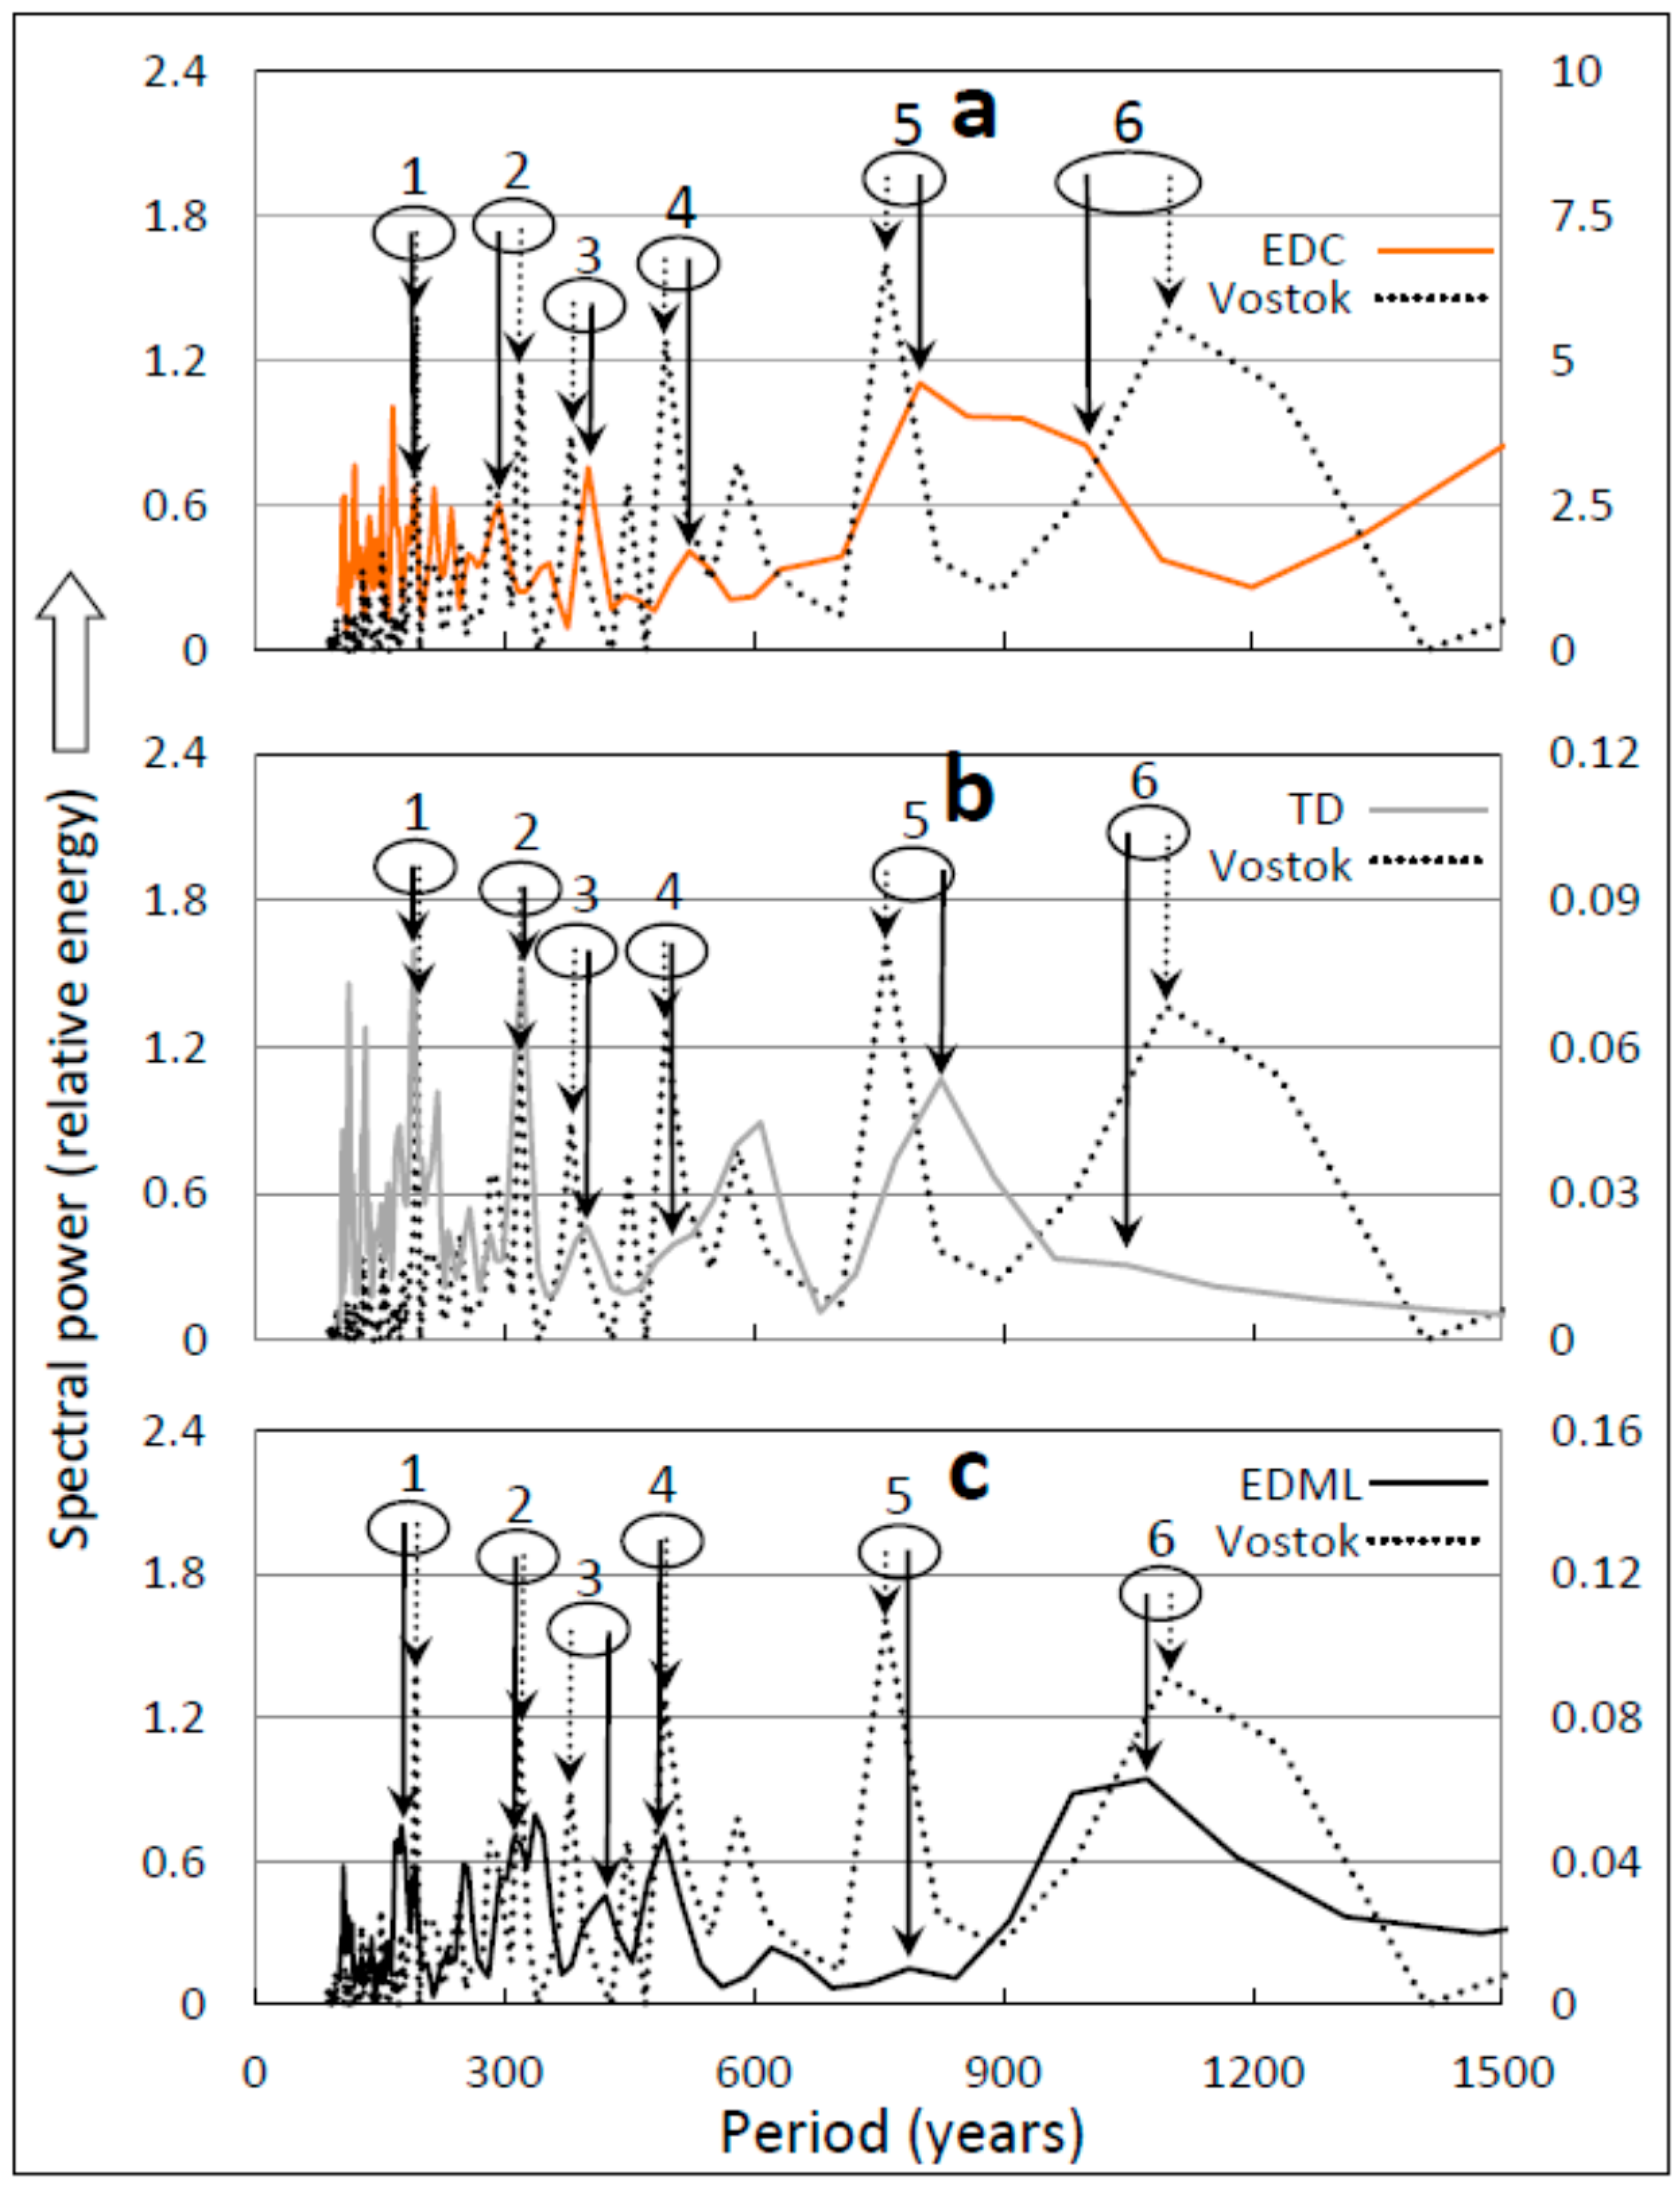
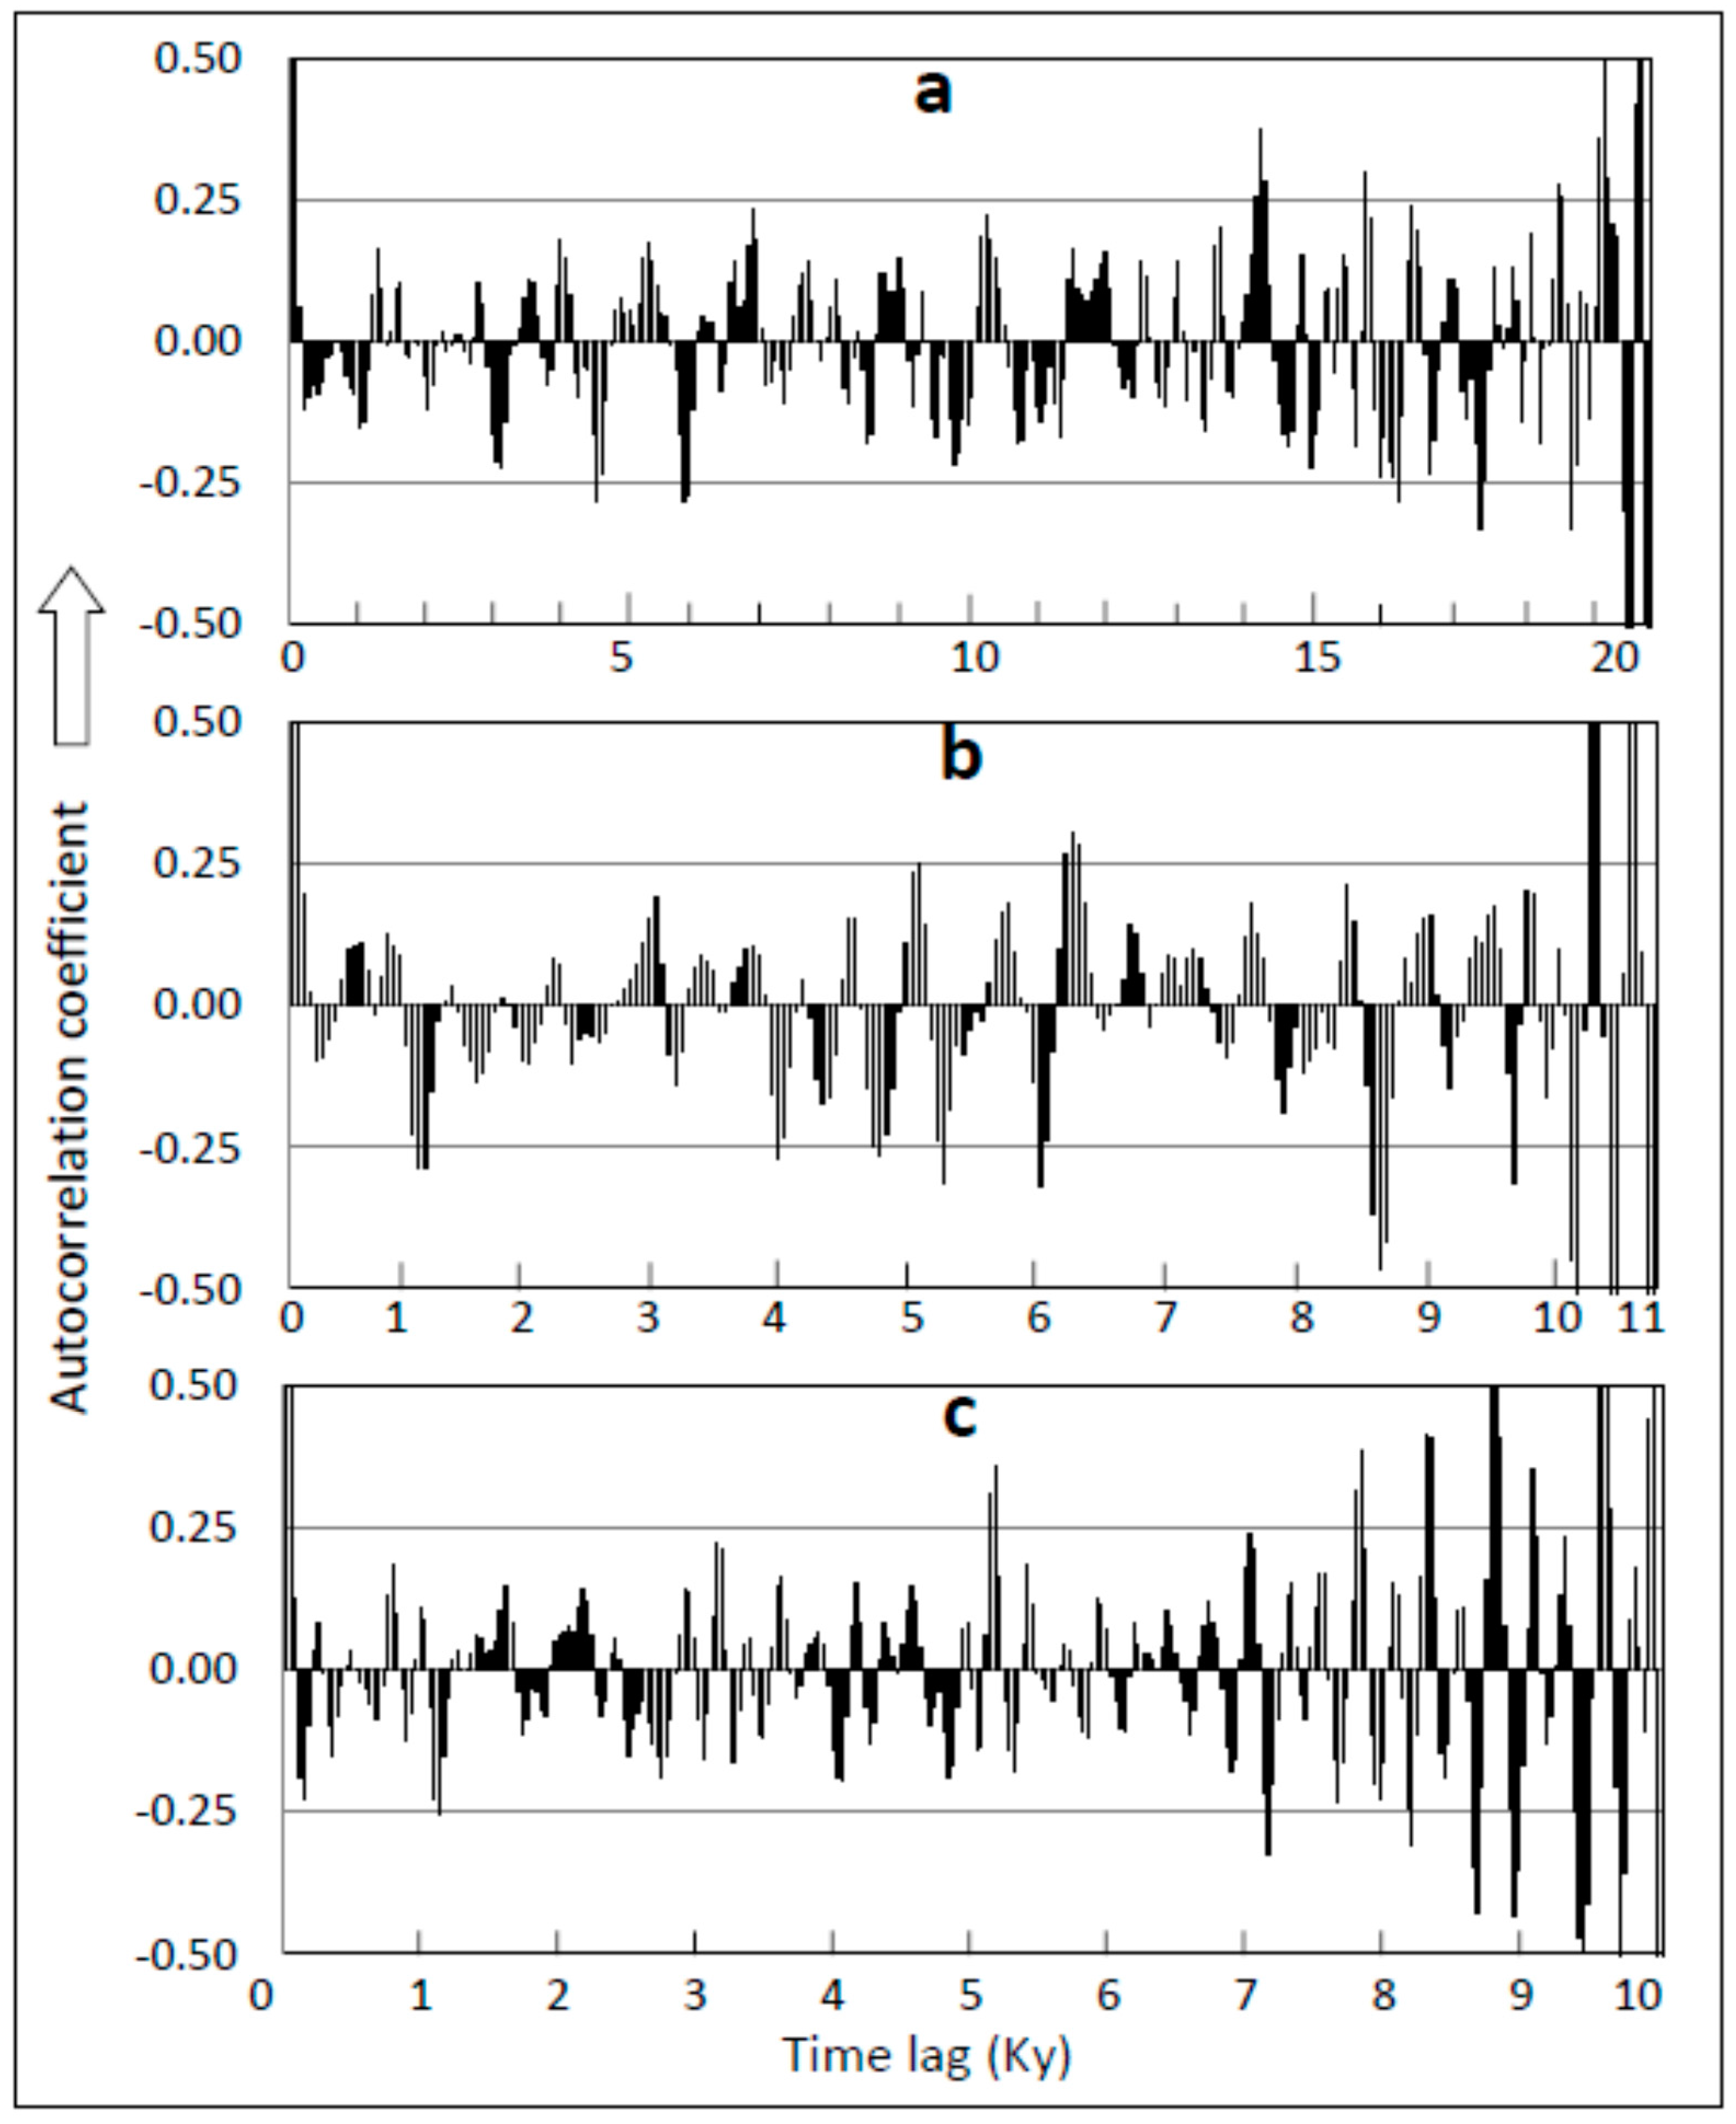
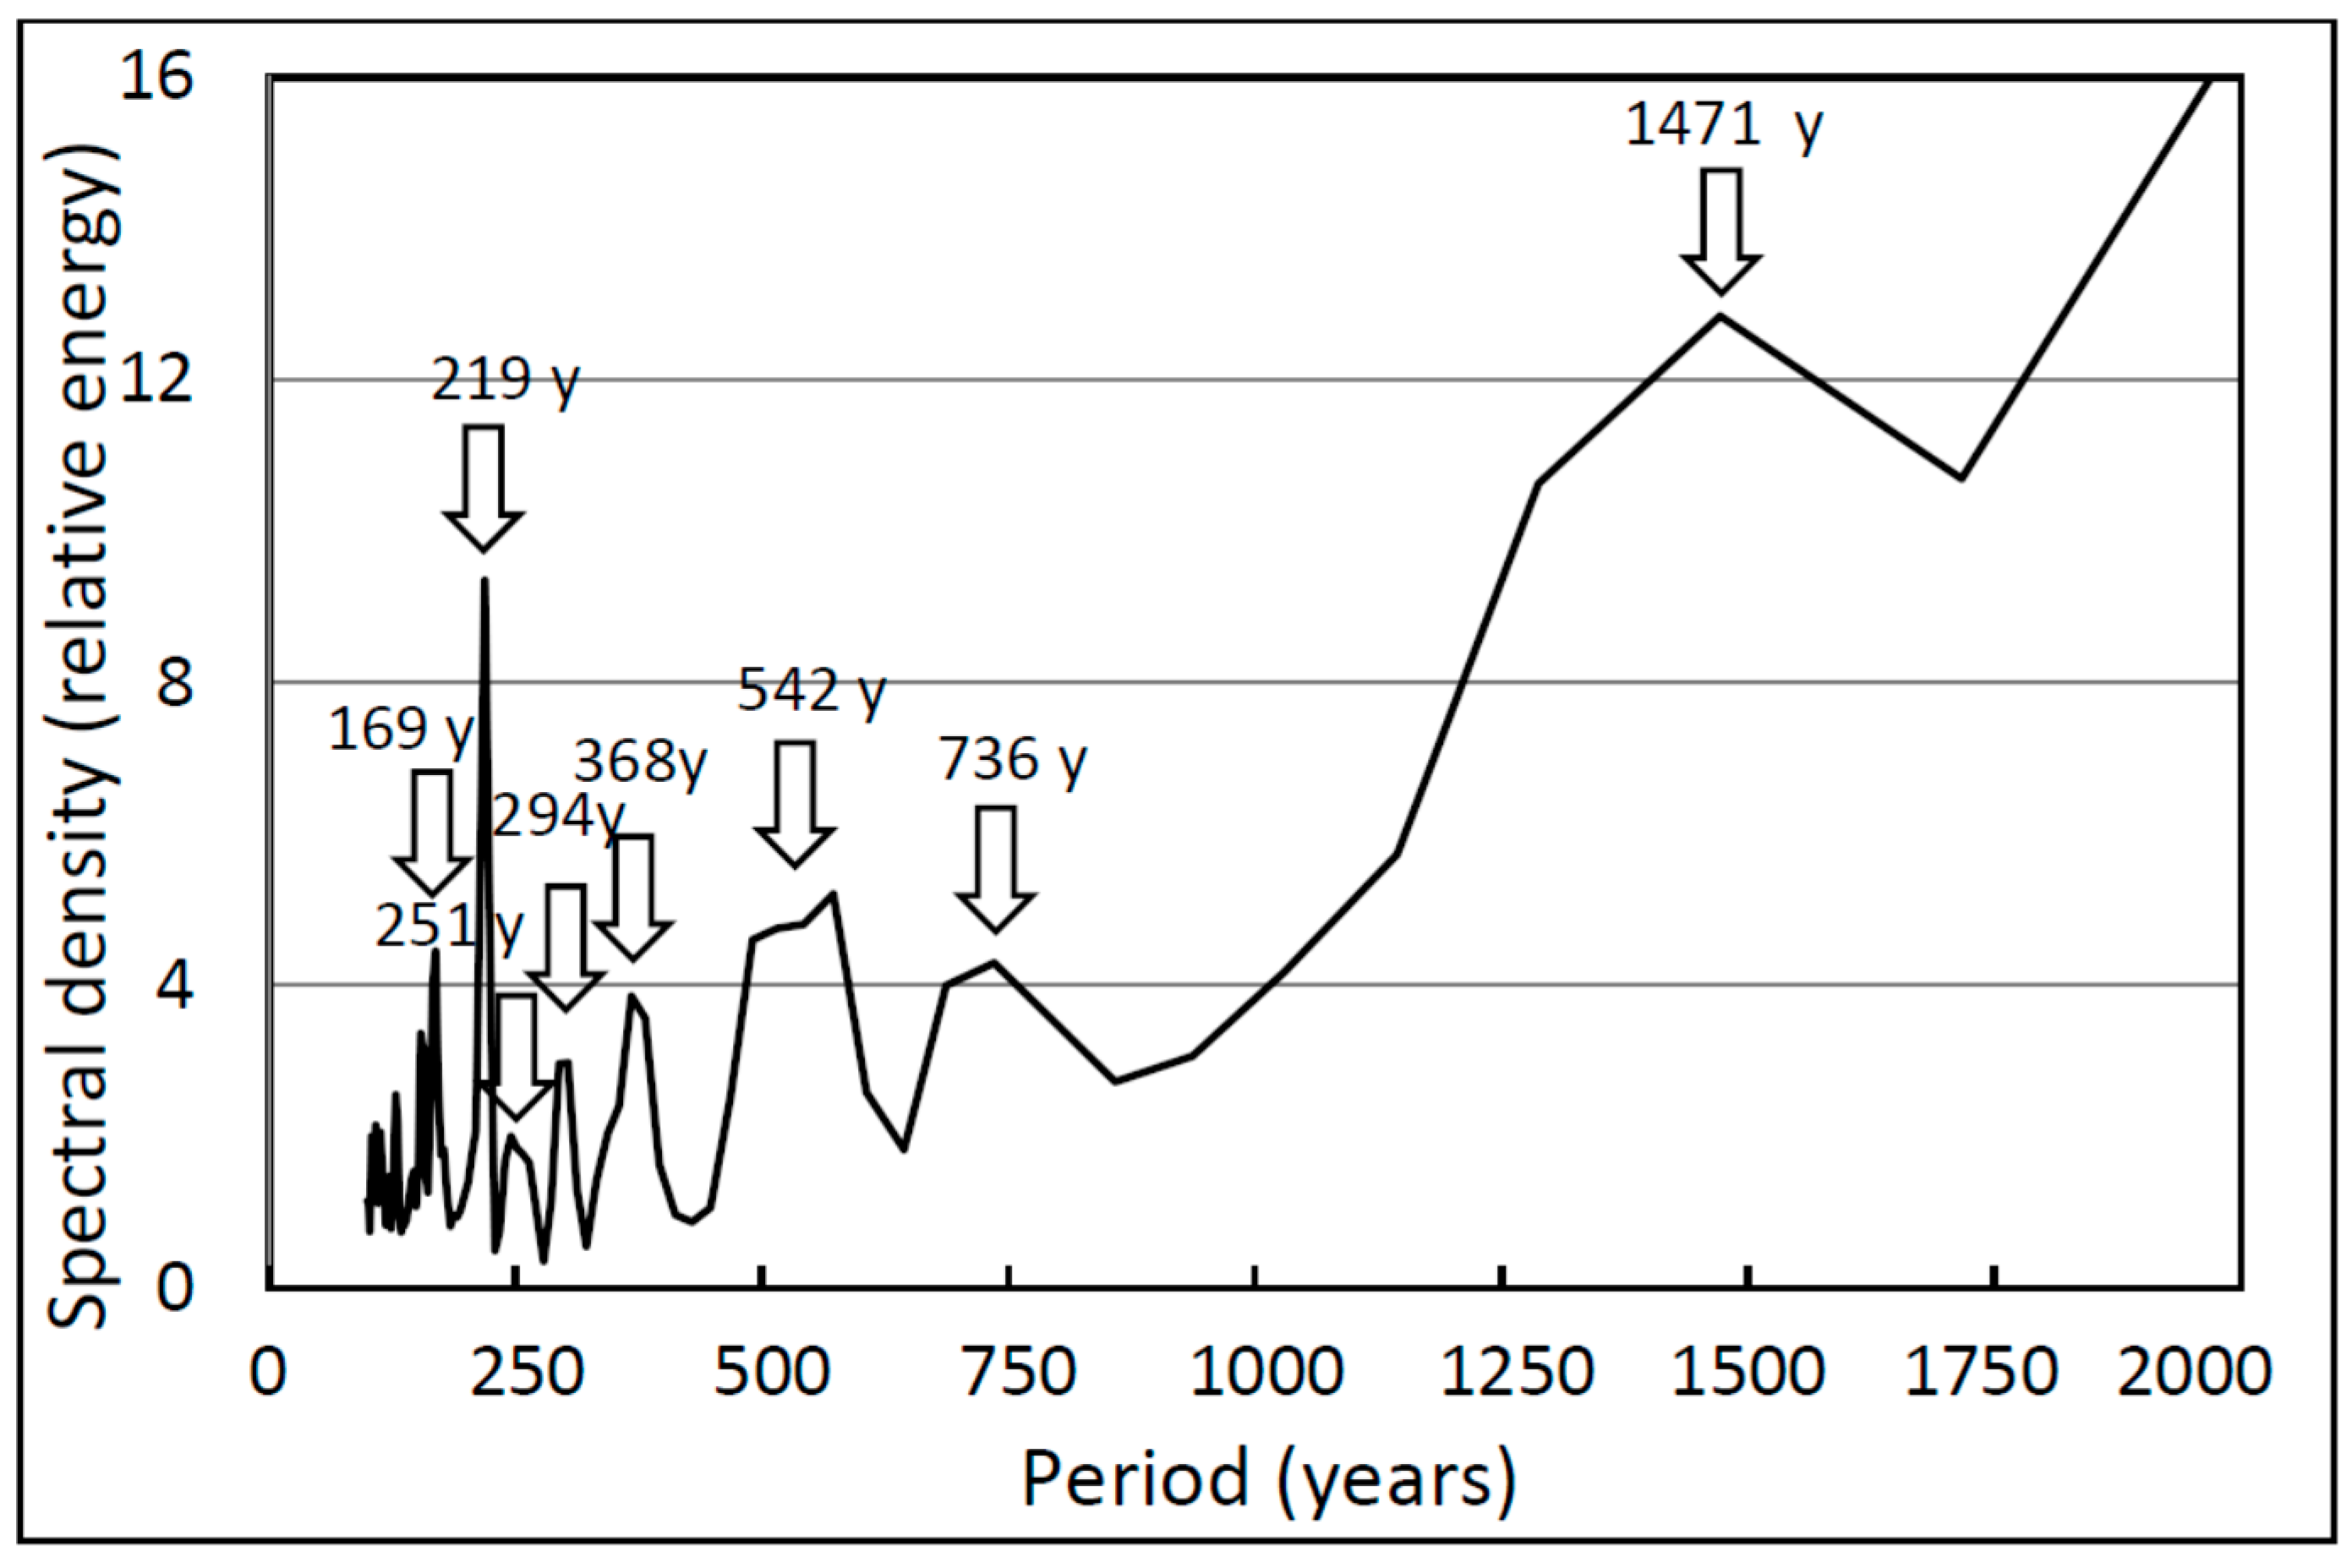
3.3. Cycle Periodicity
3.4. Geographic Distribution of ACOs
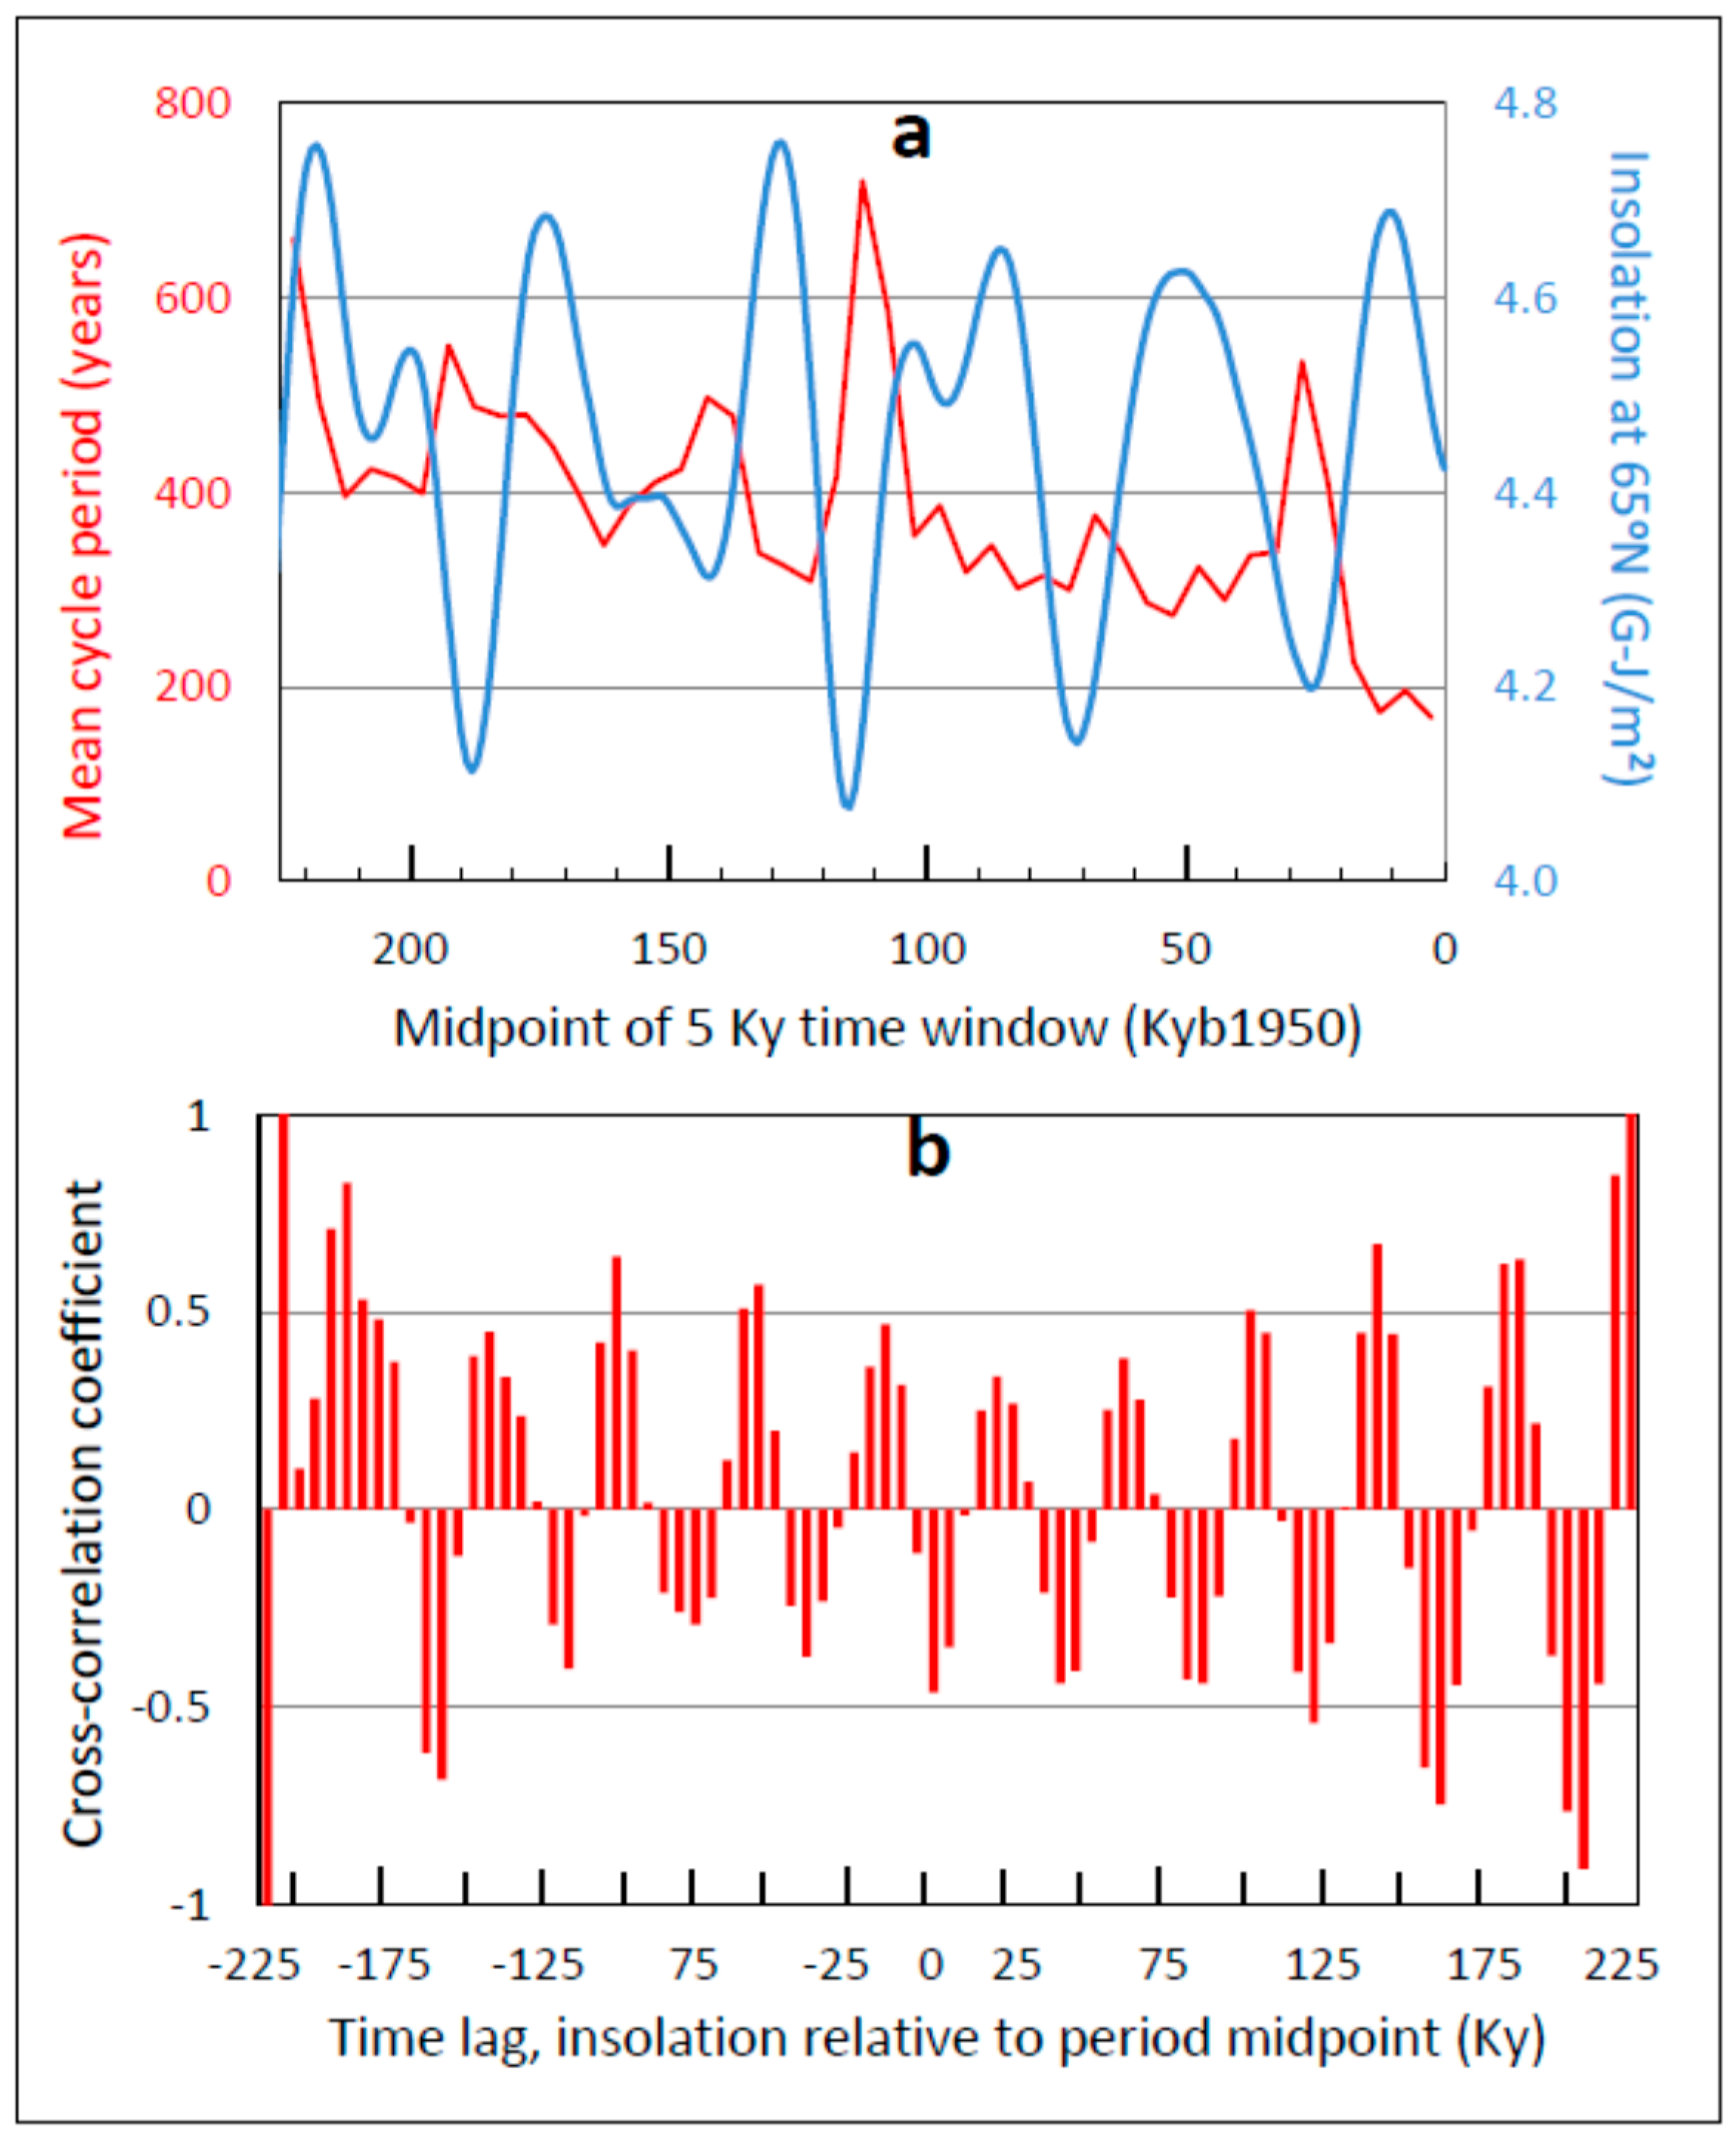
3.5. ACO Period
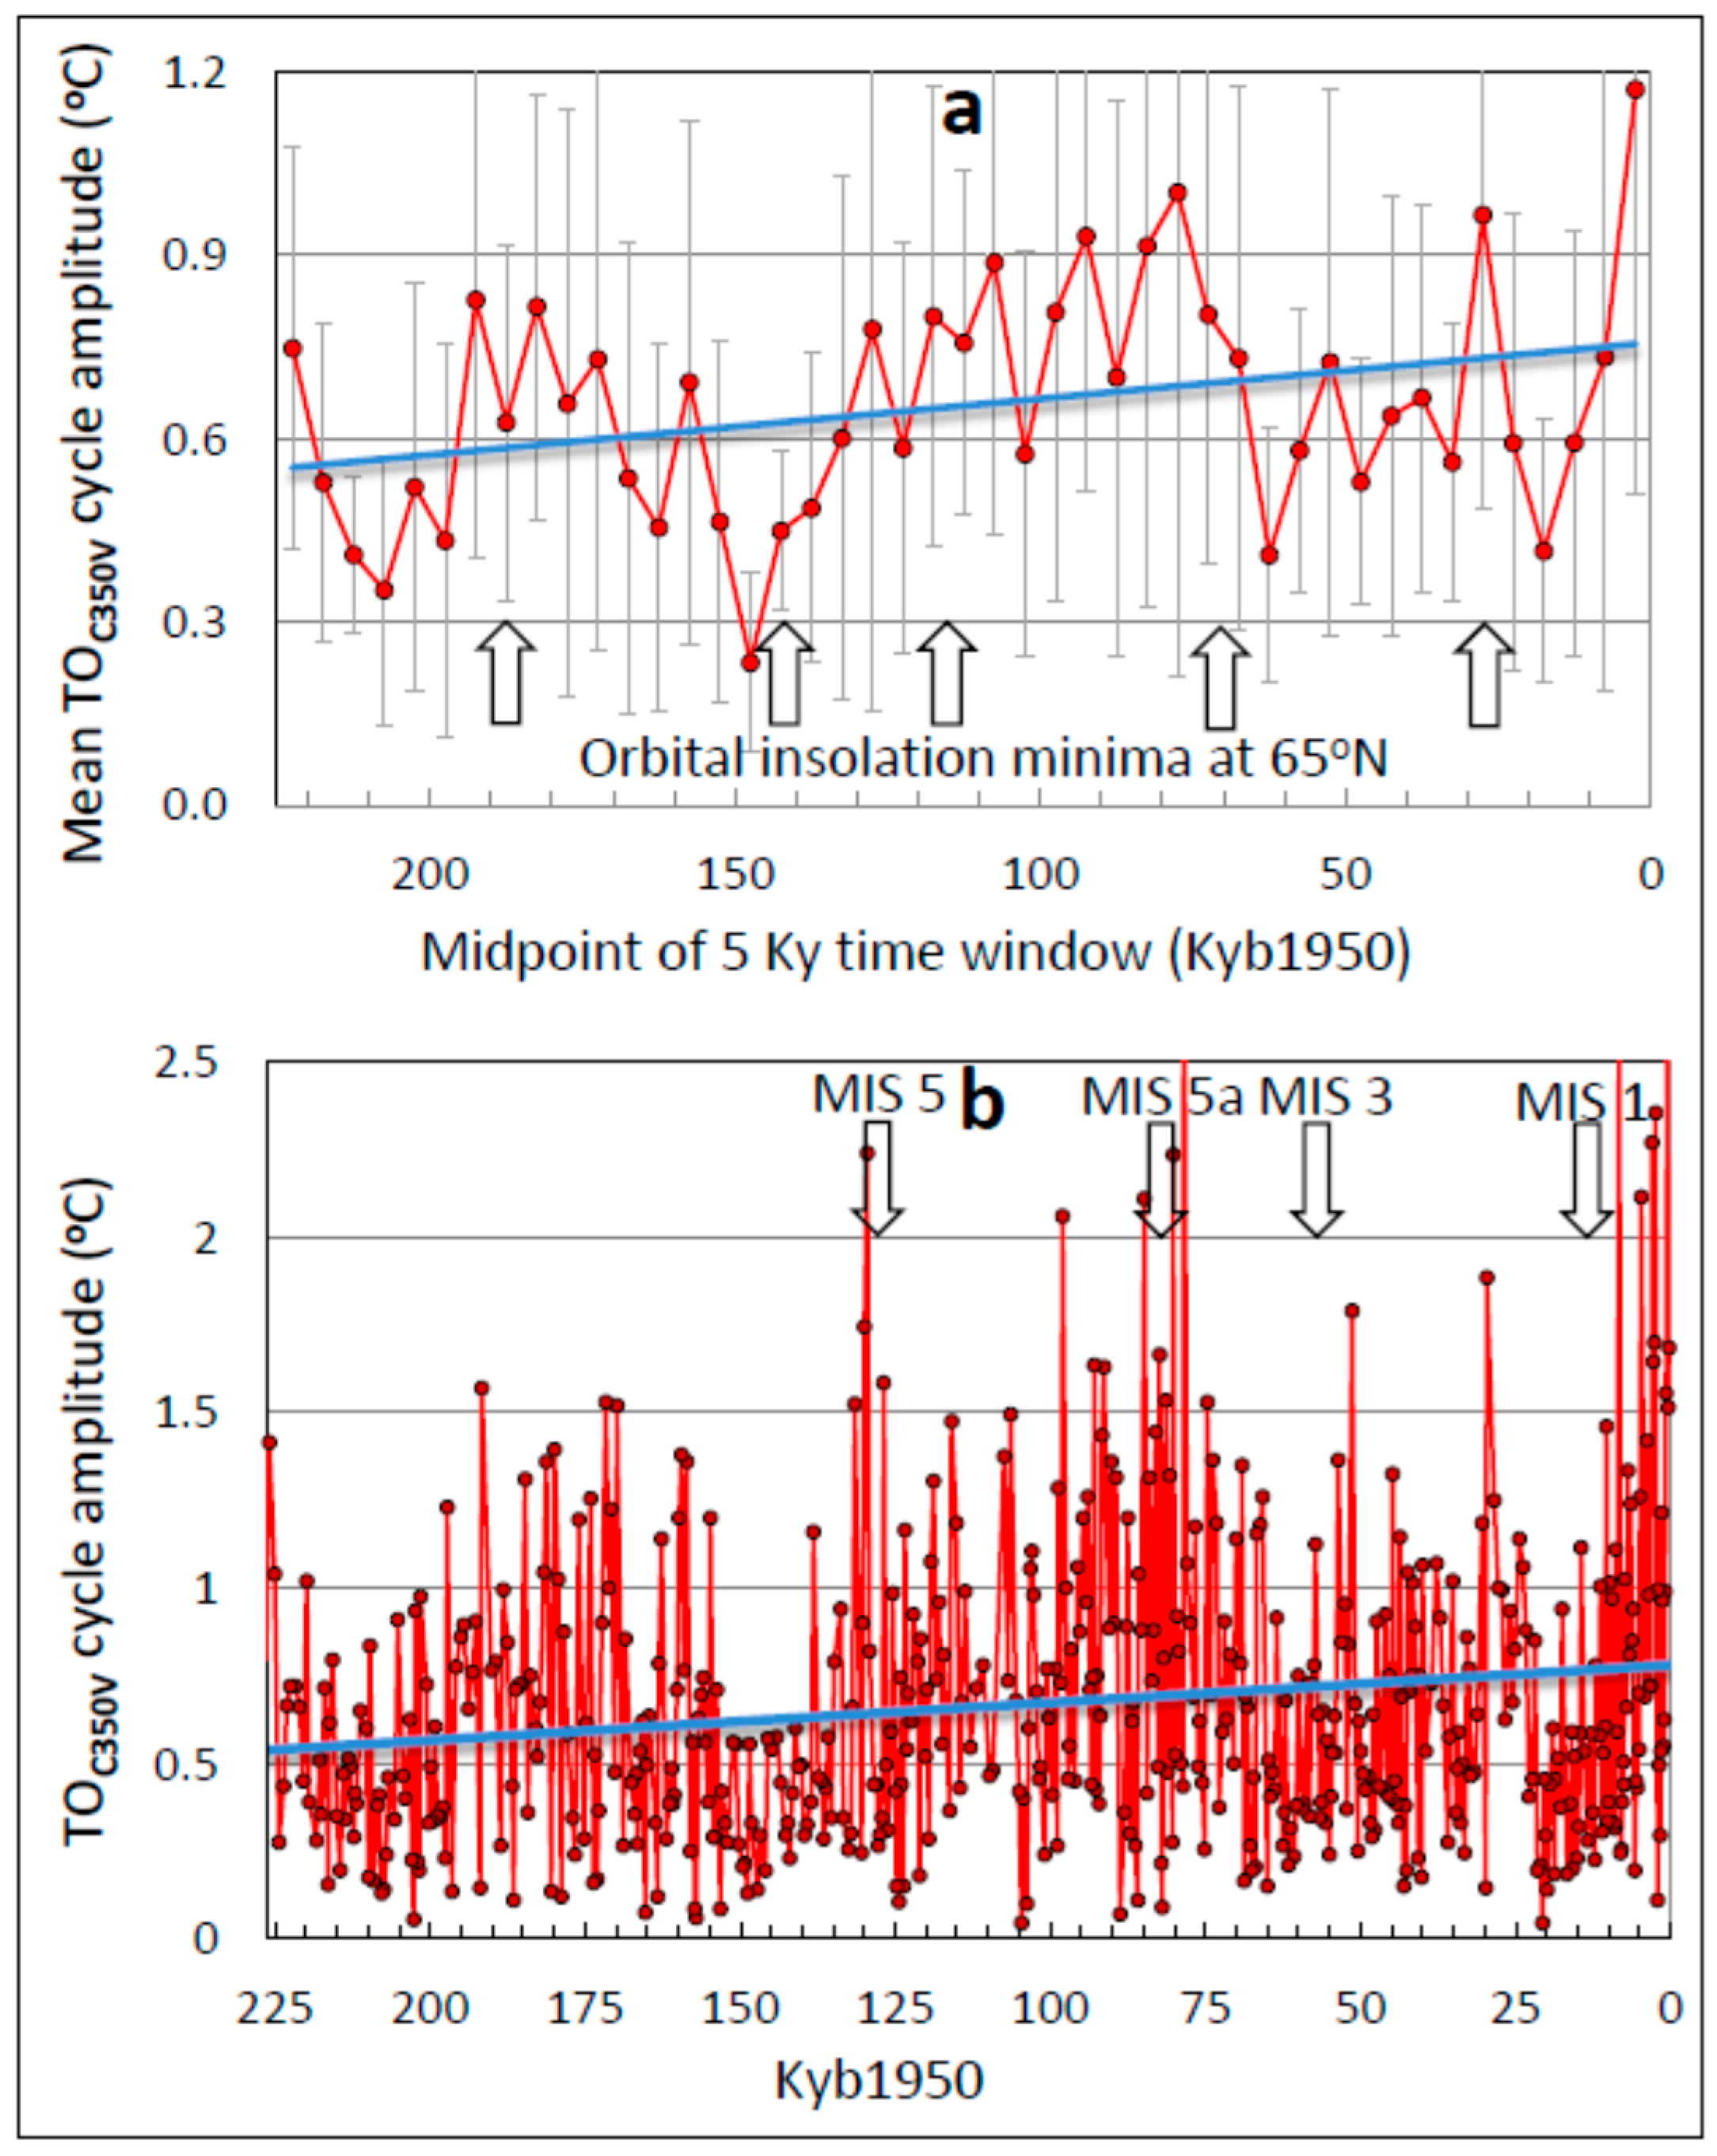
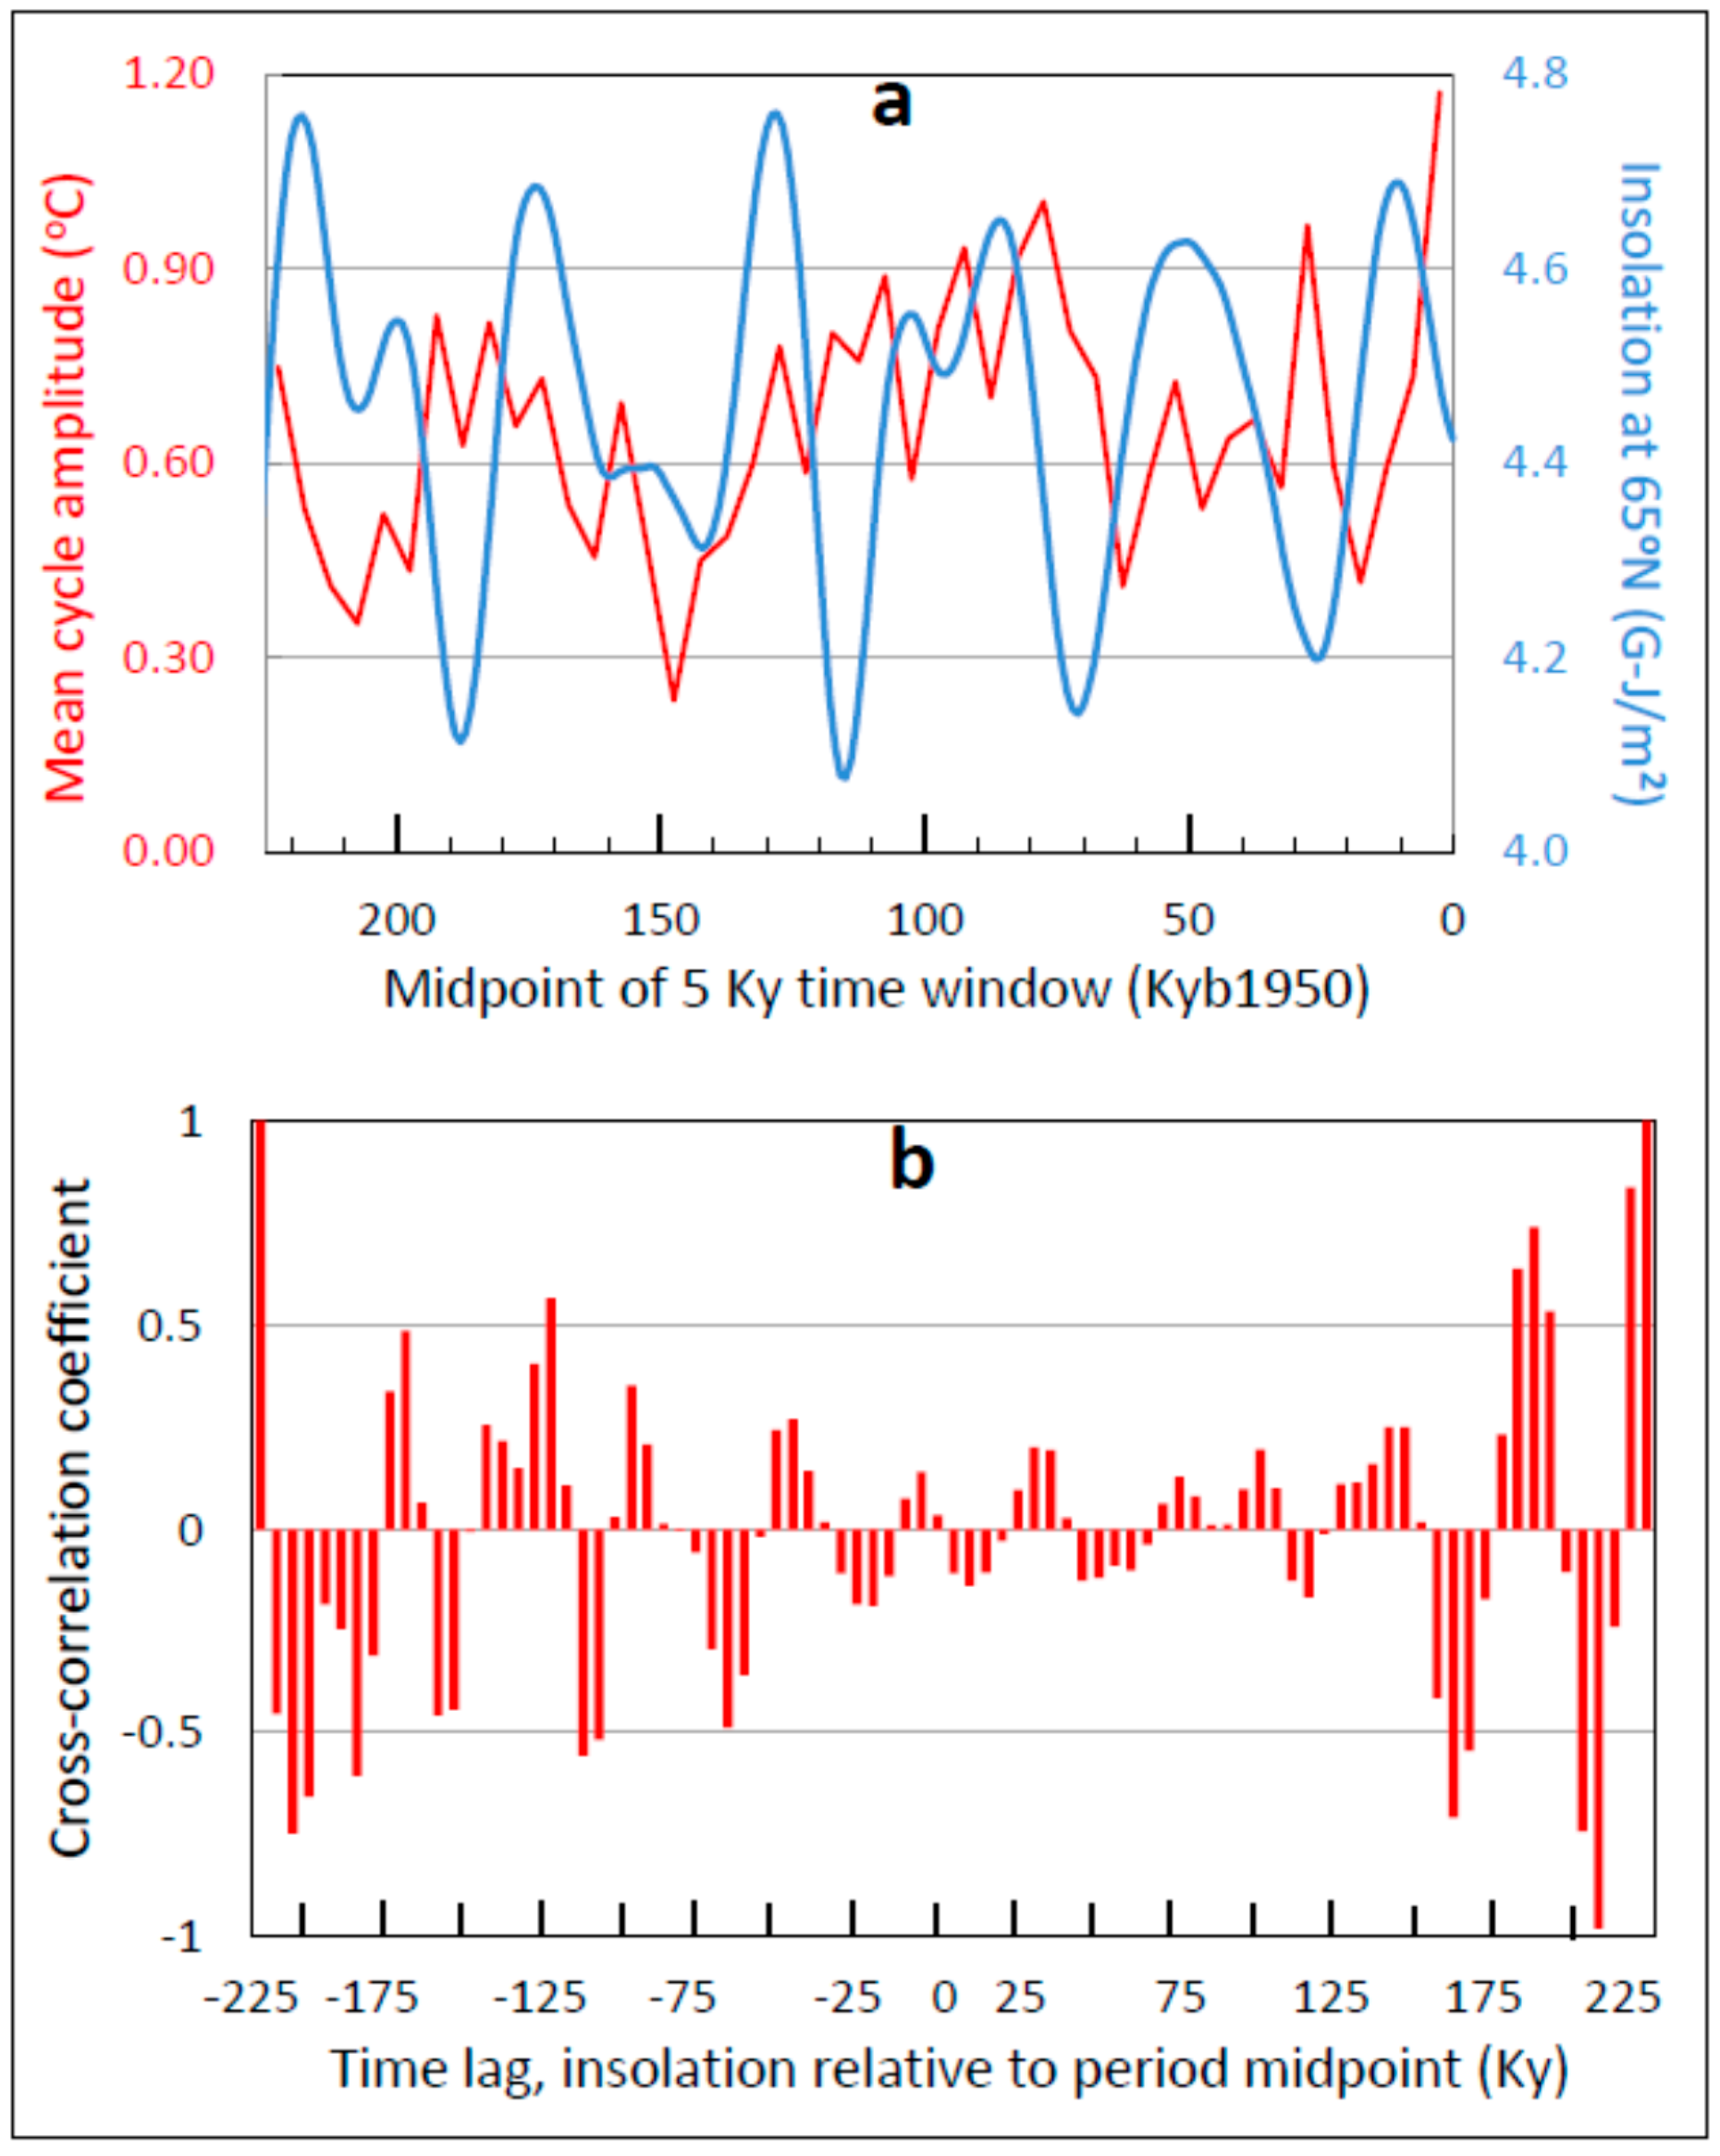
3.6. ACO Amplitude
3.7. Orbital Influences
4. Discussion and Conclusions
4.1. Geographic Distribution of ACO Cycles
4.2. Relation of the ACO to Contemporary Climate Cycles
4.3. Intensification of the Antarctic Climate
4.4. Climate Stability and the Origin of D-O Oscillations
4.5. Implications for Contemporary Global Warming
Supplementary Materials
Acknowledgments
Author Contributions
Conflicts of Interest
References
- Veizer, J.; Ala, D.; Azmy, K.; Bruckschen, P.; Buhl, D.; Bruhn, F.; Carden, G.A.F.; Diener, A.; Ebneth, S.; Godderis, Y.; et al. 87Sr/86Sr, δ13C and δ18O evolution of Phanerozoic seawater. Chem. Geol. 1999, 161, 59–88. [Google Scholar] [CrossRef]
- Prokoph, A.; Shields, G.A.; Veizer, J. Compilation and time-series analysis of a marine carbonate δ18O, δ13C, 87Sr/86Sr and δ34S database through Earth history. Earth Sci. Rev. 2008, 87, 113–133. [Google Scholar] [CrossRef]
- Davis, W.J. The relationship between atmospheric carbon dioxide concentration and global temperature for the last 425 million years. Climate 2017, 5, 76. [Google Scholar] [CrossRef]
- Zachos, J.; Pagani, M.; Sloan, L.; Thomas, E.; Billups, K. Trends, rhythms, and aberrations in global climate 65 Ma to present. Science 2001, 292, 686–693. [Google Scholar] [CrossRef] [PubMed]
- Lisiecki, L.E.; Raymo, M.E. A Pliocene-Pleistocene stack of 57 globally distributed benthic δ18O records. Paleocean 2005, 20, 1003–1020. [Google Scholar] [CrossRef]
- Huybers, P. Early Pleistocene glacial cycles and the integrated summer insolation forcing. Science 2006, 313, 508–511. [Google Scholar] [CrossRef] [PubMed]
- Huybers, P. Combined obliquity and precession pacing of late Pleistocene deglaciations. Nature 2011, 480, 229–232. [Google Scholar] [CrossRef] [PubMed]
- Raymo, M.E.; Oppo, D.W.; Curry, W. The mid-Pleistocene climate transition: A deep sea carbon isotopic perspective. Paleoceanography 1997, 12, 546–559. [Google Scholar] [CrossRef]
- Tziperman, E.; Gildor, H. On the mid-Pleistocene transition to 100-kyr glacial cycles and the asymmetry between glaciation and deglaciation times. Paleoceanography 2003, 18. [Google Scholar] [CrossRef]
- Medina-Elizalde, M.; Lea, D.W. The mid-Pleistocene transition in the tropical Pacific. Science 2005, 310, 1009–1012. [Google Scholar] [CrossRef] [PubMed]
- Clark, P.U.; Archer, D.; Pollard, D.; Blum, J.D.; Rial, J.A.; Brovkin, V.; Mix, A.C.; Pisias, N.G.; Roy, M. The middle Pleistocene transition: Characteristics, mechanisms, and implications for long-term changes in atmospheric pCO2. Quat. Sci. Rev. 2006, 25, 3150–3184. [Google Scholar] [CrossRef]
- Toggweiler, J.R. Shifting westerlies. Science 2009, 323, 1434–1435. [Google Scholar] [CrossRef] [PubMed]
- Kemp, A.E.S.; Grigorov, I.; Pearce, R.B.; Naveira Garabato, A.C. Migration of the Antarctic Polar Front through the mid-Pleistocene transition: Evidence and climatic implications. Quat. Sci. Rev. 2010, 29, 1993–2009. [Google Scholar] [CrossRef]
- Bates, S.L.; Siddall, M.; Waelbroeck, C. Hydrographic variations in ocean temperature over the mid-Pleistocene transition. Quat. Sci. Rev. 2014, 88, 147–158. [Google Scholar] [CrossRef]
- Heinrich, H. Origin and consequences of cyclic ice rafting in the northeast Atlantic Ocean during the past 130,000 years. Quat. Res. 1988, 29, 142–152. [Google Scholar] [CrossRef]
- Dansgaard, W.; Johnsen, S.J.; Clausen, H.B.; Dahl-Jensen, D.; Gundestrup, N.S.; Hammer, C.U.; Hvidberg, C.S.; Steffensen, J.P.; Svelnbjörnsdottir, A.E.; Jouzel, J.; et al. Evidence for general instability of past climate from a 250-kyr ice-core record. Nature 1993, 364, 218–220. [Google Scholar] [CrossRef]
- Bond, G.C.; Broecker, W.; Johnsen, S.; McManus, J.; Labeyrie, L.; Jouzel, J.; Bonani, G. Correlations between climate records from North Atlantic sediments and Greenland ice. Nature 1993, 365, 143–147. [Google Scholar] [CrossRef]
- Bond, G.C.; Lotti, R. Iceberg discharges into the North Atlantic on millennial time scales during the last glaciation. Science 1995, 267, 1005–1008. [Google Scholar] [CrossRef] [PubMed]
- Bond, G.; Showers, W.; Cheseby, M.; Lotti, R.; Almasi, P.; deMenocal, P.; Priore, P.; Cullen, H.; Hajdas, I.; Bonani, G. A pervasive millennial-scale cycle in North Atlantic Holocene and glacial climates. Science 1997, 278, 1257–1266. [Google Scholar] [CrossRef]
- Bond, G.C.; Showers, W.; Elliot, M.; Evans, M.N.; Lotti, R.; Hajdas, I.; Bonani, G.; Johnsen, S. The North Atlantic’s 1–2 kyr climate rhythm: Relation to Heinrich events, Dansgaard/Oeschger cycles and the little ice age. In Mechanisms of Global Climate Change at Millennial Time Scales; Clark, P.U., Webb, R.S., Keigwin, L.D., Eds.; American Geophysical Union: Washington, DC, USA, 1999; pp. 35–68. ISBN 0-87590-095-X. [Google Scholar]
- Bond, G.; Kromer, B.; Beer, J.; Muscheler, R.; Evans, M.N.; Showers, W.; Hoffman, S.; Lotti-Bond, R.; Hajdas, I.; Bonani, G. Persistent solar influence on North Atlantic climate during the Holocene. Science 2001, 294, 2130–2136. [Google Scholar] [CrossRef] [PubMed]
- Ditlevsen, P.D.; Andersen, K.K.; Svensson, A. The DO-climate events are probably noise induced: Statistical investigation of the claimed 1470 years cycle. Clim. Past 2007, 3, 129–134. [Google Scholar] [CrossRef]
- Obrochta, S.P.; Miyahara, H.; Yokoyama, Y.; Crowley, T.J. A re-examination of evidence for the North Atlantic “1500-year cycle” at Site 609. Quat. Sci. Rev. 2012, 55, 23–33. [Google Scholar] [CrossRef]
- Trenberth, K.E. Signal versus noise in the Southern Oscillation. Mon. Weather Rev. 1984, 112, 326–332. [Google Scholar] [CrossRef]
- Ropelewski, C.F.; Jones, P.D. An extension of the Tahiti-Darwin Southern Oscillation Index. Mon. Weather Rev. 1987, 115, 2161–2165. [Google Scholar] [CrossRef]
- Villalba, R.; Lara, A.; Masiokas, M.H.; Urrutia, R.; Luckman, B.H.; Marshall, G.J.; Mundo, I.A.; Christie, D.A.; Cook, E.R.; Neukom, R.; et al. Unusual Southern Hemisphere tree growth patterns induced by changes in the Southern Annular Mode. Nat. Geosci. 2012, 5, 793–798. [Google Scholar] [CrossRef]
- Abram, N.J.; Mulvaney, R.; Vimeux, F.; Phipps, S.J.; Turner, J.; England, M.H. Evolution of the Southern Annular Mode during the past millennium. Nat. Clim. Chang. 2014, 4, 564–569. [Google Scholar] [CrossRef]
- Van den Broeke, M.R.; van Lipzig, N.P.M. Changes in Antarctic temperature, wind and precipitation in response to the Antarctic Oscillation. Ann. Glaciol. 2004, 39, 119–126. [Google Scholar] [CrossRef]
- Screen, J.A.; Gillett, N.P.; Karpechko, A.Y.; Stevens, D.P. Mixed layer temperature response to the Southern Annular Mode: Mechanisms and model representation. J. Climatol. 2010, 23, 664–678. [Google Scholar] [CrossRef]
- Yuan, X.; Yonekura, E. Decadal variability in the Southern Hemisphere. J. Geophys. Res. Atmos. 2011, 116, D19115. [Google Scholar] [CrossRef]
- Ho, M.; Kiem, A.S.; Verdon-Kidd, D.C. The Southern Annular Mode: A comparison of indices. Hydrol. Earth Syst. Sci. 2012, 16, 967–982. [Google Scholar] [CrossRef]
- Ekaykin, A.A.; Kozachek, A.V.; Lipenkov, V.-Y.; Shibaev, Y.A. Multiple climate shifts in the southern hemisphere over the past three centuries based on central Antarctic snow pits and core studies. Ann. Glaciol. 2014, 55, 259–266. [Google Scholar] [CrossRef]
- Moberg, A.; Sonechkin, D.M.; Holmgren, K.; Datsenko, N.M.; Karlén, W. Highly variable Northern Hemisphere temperatures reconstructed from low- and high-resolution proxy data. Nature 2005, 433, 613–617. [Google Scholar] [CrossRef] [PubMed]
- Liu, J.; Curry, J.A.; Wang, H.; Song, H.M.; Horton, R.M. Impact of declining Arctic sea ice on winter snowfall. Proc. Natl. Acad. Sci. USA 2012, 109, 4074–4079. [Google Scholar] [CrossRef] [PubMed]
- Thompson, D.W.J.; Barnes, E. Periodic variability in the large-scale Southern Hemisphere atmospheric circulation. Science 2014, 343, 641–645. [Google Scholar] [CrossRef] [PubMed]
- Petit, J.R.; Jouzel, J.; Raynaud, D.; Barkov, N.I.; Barnola, J.M.; Basile, I.; Bender, M.; Chappellaz, J.; Davis, J.; Delaygue, G.; et al. Climate and atmospheric history of the past 420,000 years from the Vostok ice core, Antarctica. Nature 1999, 399, 429–436. [Google Scholar] [CrossRef]
- Petit, J.R.; Jouzel, J.; Raynaud, D.; Barkov, N.I.; Barnola, J.M.; Basile, I.; Bender, M.; Chappellaz, J.; Davis, J.; Delaygue, G.; et al. Vostok Ice Core Data for 420,000 Years; IGBP PAGES/World Data Center for Paleoclimatology Data Contribution Series #2001-076; NOAA/NGDC Paleoclimatology Program: Boulder, OC, USA, 2001.
- Veres, D.; Bazin, L.; Landais, A.; Kele, T.H.M.; Lemieux-Dudon, B.; Parrenin, F.; Martinerie, P.; Blayo, E.; Blunier, T.; Capron, E.; et al. The Antarctic ice core chronology (AICC2012): An optimized multi-parameter and multi-site dating approach for the last 120 thousand years. Clim. Past 2013, 9, 1733–1748. [Google Scholar] [CrossRef]
- Bazin, L.; Landais, A.; Lemieux-Dudon, B.; Kele, H.T.M.; Veres, D.; Parrenin, F.; Martinerie, P.; Ritz, C.; Capron, E.; Lipenkov, V.; et al. An optimized multi-proxy, multi-site Antarctic ice and gas orbital chronology (AICC2012): 120–800 ka. Clim. Past 2013, 9, 1715–1731. [Google Scholar] [CrossRef]
- Blunier, T.; Brook, E.J. Timing of millennial-scale climate change in Antarctica and Greenland during the last glacial period. Science 2001, 291, 109–112. [Google Scholar] [CrossRef] [PubMed]
- USGCRP. 2017: Climate Science Special Report: A Sustained Assessment Activity of the U.S. Global Change Research Program; Wuebbles, D.J., Fahey, D.W., Hibbard, K.A., Dokken, D.J., Stewart, B.C., Maycock, T.K., Eds.; U.S. Global Change Research Program: Washington, DC, USA, 2017.
- Wunsch, C. Quantitative estimate of the Milankovitch-forced contribution to observed Quaternary climate change. Quat. Sci. Rev. 2004, 23, 101–112. [Google Scholar] [CrossRef]
- Jouzel, J. Calibrating the isotopic paleothermometer. Science 1999, 286, 910–911. [Google Scholar] [CrossRef]
- Nagornov, O.V.; Konovalov, Y.V.; Tchijov, V. Temperature reconstruction for Arctic glaciers. Paleogeogr. Palaeoclimatol. Paleoecol. 2006, 236, 125–134. [Google Scholar] [CrossRef]
- Masson-Delmotte, V.; Hou, S.; Ekaykin, A.; Jouzel, J.; Aristariain, A.; Bernardo, R.T.; Bromwich, D.; Cattani, O.; Delmotte, M.; Falourd, S.; et al. A review of Antarctic surface snow isotopic composition: Observations, atmospheric circulation, and isotopic modeling. J. Clim. 2008, 21, 3359–3387. [Google Scholar] [CrossRef]
- Grossman, E.L. Applying oxygen isotope paleothermometry in deep time. Paleontol. Soc. Pap. 2012, 18, 39–68. [Google Scholar] [CrossRef]
- Lécuyer, C.; Amiot, R.; Touzeau, A.; Trotter, J. Calibration of the phosphate δ18O thermometer with carbonate-water oxygen isotope fractionation equations. Chem. Geol. 2013, 347, 217–226. [Google Scholar] [CrossRef]
- Lee, J.-E.; Fung, I.; De Paolo, J.; Otto-Bliesner, B. Water isotopes during the Last Glacial Maximum: New general circulation model calculations. J. Geophys. Res. Atmos. 2008. [Google Scholar] [CrossRef]
- EPICA Community Members. One-to-one coupling of glacial climate variability in Greenland and Antarctica. Nature 2006, 444, 195–198. [Google Scholar] [CrossRef]
- Wilkinson, L.; Dallal, G.E. Tests of significance in forward selection regression with an F-to enter stopping rule. Technometrics 1981, 23, 377–380. [Google Scholar] [CrossRef]
- Masson, V.; Vimeux, F.; Jouzel, J.; Morgan, V.; Delmotte, M.; Ciais, P.; Hammer, C.; Johnsen, C.; Lipenkov, V.Y.; Mosley-Thompson, E.; et al. Holocene climate variability in Antarctica based on 11 ice-core isotopic records. Quat. Res. 2000, 54, 348–358. [Google Scholar] [CrossRef]
- Blunier, T.; Chappellaz, J.; Schwander, J.; Dällenbach, A.; Stauffer, B.; Stocker, T.F.; Raynaud, D.; Jouzel, J.; Clausen, H.B.; Hammer, C.U.; et al. Asynchrony of Antarctic and Greenland climate change during the last glacial period. Nature 1998, 394, 739–743. [Google Scholar] [CrossRef]
- Pedro, J.B.; van Ommen, T.D.; Rasmussen, S.O.; Morgan, V.I.; Chappellaz, J.; Moy, A.D.; Masson-Delmotte, V.; Delmotte, M. The last deglaciation: Timing the bipolar seesaw. Clim. Past 2011, 7, 671–683. [Google Scholar] [CrossRef]
- Pedro, J.B.; van Ommen, T.D.; Rasmussen, S.O.; Morgan, V.I.; Chappellaz, J.; Moy, A.D.; Masson-Delmotte, V.; Delmotte, M. Antarctic Ice Core Deglacial Water Isotope Data on GICC05 Time Scale; IGBP PAGES/World Data Center for Paleoclimatology Data Contribution Series #2011-088; NOAA/NCDC Paleoclimatology Program: Boulder, CO, USA, 2011.
- Yokoyama, Y.; Lambeck, K.; De Deckker, P.; Johnston, P.; Fifield, L.K. Timing of the Last Glacial Maximum from observed sea-level minima. Nature 2000, 406, 713–716. [Google Scholar] [CrossRef] [PubMed]
- Liu, Y.; Cai, Q.F.; Song, H.M.; An, Z.S.; Hans, W.L. Amplitudes, rates, periodicities and causes of temperature variations in the past 2485 years and future trends over the central-eastern Tibetan Plateau. Chin. Sci. Bull. 2011, 56, 2986–2994. [Google Scholar] [CrossRef]
- Moffa-Sánchez, P.; Born, A.; Hall, I.R.; Thornalley, D.J.R.; Barker, S. Solar forcing of North Atlantic surface temperature and salinity over the past millennium. Nat. Geosci. 2014, 7, 275–278. [Google Scholar] [CrossRef]
- Ruddiman, W.F. The anthropogenic greenhouse era began thousands of years ago. Clim. Chang. 2003, 61, 261–293. [Google Scholar] [CrossRef]
- Miehe, G.; Miehe, S.; Böhner, J.; Kaiser, K.; Hensen, I.; Madsen, D.; Liu, J.Q.; Opgenoorth, L. How old is the human footprint in the world’s largest alpine ecosystem? A review of multiproxy records from the Tibetan Plateau from the ecologist’s viewpoint. Quat. Sci. Rev. 2014, 86, 190–209. [Google Scholar] [CrossRef]
- Jouzel, J. Ice cores north and south. Nature 1994, 372, 612–613. [Google Scholar] [CrossRef]
- Bender, M.; Sowers, T.; Dickson, M.-L.; Orchardo, J.; Grootes, P.; Mayewski, P.A.; Meese, D.A. Climate correlations between Greenland and Antarctica during the past 100,000 years. Nature 1994, 372, 663–666. [Google Scholar] [CrossRef]
- Steig, E.J.; Brook, E.J.; White, J.W.C.; Sucher, C.M.; Bender, M.L.; Lehman, S.J.; Morse, D.L.; Waddington, E.D.; Clow, G.D. Synchronous climate changes in Antarctica and the North Atlantic. Science 1998, 282, 92–95. [Google Scholar] [CrossRef] [PubMed]
- Morgan, V.; Delmotte, M.; van Ommen, T.; Jouzel, J.; Chappellaz, J.; Woon, S.; Masson-Delmotte, V.; Raynaud, D. Relative timing of deglacial climate events in Antarctica and Greenland. Science 2002, 297, 1862–1864. [Google Scholar] [CrossRef] [PubMed]
- Andres, M.S.; Bernasconi, S.I.; McKenzie, J.A.; Röhl, U. Southern Ocean deglacial record supports global Younger Dryas. Earth Planet. Sci. Lett. 2003, 216, 515–524. [Google Scholar] [CrossRef]
- Brook, E.J.; White, J.W.C.; Schilla, A.S.M.; Bender, M.L.; Barnett, B.; Severinghaus, J.P.; Taylor, K.C.; Alley, R.B.; Steig, E.J. Timing of millennial-scale climate change at Siple Dome, West Antarctica, during the last glacial period. Quat. Sci. Rev. 2005, 24, 1333–1343. [Google Scholar] [CrossRef]
- Jouzel, J.; Masson-Delmotte, V.; Cattani, O.; Dreyfus, G.; Falourd, S.; Hoffmann, G.; Minster, B.; Nouet, J.; Barnola, J.M.; Chappellaz, J.; et al. Orbital and millennial Antarctic climate variability over the past 800,000 years. Science 2007, 317, 793–797. [Google Scholar] [CrossRef] [PubMed]
- Stenni, B.; Buiron, D.; Frezzotti, M.; Albani, S.; Barbante, C.; Bard, E.; Barnola, J.M.; Baroni, M.; Baumgartner, M.; Bonazza, M.; et al. Expression of the bipolar see-saw in Antarctic climate records during the last deglaciation. Nat. Geosci. 2011, 4, 46–49. [Google Scholar] [CrossRef]
- Rial, J.A. Synchronization of polar climate variability over the last ice age: In search of simple rules at the heart of climate’s complexity. Am. J. Sci. 2012, 312, 417–448. [Google Scholar] [CrossRef]
- Tachikawa, K.; Timmermann, A.; Vidal, L.; Sonzogni, C.; Timm, O.E. CO2 radiative forcing and Intertropical Convergence Zone influences on western Pacific warm pool climate over the past 400 ka. Quat. Sci. Rev. 2014, 86, 24–34. [Google Scholar] [CrossRef]
- Landais, A.; Masson-Delmotte, V.; Stenni, B.; Selmo, E.; Roche, D.M.; Jouzel, J.; Lambert, F.; Guillevic, M.; Bazin, L.; Arzel, O.; et al. A review of the bipolar see-saw from synchronized and high-resolution ice core water stable isotope records from Greenland and East Antarctica. Quat. Sci. Rev. 2015, 114, 18–32. [Google Scholar] [CrossRef]
- WAIS Divide Project Members. Precise interpolar phasing of abrupt climate change during the last ice age. Nature 2015, 520, 661–665. [Google Scholar] [CrossRef]
- Turney, C.S.M.; Jones, R.T.; Fogwill, C.J.; Hatton, J.; Williams, A.N.; Hogg, A.G.; Thomas, Z.A.; Palmer, J.; Mooney, S.; Reimer, R.W. A 250-year periodicity in Southern Hemisphere westerly winds over the last 2600 years. Clim. Past 2016, 12, 189–200. [Google Scholar] [CrossRef]
- Dennell, R.W.; Martinón-Torres, M.; Bermúdez de Castro, J.M. Hominin variability, climate instability and population demography in middle Pleistocene Europe. Quat. Sci. Rev. 2011, 30, 1511–1524. [Google Scholar] [CrossRef]
- Billups, K.; Scheinwald, A. Origin of millennial-scale climate signals in the subtropical North Atlantic. Paleoceanography 2014, 29, 612–627. [Google Scholar] [CrossRef]
- Andersen, C.; Koç, N.; Moros, M. A highly unstable Holocene climate in the subpolar North Atlantic: Evidence from diatoms. Quat. Sci. Rev. 2004, 23, 2155–2166. [Google Scholar] [CrossRef]
- Khider, D.; Jackson, C.S.; Stott, L.D. Assessing millennial-scale variability during the Holocene: A perspective from the western tropical Pacific. Paleoceanography 2014, 29, 143–159. [Google Scholar] [CrossRef]
- Alley, R.B.; Marotzke, J.; Nordhaus, W.; Overpeck, J.; Peteet, D.; Pielke, R., Jr.; Pierrehumbert, R.; Rhines, P.; Stocker, T.; Talley, L.; et al. Abrupt Climate Change: Inevitable Surprises; National Research Council: Washington, DC, USA, 2002; 230p, ISBN 0-309-07434-7. [Google Scholar]
- Jones, J.M. Climate science: Tree rings and storm tracks. Nat. Geosci. 2012, 5, 764–765. [Google Scholar] [CrossRef]
- Jones, J.M.; Gille, S.T.; Goosse, H.; Abram, N.J.; Canziana, P.O.; Charman, D.J.; Clem, K.R.; Crosta, X.; Lavergne, C.D.; Eisenman, I.; et al. Assessing recent trends in high-latitude Southern Hemisphere surface climate. Nat. Clim. Chang. 2016, 6, 917–926. [Google Scholar] [CrossRef]
- Fyfe, J.C.; Gillett, N.P.; Zwiers, F.W. Overestimated global warming over the past 20 years. Nat. Clim. Chang. 2013, 3, 767–769. [Google Scholar] [CrossRef]
- Tollefson, J. The case of the missing heat. Nature 2014, 505, 276–278. [Google Scholar] [CrossRef] [PubMed]
- Trenberth, K.E.; Fasullo, J.T. An apparent hiatus in global warming? Earth’s Future 2013, 1, 19–32. [Google Scholar] [CrossRef]
- Bambach, R.K. Phanerozoic biodiversity mass extinctions. Ann. Rev. Earth Planet. Sci. 2006, 34, 127–155. [Google Scholar] [CrossRef]
- Doney, S.C.; Fabry, V.J.; Feely, R.A.; Kleypas, J.A. Ocean acidification: The other CO2 problem. Ann. Rev. Mar. Sci. 2009, 1, 169–192. [Google Scholar] [CrossRef] [PubMed]
- Weinbauer, M.G.; Mari, X.; Gattuso, J.-P. Effects of ocean acidification on the diversity and activity of heterotrophic marine microorganisms. In Ocean Acidification; Gattuso, J.-P., Hansson, L., Eds.; Oxford University Press: New York, NY, USA, 2012; pp. 83–98. ISBN 978-0-19-959108-4. [Google Scholar]


| Statistic | Period (Years) | Amplitude (°C) | Warming Duration (Years) | Cooling Duration (Years) | Warming Amplitude (°C) | Cooling Amplitude (°C) | Warming Rate (°C/Century) | Cooling Rate (°C/Century) |
|---|---|---|---|---|---|---|---|---|
| Mean | 352 | 0.67 | 184 | 189 | 0.66 | 0.68 | 0.43 | 0.44 |
| Min | 63 | 0.05 | 19 | 28 | 0.01 | 0.01 | 0.01 | 0.01 |
| Max | 1174 | 3.22 | 713 | 861 | 3.09 | 3.46 | 5.00 | 4.52 |
| σ | 175 | 0.44 | 109 | 114 | 0.53 | 0.52 | 0.46 | 0.45 |
| CV | 0.50 | 0.66 | 0.59 | 0.60 | 0.79 | 0.77 | 1.07 | 1.03 |
| SS (n) | 646 | 546 | 546 | 546 | 546 | 546 | 546 | 546 |
© 2018 by the authors. Licensee MDPI, Basel, Switzerland. This article is an open access article distributed under the terms and conditions of the Creative Commons Attribution (CC BY) license (http://creativecommons.org/licenses/by/4.0/).
Share and Cite
Davis, W.J.; Taylor, P.J.; Davis, W.B. The Antarctic Centennial Oscillation: A Natural Paleoclimate Cycle in the Southern Hemisphere That Influences Global Temperature. Climate 2018, 6, 3. https://doi.org/10.3390/cli6010003
Davis WJ, Taylor PJ, Davis WB. The Antarctic Centennial Oscillation: A Natural Paleoclimate Cycle in the Southern Hemisphere That Influences Global Temperature. Climate. 2018; 6(1):3. https://doi.org/10.3390/cli6010003
Chicago/Turabian StyleDavis, W. Jackson, Peter J. Taylor, and W. Barton Davis. 2018. "The Antarctic Centennial Oscillation: A Natural Paleoclimate Cycle in the Southern Hemisphere That Influences Global Temperature" Climate 6, no. 1: 3. https://doi.org/10.3390/cli6010003
APA StyleDavis, W. J., Taylor, P. J., & Davis, W. B. (2018). The Antarctic Centennial Oscillation: A Natural Paleoclimate Cycle in the Southern Hemisphere That Influences Global Temperature. Climate, 6(1), 3. https://doi.org/10.3390/cli6010003