Article

Watershed Response to Climate Change and Fire-Burns in the Upper Umatilla River Basin, USA

1
Department of Environmental Science and Management, Portland State University, Portland, OR 97207, USA
2
Department of Geography, Portland State University, Portland, OR 97207, USA
*
Author to whom correspondence should be addressed.
Climate 2017, 5(1), 7; https://doi.org/10.3390/cli5010007
Submission received: 18 October 2016 / Revised: 27 January 2017 / Accepted: 6 February 2017 / Published: 16 February 2017
(This article belongs to the Special Issue Impact of Climate Change on Water Resources)

Abstract

:
This study analyzed watershed response to climate change and forest fire impacts in the upper Umatilla River Basin (URB), Oregon, using the precipitation runoff modeling system. Ten global climate models using Coupled Intercomparison Project Phase 5 experiments with Representative Concentration Pathways (RCP) 4.5 and 8.5 were used to simulate the effects of climate and fire-burns on runoff behavior throughout the 21st century. We observed the center timing (CT) of flow, seasonal flows, snow water equivalent (SWE) and basin recharge. In the upper URB, hydrologic regime shifts from a snow-rain-dominated to rain-dominated basin. Ensemble mean CT occurs 27 days earlier in RCP 4.5 and 33 days earlier in RCP 8.5, in comparison to historic conditions (1980s) by the end of the 21st century. After forest cover reduction in the 2080s, CT occurs 35 days earlier in RCP 4.5 and 29 days earlier in RCP 8.5. The difference in mean CT after fire-burns may be due to projected changes in the individual climate model. Winter flow is projected to decline after forest cover reduction in the 2080s by 85% and 72% in RCP 4.5 and RCP 8.5, in comparison to 98% change in ensemble mean winter flows in the 2080s before forest cover reduction. The ratio of ensemble mean snow water equivalent to precipitation substantially decreases by 81% and 91% in the 2050s and 2080s before forest cover reduction and a decrease of 90% in RCP 4.5 and 99% in RCP 8.5 in the 2080s after fire-burns. Mean basin recharge is 10% and 14% lower in the 2080s before fire-burns and after fire-burns, and it decreases by 13% in RCP 4.5 and decreases 22% in RCP 8.5 in the 2080s in comparison to historical conditions. Mixed results for recharge after forest cover reduction suggest that an increase may be due to the size of burned areas, decreased canopy interception and less evaporation occurring at the watershed surface, increasing the potential for infiltration. The effects of fire on the watershed system are strongly indicated by a significant increase in winter seasonal flows and a slight reduction in summer flows. Findings from this study may improve adaptive management of water resources, flood control and the effects of fire on a watershed system.

1. Introduction

Anthropogenic influences on climate coupled with natural variability in climate have shifted the spatial and temporal distribution of water resources worldwide [1,2]. Quantifying recharge and streamflow response to climate change is an essential step to developing long-term water resource management plans to increase the understanding of the global energy balance in a hydrologic regime to improve adaptive capacity [3,4]. Identifying changes in basin runoff is important due to the strong effects on water and energy demands [5], which also have important societal and ecological implications.
A marked shift in global mean surface temperature in the 20th century has been widely cited as an indicator of climate change and its direct relationship to changes in the global energy budget [6,7]. In the Pacific Northwest, climate change impacts include shifts in the magnitude and timing of runoff [8,9,10,11], reduced proportion of precipitation falling as snow in montane regions [12,13], decreases in snow water equivalent [14,15] and an increase in the frequency and intensity of floods and droughts [11,16,17].
This paper explores the watershed response to climate change in the upper Umatilla River Basin (URB) where runoff behavior is observed before and after fire-burns in the 21st century. Seasonal flows, the ratio of snow water equivalent to precipitation and potential recharge were quantified. Three research questions guided this analysis. (1) How does the hydrologic regime change seasonally and annually in response to climate change in the 21st century in comparison to historical conditions? (2) What are the effects of land cover change after fire-burns on basin runoff? (3) Which water budget components (e.g., seasonal runoff, snow water equivalent) are sensitive to a change in climate and could potentially be considered in water resource management for climate adaptation planning?
While there is extensive research on the Columbia River Basin [18,19,20,21,22], the upper URB is largely understudied. Burns et al. [23] indicated that water levels have declined 3048–9144 cm since 1970 in some of the deeper Columbia River Basalt Group (CRBG) aquifers where the physical characteristics of basalt, depositional environment, folding and faulting impede groundwater flow. Previous studies estimated recharge in the region prior to predevelopment to be 6.90 cm/year and an increase to 10.80 cm/year in the 1980s due to irrigation [24].
Additionally, the effects of wildfire on runoff in the basin have not been thoroughly studied. The effects of wildfire can decrease canopy interception, thus increasing runoff and changing the chemical and physical properties of soil [25,26]. The infiltration rate after a wildfire has been observed to decrease two to seven-fold [25,27,28], with erosion from overland flow [29], an increase in percent area burned and more open landscape [30]. These are reasons for concern for forest resource managers who investigate the effects on the carbon cycle and forest productivity. Changes in peak discharges are more apparent than changes in annual runoff [25], where in some places, peak runoff increases by two orders of magnitude [31,32]. In the Western Northwest, vegetation shifts are projected from conifer to mixed forests by way of increased wildfire occurrence [33].
Surface and groundwater interactions and the effects of climate change on the hydrologic regime in the upper Umatilla River Basin (URB) are largely understudied. The lower URB has four Oregon Water Resources Department Groundwater Restricted Areas as a result of well withdrawals and a heavy dependence on groundwater for agricultural and municipal needs [34]. In the 1920s, the Umatilla Reclamation Project blocked the return of anadromous fish, resulting in a steep decline of salmon return. In 1988, the Umatilla Basin Project Act resulted in a bucket-for-bucket exchange of Umatilla River water for Columbia River water, which improved flows to restore salmonid and steelhead populations [35]. The cultural value of water cannot be understated, making it more important to protect natural resources vital to the Confederated Tribes of the Umatilla Indian Reservation (CTUIR) in the URB. CTUIR implemented the protection of first foods into natural resource management as a form of self-determination for environmental equity and tribal resilience, including water, salmon, deer, cous and huckleberry [36,37]. First foods are the “minimum ecological products necessary to sustain CTUIR culture” [37]. This study thus contributes to the protection of cultural and ecosystem services by providing runoff changes throughout the 21st century for climate adaptation planning.

2. Materials and Methods
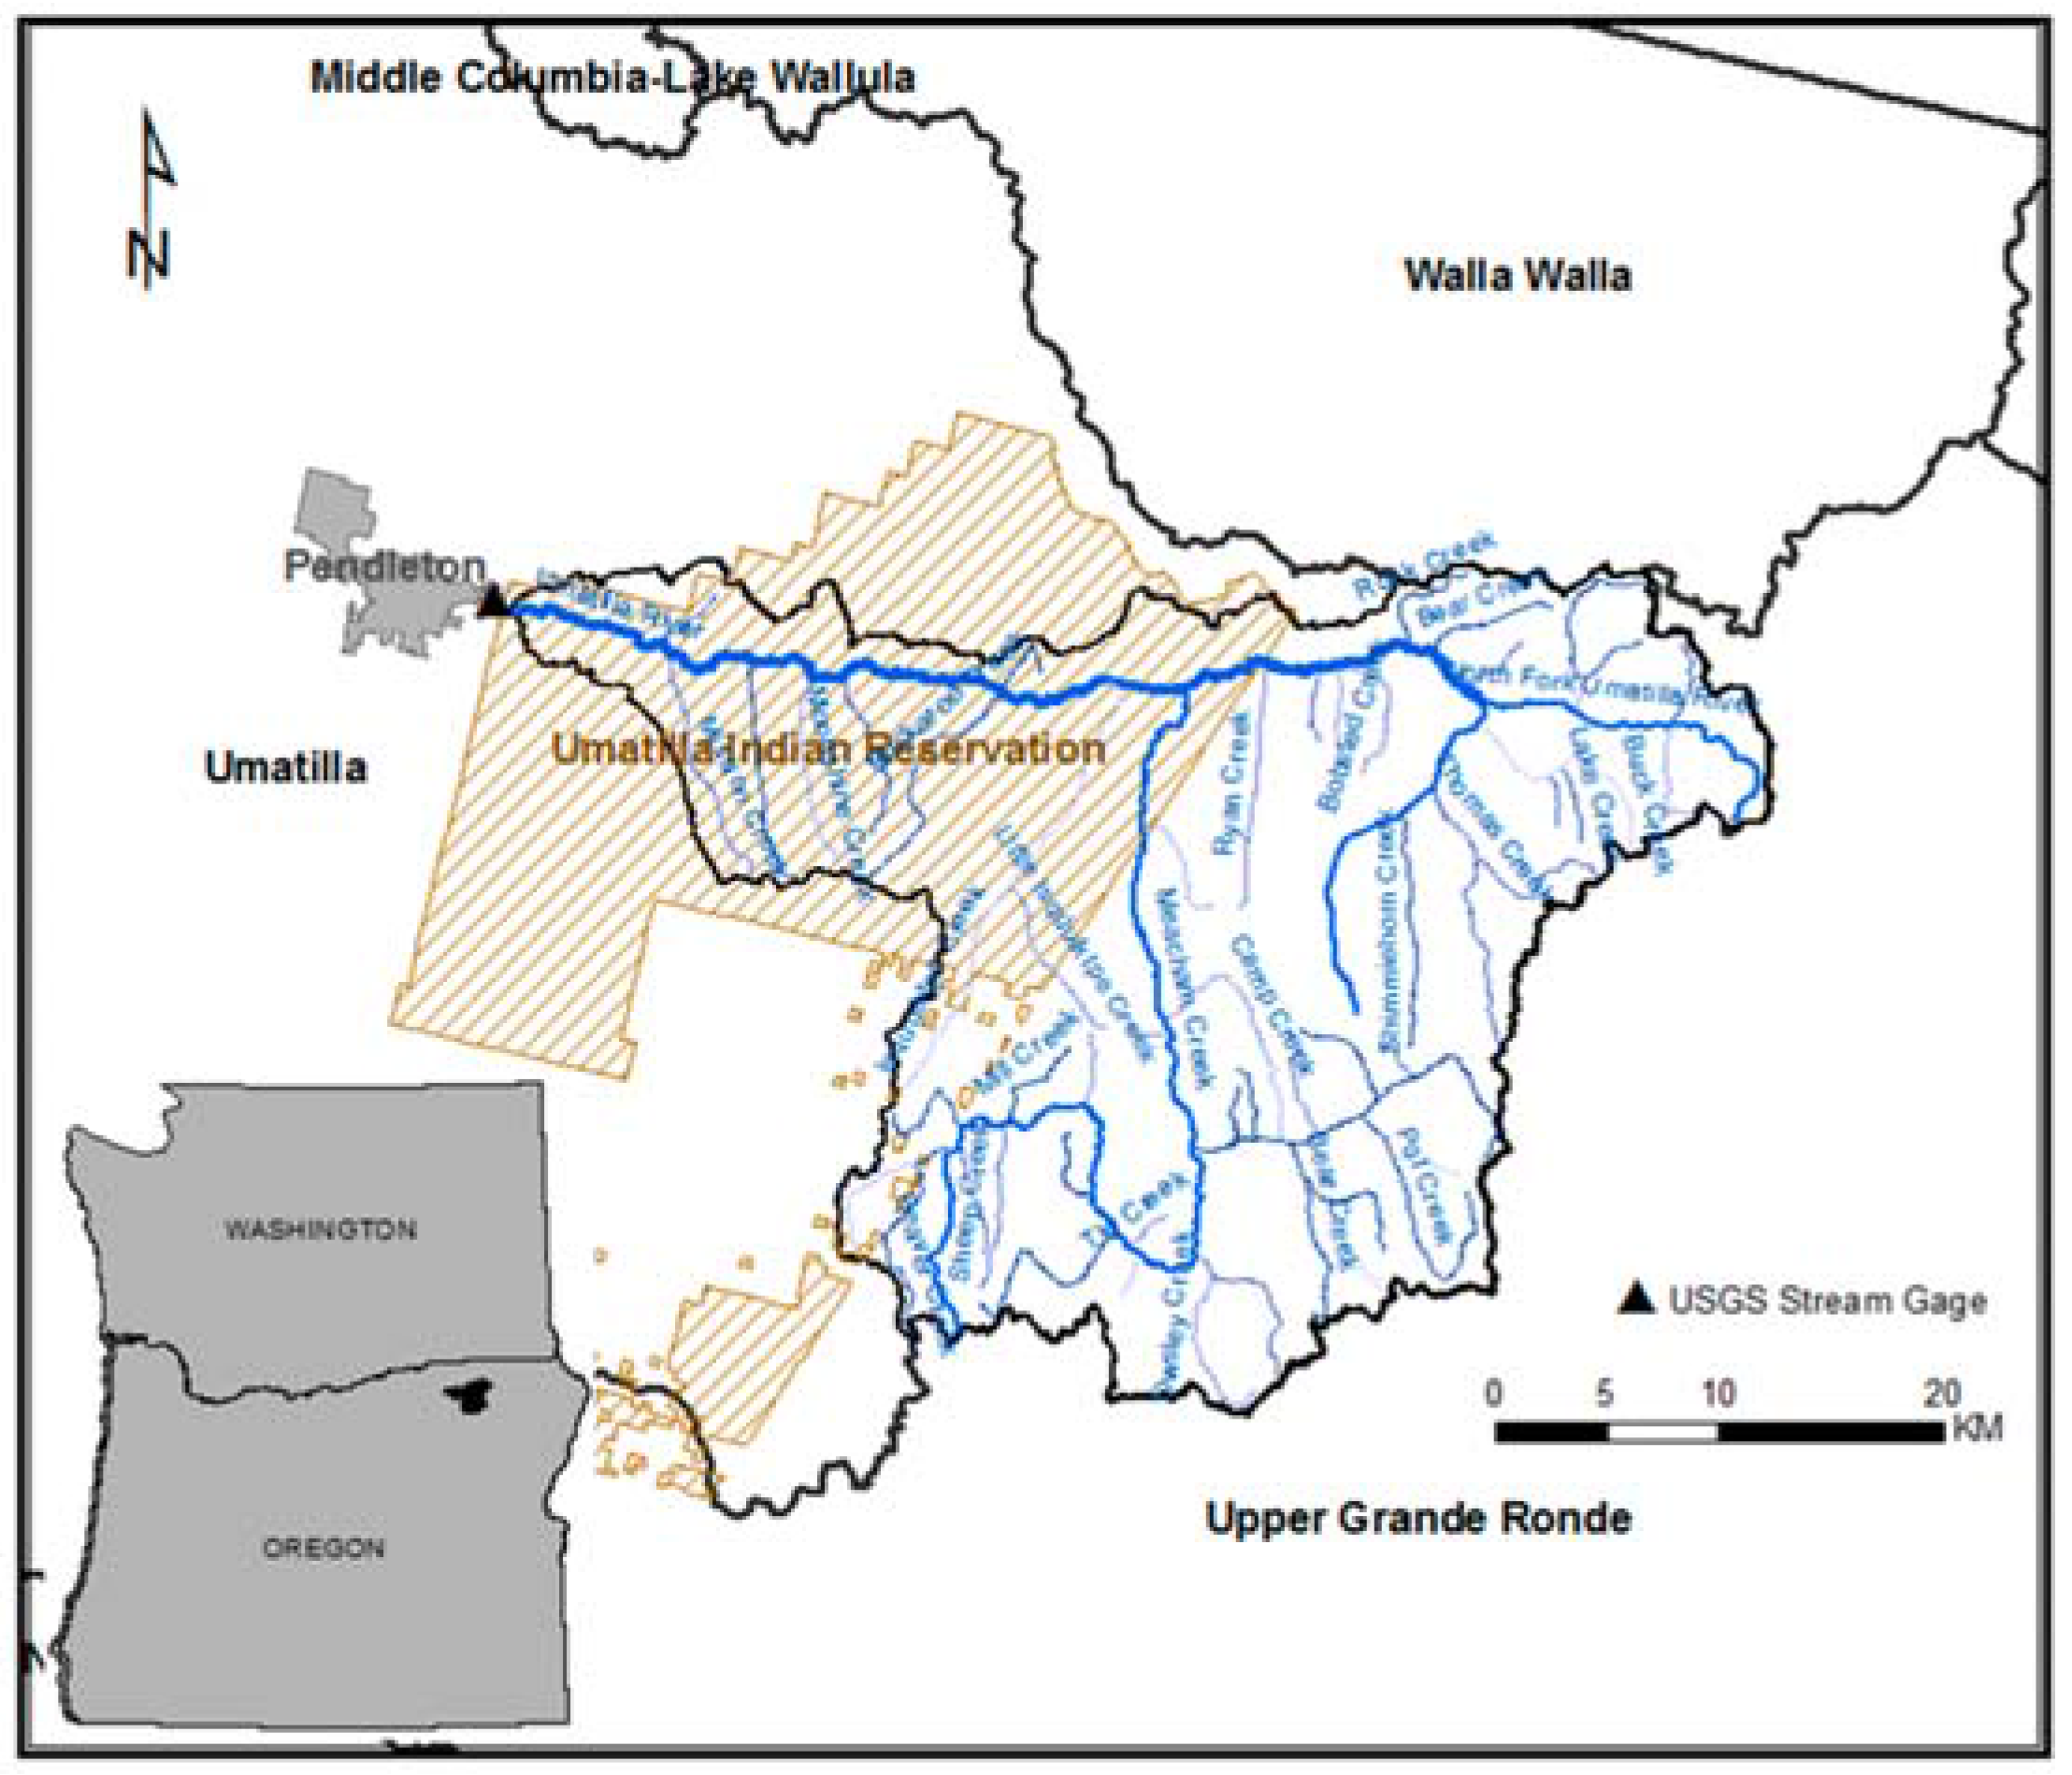
2.1. Study Area

The study site is 2365 km2 in the upper URB in northeastern Oregon on the Columbia Plateau (Figure 1). A significant portion of the Umatilla Indian Reservation, 647 km2, is within the study site boundaries. The Umatilla River is a 145-km reach that enters into the Columbia River, originating in the Blue Mountains with a gravel-bed channel system and a multi-channel pattern [38]. It is largely groundwater fed; approximately 70%–80% of annual flows are provided in the summer months [39]. The upper basin is approximately 14% in drainage area, but supplies 40%–50% of the average flow to the Umatilla River [40,41]. The URB is mostly semiarid, located east of the Cascades in the rain shadow. It receives 12.7 cm–127 cm in annual precipitation and ranges in elevation from 82 m–1676 m [36]. The study site is 55.1% coniferous tree cover, 0.1% deciduous and mixed tree cover, 21.7% shrub cover, 21.8% grass and 1.3% bare soil [42].

2.2. Hydrologic Model: Precipitation Runoff Modeling System

The Precipitation Runoff Modeling System (PRMS) (Ver. 3.0.5) is a deterministic, distributed-parameter, physically-based process hydrologic model that estimates water-balance relations, stream flow regimes and soil-water relations [43]. Precipitation, minimum and maximum temperature and solar radiation are the primary inputs into PRMS to compute a water balance and energy balance for individual hydrologic response units (HRUs) with distributed parameters [43]. It has been used extensively in assessing changes in runoff resulting from climate change [8].

2.3. Climate Data

We obtained daily time series of precipitation, minimum and maximum temperature from the University of Idaho Gridded Surface Meteorological data (METDATA) for climate forcings at 4-km (1/24-degree) resolution for model calibration (1995–2010) [44]. Solar radiation data were not obtained, in which case PRMS internally estimates daily shortwave solar radiation [43]. High resolution gridded METDATA were derived from observations and regional reanalysis using a hybrid method, combining spatially-rich data from the Parameter-elevation Regressions on Independent Slopes Model (PRISM) and temporally rich data from the North America Land Data Assimilation System Phase 2 (NLDAS-2) [44,45,46].
Downscaled simulated historical and future climate data with a resolution of 4 km (1/24-degree) were obtained for the 1980s (1970–1999), 2020s (2010–2039), 2050s (2040–2069) and 2080s (2070–2099). They were derived using the multivariate adaptive constructed analogs statistical downscaling method (MACA), a non-interpolated-based approach [47]. Data from the Coupled Model Inter-Comparison Project 5 (CMIP5), Representative Concentration Pathways 4.5 and 8.5 (RCP 4.5 and RCP 8.5) were used in this analysis [48]. RCP4.5 is a medium stabilization scenario where an additional 4.5 W/m2 of radiative forcing energy is trapped in the atmosphere by year 2100 [48]. RCP8.5 has a very high baseline emission scenario at the 90th percentile, where an additional 8.5 W/m2 is trapped by 2100, with no climate action anticipated [49]. Downscaled CMIP5 climate data were obtained from the University of Idaho for each of ten Global Climate Models used in this study and uploaded to the USGS’s Geo Data Portal [50] with a shapefile of the study site, for which the portal provided specific climate data for each individual HRU on a weighted scale.

2.4. Global Climate Models

In a multi-model ensemble approach, ten global climate models (GCMs) were chosen based on model performance in the Pacific Northwest (Table A1), including a low normalized error score [51] and data availability for each GCM. Analysis of model performance for each GCM revealed minor differences in precipitation projections; differences are minimal (<0.02 cm), with greater differences in temperature (<2.64 °C), but not large enough to exclude any GCMs. Further, bias corrections were not made, as studies have found little to no difference in selecting or weighting GCM output [52], and our main purpose was to investigate relative changes of runoff in the future from the historical period.

2.5. Indicators for Detecting Climate Change Impact

We used four climate change impact detection indices to analyze runoff behavior before fire-burns in the 2020s, 2050s and 2080s and the effects of fire-burns in the 2080s in RCP 4.5 and RCP 8.5. The indices are: (1) ensemble mean change in annual and seasonal runoff; (2) center timing of streamflow (CT); (3) the ratio of 1 April snow water equivalent to October–March precipitation (snow water equivalent (SWE)/P); and (4) potential recharge to analyze ground and surface water interactions. These indices were compared between the means of historical and future time periods and deemed statistically significant at the 5% significance level. To compare differences in the aforementioned indices between different periods, we used one-way analysis of variance (ANOVA) and the Kruskal–Wallis test (for small samples). Detection of an overall significant difference required multiple comparisons with Tukey’s honest significance test and Kruskal–Wallis’ multiple comparisons test.

2.6. Generation of Hydrologic Response Units

HRUs were discretized using watershed boundaries, soils and land cover to derive 107 HRUs (Table A2). A daily water and energy balance is computed for each HRU, and the sum of the responses of all HRUs is weighted on a unit-area basis [43]. HRUs smaller than 4%–5% were avoided for daily-flow computations for basin-wide estimates [53].

2.7. Post-fire Analysis

We modified PRMS model parameters to exemplify post-fire conditions (Table 1). Our method is similar to Konrad [54], who adjusted model parameters pertaining to seasonal vegetation cover, shortwave radiation transmitted through the canopy, upper soil storage capacity and total soil storage capacity. We projected burned areas in the 2080s based on the fire history in the URB obtained from the U.S. Forest Service at Umatilla National Forest [55]. The maximum spatial extent of fires that occurred in history (representing the 1980s) was used for representing post-fire conditions for both the 1980s and the 2080s. Accordingly, the parameters in Table 1 for those HRUs with fire occurrences in the 1980s were changed in the 2080s in both the RCP 4.5 and RCP 8.5 scenarios. The newest version of the Model for Interdisciplinary Research on Climate (MIROC5), an intermediate warm model, was chosen to simulate runoff in RCP 4.5, and the Hadley Global Environment Model 2- Earth System (HadGEM2-ES), a warmer model with acute summer drying, was run in RCP 8.5. These two GCMs were used in a previous study by Turner et al. [30].

2.8. Calibration and Verification

Automated and manual calibration was completed with observed (1995–2010) streamflow (Table A3). We used Let Us Calibrate (LUCA, V. 2.0.0), a multiple-objective, stepwise, automated procedure [56], to calibrate water balance, daily flow timing of all flows and of high and low flows. Manual calibration was required to improve manual calibration of simulated peak runoff to observed conditions. Consumptive use is very small to the total volume of streamflow and was determined as negligible and not added to the hydrograph to obtain normal streamflow conditions. Four years of additional data (2010–2014, 26% of the data used for calibration) were used for model verification.

2.9. Model Evaluation

Four statistical analyses were used to analyze model performance (Table 2). The Nash–Sutcliffe efficiency (NSE) indicates accuracy, one being a perfect fit, and a negative coefficient would indicate that the mean value of observed data would be a better predictor than the model [57]. The percent bias (PBIAS) determines under- or over-prediction of simulated data in comparison to observed data with an optimal value of 0; a negative value would indicate underestimation [58]. Kling–Gupta efficiency (KGE) is an alternative to NSE, where 1 is an optimal fit. Different components of the model area are evaluated, such as correlation, bias and variability [59]. Root mean square error (RMSE) is first calculated to indicate the differences, the residuals between simulated and observed values. Normalized RMSE (NRMSE) was also calculated where the lower the value, the lower the variance.
N S E = 1   i = 1 n ( y i o b s y i s i m ) 2 i = 1 n ( y i o b s y i m e a n ) 2
y i o b s = the i-th observed flow; y i s i m = the i-th simulated flow value; y m e a n = mean of observed flow data.
P B I A S = i = 1 n ( y i o b s y i s i m ) * 100 i = 1 n ( y i o b s )
K G E = 1 ( r 1 ) 2 + ( α 1 ) 2 + ( β 1 ) 2 r = linear correlation coefficient; α = relative variability in the simulated and observed values; β = ratio of the means of the simulated and observed values.
R M S E = i = 1 n ( y i o b s y i s i m ) 2 n
N R M S E = R M S E Y o b s , m a x Y o b s , m i n
Y o b s , m a x = observed maximum flow; Y o b s , m i n = observed minimum flow.

3. Results

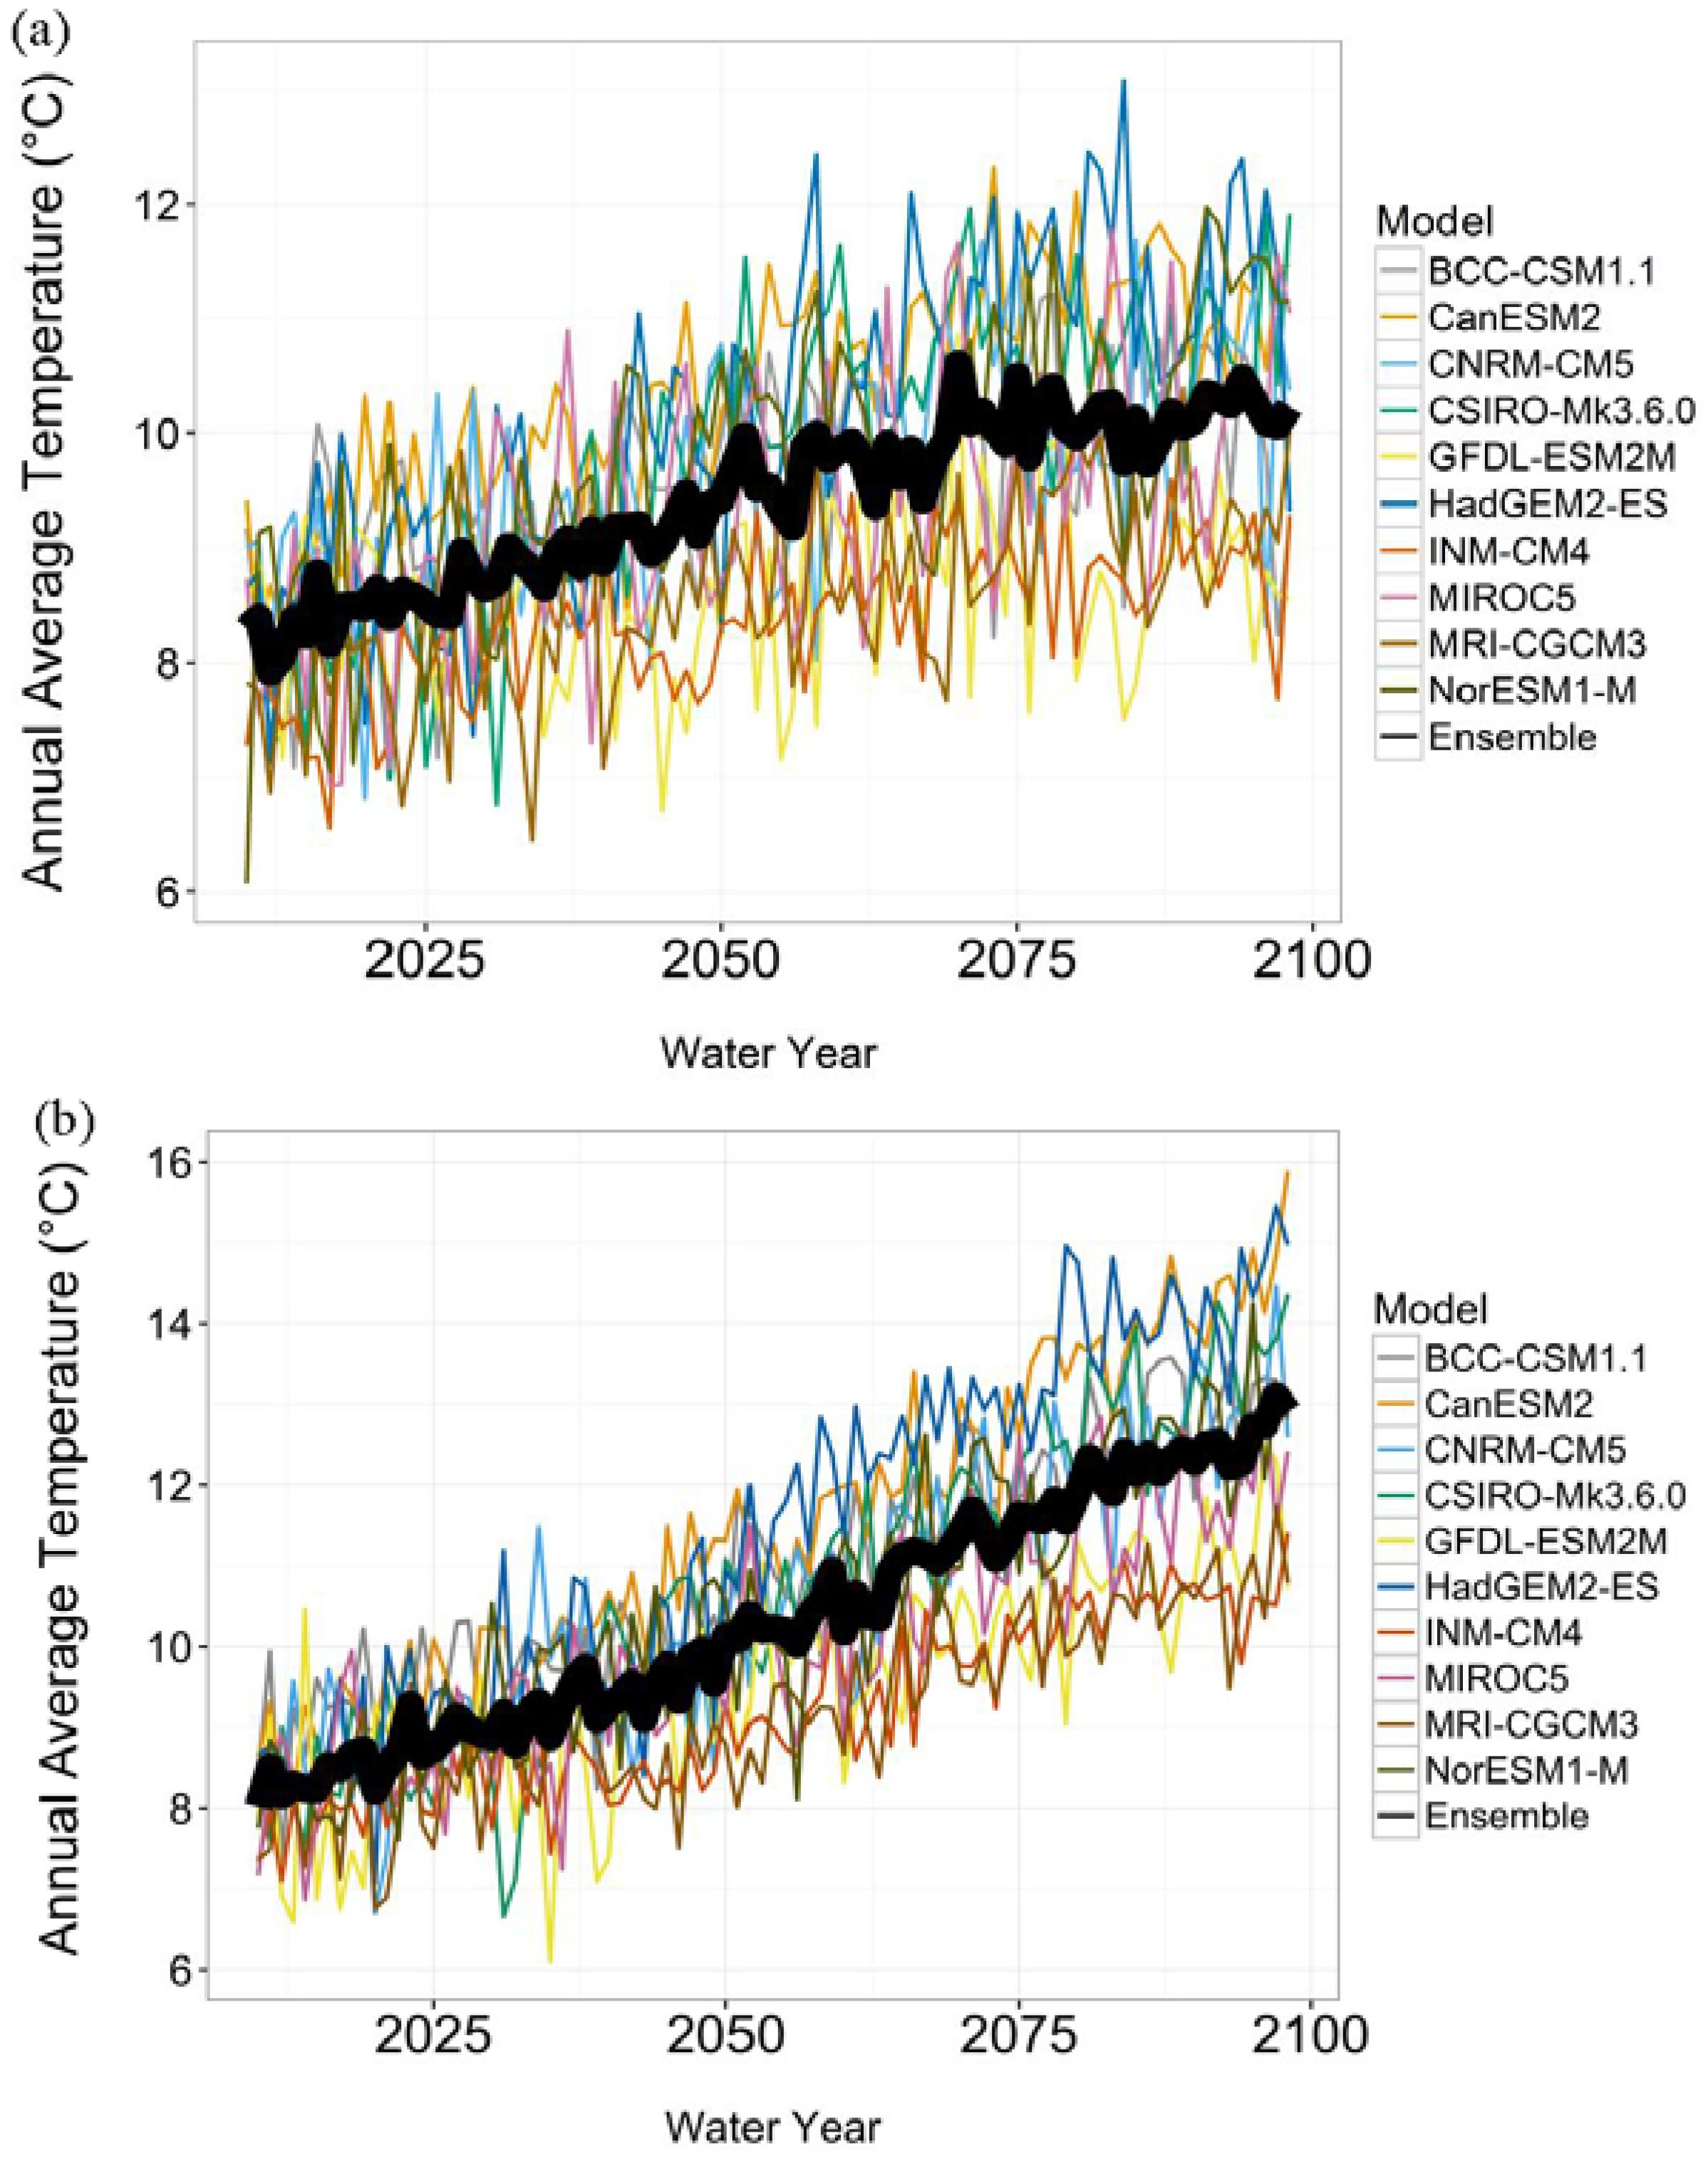
3.1. Change in Mean Annual Temperature

The ensemble mean temperature increases from 8.6 °C in the 2020s to 9.5 °C in the 2050s, to 10.2 °C in the study area in the 2080s in RCP 4.5. In RCP 8.5, an increase from 8.8 °C in the 2020s to 10.2 °C in the 2050s to 12.1 °C in the 2080s is observed (Figure 2). By the end of the 21st century, there is a 3.3 °C increase in mean temperature in RCP 8.5 and an increase of 1.6 °C in the RCP 4.5 scenario.
BCC-CSM1.1 = Beijing Climate Center – Climate System Model, version 1.1; CanESM2 = Second Generation Canadian Earth System Model; CNRM-CM5 = Centre National de Recherches Météorologiques, Climate Model, version 5; CSIRO-Mk3.6.0 = Commonwealth Scientific and Industrial Research Organisation, Mark 3.6; GFDL-ESM2M = Geophysical Fluid Dynamics Laboratory- Earth System Model 2 Modular; HadGEM2-ES = Hadley Centre Global Environmental Model, version 2 (Earth System); INM-CM4 = Institute for Numerical Mathematics Coupled Model, version 4.0; MIROC5 = Model for Interdisciplinary Research on Climate, version 5; MRI-CGCM3 = Meteorological Research Institute Coupled Global Climate Model, version 3.

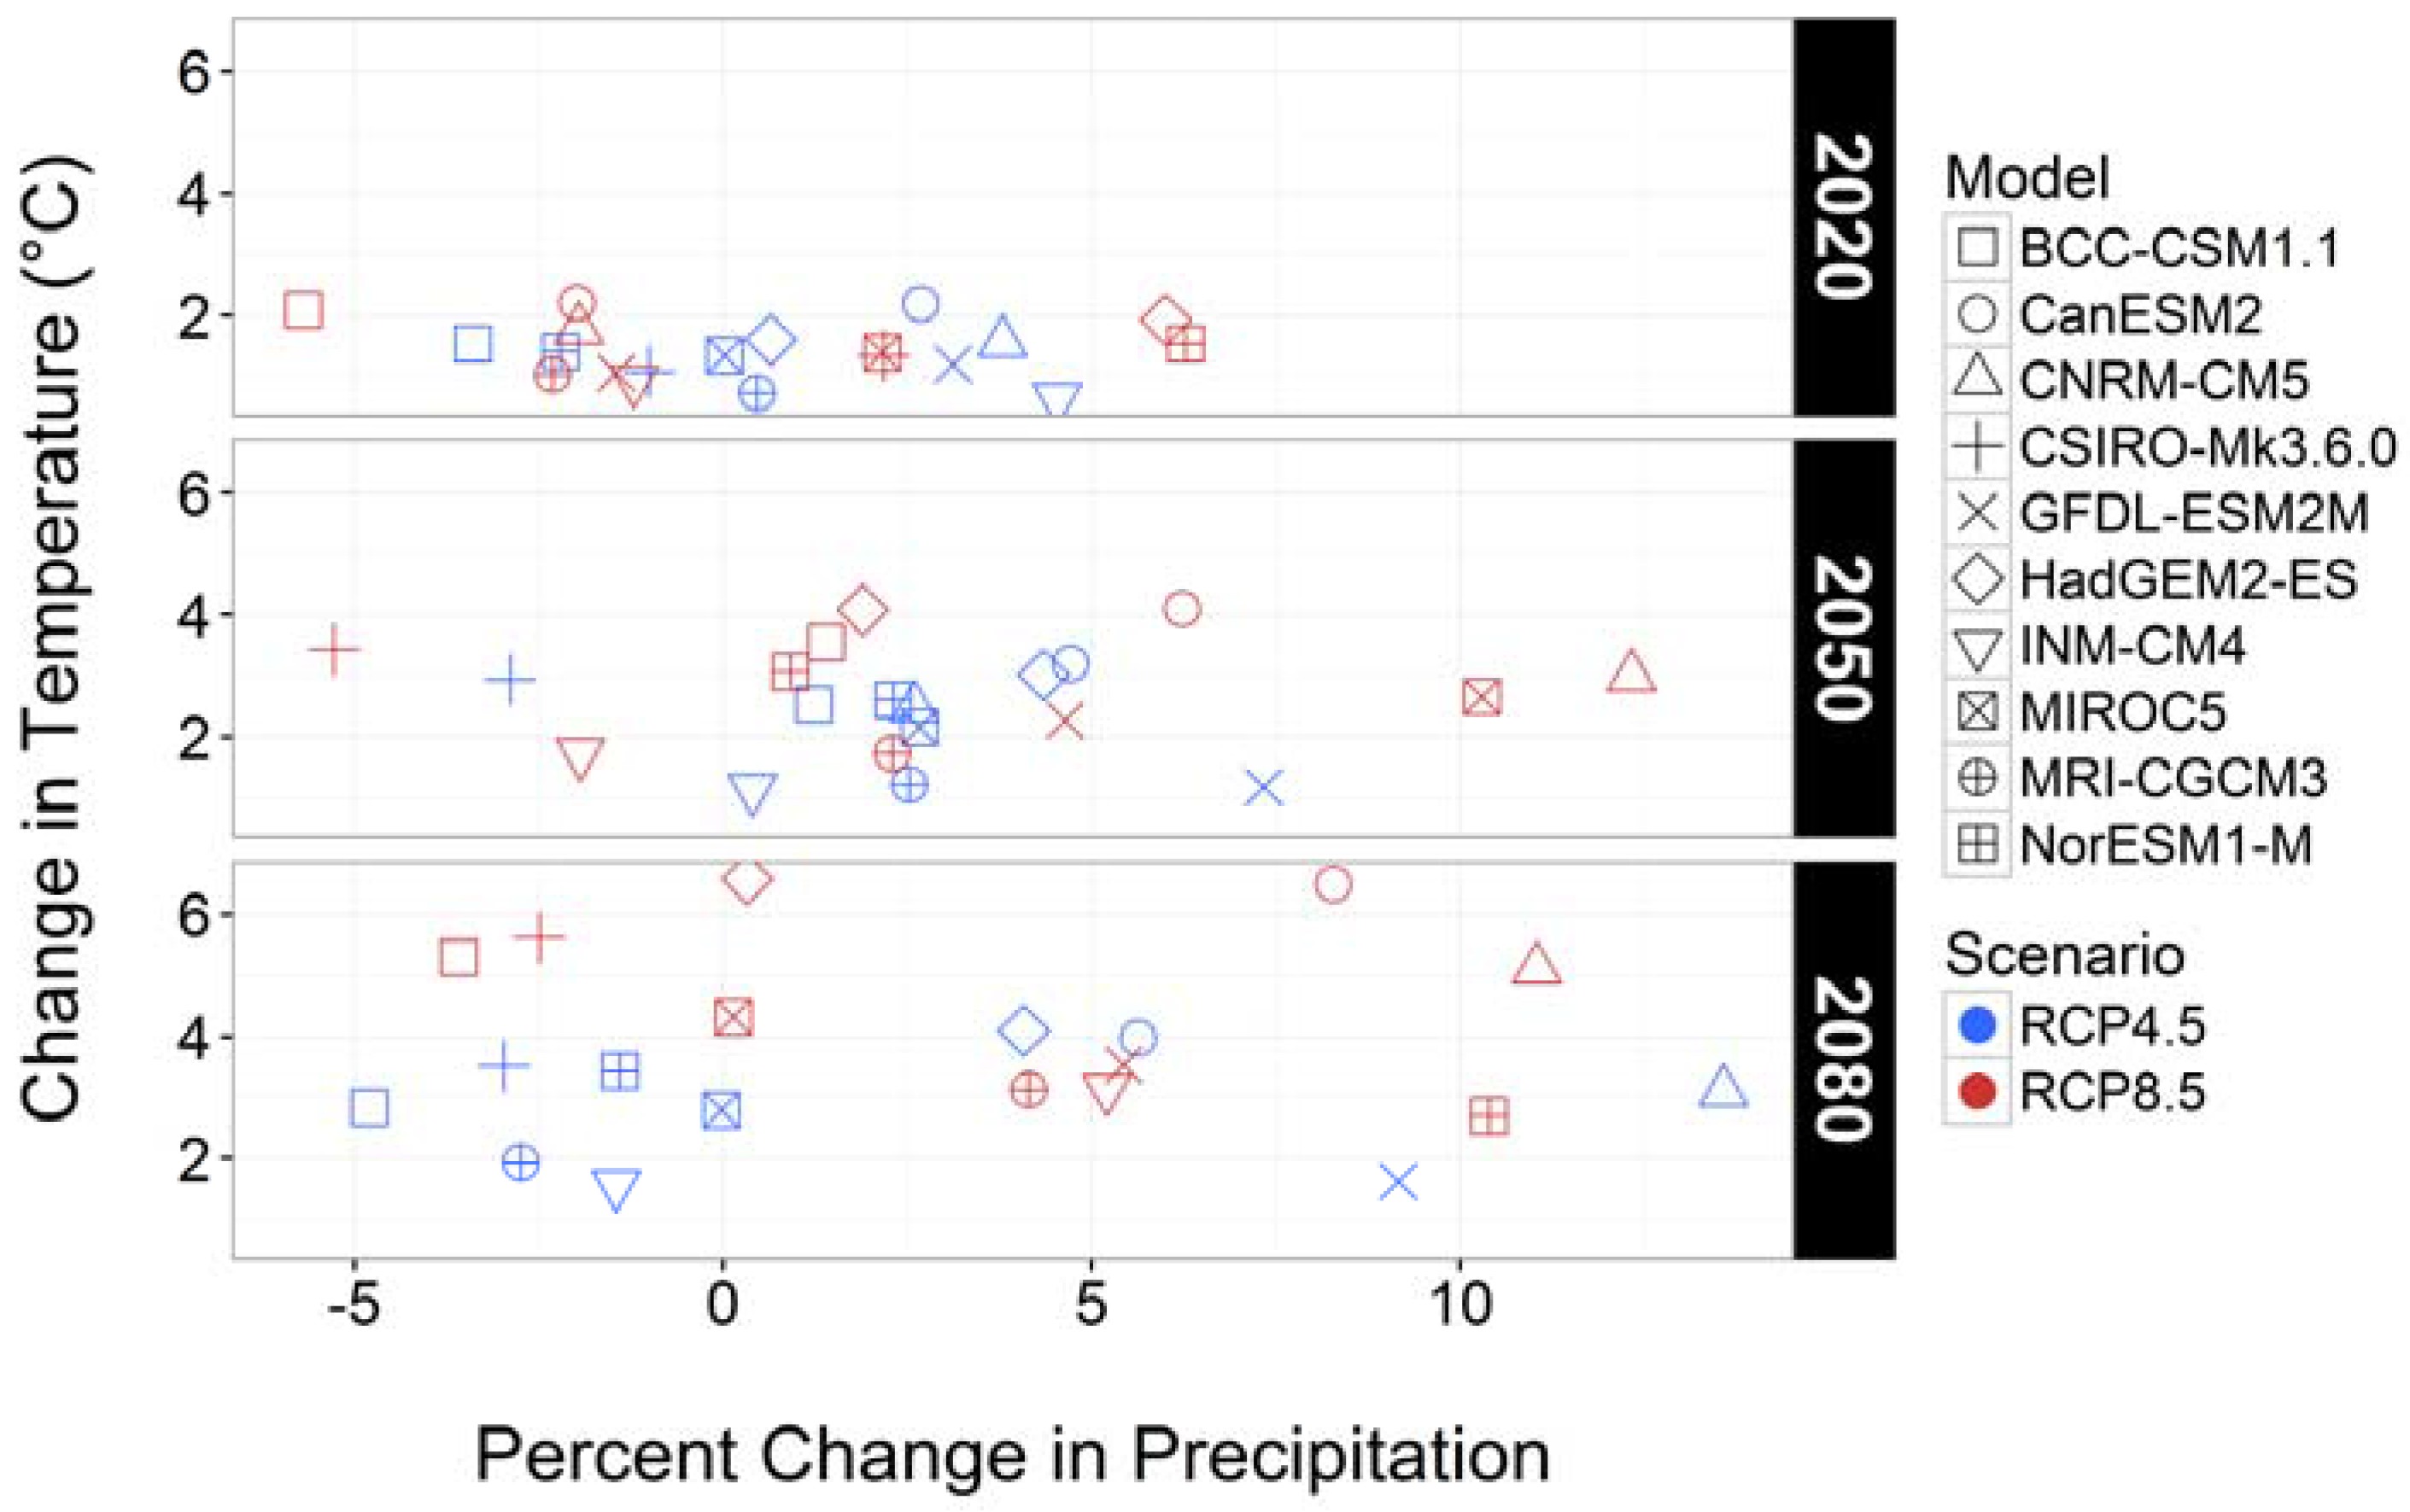
3.2. Change of Temperature and Percent Change in Precipitation

The 10 GCMs project a steady increase of temperature with increased model variability toward the end of the 21st century in the study area (Figure 3). In the 2020s, annual temperature is projected to increase ranging from 0.7 °C–2.2 °C in RCP 4.5 and 0.9 °C–2.2 °C in RCP 8.5, and annual precipitation is projected to change from −3.4%–4.5% in RCP 4.5 and −5.7%–6.3% in RCP 8.5. In the 2050s, the change of temperature ranges from 1.2 °C–3.2 °C for RCP 4.5 and 1.7 °C–4.1 °C for RCP 8.5 and a percent change in precipitation from −2.9%–7.3% for RCP 4.5 and −5.3%–12.3% for RCP 8.5. In the 2080s, the change of temperature ranges from 1.6 °C–4.1 °C in RCP 4.5 and 3.1 °C–6.6 °C in RCP 8.5 and a percent change in precipitation from −4.8%–13.6% in RCP 4.5 and −3.6%–11.3% in RCP 8.5.

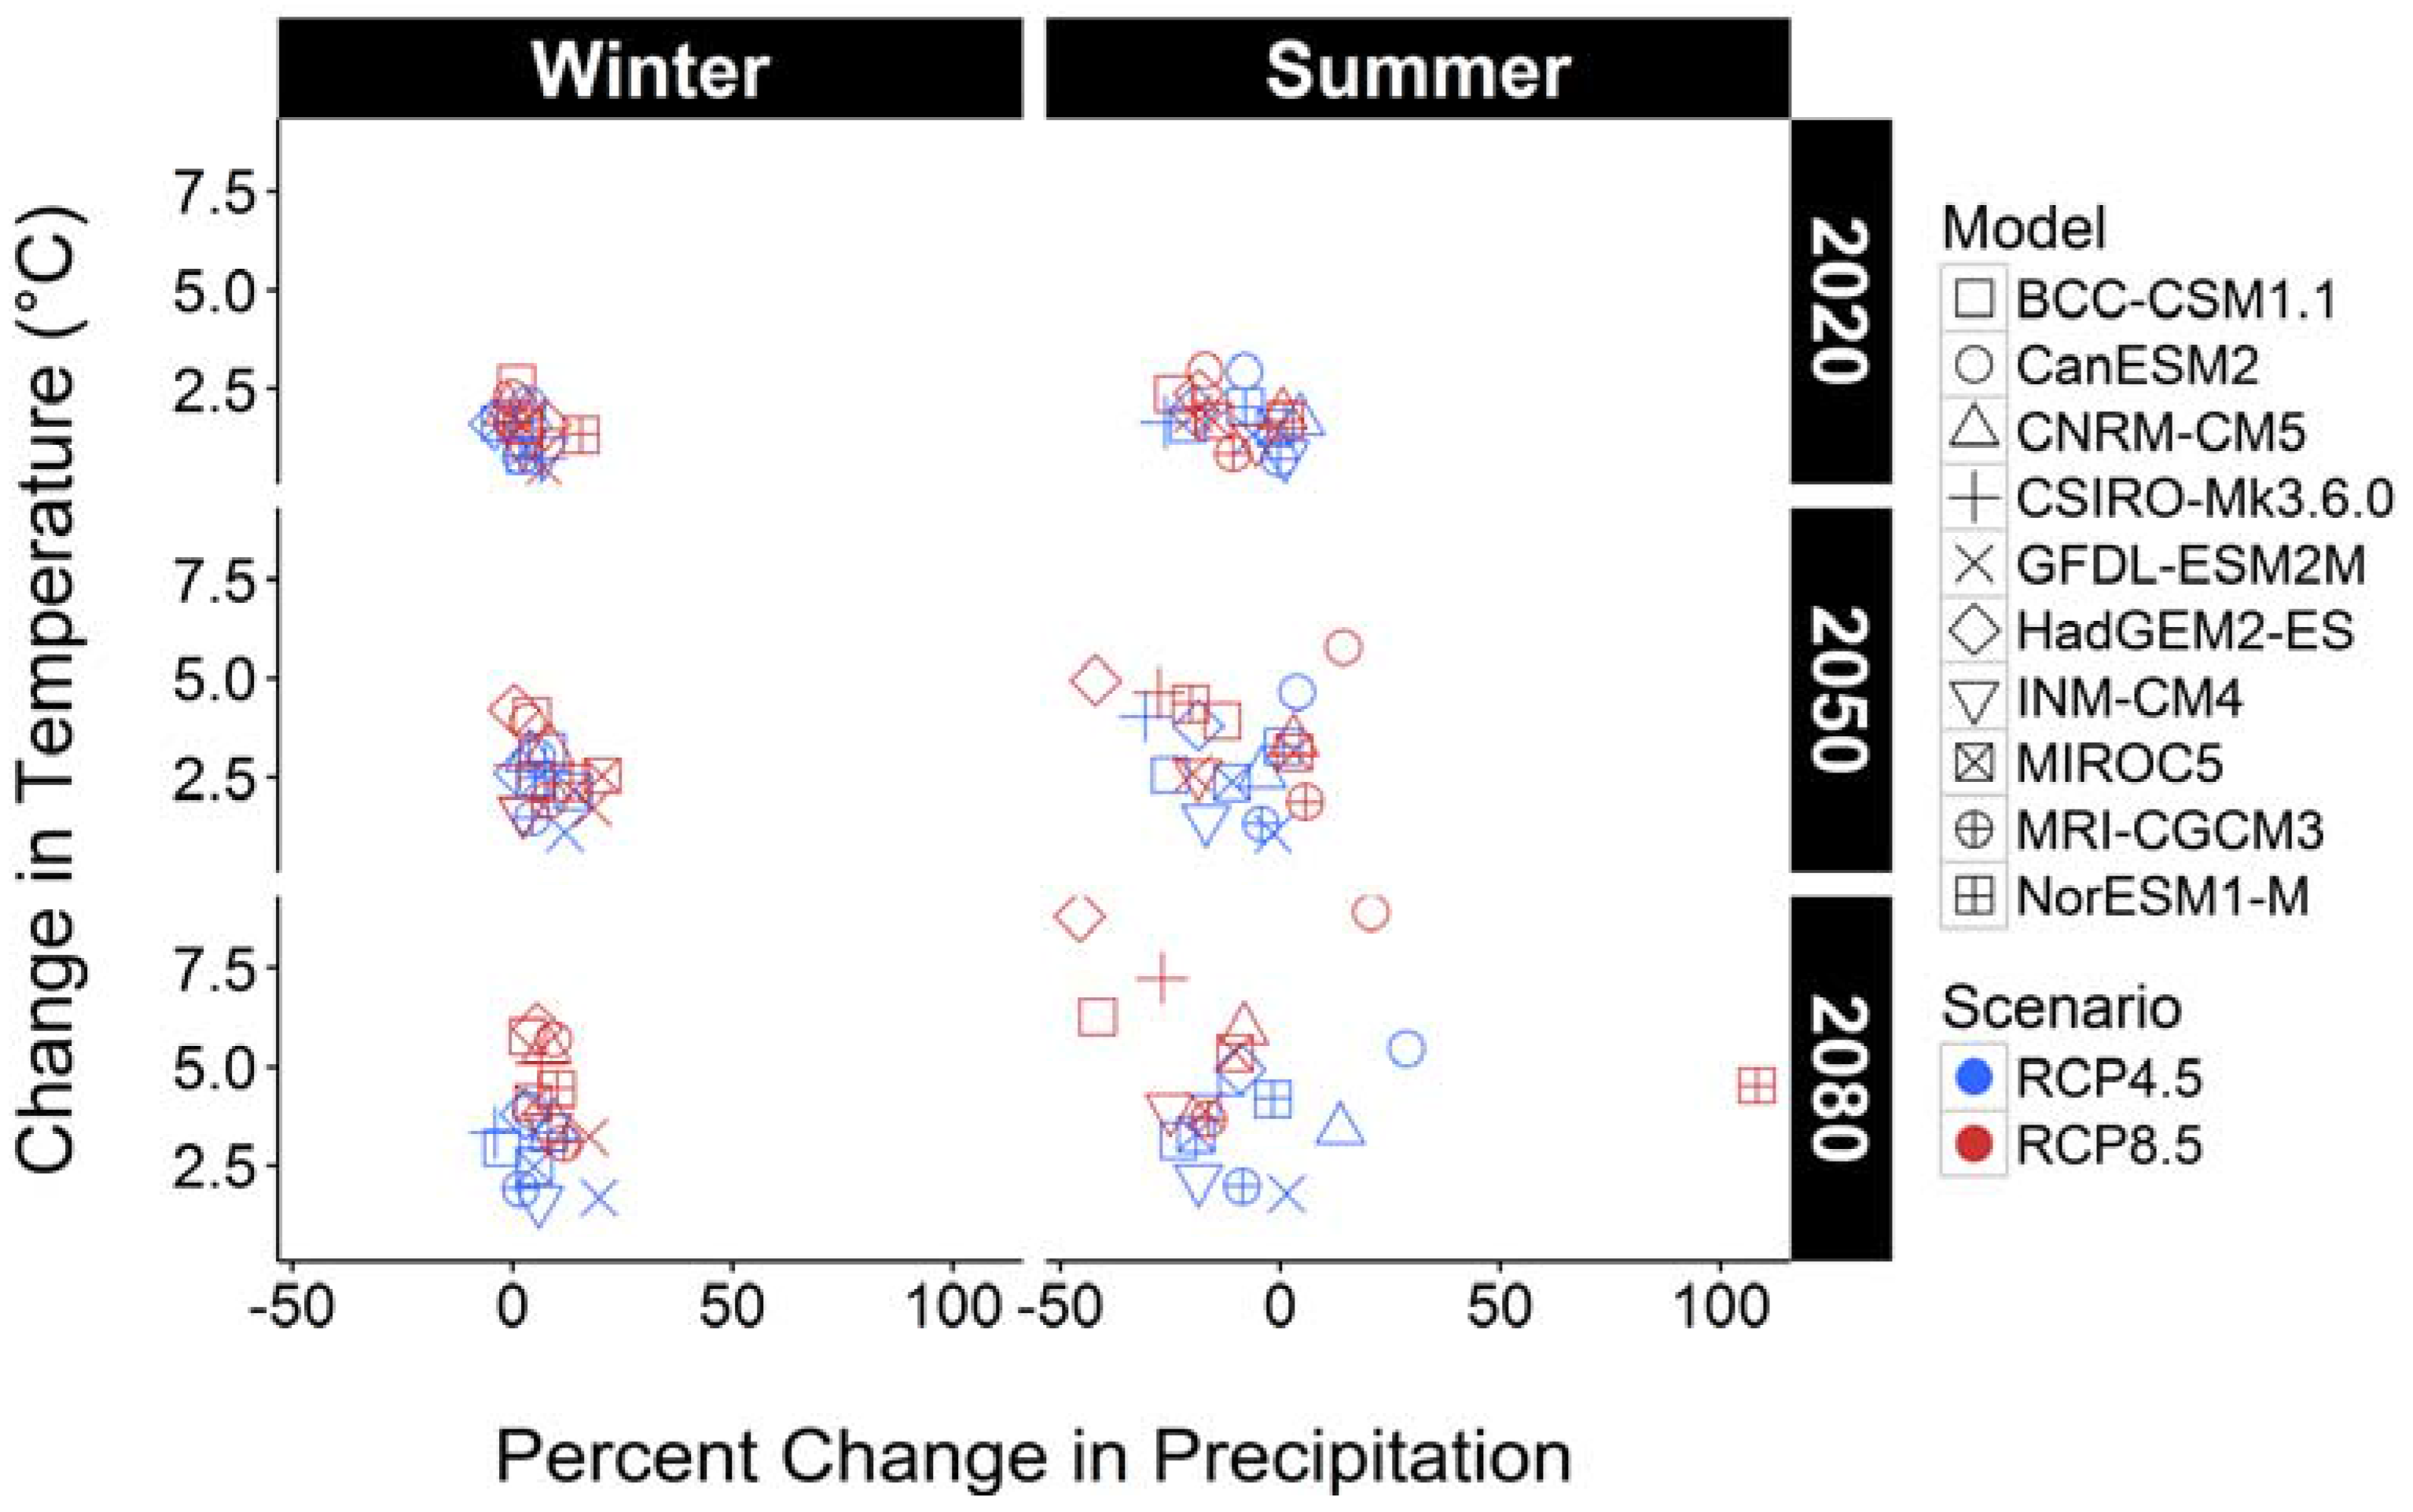
3.3. Seasonal Change of Temperature and Percent Change in Precipitation

There is less model uncertainty in the winter with more variation in the summer season throughout the century in both scenarios for both temperature and precipitation. In the summer, there is substantial variability in model predictions in the change of temperature in the 2050s and 2080s. The percent change in precipitation increases slightly throughout the 21st century (Figure 4). In the summer, there is a significant increase in the percent change in precipitation with high model uncertainty in both scenarios in the 2050s and 2080s (Figure 4).

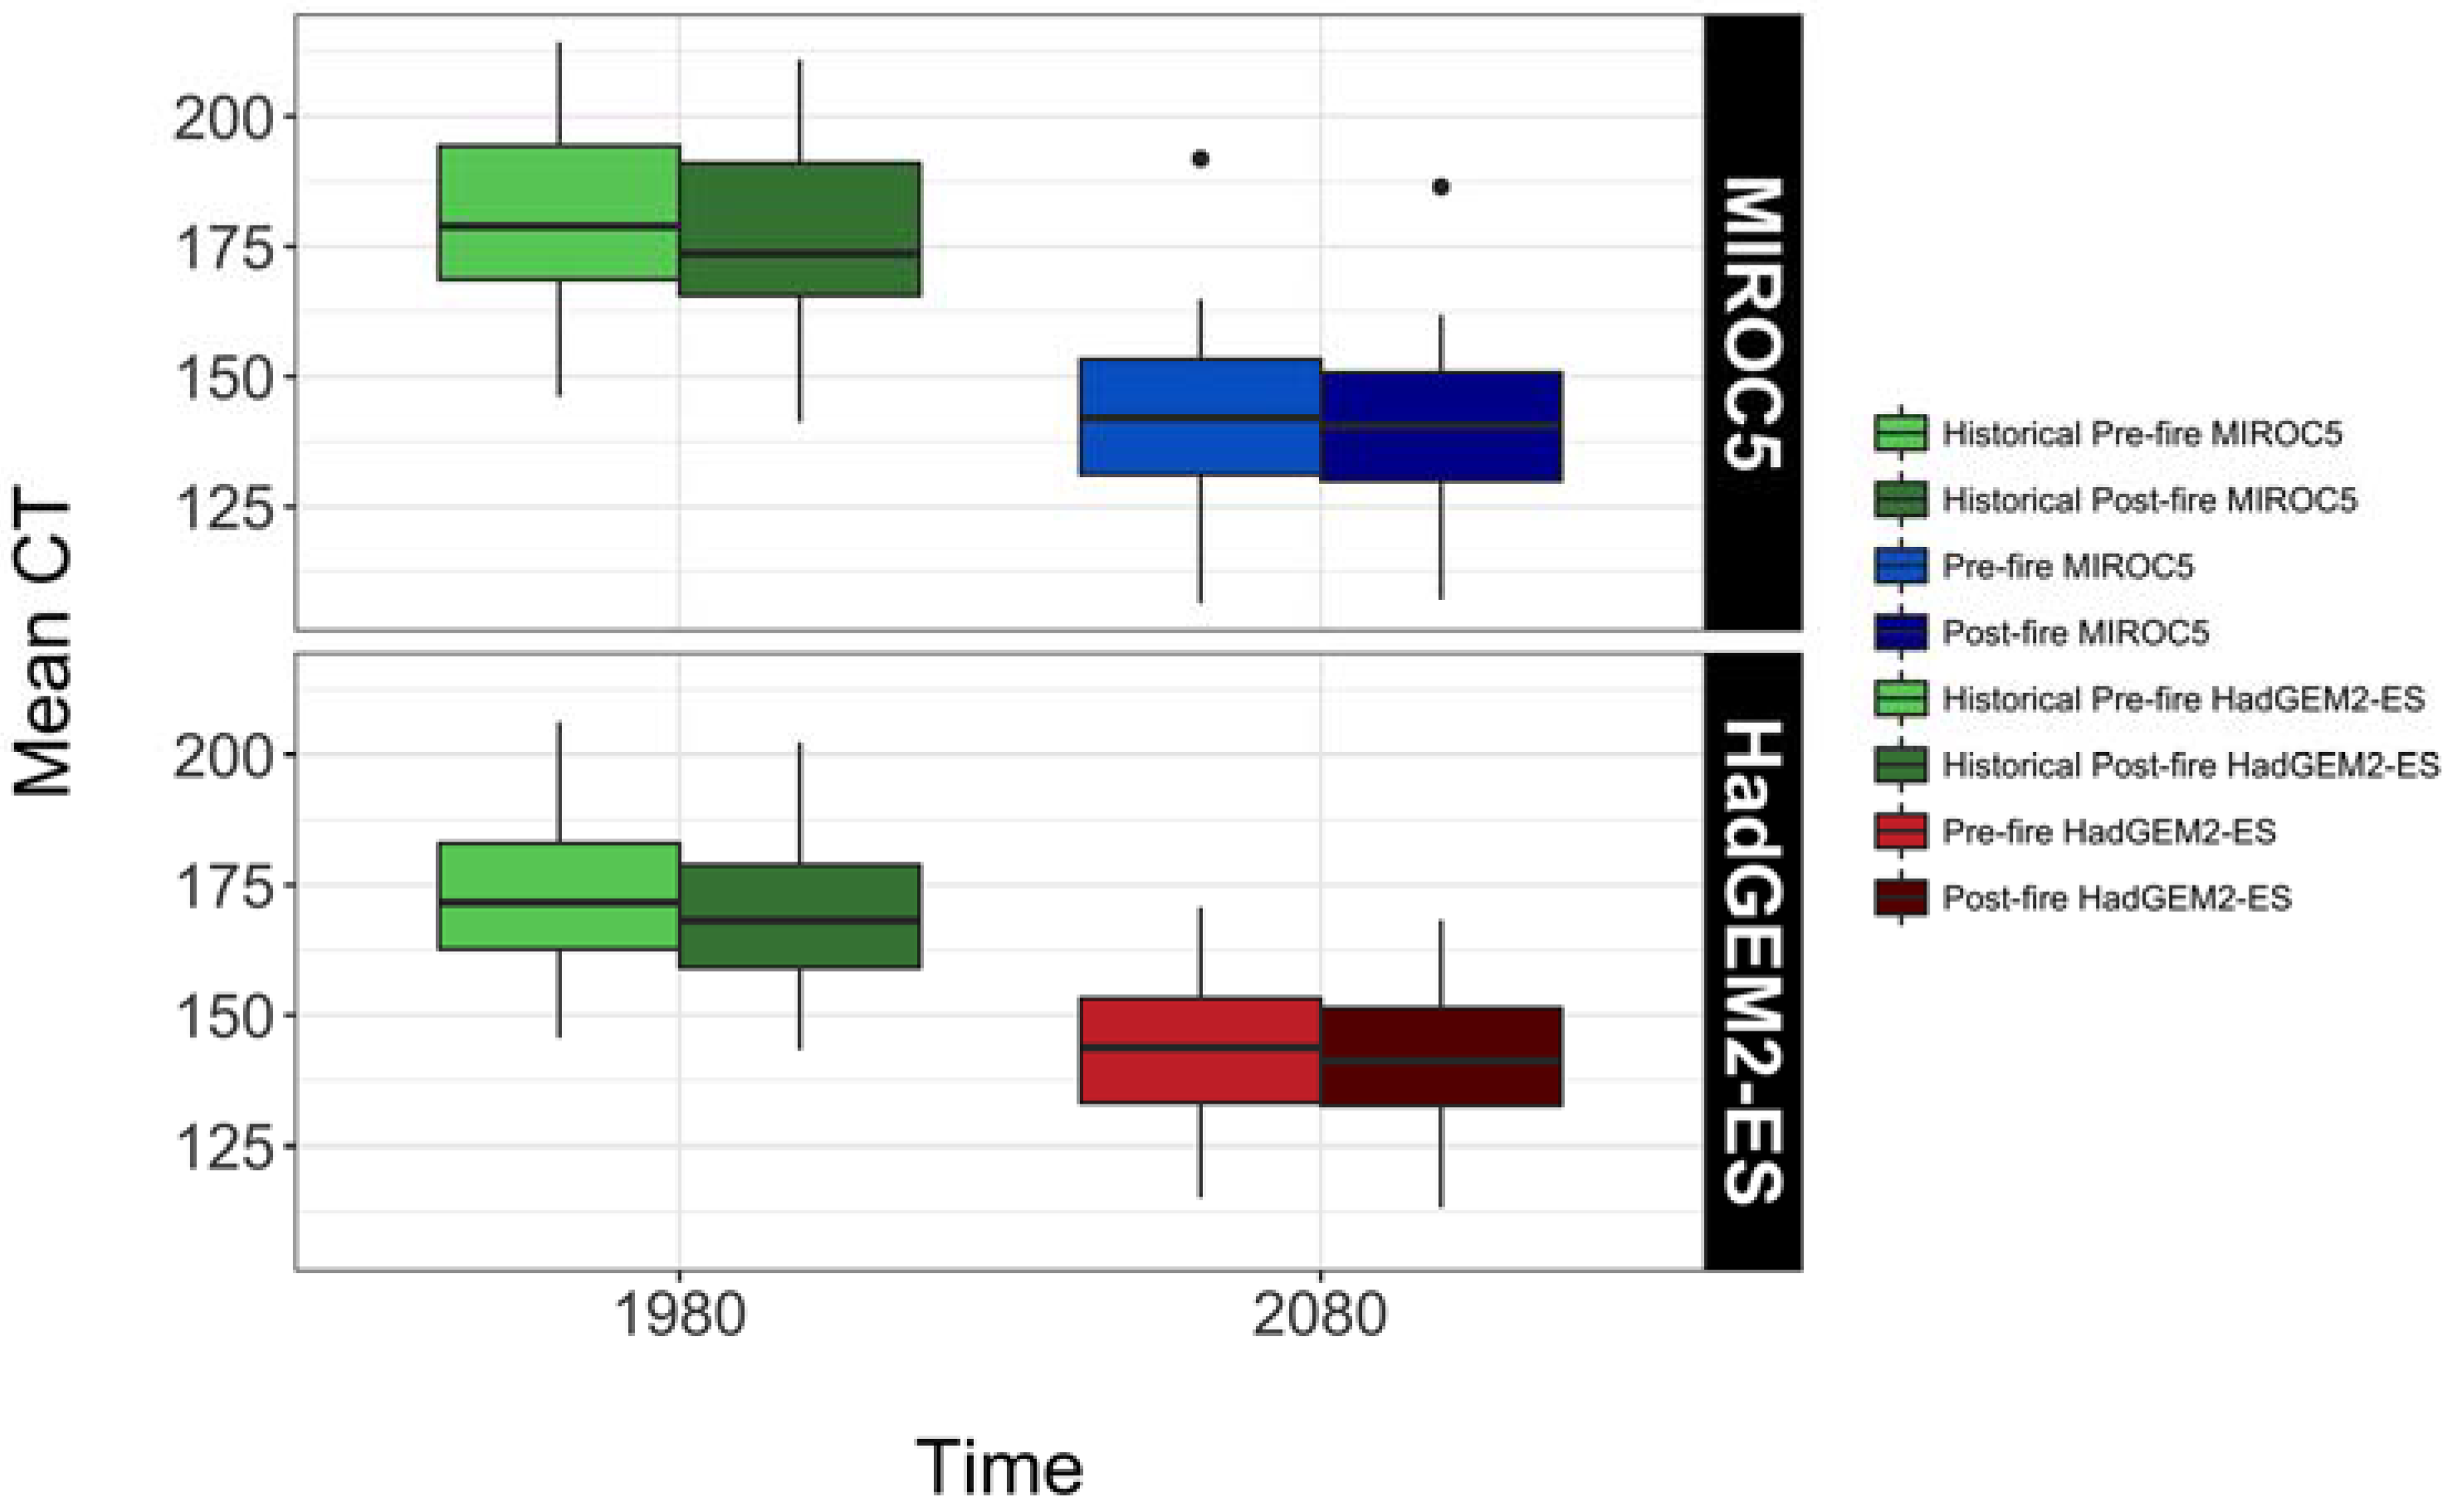
3.4. Center Time of Flow after Fire-Burns

Mean center time (CT) in RCP 4.5 in the 2080s before forest cover reduction occurred 37 days earlier than baseline conditions and occurred 40 days earlier after forest cover reduction (Figure 5; Table 3). In RCP 8.5 in the 2080s, mean CT occurred 30 days earlier before forest cover reduction and occurred 32 days earlier than baseline conditions after forest cover reduction (Table 3). In the 1980s after forest cover reduction, Mean CT occurs five days earlier in RCP 4.5 and three days earlier in RCP 8.5. Mean CT is significantly different between historical pre-fire and before and after forest cover reduction, between historical post-fire and before and after forest cover reduction, but not significantly different between before and after forest reduction in both the RCP 4.5 and 8.5 scenarios and before and after fire-burns in historic conditions. For a comparison, ensemble mean basin CT before forest cover reduction occurs 27 days earlier in RCP 4.5 and 32 days earlier in RCP 8.5 in the 2080s, occurring earlier than the model prediction by MIROC5 in RCP 4.5 (Table 3).

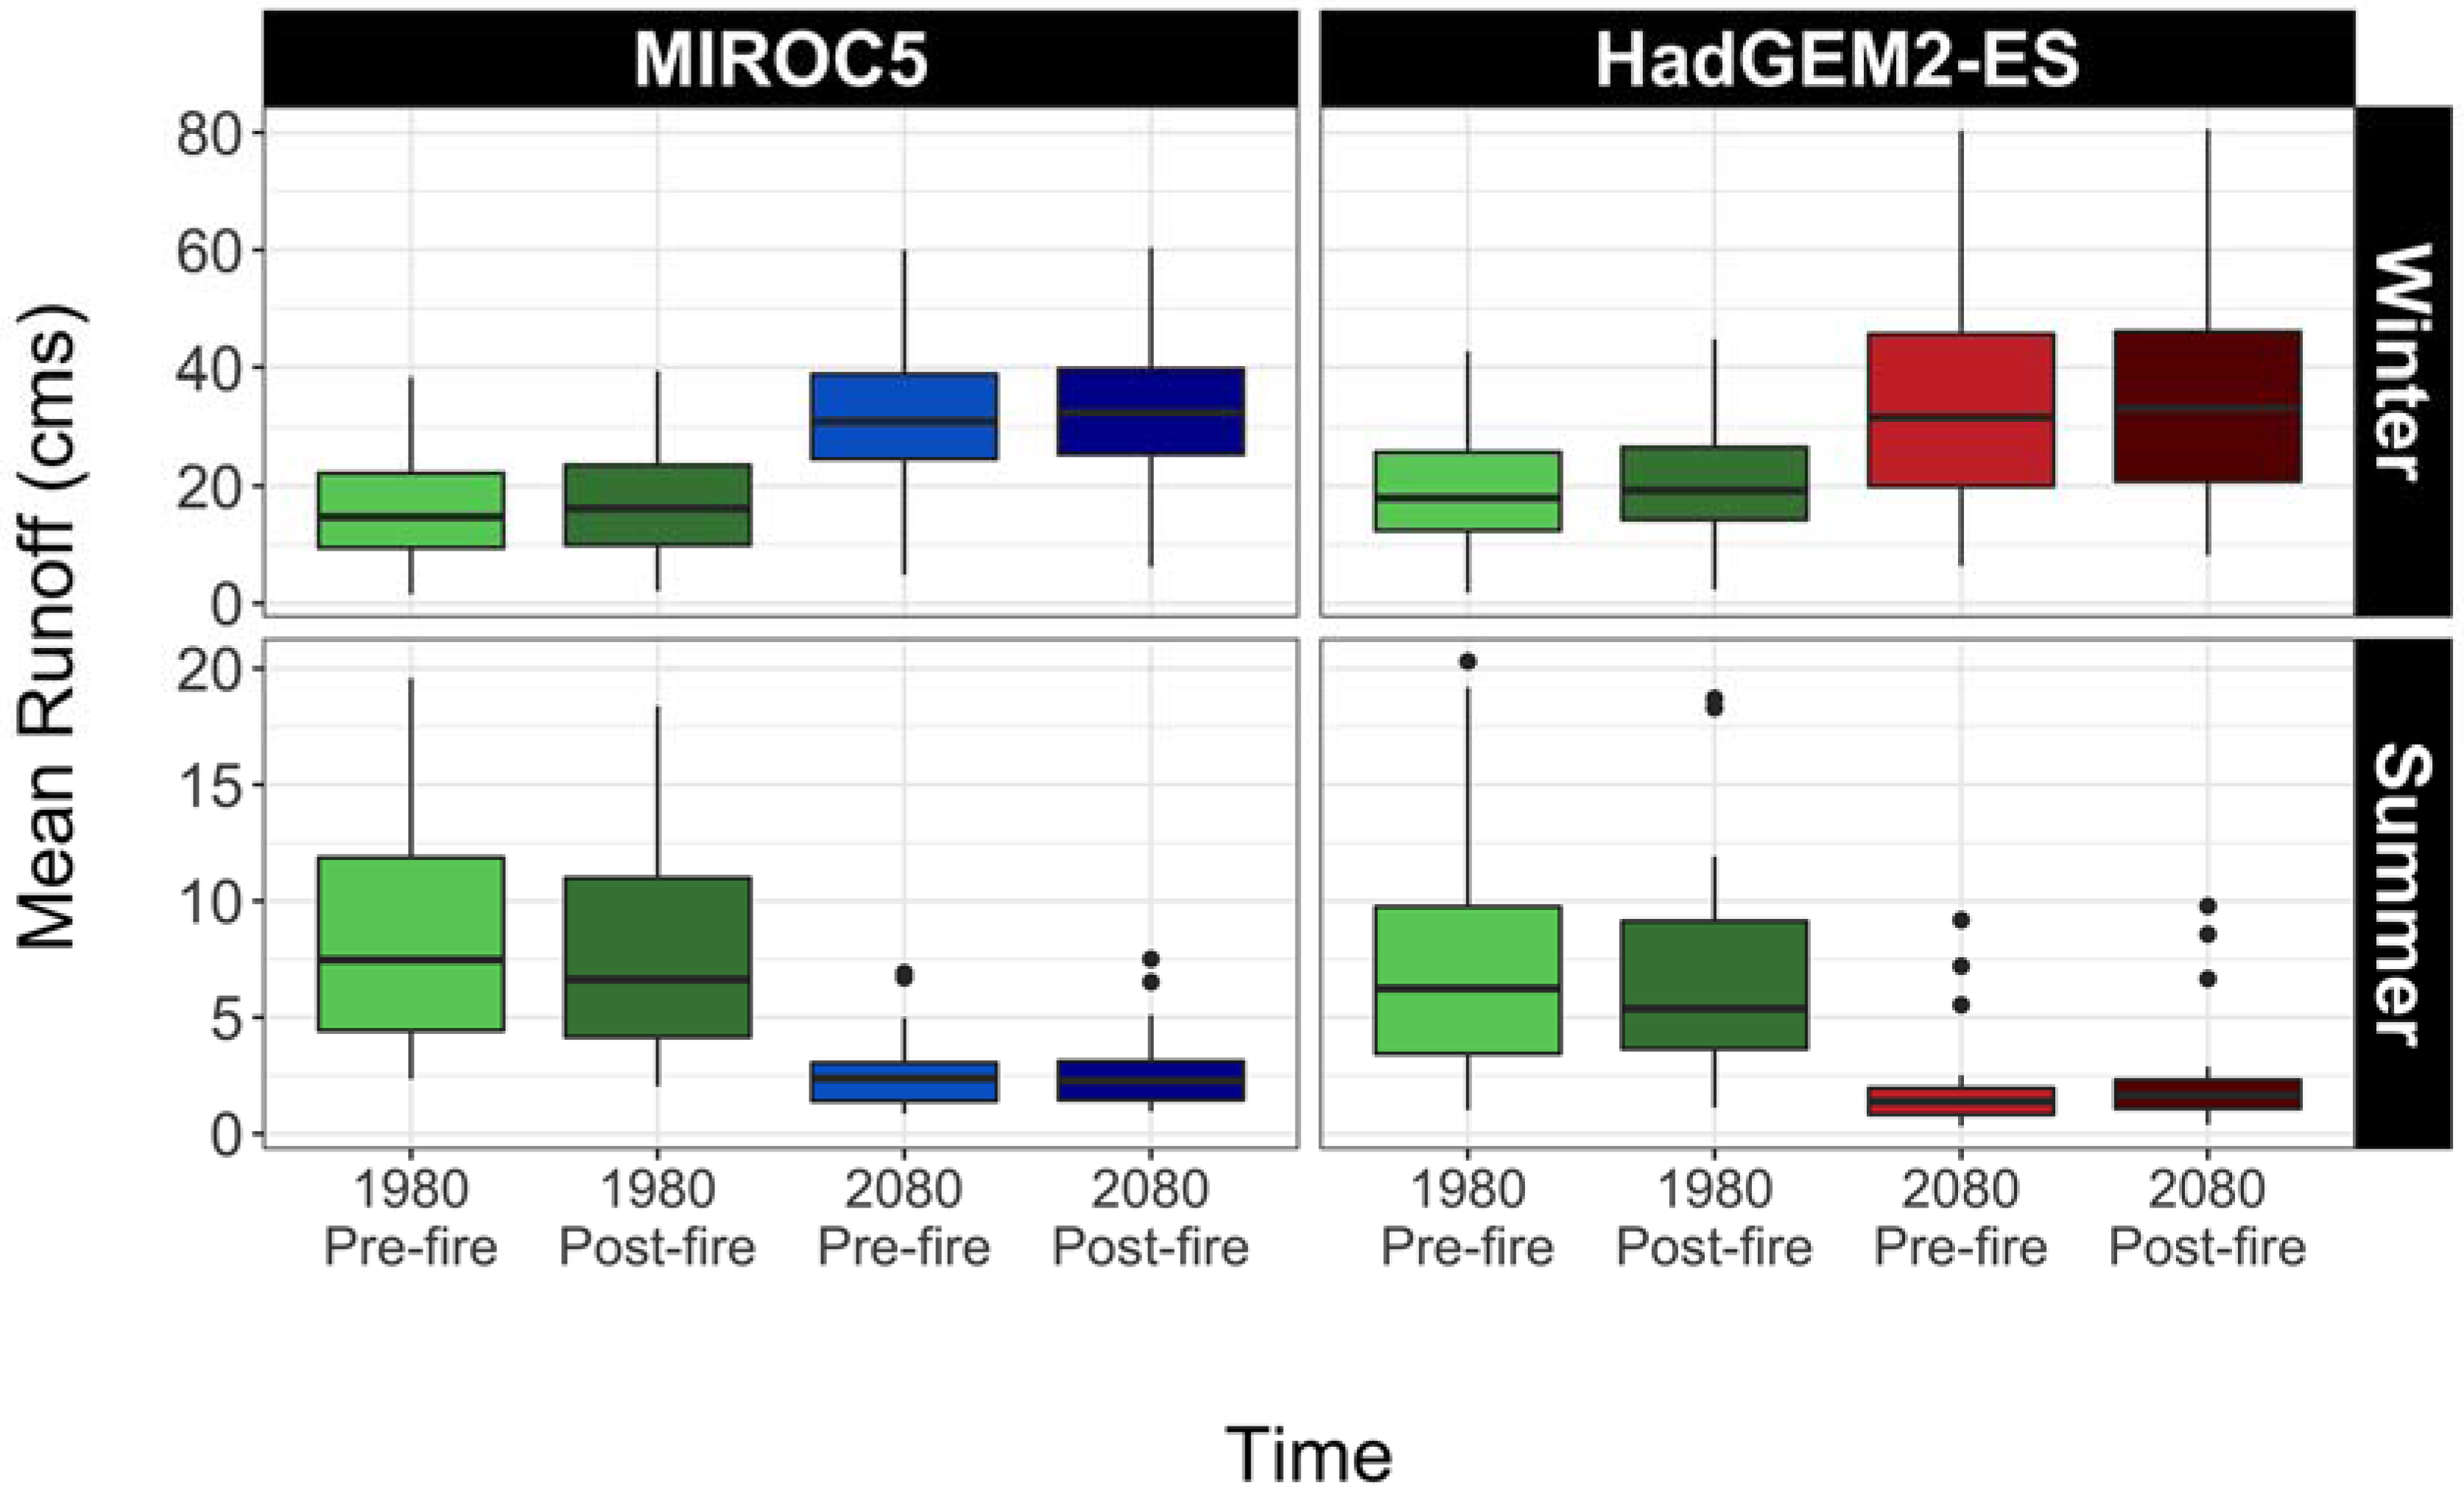
3.5. Seasonal Flows after Fire-Burns

Winter runoff in MIROC 5 under RCP 4.5 in the 2080s showed a 92% increase before forest cover reduction and an 85% increase after forest cover reduction compared to the historical period with the same respective land cover conditions (Figure 6; Table 4). In RCP 8.5 in the 2080s, winter runoff increases 79% before forest cover change and increases 72% after forest cover reduction (Table 4). A decrease in summer flows is observed for both before and after forest cover reduction. A 72% decrease and 67% decrease after land cover change are observed in RCP4.5 and a 72% and 67% decrease before and after forest cover reduction in RCP 8.5 (Figure 6; Table 4). Winter flows are significantly different between historical and both land cover conditions in RCP 4.5 and RCP 8.5 and for summer flows in RCP 4.5. It is not significantly different between summer flows in RCP 8.5 and between both land cover reductions in both scenarios, as well as between before and after forest cover reduction in historical conditions. The ensemble basin mean of winter flows before forest cover reduction substantially increases in the 2080s by 98% in RCP 8.5 in comparison to an increase by 71% in RCP 4.5 (Table 5).

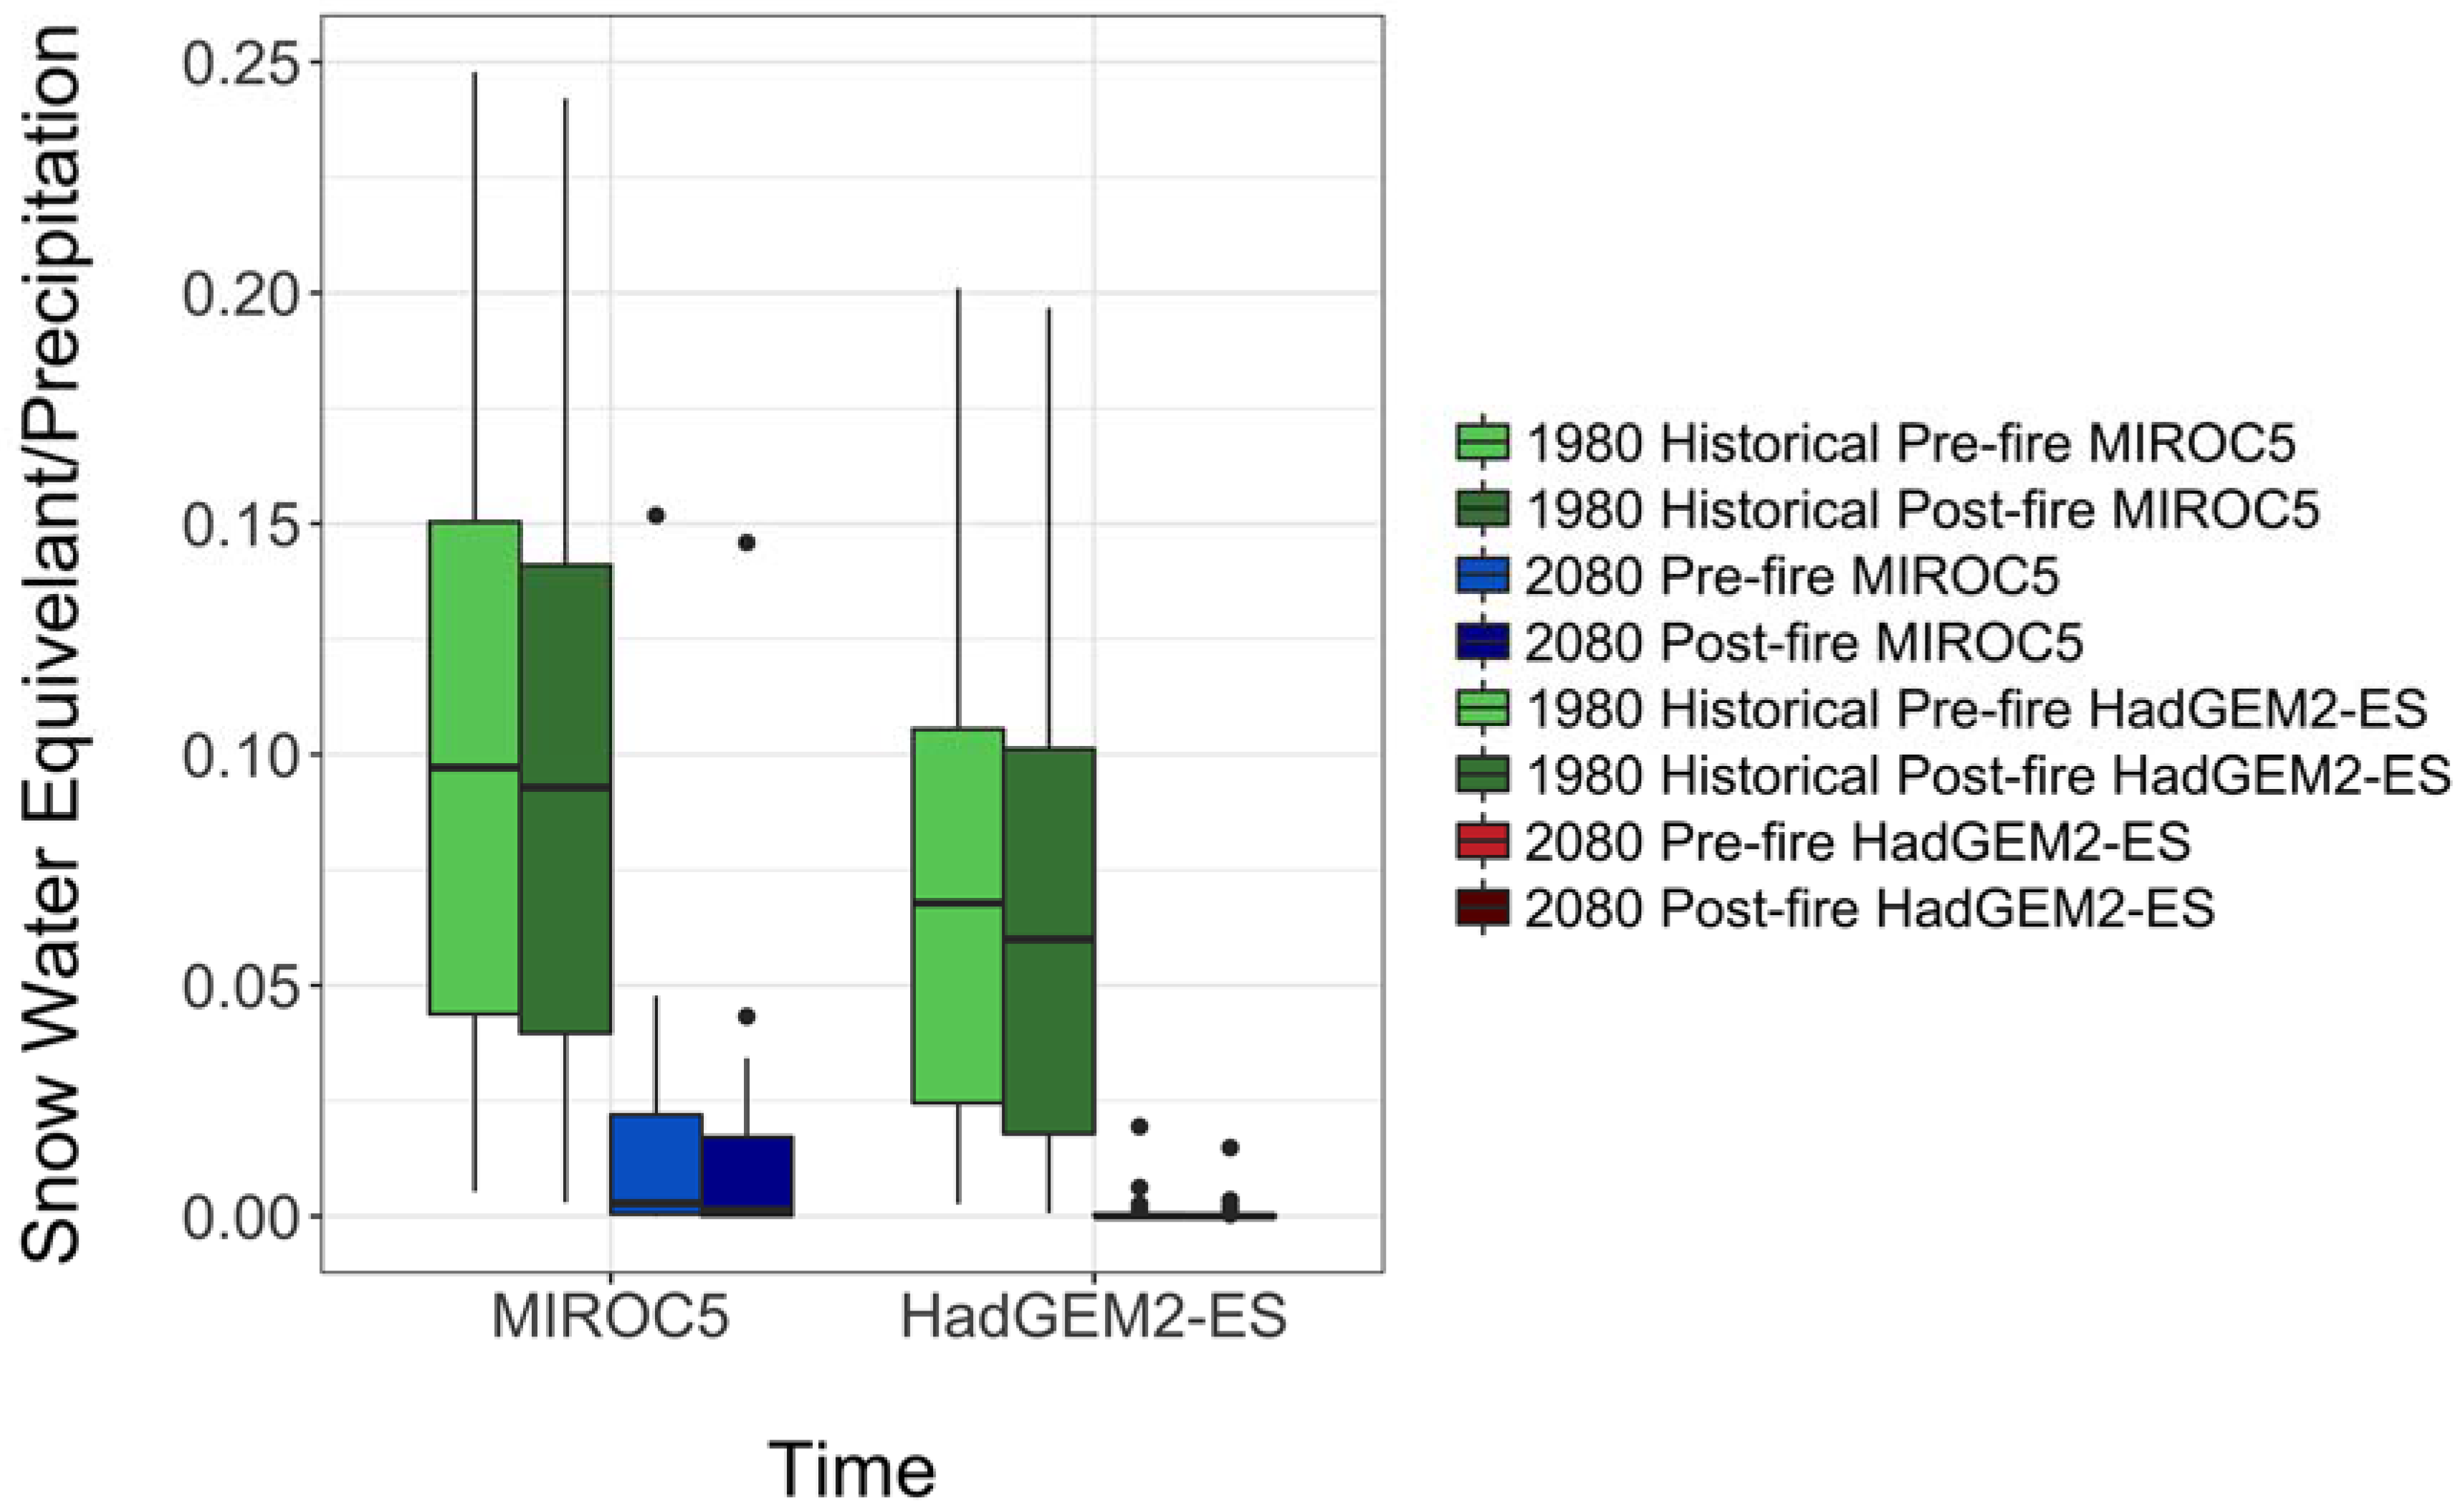
3.6. Ratio of Snow Water Equivalent to Precipitation before Fire-Burns

The ratio of SWE to P over the whole study area is substantially lower in RCP 4.5 in comparison to the 1980s with a 81% and 90% decrease before and after forest cover reduction (Figure 7; Table 6). The absolute difference of SWE/P is 9.0 × 10⁻² and 0.1, before and after forest cover reduction in RCP 4.5 in comparison to the 1980s before canopy reduction (Table 6). Between the two land cover conditions in RCP 4.5, there is an 8% decrease in SWE/P after forest fire (Table 6). In RCP 8.5, the ratio is significantly lower with a 98% decrease and 99% decrease before and after forest cover reduction and an absolute difference of 7.9 × 10⁻² and 7.3 × 10⁻² in comparison to historical conditions (Table 6). This does not consider expected variability at different elevations and aspect. There is a significant difference between both historical land cover conditions and future land cover conditions in both scenarios. There is no significant difference between both scenarios before and after forest cover reduction in both historical and future periods. The difference between the ensemble basin mean of SWE/P in the 2080s before fire-burn is similar to MIROC5 predictions before forest cover reduction.

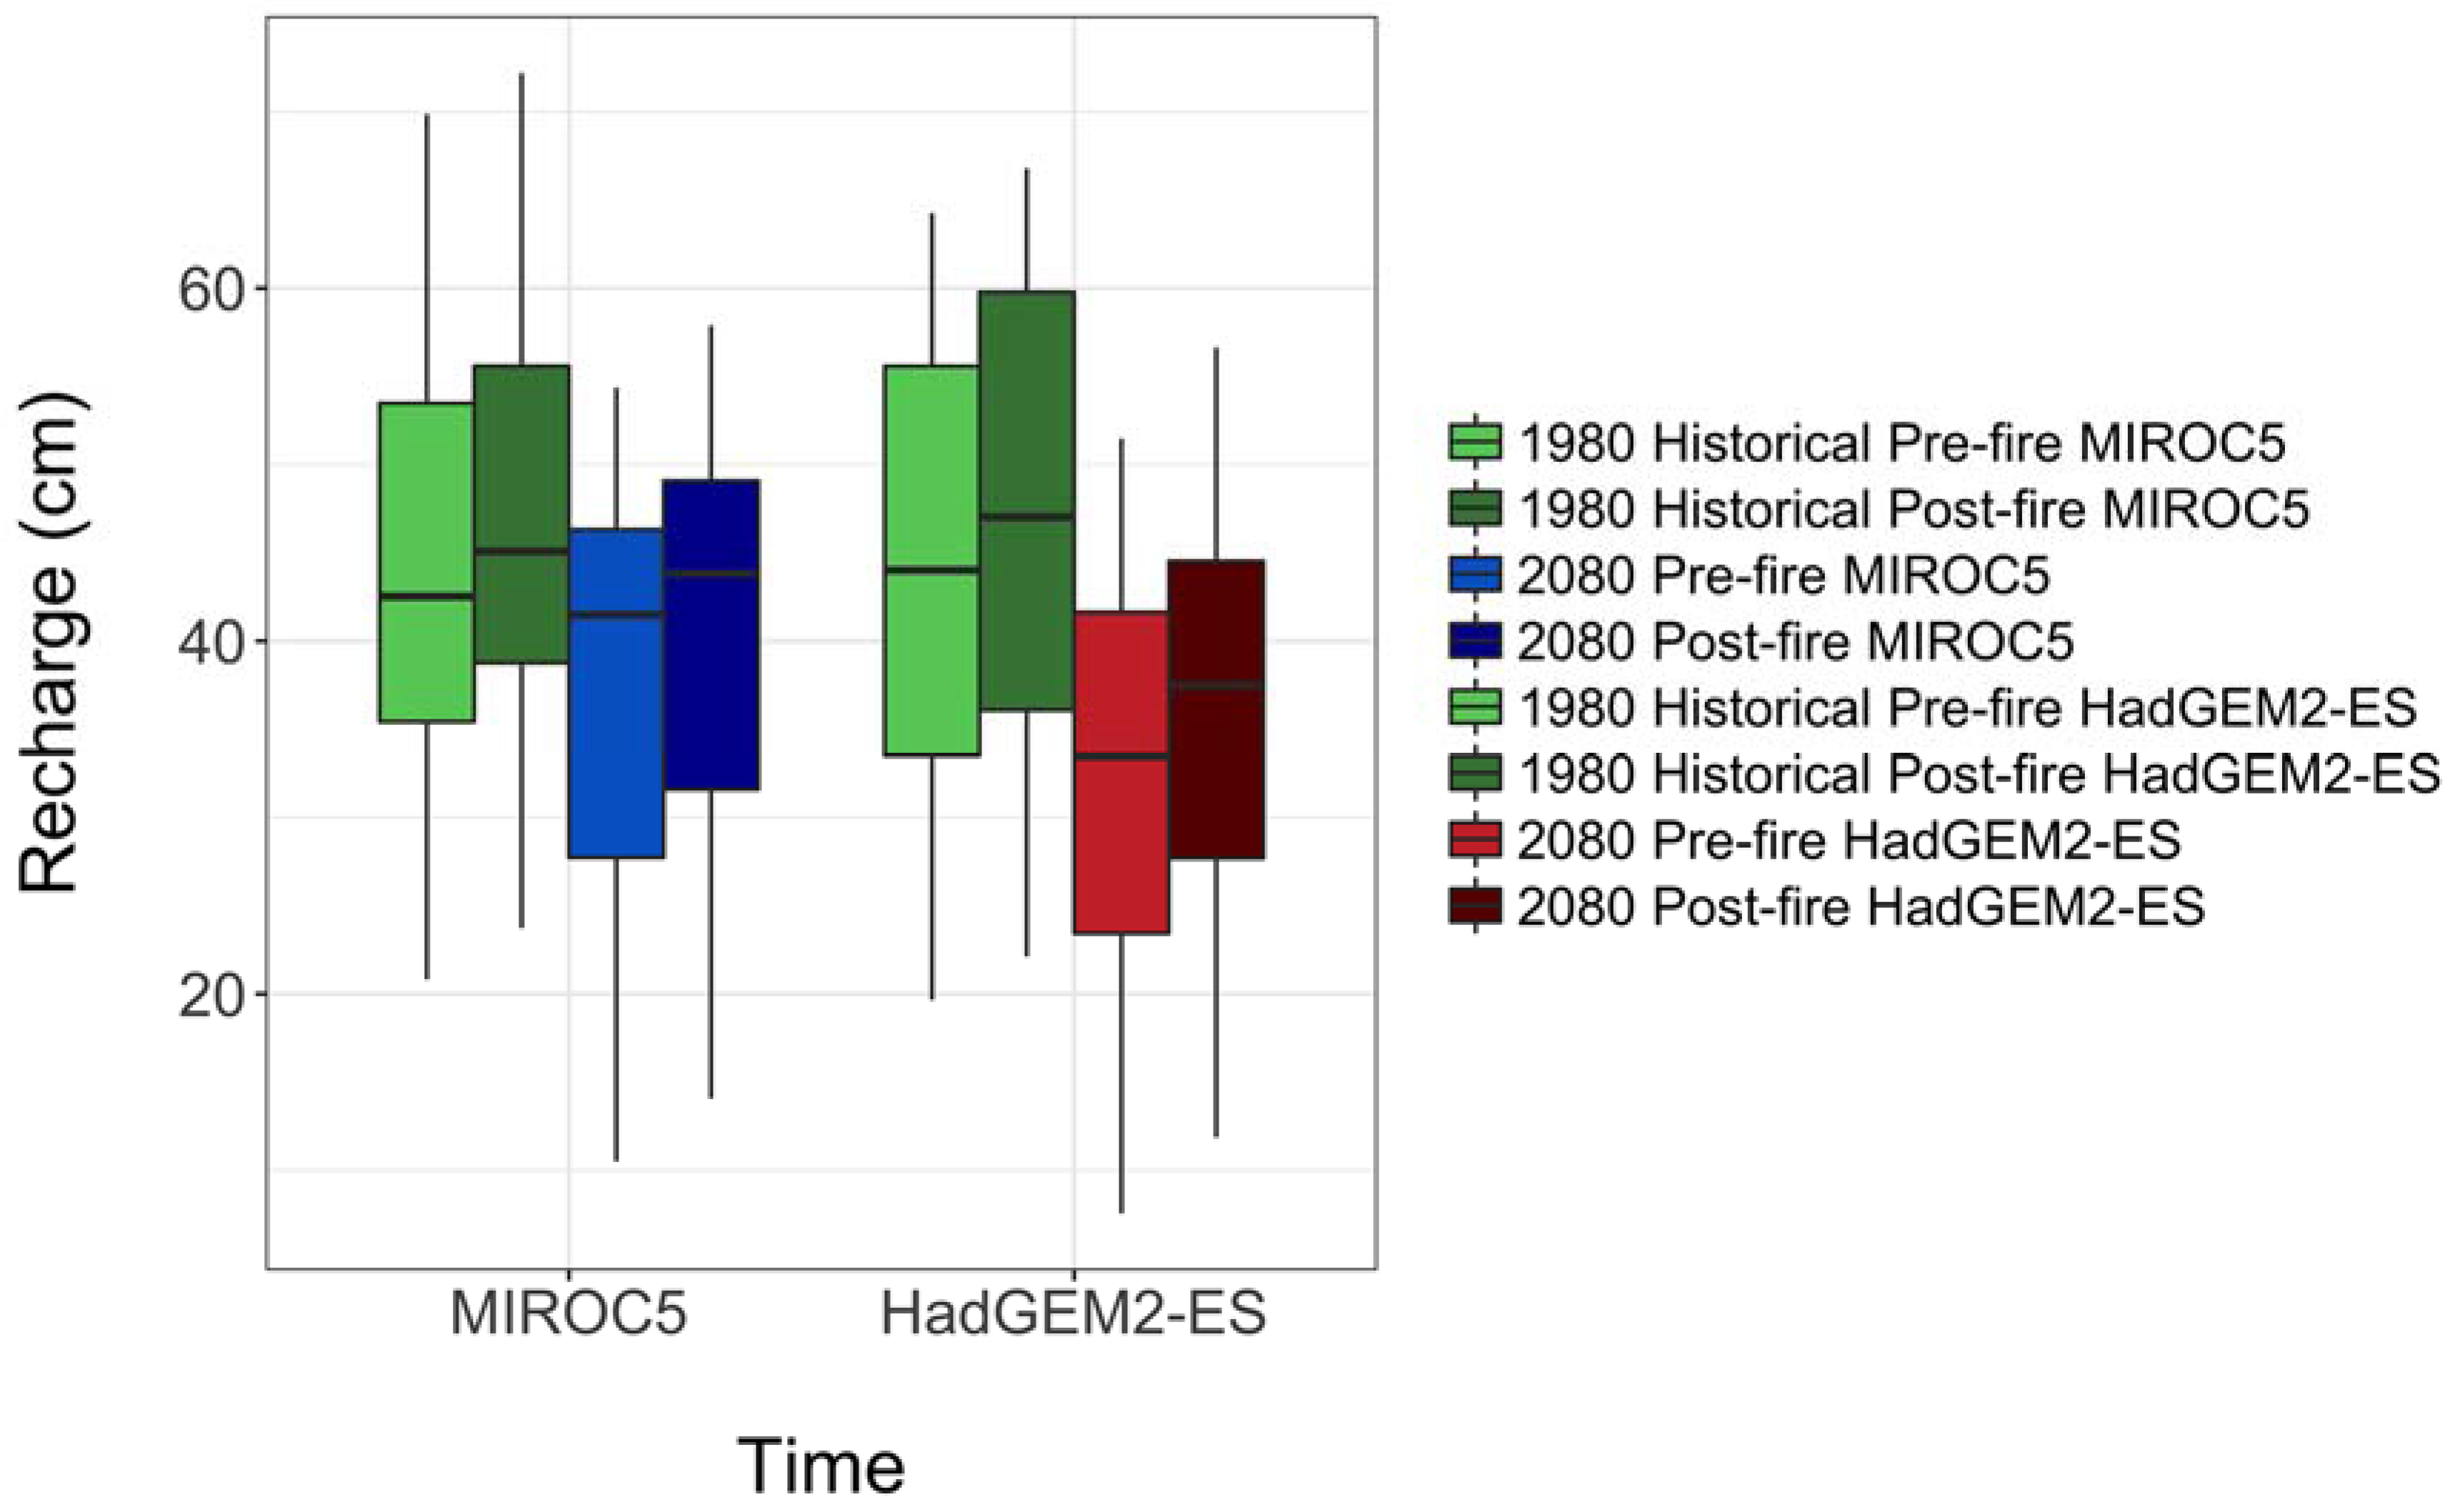
3.7. Potential Recharge after Fire-Burn

Cumulative basin-wide potential recharge after the fire-burn decreases in RCP 4.5 and RCP 8.5 by 14% and 26% in the 2080s in comparison to historical conditions before forest cover reduction (Figure 8; Table 7). After forest cover reduction, recharge decreases 13% and 22% in comparison to historical conditions in the RCP 4.5 and RCP 8.5 scenarios (Table 7). We see a decrease in recharge in the 2080s in both scenarios in comparison to historical conditions, but an increase in recharge after forest cover reduction in comparison to before forest reduction in the 1980s and 2080s (Table 7). Basin-wide recharge is not significantly different between any land cover conditions in RCP 4.5 and between historical pre-fire and historical post-fire, historical pre-fire and post-fire and between pre-fire and post-fire in RCP 8.5. Potential recharge is significantly different between historical pre-fire and future pre-fire, historical pre-fire and future post-fire and between future pre-fire and future post-fire in RCP 8.5. Ensemble mean basin recharge decreases 14% in the 2080s in RCP 8.5 and is exceeded in decrease by HadGEM2-ES before and after forest cover reduction (Table 7). We observe a slight increase in recharge after forest cover reduction in the 1980s and 2080s in both scenarios.

4. Discussion

4.1. Caveats of Modeling

Model calibration may have been improved with a second stream gage located upstream on Meacham Creek, a tributary to the Umatilla River that provides a little over 50% of summer flows [60]. This would have required a second calibration. Consumptive use, which includes irrigation, municipal and domestic needs [61], was deemed negligible because diversions at the USGS stream gage, Umatilla River West Reservation Boundary near Pendleton, are minimal to total volume of streamflow [62]. The temporal and spatial behavior of groundwater in a heterogeneous geologic structure of the CRBGs could not be delineated with PRMS alone and is beyond the scope of this study. The CRBGs as a part of the Columbia Plateau Regional Aquifer System (CPRAS) cover 70,811 km2 and warrant a regional approach in understanding groundwater behavior [63].

4.2. Temperature and Precipitation

A projected warming rate in the western U.S. is 0.1–0.6 °C per decade [64]. In the URB, there is high uncertainty and variability across the GCMs as can be seen in the wide variation of temperature and precipitation change throughout the 21st century (Figure 3). Mean temperature increases 3.3 °C by the end of the century in RCP 8.5, similar to a +3.2 °C increase by the 2080s predicted by Chang and Jung [8], in the Willamette River, OR. Dickerson-Lange and Mitchell [62], predicted a 1.8–3.5 °C mean increase in spring and summer temperatures by the 2050s in one scenario in northwestern Washington. Precipitation is variable in summer flows and increases as much as 11.3% in RCP 8.5 by the end of the century in the URB (Figure 3), where a 15%–21% increase is seen in northwestern WA in two models [64]. This is in agreement with Vynee et al. [65], who observed approximately a 10%–18% increase in precipitation by the mid and end of the century in the URB. With increased temperatures and less snow to hold increased precipitation, the frequency and magnitude of floods are predicted to increase [64].

4.3. Snow Water Equivalent and Precipitation

April 1 SWE is a function of winter accumulation and ablation. SWE/P substantially decreases with each time period, indicating a hydrologic regime shift from a snow-rain-dominated to a rain-dominated basin. This is consistent with predictions in the Pacific Northwest [5,14,64,65,66,67,68]. Vynee et al. [65] predicted SWE to decrease more than 50% by the 2080s in the URB. A considerable change in basin area-weighted SWE has been observed to affect mid-elevation areas in the rain and snow transition zone [15]. In post-fire conditions, there is a substantial decrease in SWE in the 2080s for both land cover conditions, a decrease of greater than 90%. This could be due to varying energy balances at the land and atmosphere interface, including radiative fluxes and changes in albedo, which can significantly influence the melting snow rate and the intensity of reflection by snow cover. Albedo was observed to be higher after a forest fire and lower after afforestation [68]. Further analysis of montane snowpacks that store winter precipitation and provide water for the rest of the year is required for climate adaptation planning in dam water releases and flood control [27].

4.4. Runoff Behavior

Precipitation and temperature are the main drivers of the magnitude and timing of streamflow [64]. At the end of the 21st century, after forest cover reduction, ensemble mean CT occurs earlier in the year by five weeks in RCP 4.5 and by 4.1 weeks in RCP 8.5. Post-fire parameters, including an 80% decrease in both summer and winter cover density and a 40% increase in the solar radiation transmission coefficient (Table 1), may have more effect on peak discharge during individual precipitation events than CT. Runoff trends, even if subtle, can be detrimental to fish habitat and growing seasons of wheat and green peas in the URB, for instance.
At the end of the 21st century, seasonal variability of ensemble winter flows is projected to increase (up to 98%) with decreases in summer flows (up to 65% reduction). Forest cover reduction is projected to amplify this variability further, with increases in winter flows by 85% in RCP 4.5 and 72% in RCP 8.5 in the UIR in particular (Table 4). An increase in the ratio of winter rainfall to winter snowfall is observed here, where precipitation is not being held in the snowpack due to warming temperatures as seen across the western United States. Jung and Chang [5] observed negative runoff trends in the spring and summer and positive trends in the fall and winter in the Willamette River Basin, OR. Similarly, Dickerson-Lange [64] observed increases in winter discharge from 34%–60% by midcentury and decreases in summer flows from −20% to −30% in Northwestern, WA. In the Deschutes Basin in central Oregon, winter flows are projected to increase 80%–115% in the Cascade Range [4].

4.5. Potential Basin Recharge and Base-Flow

A decrease in recharge after forest cover reduction in both scenarios in the 2080s, but not greater than historic conditions, may be due to decreased canopy interception and less evaporation occurring at the watershed surface with an increased potential for infiltration to occur, contributing to basin recharge. The ensemble mean of basin recharge is projected to remain within the range of historic levels before forest cover reduction with slight declines throughout the 21st century. It is most likely that fire-burned areas are relatively small compared to the whole basin area, and the recharge rate may vary over space with the shift in climate as reported in other Oregon watersheds in a semi-arid climate [4]. Historic mean basin recharge is 42 cm/year, within range of previous studies of 2.0 to 36.0 cm/year [21,69]. After forest cover reduction, mean recharge decreases by 1.9 cm in RCP 4.5 and decreases 6.71 cm in RCP 8.5 in comparison to historic conditions.
Quantifying groundwater is difficult due to the spatial and temporal variability of water below the subsurface [4]. The estimation of aquifer recharge and groundwater availability is critical to water management to meet domestic, municipal and ecological needs. The decline of groundwater levels in the URB has been addressed by The City of Pendleton, where the Aquifer Storage and Recovery program (ASR) lowered the city’s dependence on groundwater from 62% down to 3%. Since then, groundwater declines were observed to be 340 cm/year and down to 200 cm/year after ASR was implemented in 2004 [70].

4.6. Future Work

PRMS files may be adapted to combine with the Modular Groundwater Flow Model (MODFLOW), a numerical groundwater model, to input to the Groundwater and Surface-Water Flow Model (GSFLOW), a coupled groundwater and surface-water flow model, to increase the understanding of the spatial and temporal behavior of groundwater. A dynamic global vegetation model may help identify parameters that account for regrowth, burn severity and intensity, to improve the understanding of the effects of fire-burns on a watershed system. Soil water repellence for example, has been found to last anywhere from one–six years, where a shorter temporal scale may best capture watershed response to fire [71,72]. Spatial analysis at a finer scale will only enhance localized efforts for the management of ecosystem services.

5. Conclusions

Increasing global mean temperature and changing precipitation are driving factors in runoff behavior. The uncertainty in the effects of climatic change and variability and anthropogenic influences on a hydrologic regime make it imperative to study their effects on natural resources. Using PRMS, a runoff model was calibrated for the upper URB, to characterize trends in runoff, snowpack, recharge and other components of the water budget to understand water availability in a changing climate and forest cover reduction. The effects of fire and climate shifts on runoff behavior are largely understudied in the URB, making this study unique.
A hydrologic regime shift is observed in the URB, from a snow-rain-dominated to a rain-dominated basin, as observed in SWE/P, as an important metric that shows increased sensitivity to climactic change in the URB throughout the 21st century before and after forest cover reduction. The ratio of SWE/P is shown to significantly decrease in both scenarios across the century before forest cover reduction. After forest cover reduction, similar trends in mean CT, seasonal flows and SWE/P are observed with a substantial decrease in SWE/P and an increase in winter flows in RCP 4.5 in the 2080s.
Mean basin recharge is sustained throughout the 21st century with slight declines in each subsequent time period before forest cover reduction, while after post-fire simulation, basin recharge is projected to increase. Due to the complexity of groundwater behavior in the CRBGs, basin recharge should be explored further with a numerical groundwater flow model.
This study provides further insight to secure freshwater resources for ecosystem function and cultural resources in the URB. Runoff modeling is a valuable tool to inform water and natural resources management to improve adaptive capacity, including flood control, dam releases and in-stream flow restoration practices.

Acknowledgments

The research was funded by the Geology Foundation at Portland State University and the Intertribal Timber Council. We appreciate John Risley of the U.S. Geological Survey and Professors Joseph Maser and Scott Burns of Portland State University for their careful reviews of the initial version of this manuscript. We thank Kate Ely, with Department of Natural Resources Water Resources Program at Confederated Tribes of the Umatilla Indian Reservation, for providing background materials on the study area. We also thank Mathew Dorfman, with the City of Portland, Environmental Services, for review of statistical analysis. The views expressed are our own and do not necessarily reflect those of sponsoring agencies.

Author Contributions

Kimberly Yazzie and Heejun Chang conceived of and designed the hydrologic modeling and analyses. Kimberly Yazzie performed the modeling and analyses. Kimberly Yazzie and Heejun Chang interpreted the results and wrote the paper.

Conflicts of Interest

The authors declare no conflict of interest. The founding sponsors had no role in the design of the study; in the collection, analyses or interpretation of data; in the writing of the manuscript; nor in the decision to publish the results.

Appendix A

Table A1. Global climate models (GCM) used in this study. The ensemble mean was taken of all ten GMCs. MIROC5 and HadGEM2-ES were used for forest cover reduction analysis.
Model NameModel AgencyCountry
CNRM-CM5Natl. Centre of Meteorological Res.France
HadGEM2-ESMet Office Hadley Ctr.UK
CanESM2Canadian Ctr. for Climate Modeling & AnalysisCanada
MIROC5Atmosphere & Ocean Res. Inst, Japan & Natl. Inst. for Env. Studies, Japan Agency for Marine-Earth Sci. and Tech.Japan
NorESM1-MNorwegian Climate Ctr.Norway
CSIRO-Mk3.6.0Commonwealth Sci. & Industrial Res. Org./Queensland Climate Change Ctr. of ExcellenceAustralia
MRI-CGCM3Meteorological Res. Inst. Japan
INM-CM4Inst. for Numerical MathematicsRussia
BCC-CSM1.1Beijing Climate Ctr., China Meteorological Admin.China
GFDL-ESM2MNOAA Geophysical Fluid Dynamics LaboratoryUSA
Table A2. Datasets, models and tools used for model parameters and data analysis.
DataResolutionSource
Historic Climate Data4 kmAbatzaglou (2012)
Future Climate Data4 kmAbatzaglou (2012)
Streamflow: U.S. Geological Survey Stream Gage 14020850 USGS (2013)
Soils: NRCS State Soils Geographic30 mSTATSGO (2013)
Land Use and Land Cover: Nat’l Land Cover Data30 mUSGS (2013)
DEM: National Elevation Dataset30 mUSGS (2013)
Point data and acres burned in the URB U.S. Forest Service, Umatilla Natl. Forest
Models and ToolsVersion
Precipitation Runoff Modeling System (PRMS)3.0.5USGS (2013)
Geo Data Portal (GDP) USGS (2013)
Let Us Calibrate (LUCA) USGS (2013)
Web-based Hydrograph Analysis Tool Purdue University (2015)
Table A3. Final model parameters used after calibration.
StepCalibration DatasetParameter NameFinal ValueParameter Range
1Water Balancerain_cbh_adj_mo1.1280.6–1.4
snow_cbh_adj_mo 1.40.6–1.4
2Daily Flow Timing (all flows)adjmix_rain_hru_mo0.4–1.40.6–1.4
cecn_coef2.122.0–10.0
emis_noppt0.9750.76–1.0
freeh2o_cap0.0190.01–0.2
K_coef23.8591–24.0
potet_sublim0.5410.1–0.75
slowcoef_lin0.0040.001–0.5
soil_moist_max2.14–12.5372–10
soil_rechr_max1.6431.5–5
tmax_allrain_hru_mo22–5234–45
tmax_allsnow_hru3730–40
3Daily Flow Timing (high flows)fastcoef_lin0.0050.001–0.8
pref_flow_den0.10–0.1
sat_threshold3.031–13.9551.0–15.0
smidx_coef0.0010.001–0.06
4Daily Flow Timing (low flows)gwflow_coef0.0240.001–0.1
soil2gw_max0.1030–0.5
ssr2gw_rate0.5820.05–0.8
gwflow_coef0.0240.001–0.5
gwsink_coef0.020.0–0.05
soil2gw_max0.1030–0.5
ssr2gw_rate0.5820.05–0.8
soil_moist_max 2.14–12.5372–10
slowcoef_sq0.1610.05–0.3

References

  1. Oki, T.; Kanae, S. Global hydrological cycles and world water resources. Science 2006, 313, 1068–1072. [Google Scholar] [CrossRef] [PubMed]
  2. Kundzewicz, Z.W.; Mata, L.J.; Arnell, N.W.; Doll, P.; Kabat, P.; Jimenez, B.; Miller, K.A.; Oki, T.; SÍn, Z.; Shiklomanov, I.A. Freshwater resources and their management. In Impacts, adaptation and vulnerability. Contribution of Working Group II to the Fourth Assessment Report of the Intergovernmental Panel on Climate Change; Parry, M.L., Canziani, O.F., Palutikof, J.P., van der Linden, P.J., Hanson, C.E., Eds.; Cambridge University Press: Cambridge, UK, 2007; pp. 173–210. [Google Scholar]
  3. Qi, S.; Sun, G.; Wang, Y.; Mcnulty, S.; Myers, J. Streamflow response to climate and landuse changes in a coastal watershed in North Carolina. Trans. ASABE 2009, 52, 739–749. [Google Scholar] [CrossRef]
  4. Waibel, M.S.; Gannett, M.W.; Chang, H.; Hulbe, C.L. Spatial variability of the response to climate change in regional groundwater systems—Examples from simulations in the Deschutes Basin, Oregon. J. Hydrol. 2013, 486, 187–201. [Google Scholar] [CrossRef]
  5. Jung, Il-W.; Chang, H. Assessment of future runoff trends under multiple climate change scenarios in the Willamette River Basin, Oregon, USA. Hydrol. Process. 2011, 25, 258–277. [Google Scholar] [CrossRef]
  6. Hamlet, A.F.; Lettenmaier, D.P. Effects of 20th century warming and climate variability on flood risk in the western U.S. Water Resour. Res. 2007, 43, 1–17. [Google Scholar] [CrossRef]
  7. Abatzoglou, J.T.; Rupp, D.; Mote, P. Understanding seasonal climate variability and change in the Pacific Northwest of the United States. J. Clim. 2014, 27, 2125–2142. [Google Scholar] [CrossRef]
  8. Chang, H.J.; Jung, I.W. Spatial and temporal changes in runoff caused by climate change in a complex large river basin in Oregon. J. Hydrol. 2010, 388, 186–207. [Google Scholar] [CrossRef]
  9. Elsner, M.; Cuo, L.; Voisin, N.; Deems, J.; Hamlet, A.; Vano, J.; Mickelson, K.; Lee, S.; Lettenmaier, D. Implications of 21st century climate change for the hydrology of Washington State. Clim. Chang. 2010, 102, 225–260. [Google Scholar] [CrossRef]
  10. Hamlet, A.F.; Carrasco, P.; Deems, J.; Elsner, M.M.; Kamstra, T.; Lee, C.; Mauger, G.; Salathe, E.P.; Tohver, I.; Whitely Binder, L. Final Project Report for the Columbia Basin Climate Change Scenarios Project. 2010. Available online: http://warm.astmos.washington.edu/2860/report/ (accessed on 1 August 2015).
  11. Surfleet, C.G.; Tullos, D.; Chang, H.; Jung, I.-W. Selection of hydrologic modeling approaches for climate change assessment: A comparison of model scale and structures. J. Hydrol. 2012, 464–465, 233–248. [Google Scholar] [CrossRef]
  12. Knowles, N.; Dettinger, M.D.; Cayan, D.R. Trends in snowfall versus rainfall in the western United States. J. Clim. 2006, 19, 4545–4559. [Google Scholar] [CrossRef]
  13. Abatzoglou, J.T. Influence of the PNA on declining mountain snowpack in the Western United States. Int. J. Climatol. 2011, 31, 1135–1142. [Google Scholar] [CrossRef]
  14. Mote, P.W.; Hamlet, A.F.; Clark, M.P.; Lettenmaier, D.P. Declining mountain snowpack in western North America. Bull. Am. Meteorol. Soc. 2005, 86, 6. [Google Scholar] [CrossRef]
  15. Mastin, M.C.; Chase, K.J.; Dudley, R.W. Changes in spring snowpack for selected basins in the United States for different climate-change scenarios. Earth Interact. 2011, 15, 1–18. [Google Scholar] [CrossRef]
  16. Mote, P.W.; Parson, E.A.; Hamlet, A.F.; Keeton, W.S.; Lettenmaier, D.; Mantua, N.; Miles, E.L.; Peterson, D.W.; Peterson, D.L.; Slaughter, H.; et al. Preparing for climatic change: The water, salmon, and forests of the Pacific Northwest. Clim. Chang. 2003, 61, 45–88. [Google Scholar] [CrossRef]
  17. Jung, I.; Chang, H. Climate change impacts on spatial patterns in drought risk in the Willamette River Basin, Oregon, USA. Theor. Appl. Climatol. 2011, 108, 355–371. [Google Scholar] [CrossRef]
  18. Drost, B.; Whiteman, K.J. Washington Department of Ecology. In Surficial Geology, Structure, and Thickness of Selected Geohydrologic Units in the Columbia Plateau, Washington; U.S Geological Survey Water-Resources Investigations Report 84–4326; Washington Department of Ecology: Tacoma, DC, USA, 1986. [Google Scholar]
  19. Vaccaro, J.J. Plan of Study for the Regional Aquifer-System Analysis, Columbia Plateau, Washington, Northern Oregon, and Northwestern Idaho Water-Resources Investigations Report 85-4151; U.S. Department of the Interior, U.S. Geological Survey: Tacoma, WA, USA, 1986.
  20. Tolan, T.L.; Reidel, S.P.; Beeson, M.H.; Anderson, J.L.; Fecht, K.R.; Swanson, D.A. Revisions to the areal extent and volume of the Columbia River Basalt Group (CRBG). Geol. Soc. Am. 1987, 19, 458. [Google Scholar]
  21. Bauer, H.H.; Vaccaro, J.J. Estimates of Groundwater Recharge to the Columbia Plateau Regional Aquifer System, Washington, Oregon, and Idaho, for Predevelopment and Current Land-Use Conditions Water Resources Investigations Report 88–4108; U.S. Geological Survey: Tacoma, WA, USA, 1990.
  22. Chang, H.; Psaris, M. Local landscape predictors of maximum stream temperature and thermal sensitivity in the Columbia River Basin, USA. Sci. Tot. Environ. 2013, 461–462, 587–600. [Google Scholar] [CrossRef] [PubMed]
  23. Burns, E.R.; Snyder, D.T.; Haynes, J.V.; Waibel, M.S. Groundwater status and trends for the Columbia Plateau Regional Aquifer System, Washington, Oregon, and Idaho Scientific Investigations Report 2012–5261. U.S. Department of the Interior, U.S. Geological Survey, 2012. Available online: http://pubs.er.usgs.gov/publications/sir20125261 (accessed on 1 September 2013). [Google Scholar]
  24. Hansen, A.J.; Vaccaro, J.J.; Bauer, H.H. Ground-Water Flow Simulation of the Columbia Plateau Regional Aquifer System, Washington, Oregon, and Idaho Water-Resources Investigations Report 91–4187; U.S. Department of the Interior, U.S. Geological Survey: Tacoma, WA, USA, 1994.
  25. Moody, J.A.; Martin, D.A. Post-fire, rainfall intensity—Peak discharge relations for three mountainous watersheds in the western USA. Hydrol. Process. 2001, 15, 2981–2993. [Google Scholar] [CrossRef]
  26. Vieira, D.; Fernández, C.; Vega, J.; Keizer, J. Does soil burn severity affect the post-fire runoff and interrill erosion response? A review based on meta-analysis of field rainfall simulation data. J. Hydrol. 2015, 523, 452–464. [Google Scholar] [CrossRef]
  27. Cerda, A. Post-fire dyamics of erosional processes under mediterranean climatic conditions. Z. Feur Geomorphol. Neue Folge 1998, 42, 373–398. [Google Scholar]
  28. Martin, D.A.; Moody, J.A. Comparison of soil infiltration rates in burned and unburned mountainous watersheds. Hydrol. Process. 2001, 15, 2893–2903. [Google Scholar] [CrossRef]
  29. Robichaud, P.R. Measurement of post-fire hillslope erosion to evaluate and model rehabilitation treatment effectiveness and recovery. Int. J. Wildland. Fire 2005, 14, 475–485. [Google Scholar] [CrossRef]
  30. Turner, D.P.; Conklin, D.R.; Bolte, J.P. Projected climate change impacts on forest land cover and land use over the Willamette River Basin, Oregon, USA. Clim. Chang. 2015, 133, 335. [Google Scholar] [CrossRef]
  31. Rulli, M.C.; Offeddu, L.; Santini, M. Modeling post-fire water erosion mitigation strategies. Hydrol. Earth Syst. Sci. 2013, 17, 2323–2337. [Google Scholar] [CrossRef]
  32. Terranova, O.; Antronico, L.; Coscarelli, R.; Iaquinta, P. Soil erosion risk scenarios in the Mediterranean environment using RUSLE and GIS: An application model for Calabria (Southern Italy). Geomorphology 2009, 112, 228–245. [Google Scholar] [CrossRef]
  33. Sheehan, T.; Bachelet, D.; Ferschweiler, K. Projected major fire and vegetation changes in the Pacific Northwest of the conterminous United States under selected CMIP5 climate futures. Ecol. Model. 2015, 317, 16–29. [Google Scholar] [CrossRef]
  34. Oregon Water Resources Department. Available online: https://www.oregon.gov/owrd/Pages/law/integrated_water_supply_strategy.aspx (accessed on 15 October 2015).
  35. Umatilla River Subbasin Local Advisory Committee, Oregon State Deptartment of Agriculture, & Umatilla Soil Water Conservation District. Umatilla Agricultural Water Quality Management Area Plan; The Umatilla Local Advisory Committee: Umatilla, FL, USA, 2012.
  36. Ely, K. Water Resources Status, A Study of the Water Resources Availability and Demand in the Umatilla River Basin, Oregon; U.S. Bureau of Indian Affairs: Pendleton, OR, USA, 2001.
  37. Jones, K.L.; Poole, G.C.; Quaempts, E.J.; O’Daniel, E.; Beechie, T. Umatilla River Vision Report. 2008. Available online: http://ctuir.org/DNRUmatillaRiverVision.pdf (accessed on 1 September 2013).
  38. Hughes, M. Channel Change of the Upper Umatilla River during and between Flood Periods: Variability and Ecological Implications. Ph.D. Thesis, University of Oregon, Eugene, OR, USA, 2008. [Google Scholar]
  39. Ely, K. Groundwater and surface water are they related? Confed. Umatilla J. 2012, 16, 31. [Google Scholar]
  40. U.S. Forest Service. Umatilla and Meacham Ecosystem Analysis; USDA Forest Service Pacific Northwest Region Umatilla National Forest: Pendleton, OR, USA, 2001.
  41. Confederated Tribes of the Umatilla Indian Reservation. Forest Management Plan: An Ecological Approach to Forest Management; Mason Bruce & Gerard, Inc. Publication: Bothell, WA, USA, 2010. [Google Scholar]
  42. Homer, C.G.; Dewitz, J.A.; Yang, L.; Jin, S.; Danielson, P.; Xian, G.; Coulston, J.; Herold, N.D.; Wickham, J.D.; Megown, K. Completion of the 2011 national land cover database for the conterminous United States-Representing a decade of land cover change information. Photogr. Eng. Rem. Sens. 2015, 81, 345–354. [Google Scholar]
  43. Markstrom, S.L.; Regan, R.S.; Hay, L.E.; Viger, R.J.; Webb, R.M.T.; Payn, R.A.; LaFontaine, J.H. PRMS-IV, the Precipitation-Runoff Modeling System, Version 4: U.S. Geological Survey Techniques and Methods; U.S. Geological Survey: Reston, VA, USA, 2015.
  44. Abatzoglou, J.T. Development of gridded surface meteorological data for ecological applications and modelling. Int. J. Climatol. 2013, 33, 121–131. [Google Scholar] [CrossRef]
  45. Mitchell, K.E.; Lohmann, D.; Houser, P.R.; Wood, E.F.; Schaake, J.C.; Robock, A.; Cosgrove, B.A.; Sheffield, J.; Duan, Q.; Luo, L.; et al. The multi-institution North American Land Data Assimilation System (NLDAS): Utilizing multiple GCIP products and partners in a continental distributed hydrological modeling system. J. Geophys. Res. 2004, 109, 1–32. [Google Scholar] [CrossRef]
  46. Daly, C.; Halbleib, M.; Smith, J.; Gibson, W.; Doggett, M.; Taylor, G.; Curtis, J.; Pasteris, P. Physiographically sensitive mapping of climatological temperature and precipitation across the conterminous United States. Int. J. Climatol. 2008, 28, 2031–2064. [Google Scholar] [CrossRef]
  47. Abatzoglou, J.T.; Brown, T.J. A comparison of statistical downscaling methods suited for wildfire applications. Int. J. Climatol. 2012, 32, 772–780. [Google Scholar] [CrossRef]
  48. Taylor, K.E.; Stouffer, R.J.; Meehl, G.A. An overview of CMIP5 and the experiment design. Bull. Am. Meteorol. Soc. 2011, 93, 485–498. [Google Scholar] [CrossRef]
  49. Van Vuuren, D.; Edmonds, J.; Kainuma, M.; Riahi, K.; Thomson, A.; Hibbard, K.; Rose, S. The representative concentration pathways: An overview. Clim. Chang. 2011, 109, 5–31. [Google Scholar] [CrossRef]
  50. Blodgett, D.L.; Booth, N.L.; Kunicki, T.C.; Walker, J.L.; Viger, R.J. Description and Testing of the Geo Data Portal: A Data Integration Framework and Web Processing Services for Environmental Science Collaboration; Open-File Report 2011–1157; U.S. Deptartment of Interior, U.S. Geological Survey: Reston, VA, USA, 2011.
  51. Rupp, D.; Abatzoglou, J.; Hegewisch, K.; Mote, P. Evaluation of CMIP5 20th century climate simulations for the Pacific Northwest USA. J. Geophys. Res. 2013, 118, 10884–10906. [Google Scholar]
  52. Mote, P.; Brekke, L.; Duffy, P.; Maurer, E. Guidelines for constructing climate scenarios. EOS Trans. Am. Geophys. Union 2011, 92, 257–258. [Google Scholar] [CrossRef]
  53. Leavesley, G.H.; Lichty, R.W.; Troutman, B.M.; Saindon, L.G. Precipitation Runoff Modeling System: User’s Manual -Water-Resources Investigations Report 83–4238; US Geological Survey: Denver, CO, USA, 1983.
  54. Konrad, C. Simulated Water-Management Alternatives Using the Modular Modeling System for the Methow River Basin, Washington U.S; Geological Survey Open-File Report 2004–1051; U.S. Department of the Interior, U.S. Geological Survey: Denver, CO, USA, 2004.
  55. Ebert, B.U.S.; Forest Service, Pendleton, OR, USA. Personal Communication, 2015.
  56. Hay, L.E.; Umemoto, M. Multiple-Objective Stepwise Calibration Using LUCA: U.S. Geological Survey Open-File Report 2006–1323; US Geological Survey Water-Resources Investigations Report: Washington, DC, USA, 2006.
  57. Krause, P.; Boyle, D.P.; Bäse, F. Comparison of different efficiency criteria for hydrological model assessment. Adv. Geosci. 2005, 5, 89–97. [Google Scholar] [CrossRef]
  58. Moriasi, D.N.; Arnold, J.G.; Van Liew, M.W.; Binger, R.L.; Harmel, R.D.; Veith, T.L. Model evaluation guidelines for systematic quantification of accuracy in watershed simulations. Trans. ASABE. 2007, 50, 885–900. [Google Scholar] [CrossRef]
  59. Gupta, H.; Kling, H.; Yilmaz, K.; Martinez, G. Decomposition of the mean squared error and NSE performance criteria; implications for improving hydrological modelling. J. Hydrol. 2009, 377, 80–91. [Google Scholar] [CrossRef]
  60. Confederated Tribes of the Umatilla Indian Reservation. Meacham Creek Flood Restoration and In-stream Enhancement Project Completion Report; Tetra Tech Inc. Publication: Portland, OR, USA, 2012. [Google Scholar]
  61. Cooper, R.M. Determining Surface Water Availability in Oregon, State of Oregon Water Resources Department, Open File Report SW 02-002; State of Oregon, Water Resources Department: Salem, OR, USA, 2002.
  62. Ely, K.; Department of Natural Resources, Confederated Tribes of the Umatilla Indian Reservation, Pendleton, OR, USA. Personal Communication, 2013.
  63. Cherkauer, D. Quantifying ground water recharge at multiple scales using PRMS and GIS. Ground Water 2004, 42, 97–110. [Google Scholar] [CrossRef] [PubMed]
  64. Dickerson-Lange, S.; Mitchell, R. Modeling the effects of climate change projections on streamflow in the Nooksack River Basin, Northwest Washington. Hydrol. Process. 2014, 28, 5236–5250. [Google Scholar] [CrossRef]
  65. Stacy, V.; Reder, B.; Hamilton, R.; Doppelt, B.; Dello, K.; Sharp, D. Projected Future Conditions in the Umatilla River Basin of Northeast Oregon; Report: Oregon Climate Change Research Institute, Climate Leadership Initiative Institute for a Sustainable Environment; University of Oregon: Eugen, OR, USA, 2010. [Google Scholar]
  66. Stewart, I.T.; Cayan, D.R.; Dettinger, M.D. Changes toward earlier streamflow timing across western North America. J. Clim. 2005, 18, 1136–1155. [Google Scholar] [CrossRef]
  67. Hamlet, A.F. Assessing water resources adaptive capacity to climate change impacts in the Pacific Northwest Region of North America. Hydrol. Earth Syst. Sci. 2011, 15, 1427–1443. [Google Scholar] [CrossRef]
  68. Safeeq, M.; Grant, G.; Lewis, S.; Tague, C. Coupling snowpack and groundwater dynamics to interpret historical streamflow trends in the western United States. Hydrol. Process. 2013, 27, 655–668. [Google Scholar] [CrossRef]
  69. Spane, F.; Webber, W. Hydrochemistry and Hydrogeologic Conditions within the Hanford Site Upper Basalt Confined Aquifer System; PNNL-10817; U.S. Department of Energy: Richland, WA, USA, 1995.
  70. Pendleton Public Works Water Division. City of Pendleton Water Management Plan; Pendleton Public Works Water Division: Pendleton, OR, USA, 2010. [Google Scholar]
  71. MacDonald, L.; Huffman, E. Post-fire soil water repellency; persistence and soil moisture thresholds. Soil Sci. Soc. Am. J. 2004, 68, 1729–1734. [Google Scholar] [CrossRef]
  72. Henderson, G.; Golding, D. The effect of slash burning on the water repellency of forest soils at Vancouver, British Columbia. Can. J. For. Res. 1983, 13, 353–355. [Google Scholar] [CrossRef]
Figure 1. The study site is 2365 km2 in the upper Umatilla River Basin in northeastern Oregon.
Climate 05 00007 g001
Figure 2. (a) Annual mean temperature for all global climate models (GCMs) for Representative Concentration Pathway (RCP) 4.5 with the ensemble mean in black. (b) Annual mean temperature for all GCMs for RCP 8.5.
Climate 05 00007 g002
Figure 3. Change of temperature and annual percent change in precipitation in comparison to historical conditions for all GCMs.
Climate 05 00007 g003
Figure 4. Change in seasonal temperature (T) and percent change in precipitation (P) for all GCMs in comparison to historical records.
Climate 05 00007 g004
Figure 5. Mean center timing (CT) of flow for MIROC5 in RCP 4.5 and HadGEM2-ES in RCP 8.5 before and after forest cover reduction in comparison to historic conditions.
Climate 05 00007 g005
Figure 6. Seasonal flows for MIROC5 in RCP 4.5 and HadGEM2-ES in RCP 8.5 before and after forest cover reduction in comparison to historic conditions.
Climate 05 00007 g006
Figure 7. Ratio of snow water equivalent to precipitation for MIROC5 in RCP 4.5 and HadGEM2-ES in RCP 8.5 before and after forest cover reduction in comparison to historic conditions.
Climate 05 00007 g007
Figure 8. Potential mean basin recharge for MIROC5 in RCP 4.5 and HadGEM2-ES in RCP 8.5 before and after forest cover reduction in comparison to historic conditions.
Climate 05 00007 g008
Table 1. Initial and assigned model parameter values for forest cover reduction analysis.
DescriptionInitialAssigned% Δ
COVDEN_SUMSummer vegetation cover density0.50.1−80%
COVDEN_WINWinter vegetation cover density0.50.1−80%
RAD_TRNCFSolar radiation transmission0.30.540%
SOIL_RECHR_MAXMax. storage for soil recharge zone1.6430.55−67%
SOIL_MOIST_MAXMax. value of water for soil zone2.14–12.5371.08−50%
Table 2. Final model goodness of fit statistics based on daily streamflow for Nash-Sutcliffe efficiency (NSE), Percent Bias (PBIAS), Kling–Gupta efficiency (KGE), and Normalized RMSE (NRMSE).
NSE% BiasKGENRMSE
Initial Model Results0.0440.5797.7
After Calibration (1995–2010)0.733.50.8152.2
Validation (2010–2014)0.733.50.8352.1
Table 3. Ensemble mean center timing (CT) of flow before forest cover reduction in historical conditions (1980s), in the 2050s and in the 2080s, in comparison to MOROC5 in RCP 4.5 and HadGEM2-ES in RCP 8.5 in the 2080s before and after forest cover reduction.
Ensemble MeanMIROC5HadGEM2-ES
Hist.RCP 4.5RCP 8.5RCP 4.5RCP 8.5
1980s2050s2080s2050s2080sPre 1980sPost 1980sPre 2080sPost 2080sPre 1980sPost 1980sPre 2080sPost 2080s
Δ in days in μ CT6/23 1755/31 1525/27 1485/29 1505/22 1436/29 1816/24 1765/23 1445/20 1416/20 1726/17 1695/21 1425/19 140
σ17.3214.7615.8316.2315.7217.2617.1514.0716.2615.3213.7714.2314.04
Table 4. Seasonal flows before and after forest cover reduction in the 1980s and 2080s for MIROC5 in RCP 4.5 and HadGEM2-ES in RCP 8.5.
MIROC5 HadGEM2-ES
1980s Hist.2080s RCP 4.51980s Hist.2080s RCP 8.5
Pre-firePost-firePre-firePost-firePre-firePost-firePre-firePost-fire
μ Runoff (cm3/s)WTRSMRWTRSMRWTRSMRWTRSMRWTRSMRWTRSMRWTRSMRWTRSMR
15.938.8417.228.3030.682.4731.992.6618.957.1220.366.7733.921.9335.032.23
Min1.532.342.072.034.770.866.150.951.781.012.321.126.330.328.170.39
Max8.3619.5739.3118.3860.016.9160.387.542.6620.344.7918.7180.299.1780.549.78
% Δ 92.59−72.0685.77−67.95 79.00−72.8972.05−67.06
σ9.715.139.864.7212.351.5612.161.688.674.678.744.2716.432.0116.112.25
WTR = winter; SMR = summer.
Table 5. Ensemble mean seasonal flows before forest cover reduction in the 1980s, 2050s, and 2080s.
Ensemble Mean
Hist.RCP 4.5RCP 8.5
1980s2050s2080s2050s2080s
μ Runoff (cm3/s)WTRSMRWTRSMRWTRSMRWTRSMRWTRSMR
17.696.91629.263.5130.333.2730.633.3535.362.37
Min10.34.74621.741.9924.302.0922.402.2027.991.54
Max25.2610.09236.284.6939.025.1344.505.1344.743.48
% Δ 65.40−49.2471.45−52.7173.14−51.5698.89−65.73
σ3.971.323.550.613.380.724.820.984.190.50
WTR = winter; SMR = summer.
Table 6. Ensemble mean of snow water equivalent to precipitation (SWE/P) before forest cover reduction, and SWE/P before and after forest cover reduction for MIROC5 in RCP 4.5 and HadGEM2-ES in RCP 8.5.
Ensemble MeanMIROC5 RCP 4.5HadGEM2-ES RCP 8.5
Hist.RCP 4.5RCP 8.5Pre-firePost-firePre-firePost-firePre-firePost-firePre-firePost-fire
1980s2050s2080s2050s2080s1980s1980s2080s2080s1980s1980s2080s2080s
μ SWE (cm)6.61.971.371.430.728.408.041.331.156.384.420.080.05
μ P (cm)75.779.2378.1979.4681.0877.2077.2079.7479.7476.9677.1479.8979.89
μ SWE/P0.080.020.0150.0160.00720.110.1040.020.010.080.0790.0010.00626
% Δ −75.0−81.25−80.0−91.0 −81.81−90.3 −98.75−99.20
σ0.0590.0270.0260.0240.0290.0690.0690.0290.0280.0540.0560.0030.002
Table 7. Ensemble mean of potential basin recharge before forest cover reduction, and potential basin recharge before and after forest cover reduction in RCP 4.5 and RCP 8.5 scenarios.
Ensemble MeanMIROC5HadGEM2-ES
Hist.RCP 4.5RCP 8.5Pre-firePost-firePre-firePost-firePre-firePost-firePre-firePost-fire
1980s2050s2080s2050s2080s1980s1980s2080s2080s1980s1980s2080s2080s
μ Recharge42.7740.7138.3639.6036.4644.5547.2037.8940.8743.7346.5432.1436.06
Min15.238.296.636.036.3120.8223.7310.514.0719.6522.117.5511.87
Max72.7975.6277.6070.6375.0969.8872.2054.3657.8864.2666.7951.4856.65
% Δ −4.82−10.31−7.41−14.75 −14.95−13.41 −26.50−22.51
σ11.1912.0711.3411.7511.4412.9612.7511.1110.8613.7513.7911.6511.59

