
Hydro-Climatic Variability in the Karnali River Basin of Nepal Himalaya


Abstract
:1. Introduction
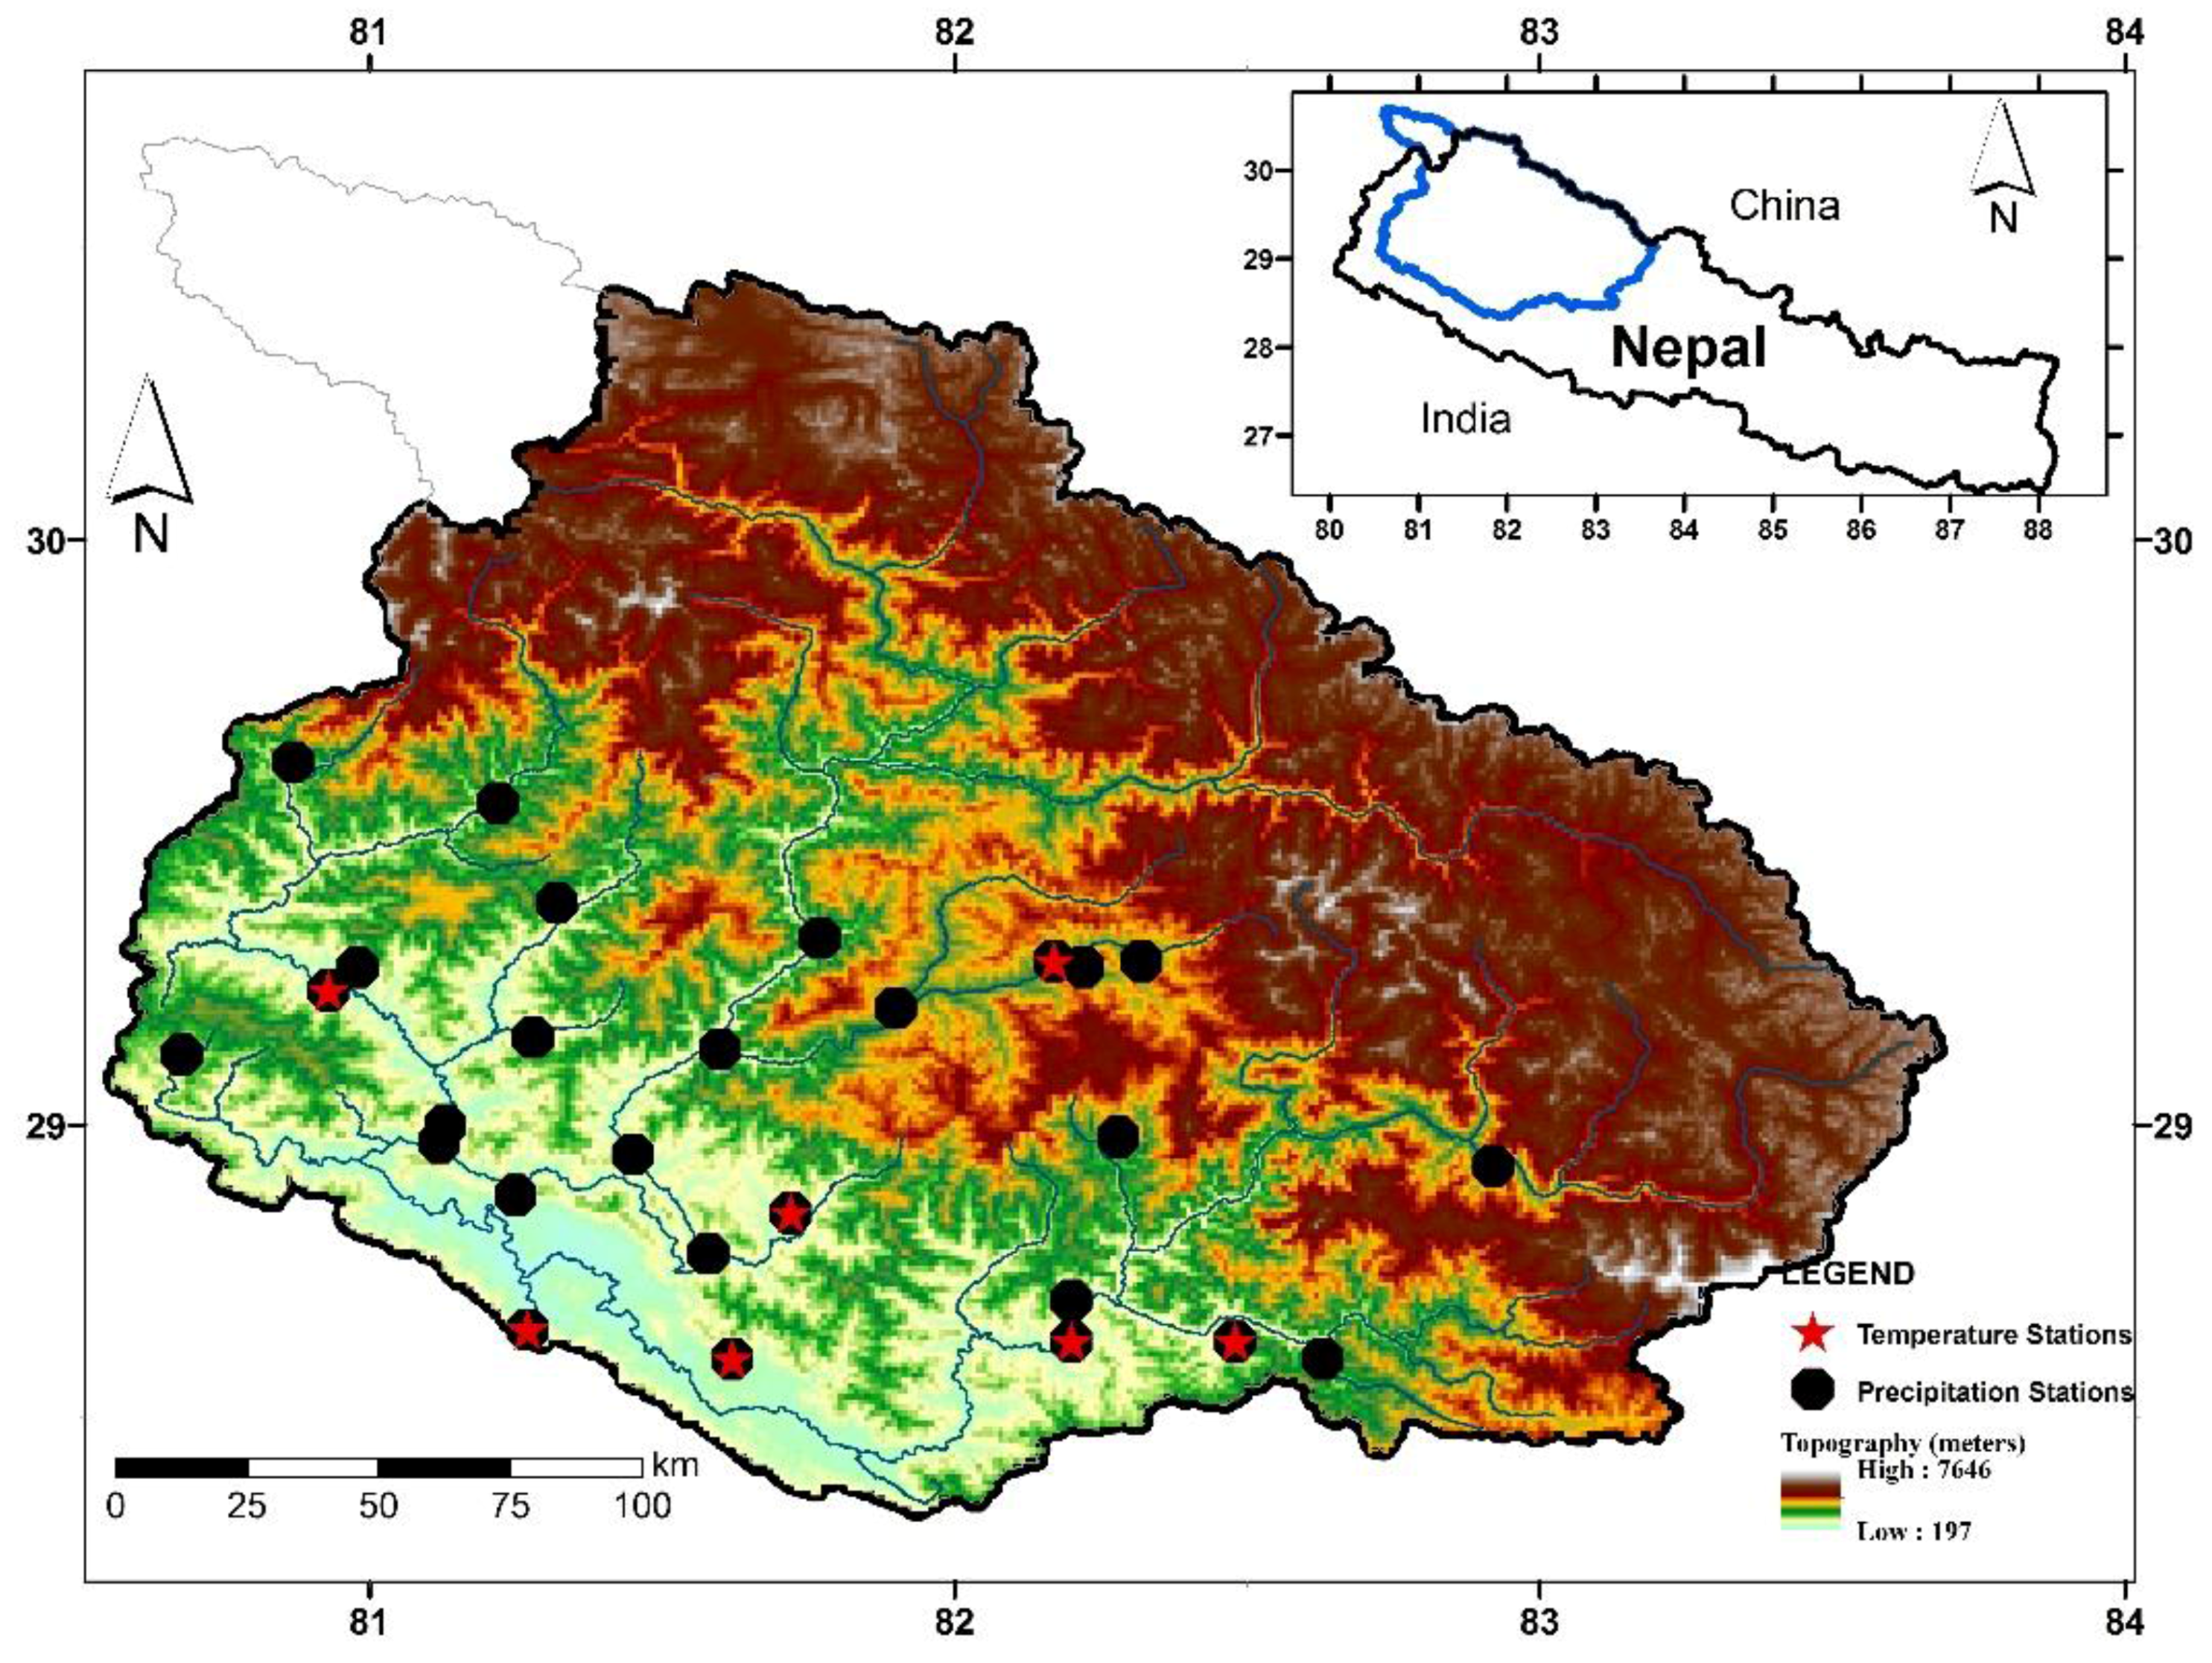
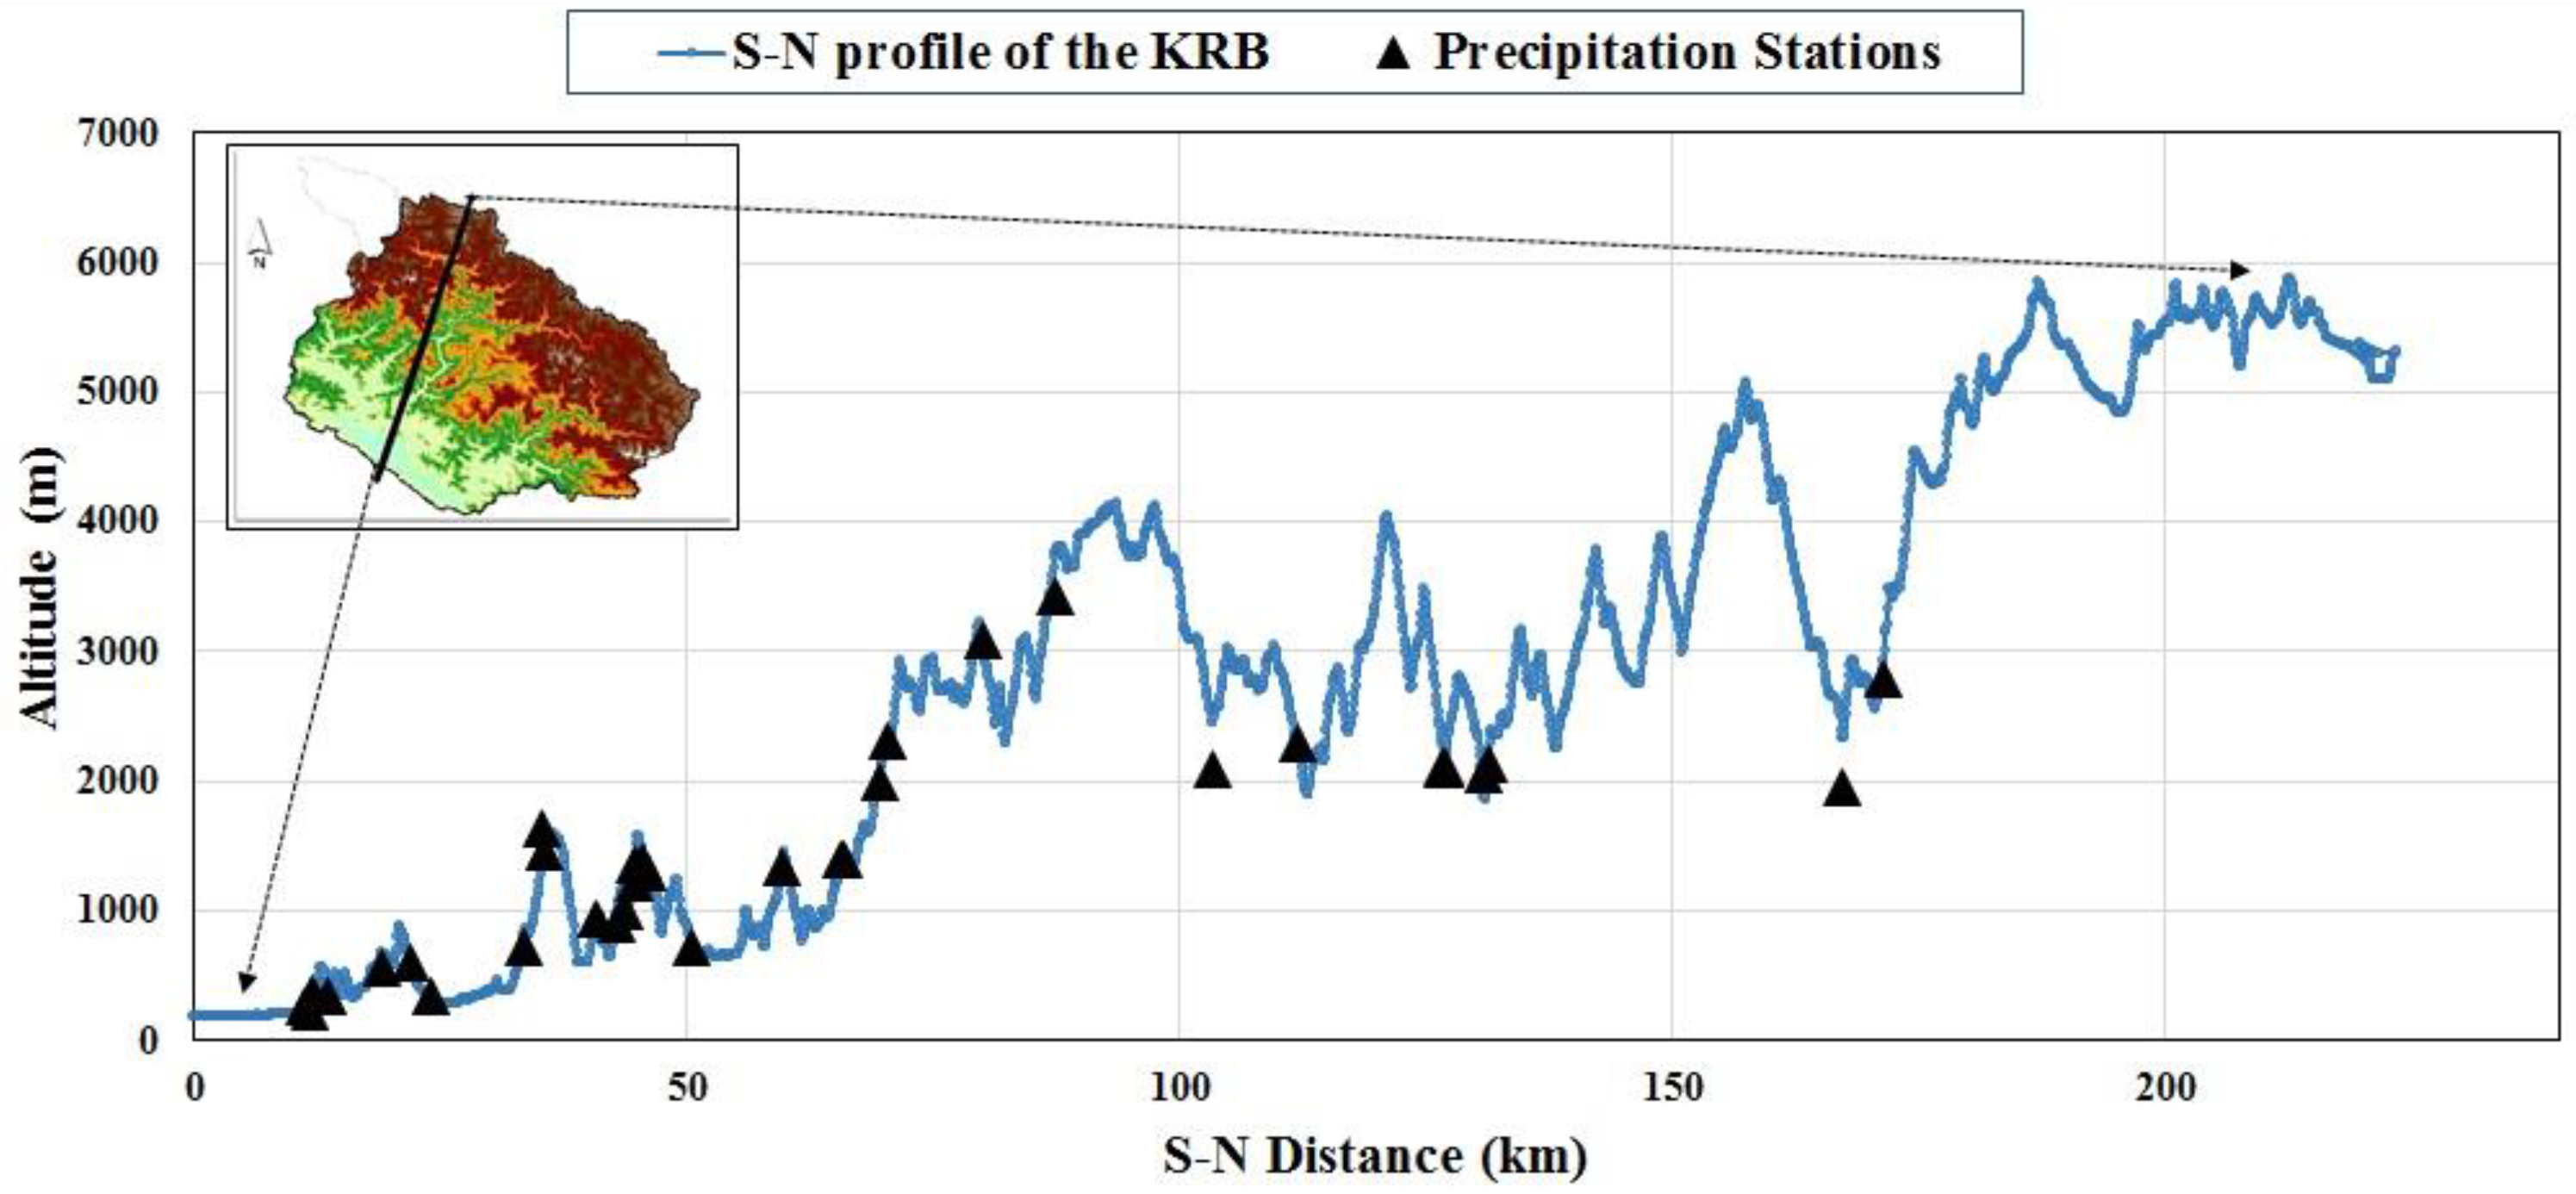
2. Study Area
3. Data and Methodology
4. Results and Discussions
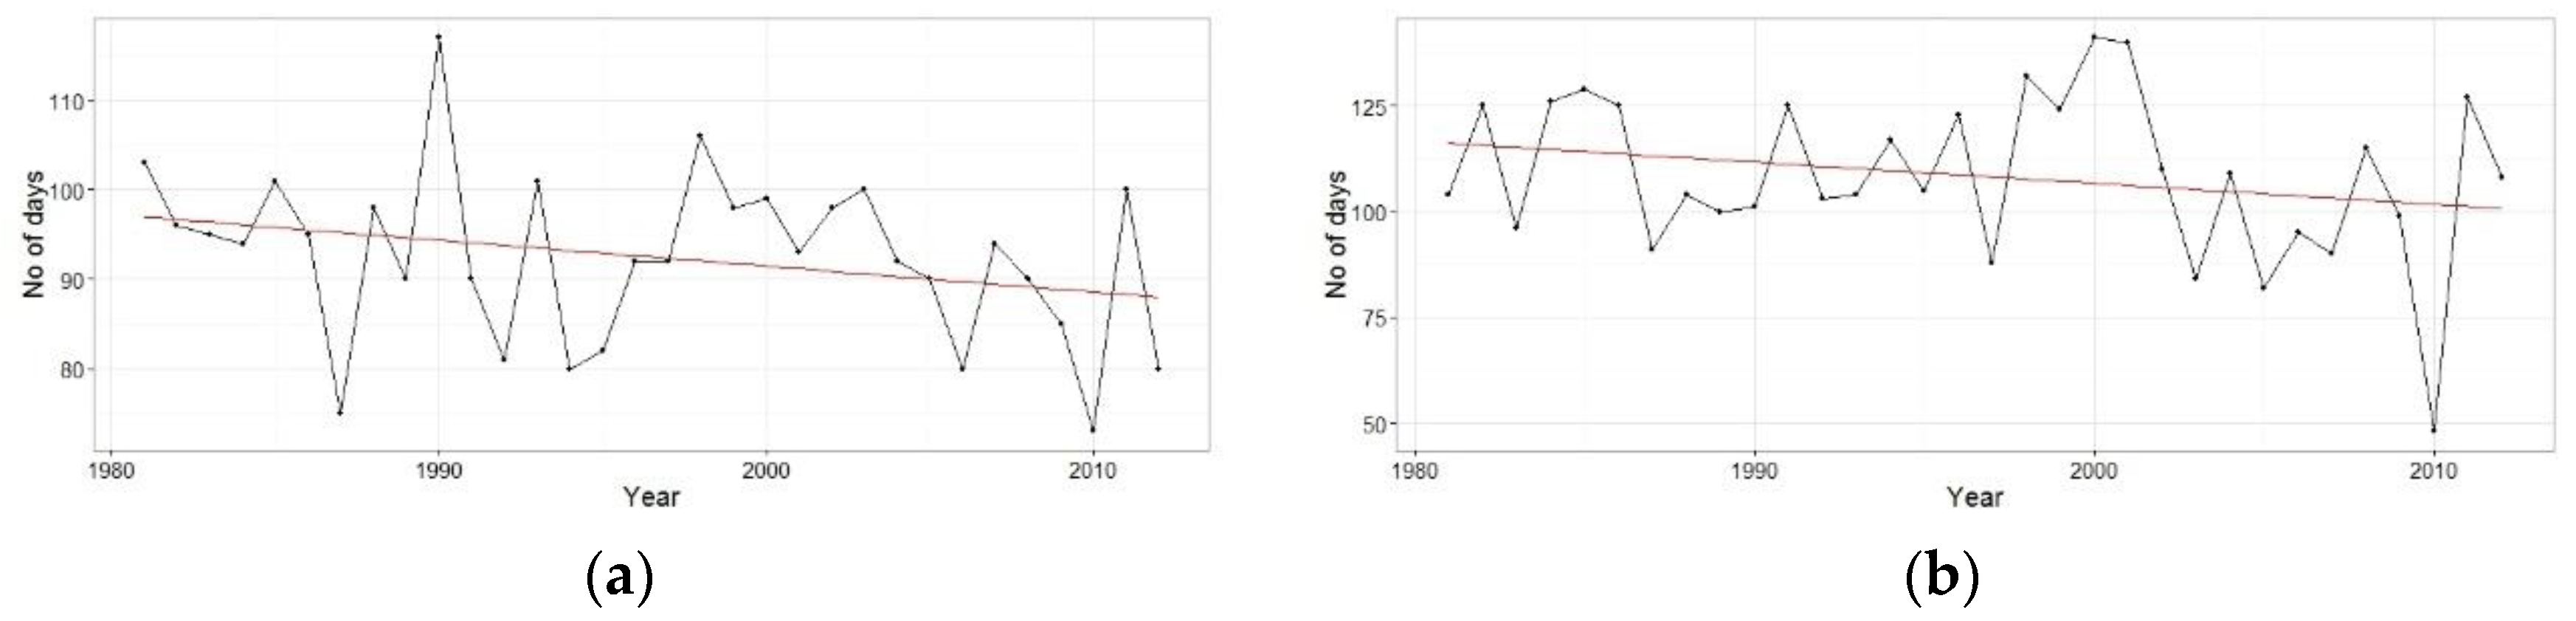
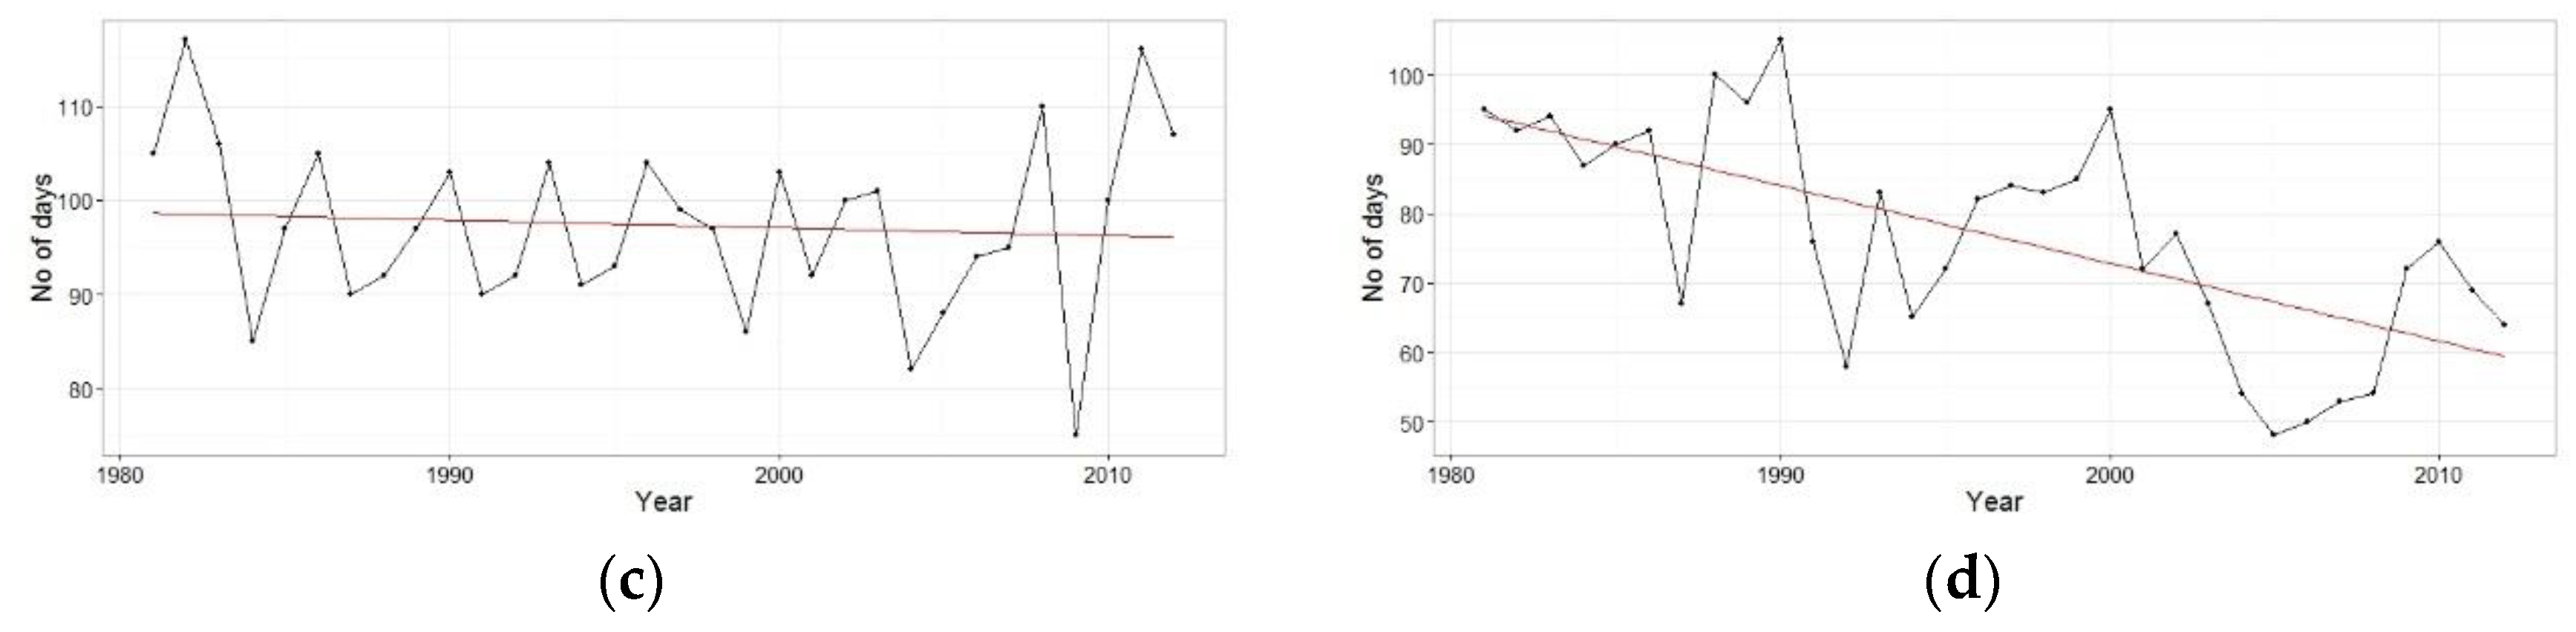
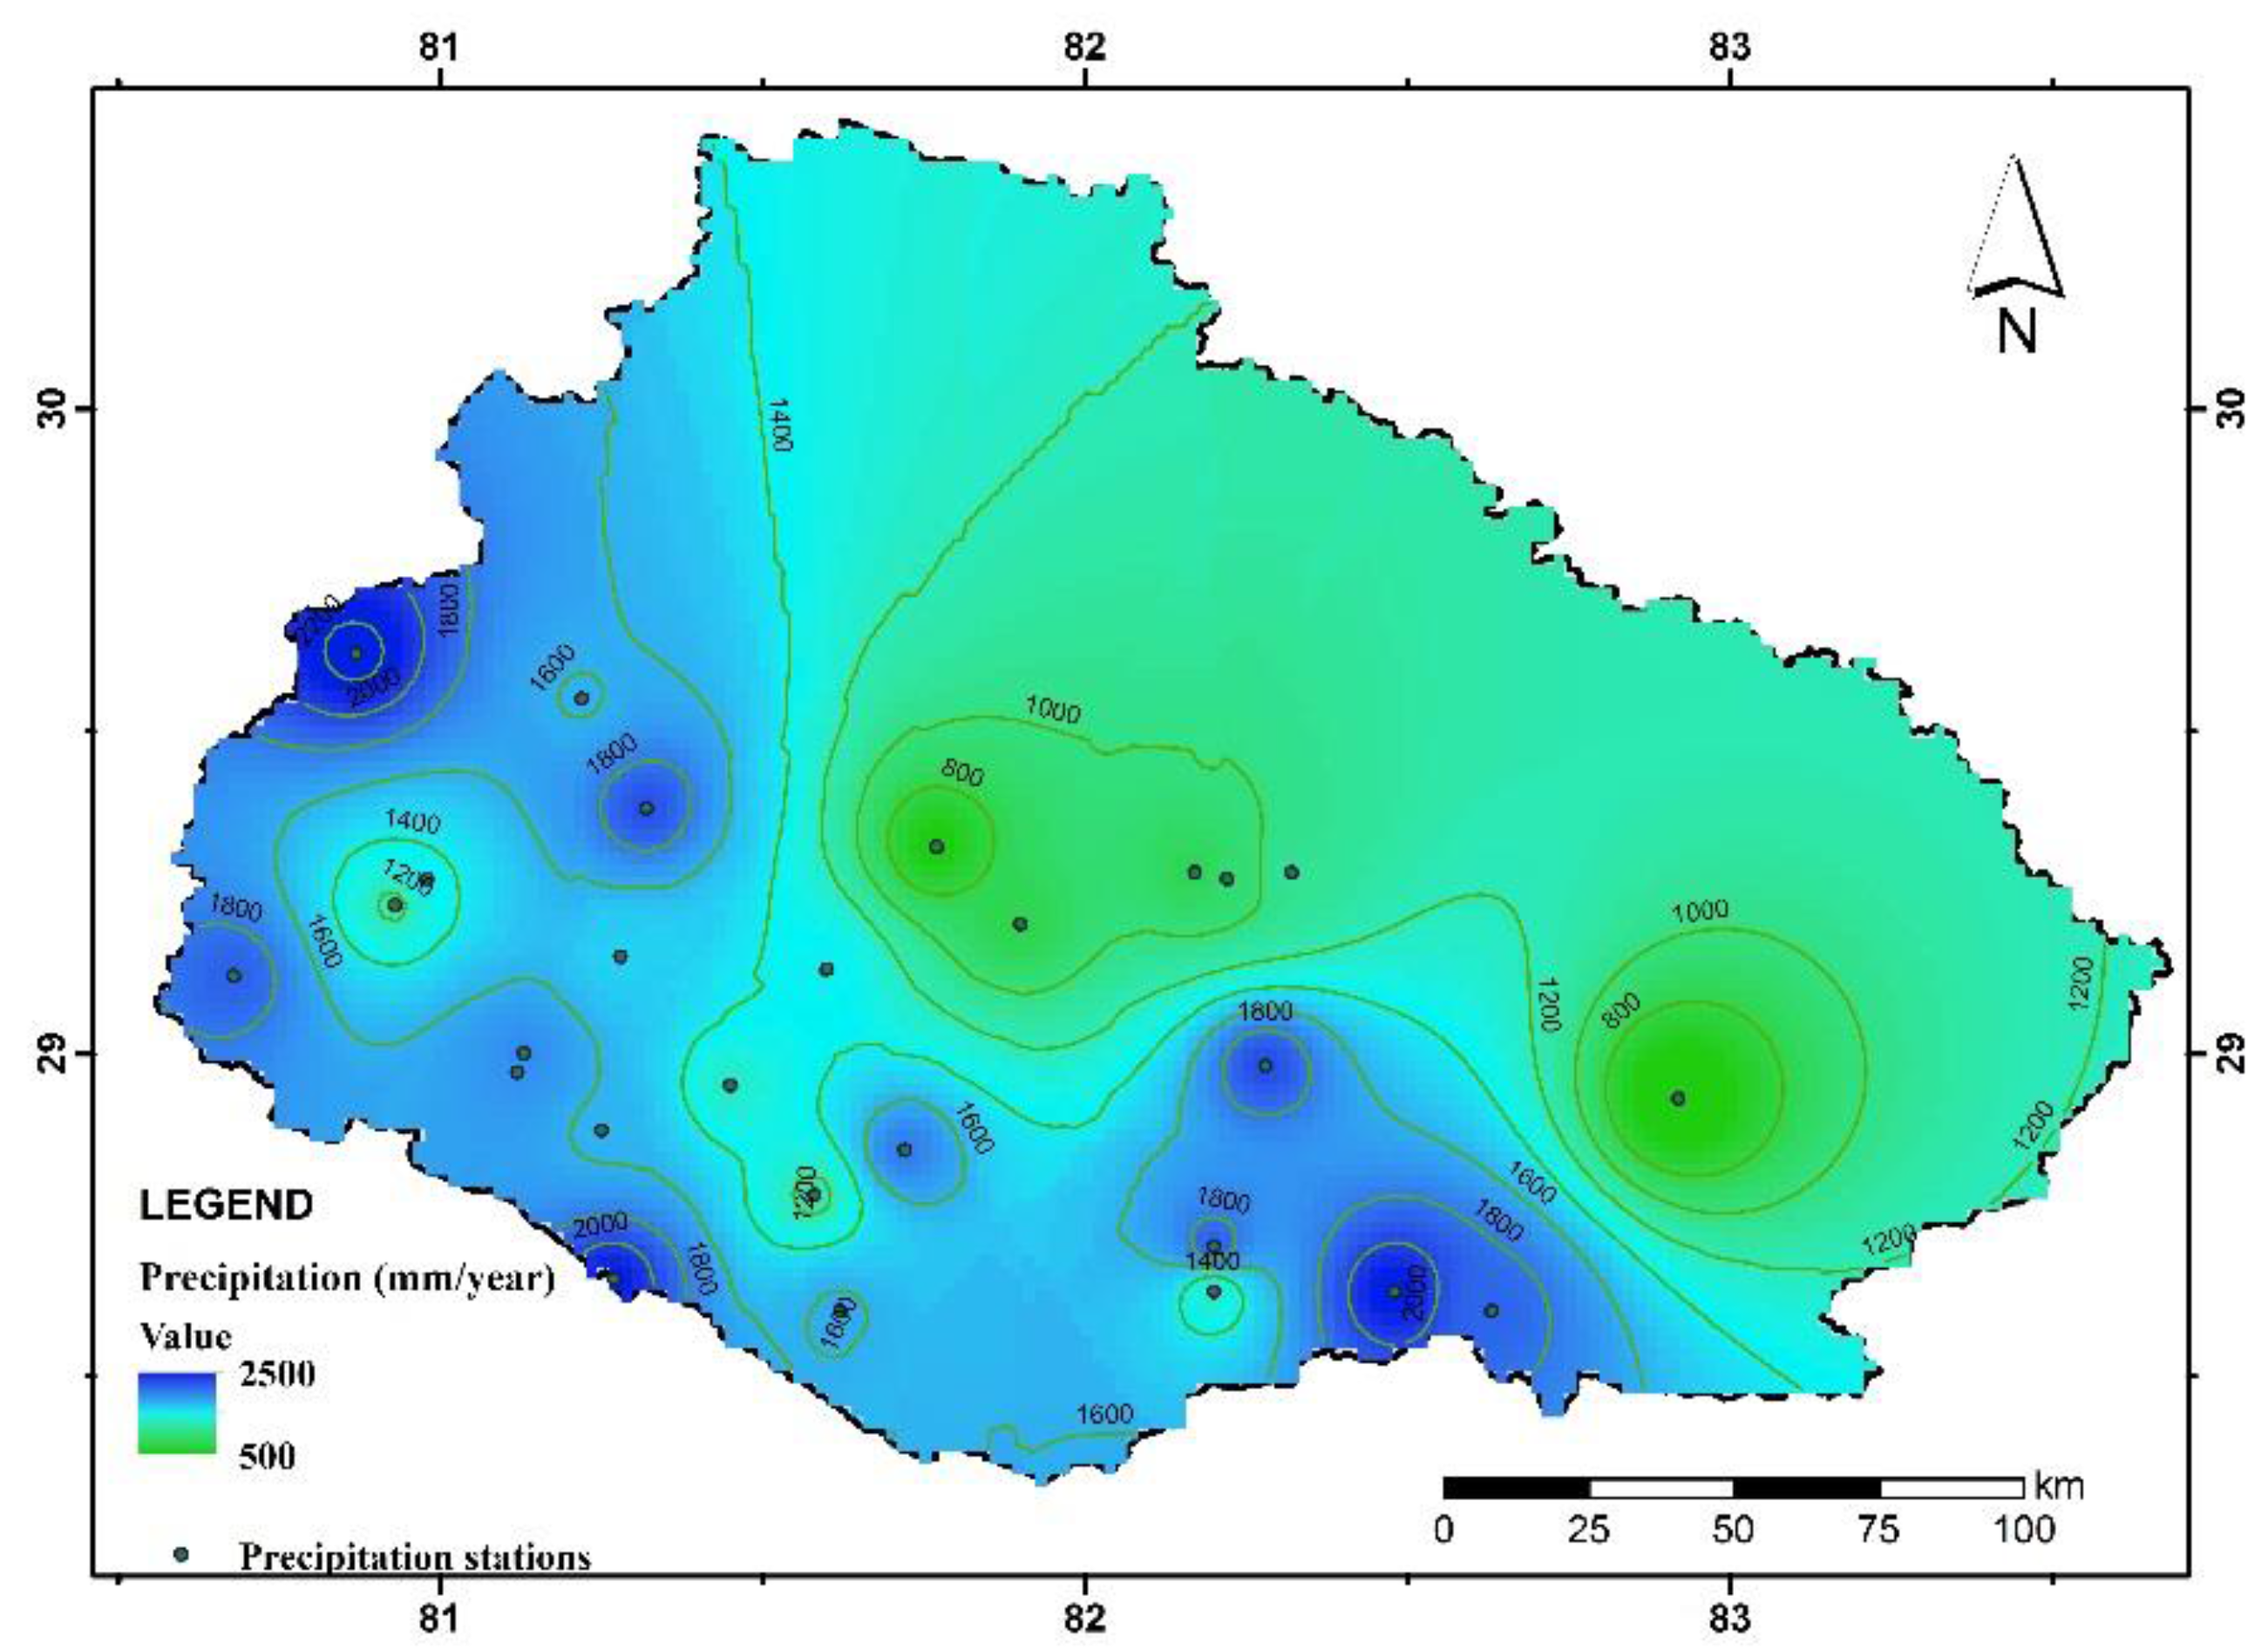
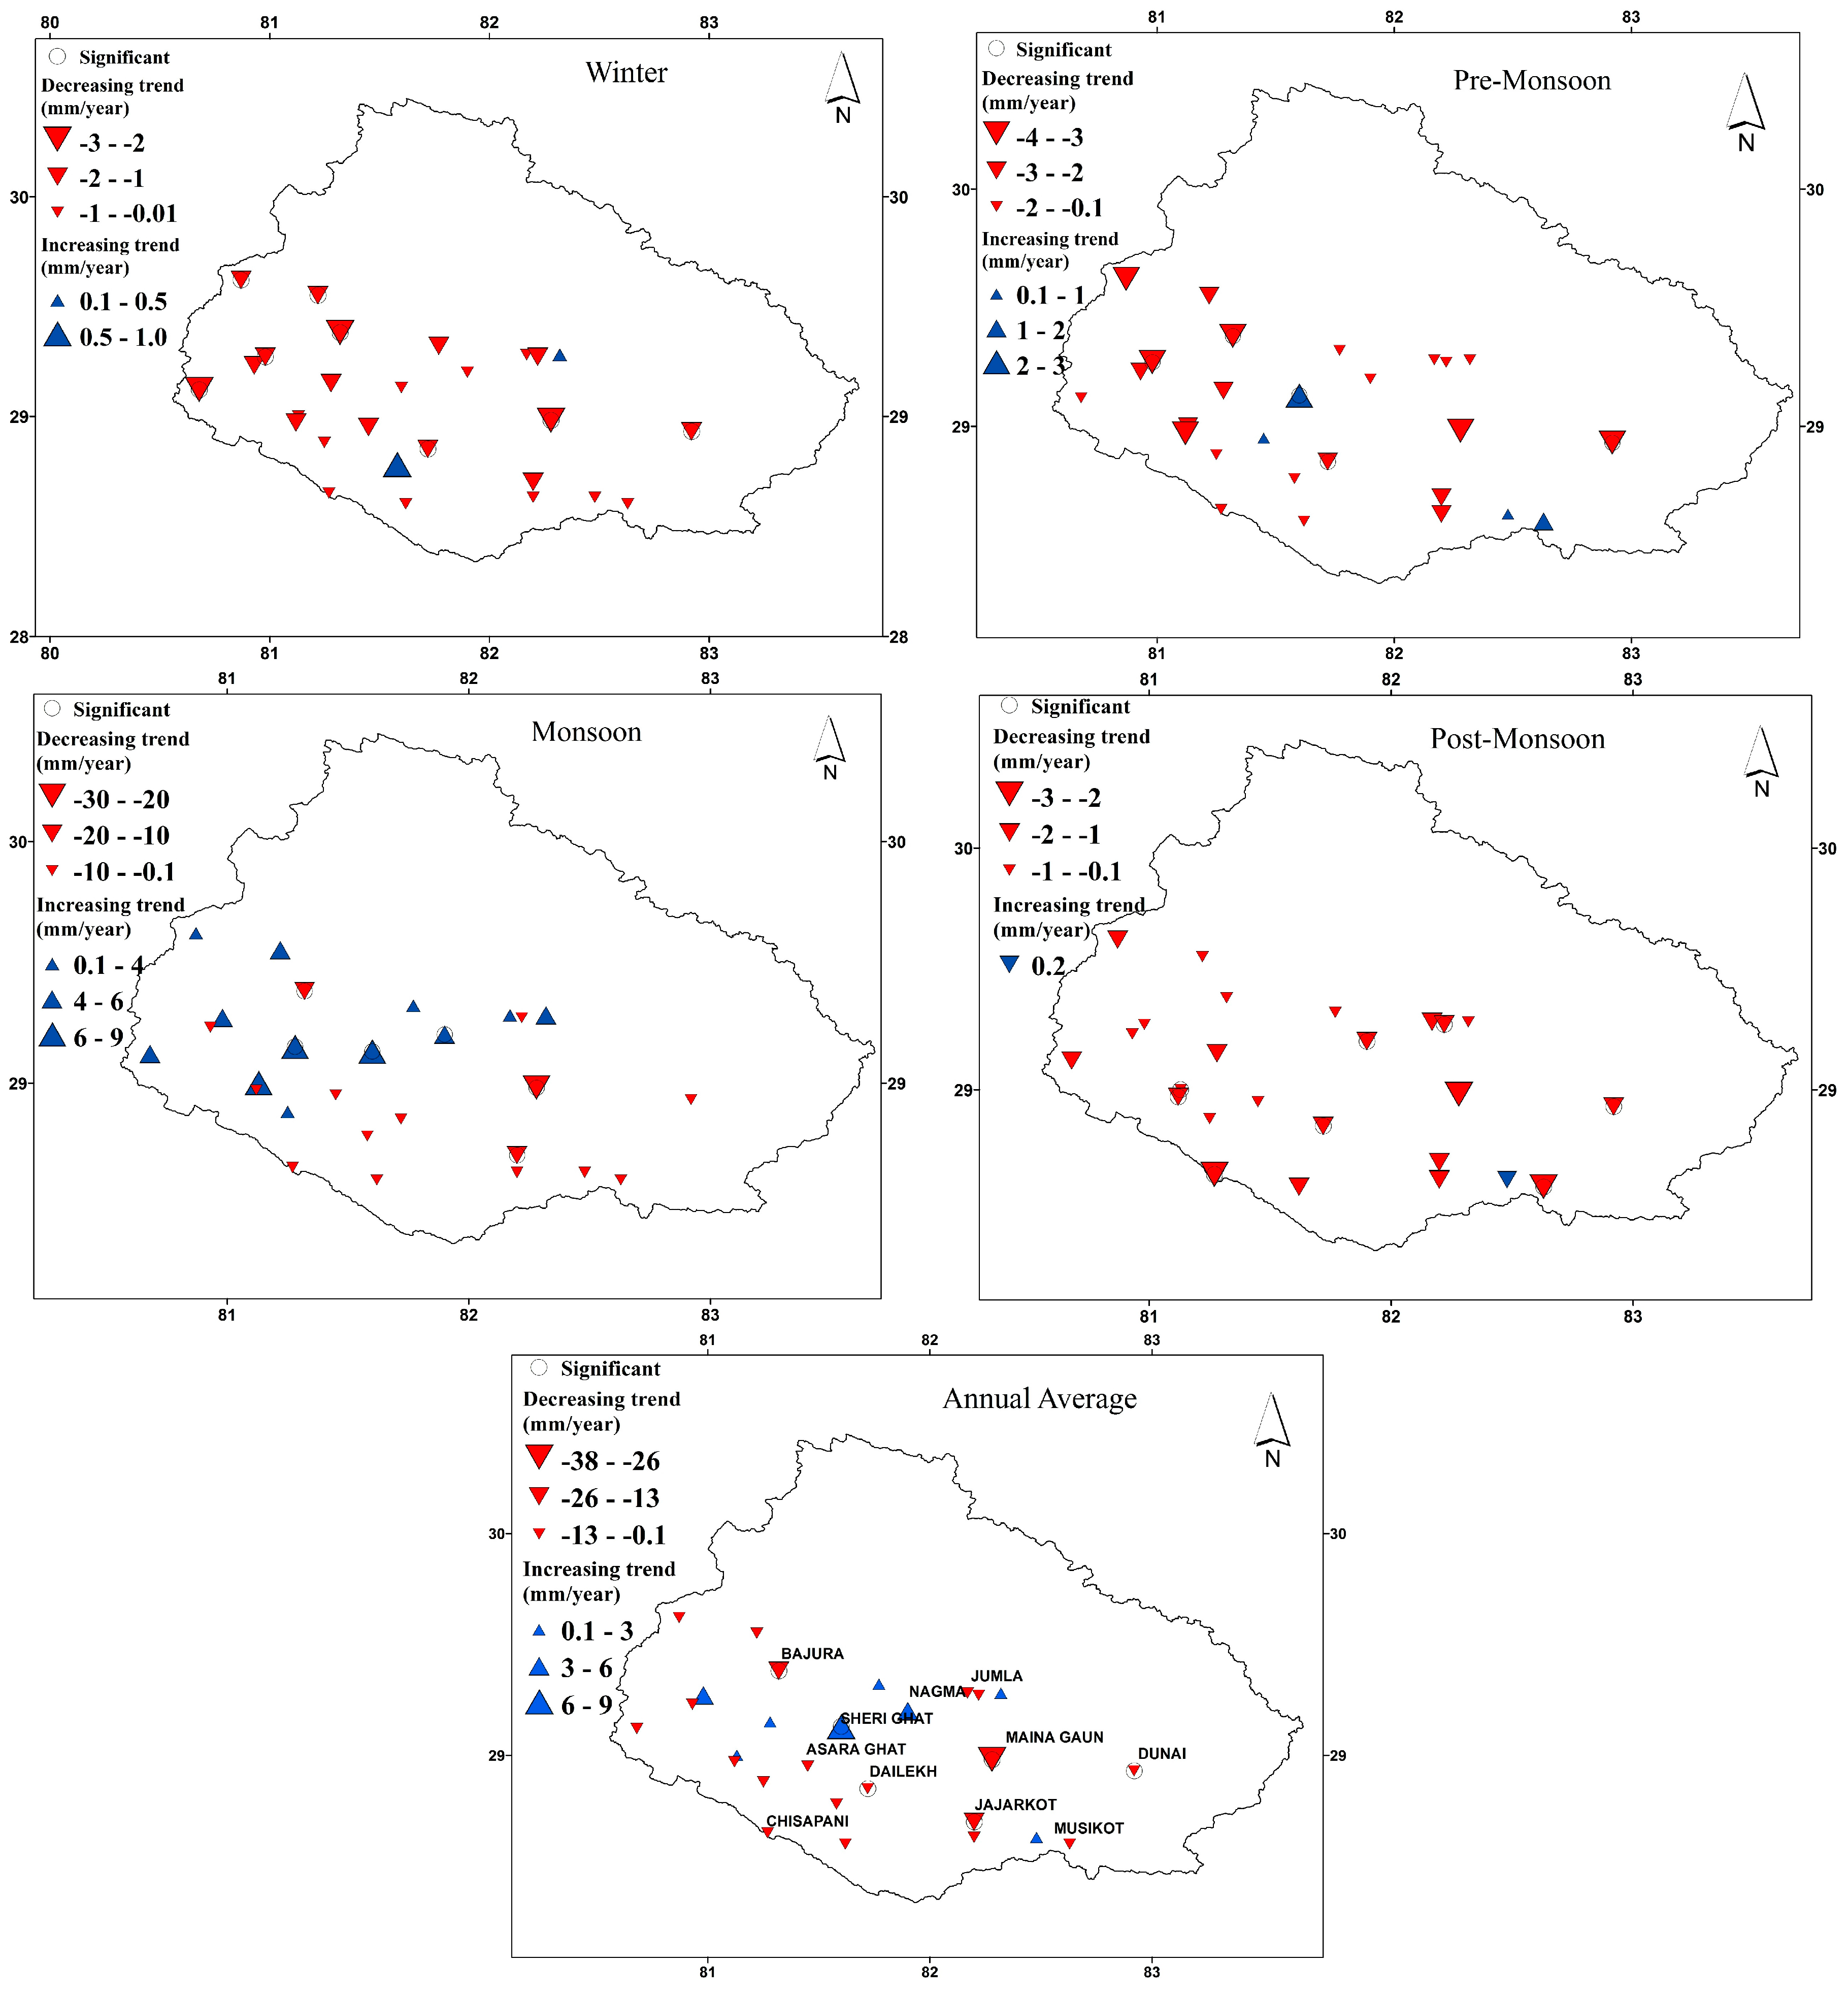
4.1. Precipitation Pattern and Trend
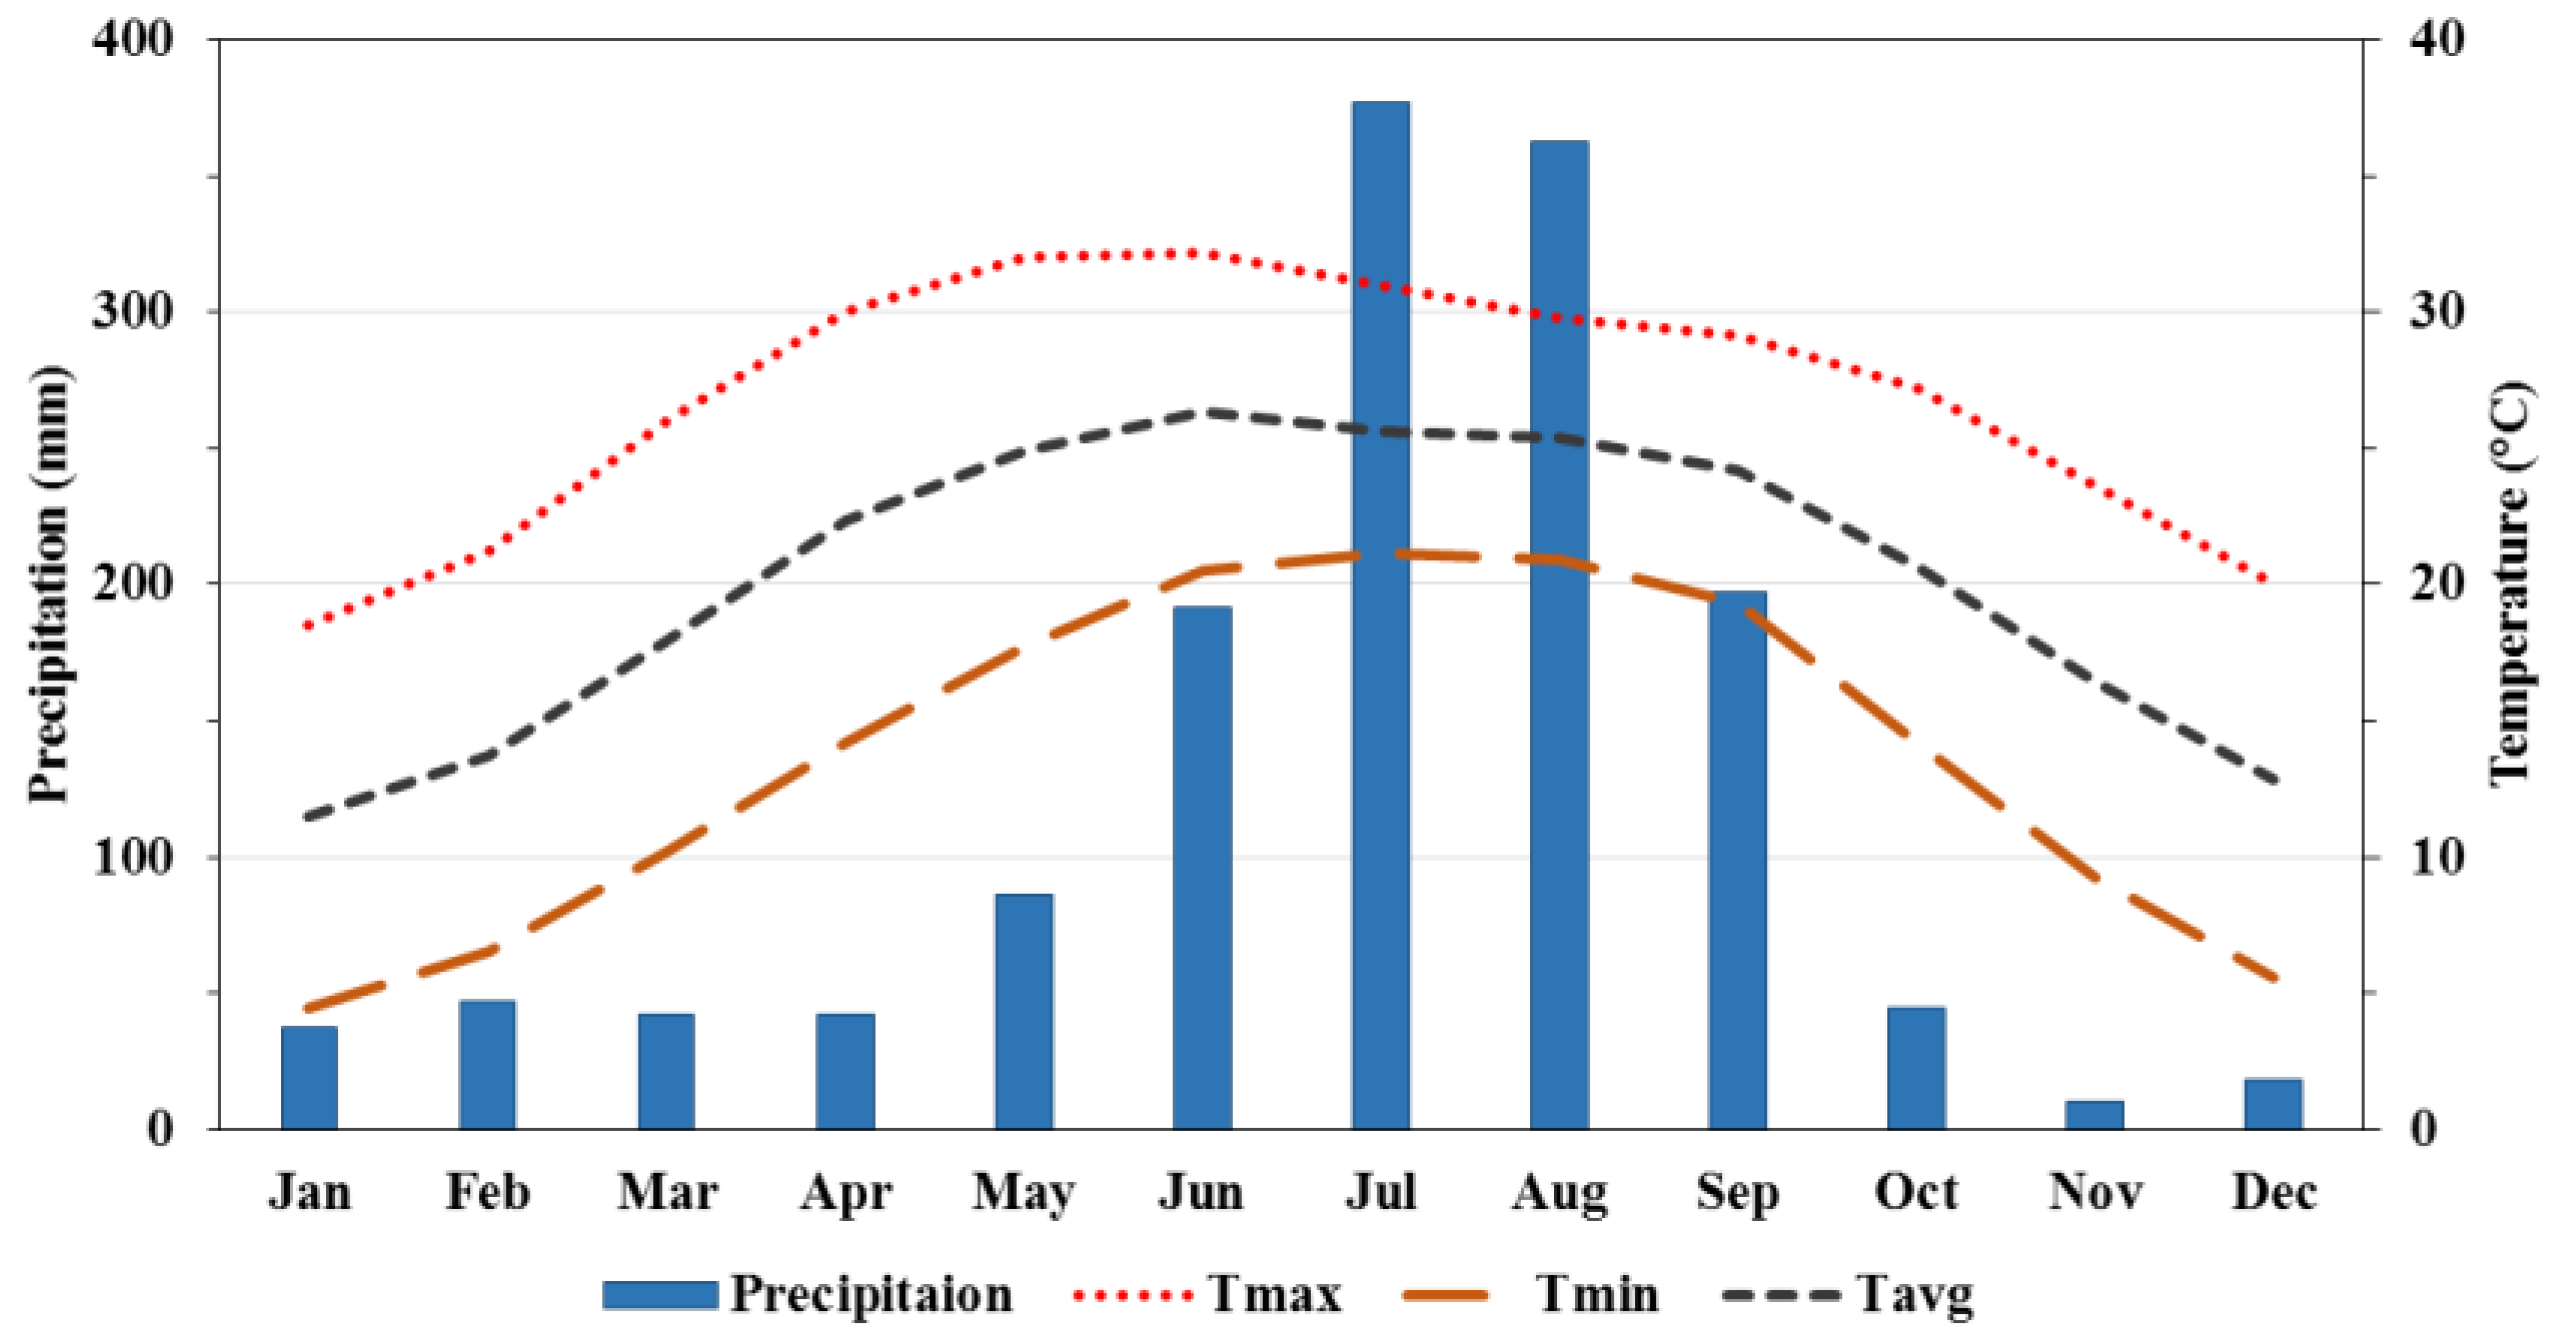
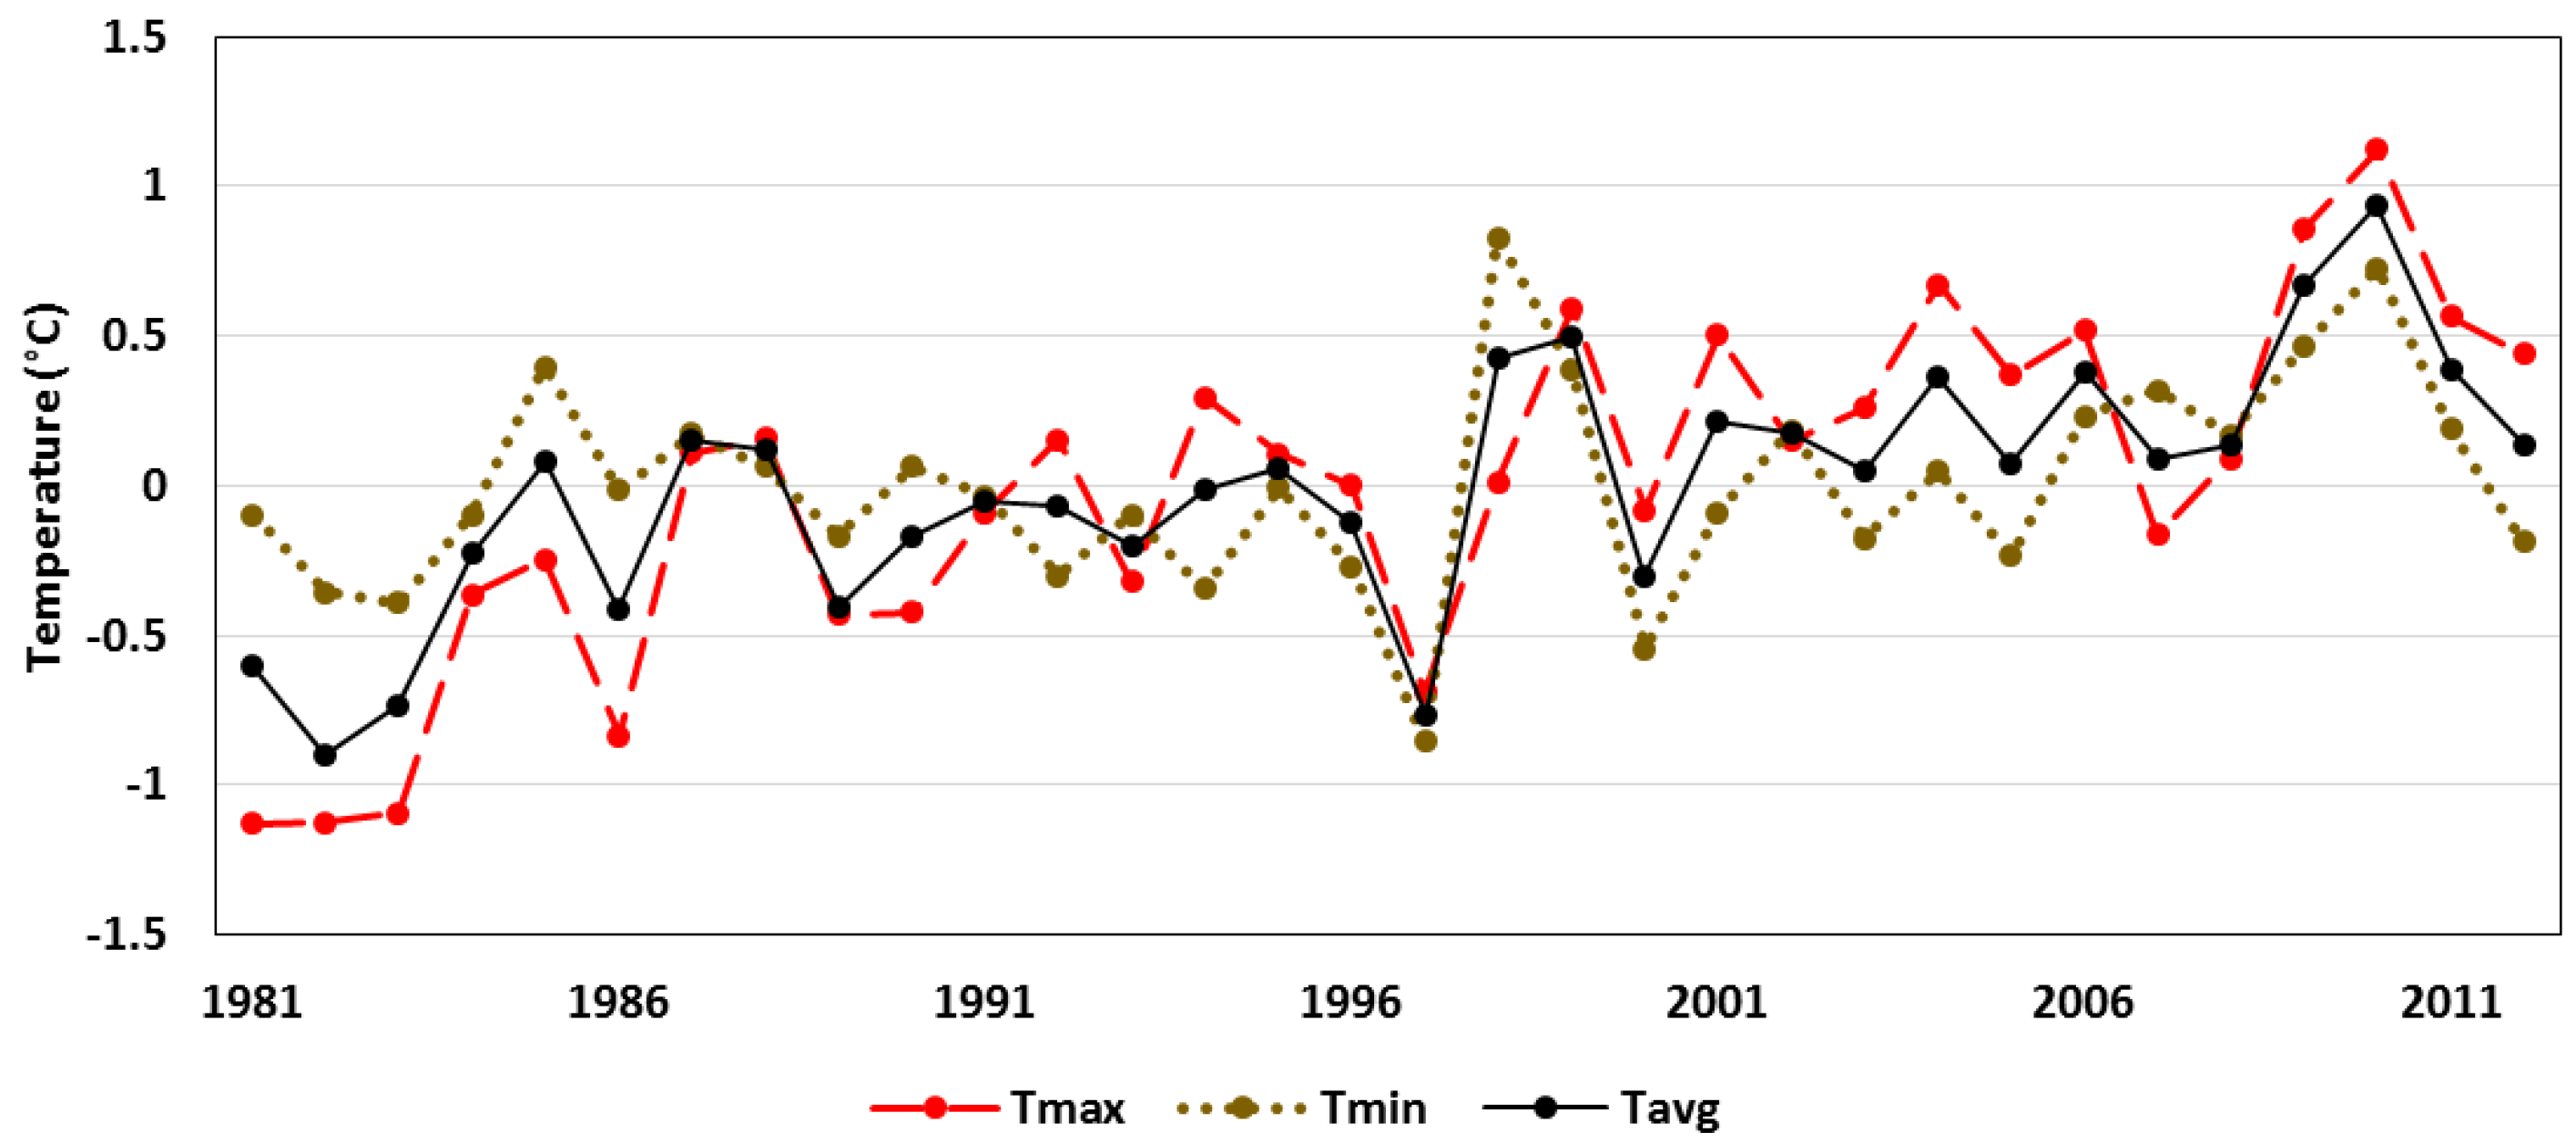
4.2. Temperature
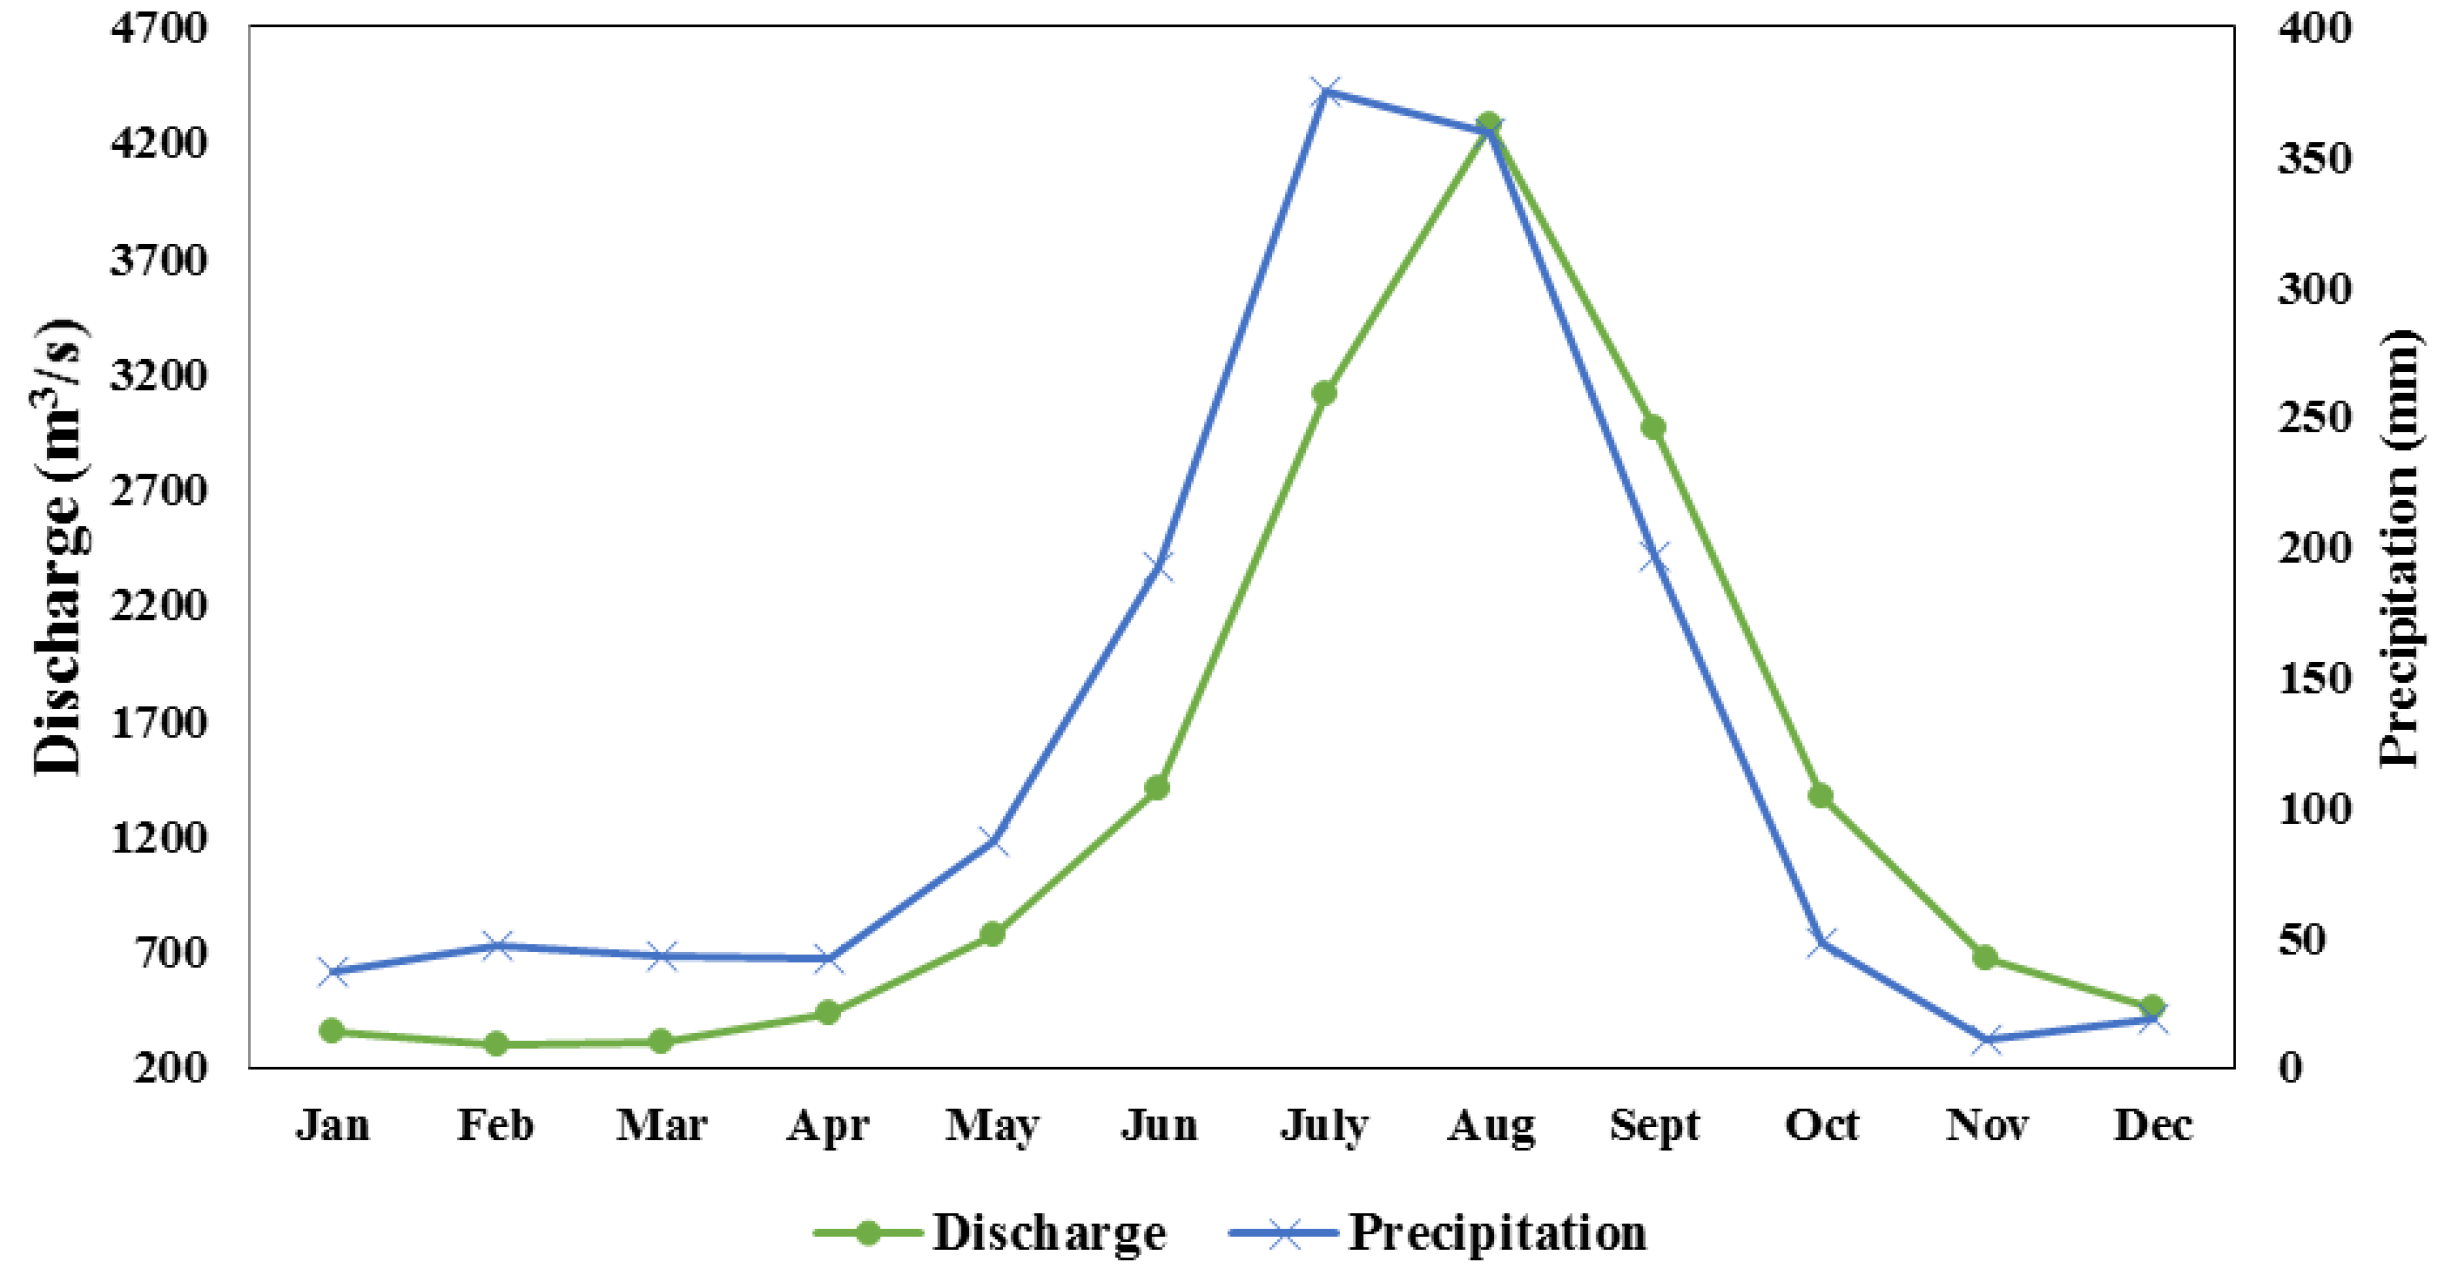
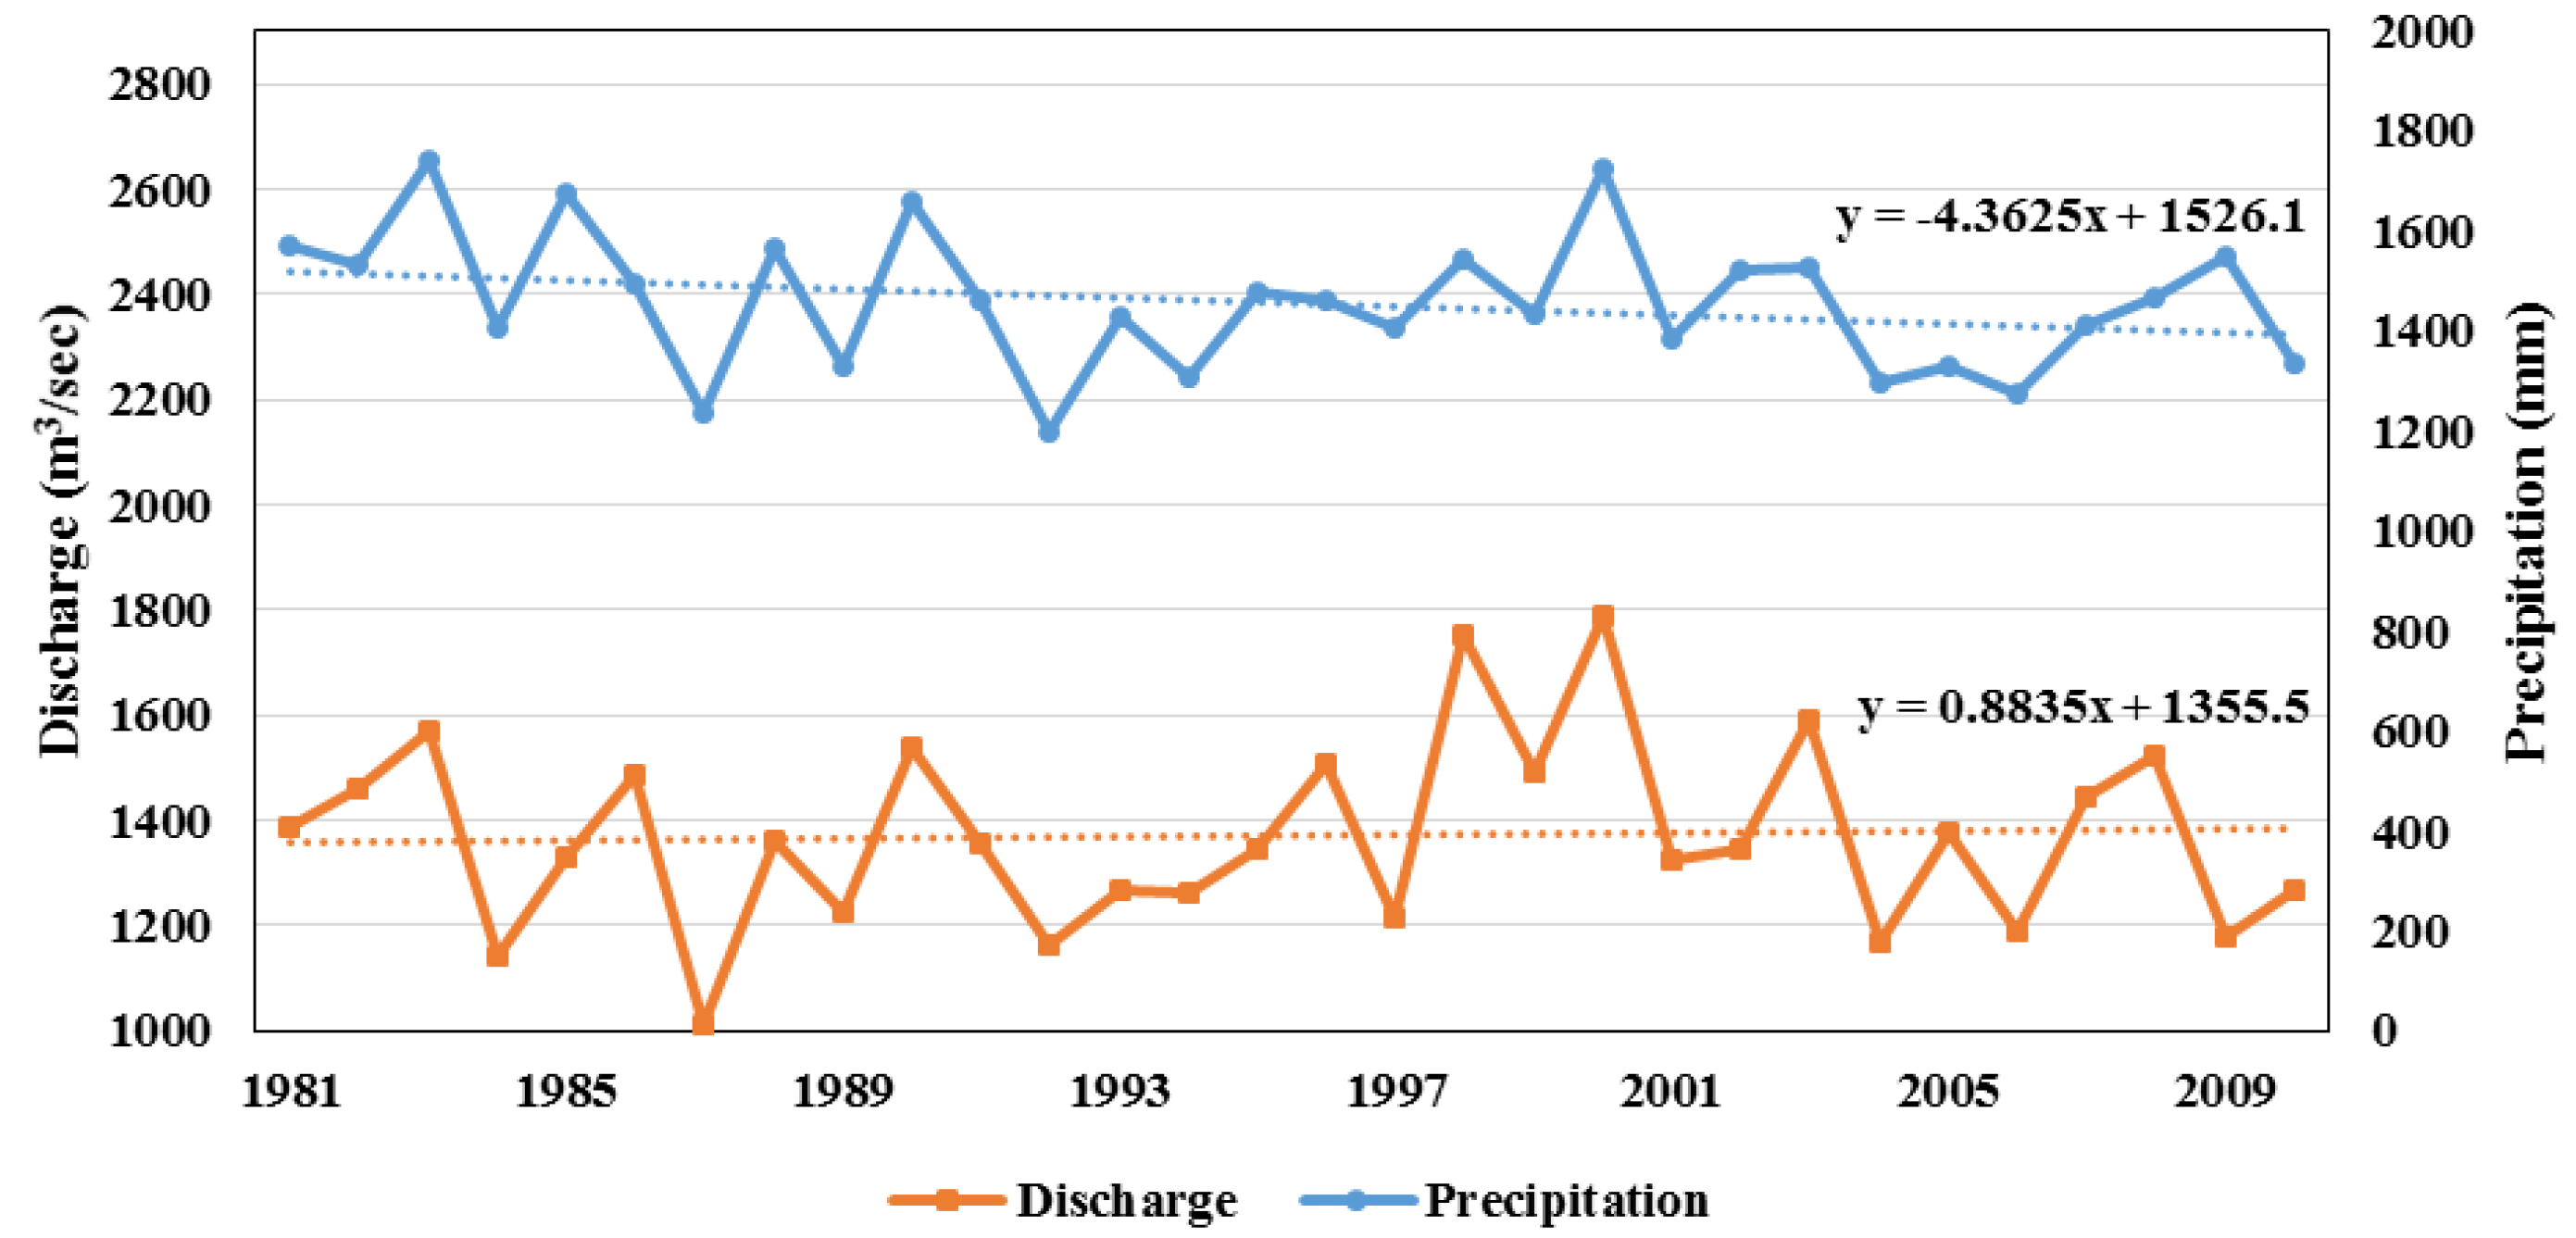
4.3. Precipitation Versus River Discharge
5. Conclusions
Acknowledgments
Author Contributions
Conflicts of Interest
References
- Rangwala, I.; Miller, J.R. Climate change in mountains: A review of elevation-dependent warming and its possible causes. Clim. Chang. 2012, 114, 527–547. [Google Scholar] [CrossRef]
- IPCC. Summary for policymakers. In Climate Change 2014: Impacts, Adaptation, and Vulnerability. Part A: Global and Sectoral Aspects. Contribution of Working Group II to the Fifth Assessment Report of the Intergovernmental Panel on Climate Change; Field, C.B., Barros, V.R., Dokken, D.J., Mach, K.J., Mastrandrea, M.D., Bilir, T.E., Chatterjee, M., Ebi, K.L., Estrada, Y.O., Genova, R.C., et al., Eds.; Cambridge University Press: Cambridge, UK, 2014; pp. 1–32. [Google Scholar]
- Beniston, M.; Diaz, H.F.; Bradley, R.S. Climatic change at high elevation sites: An overview. Clim. Chang. 1997, 36, 233–251. [Google Scholar] [CrossRef]
- Singh, S.P.; Bassignana-Khadka, I.; Karky, B.S.; Sharma, E. Climate Change in the Hindu Kush-Himalayas: The State of Current Knowledge; International Centre for Integrated Mountain Development (ICIMOD): Kathmandu, Nepal, 2011. [Google Scholar]
- Bolch, T.; Kulkarni, A.; Kääb, A.; Huggel, C.; Paul, F.; Cogley, J.; Frey, H.; Kargel, J.S.; Fujita, K.; Scheel, M. The state and fate of himalayan glaciers. Science 2012, 336, 310–314. [Google Scholar] [CrossRef] [PubMed]
- Shrestha, A.B.; Wake, C.P.; Mayewski, P.A.; Dibb, J.E. Maximum temperature trends in the himalaya and its vicinity: An analysis based on temperature records from nepal for the period 1971–94. J. Clim. 1999, 12, 2775–2786. [Google Scholar] [CrossRef]
- Shrestha, A.B.; Wake, C.P.; Dibb, J.E.; Mayewski, P.A. Precipitation fluctuations in the nepal himalaya and its vicinity and relationship with some large scale climatological parameters. Int. J. Climatol. 2000, 20, 317–327. [Google Scholar] [CrossRef]
- Ashfaq, M.; Shi, Y.; Tung, W.-W.; Trapp, R.J.; Gao, X.; Pal, J.S.; Diffenbaugh, N.S. Suppression of south asian summer monsoon precipitation in the 21st century. Geophys. Res. Lett. 2009, 36. [Google Scholar] [CrossRef]
- Immerzeel, W.W.; van Beek, L.P.H.; Bierkens, M.F.P. Climate change will affect the asian water towers. Science 2010, 328, 1382–1385. [Google Scholar] [CrossRef] [PubMed]
- Bhatt, D.; Mall, R.K. Surface water resources, climate change and simulation modeling. Aquat. Procedia 2015, 4, 730–738. [Google Scholar] [CrossRef]
- Palazzi, E.; Hardenberg, J.; Provenzale, A. Precipitation in the Hindu-Kush Karakoram Himalaya: Observations and future scenarios. J. Geophys. Res. Atmos. 2013, 118, 85–100. [Google Scholar] [CrossRef]
- Yao, T.; Thompson, L.; Yang, W.; Yu, W.; Gao, Y.; Guo, X.; Yang, X.; Duan, K.; Zhao, H.; Xu, B. Different glacier status with atmospheric circulations in tibetan plateau and surroundings. Nat. Clim. Chang. 2012, 2, 663–667. [Google Scholar] [CrossRef]
- Salerno, F.; Guyennon, N.; Thakuri, S.; Viviano, G.; Romano, E.; Vuillermoz, E.; Cristofanelli, P.; Stocchi, P.; Agrillo, G.; Ma, Y. Weak precipitation, warm winters and springs impact glaciers of south slopes of Mt. Everest (central himalaya) in the last 2 decades (1994–2013). Cryosphere 2015, 9, 1229–1247. [Google Scholar] [CrossRef]
- Nogués-Bravo, D.; Araújo, M.B.; Errea, M.; Martinez-Rica, J. Exposure of global mountain systems to climate warming during the 21st century. Glob. Environ. Chang. 2007, 17, 420–428. [Google Scholar] [CrossRef]
- Immerzeel, W.; van Beek, L.P.H.; Konz, M.; Shrestha, A.B.; Bierkens, M.F.P. Hydrological response to climate change in a glacierized catchment in the himalayas. Clim. Chang. 2012, 110, 721–736. [Google Scholar] [CrossRef] [PubMed]
- Viviroli, D.; Weingartner, R.; Messerli, B. Assessing the hydrological significance of the world’s mountains. Mt. Res. Dev. 2003, 23, 32–40. [Google Scholar] [CrossRef]
- Nepal, S. Evaluating Upstream-Downstream Linkages of Hydrological Dynamics in the Himalayan Region. Ph.D. Thesis, Friedrich Schiller University, Jena, Germany, 2012. [Google Scholar]
- Bajracharya, S.R.; Mool, P.K.; Shrestha, B.R. Impact of Climate Changeon Himalaya Glaciers and Glacial Lakes: Case Studies on Glof and Associated Hazards in Nepal and Bhutan; ICIMOD: Kathmandu, Nepal, 2007. [Google Scholar]
- Xu, J.; Grumbine, R.E.; Shrestha, A.; Eriksson, M.; Yang, X.; Wang, Y.; Wilkes, A. The melting himalayas: Cascading effects of climate change on water, biodiversity, and livelihoods. Conserv. Biol. 2009, 23, 520–530. [Google Scholar] [CrossRef] [PubMed]
- Schild, A. The mountain perspective as an emerging element in the international development agenda. ICIMOD Newsl. 2007, 53, 5–8. [Google Scholar]
- Panthi, J.; Krakauer, N.Y.; Pradhanang, S.M. Sharing climate information in the Himalayas. In Proceedings of the International Conference on Climate Change Innovation and Resilience for Sustainable Livelihood (ClimDev15 Conference), Kathmandu, Nepal, 12–14 January 2015.
- Cook, E.R.; Krusic, P.J.; Jones, P.D. Dendroclimatic signals in long tree-ring chronologies from the himalayas of Nepal. Int. J. Climatol. 2003, 23, 707–732. [Google Scholar] [CrossRef]
- Collins, D.N.; Davenport, J.L.; Stoffel, M. Climatic variation and runoff from partially-glacierised himalayan tributary basins of the ganges. Sci. Total Environ. 2013, 468–469, S48–S59. [Google Scholar] [CrossRef] [PubMed]
- Middelkoop, H.; Daamen, K.; Gellens, D.; Grabs, W.; Kwadijk, J.; Lang, H.; Parmet, B.; Schädler, B.; Schulla, J.; Wilke, K. Impact of climate change on hydrological regimes and water resources management in the Rhine Basin. Clim. Chang. 2001, 49, 105–128. [Google Scholar] [CrossRef]
- McNally, A.; Magee, D.; Wolf, A.T. Hydropower and sustainability: Resilience and vulnerability in China’s powersheds. J. Environ. Manag. 2009, 90, S286–S293. [Google Scholar] [CrossRef] [PubMed]
- Cramer, W.; Yohe, G.W.; Auffhammer, M.; Huggel, C.; Molau, U.; Dias, M.A.F.S.; Solow, A.; Stone, D.A.; Tibig, L. Detection and attribution of observed impacts. In Climate Change 2014: Impacts, Adaptation, and Vulnerability. Part A: Global and Sectoral Aspects. Contribution of Working Group II to the Fifth Assessment Report of the Intergovernmental Panel of Climate Change; Field, C.B., Barros, V.R., Dokken, D.J., Mach, K.J., Mastrandrea, M.D., Bilir, T.E., Chatterjee, M., Ebi, K.L., Estrada, Y.O., Genova, R.C., et al., Eds.; Cambridge University Press: Cambridge, UK, 2014; pp. 979–1037. [Google Scholar]
- Shrestha, M.L. Interannual variation of summer monsoon rainfall over nepal and its relation to southern oscillation index. Meteorol. Atmos. Phys. 2000, 75, 21–28. [Google Scholar] [CrossRef]
- International Water Management Institute. Nepal: Building Climate Resilience in Watersheds in Mountain Eco-Regions; ADB: Metro Manila, Philippines, 2012. [Google Scholar]
- Li, J.; Heap, A.D. A Review of Spatial Interpolation Methods for Environmental Scientists; Geoscience Australia: Symonston, Australia, 2008.
- Mann, H.B. Nonparametric tests against trend. Econometrica 1945, 13, 245–259. [Google Scholar] [CrossRef]
- Kendall, M. Rank Correlation Methods; Oxford University Press: Oxford, UK, 1948. [Google Scholar]
- Panthi, J.; Dahal, P.; Shrestha, M.L.; Aryal, S.; Krakauer, N.Y.; Pradhanang, S.M.; Lakhankar, T.; Jha, A.K.; Sharma, M.; Karki, R. Spatial and temporal variability of rainfall in the gandaki river basin of nepal himalaya. Climate 2015, 3, 210–226. [Google Scholar] [CrossRef]
- Smith, L.C. Trends in russian arctic river-ice formation and breakup, 1917 to 1994. Phys. Geogr. 2000, 21, 46–56. [Google Scholar]
- Sen, P.K. Estimates of the regression coefficient based on Kendall’s tau. J. Am. Stat. Assoc. 1968, 63, 1379–1389. [Google Scholar] [CrossRef]
- Helsel, D.R.; Hirsch, R.M. Statistical Methods in Water Resources; U.S. Geological Survey: Reston, VA, USA, 2002.
- Hipel, K.W.; McLeod, A.I. Time Series Modelling of Water Resources and Environmental Systems. Available online: http://www.stats.uwo.ca/faculty/aim/1994Book/ (assessed on 30 July 2015).
- Wang, X.; Luo, Y.; Sun, L.; Zhang, Y. Assessing the effects of precipitation and temperature changes on hydrological processes in a glacier-dominated catchment. Hydrol. Process. 2015, 29, 4830–4845. [Google Scholar] [CrossRef]
- Nepal, S. Impacts of climate change on the hydrological regime of the koshi river basin in the himalayan region. J. Hydro Environ. Res. 2016, 10, 76–89. [Google Scholar] [CrossRef]
- Salmi, T.; Määttä, A.; Anttila, P.; Ruoho-Airola, T.; Amnell, T. Detecting trends of annual values of atmospheric pollutants by the mann-kendall test and sen’s slope estimates—The microsoft corporation excel version 1997 template application makesens. Publ. Air Qual. 2002, 31, 1–35. [Google Scholar]
- Keuser, A.P. Precipitation patterns and trends in the metropolitan area of Milwaukee, Wisconsin. Int. J. Geospatial Environ. Res. 2014, 1, 1–14. [Google Scholar]
- Shrestha, D.L.; Paudyal, G.N. Water resources development planning in the Karnali river basin, Nepal. Int. J. Water Resour. Dev. 1992, 8, 195–203. [Google Scholar] [CrossRef]
- Nayava, J.L. Rainfall in Nepal. Himal. Rev. 1980, 12, 1–18. [Google Scholar]
- Water and Energy Commission Secretariat. Water Resources of Nepal in the Context of Climate Change; Water and Energy Commission Secretariat: Kathmandu, Nepal, 2011.
- Kansakar, S.R.; Hannah, D.M.; Gerrard, J.; Rees, G. Spatial pattern in the precipitation regime of Nepal. Int. J. Climatol. 2004, 24, 1645–1659. [Google Scholar] [CrossRef]
- Bookhagen, B.; Burbank, D.W. Topography, relief, and trmm-derived rainfall variations along the Himalaya. Geophys. Res. Lett. 2006, 33. [Google Scholar] [CrossRef]
- Hannah, D.M.; Kansakar, S.R.; Gerrard, A.J.; Rees, G. Flow regimes of Himalayan rivers of Nepal: Nature and spatial patterns. J. Hydrol. 2005, 308, 18–32. [Google Scholar] [CrossRef]
- Bhutiyani, M.R.; Kale, V.S.; Pawar, N.J. Long-term trends in maximum, minimum and mean annual air temperatures across the northwestern himalaya during the twentieth century. Clim. Chang. 2007, 85, 159–177. [Google Scholar] [CrossRef]
- Salinger, M.; Shrestha, M.; Ailikun; Dong, W.; McGregor, J.; Wang, S. Climate in Asia and the pacific: Climate variability and change. In Climate in Asia and the Pacific; Manton, M., Stevenson, L.A., Eds.; Springer: Dordrecht, The Netherlands, 2014; Volume 56, pp. 17–57. [Google Scholar]
- Thapa, S. The human development index: A portrait of the 75 districts in Nepal. Asia Pac. Popul. J. 1995, 10, 3–14. [Google Scholar] [PubMed]
- Kocanda, J.; Puhakka, K. Living with Floods along the Karnali River; A Case stUdy of Adaptive Capacity in Rajapur Area, Nepal; Lund University: Lund, Sweden, 2012. [Google Scholar]
- Nepal Development Research Institute (NDRI); United Nations World Food Programme (WFP); Food Security Monitoring Task Force of National Planning Commission (NPC). The food Security Atlas of Nepal; Nepal Development Research Institute: Patan, Nepal, 2010. [Google Scholar]
- Nijssen, B.; O’Donnell, G.; Hamlet, A.; Lettenmaier, D. Hydrologic sensitivity of global rivers to climate change. Clim. Chang. 2001, 50, 143–175. [Google Scholar] [CrossRef]
- Miller, J.D.; Immerzeel, W.W.; Rees, G. Climate change impacts on glacier hydrology and river discharge in the Hindu Kush-Himalayas. Mt. Res. Dev. 2012, 32, 461–467. [Google Scholar] [CrossRef]
- Bhusal, J.K. Climate change implication for hydropower development in Nepal Himalayan region. Direct Res. J. 2014, 2, 27–35. [Google Scholar]
- Pokhrel, K.P. Role of participatory research on natural resource management: A case of Karnali watershed area. Nepal Int. J. Biodivers. Conserv. 2011, 3, 237–248. [Google Scholar]


| Terai | Hill | Mountain | Trans-Himalaya | Basin Average | |
|---|---|---|---|---|---|
| Winter | −1.23 | −1.28 | 0.18 | −1.2 * | −1.21 |
| Pre-monsoon | −2.13 | −1.34 | −0.88 | −3.89 *** | −1.54 |
| Monsoon | −1.6 | −1.12 | 3.5 | −3.27 | −1.58 |
| Post-monsoon | −0.82 | −0.69 | −0.35 | −0.91 ** | −0.74 |
| Annual Average | −4.12 * | −5.45 + | 2.76 | −12.12 ** | −4.91 * |
| SN | Station Name (Index, Altitude in Meter) | Pre-Monsoon | Monsoon | Post-Monsoon | Winter | ||||||||
|---|---|---|---|---|---|---|---|---|---|---|---|---|---|
| Tmax | Tmin | Tavg | Tmax | Tmin | Tavg | Tmax | Tmin | Tavg | Tmax | Tmin | Tavg | ||
| 1 | Chisapani (405, 225) | 0.05 * | 0.04 * | 0.05 * | 0.02 | 0.01 * | 0.02 + | 0.02 | 0.02 | 0.02 + | −0.01 | 0.01 | 0 |
| 2 | Dipayal (218, 652) | 0.06 * | 0.08 *** | 0.07 ** | −0.01 | 0.02 * | 0.01 | 0.01 | 0.04 * | 0.02 | 0.04 | 0.05 ** | 0.04 * |
| 3 | Surkhet (406, 720) | 0.09 *** | 0.03 | 0.06 ** | 0.05 ** | 0.01 | 0.03 ** | 0.07 *** | 0.03 * | 0.05 *** | 0.08 *** | −0.01 | 0.03 ** |
| 4 | Chaut Jhari (513, 910) | 0.04 | 0.02 | 0.03 + | 0.01 | 0.04 *** | 0.02 | −0.12 *** | 0.05 ** | −0.03 + | −0.04 * | 0.02 | −0.01 |
| 5 | Dailekh (402, 1402) | 0.22 *** | 0.0013 | 0.11 *** | 0.14 *** | −0.10 * | 0.02 | 0.17 *** | −0.04 | 0.06 * | 0.11 *** | −0.01 | 0.04 + |
| 6 | Musikot (514, 2100) | 0.05 | 0.009 | 0.04 | 0 | −0.04 ** | −0.02 | 0.07 *** | 0 | 0.04 * | 0.08 ** | 0.02 | 0.04 * |
| 7 | Jumla (303, 2300) | 0.06 ** | 0.02 * | 0.05 ** | 0.03 ** | 0.03 *** | 0.03 *** | 0.07 *** | 0.02 | 0.05 ** | 0.05 * | 0.01 | 0.03 |
| Average basin | 0.08 ** | 0.03 * | 0.05 *** | 0.04 *** | −0.01 | 0.02 * | 0.03 * | 0.02 | 0.02 * | 0.05 ** | 0.01 | 0.03 * | |
© 2016 by the authors; licensee MDPI, Basel, Switzerland. This article is an open access article distributed under the terms and conditions of the Creative Commons by Attribution (CC-BY) license (http://creativecommons.org/licenses/by/4.0/).
Share and Cite
Khatiwada, K.R.; Panthi, J.; Shrestha, M.L.; Nepal, S. Hydro-Climatic Variability in the Karnali River Basin of Nepal Himalaya. Climate 2016, 4, 17. https://doi.org/10.3390/cli4020017
Khatiwada KR, Panthi J, Shrestha ML, Nepal S. Hydro-Climatic Variability in the Karnali River Basin of Nepal Himalaya. Climate. 2016; 4(2):17. https://doi.org/10.3390/cli4020017
Chicago/Turabian StyleKhatiwada, Kabi Raj, Jeeban Panthi, Madan Lall Shrestha, and Santosh Nepal. 2016. "Hydro-Climatic Variability in the Karnali River Basin of Nepal Himalaya" Climate 4, no. 2: 17. https://doi.org/10.3390/cli4020017
APA StyleKhatiwada, K. R., Panthi, J., Shrestha, M. L., & Nepal, S. (2016). Hydro-Climatic Variability in the Karnali River Basin of Nepal Himalaya. Climate, 4(2), 17. https://doi.org/10.3390/cli4020017