Article

Greenhouse Gas Induced Changes in the Seasonal Cycle of the Amazon Basin in Coupled Climate-Vegetation Regional Model

1
Department of Agricultural and Environmental Engineering, Federal University of Viçosa (UFV), Av. P. H. Rolfs s/n Campus Universitário, Viçosa, MG 3670-900, Brazil
2
Department of Geosciences, University of Oslo, PO Box 1047 Blindern, N-0316 Oslo, Norway
3
The University of Texas at Austin Department of Geological Sciences, University Station C1100, Austin, TX 78712, USA
*
Author to whom correspondence should be addressed.
Climate 2016, 4(1), 3; https://doi.org/10.3390/cli4010003
Submission received: 28 August 2015 / Revised: 11 December 2015 / Accepted: 23 December 2015 / Published: 4 January 2016
(This article belongs to the Special Issue Dynamics of Land-Use/Cover Change under a Changing Climate)

Abstract

:
Previous work suggests that changes in seasonality could lead to a 70% reduction in the extent of the Amazon rainforest. The primary cause of the dieback of the rainforest is a lengthening of the dry season due to a weakening of the large-scale tropical circulation. Here we examine these changes in the seasonal cycle. Under present day conditions the Amazon climate is characterized by a zonal separation of the dominance of the annual and semi-annual seasonal cycles. This behavior is strongly modified under greenhouse warming conditions, with the annual cycle becoming dominant throughout the Amazon basin, increasing differences between the dry and wet seasons. In particular, there are substantial changes in the annual cycle of temperature due to the increase in the temperature of the warmest month, but the lengthening of the dry season is believed to be particularly important for vegetation-climate feedbacks. Harmonic analysis performed to regional climate model simulations yields results that differ from the global climate model that it is forced from, with the regional model being more sensitive to changes in the seasonal cycle.

1. Introduction

The Amazon’s climate, including its seasonal cycle, is strongly dependent on the interchange of water between the troposphere and the underlying surface. As previously discussed in the literature (e.g., [1]), the driving force for this interchange is the water vapor pressure gradient between the evaporating surface and the overlying air. This complex interaction within the Amazon basin is also linked to the thermal and dynamical behavior of the troposphere induced by Sea Surface Temperature (SST) variations in the Pacific and Atlantic Oceans [2,3] which are greatly impacted by the El Niño Southern Oscillation (ENSO, [4]).
Currently, there is evidence that human emission of greenhouse gases are associated with an increase in temperature, which in turn may lead to substantial modifications of the hydrological cycle on both regional and global scales [5,6]. Several studies have explored the potential impact of human-induced global warming on the tropical environment and climate of South America (e.g., [6,7,8,9,10,11]). These studies indicate that future warming may drastically affect tropical forests and its hydrology. For example, the regional modeling study of Cook and Vizy ([7], hereafter CV08), projects a 70% reduction in the extent of the Amazon rainforest by the end of the 21st century. It should be noted however, that more recent studies [8] suggest some degree of resilience of tropical forests to future climate change. Ramming et al. (2010) [9] even argue that human induced climate changes may induce increased biomass in the Amazon forest that is due to the CO2 fertilization effect.
As discussed by [5,6,10,11,12,13,14,15,16], assessing the seasonal and spatial variation of thermodynamic fluxes is mandatory for a reasonable understanding of processes governing the exchange between the biosphere and the lower troposphere. For instance, Hutyra et al. [17] argued that drought frequency is an excellent predictor of the forest-savanna boundary, indicating the key role of extreme climatic events for inducing vegetation change. Moreover, vegetation fires and aerosol pollution are known to modify the Amazon´s seasonal cycle. Vegetation changes may also feed back onto climate. Future large-scale deforestation in Amazonia could alter the regional climate significantly, producing a warmer and somewhat drier post-deforestation climate [15,18,19].
Previous studies of South America have found that regional climate models improve the results of the global models they are downscaled from, e.g., with respect to climate sensitivity (reduced warming, [13]), precipitation bias (reduced dry bias, [15]), seasonal cycle of precipitation [14], and precipitation extremes [12].
The purpose of this paper is to explore in detail the simulated changes in seasonality of near-surface variables that are most closely related to vegetation growth and maintenance. Specifically, we provide an evaluation of the potential for change in the seasonal cycle of precipitation and air temperature at two meters by applying harmonic analysis (Fourier Transformation) to the regional model simulation of CV08. The performance of the regional and the global model it is forced from is compared and evaluated against state-of-the-art reanalysis.
The harmonic analysis provides a more complete understanding of the climate change associated with the replacement of the rainforest by largely dry savanna vegetation by the end of the 21st century. The majority of studies addressing the seasonal cycle characteristics are based on grid point areal averages or single weather station measurements. We have used a temporal harmonic analysis to yield a comprehensive spatial picture of the large-scale domain of the Amazon.

2. Methodology

2.1 The Coupled Climate Model and the Design of the Numerical Experiment

In order to investigate the relationship between greenhouse gas forcing and the Amazon´s seasonal cycle, two model simulations were performed with the Regional Climate Model (RCM) from the Pennsylvania State University/National Center for Atmospheric Research (PSU/NCAR) MM5 (v3.6) model coupled to the Noah land surface scheme [20,21] and the Potential Vegetation Model (PVM) of Oyama and Nobre [10], one for present day and one for future climate. These experiments are described in detail in CV08, therefore only a brief description is included here. A horizontal resolution of 60 km is used, with 24 vertical σ-levels and the time step of 1 minute.
The regional model domain includes the entire South American continent (from 55°S to 12°N, and 28°W to 92°W). The experiments include the Kain-Fritsch cumulus parameterization and the shallow cumulus parameterization of Grell et al. [19,20,21]. Cloud ice is included using the “simple ice” scheme. For the present day simulation, surface and lateral boundary conditions are taken from the NCEP/NCAR reanalysis climatology for 1981–2000. Future boundary conditions are constructed by adding differences between simulations of the present and future climates with the Coupled General Circulation Model (CGCM) version 3.1 from the Canadian Centre for Climate Modeling and Analysis (CCCMA), as archived for the IPCC’s Fourth Assessment Report. The future climate forcing of the regional model is based on increasing atmospheric concentration of greenhouse gases consistent with the IPCC’s A2 forcing scenario for 2081–2100.
The coupled model produces an accurate simulation of the present day climate and vegetation (CV08). Although the coupling of the PVM and the RCM is asynchronous, sufficient iterations are made to achieve vegetation that is in equilibrium with the simulated climate. The reader is referred to CV08 for further details on the coupling process. The analysis discussed here is based upon the 20-year climatologies for two simulations: 1981–2000 (PD-RCM simulation) and 2081–2100 (GW-RCM simulation). For the PD case, atmospheric reanalysis data has been used rather than the CGCM results to force the model, as this approach yields a more realistic vegetation distribution. When CGCM data is used as boundary conditions for the RCM in the GW future calculations, lateral and surface boundary conditions are constructed by adding differences between the 2081–2100 and 1981–2000 means from the CCCMA integrations to the 1981–2000 reanalysis values and observed SSTs, for the sake of consistency.
To verify the model performance we have compared the RCM’s and CCCMA’s temperature and precipitation to the 20-year (1981–2000) climatology of ECMWF ERA-Interim, University of Delaware dataset (UDel), Climatic Research Unit dataset (CRU [22]), and the Climate Forecast System Reanalysis (CFSR, [23]). Precipitation is validated against the 1981–2000 climatology of CRU, Global Precipitation Climatology Project (GPCP) and UDel. The GPCP Precipitation data is provided by NOAA/OAR/ESRL PSD, Boulder, Colorado, USA, from their Web site at http://www.esrl.noaa.gov/psd/. The UDel data is provided by the NOAA/OAR/ESRL PSD, Boulder, Colorado, USA, from their Web site at http://www.esrl.noaa.gov/psd/.

2.2 Harmonic Analysis

Harmonic analysis has emerged as a useful tool in studying temporal patterns of meteorological parameters [24]. In order to evaluate climate change impacts, climate information is usually needed at the regional scale. As discussed by Aslan et al. [24], Fourier transformation or harmonic analysis decomposes a time-dependent periodic phenomenon into a series of sinusoidal functions, each defined by unique amplitude and phase values. The proportion of variance in the original time-series data set accounted for by each term of the harmonic analysis can also be calculated [25,26]. The first order harmonics of meteorological parameters resolve long time scales, while higher order harmonics represent gradually shorter time scale fluctuations. In this work we analyze an annual cycle, thus one year is the longest time scale in our analysis. The phase angle can be used to determine the time of the year in which the maximum or minimum of a given harmonic occurs [24,25,26].
Several studies have focused on the semi-annual harmonic due to its climate linkage with distinct climate modes, such as the Southern Annular Mode (SAM), the quasi-stationary wave-3 pattern (ZW3), and the Pacific South American pattern (PSA) (e.g., [27]). During the last four decades several studies have explored the use of harmonic analysis to characterize the SH polar climate. Van Loon [28] utilized harmonic analysis to identify that the temperature contrast between middle and polar latitudes in the Southern Hemisphere is linked to increased cyclonic activity in high latitudes over the Antarctic Ocean. While the use of harmonic analysis has been successfully applied for the understanding of the extra-tropical climate, this tool has not been widely used for quantifying the tropical climate variability.

3. Results and Discussion

3.1. Present Day Climate
The Amazon´s climate under present day conditions is primarily influenced by the position of the Inter-Tropical Convergence Zone (ITCZ), the Andes, the eastern Pacific and Atlantic Oceans, and by vegetation and soil moisture contrasts (e.g., [3,7]).
Here we explore the possibility that increasing greenhouse gas concentrations may perturb future seasonal cycles in the Amazon basin. We analyze the regional distribution of near surface air temperature (t2m) and precipitation annual and semi-annual cycles using harmonic analysis, by comparing the modern climate with future climate according to the A2 scenario. This study adds to CV08 in the sense that the semi-annual and annual cycles are analyzed in terms of variance and amplitude over the entire Amazon region. Further, the present day climate is compared with additional datasets not examined by CV08, for instance the CFSR reanalysis.
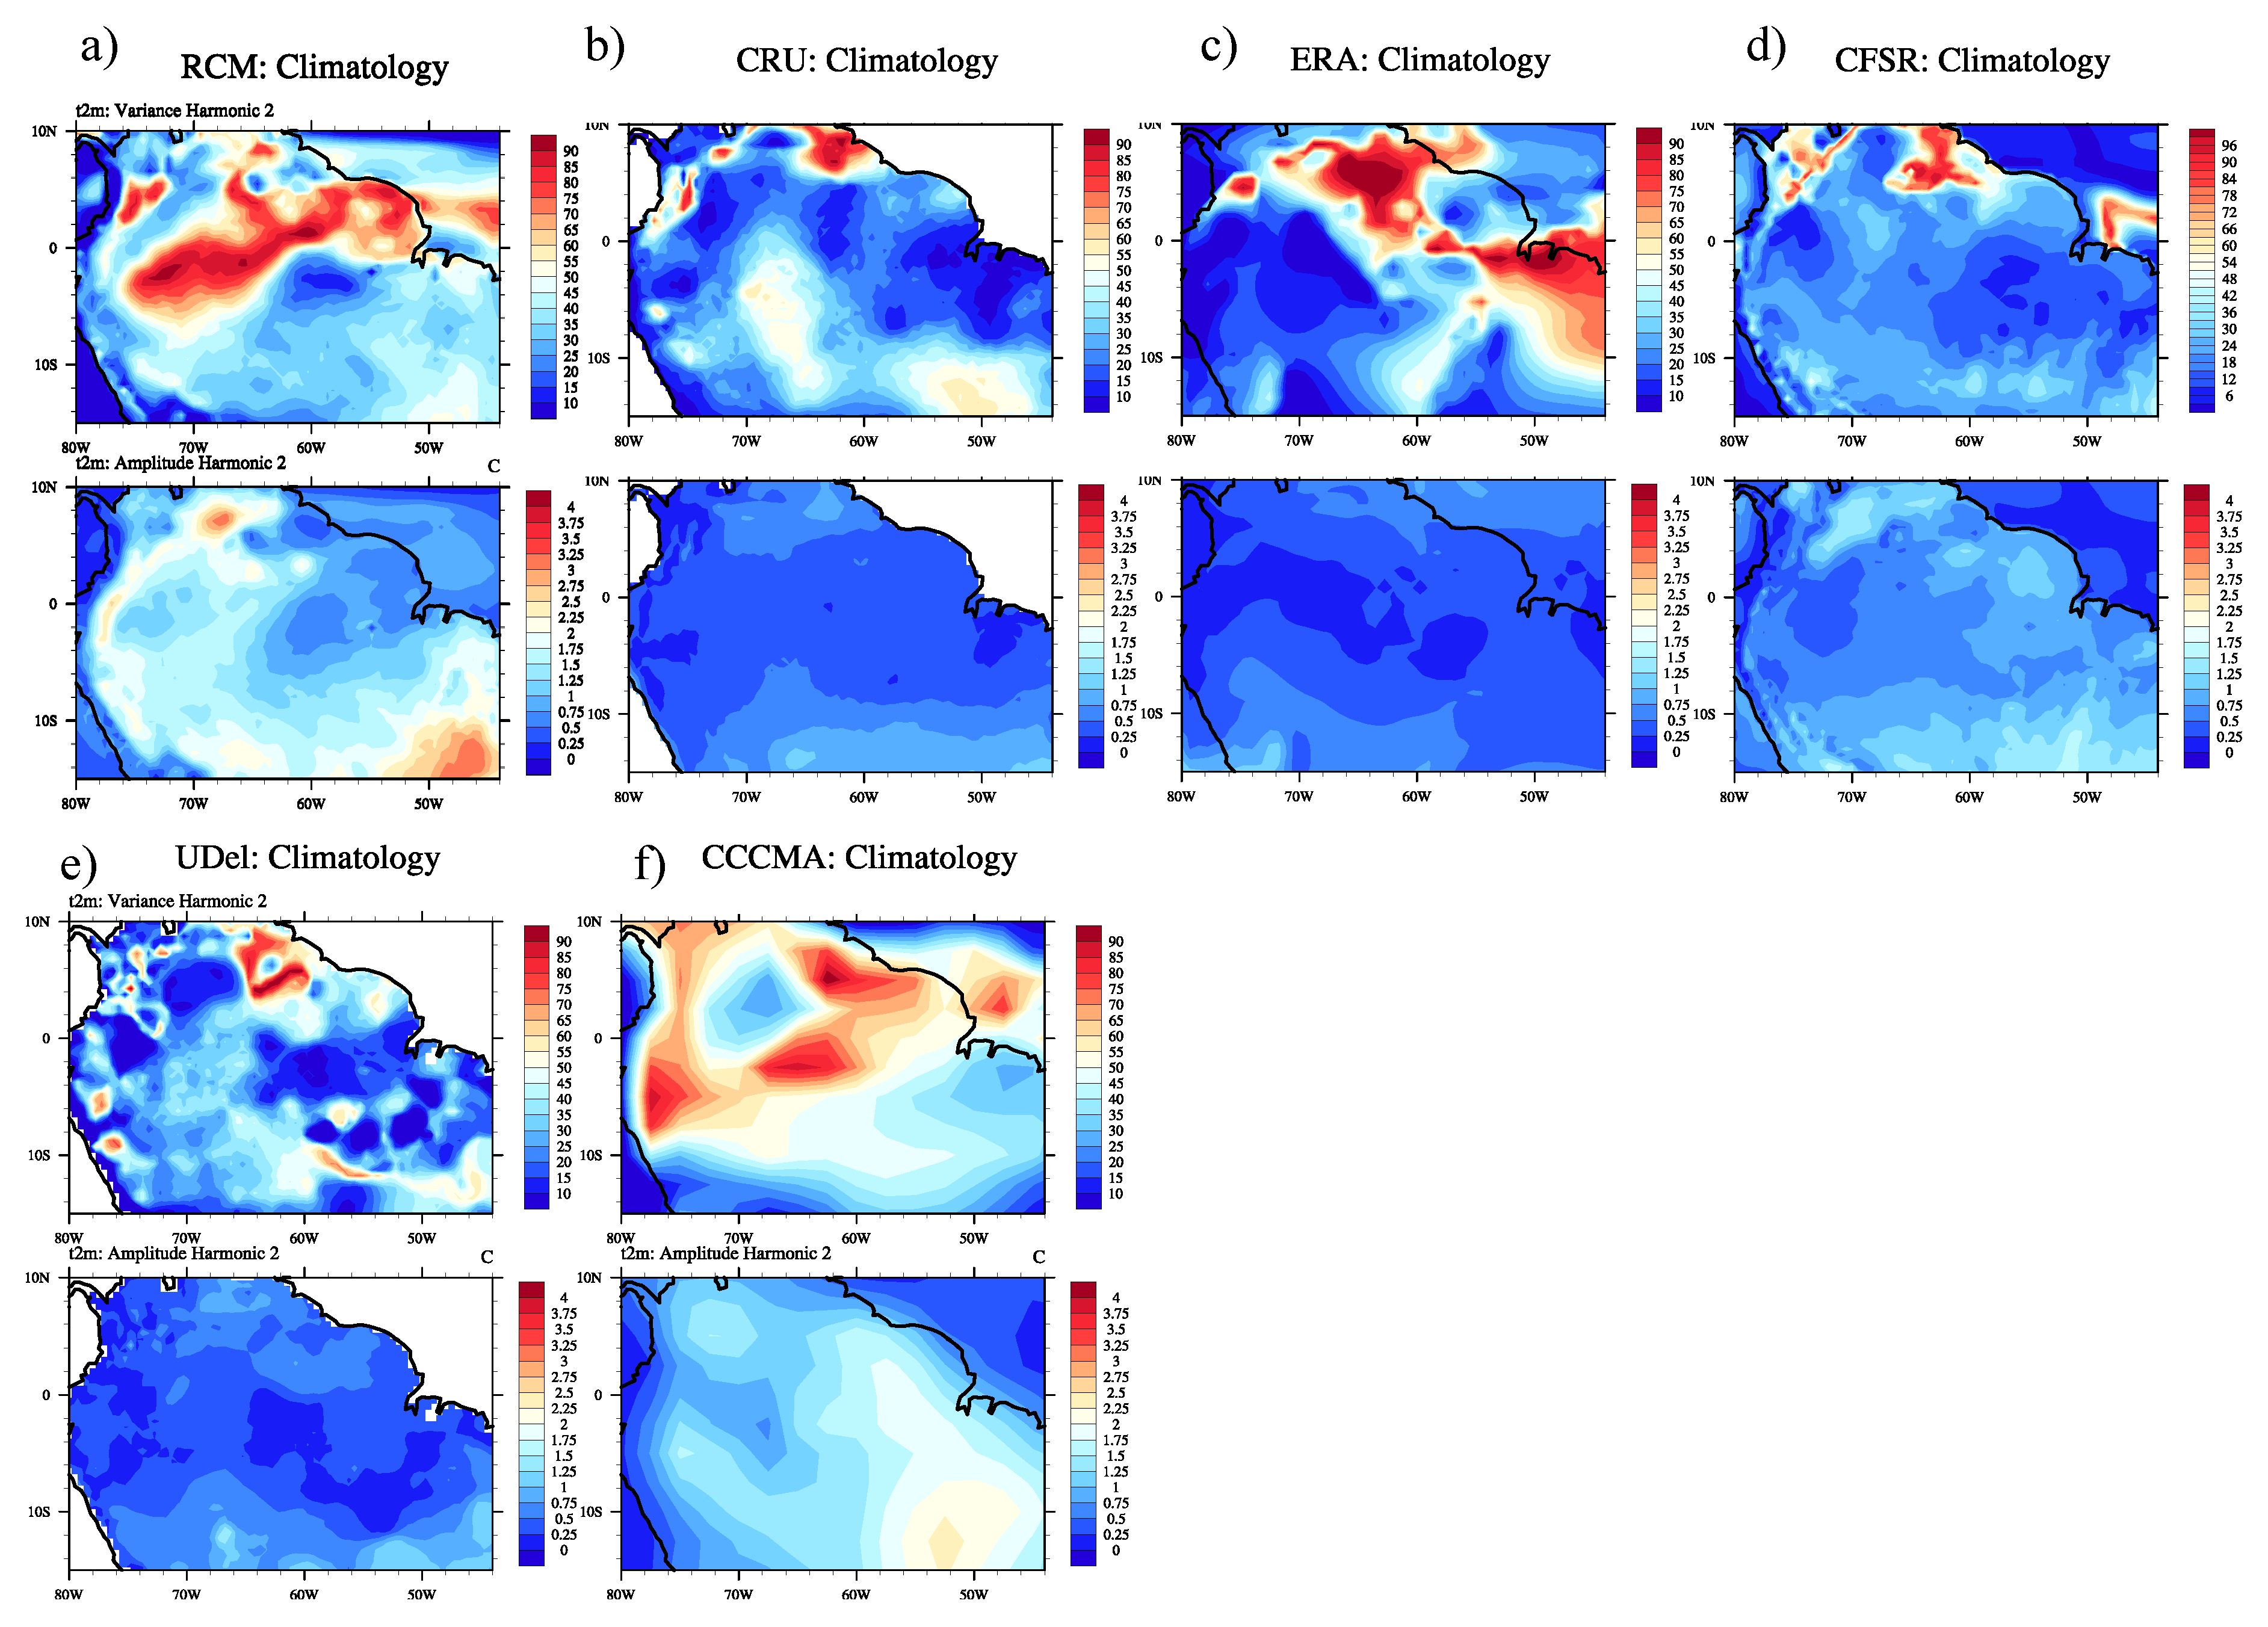
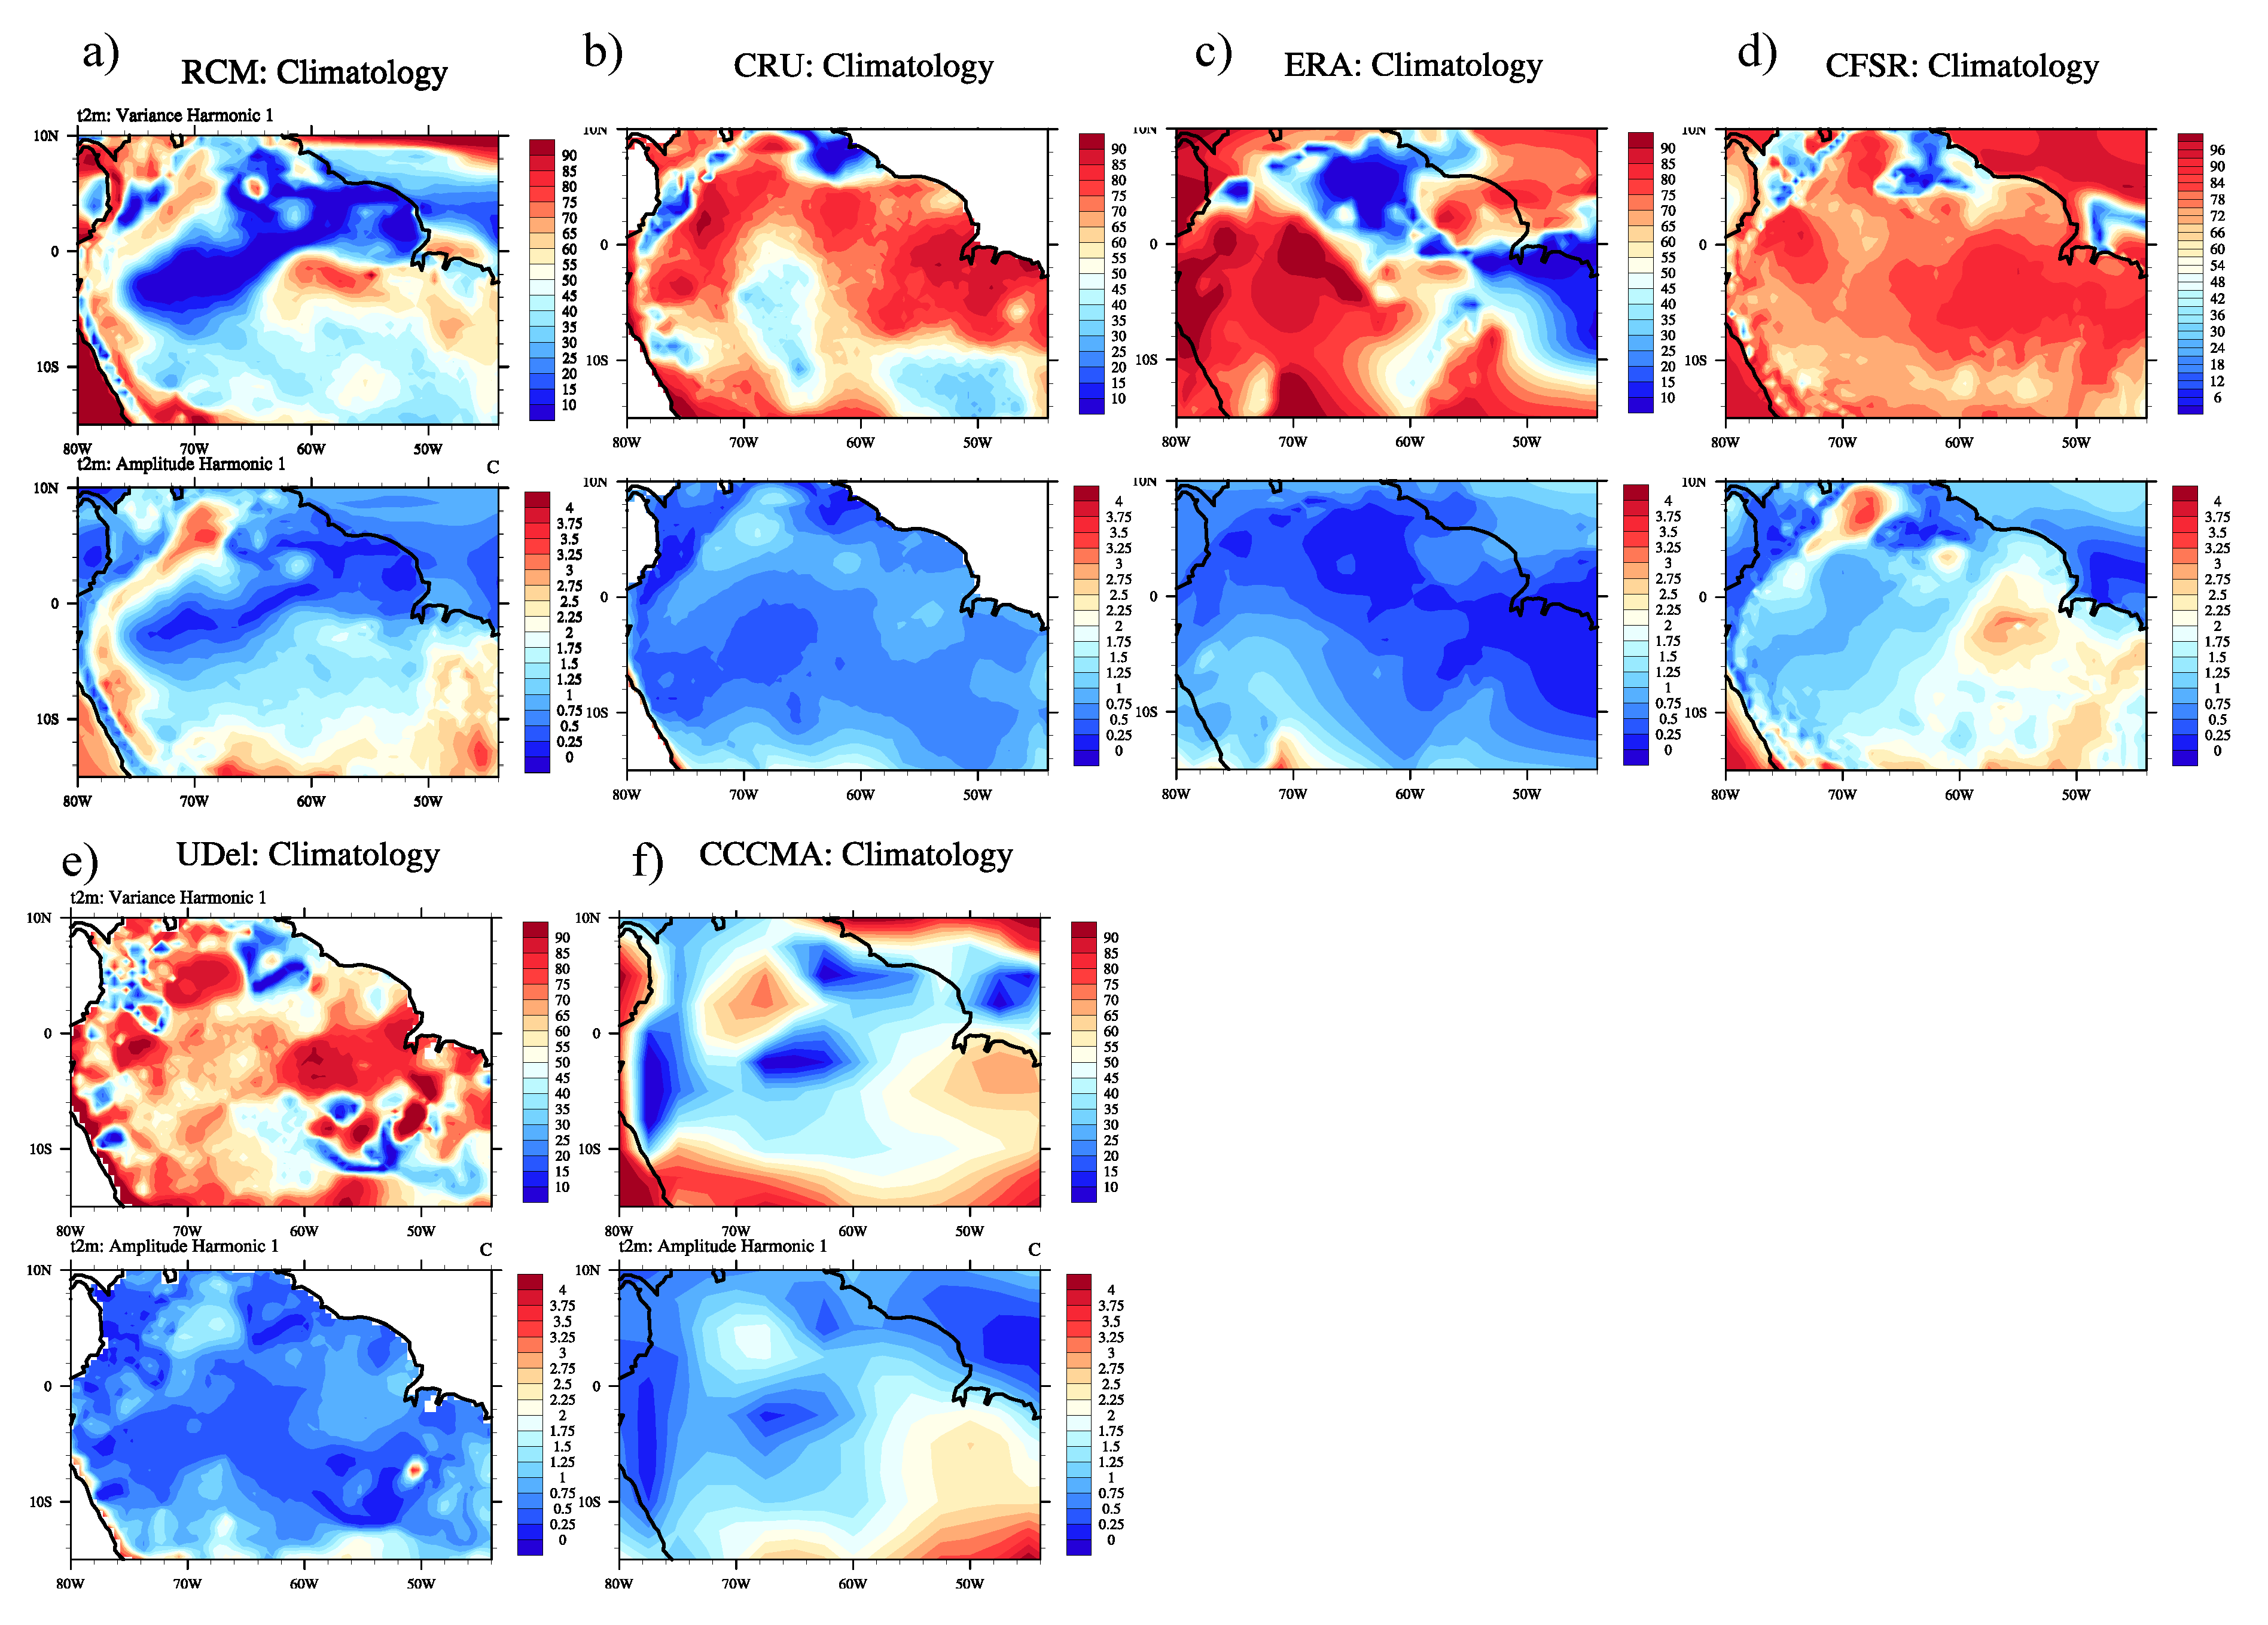
Figure 1a shows the proportion of the variance that is captured by the first harmonic, revealing the annual cycle dominance. The RCM results under present day conditions (Figure 1a) indicate that the simulated t2m variability in the western part of the Amazon region is not dominated by the annual cycle, since it explains only 20%–40% of the variance. However, over the northeastern part of the basin variability of t2m are associated with the first harmonic.
Figure 1. Explained variance (top panels %) and amplitude (lower panels °C) of the first harmonic of t2m. (a) PD-RCM simulation (b) CRU, (c) ERA-Interim, (d) CFSR, (e) University of Delaware dataset, and (f) the CCCMA.
Climate 04 00003 g001
Comparing results from PD-RCM to the reanalysis/observational data (Figure 1b–d) reveals that PD-RCM yields similar patterns over the central part for the Amazon basin, in particular with CRU [28] (ERA) over central (northwestern) Amazon. Nevertheless, the model and reanalysis/observational data differ in respect to the explained variance in the sense that the reanalysis/observations show stronger annual cycle (variance higher than 70%) over western Amazon, as compared to the PD-RCM. Indeed, the region with the strongest annual cycle over western Amazon is smaller in PD-RCM. It should be noted that differences are also noticeable between the reanalysis/observation products. Rocha et al. and Li et al. Authors in [29,30,31] have also demonstrated large biases in RCM simulations and observations/reanalysis over northern South America.
The PD-RCM is run at a spatial resolution that allows for a better resolved interchange of latent and sensible heat fluxes between the biosphere and the overlying atmosphere. Therefore, land surface processes associated to the seasonal growth/decay of the rainforest, including soil moisture, might be an important source in reducing the annual cycle strength over the western part of Amazon in our modeling approach.
The second harmonic analysis component is the amplitude. It characterizes differences between the highest and lowest values of the meteorological parameter along the annual/semi-annual cycles or shorter periodic signals. The simulated present day amplitude of t2m (Figure 1a lower panel) does exhibit strong seasonal variability over the eastern and southern Amazon, with values up to 3 °C, in a region known as the Arc of Deforestation. The amplitude is higher where the annual cycle is dominant as determined by the variance. This may indicate the influence of the Amazon deforestation on the PD-RCM climate. Reduction in the latent heat flux associated with the replacement of forest to pastures results in increased sensible heat flux and subsequently a warmer dry season. Thus, the annual cycle of the amplitude is increased. On the other hand, over the western part of the basin, where the partitioning of latent and sensible heat fluxes hardly changes annually, the annual cycle is weaker.
Differences in the magnitude of the annual cycle between the PD-RCM, CRU, ERA-Interim and CFSR are small in terms of spatial distribution and magnitude of values. It should be emphasized that very good agreement between the PD-RCM and the CFSR dataset is noted (Figure 1a,d).
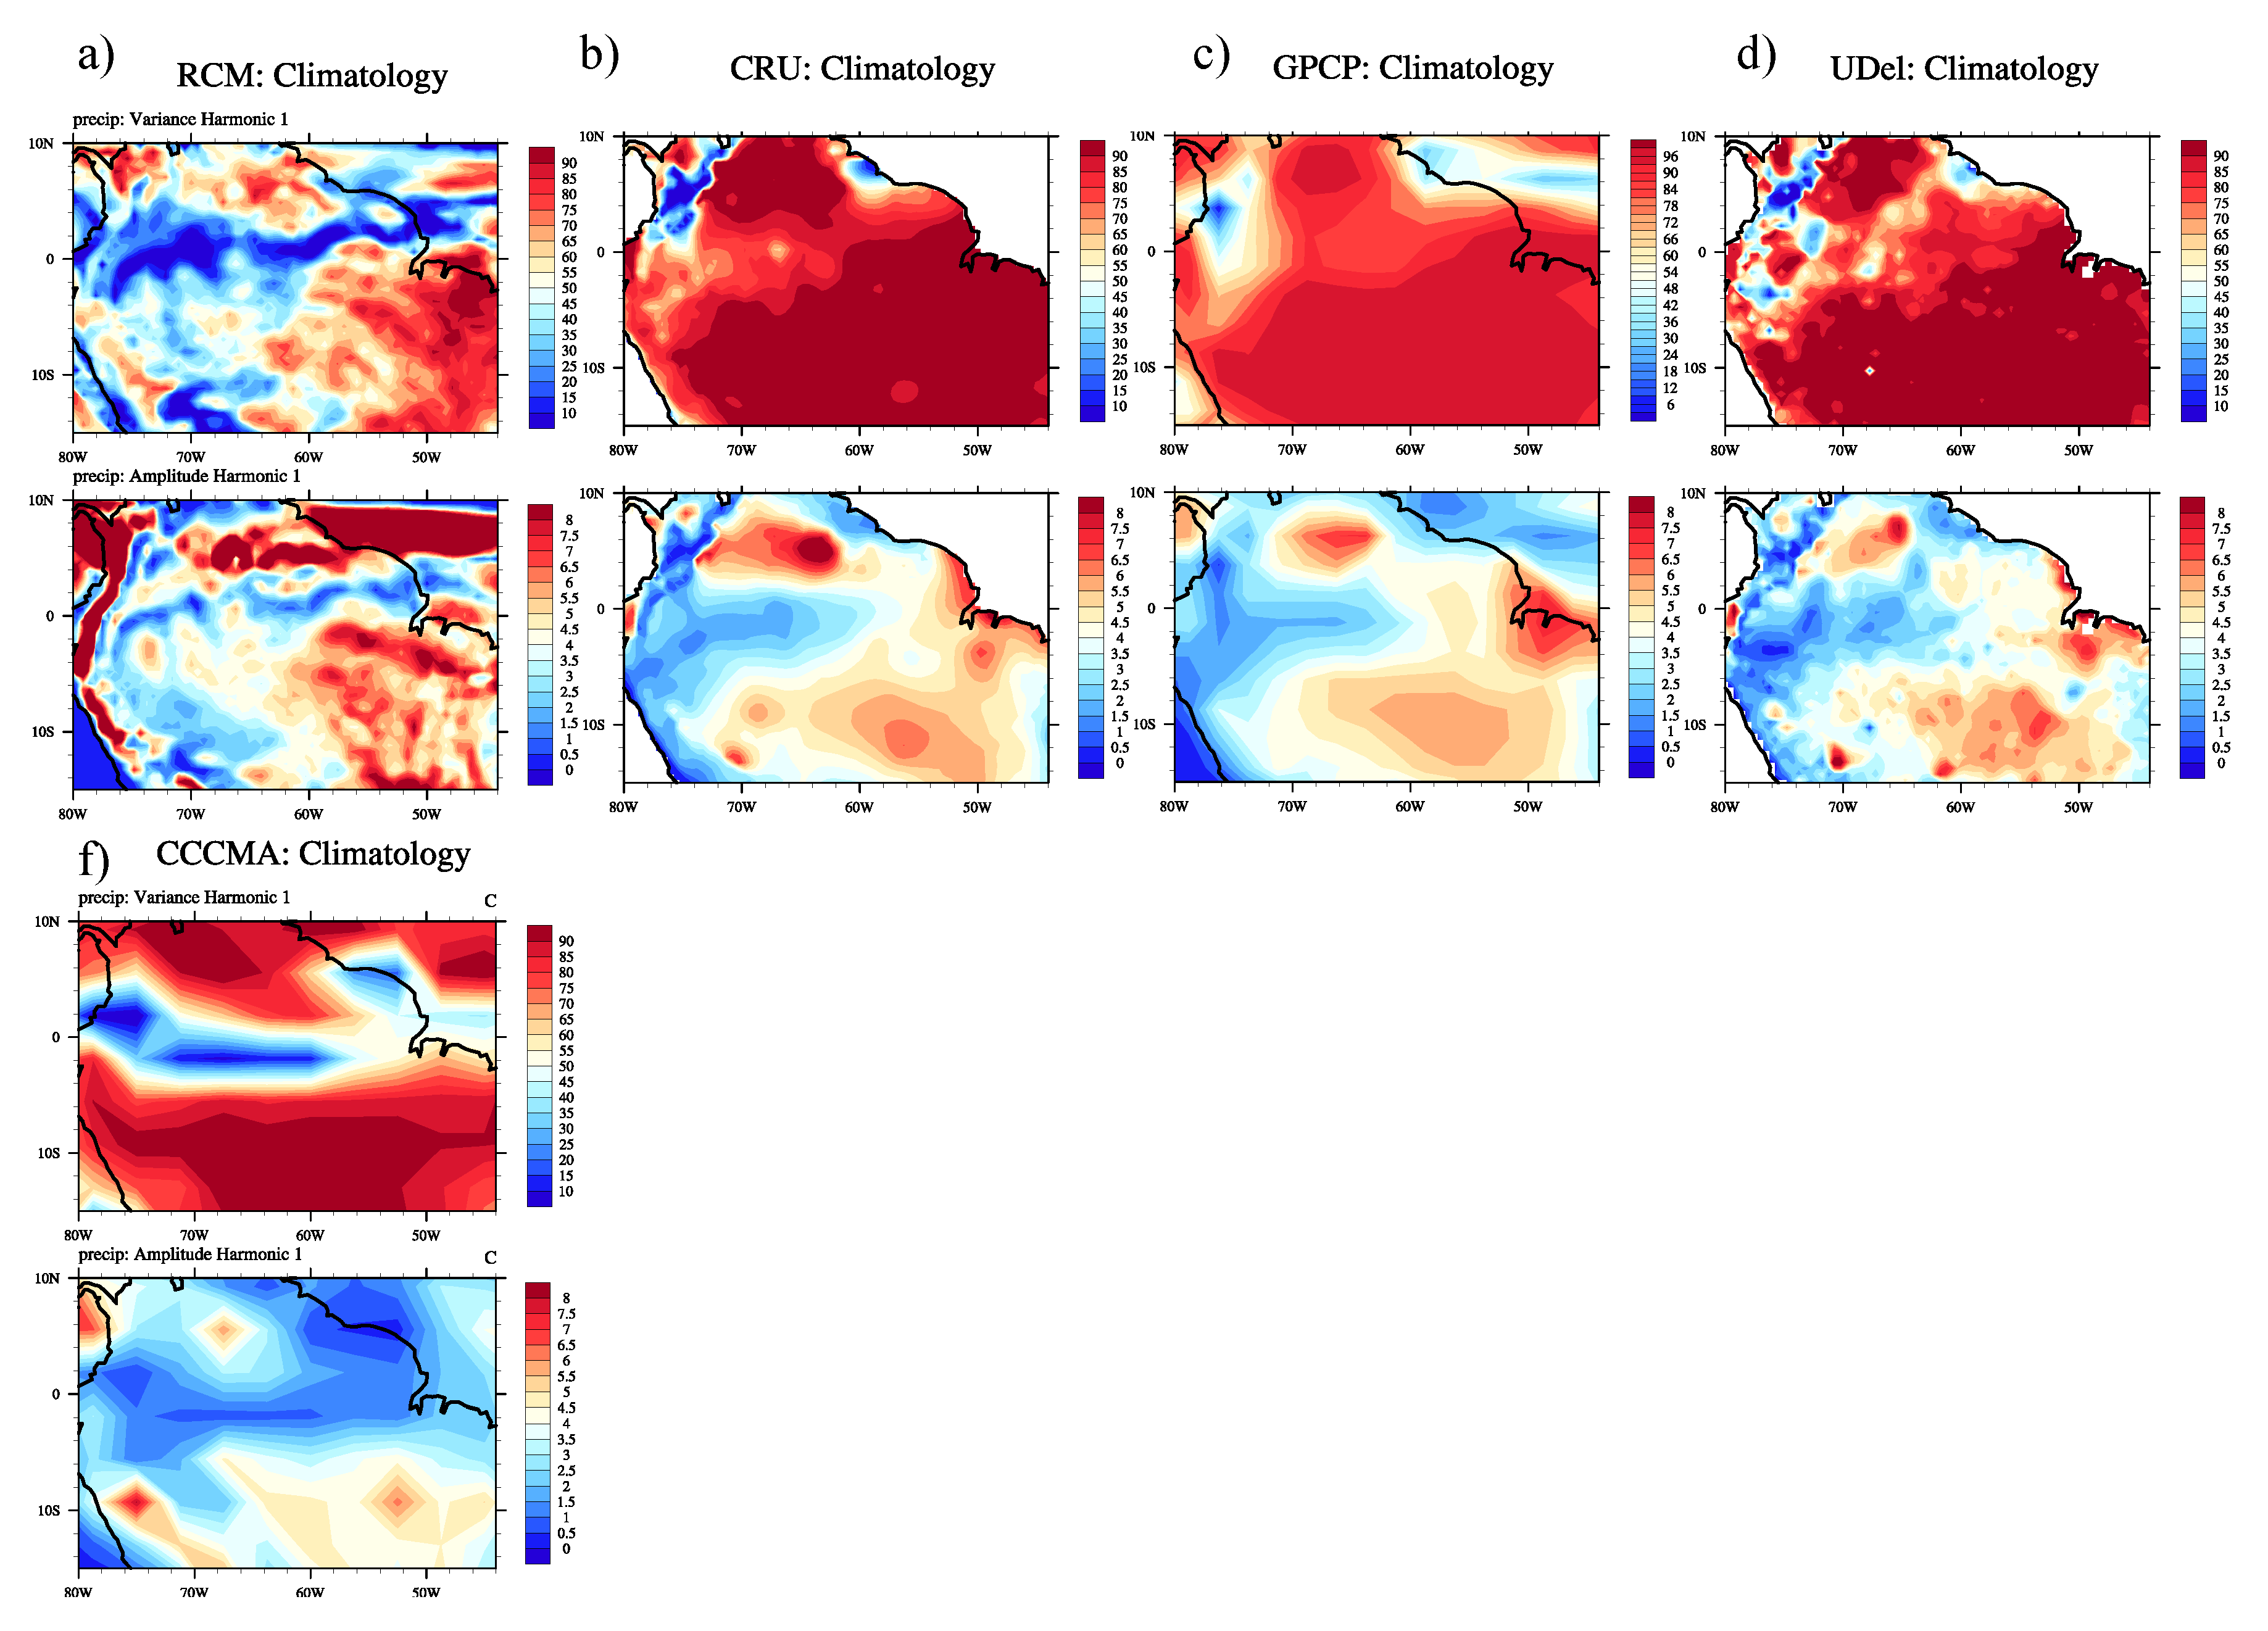
Analysis of the second harmonic variance of t2m as simulated by the PD-RCM demonstrate that this harmonic is dominant in regions where the first harmonic only weakly explains the time variability (Figure 2a). This is highlighted in the western and northern Amazon, because local climate is strongly associated with wind flow reversal due to the South America monsoon and the trade winds. Intra-seasonal meso-scale convective systems that act as heat sources may also play a role [32]. In the Amazon basin, the third and the fourth harmonics, which represent shorter time scales, explain very little of the variance, in particular for t2m, as only 20% of the time variability is explained by the higher order harmonics. The second harmonic of t2m in the ERA-Interim, CRU, UDel, and CFSR datasets exhibits lower variance than that simulated in PD-RCM.
Figure 2. The same as in Figure 1 but for the second harmonic. (a) PD-RCM simulation (b) CRU, (c) ERA-Interim, (d) CFSR, (e) University of Delaware dataset, and (f) the CCCMA.
Climate 04 00003 g002
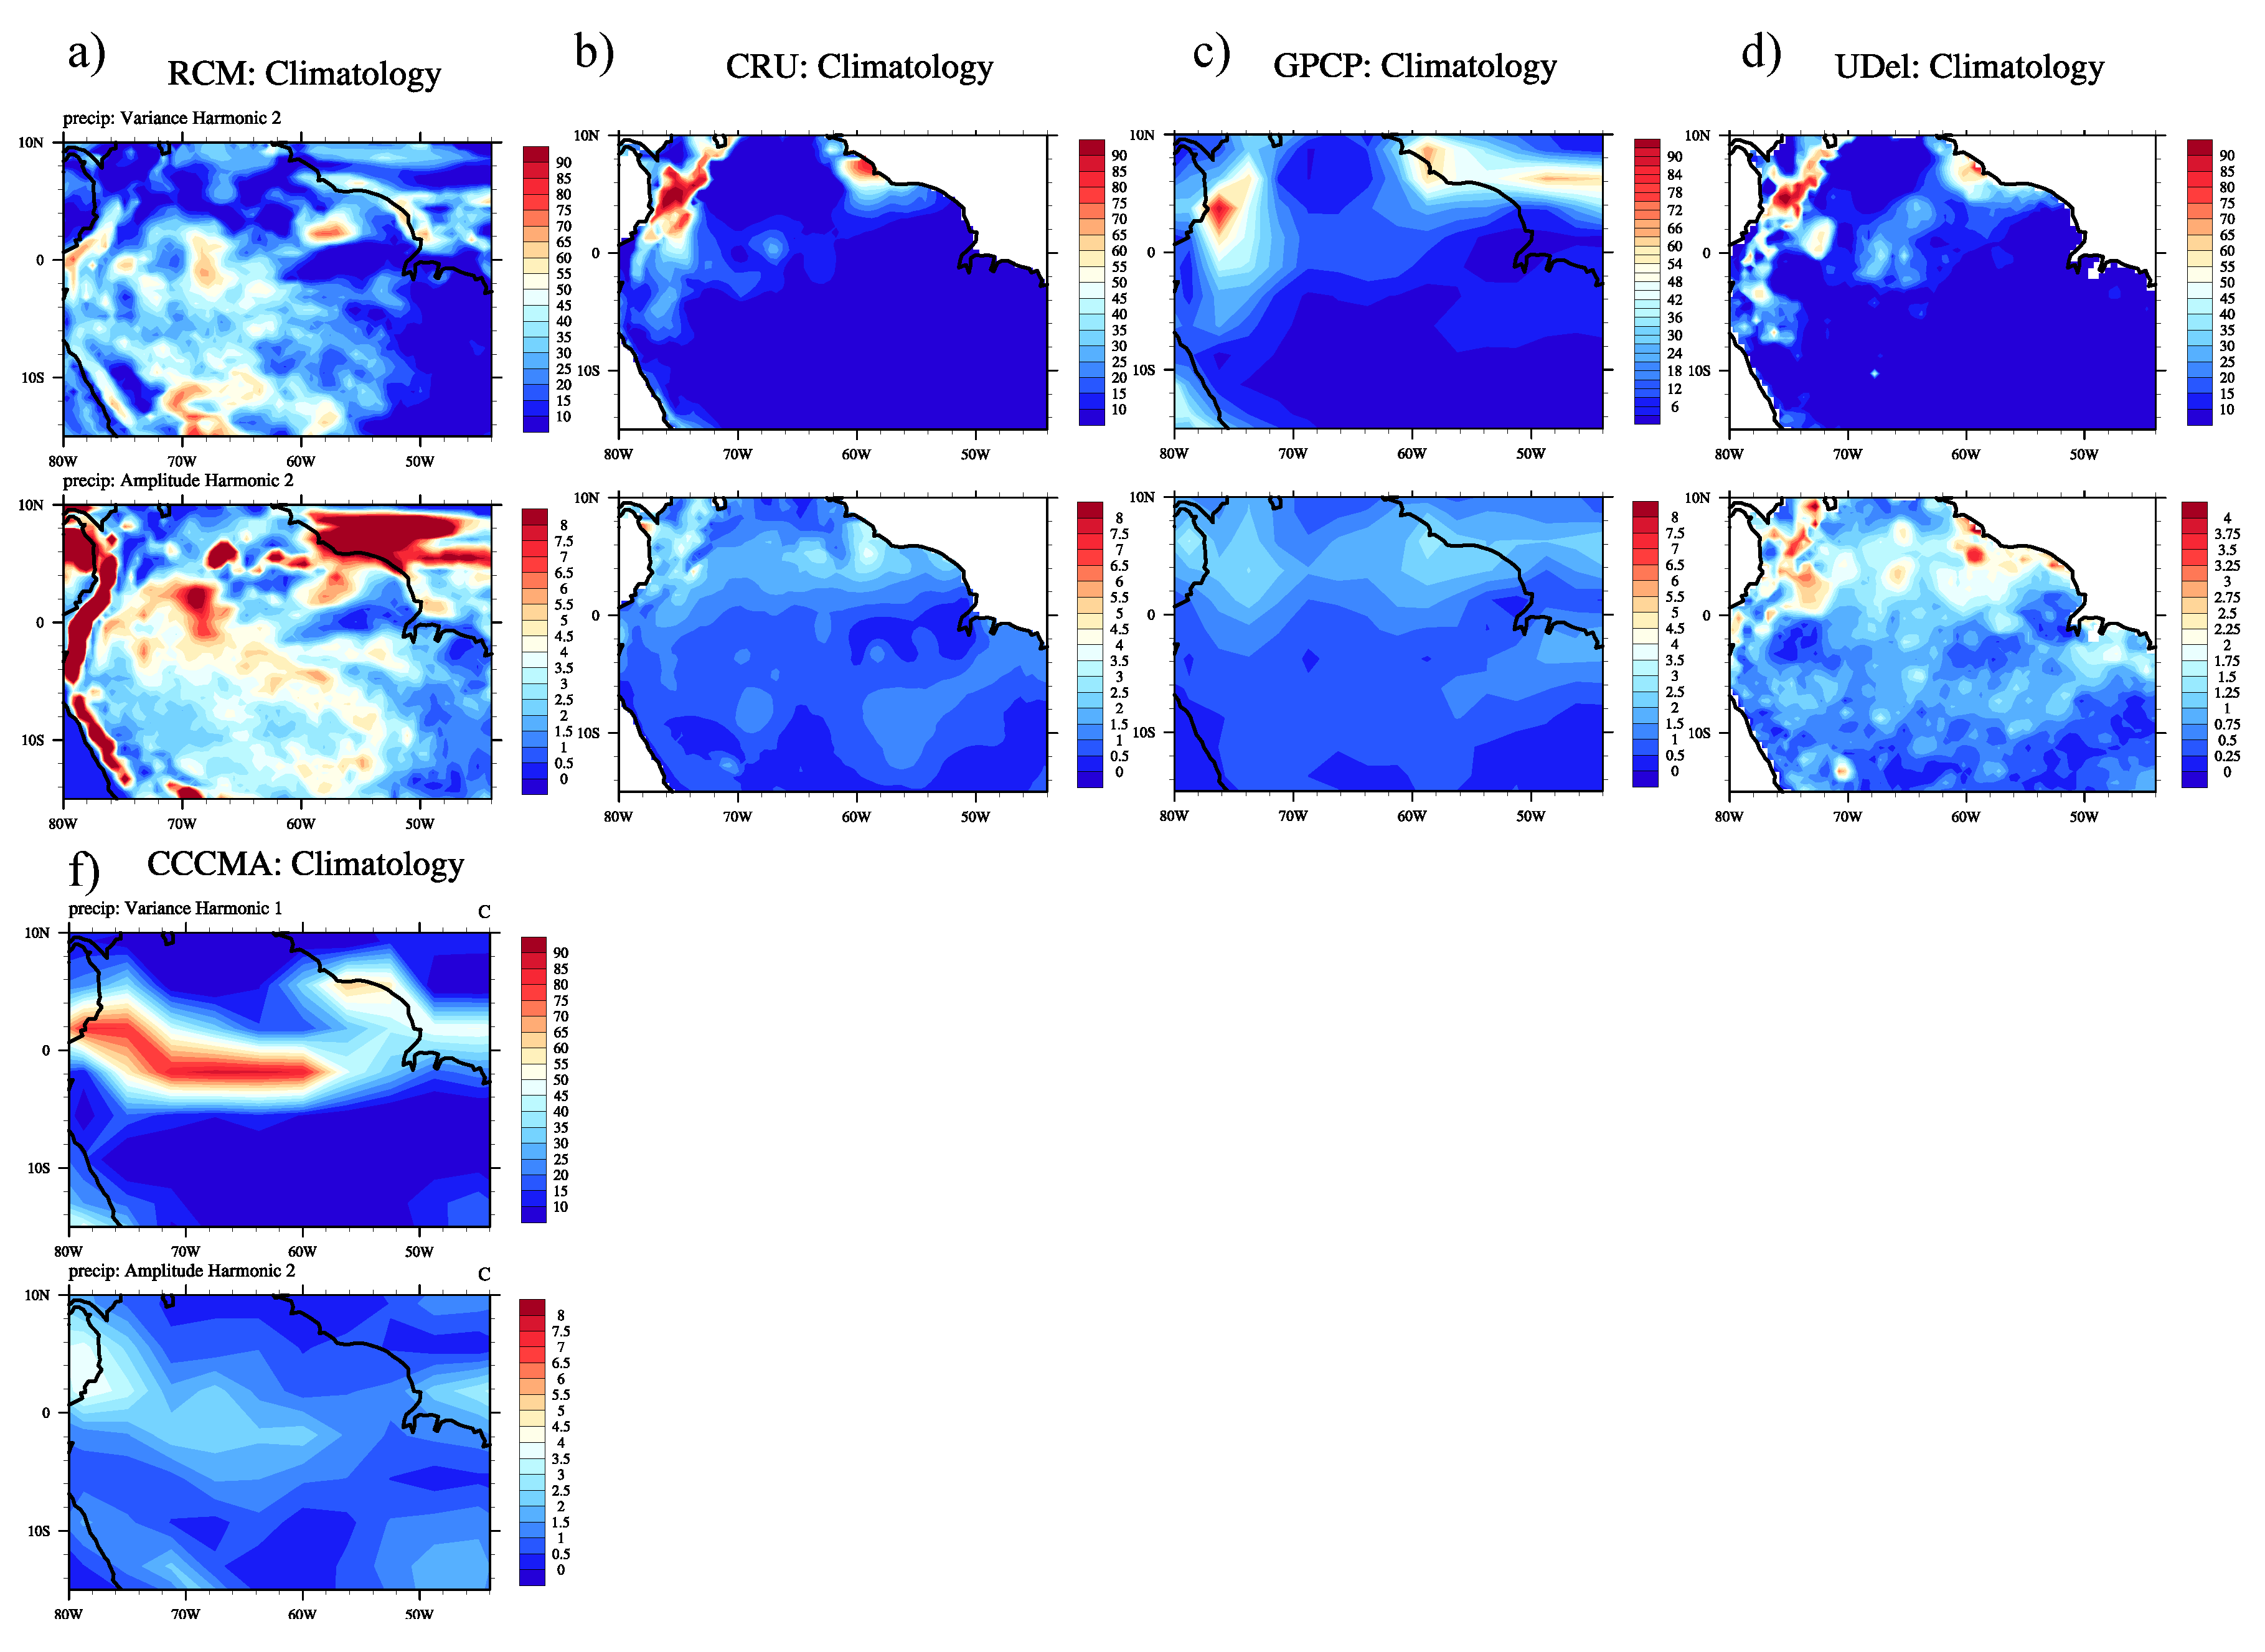
It should be noted that for precipitation (Figure 3) and q2m (not shown) the annual cycle dominates over eastern Amazon in PD-RCM. There is a separation in terms of dominance of the annual and the semi-annual cycles between the eastern and western parts of the Amazon basin (Figure 3a). The strengthening of the annual cycle over the eastern part may be associated with the clearance of the Amazon forest and perhaps less evapotranspiration induced-precipitation. Under these conditions, the precipitation is primary related to large-scale processes. Marengo et al. [3] argued that the nearby Atlantic Ocean plays a prominent role in dictating the time variability of the climate in eastern Amazon, due to the advection of moisture and heat. The precipitation distribution according to CRU, GPCP data, and UDel (Figure 3b–d) is primarily dominated by the annual component. Interestingly, the datasets match well in terms of their amplitudes.
Figure 3. Explained variance (top panels %) and amplitude (lower panels °C) of the first harmonic of precipitation. (a) PD-RCM simulation (b) CRU, (c) GPCP, (d) UDel, and (e) the CCCMA.
Climate 04 00003 g003
Analysis of the amplitude of q2m reveals a pattern which is different compared to precipitation, though their variances are similar. One may argue that annual changes of forest evapotranspiration alone is not sufficient to produce the actual annual changes of precipitation. This enhances the likelihood that the assumption that dynamical processes associated with moisture advection into the Amazon basin, as well as small-scale features related to soil moisture, are important contributors to regional precipitation. These mechanisms maintain the atmosphere throughout the year with relatively small changes in the amount of water vapor. On the other hand, in places where the forest is absent (e.g., 6°S–12°S and 54°W–45°W region) the annual cycle is stronger due to larger q2m seasonal changes. In the dry season, grass and pastures tend to partially close their stomata to retain water, but forests which have more extensive roots may absorb water from deeper soil layers, reducing changes in evapotranspiration.
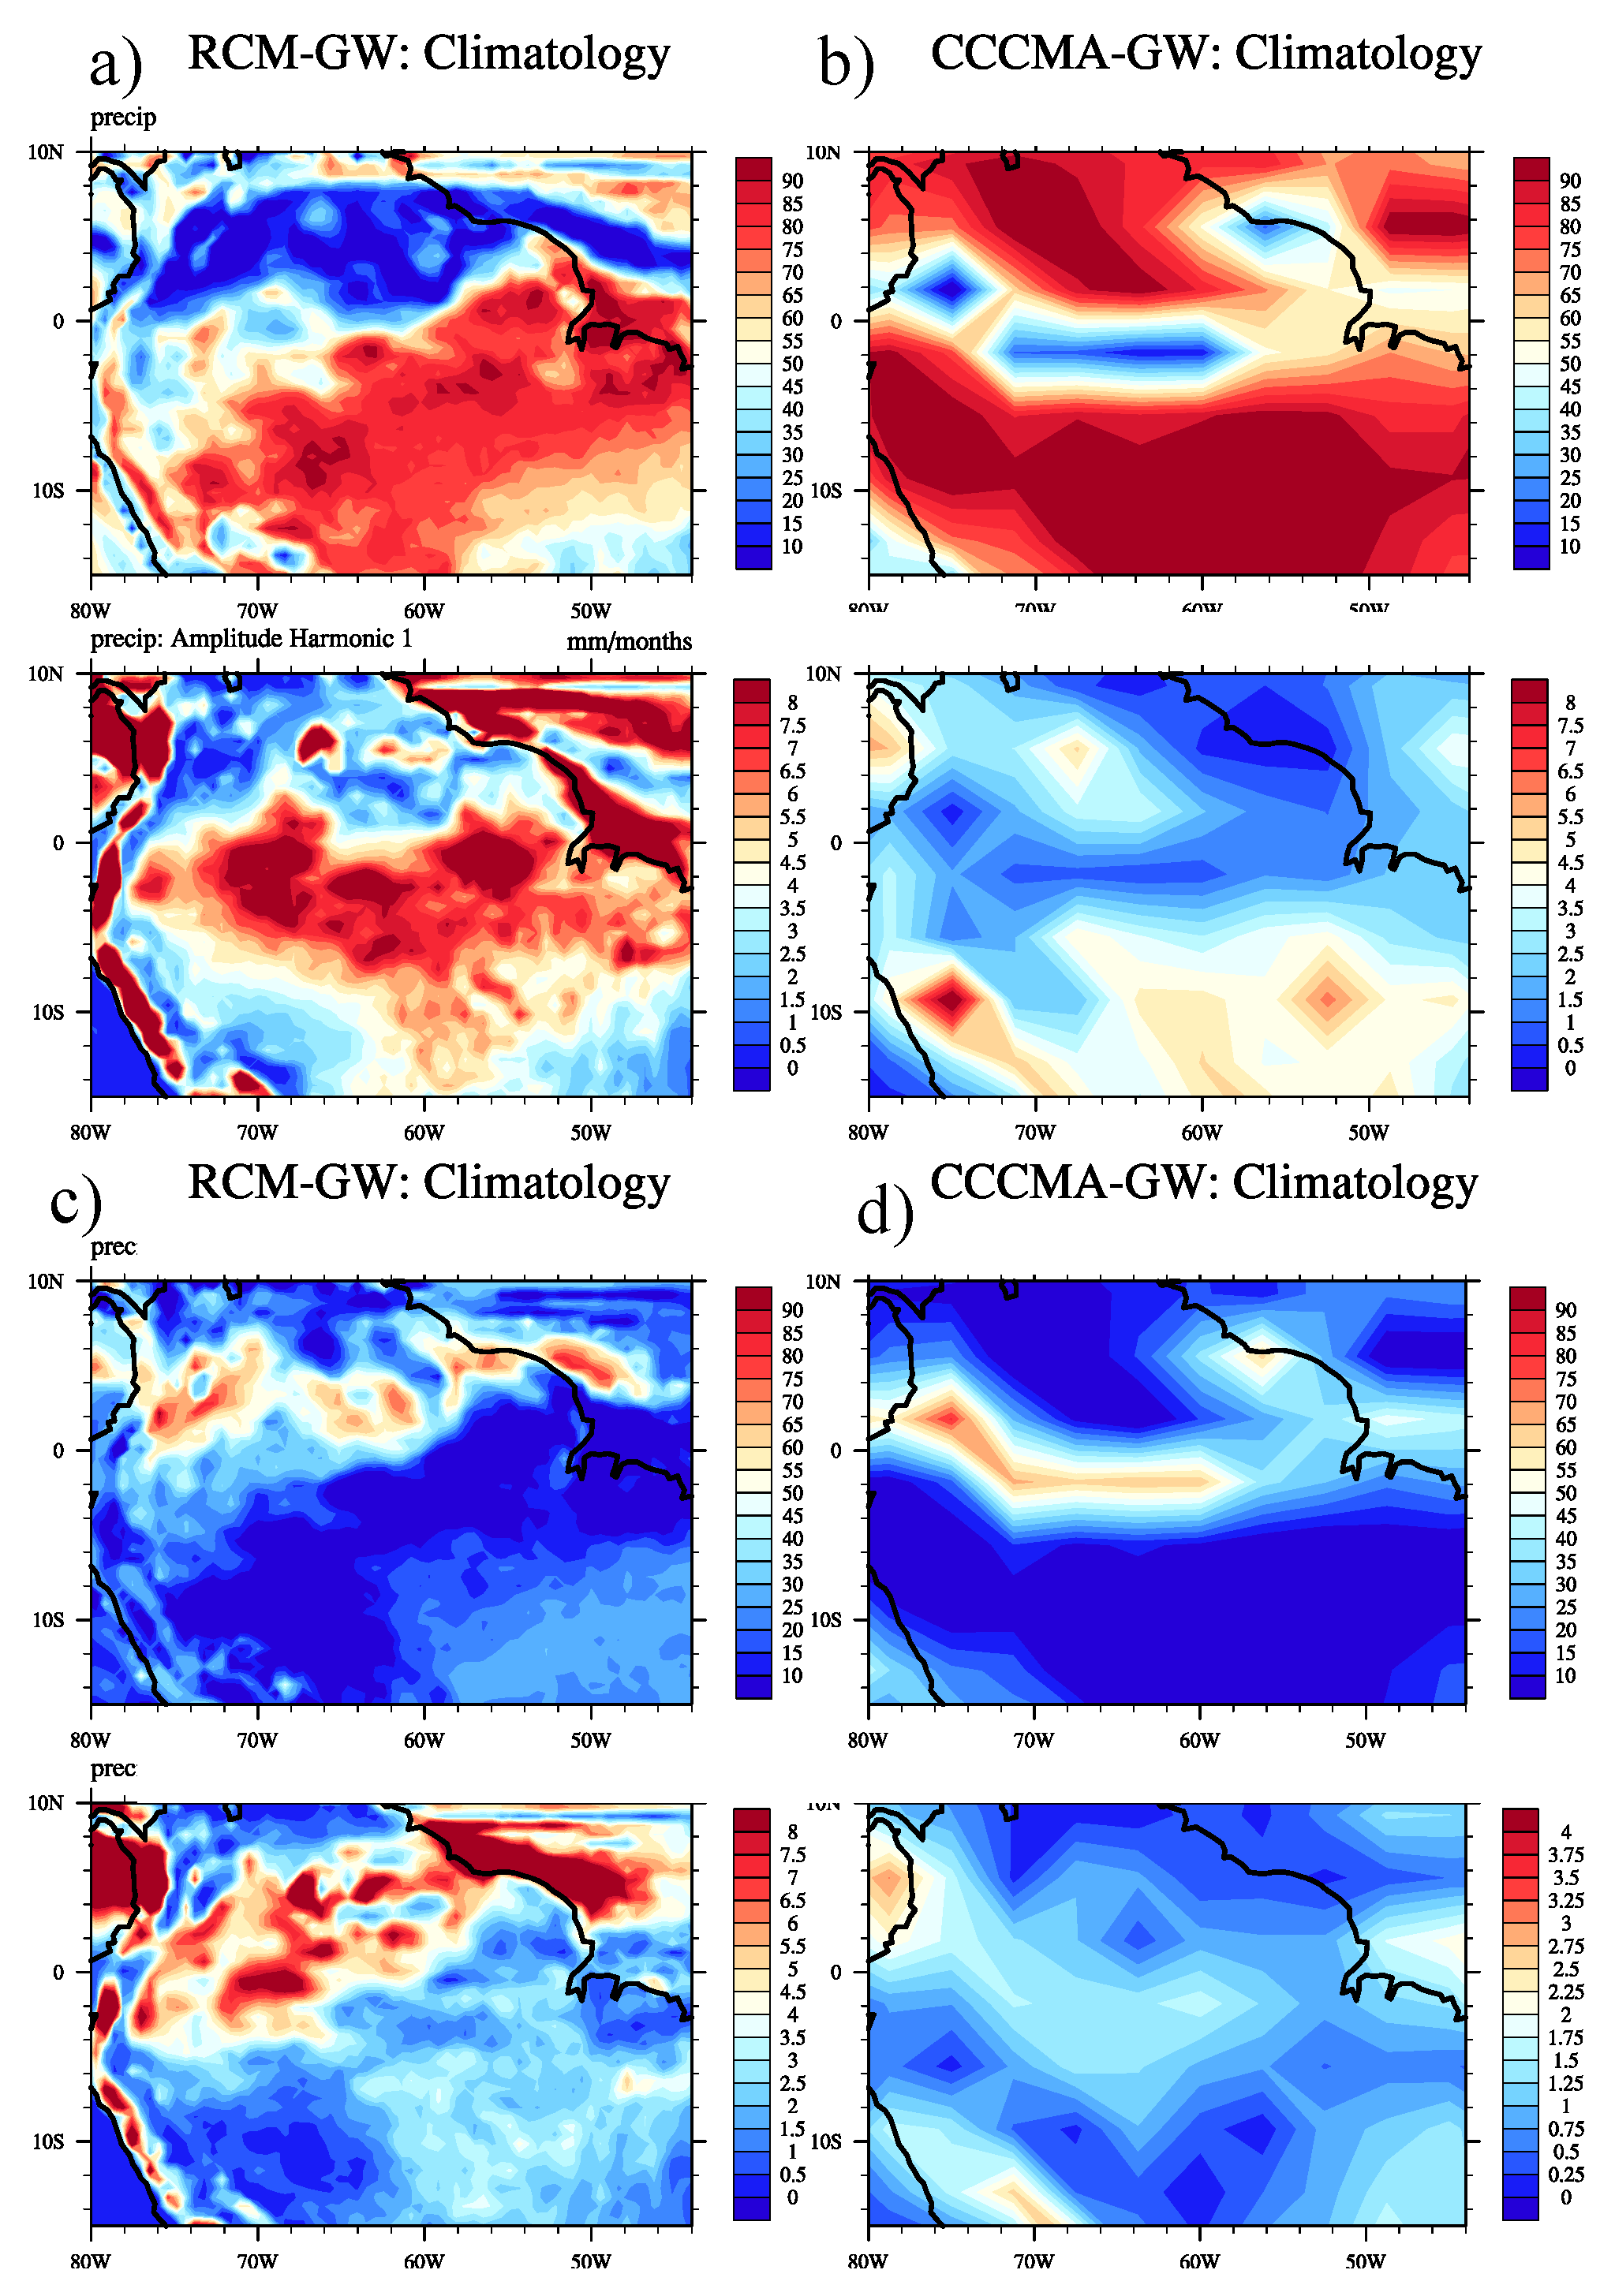
The largest differences between PD-RCM and the observations are depicted by the second harmonic (Figure 4). The latter indicate very little influence of the semi-annual cycle in the Amazon precipitation. Intra-seasonal variability plays a role over the northwestern part of the basin. The PD-RCM precipitation exhibits, however, significant influence of temporal meso-scale processes (Figure 4a lower panel).
Harmonic analysis has also been applied to the CGCM 3.1 PD-CCCMA 1981–2000 climatology (Figure 1f, Figure 2f, Figure 3d, and Figure 4d). This model has been used develop the future boundary conditions of the regional model simulation. Note that according to the explained variance under present day conditions, the CCCMA exhibits a similar annual cycle compared to PD-RCM, insofar the t2m variability is concerned (Figure 1a,f). There is also reasonable agreement between PD-RCM and PD-CCCMA of when the maximum and minimum values occur for t2m (not shown). However, the regional and global model datasets disagree for precipitation over the southern part of the Amazon basin (as in [12,13,15,30]). In this area, large-scale atmospheric processes, such as the South Atlantic Convergence Zone and the presence of recurrent frontal systems, dictate the seasonal variability. It was not anticipated that CCCMA would have strong agreement with observational datasets.
Figure 4. Same as Figure 3 but for precipitation (mm/month). (a) PD-RCM simulation (b) CRU, (c) GPCP, (d) UDel, and (e) the CCCMA.
Climate 04 00003 g004

3.2. Greenhouse Warming Climates Anomalies
Differences in t2m and precipitation between PD-RCM and GW-RCM were discussed by CV08. They note that GW forcing is associated with warmer temperatures, with warming as high as 4 °C, and a reduction in precipitation by up to 2 mm/day over most of the Amazonian region.
Vizy and Cook [32] argued that humid and dry conditions over the Amazon are closely related to the land surface conditions. For instance, it has been demonstrated that during the dry season, when total rainfall is less than 100 mm, the soil moisture storage available for root uptake in the top three-meter layer is sufficient to maintain high evapotranspiration rates, which are equal to or even higher than during the wet season [33]. Moreover, water uptake from deep soil layers has been found to contribute significantly to the dry season transpiration at some sites in Amazonia. Kleidon and Heimann [34] found that a large area covered by the evergreen forest in Amazonia depends on deep roots to survive during the dry season.
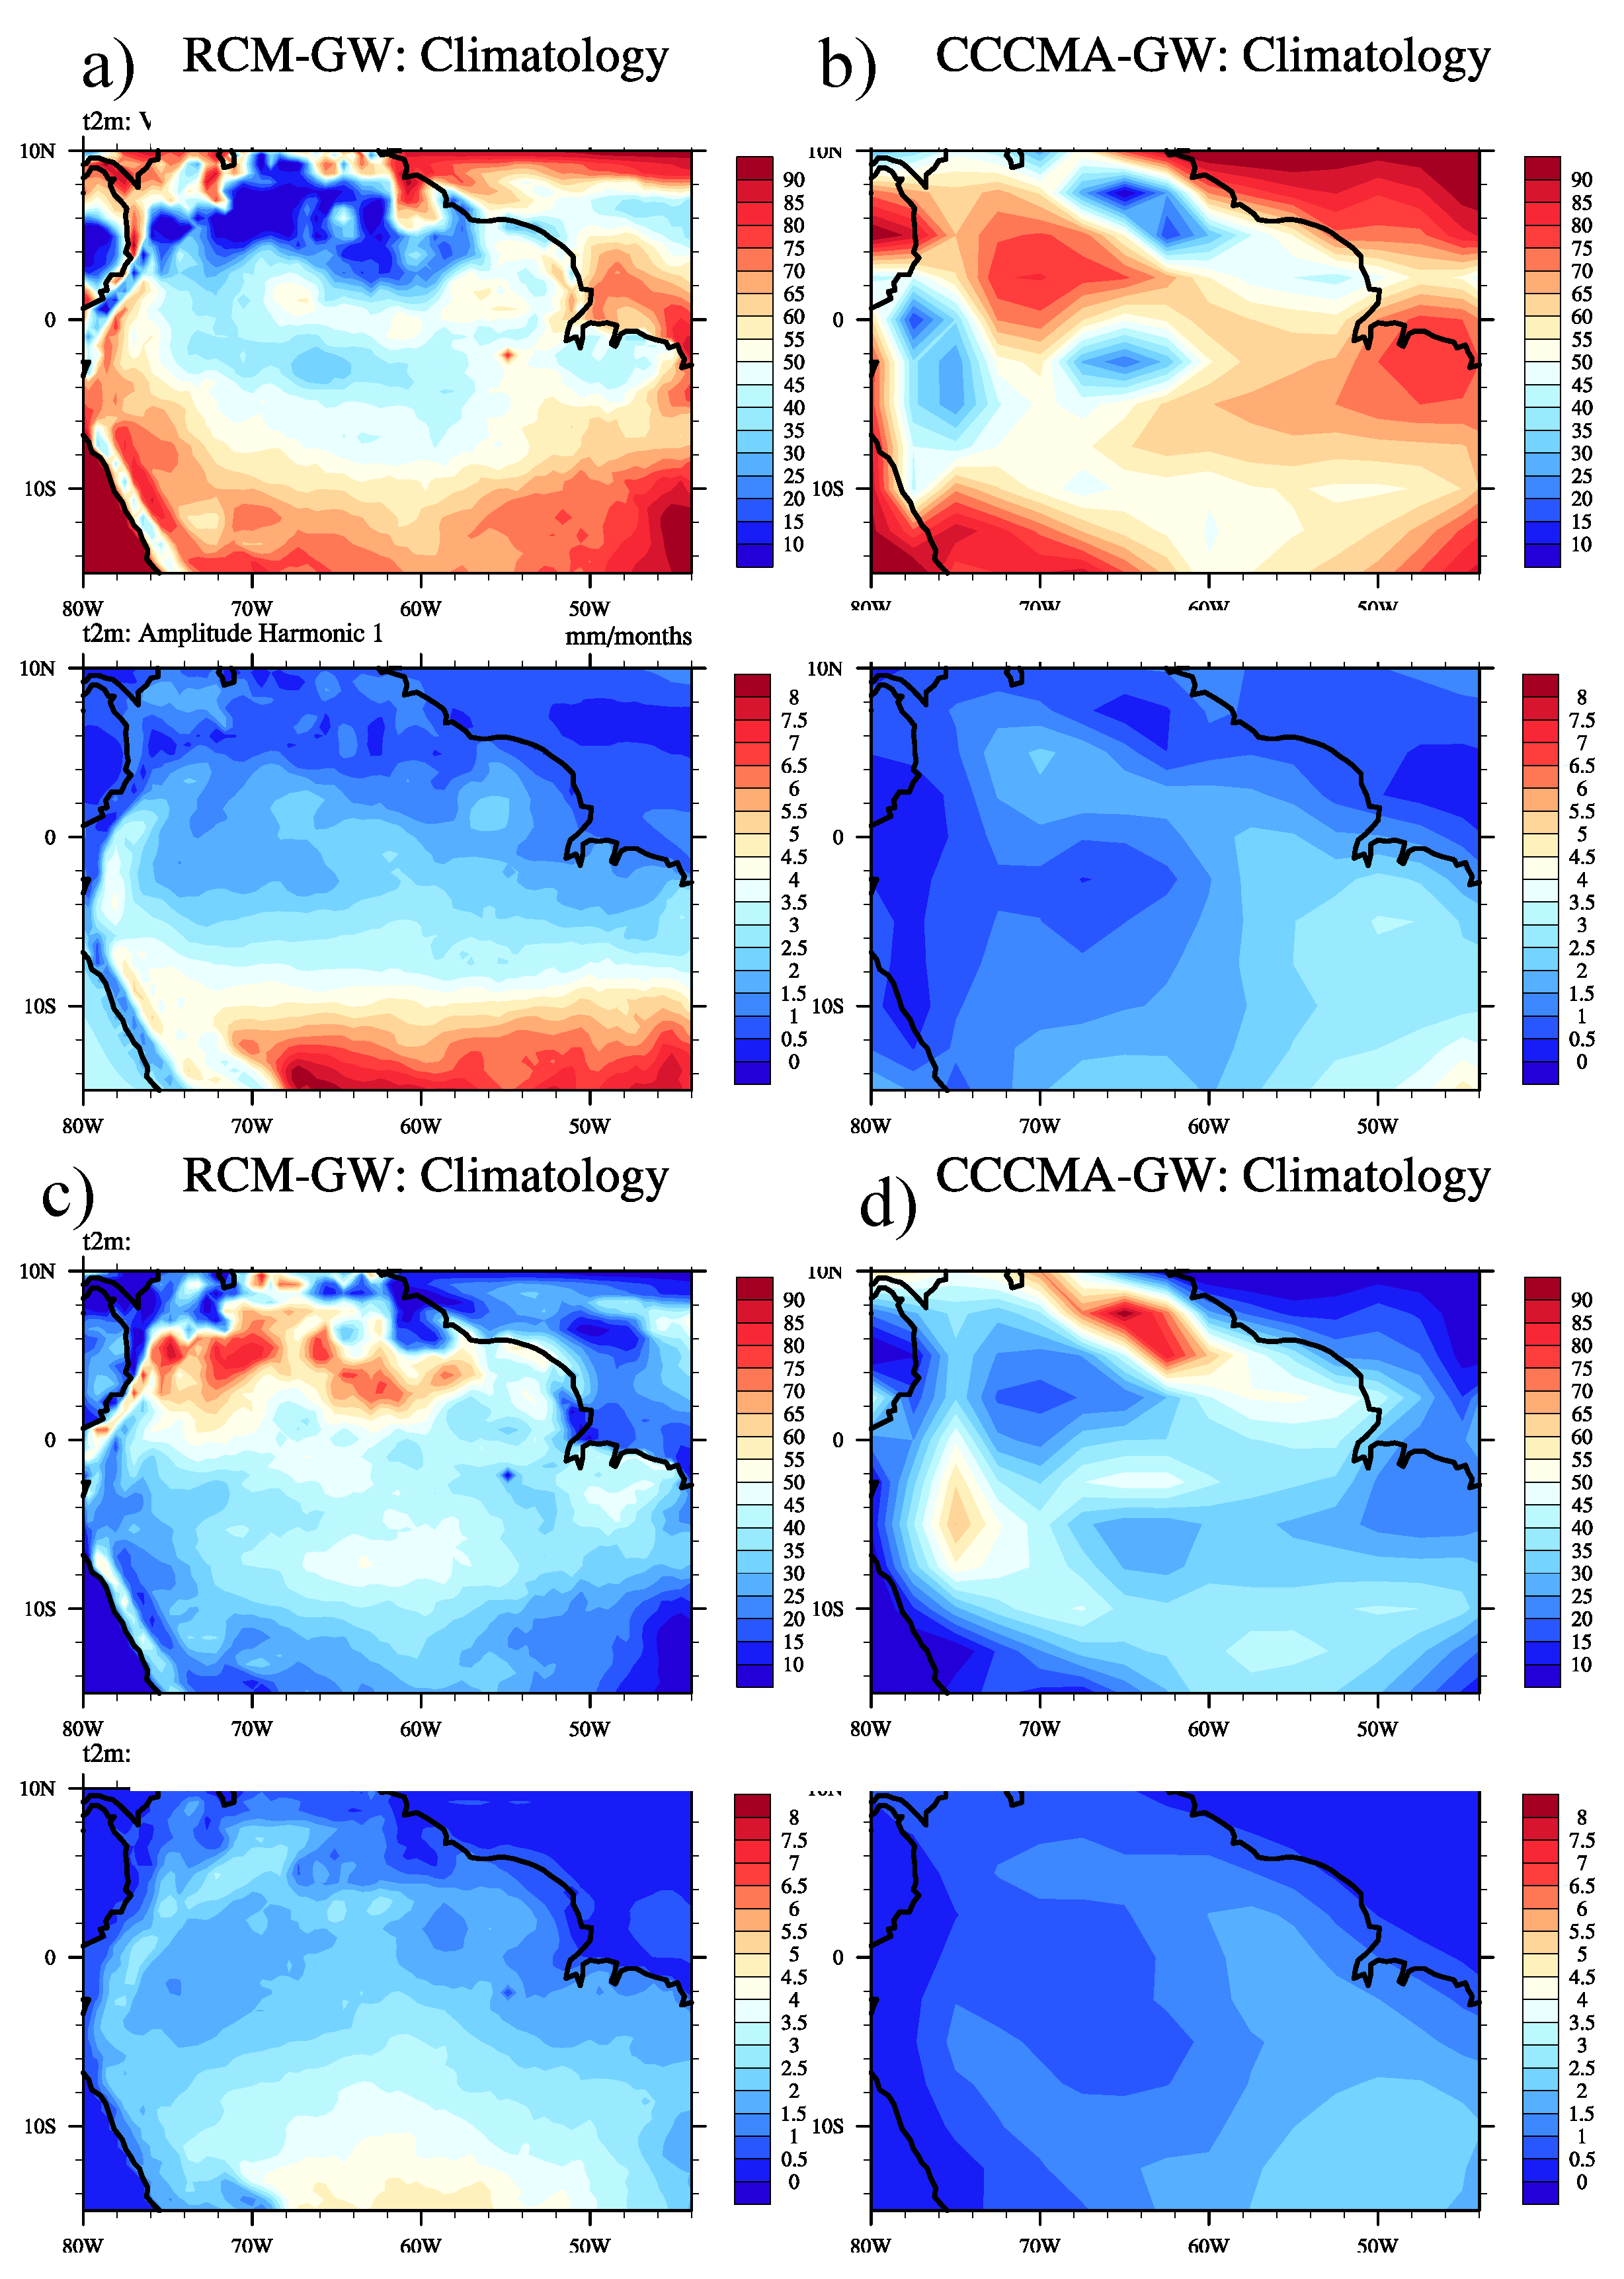
In GW-RCM over western Amazon, we find a reduction in the region dominated by the second t2m harmonic (Figure 1a, Figure 2a and Figure 5a,c). Increased variance associated with the annual harmonic is also found over the southern part of the Amazon region (Figure 1a and Figure 5a). Thus the seasonal pattern of the projected future t2m (Figure 5a lower panel) clearly changes (Figure 1a lower panel). The future GW-RCM climate projection over southern Amazon shows larger amplitude values compared to the PD-RCM. These changes are primarily located over areas that experienced the replacement of the rainforest by dry savanna-like vegetation in the GW-RCM run.
Figure 5. Variance of the first harmonic (%) based on GW-RCM simulation for t2m (a upper panel) and for the CCCMA-GW simulation (b upper panel). Lower panels of (a,b) show the first harmonic amplitude. (c,d) are the same as (a,b) but for the second harmonic.
Climate 04 00003 g005
However, small changes are found throughout the year along the equatorial belt as the rainforest is maintained here in the future (Figure 5c).
It should be noted that the future climate yields change in the seasonal timing of the warmest month. We find that the onset of the warm season is delayed by two months in the future (not shown). Whereas there are no substantial changes in the temperature of the coldest month there is a noticeable increase in the temperature of the warmest month in the GW-RCM. Anomalies between the warmest and coldest months over southern Amazon in the GW-RCM (PD-RCM) simulation may reach values as high as 6 °C (4 °C).
Harmonic analysis based on the global model simulations projects a future intensification of the annual cycle over most of the Amazon region (Figure 5b,d vs. Figure 1 ). These results, however, are different from those predicted by the regional model, which projects an intensification of the annual cycle primarily in the west Amazon (Figure 1f). Secondly, GW-RCM simulates a modified distribution of the first harmonic variance compared to PD-RCM. Comparison between the CCCMA and the RCM results suggests that the climate feedbacks associated with the inclusion of vegetation in the RCM-PVM coupling play a prominent role in defining the temporal climate variability of the Amazon basin.
Analysis of the precipitation projections show that the PD-RCM east-west “dipole” (Figure 3a) predicted in the western part of the basin for the semi-annual harmonic, is absent in the future GW-RCM projections (Figure 6a). This suggests that the greenhouse forcing and associated vegetation-climate feedbacks generate substantial changes to the temporal variability of the Amazonian precipitation/water availability. Mineny et al. [35] argued that seasonal swings in leaf area may be critical to initiate the transition from dry to wet season. This may lead to a future climate in most of the Amazon region that will be characterized by one defined period of maximum precipitation/specific humidity (Figure 6a).
Figure 6. Same as Figure 5 but for precipitation. Lower panels of (a,b) show the first harmonic amplitude. (c,d) are the same as (a,b) but for the second harmonic.
Climate 04 00003 g006
The dramatic climate driven deforestation is further associated with changes in the amplitude of precipitation (Figure 6a lower panels). The interaction between the atmosphere and the underlying vegetation is evident by the strong separation of dry and humid periods, as was predicted to occur in the future climate. Under GW conditions, the amplitude of the first harmonic is twice that of the present day over much of Amazon (Figure 3a and Figure 6a lower panels). These features are associated with the dieback of the rainforest that diminishes the water holding capacity of the exposed soil, with a subsequent reduction in evapotranspiration. Due to the presence of rainforest in the future, the annual cycle amplitude is nearly unchanged from present day conditions in the equatorial region (Figure 3a and Figure 6a).
The weakening of the semi-annual component for precipitation over the equatorial belt (Figure 6) is primarily associated with modifications in the seasonal march of the ITCZ. This suggests that Amazon deforestation induces a larger amplitude of the seasonal cycle. In particular, there is an increased contrast between dry and humid periods especially since the dry season is getting even drier in the future (as in [7]).

4. Conclusions

Cook and Vizy [7] used a regional atmospheric model coupled with a potential vegetation model to assess the effects of 21st century climate change on the Amazon’s rainforest. Here we have provided an additional investigation based upon harmonic analysis of the seasonal cycle of two-meter temperature and precipitation over the Amazon basin. The purpose of this study is to investigate future changes in temporal variations of the climate. The Amazon basin under PD conditions is mainly characterized by a zonal separation in terms of dominance of the annual and semi-annual cycles (Figure 2). Climate conditions over the western part of the basin are associated with the semi-annual cycle, whereas the eastern part is dominated by the annual component.
Our results indicate substantial changes of the annual cycle under greenhouse warming conditions. The increased amplitude of the 1st harmonic of the two-meter temperature in the regional model demonstrates that the differences between the warmest and coldest months over southern Amazon will be greater in the future. This is primarily due to an increase in the temperature of the warmest month rather than changes in the temperature of the coldest month. For precipitation we find that the east-west “dipole” predicted to occur under present day, will be modified in the future under greenhouse warming, in the sense that the future annual cycle is predicted to be dominant throughout the Amazon. This further enhances the differences between the dry and wet seasons.
Harmonic analysis of the global climate simulations used to force the regional model yields results that differ from the RCM projections. The regional climate model adds variability not inherent in the global model. By comparing the CCCMA and the RCM results, we argue that the RCM is able to reproduce the Amazonian climate in more details, at least in the present day (as found in [12,13,15]).
Our findings raise questions on the potential impact of 21st climate conditions for increasing the atmospheric susceptibility to wildfire development. Reduced precipitation and warmer temperatures, as simulated under greenhouse warming conditions, would accelerate the dieback of the Amazon rainforest. This process leads to the increase of canopy openness and under-storey insolation with consequent drying of the accumulated litter. When these conditions are combined, the risk of forest fires can increase dramatically in the Amazon [36,37,38]. Therefore, it can be argued that the future climate over much of Amazon will likely be more prone to wildfire developments. This will further contribute to a strengthening of the initial warming effect due to the additional emission of greenhouse gases and atmosphere-vegetation feedbacks.
Although, only one regional model has been used here, the PD-RCM results have been shown to be consistent with state-of-the-art present day reanalysis data, in particular for the amplitude of the seasonal cycle of both temperature and precipitation. However, the only way to test the robustness of the future climate projections and gain confidence in the predictions is to evaluate the predictions against other models. In this sense, the RCM performs similarly what has been predicted for the Amazon region, namely a warmer and drier future climate.
One may argue that among other limitations, like uncertainties in the boundary and surface conditions prescribed for the greenhouse warming simulation, this study may have limitations in the ability to reproduce important aspects of soil and root respiration. However, there are no substantial observations of this complex interaction to be parameterized in the model in order to perform a more reliable simulation of the future climate. Therefore, for the time being, we need to cope with the uncertainties still present and, in parallel, seek to improve models to include such interactions.

Acknowledgments

The authors would like to thank The Texas Advanced Computing Center (TACC) at the University of Texas at Austin for providing the high performance computing and database resources. This study is supported by the CNPq project proposal 479589/2012-7.

Author Contributions

Flavio Justino structured the study, and wrote large portions of the manuscript, data processing, and plotting. Kerry H. Cook and Edward K. Vizy performed all model simulations. All authors contributed to interpretation of the results, and writing of the manuscript.

Conflicts of Interest

The authors declare no conflict of interest.

References

  1. Sellers, W. Potential evapotranspiration in arid regions. J. Clim. 1963, 3, 98–105. [Google Scholar] [CrossRef]
  2. Kayano, M.T.; Andreoli, R.V. Relations of South American summer rainfall interannual variations with the Pacific Decadal Oscillation. Int. J. Climatol. 2007, 27, 531–540. [Google Scholar] [CrossRef]
  3. Marengo, J.A.; Nobre, C.A.; Tomasella, J.; Cardoso, M.F.; Oyama, M.D. Hydro-climatic and ecological behavior of the drought of Amazonia in 2005. Philos. Trans. R. Soc. B Biol. Sci. 2008. [Google Scholar] [CrossRef] [PubMed]
  4. Da Rocha, R.P.; Reboita, M.S.; Dutra, L.M.M.; Llopart, M.P.; Coppola, E. Interannual variability associated with ENSO: Present and future climate projections of RegCM4 for the South America CORDEX domain. Clim. Change 2014. [Google Scholar] [CrossRef]
  5. Da Rocha, R.P.; Cuadra, S.V.; Reboita, M.S.; Kruger, L.F.; Ambrizzi, T.; Krusche, N. Effects of RegCM3 parametrizations on simulated rainy season over South America. Clim. Res. 2012, 52, 253–265. [Google Scholar] [CrossRef]
  6. Solman, S.A.; Sanchez, E.; Samuelsson, P.; da Rocha, R.P.; Li, L.; Marengo, J.; Pessacg, N.L.; Remedio, A.R.C.; Chou, S.C.; Berbery, H.; et al. Evaluation of an ensemble of regional climate model simulations over South America driven by the ERA-Interim reanalysis: model performance and uncertainties. Clim. Dyn. 2013. [Google Scholar] [CrossRef]
  7. Cook, K.; Vizy, E.K. Effects of twenty-first-century climate change on the Amazon rainforest. J. Clim. 2008, 21, 542–560. [Google Scholar] [CrossRef]
  8. Huntingford, C.; Zelazowski, P.; Galbraith, D.; Mercado, L.M.; Sitch, S.; Fisher, R.; Lomas, M.; Walker, A.P.; Jones, C.D.; Booth, B.B.B.; et al. Simulated resilience of tropical rainforests to CO2-induced climate change. Nat. Geosci. 2013, 6, 268–273. [Google Scholar]
  9. Rammig, A.; Jupp, T.; Thonicke, K.; Tietjen, B.; Heinke, J.; Ostberg, S.; Lucht, W.; Cramer, W.; Cox, P. Estimating the risk of Amazonian forest dieback. New Phytol. 2010, 187, 694–706. [Google Scholar] [CrossRef] [PubMed]
  10. Oyama, M.D.; Nobre, C.A. A simple potential vegetation model for coupling with the Simple Biosphere Model. Braz. J. Meteorol. 2004, 19, 204–216. [Google Scholar]
  11. Gentry, A.H.; Lopez-Parodi, J. Deforestation and increased floods of the upper Amazon. Science 1980. [Google Scholar] [CrossRef] [PubMed]
  12. Giorgi, F.; Coppola, E.; Raffaele, F.; Diro, G.T.; Fuentes-Franco, R.; Giuliani, G.; Mamgain, A.; Llopart, M.P.; Mariotti, L.; Torm, C. Changes in extremes and hydroclimatic regimes in the CREMA ensemble projections. Clima. Change 2014. [Google Scholar] [CrossRef]
  13. Coppola, E.; Giorgi, F.; Raffaele, F.; Fuentes-Franco, R.; Giuliani, G.; LLopart-Pereira, M.; Mamgain, A.; Mariotti, L.; Tefera Diro, G.; Torma, C. Present and future climatologies in the Phase I CREMA experiment. Clim. Change 2014, 125, 23–38. [Google Scholar] [CrossRef]
  14. Francis, F.W.S.; Alvalá, R.C.S.; Manzi, A.O. Modeling the impacts of land cover change in Amazonia: A regional climate model (RCM) simulation study. Theor. Appl. Climatol. 2008, 12, 225–244. [Google Scholar]
  15. Llopart, M.; da Rocha, R.P.; Cuadra, S.V.; Coppola, E.; Giorgi, F. Land surface feedbacks and climate change over South America as projected by RegCM4. Clim. Change 2014, 125, 111–125. [Google Scholar] [CrossRef]
  16. Werth, D.; Avissar, R. The Regional evapotranspiration of the Amazon. J. Hydrometeorol. 2004, 5, 100–109. [Google Scholar] [CrossRef]
  17. Hutyra, L.R.; Munger, J.W.; Nobre, C.A.; Saleska, S.R.; Vieira, S.A.; Wofsky, S.C. Climatic variability and vegetation vulnerability in Amazônia. Geophys. Res. Lett. 2005, 32, L24712. [Google Scholar] [CrossRef]
  18. Andreae, M.O.; Rosenfeld, D.; Artaxo, P.; Costa, A.; Frank, G.; Longo, K.M.; Silva Dias, M.A.F. Smoking rain clouds over the Amazon. Science 2004, 303, 1337–1342. [Google Scholar] [CrossRef] [PubMed]
  19. Grell, G.A.; Dudhia, J.; Stauffer, D.R. A Description of the Fifth-Generation Penn State/NCAR Mesoscale Model (MM5); TN-398+STR; NCAR: Boulder, CO, USA, 1994. [Google Scholar]
  20. Chen, F.; Dudhia, J. Coupling an advanced land surface–hydrology model with the Penn State–NCAR MM5 modeling system. Part I: Model implementation and sensitivity. Mon. Wea. Rev. 2001, 129, 569–585. [Google Scholar] [CrossRef]
  21. Kain, J.S.; Fritsch, J.M. Convective parameterization for mesoscale models: The Kain-Fritsch scheme. In The Representation of Cumulus Convection in Numerical Models; Emanuel, K.A., Raymond, D.J., Eds.; American Meteorological Society: Washington, DC, USA, 1993; pp. 165–170. [Google Scholar]
  22. New, M.; Hulme, M.; Jones, P.D. Representing twentieth century space-time climate variability. Part 1: Development of a 1960-90 mean monthly terrestrial climatology. J. Clim. 1999, 12, 829–856. [Google Scholar] [CrossRef]
  23. Saha, S.; Moorthi, S.; Pan, H.-L.; Wu, X.; Wang, J.; Nadiga, S.; Tripp, P.; Kistler, R.; Woollen, J.; Behringer, D.; et al. The NCEP climate forecast system reanalysis. Bull. Amer. Meteor. Soc. 2010, 91, 1015–1057. [Google Scholar] [CrossRef]
  24. Aslan, Z.; Okcu, D.; Kartal, S. Harmonic analysis of precipitation, pressure and temperature over Turkey. Nuovo Cimento Della Società Italiana di Fisica. C 1997, 20, 595–605. [Google Scholar]
  25. Jakubauskas, M.E.; Legates, D.; Kastens, J.H. Harmonic analysis of time-series AVHRR NDVI data. Photogramm. Eng. Remote Sens. 2001, 67, 461–470. [Google Scholar]
  26. Wilks, D.S. Statistical Methods in the Atmospheric Sciences: An Introduction; Academic Press; San Diego, CA, USA, 1995. [Google Scholar]
  27. Yuan, X.; Li, C. Climate modes in southern high latitudes and their impacts on Antarctic sea ice. J. Geophys. Res. 2008. [Google Scholar] [CrossRef]
  28. Van Loon, H. The half-yearly oscillations in middle and high southern latitudes and the coreless winter. J. Atmos. Sci. 1967, 24, 472–486. [Google Scholar] [CrossRef]
  29. Grimm, A.M. How do La Niña events disturb the summer monsoon system in Brazil? Clim. Dyn. 2004, 22, 123–138. [Google Scholar] [CrossRef]
  30. Rocha, V.M.; Correia, F.W.S.; Fonseca, P.A.M. Reciclagem de precipitação na Amazônia: um estudo de revisão. Revis. Bras. de Meteorol. 2015, 30, 59–70. [Google Scholar] [CrossRef]
  31. Li, W.; Fu, R.; Dickinson, R.E. Rainfall and its seasonality over the Amazon in the 21st century as assessed by the coupled models for the IPCC AR4. J. Geophys. Res. 2006, 111, D02111. [Google Scholar] [CrossRef]
  32. Vizy, E.K.; Cook, K.H. Relationship between Amazon and high Andes precipitation. J. Geophys. Res. Atmos. 2007, 112, D07107. [Google Scholar] [CrossRef]
  33. Negrón Juárez, R.I.; Hodnett, M.G.; Fu, R.; Goulden, M.L.; von Randow, C. Control of dry season evapotranspiration over the Amazonian forest as inferred from observations at a Southern Amazon forest site. J. Clim. 2007, 20, 2827–2839. [Google Scholar] [CrossRef]
  34. Kleidon, A.; Heimann, M. Deep-rooted vegetation, Amazonian deforestation, and climate: Results from a modelling study. Glob. Ecol. Biogeogr. 1999, 8, 397–405. [Google Scholar] [CrossRef]
  35. Myneni, R.B.; Yang, W.; Nemani, R.R.; Huete, A.R.; Dickinson, R.E.; Knyazikhin, Y.; Didan, K.; Fu, R.; Negrón Juárez, R.I.; Saatchi, S.S.; et al. Large seasonal swings in leaf area of Amazon rainforests. Proc. Natl. Acad. Sci. USA 2007, 104, 4820–4823. [Google Scholar] [CrossRef] [PubMed]
  36. Barlow, J.; Peres, C.A. Ecological responses to el Niño-induced surface fires in central Brazilian Amazonia: Management implications for flammable tropical forests. Philos. Trans. R. Soc. Lond. B Biol. Sci. 2004, 359, 367–380. [Google Scholar] [CrossRef] [PubMed]
  37. Nepstad, D.; Lefebvre, P.; Lopes da Silva, U.; Tomasella, J.; Schlesinger, P.; Solórzano, L.; Moutinho, P.; Ray, D.; Guerreira Benito, J. Amazon drought and its implications for forest flammability and tree growth: A basin-wide analysis. Glob. Change Biol. 2004, 10, 704–717. [Google Scholar] [CrossRef]
  38. Justino, F.B.; Ribeiro, G.A.; Sterl, A.; Sediyama, G.C.; Setzer, A.; Sismanoglu, R.A.; Machado, J.P.; Machado, J.P. Greenhouse gas induced changes in the fire risk in Brazil in ECHAM5/MPI-OM coupled climate model. Clim. Change 2011, 106, 285–302. [Google Scholar] [CrossRef]