
Self-Reported Experiences of Climate Change in Nigeria: The Role of Personal and Socio-Environmental Factors


Abstract
:1. Introduction
2. Theoretical Framework
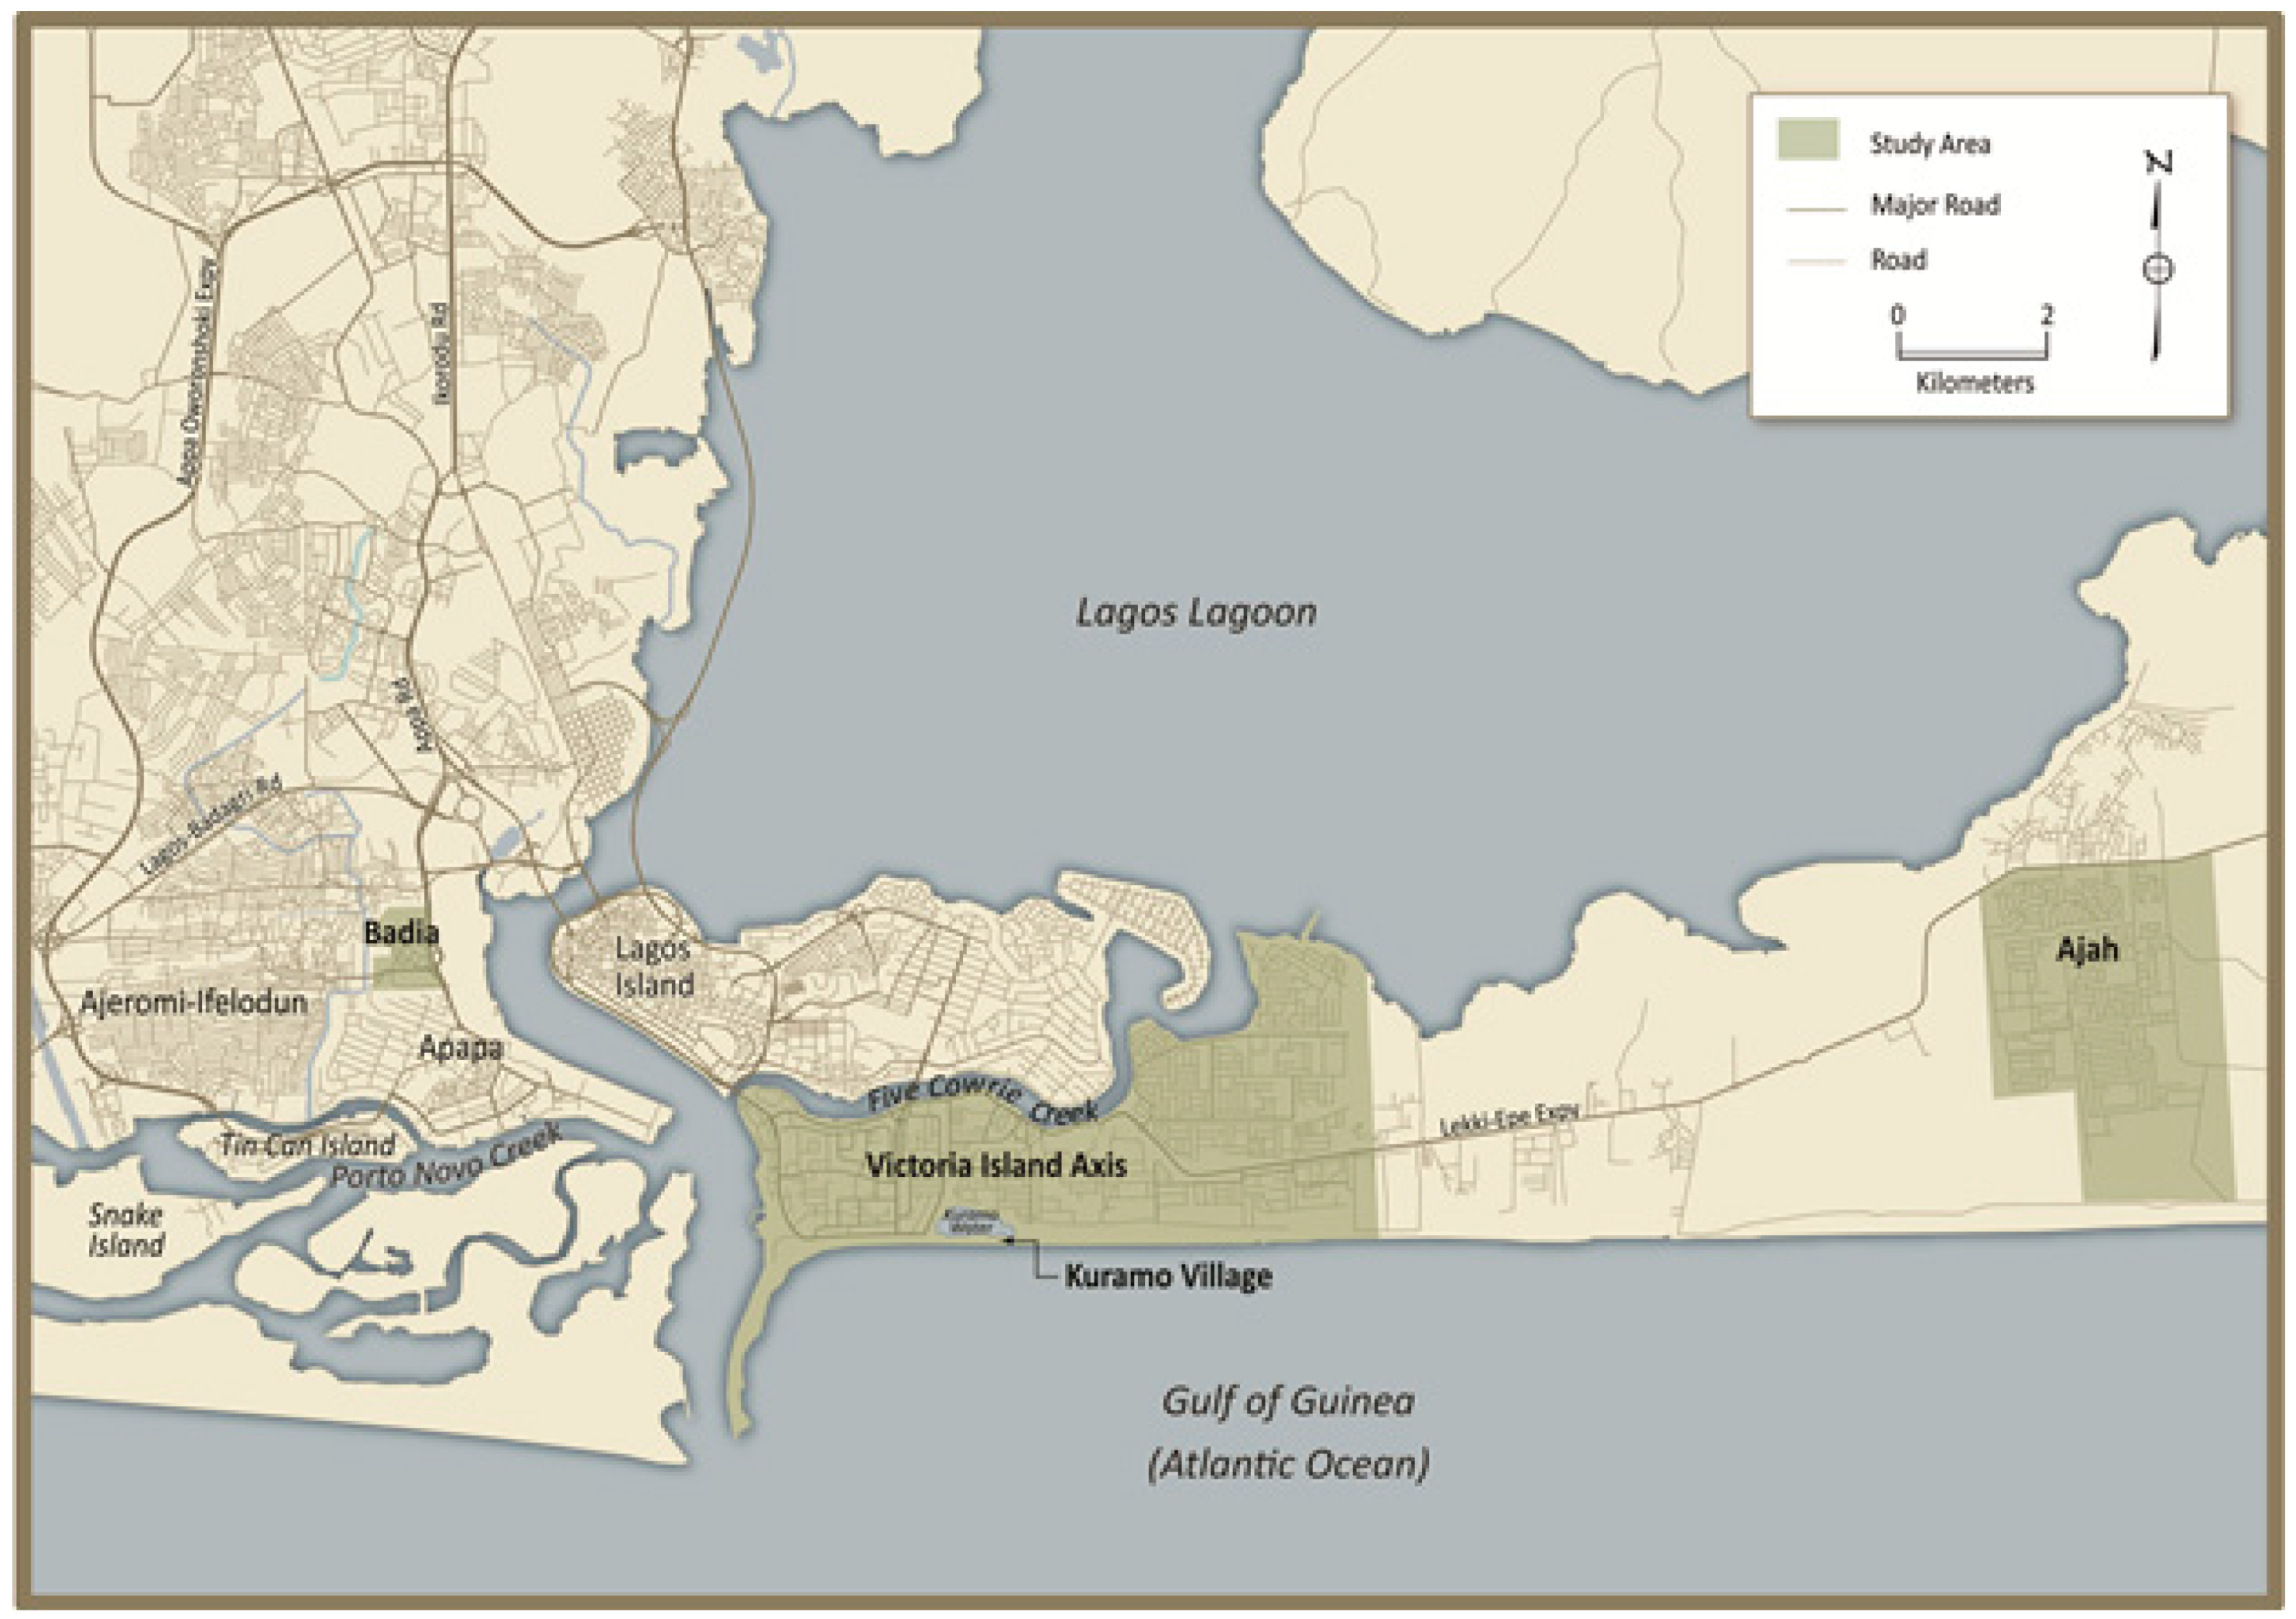
3. Context and Description of Study Areas
4. Materials and Methods
4.1. Survey Data Collection and Sampling
4.2. Multivariate Regression
5. Results
5.1. Descriptive Statistics

| Outcome Variables | Frequency | % |
|---|---|---|
| Noticed Changes in Rainfall Patterns in last 10 years | ||
| No | 252 | 25.1 |
| Yes | 751 | 74.9 |
| Experience of Ocean Surge in the last 5 years | ||
| No | 804 | 80.2 |
| Yes | 199 | 19.8 |
| Experience of Flooding in the last 5 years | ||
| No | 126 | 12.6 |
| Yes | 877 | 87.4 |
| Explanatory Variables | ||
| Personal & Household Factors | ||
| Age | ||
| 18–30 | 209 | 20.8 |
| 31–40 | 622 | 62.0 |
| 41–65 | 172 | 17.2 |
| Gender | ||
| Female | 453 | 45.2 |
| Male | 550 | 54.8 |
| Highest Education Level Attained | ||
| Up to Primary | 348 | 34.7 |
| Secondary | 388 | 38.7 |
| Tertiary | 267 | 26.6 |
| Marital Status | ||
| Unmarried | 257 | 25.6 |
| Married | 746 | 74.4 |
| Position in Household | ||
| Head | 547 | 54.5 |
| Non-head | 456 | 45.5 |
| Household Size | ||
| 1 to 3 | 252 | 25.1 |
| 4 or 5 | 506 | 50.5 |
| 6 or more | 245 | 24.4 |
| Ethnicity | ||
| Yoruba | 628 | 62.6 |
| Ibo | 325 | 32.4 |
| Hausa | 23 | 2.3 |
| Other | 27 | 2.7 |
| Occupation | ||
| Unemployed | 105 | 10.5 |
| Civil servant | 163 | 16.3 |
| Artisan | 189 | 18.8 |
| self-employed | 546 | 54.4 |
| Household Income Levels | ||
| N5,000–N15,000 | 186 | 18.5 |
| N15,500–N25,000 | 232 | 23.1 |
| N25,500–N50,000 | 207 | 20.6 |
| N50,500 and above | 97 | 9.7 |
| will rather not say | 281 | 28.0 |
| Length of stay in Community | ||
| less than 5 years | 399 | 39.8 |
| 5+ years | 604 | 60.2 |
| Length of stay in present dwelling | ||
| less than 5 years | 432 | 43.1 |
| 5+ years | 571 | 56.9 |
| Dwelling ownership | ||
| Owner | 205 | 20.4 |
| Renters | 798 | 79.6 |
| Socio-Environmental Factors | ||
| Location | ||
| Ijora Badia | 607 | 60.5 |
| Ajah | 120 | 12.0 |
| Victoria Island | 276 | 27.5 |
| Type of housing | ||
| wooden shack | 181 | 18.1 |
| wooden on stilts | 191 | 19.0 |
| Concrete | 631 | 62.9 |
| Vulnerability of housing type to flood events | ||
| No | 228 | 22.7 |
| Yes | 603 | 60.1 |
| Refused to answer | 172 | 17.2 |
| Vulnerability of neighbourhood to flood events | ||
| No | 131 | 13.1 |
| Yes | 810 | 80.8 |
| Refused to answer | 62 | 6.2 |
| Ever received government assistance due to flooding | ||
| No | 926 | 92.3 |
| Yes | 77 | 7.7 |
| Access to social housing | ||
| No | 913 | 91.0 |
| Yes | 90 | 9.0 |
| Access to water services | ||
| poor water access | 569 | 56.7 |
| good water access | 434 | 43.3 |
| Distance to nearest healthcare facility | ||
| 5+ km | 730 | 72.8 |
| Less than 5 km | 273 | 27.2 |
5.2. Bivariate Analysis
5.3. Multivariate Analysis
| Model 1: Personal & Household Factors | Model 2: Socio-Environmental Factors | ||||||
|---|---|---|---|---|---|---|---|
| Variables | OR | (Robust SE) | 95% CI | OR | (Robust SE) | 95% CI | |
| Age (ref: 18–30) | |||||||
| 31–40 | 1.41 | (0.21) * | 1.05–1.90 | 1.73 | (0.30) ** | 1.23–2.43 | |
| 41–65 | 2.65 | (0.54) *** | 1.77–3.96 | 3.42 | (0.92) *** | 2.03–5.79 | |
| Gender (ref: female) | |||||||
| Male | 1.01 | (0.14) | 0.78–1.31 | 0.99 | (0.15) | 0.73–1.34 | |
| Respondent Education (ref: up to primary) | |||||||
| Secondary | 0.59 | (0.07) *** | 0.47–0.73 | 0.57 | (0.08) *** | 0.44–0.75 | |
| Tertiary | 0.73 | (0.12) * | 0.53–0.99 | 0.69 | (0.15) | 0.46–1.06 | |
| Marital Status (ref: Unmarried) | |||||||
| Married | 0.72 | (0.10) * | 0.55–0.95 | 0.75 | (0.11) | 0.56–1.01 | |
| Position in Household (ref: Head) | |||||||
| Non-head | 0.64 | (0.09) ** | 0.49–0.83 | 0.71 | (0.11) * | 0.53–0.95 | |
| No. People in Household (ref: 1–3) | |||||||
| 4 or 5 | 1.75 | (0.23) *** | 1.34–2.27 | 1.55 | (0.24) ** | 1.15–2.09 | |
| 6 or more | 1.49 | (0.22) ** | 1.12–1.97 | 1.61 | (0.26) ** | 1.17–2.22 | |
| Ethnicity (ref: Yoruba) | |||||||
| Ibo | 0.99 | (0.11) | 0.79–1.23 | 1.00 | (0.15) | 0.75–1.33 | |
| Hausa | 0.41 | (0.13) ** | 0.21–0.77 | 0.40 | (0.15) * | 0.19–0.84 | |
| Other | 1.00 | (0.30) | 0.56–1.78 | 1.11 | (0.34) | 0.60–2.03 | |
| Occupation (ref: unemployed) | |||||||
| Civil servant | 1.54 | (0.32) * | 1.02–2.32 | 1.28 | (0.34) | 0.75–2.17 | |
| Artisan | 0.39 | (0.08) *** | 0.26–0.59 | 0.35 | (0.09) *** | 0.21–0.58 | |
| self-employed | 0.91 | (0.16) | 0.64–1.29 | 0.78 | (0.17) | 0.51–1.19 | |
| Household Income (ref: N5,000–N15,000) | |||||||
| N15,500–N25,000 | 1.80 | (0.29) *** | 1.30–2.48 | 1.36 | (0.26) | 0.94–1.97 | |
| N25,500–N50,000 | 0.58 | (0.10) ** | 0.42–0.80 | 0.43 | (0.08) *** | 0.30–0.62 | |
| N50,500- or more | 0.59 | (0.12) * | 0.39–0.88 | 0.60 | (0.15) | 0.37–0.97 | |
| will rather not say | 1.06 | (0.15) | 0.80–1.40 | 0.78 | (0.13) | 0.56–1.07 | |
| Length of stay in area (ref: less than 5 years) | |||||||
| 5 years or more | 1.08 | (0.29) | 0.63–1.84 | 1.54 | (0.43) | 0.89–2.66 | |
| Length of stay in dwelling (ref: less than 5 years) | |||||||
| 5 years or more | 0.34 | (0.09) *** | 0.20–0.58 | 0.27 | (0.08) *** | 0.15–0.47 | |
| Dwelling ownership (ref: owner) | |||||||
| Renters | 0.75 | (0.09) * | 0.59–0.96 | 0.85 | (0.14) | 0.62–1.16 | |
| Location (ref: Ijora Badia) | |||||||
| Ajah | 23.86 | (5.28) *** | 15.47–36.81 | ||||
| Victoria Island | 1.12 | (0.23) | 0.75–1.67 | ||||
| Type of housing (ref: wooden shack) | |||||||
| wooden on stilts | 1.82 | (0.36) ** | 1.24–2.68 | ||||
| Concrete | 1.07 | (0.18) | 0.77–1.48 | ||||
| Household vulnerability to flood (ref: no) | |||||||
| Yes | 1.40 | (0.25) | 0.99–2.00 | ||||
| Refused to answer | 2.89 | (0.77) *** | 1.71–4.86 | ||||
| Neighbourhood vulnerability to flood (ref: no) | |||||||
| Yes | 0.75 | (0.14) | 0.53–1.08 | ||||
| Don’t know | 0.32 | (0.09) *** | 0.18–0.55 | ||||
| Ever received government assistance due to flood (ref: no) | |||||||
| Yes | 1.18 | (0.27) | 0.75–1.86 | ||||
| Access to social housing (ref: no) | |||||||
| Yes | 1.40 | (0.28) | 0.94–2.07 | ||||
| Access to water services (ref: poor) | |||||||
| good water access | 0.99 | (0.12) | 0.78–1.26 | ||||
| Distance to nearest healthcare facility (ref: 5km or more) | |||||||
| Less than 5 km | 0.64 | (0.09) ** | 0.49–0.85 | ||||
| Variables | Model 1: Personal & Household Factors | Model 2: Socio-Environmental Factors | ||||
|---|---|---|---|---|---|---|
| OR | (Robust SE) | 95% CI | OR | (Robust SE) | 95% CI | |
| Age (ref: 18–30) | ||||||
| 31–40 | 2.63 | (0.59) *** | 1.69–4.08 | 1.63 | (0.50) | 0.89–2.99 |
| 41–65 | 1.97 | (0.61) * | 1.08–3.61 | 1.28 | (0.53) | 0.57–2.88 |
| Gender (ref: female) | ||||||
| Male | 1.06 | (0.22) | 0.70–1.59 | 0.63 | (0.17) | 0.37–1.09 |
| Respondent Education (ref: up to primary) | ||||||
| Secondary | 0.29 | (0.06) *** | 0.19–0.44 | 0.24 | (0.06) *** | 0.14–0.40 |
| Tertiary | 1.07 | (0.27) | 0.65–1.76 | 0.34 | (0.14) * | 0.15–0.77 |
| Marital Status (ref: Unmarried) | ||||||
| Married | 0.43 | (0.10) *** | 0.27–0.68 | 0.44 | (0.11) ** | 0.27–0.71 |
| Position in Household (ref: Head) | ||||||
| Non-head | 0.90 | (0.20) | 0.57–1.40 | 1.00 | (0.28) | 0.57–1.73 |
| No. People in Household (ref: 1–3) | ||||||
| 4 or 5 | 2.07 | (0.55) ** | 1.23–3.50 | 1.89 | (0.54) * | 1.08–3.31 |
| 6 or more | 2.92 | (0.76) *** | 1.75–4.86 | 2.01 | (0.64) * | 1.08–3.75 |
| Ethnicity (ref: Yoruba) | ||||||
| Ibo | 0.65 | (0.14) * | 0.43–0.98 | 0.93 | (0.22) | 0.59–1.47 |
| Hausa | 0.93 | (0.39) | 0.41–2.13 | 1.54 | (0.66) | 0.66–3.59 |
| Other | 0.50 | (0.31) | 0.15–1.68 | 0.58 | (0.34) | 0.18–1.85 |
| Occupation (ref: unemployed) | ||||||
| Civil servant | 2.00 | (0.76) | 0.95–4.19 | 2.77 | (1.62) | 0.88–8.69 |
| Artisan | 1.51 | (0.56) | 0.73–3.12 | 2.19 | (1.28) | 0.70–6.86 |
| self-employed | 0.86 | (0.29) | 0.44–1.68 | 1.80 | (0.96) | 0.63–5.13 |
| Household Income (ref: N5,000–N15,000) | ||||||
| N15,500–N25,000 | 0.05 | (0.04) *** | 0.01–0.25 | 0.09 | (0.08) ** | 0.02–0.51 |
| N25,500–N50,000 | 1.99 | (0.69) * | 1.01–3.93 | 0.87 | (0.35) | 0.39–1.91 |
| N50,500- or more | 1.00 | (0.41) | 0.45–2.26 | 0.86 | (0.43) | 0.32–2.29 |
| will rather not say | 4.42 | (1.32) *** | 2.46–7.95 | 3.46 | (1.18) *** | 1.78–6.74 |
| Length of stay in area (ref: less than 5 years) | ||||||
| 5 years or more | 1.06 | (0.36) | 0.55–2.05 | 1.54 | (0.57) | 0.74–3.19 |
| Length of stay in dwelling (ref: less than 5 years) | ||||||
| 5 years or more | 0.57 | (0.20) | 0.29–1.12 | 0.32 | (0.11) ** | 0.16–0.63 |
| Dwelling ownership (ref: owner) | ||||||
| Renters | 2.85 | (0.77) *** | 1.68–4.85 | 1.61 | (0.47) | 0.91–2.84 |
| Location (ref: Ijora Badia) | ||||||
| Ajah | 19.82 | (8.87) *** | 8.24–47.62 | |||
| Victoria Island | 3.54 | (1.09) *** | 1.94–6.46 | |||
| Type of housing (ref: wooden shack) | ||||||
| wooden on stilts | 1.02 | (0.42) | 0.45–2.28 | |||
| Concrete | 1.79 | (0.67) | 0.87–3.71 | |||
| Household vulnerability to flood (ref: no) | ||||||
| Yes | 2.07 | (0.67) * | 1.09–3.92 | |||
| Refused to answer | 0.14 | (0.14) * | 0.02–0.96 | |||
| Neighbourhood vulnerability to flood (ref: no) | ||||||
| Yes | 3.42 | (1.42) ** | 1.52–7.73 | |||
| Don’t know | 1.90 | (1.22) | 0.54–6.67 | |||
| Ever received government assistance due to flood (ref: no) | ||||||
| Yes | 0.99 | (0.34) | 0.50–1.95 | |||
| Access to social housing (ref: no) | ||||||
| Yes | 1.33 | (0.46) | 0.67–2.63 | |||
| Access to water services (ref: poor ) | ||||||
| good water access | 0.46 | (0.13) ** | 0.27–0.79 | |||
| Distance to nearest healthcare facility (ref: 5km or more) | ||||||
| Less than 5 km | 0.11 | (0.05) *** | 0.05–0.25 | |||
| Variables | Model 1: Personal & Household Factors | Model 2: Socio-Environmental Factors | ||||
|---|---|---|---|---|---|---|
| OR | (Robust SE) | 95% CI | OR | (Robust SE) | 95% CI | |
| Age (ref: 18–30) | ||||||
| 31–40 | 0.87 | (0.16) | 0.61–1.24 | 1.27 | (0.39) | 0.70–2.33 |
| 41–65 | 1.44 | (0.39) | 0.85–2.44 | 3.11 | (1.23) ** | 1.43–6.75 |
| Gender (ref: female) | ||||||
| Male | 1.31 | (0.21) | 0.96–1.78 | 1.54 | (0.43) | 0.89–2.66 |
| Respondent Education (ref: up to primary) | ||||||
| Secondary | 0.58 | (0.10) ** | 0.42–0.81 | 0.96 | (0.34) | 0.48–1.92 |
| Tertiary | 0.33 | (0.07) *** | 0.21–0.51 | 0.64 | (0.25) | 0.29–1.39 |
| Marital Status (ref: Unmarried) | ||||||
| Married | 1.16 | (0.20) | 0.83–1.62 | 1.82 | (0.52) * | 1.03–3.20 |
| Position in Household (ref: Head) | ||||||
| Non-head | 0.74 | (0.11) | 0.55–1.00 | 0.86 | (0.24) | 0.50–1.49 |
| No. People in Household (ref: 1–3) | ||||||
| 4 or 5 | 0.96 | (0.18) | 0.67–1.39 | 1.39 | (0.48) | 0.71–2.72 |
| 6 or more | 0.74 | (0.12) | 0.54–1.03 | 0.75 | (0.25) | 0.39–1.44 |
| Ethnicity (ref: Yoruba) | ||||||
| Ibo | 0.27 | (0.05) *** | 0.20–0.38 | 0.31 | (0.08) *** | 0.20–0.50 |
| Hausa | 0.49 | (0.21) | 0.21–1.15 | 2.38 | (1.59) | 0.64–8.84 |
| Other | 0.71 | (0.26) | 0.35–1.44 | 3.26 | (1.18) ** | 1.61–6.61 |
| Occupation (ref: unemployed) | ||||||
| Civil servant | 0.77 | (0.19) | 0.47–1.25 | 0.92 | (0.36) | 0.43–2.00 |
| Artisan | 0.75 | (0.20) | 0.45–1.26 | 0.90 | (0.38) | 0.39–2.07 |
| self-employed | 1.09 | (0.25) | 0.69–1.71 | 0.59 | (0.23) | 0.28–1.27 |
| Household Income (ref: N5,000–N15,000) | ||||||
| N15,500–N25,000 | 9.48 | (1.48) *** | 6.99–12.86 | 20.04 | (6.67) *** | 10.44–38.48 |
| N25,500–N50,000 | 1.16 | (0.22) | 0.79–1.68 | 1.12 | (0.33) | 0.63–2.00 |
| N50,500- or more | 1.13 | (0.28) | 0.69–1.85 | 2.44 | (0.89) * | 1.19–5.00 |
| will rather not say | 0.71 | (0.11) * | 0.52–0.97 | 1.04 | (0.28) | 0.62–1.75 |
| Length of stay in area (ref: less than 5 years) | ||||||
| 5 years or more | 0.54 | (0.21) | 0.25–1.16 | 0.68 | (0.37) | 0.23–1.98 |
| Length of stay in dwelling (ref: less than 5 years) | ||||||
| 5 years or more | 1.88 | (0.74) | 0.87–4.07 | 1.12 | (0.62) | 0.38–3.30 |
| Dwelling ownership (ref: owner) | ||||||
| Renters | 2.73 | (0.48) *** | 1.94–3.86 | 2.73 | (0.76) *** | 1.59–4.70 |
| Location (ref: Ijora Badia) | ||||||
| Ajah | 0.22 | (0.08) *** | 0.11–0.44 | |||
| Victoria Island | 0.18 | (0.07) *** | 0.08–0.39 | |||
| Type of housing (ref: wooden shack) | ||||||
| wooden on stilts | 0.44 | (0.08) *** | 0.30–0.64 | |||
| Concrete | 0.03 | (0.01) *** | 0.02–0.06 | |||
| Household vulnerability to flood (ref: no) | ||||||
| Yes | 2.43 | (0.67) ** | 1.42–4.19 | |||
| Refused to answer | 1.76 | (1.07) | 0.54–5.79 | |||
| Neighbourhood vulnerability to flood (ref: no) | ||||||
| Yes | 3.46 | (0.93) *** | 2.04–5.85 | |||
| Don’t know | 4.27 | (1.91) ** | 1.77–10.26 | |||
| Ever received government assistance due to flood (ref: no) | ||||||
| Yes | 0.51 | (0.14) * | 0.30–0.87 | |||
| Access to social housing (ref: no) | ||||||
| Yes | 1.46 | (0.47) | 0.77–2.75 | |||
| Access to water services (ref: poor) | ||||||
| good water access | 0.91 | (0.27) | 0.51–1.61 | |||
| Distance to nearest healthcare facility (ref: 5km or more) | ||||||
| Less than 5 km | 0.91 | (0.22) | 0.56–1.47 | |||
6. Discussion
7. Conclusions
Acknowledgments
Author Contributions
Conflicts of Interest
References
- Benson, C.; Clay, E.J. Understanding the Economic and Financial Impacts of Natural Disasters; Disaster Risk Management Series No. 4; World Bank Publications: Washington, DC, USA, 2004. [Google Scholar]
- Eriksen, S.H.; Brown, K.; Kelly, P.M. The dynamics of vulnerability: Locating coping strategies in Kenya and Tanzania. Geogr. J. 2005, 171, 287–305. [Google Scholar]
- Intergovernmental Panel on Climate Change (IPCC). Summary for policymakers. In Managing the Risks of Extreme Events and Disasters to Advance Climate Change Adaptation; A Special Report of Working Groups I and II of the Intergovernmental Panel on Climate Change; Cambridge University Press: Cambridge, UK; New York, NY, USA, 2012. [Google Scholar]
- Klein, R.J.T.; Nicholls, R.J.; Thomalla, F. The resilience of coastal megacities to weather-related hazards. In Building Safer Cities: The Future of Disaster Risk; Kreimer, A., Arnold, M., Carlin, A., Eds.; The World Bank Disaster Management Facility: Washington, DC, USA, 2002; pp. 101–120. [Google Scholar]
- Moreno, E.L.; Oyeyinka, O.; Mboup, G.; Sampath, P.; Zanetta, C.; Kothari, M.; Shivani, C.; Williams, C. State of the World’s Cities 2010/2011—Cities for All: Bridging the Urban Divide; Earthscan: London, UK, 2010. [Google Scholar]
- Thomson, M.C.; Doblas-Reyes, F.J.; Mason, S.J.; Hagedorn, R.; Connor, S.J.; Phindela, T.; Morse, A.P.; Palmer, T.N. Malaria early warnings based on seasonal climate forecasts from multi-model ensembles. Nature 2006, 439, 576–579. [Google Scholar]
- Hewawasam, I. Managing the Marine and Coastal Environment of Sub-Saharan Africa: Strategic Directions for Sustainable Development; World Bank: Washington, DC, USA, 2002; p. 57. [Google Scholar]
- Nicholls, R.J. Coastal flooding and wetland loss in the 21st century: Changes under the SRES climate and socio-economic scenarios. Glob. Environ. Chang. 2004, 14, 69–86. [Google Scholar]
- McMichael, A.J.; Woodruff, R.E.; Hales, S. Climate change and human health: Present and future risks. Lancet 2006, 367, 859–869. [Google Scholar]
- Few, R.; Ahern, M.; Matthies, F.; Kovats, S. Floods, Health and Climate Change: A Strategic Review; Working Paper 63; Tyndall Centre for Climate Change Research, University of East Anglia: Norwich, UK, 2004; p. 138. [Google Scholar]
- Boko, M.; Niang, I.; Nyong, A.; Vogel, C.; Githeko, A.; Medany, M.; Osman-Elasha, B.; Tabo, R.; Yanda, P. Impacts, adaptation and vulnerability; Contribution of Working Group II to the Fourth Assessment Report of the Intergovernmental Panel on Climate Change; Parry, M.L., Canziani, O.F., Palutikof, J.P., Van der Linden, P.J., Hanson, C.E., Eds.; Cambridge University Press: Cambridge, UK, 2007; pp. 433–467. [Google Scholar]
- Piguet, E. Linking climate change, environmental degradation and migration: A methodological overview. Wiley Interdiscip. Rev. Clim. Chang. 2010, 1, 517–524. [Google Scholar]
- Odjugo, P.A.O. Quantifying the cost of climate change impact in Nigeria: Emphasis on wind and rainstorms. J. Hum. Ecol. 2009, 28, 93–101. [Google Scholar]
- Coe, M.; Foley, J.A. Human and natural impacts on the water resources of the Lake Chad Basin. J. Geophys. Res. 2001, 106, 3349–3356. [Google Scholar]
- Adejuwon, J.O. Food crop production in Nigeria. II: Potential effects of climate change. Clim. Res. 2006, 32, 229–245. [Google Scholar]
- Odjugo, P.A.O. General overview of climate change impacts in Nigeria. J. Hum. Ecol. 2010, 29, 47–55. [Google Scholar]
- Odjugo, P.A.O. An analysis of rainfall pattern in Nigeria. Glob. J. Environ. Sci. 2005, 4, 139–145. [Google Scholar]
- Wheeler, D. Quantifying Vulnerability to Climate Change: Implications for Adaptation Assistance; Center for Global Development: Washington, DC, USA, 2011. [Google Scholar]
- Treichel, V. Putting Nigeria to Work: A Strategy for Employment and Growth; World Bank: Washington, DC, USA, 2010. [Google Scholar]
- UK Department of International Development (DFID/ERM). Impact of Climate Change on Nigeria’s Economy; DFID: Abuja, Nigeria, 2009.
- Blennow, K.; Persson, J.; Tome, M.; Hanewinkel, M. Climate change: Believing and seeing implies adapting. PLoS One 2012, 7, e50182. [Google Scholar]
- Leiserowitz, A. Climate change risk perception and policy preferences: the role of affect, imagery, and values. Clim. Chang. 2006, 77, 45–72. [Google Scholar]
- Blennow, K.; Persson, J. Climate change: Motivation for taking measure to adapt. Glob. Environ. Chang. 2009, 19, 100–104. [Google Scholar]
- Weber, E. What shapes perceptions of climate change? Wiley Interdiscip. Rev. Clim. Chang. 2010, 1, 332–342. [Google Scholar]
- Spence, A.; Poortinga, W.; Butler, C.; Pidgeon, N.F. Perceptions of climate change and willingness to save energy related to flood experience. Nat. Clim. Chang. 2011, 1, 46–49. [Google Scholar]
- Weber, E. Experience-based and description-based perceptions of long term risk: Why global warming does not scare us (yet). Clim. Chang. 2006, 77, 103–120. [Google Scholar]
- Leiserowitz, A.; Maibach, E.; Roser-Renouf, C.; Hmielowski, J.D. Extreme Weather, Climate & Preparedness in the American Mind. Available online: http://environment.yale.edu/climate/files/Extreme-Weather-Climate-Preparedness.pdf (accessed on 28 August 2013).
- Costello, A.; Abbas, M.; Allen, A.; Ball, S.; Bell, S.; Bellamy, R.; Patterson, C. Managing the health effects of climate change. Lancet 2009, 373, 1693–1733. [Google Scholar]
- Weber, E.U.; Stern, P.C. Public understanding of climate change in the United States. Amer. Psych. 2011, 66, 315–328. [Google Scholar]
- Daw, T.M.; Robinson, J.A.N.; Graham, N.A. Perceptions of trends in Seychelles artisanal trap fisheries: Comparing catch monitoring, underwater visual census and fishers' knowledge. Environ. Conserv. 2011, 38, 75–88. [Google Scholar]
- MacIntyre, S.; Ellaway, A.; Cummins, S. Place effects on health: How can we conceptualise, operationalise and measure them? Soc. Sci. Med. 2002, 55, 125–139. [Google Scholar]
- Armitage, D.R.; Plummer, R.; Berkes, F.; Arthur, R.I.; Charles, A.T.; Davidson-Hunt, I.J.; Wollenberg, E.K. Adaptive co-management for social-ecological complexity. Front. Ecol. Environ. 2008, 7, 95–102. [Google Scholar]
- Tschakert, P.; Dietrich, K.A. Anticipatory learning for climate change adaptation and resilience. Ecol. Soc. 2010, 15, 11–33. [Google Scholar]
- Crate, S.A.; Nuttall, M. (Eds.) Anthropology and Climate Change: From Encounters to Actions; Left Coast Press: Walnut Creek, CA, USA, 2009.
- Gifford, R. The dragons of inaction: Psychological barriers that limit climate change mitigation and adaptation. Am. Psychol. 2011, 66. [Google Scholar] [CrossRef]
- Braimoh, A.K.; Onishi, T. Spatial determinants of urban land use change in Lagos, Nigeria. Land Use Policy 2007, 24, 502–515. [Google Scholar]
- Hahn, M.B.; Riederer, A.M.; Foster, S.O. The livelihood vulnerability index: A pragmatic approach to assessing risks from climate variability and change—A case study in Mozambique. Glob. Environ. Chang. 2009, 19, 74–88. [Google Scholar]
- Barrios, S.; Bertinelli, L.; Strobl, E. Climatic change and rural-urban migration: The case of sub-Saharan Africa. J. Urban Econ. 2006, 60, 357–371. [Google Scholar]
- Kuruppu, N.; Liverman, D. Mental preparation for climate adaptation: The role of cognition and culture in enhancing adaptive capacity of water management in Kiribati. Glob. Environ. Chang. 2011, 21, 657–669. [Google Scholar]
- Bryan, E.; Ringler, C.; Okoba, B.; Roncoli, C.; Silvestri, S.; Herrero, M. Adapting agriculture to climate change in Kenya: Household strategies and determinants. J. Environ. Manag. 2013, 114, 26–35. [Google Scholar]
- Wolf, J.; Adger, W.N.; Lorenzoni, I.; Abrahamson, V.; Raine, R. Social capital, individual responses to heat waves and climate change adaptation: An empirical study of two UK cities. Glob. Environ. Chang. 2010, 20, 44–52. [Google Scholar]
- Adger, N. Vulnerability. Glob. Environ. Chang. 2006, 16, 268–281. [Google Scholar]
- Cutter, S. Vulnerability to environmental hazard. Prog. Hum. Geogr. 1996, 20, 529–539. [Google Scholar]
- Wisner, B.; Blaikie, P.; Cannon, T.; Davis, I. At Risk: Natural Hazards, People’s Vulnerability and Disasters, 2nd ed.; Routledge: London, UK, 2004. [Google Scholar]
- Kelly, P.M.; Adger, N. Theory and practice in assessing vulnerability to climate change and facilitating adaptation. Clim. Chang. 2000, 47, 325–352. [Google Scholar]
- O’Brien, K.L.; Leichenko, R.; Kelkar, U.; Venema, H.; Aandahl, G.; Tompkins, H.; West, J. Mapping vulnerability to multiple stressors: Climate change and globalization in India. Glob. Environ. Chang. 2004, 14, 303–313. [Google Scholar]
- Sen, A. Poverty and Famines: An Essay on Entitlement and Deprivation; Clarendon: Oxford, UK, 1981. [Google Scholar]
- Watt, M.; Bohle, H. Hunger, famine and the space of vulnerability. GeoJournal 1993, 30, 117–125. [Google Scholar]
- Blaikie, P.; Brookfield, H. Land Degradation and Society; Methuen: London, UK, 1987. [Google Scholar]
- Lankao, P.; Qin, H. Conceptualising urban vulnerability to global climate and environmental change. Curr. Opin. Glob. Environ. Sustain. 2011, 3, 142–149. [Google Scholar]
- Cutter, S.; Emrich, C. Moral hazard, social catastrophe: The changing face of vulnerability along the coasts. Ann. Am. Assoc. Polit. Soc. Sci. 2006, 604, 102–112. [Google Scholar]
- Awosika, F.; French, T.; Nicholls, R.; Ibe, E. Impacts of sea level rise on Nigeria. In Proceedings of the 1992 IPCC Symposium: The Rising Challenge of the Sea, Margarita, Venezuela, 14–19 March 1992.
- Rosenzweig, C.; Solecki, W.D.; Hammer, S.A. Climate Change and Cities: First Assessment report of the Urban Climate Change Research Network; Cambridge University Press: Cmbridge, UK, 2011. [Google Scholar]
- The State of African Cities: Re-Imaging Sustainable Urban Transitions. Available online: http://unhabitat.org/the-state-of-african-cities-2014/ (accessed on 15 June 2014).
- Pol, L.G.; Thomas, R.K. Population size, distribution and concentration. In The Demography of Health and Healthcare; Springer: Dordrecht, The Netherlands, 2013; pp. 37–63. [Google Scholar]
- Awosika, L.F.; Dublin-Green, C.O.; Folorunsho, R.; Adekoya, E.A.; Adekanmbi, M.A.; Jim-Saiki, J. Study of Main Drainage Channels of Victoria and Ikoyi Islands in Lagos Nigeria and Their Response to Tidal and Sea Level Changes; CSI-UNESCO Special Report; United Nations: New York, NY, USA, 2000. [Google Scholar]
- Okusipe, O.M. Lagos Lagoon Coastal Profile: Information Database for Planning Theory; Lagos State Environment Report; Lagos State Ministry of Environment: Lagos, Nigeria, 2004.
- Brooks, N.; Adger, W.N.; Kelly, P M. The determinants of vulnerability and adaptive capacity. Glob. Environ. Chang. 2005, 15, 151–163. [Google Scholar]
- Ajibade, I.; McBean, G. Climate extremes and housing rights: A political ecology of impacts, early warning and adaptation constraints in slum communities. Geoforum 2014, 55, 76–86. [Google Scholar]
- Cohen, C.; Werker, E.D. The political economy of “natural” disasters. J. Confl. Resolut. 2008, 52, 795–819. [Google Scholar]
- Jerrett, M.; Gale, S.; Kontgis, C. An environmental health geography of risk. In A Companion to Health and Medical Geography; Brown, T., McLafferty, S., Moon, G., Eds.; Wiley-Blackwell: Chichester, UK, 2010; pp. 418–445. [Google Scholar]
- Curtis, S.; Oven, K. Geographies of health and climate change. Prog. Hum. Geogr. 2012, 36, 654–666. [Google Scholar]
- Atkinson, R.; Kintrea, K. Owner-occupation, social mix and neighbourhood impacts. Policy Polit. 2000, 28, 93–108. [Google Scholar]
- Atkinson, R.; Kintrea, K. Disentangling area effects: Evidence from deprived and non-deprived neighbourhoods. Urban Stud. 2001, 38, 2277–2298. [Google Scholar]
- Yen, I.H.; Kaplan, G.A. Poverty area residence and changes in physical activity level: Evidence from the Alameda County Study. Am. J. Public Health 1998, 88, 1709–1712. [Google Scholar]
- Ebi, K.L.; Lewis, N.D.; Corvalan, C. Climate variability and change and their potential health effects in small island states: Information for adaptation planning in the health sector. Environ. Health Perspect. 2006, 114, 1957–1963. [Google Scholar]
- Haines, A.; Kovats, R.S.; Campbell-Lendrum, D.; Corvalan, C. Climate change and human health: Impacts, vulnerability, and mitigation. Lancet 2006, 367, 2101–2109. [Google Scholar]
- Waitzman, N.J.; Smith, K.R. Phantom of the area: poverty residence and mortality in the U.S. Am. J. Public Health 1998, 88, 973–976. [Google Scholar]
- Ellen, I.G.; Mijanovich, T.; Dillman, K.N. Neighborhood effects on health: Exploring the links and assessing the evidence. J. Urban Aff. 2003, 23, 391–408. [Google Scholar]
- Kawachi, I.; Subramanian, S.V.; Almeida-Filho, N. A glossary for health inequalities. J. Epidemiol. Community Health 2002, 56, 647–652. [Google Scholar]
- Schulz, A.; Northridge, M.E. Social determinants of health: Implications for environmental health promotion. Health Educ. Behav. 2004, 31, 455–471. [Google Scholar]
- Williams, D.R. Race, socioeconomic status, and health the added effects of racism and discrimination. Ann. N. Y. Acad. Sci. 2006, 896, 173–188. [Google Scholar]
- Barredo, J.I.; Demicheli, L.; Lavalle, C.; Kasanko, M.; McCormick, N. Modelling future urban scenarios in developing countries: An application case study in Lagos, Nigeria. Environ. Plan. B–Plan. Des. 2004, 31, 65–84. [Google Scholar]
- Crandall, M.S.; Weber, B.A. Local social and economic conditions, spatial concentrations of poverty, and poverty dynamics. Am. J. Agric. Econ. 2004, 86, 1276–1281. [Google Scholar]
- Chowdhury, M.J.A.; Ghosh, D.; Wright, R.E. The impact of micro-credit on poverty: Evidence from Bangladesh. Prog. Dev. Stud. 2005, 5, 298–309. [Google Scholar]
© 2014 by the authors; licensee MDPI, Basel, Switzerland. This article is an open access article distributed under the terms and conditions of the Creative Commons Attribution license (http://creativecommons.org/licenses/by/4.0/).
Share and Cite
Ajibade, I.; Armah, F.A.; Kuuire, V.; Luginaah, I.; McBean, G. Self-Reported Experiences of Climate Change in Nigeria: The Role of Personal and Socio-Environmental Factors. Climate 2015, 3, 16-41. https://doi.org/10.3390/cli3010016
Ajibade I, Armah FA, Kuuire V, Luginaah I, McBean G. Self-Reported Experiences of Climate Change in Nigeria: The Role of Personal and Socio-Environmental Factors. Climate. 2015; 3(1):16-41. https://doi.org/10.3390/cli3010016
Chicago/Turabian StyleAjibade, Idowu, Frederick Ato Armah, Vincent Kuuire, Isaac Luginaah, and Gordon McBean. 2015. "Self-Reported Experiences of Climate Change in Nigeria: The Role of Personal and Socio-Environmental Factors" Climate 3, no. 1: 16-41. https://doi.org/10.3390/cli3010016
APA StyleAjibade, I., Armah, F. A., Kuuire, V., Luginaah, I., & McBean, G. (2015). Self-Reported Experiences of Climate Change in Nigeria: The Role of Personal and Socio-Environmental Factors. Climate, 3(1), 16-41. https://doi.org/10.3390/cli3010016