1. Introduction
The rainfall dominated climate of Bangladesh receives the heaviest rainfall in the world [
1] and differs from other tropical regions because of the strong influence of the Indian Ocean and the Himalayas. High temperatures, heavy rainfall and seasonal variation are the unique characteristics that distinguish the climate of Bangladesh from that of other tropical regions. However, the locations of rainfall origination including the characteristics remain unclear in different rainy periods [
2]. The Bangladeshi climate is comprised of four seasons: pre-monsoon (March–May), monsoon (June–August), post-monsoon (September–November) and winter (December–February). The pre-monsoon, monsoon and post-monsoon seasons are basically the rainy seasons [
3]. Monsoon rainfall accounts for approximately 85% of the total rainfall while occurrences of wet days are rare in the dry season. This monsoon rainfall is caused by monsoon depressions in the Bay of Bengal [
4]. This makes Bangladesh a highly humid zone with a mean annual rainfall of 2488 mm. The pre-monsoon period is characterized by warm temperatures (27 °C on average) and the occurrence of thunderstorms with rainfall ranging from 15 mm/year in the western central region to more than 80 mm/year in the northeast region. This pre-monsoonal rainfall and thunderstorms are dominated by the moist air from the Bay of Bengal. The effect of the Bay of Bengal coupled with that of the Himalayas creates extremely high rainfall levels during the monsoon season [
5,
6,
7]. Annual rainfall varies significantly throughout the country with a range of 1270–5000 mm. Shahid and Khairulmain [
8] showed that inter-annual rainfall is highly variable (coefficient of variation 16–24 %) across the entire country, which they classified into 6 zones based on rainfall variability. High rainfall variability together with low rainfall in the northern part made it “drought prone”, whereas the south western coastal region is a comparatively “humid area” with low variability and high rainfall.
Rainfall is one of the substantial weather indicators of climate change [
9]. Rising temperatures across the globe likely result in changes in precipitation and atmospheric moisture through a more active hydrological cycle, leading to increases in water holding capacity throughout the atmosphere at a rate of about 7% per °C [
10]. Climate change is acting as a trigger for changing rainfall patterns which can have significant impacts on the sowing and harvesting times of crops [
5,
11]. The main rice varsities such as
Aus and
Aman are sown and harvested between the pre-monsoon and post-monsoon periods, which account for more than 95% of total annual rainfall. Although the harvesting and sowing periods of the crops vary spatially depending on the agro-climatic conditions of the area [
5], the farming system is strongly dependent on the timely arrival of monsoon rain and its distribution [
12].
Rising temperatures in combination with rainfall anomalies due to climate change strongly influence soil moisture. This may have a negative impact on the major crops of the country by inducing drought [
13]. Recently, in 2010, low rainfall (30% below average levels) during the monsoon and excessive rainfall in the post-monsoon caused extensive damage in the agricultural sector. The lack of rainfall created agricultural drought in the country while excessive rainfall at the beginning of the post-monsoon period provoked flash floods. In 2007, more than 9 million people were affected by severe flooding caused by heavy rainfall [
14]. Rice and wheat production decreased by approximately 3.5 × 10⁶ metric tonnes because of low rainfall during the 1994–2005 period [
4]. Traditional crop cultivation methods changed and production costs increased because of increased temperatures and rainfall changes during the harvesting and sowing periods of crops. These changes in climate are leading to crop failure and greater demands for capital (labor, money, fertilizer,
etc.) to produce food for the large population in some coastal areas of the country [
15].
Therefore, knowledge of the spatial and temporal variability of rainfall patterns are crucial in adaptation planning for Bangladesh, as rain-fed agriculture not only accounts for around 23% of the Gross Domestic Product (GDP) but also constitutes 68% of the total employment of Bangladesh [
3,
16]. A deeper understanding of the characteristics and distribution of rainfall patterns will support water management, agricultural development and disaster management and planning in Bangladesh in the context of global climate change [
4,
17,
18].
Numerous efforts (e.g., [
12,
17,
18]) have been undertaken to investigate the characteristics of rainfall patterns in Bangladesh. These studies have largely focused on either monsoon or pre-monsoon rainfall characteristics and trends. Spatial and temporal rainfall patterns have also been analyzed by other [
1,
8,
19,
20,
21]. There studies concentrated on specific locations and few of them like Shahid and Khairulmaini [
8] concentrated on the rainfall variability of the country from 1969–2003. Shahid [
6] focused on the dry and wet periods of Bangladesh over the period 1958–2007 and the climatic characteristics of rainfall were analyzed by Islam and Uyeda [
20]. However, the remainder of the studies [
3,
20,
22] focused on the projection of rainfall in Bangladesh. No study has thus far been conducted to evaluate the spatial and temporal rainfall variability in the south-west coastal area, which is the most vulnerable area of Bangladesh due to climate change, and where the Bangladesh Government is planning and implementing climate change adaptation strategies. Moreover, previous studies in Bangladesh have not analyzed any change point, or investigated the sequential trends to identify the starting point in rainfall trajectories. A more in-depth knowledge of the rainfall variability focusing on the seasonal, decadal and spatial aspects in this south-west area is essential for effective regional (e.g., [
23]) and national climate change adaptation planning. Therefore, the objective of this study is to analyze the temporal and spatial variability of seasonal and annual rainfall trends over the south-west coast of Bangladesh from 1947 to 2007 through answering the following research questions:
Is the seasonal rainfall trends decreasing or increasing?
Is there any variability within the different time segments of seasonal rainfall?
Is there any spatial variability of rainfall over the southwest coast of Bangladesh?
Is there any cyclicity in the trajectories of rainfall?
Is there any change point in the rainfall trajectories?
What are the implications of rainfall variability in adaptation to climatic variability?
The objective of this study has been achieved by analyzing time series data from eight weather stations (1947–2007) using statistical tests including the homogeneity test, Sen’s slope estimation, linear regression, the Mann-Kendal test and autocorrelation. Annual, decadal and seasonal rainfall trends are evaluated to understand their spatial and temporal variability. Moreover, the sequential Mann Kendal test is applied to identify the starting point of trends, and also change point has been analyzed using the Lepage test.
1.1. Study Area
South west coastal Bangladesh has been selected for this study. This area accounts around 10% of the national population and around 16% total land area, which is about 25,000 km
2. Beside the demographic characteristics, environmental settings are one the major reasons in selecting this area, within which are:
This area acts as a passage to pass one of the major river systems in the world: Ganges-Bhrahmputra-Meghna, where rainfall plays an important role [
20]. This river flow and rainfall plays important role in maintaining the fresh water and sea water mixing which underpin to mangrove forest growth.
World largest mangrove forest Sundarban located in this area, where people are mostly dependent on agriculture, fishery and resources extraction from mangrove forest.
This area is highly vulnerable to storm surges and river flooding [
24] and most importantly, this area is one of the most vulnerable regions to global climate change.
Moreover, regional problem like salinity usually increases in absence of rainfall events and river flow, which also influences by rainfall runoff.
Therefore, concerning the regional level adaptations planning to environmental changes, we select this area for this study, which can further be extend for the whole country.
1.2. Dataset Arrangement
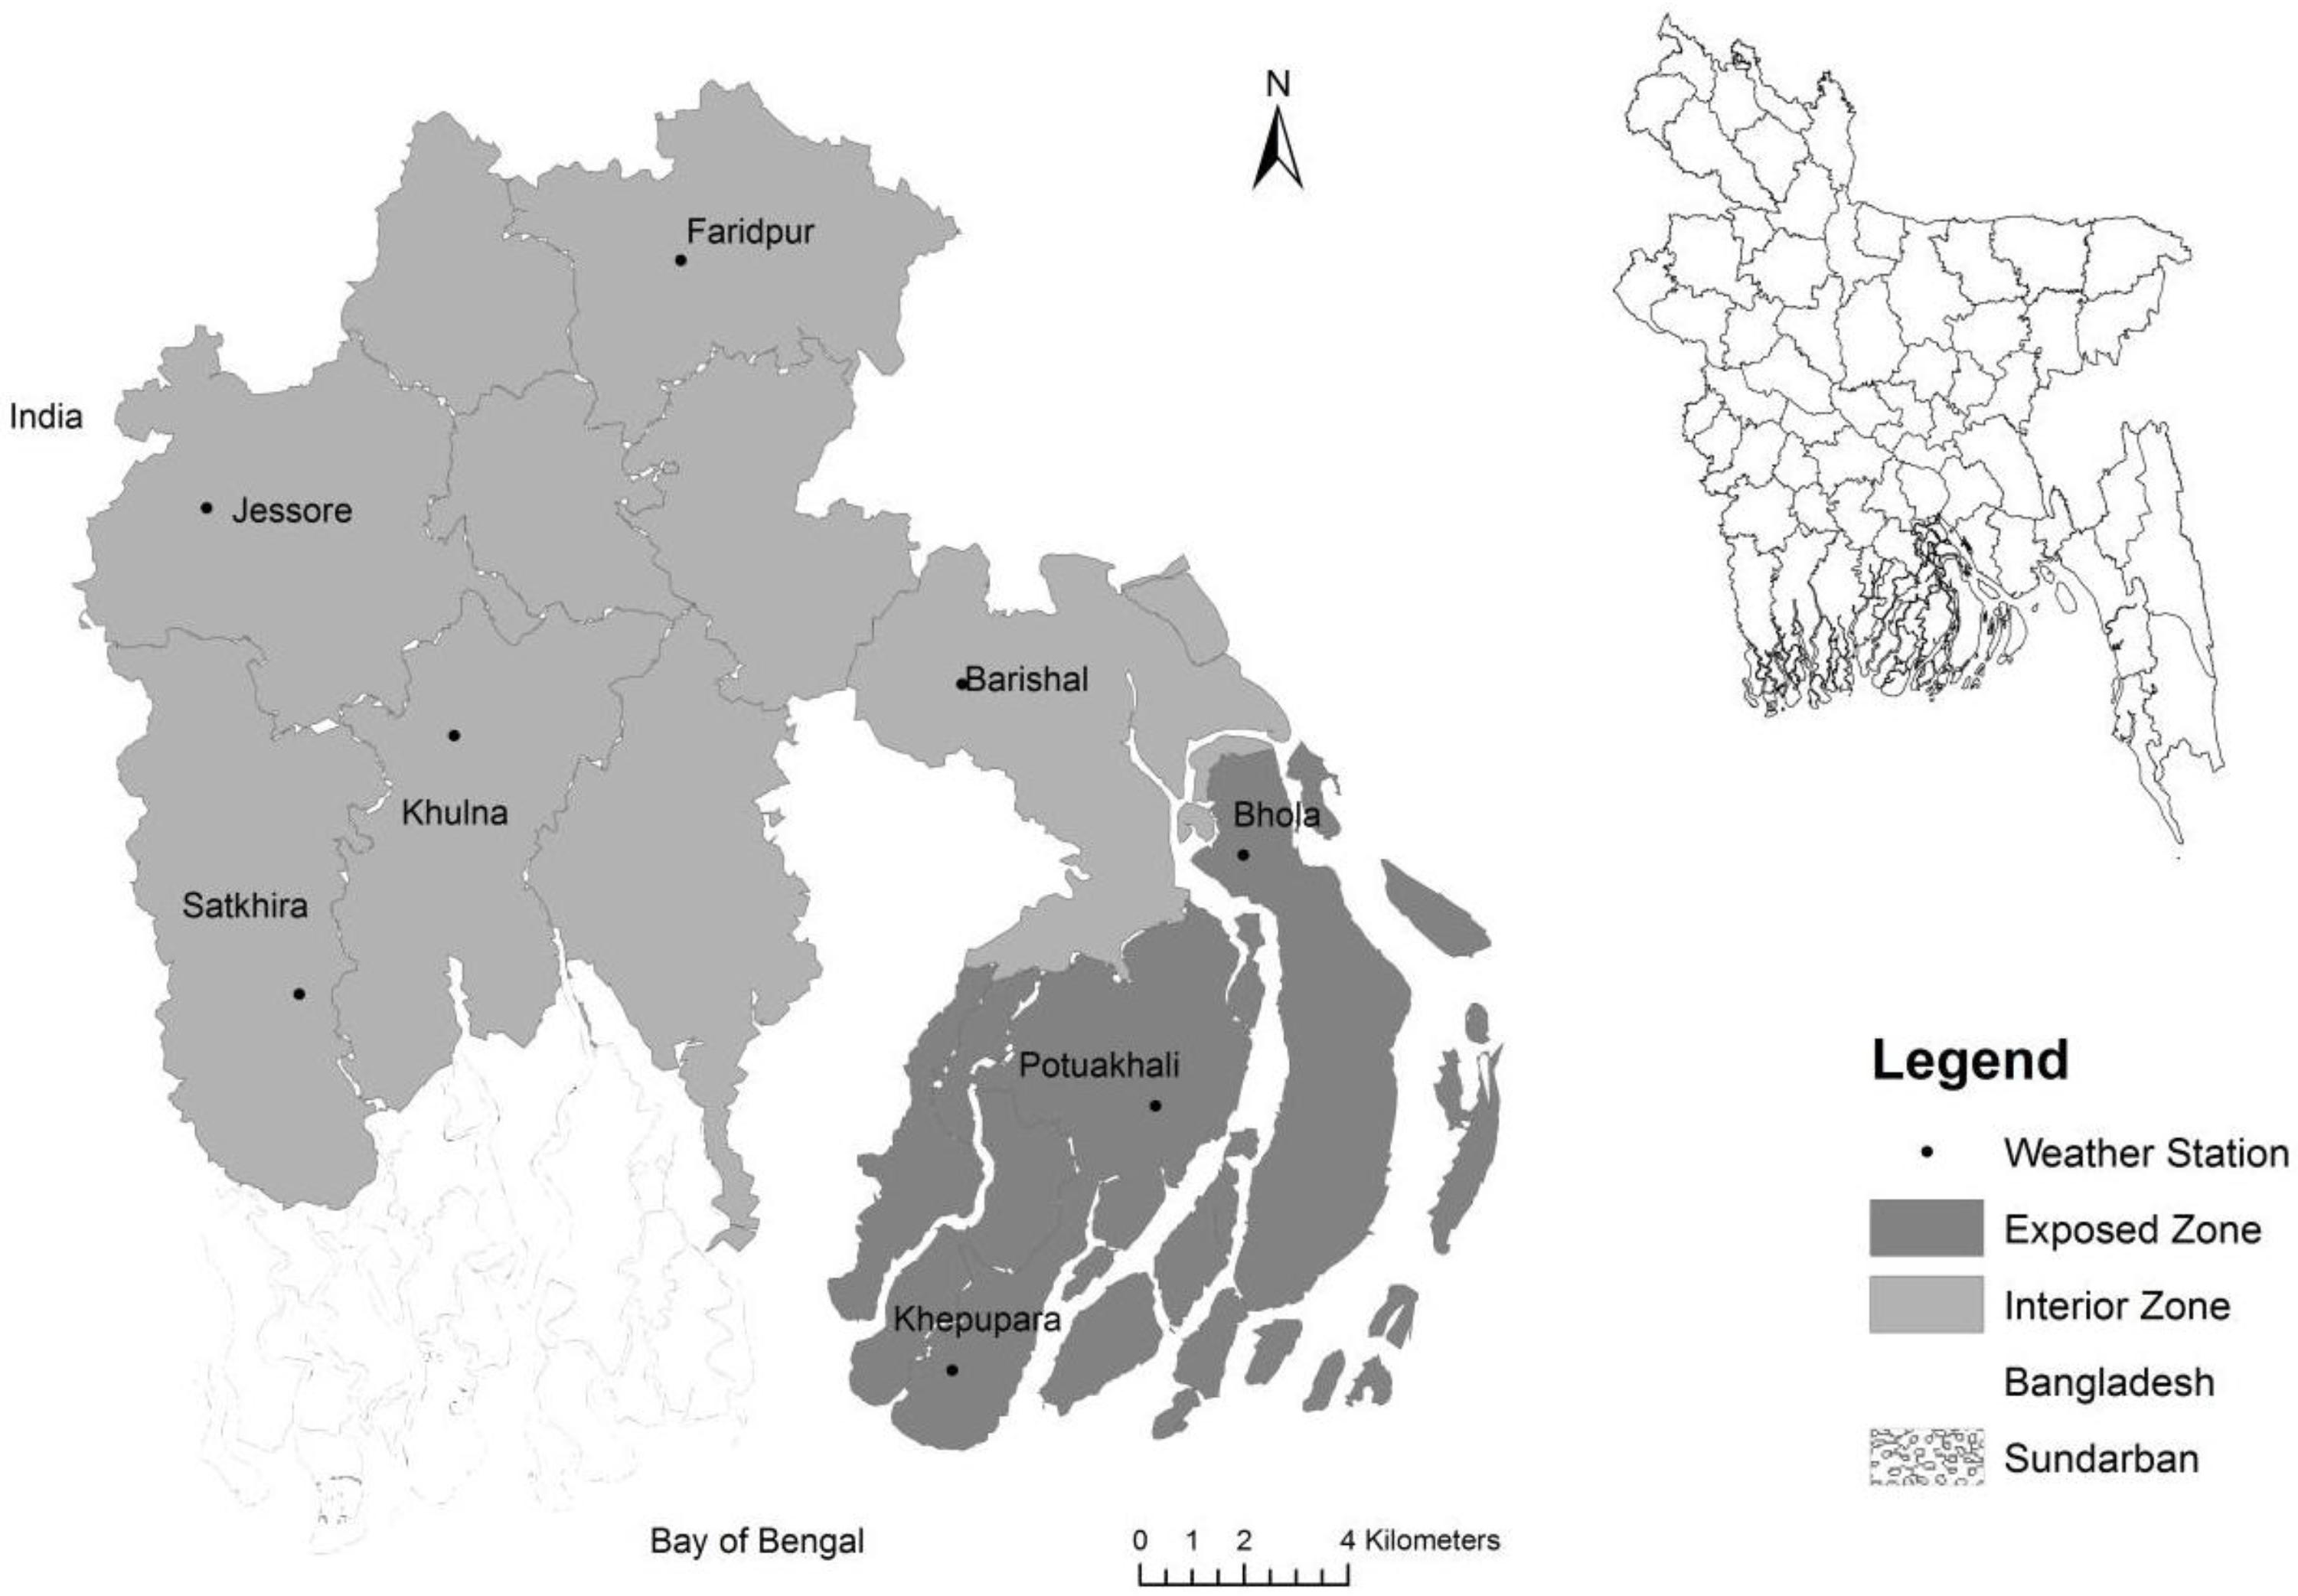
Long-term daily rainfall records (1948–2007) from 8 meteorological stations were collected from the Bangladesh Meteorological Department (BMD). Each station represents one district (mid-level administrative unit in Bangladesh), covering 8 Districts of the south-west coastal region of Bangladesh. According to the definition of coastal region delineated by the Integrated Coastal Zone Management Programme (ICZMP) initiated by the Government of Bangladesh, three fall within the exterior coastal zone (exposed to the sea) and the remaining five lie within the interior coastal zone (distant from the sea) [
25]. The ICZMP [
25] of Bangladesh defines the exposed zone as that which has an intense relationship with the marine environment and is characterized by a high risk of cyclone, tidal movement and salinity. The exposed zone is defined as a humid zone as it receives an annual rainfall of 2000–3000 mm whereas the interior zone (moist sub-humid) receives 1500–1900 mm of rainfall annually [
8]. More details regarding the methodology of this classification and
Figure 1 can be found in the 2003 ICZMP report. The locations of the meteorological stations and the characteristics of the rainfall weather stations are shown in
Figure 1 and
Table 1 respectively.
Figure 1.
Weather Stations in the south-west coastal Bangladesh.
Figure 1.
Weather Stations in the south-west coastal Bangladesh.
Table 1.
Characteristics of the rainfall datasets used in this study.
Table 1.
Characteristics of the rainfall datasets used in this study.
| Station | Lat./Long. | Altitude (m) | Group | Period of Record | Record Length |
|---|
| Barishal | 22.70N 90.36E | 4 | ICZ | 1948–2007 | 60 years |
| Khulna | 22.80N 89.58E | 4 | ICZ | 1948–2007 | 60 years |
| Faridpur | 23.61N 89.84E | 9 | NCZ | 1948–2007 | 60 years |
| Jessore | 23.17N 89.22E | 7 | ICZ | 1948–2007 | 60 years |
| Satkhira | 22.68N 89.07E | 6 | ICZ | 1948–2007 | 60 years |
| Bhola | 22.70N 90.66E | 5 | ECZ | 1973–2007 | 35 years |
| Patuakhali | 22.36N 90.34E | 3 | ECZ | 1973–2007 | 35 years |
| Khepupara | 21.98N 90.22E | 3 | ECZ | 1973–2007 | 35 years |
Monthly mean rainfall was calculated from the daily rainfall data. The rate of missing data was less than 1%. The dataset of the interior coastal zone was more complete than that of the exterior coastal zone. If the data for any day of a year is missing for a particular station, a simple average method was applied.
Table 1 illustrates the characteristics of the dataset used for this study.
The rainfall records, however, cover a much more extensive period (1948–2007) in the meteorological stations of interior coastal zone than in those of the exterior zone (1973–2007), due to their date of establishment. The yearly time scale was classified into four seasons: monsoon (June–July–August: hereafter written as JJA), post-monsoon (September–October–November: SON), winter (December–January–February: DJF) and pre-monsoon (March–April–May: MAM) (adapted from [
20,
23,
26]). Seasonal and zonal trends are considered in this study in order to increase the validity and reliability of the analysis, as the annual rainfall pattern varies significantly across the four seasons of Bangladesh [
5].
For the analysis and observation of trends, the datasets were divided into three time segments: 1947–1970, 1971–1990 and 1991–2007 for the interior zone and 1973–1990 and 1991–2007 for the exposed zone. The classification of the time segments was conceptualized according to the IPCC [
27], as it has been reported that climate warming was observed principally after the 1990s, where 1998 was the warmest year on record. Annual rainfall in Bangladesh decreased from 1971 to 1980 and increased over the 1981–1990 period [
20]. However, Ahsan
et al., 2010 [
12] showed that the decades from 1991 to 2010 were very dry compared to those between 1961 and 1990. Moreover, similar patterns were observed in previous research which examined annual rainfall trends [
6]. This country-level result also coincides with regional-level trends such as those in the south-west coastal area of Bangladesh, where annual rainfall increased by around 6% in the period 1991–2002 compared to 1954–1990 [
22]. Hossain and Roy [
19], and Hossain [
28] also used a similar classification to observe the rainfall and temperature trends in their studies. Furthermore, community perceived knowledge reported changing rainfall patterns mostly after 1990 [
15,
29]. Therefore, we classified the time scale into three time segments to observe the trends in different time segments.
Before statistical analysis of the dataset was carried out, a homogeneity test was performed on the seasonally averaged dataset grouped according to interior and exterior coastal zone to detect any non-homogeneity. In this study, both Levene’s Test (1960) and Brown and Forsythe’s Test (1974) were applied to detect any non-homogeneity among the time series dataset. Results reveal that significant non-homogeneity exists in the seasonal time series data
2. Methodology
We applied number of time series statistics both parametric and non-parametric to analyze the temporal and spatial rainfall variability. The non-parametric Mann–Kendall trend test was applied to detect trends in the time series data. The Mann-Kendall test was formulated by Mann (1945) [
30] as a non-parametric test for trend detection and the test statistic distribution was explained by Kendall (1975) [
31] for testing non-linear trends and turning points. The test assumes a monotonic trend and thus rejects the presence of any seasonal or other cycles in the data. The Mann-Kendall test is preferred when various stations are tested in a single study [
32]. In the present study, confidence levels of 99%, 95% and 90% signify the positive or negative trends determined by the test statistic. At the 99% significance level, the null hypothesis of no trend is rejected if |Z| > 2.575; at the 95% significance level, the null hypothesis of no trend is rejected if |Z| > 1.96; and at the 90% significance level, the null hypothesis of no trend is rejected if |Z| > 1.645. More details of the Mann-Kendall test and its statistical ability are documented in Yue
et al. [
33].
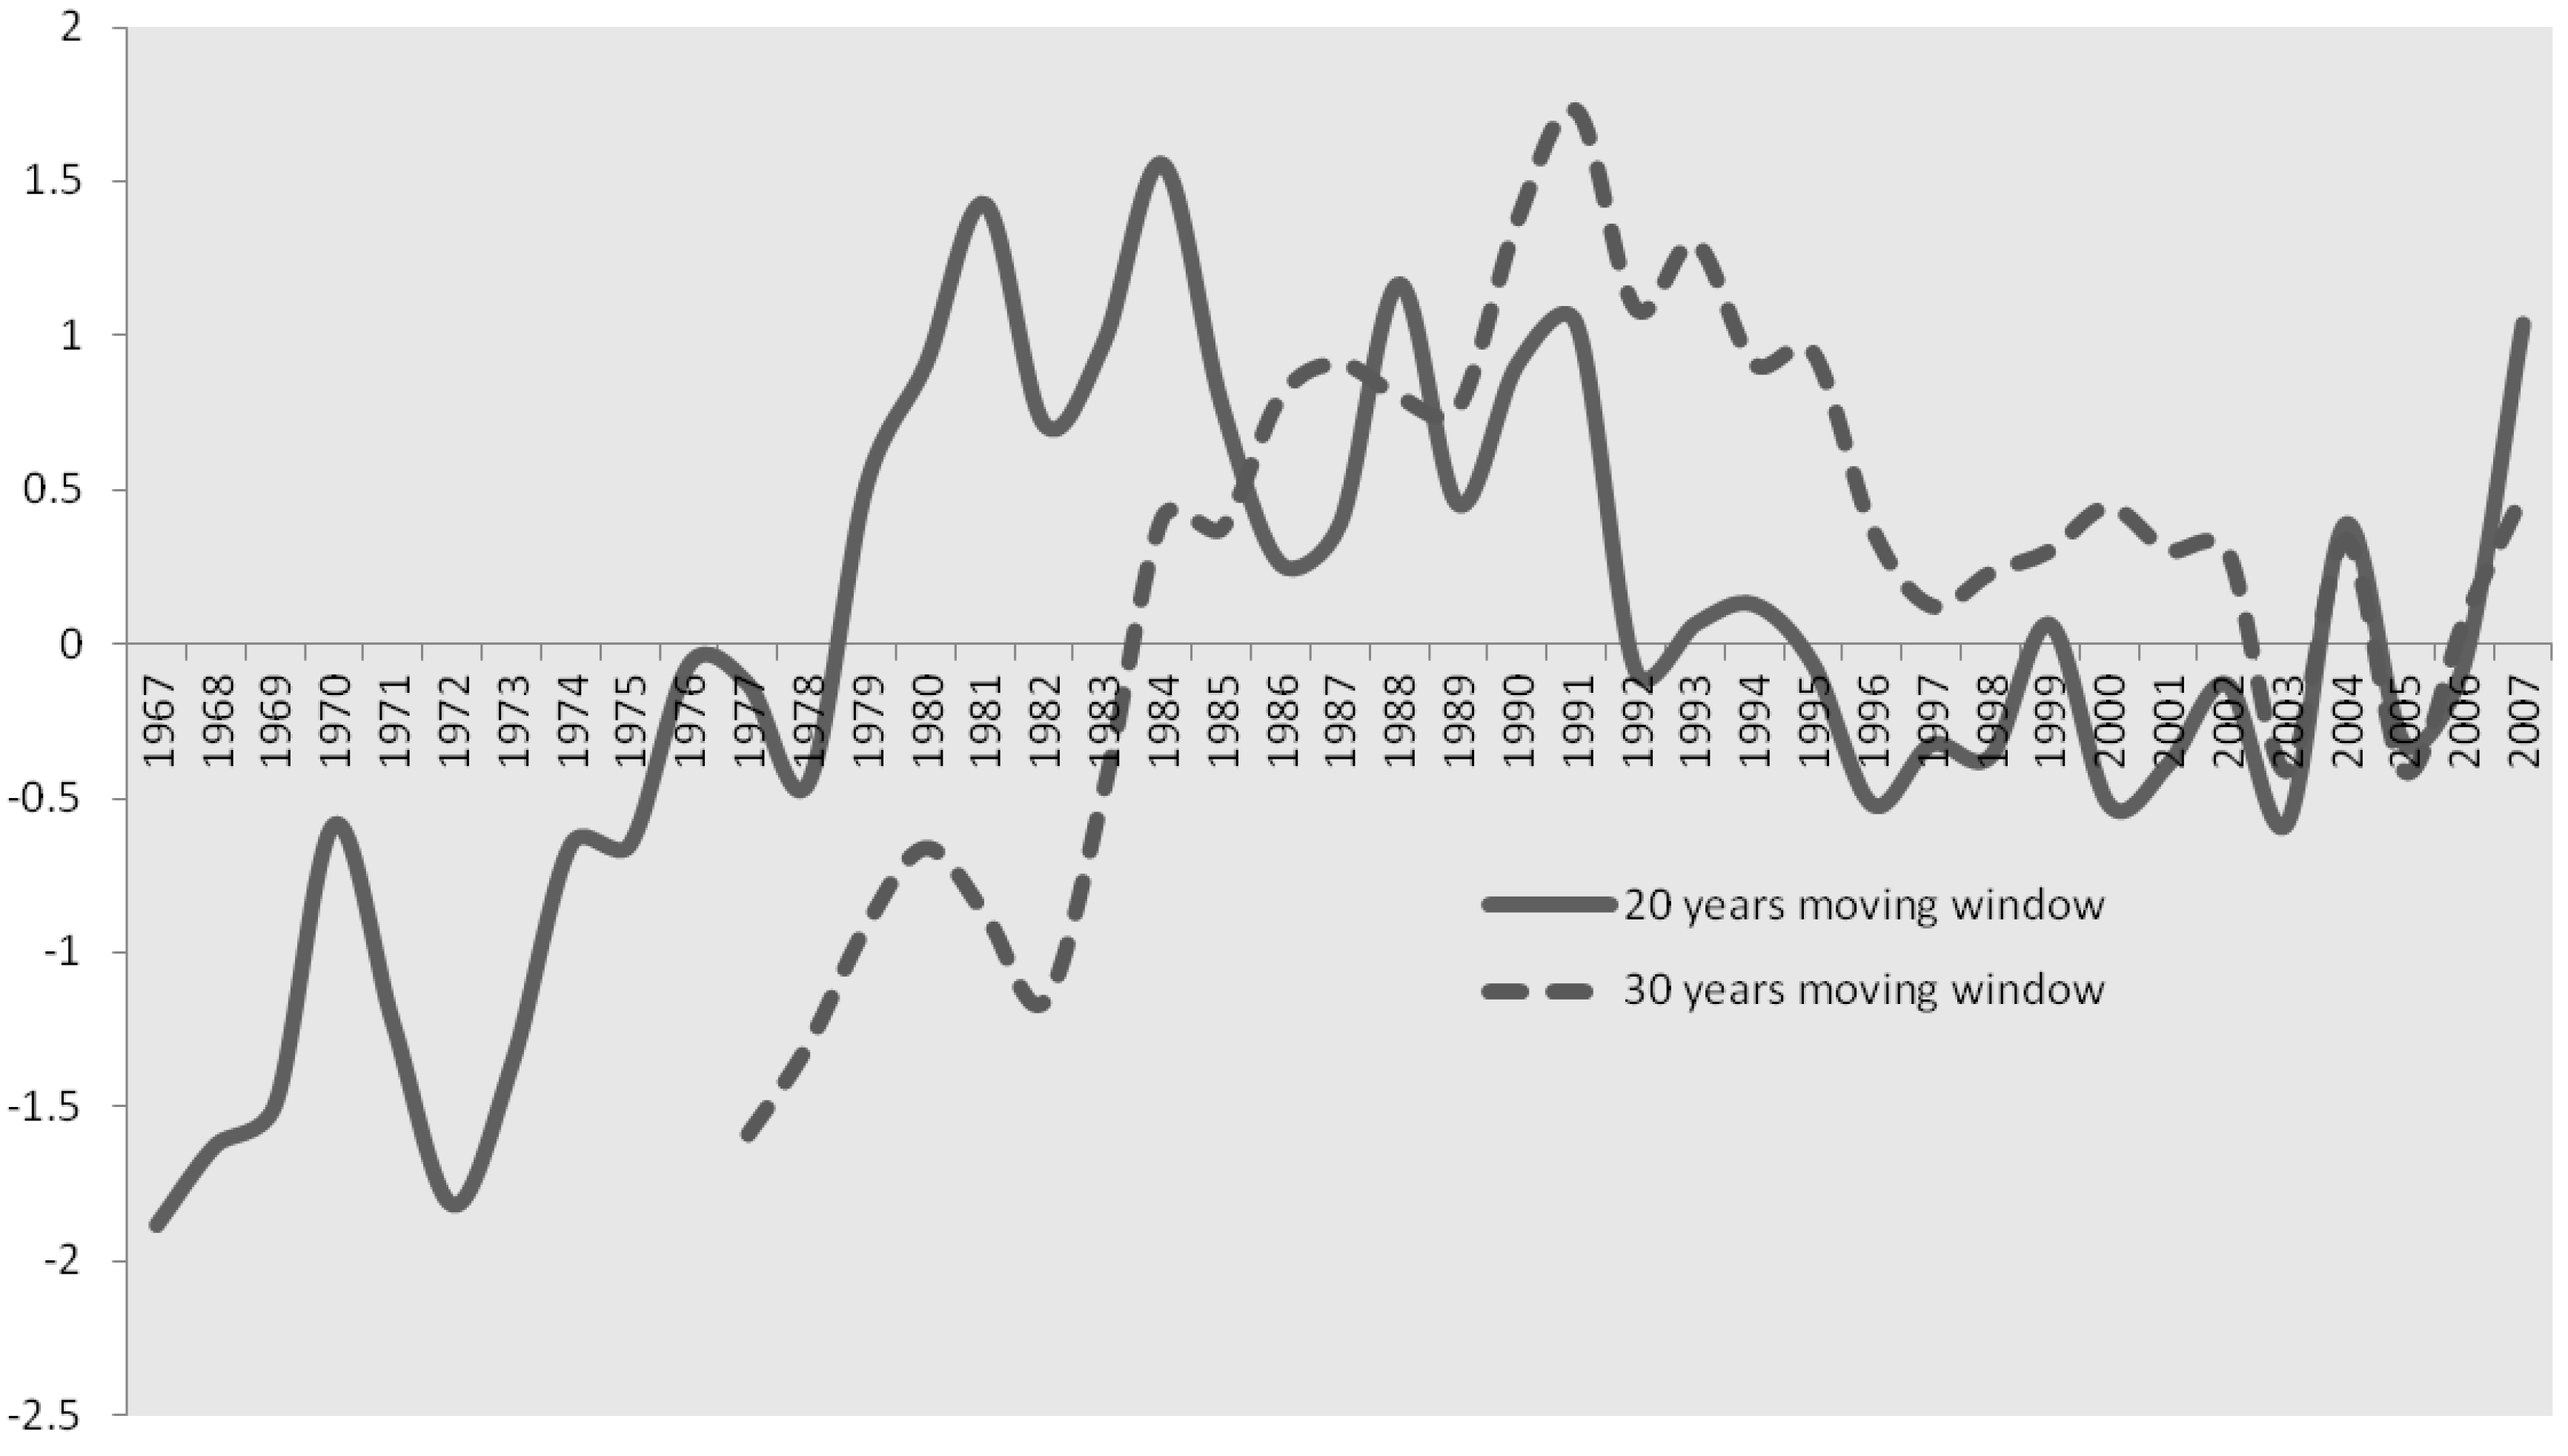
Moreover, sequential Mann Kendal test using 20 years of moving window was applied to investigate how the trend sequentially changes over the time particularly the identification of the starting point of trend. We also used 30 years of moving window to see whether the selection of the moving window influences the result of the test, and we found (
Figure 2) similar trends while using 20 years and 30 years of moving window. This sequential Mann Kendal test has already been applied by other studies [
34]. Though this method identifies the starting point of regional trends, we also have used Lepage test [
35] to identify change point (
i.e., step change) in both station wise and region wise rainfall data. The nonparametric Lepage test is a two sample test for location and dispersion assumes that the studied series size is equal to or greater than ten and this test follows the Chi-squares (χ
2) distribution with two degrees of freedom. The Lepage test has been used to detect change point or step wise change for rainfall [
36], and climate change [
26,
37].
Figure 2.
Sequential Mann Kendal test results for 20 years and 30 years moving window.
Figure 2.
Sequential Mann Kendal test results for 20 years and 30 years moving window.
Another non-parametric test known as Sen’s slope estimator [
38] was used to determine the magnitude of change in the rainfall records while the Mann-Kendall test reveals the direction of change or trend. Sen’s method is used to find the true slope of an existing trend, if there is any. The present study computes the confidence interval for the true slope at both the 95% and 99% confidence levels. All of the methods used are discussed below. To estimate the true slope of an existing trend, Sen's non-parametric method is used. Sen’s method can be used in cases where the trend can be assumed to be linear. The present study computes the confidence interval at two different confidence levels:
p = 0.01 and
p = 0.05, resulting in two different confidence intervals. The details of the procedure can be found in [
39].
The autocorrelation test is useful in identifying cyclicity or seasonality in time series data. Any positive or negative autocorrelation in the time series data put a large effect on trend detection (e.g., [
40,
41,
42]). When a positive autocorrelation is present in the series, there is the possibility of an upward trend, although this is not always the case. In this study, the autocorrelation test was performed on the seasonally averaged time series data to detect any cyclicity. As the threshold level of significance, the 95% confidence limit was used. The Mann-Kendall test is based on the null hypothesis that the time series data are independent and randomly ordered,
i.e., there is no seasonality or cyclicity (serial correlation) among the observations [
43]. While the Mann-Kendall tests were performed on the seasonal time series data in this study, an autocorrelation test was performed to identify any cyclicity in the dataset. In this study, the confidence level of 95% is used as the significance level.
Along with the non-parametric tests—the Mann-Kendall test and Sen’s slope estimator—a linear regression method was also applied for detecting and analyzing the trends in the time series. The main statistical parameter, the slope, resulting from the regression analysis indicates the mean temporal change of rainfall. The rate of change, either positive or negative, was calculated as mm/day. In this study, the trends were considered to be statistically significant using the threshold levels p < 0.1, p < 0.05 and p < 0.01.
Rainfall is a very dynamic component of weather and varies significantly over spatial and temporal scales, even across a small region. Therefore, we plotted annual and other four seasonal Mann Kendal test statistics results (Z value) for the two time scale: 1948–2007 and 1991–2007, to show the spatial variability of rainfall over the regions. The last time segment (1991–2007) is plotted to compare the overall trends with the recent trends. Moreover, though, the rainfall graphs and results in the tables are presented in mm/day/year unit as our raw data unit is mm/day, we have used mm/year unit to show the magnitude and to explain the results. The detailed results obtained from time series analysis (Mann Kendal test, Sen slop, Linear regression and Lepage test) as well the graph plotted using raw data are presented in the supplementary file.
3. Results
3.1. Rainfall Time Series Characteristics
The results reveal that mean annual rainfall is higher in the exterior zone 4854 ± 750 mm than the interior zone (3526 ± 591) mm. There was no marked difference in variance between the two time series. The mean average seasonal rainfall of the periods of record was also found to be higher in the exterior coastal zone than the interior zone. While the exterior zone has seasonal averages of pre-monsoon, monsoon, post-monsoon and winter rainfall as 838 ± 279, 2575 ± 455, 1265 ± 485 and 109 ± 70 mm respectively, the interior zone’s average values were found to be 677 ± 228, 1826 ± 339, 882 ± 283 and 100 ± 72 mm respectively.
The linear trends of daily rainfall changes in the south-west are shown in
Table 2. Results show that during the post-monsoon both the interior and exterior coasts exhibit positive linear trends within the 95% confidence limit. The rate of change in the exterior zone is quite high (+17.28 mm/year). Rainfall trends during the winter period in the interior zone are also increasing (+1.44 mm/year), even within the 99% confidence limit, in contrast, exterior zone winter rainfall shows non-significant decreasing trend.
Table 2.
Linear regression trends (b) of seasonal rainfall changes over the south-western coastal region of Bangladesh.
Table 2.
Linear regression trends (b) of seasonal rainfall changes over the south-western coastal region of Bangladesh.
| Zone (Period of Record) | Pre-Monsoon | Monsoon | Rate of Change b (mm/day/year) |
|---|
| Post-Monsoon | Winter | Annual |
|---|
| Interior (1948–2007) | +0.023 | −0.005 | +0.049 ** | +0.016 *** | +0.021 * |
| Exterior (1973–2007) | −0.066 | +0.113 | +0.192 ** | +0.008 | +0.062 * |
3.2. Trends in Annual Rainfall
Annual rainfall trends over the southwest coastal region of Bangladesh and their magnitudes were obtained using the Mann-Kendall test, Sen’s slope estimator and linear regression analysis (See Table S1). The annual trends resulting from the three tests showed similar trends. Predominantly positive trends were found over the southwest region with the exception of 2 stations, Faridpur and Khepupara, although the trends found in these two stations were not significant. In half of the stations studied (4 out of 8), annual rainfall trends were positive and statistically significant. Both the exterior and interior zones showed positive trends, which were statistically significant at the 90% confidence level. The Mann-Kendall test, however, confirms that only trends in the interior zone were significant at p < 0.1 while Sen’s slope estimator calculates the rate of change as 8.39 mm/year.
In the interior coastal zone, trends at the Khulna, Jessore and Satkhira stations were positive and significant following regression analysis, although the Mann-Kendall test confirms the significant positive trend for Khulna and Stakhira stations only. The rate of change of rainfall is higher in Khulna (+19.71 mm/year by Sen’s estimate) than the other 4 stations of the interior coastal zone, and only Faridpur showed a negative trend, which is very low (−2.55 mm/year by Sen’s estimate) and insignificant (p > 0.1). The meteorological stations in the exterior zone also revealed similar trends, as Patuakhali and Khepupara showed a positive trend while Bhola showed a negative trend. However, the annual rainfall trend was found to be very high at Khepupara (+78.84 mm/year by Sen’s estimate) and statistically significant at the 99% confidence level. The Mann-Kendall test for the station also revealed a high positive trend at p < 0.01.
3.3. Trends of Seasonal Rainfall
The results of the Mann-Kendall test and Sen’s slope estimator for the seasonal trends are given in Table S2. As shown, significant or not, most of the values were positive. Both the exterior and interior coastal zones showed significant positive trends in the post-monsoon period, of which the exterior zone exhibited a very high rate of change in seasonal rainfall (+12.64 mm/year). The winter rainfall in the interior coast also showed a positive trend at p < 0.01 where the rate of change was +1.26 mm/year. Station-specific seasonal trends suggest monsoon rainfall experiences no significant changes at the majority of the stations except Khepupara. In fact, the rate of change in monsoon, post-monsoon and winter rainfall is particularly high at Khepupara, with a statistically significant trend. The rates of rainfall change at Khepupara in the monsoon, post-monsoon and winter are +27.42, +26.30 and +1.8 mm/year respectively.
Winter rainfall was found to be increasing at the majority of stations, with statistically significant trends. Trends of post-monsoon rainfall were almost similar to those of winter rainfall, although out of 8 stations only 3 showed significant changes. Patuakhali and Khepupara, 2 stations from the exterior coast, exhibited high rates of increase in rainfall, +12.74 and +26.30 mm/year, respectively. Khulna showed the most significant (p < 0.001) rate of increase in seasonal rainfall (+16.29 mm/year). Although post-monsoon rainfall trends were found to be significant for only 3 out of 8 stations, these trends are positive (Mann-Kendal test) and increasing (Sen’s slope estimation) across the regions.
Rainfall in the pre-monsoon season does not reveal any significant trend either in the exterior or interior zone. The most significant trend in the interior zone was found at Satkhira station, which is positive and increasing at a rate of 4.14 mm/year. Barishal station also showed a positive trend within the 90% confidence limit. The only significant negative trend among all stations and all seasons was found in the pre-monsoon period at Bhola station. The rate was also quite high (−15.46 mm/year).
3.4. Temporal Variation of Annual Trends
The rainfall data period of record 1948–2007 (60 years) is divided into 3 sub-sets for temporal analysis: 1948–1970 (23 years), 1971–1990 (20 years) and 1991–2007 (18 years). The statistics reveal that, despite not showing a significant trend over the full period of record (1973–2007), the annual rainfall rate accelerated in the period 1991–2007 (Z = +1.85,
p < 0.1) with quite a high rate of 151.48 mm/year in the exterior zone. The interior zone, in contrast, despite showing a significant positive trend over the full period of record (1948–2007), did not show any significant trends in the 3 sub-sets. Khulna and Khepupara are the two stations where higher significant trends (in this case both are positive) were present over the full record length, for Khulna 1948-2007 and for Khepupara 1973–2007. Both stations show significant positive trends in the period 1971–1990 (Z = +1.98,
p <0.05 and Z = +1.71,
p < 0.1). Satkhira, the other station displaying a significant positive trend over the period 1948-2007, showed a positive trend between 1991 and 2007 only (Z = +1.94,
p < 0.1) at a rate of 34.31 mm/year. Jessore and Bhola are the other two stations along with Satkhira, which revealed a similar character (Table S3). Bhola, however, shows a very high rate of increasing annual rainfall from 1991 to 2007 of 173.38 mm/year (Z = +1.69,
p < 0.1). The only negative and significant trend is found in Faridpur station over the 1948–1970 period (Z = −2.22,
p < 0.01). The rate of change was found to be as high as 74.83 mm/year. From the analysis, it is difficult to comment on any pattern of annual rainfall change from 1948 to 2007 in southwest Bangladesh. Results suggest more significant (and positive in all cases) trends occur between 1991 and 2007 than in the other periods. The spatial variation of annual and four seasons’ rainfalls are presented in
Figure 3 and
Figure 4.
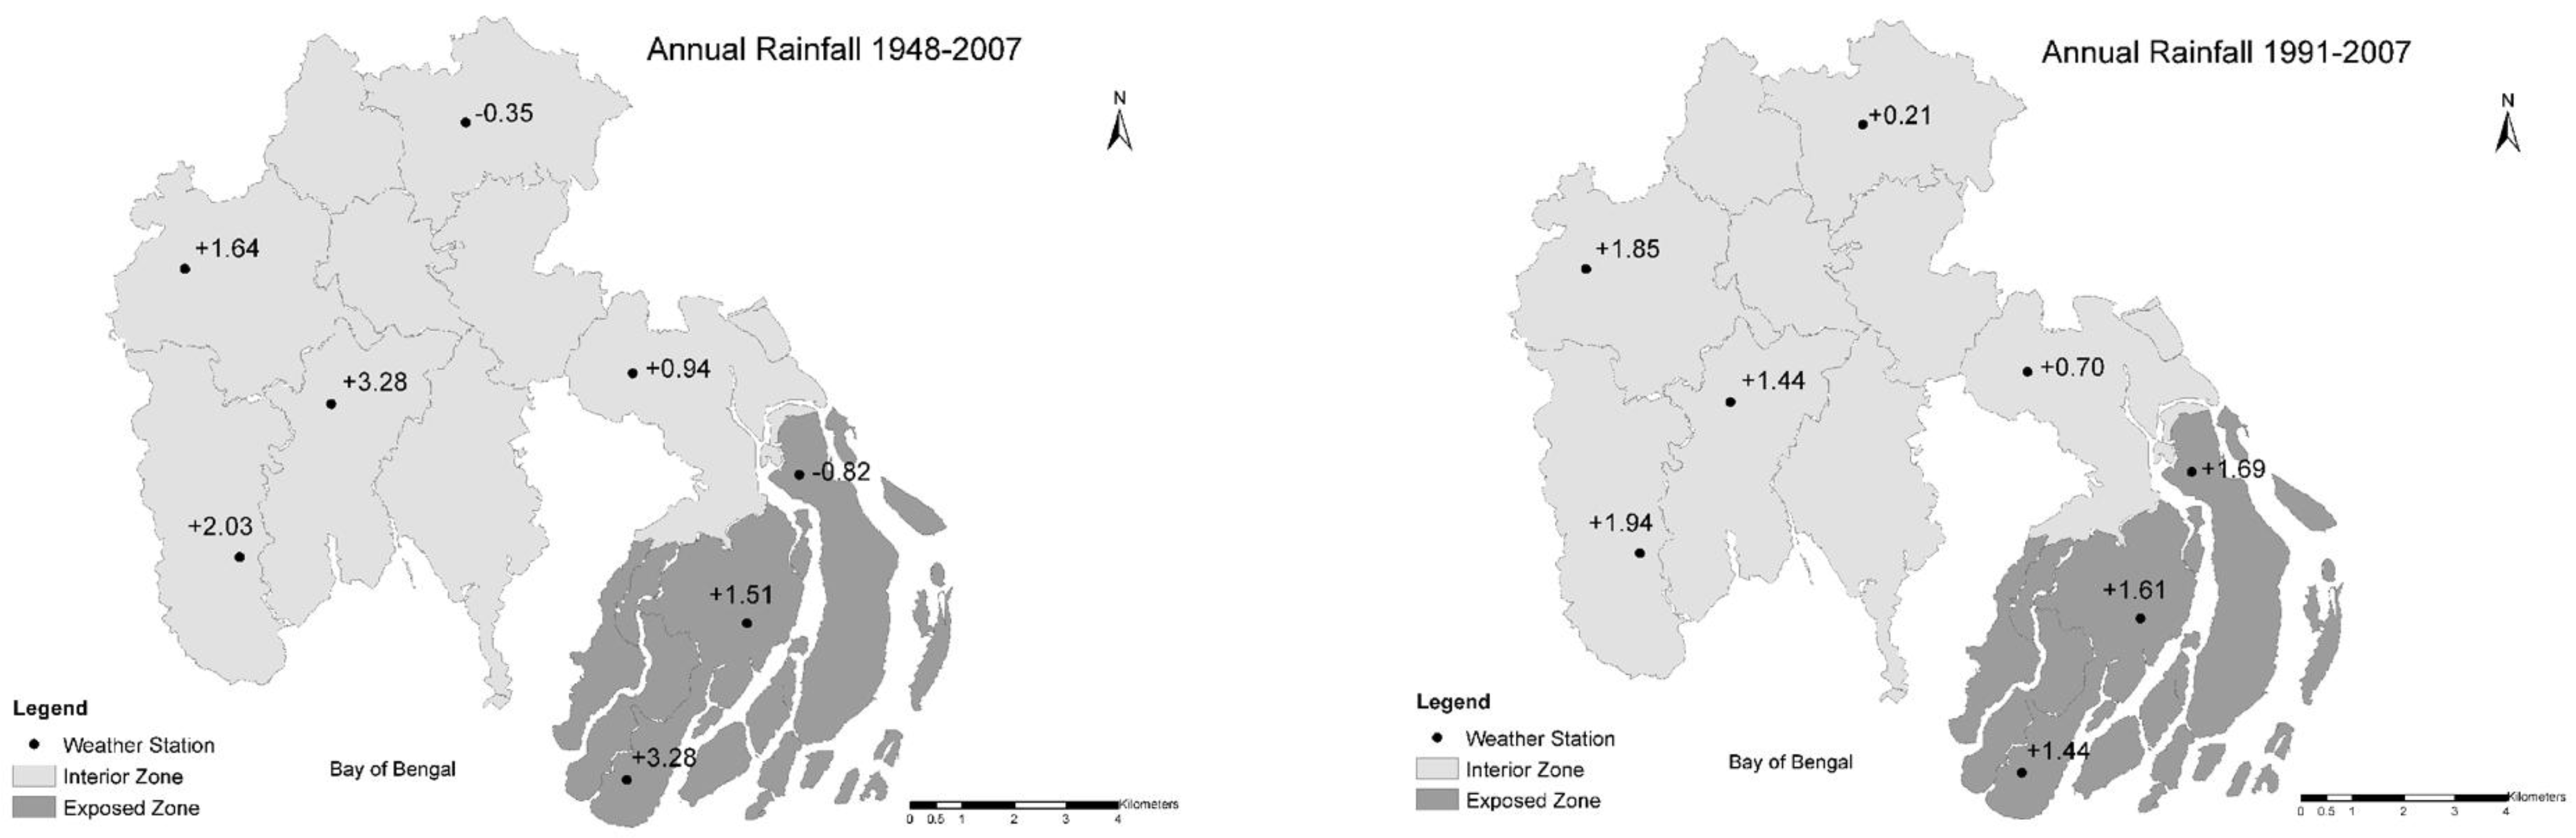
Figure 3.
Spatial variation of annual rainfall trends (Mann Kendall test z) from 1948–2007 and 1991–2007.
Figure 3.
Spatial variation of annual rainfall trends (Mann Kendall test z) from 1948–2007 and 1991–2007.
3.5. Temporal Variation of Seasonal Trends
Temporal variation in the seasonal trends were analyzed, and the period of record was again divided into 3 time periods as for the annual trend analysis (see
Section 3.4). It reveals that neither the exterior nor the interior zone exhibited any significant trend during the time periods analyzed, with the exception of a significant negative trend in the 1948–1970 period in the interior zone (Z = −1.74,
p < 0.1). Values from the Mann-Kendall test and Sen’s slope estimator suggest that pre-monsoon rainfall does not show any significant changes after 1970. Unfortunately, data for the period 1948–1970 is not available for the exterior coastal zone. However, the statistics suggest that the majority of stations in the interior zone show significant negative trends over the period 1948–1970. Data sets are available for both the interior and exterior coastal zones from 1973 onwards. However, over the time spans 1971–1990 and 1991–2007, the majority of stations show insignificant trends, except Satkhira station where a significant positive trend was evident between 1971 and 1990. Although pre-monsoon trends are found to be non-significant, rainfall rates at most of the stations (except Jessore, Satkhira and Bhola) have followed a decreasing trend since the 1990s. Moreover, the interior and exterior zone rainfall patterns have also followed decreasing trends since the 1990s.
Temporal variation of monsoon rainfall, somewhat like the pre-monsoon season, suggests fewer significant trends post-1970 (Table S5). The only significant trend (Z = +2.24, p < 0.01) found during the 1971–1990 period was a positive trend at the Khulna station. The rate of increase in rainfall was also found to be very high at 52.16 mm/year. Two significant negative trends were found in the period 1948–1970. One of these is in Faridpur (Z = −1.85, p < 0.1), which might have affected the trend (Z = −1.74, p < 0.1) of the interior zone.
Unlike the pre-monsoon and monsoon periods, post-monsoon and winter rainfall shows significant trends over time (Tables S6 and S7). Post-monsoon rainfall exhibits significant and positive trends at the majority of stations, including the exterior zone, over the 1991–2007 periods. In fact, except for Khulna station between 1948 and 1970, all of the significant trends are concentrated in the post-1970 period.
The rates of change in seasonal rainfall were very high over this time span, ranging from 33.58 to 52.07 mm/year. Post-monsoon rainfall trends were not consistent between 1948 and 1970, and 1971 and 1990 but were, however, observed to increase at all weather stations post-1990 (Table S6). In contrast to the post-monsoon rainfall trends, winter rainfall patterns show contrasting variation of significant trends over the time spans (Table S7). Interestingly, significant positive trends are concentrated in the 1971–1990 periods while significant negative trends are concentrated in the post 1991. None of the stations were found to be consistent with respect to trends, either significant or not, over the time spans examined.
3.6. Cyclicity in Annual Rainfall Patterns
An autocorrelation test was performed to investigate the presence of any periodicity in the rainfall records. Since the data record of the interior coastal zone is larger than that of the exterior coastal zone (60 years compared to 35 years), the interior coastal zone is expected to show a more reliable and significant estimate of autocorrelation. No significant autocorrelation was found in the annual datasets of the interior and exterior zones. The seasonal datasets, however, show that the rainfall record series in the interior coastal zone is auto correlated. The pre-monsoon and monsoon rainfall records in the interior zone are correlated with an 11-year cycle (r = −0.33 and −0.41, respectively, p < 0.05) while the post-monsoon and winter records show either weak or insignificant (p > 0.05) autocorrelation.
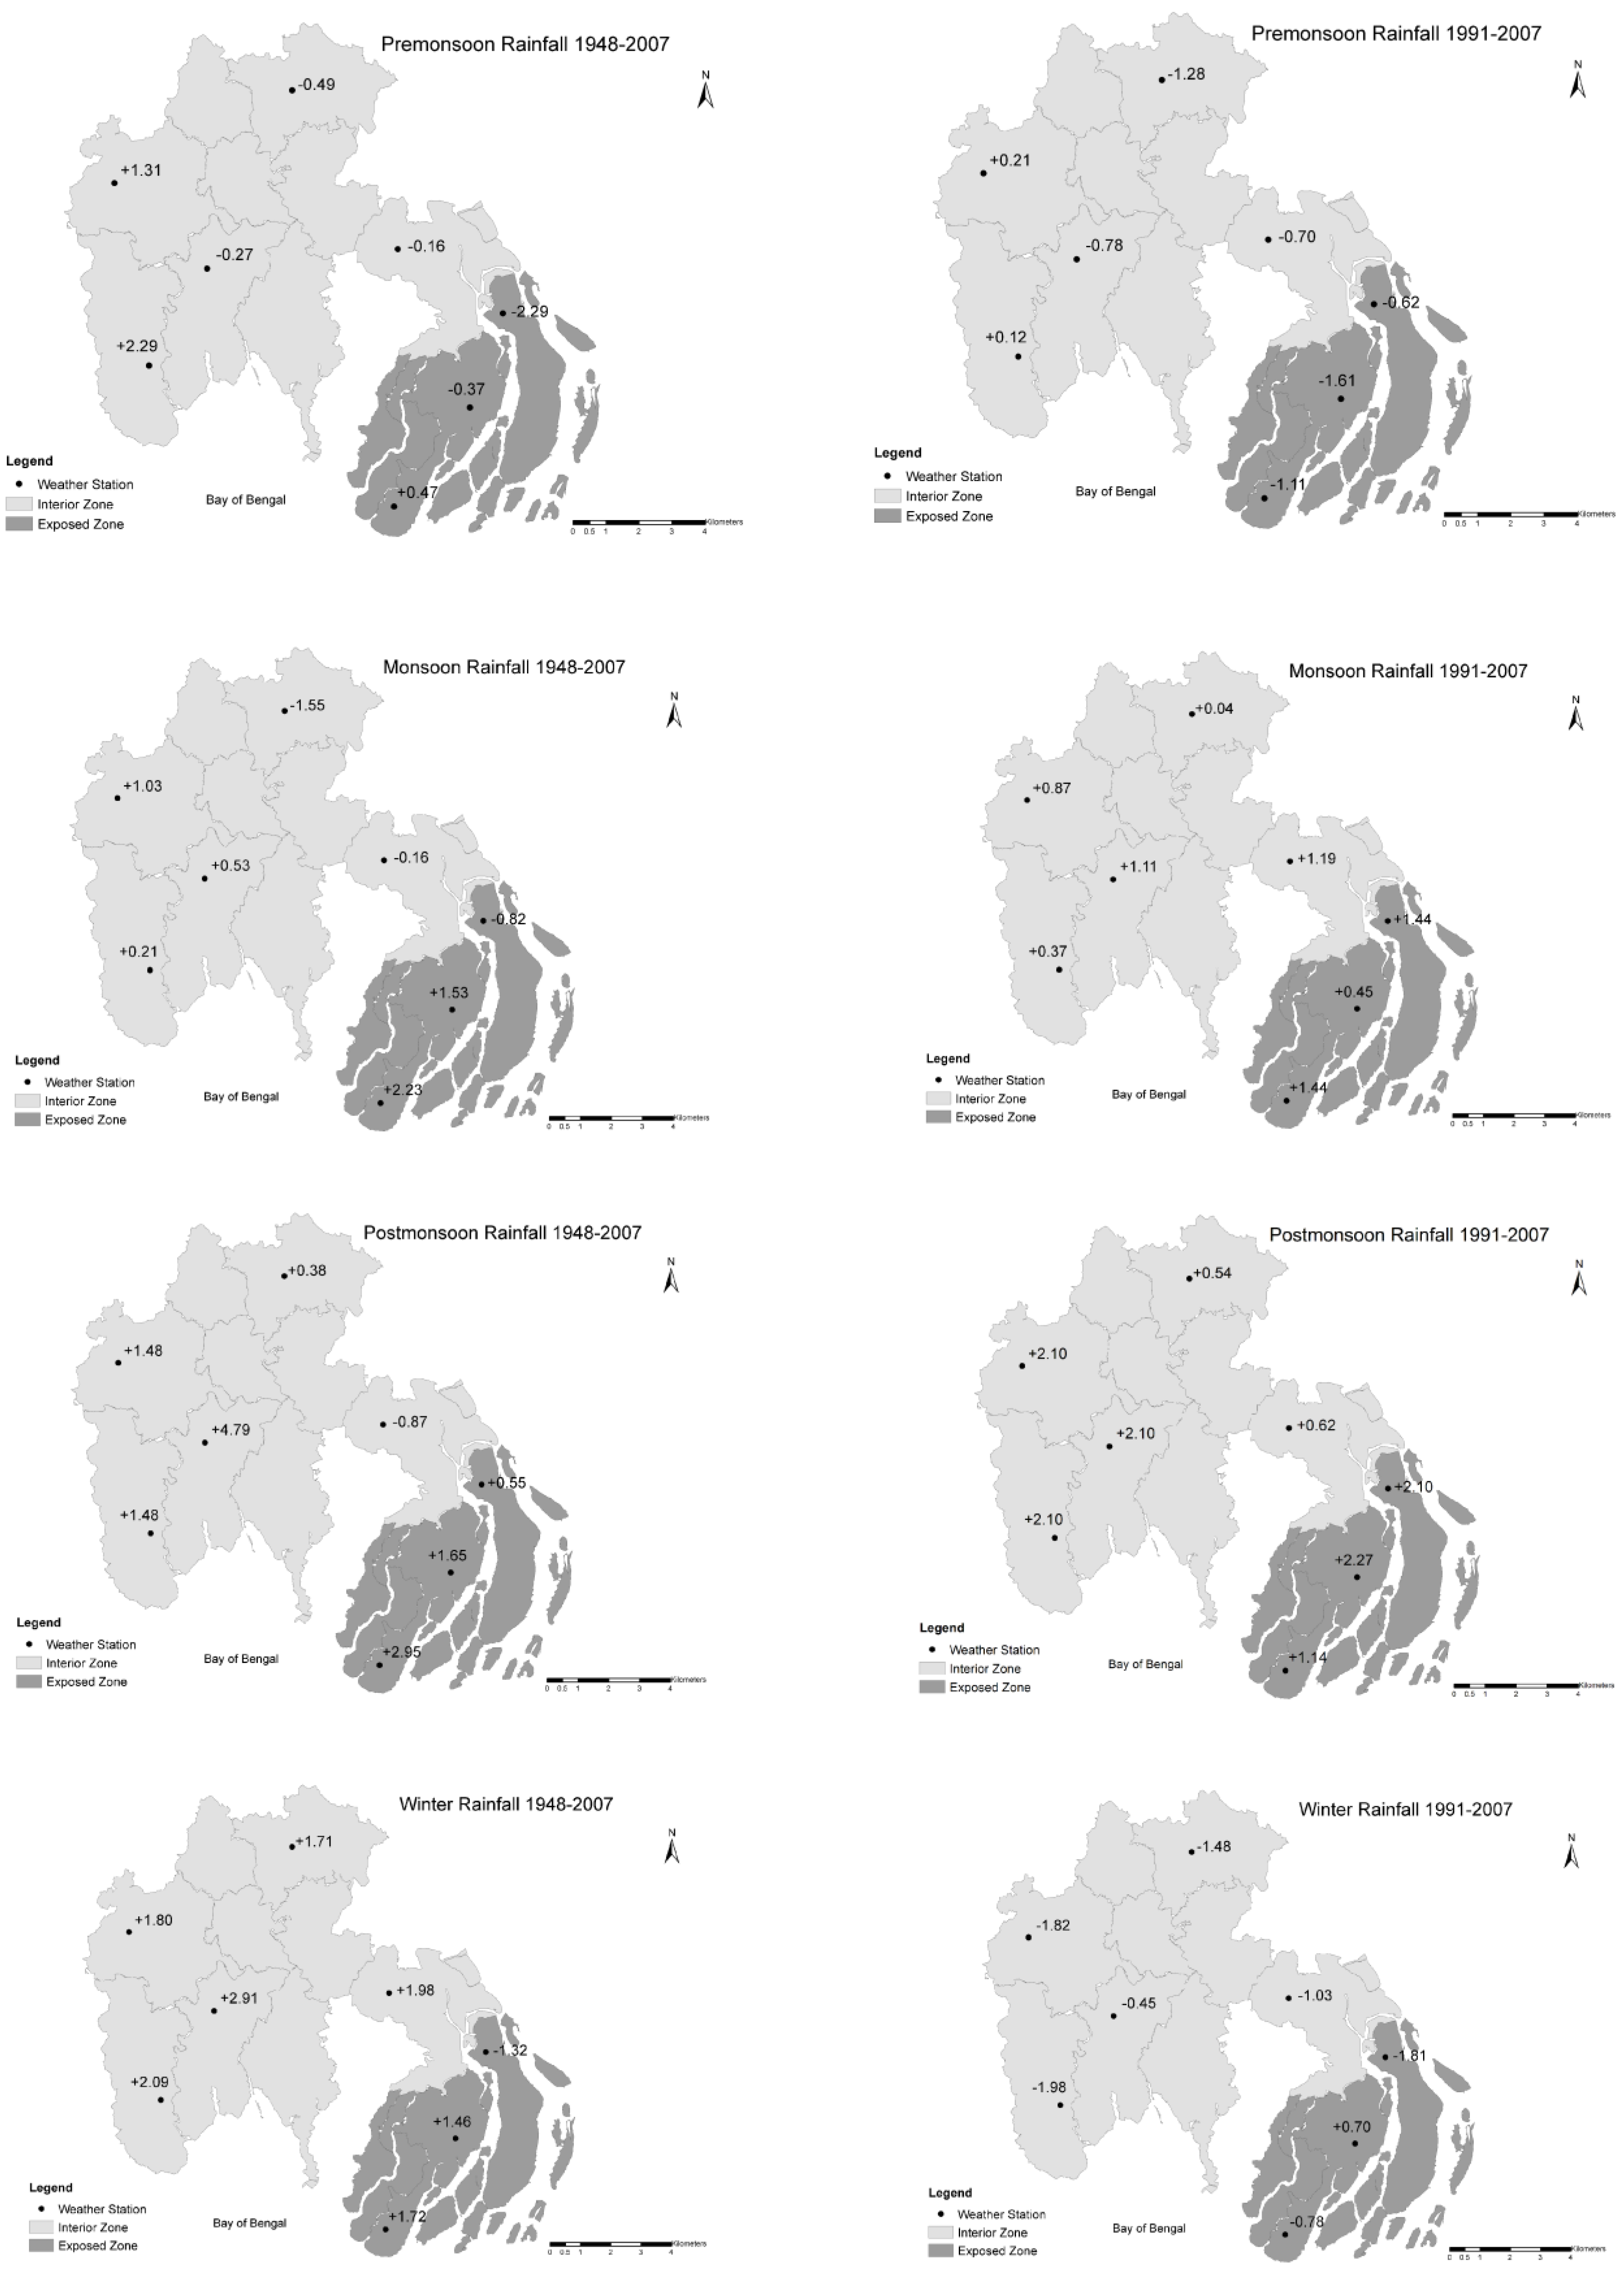
Figure 4.
Spatial variation of four seasonal rainfall trends (Mann Kendall test) in the time period 1948–2007 and 1991–2007. Exterior zone rainfall trends are limited to the time period 1973 to 2007 due to data unavailability.
Figure 4.
Spatial variation of four seasonal rainfall trends (Mann Kendall test) in the time period 1948–2007 and 1991–2007. Exterior zone rainfall trends are limited to the time period 1973 to 2007 due to data unavailability.
4. Discussion
Detailed analysis of the observed data clearly indicates that rainfall increased between the late 1940s and 2007 across all regions of the south west coast of Bangladesh. The changes are not seasonally and temporally homogenous over this time period.
In our analysis, the annual rainfall series showed a significant positive trend in the interior coastal zone, where rainfall is increasing at a rate of 8.4 mm/year over the period 1948–2007. About 38% of the meteorological stations showed significant trends, all of which are positive. The highest significant rate of +78.84 mm/year was found at Khepupara. Rainfall rates decreased during the monsoon seasons of the interior coast, whereas rainfall trends in the exposed zone exhibited an upward trajectory during the 1948–2007 and 1973–2007 periods. Temporal variation of monsoon rainfall showed non-significant but increasing trends across the regions post-1970, with the exception of Faridpur and Bhola, whilst rates of change were increasing and positive for all stations in the post-1990s. Rahman
et al. [
4] also reported this non-significant monsoon trend while Ahsan
et al. [
12] observed an increasing trend (3–4 mm/year) in monsoon rainfalls between 1960 and 2010 in the southwest coastal regions.
The post-monsoon season is receiving higher rainfall, as evident from both linear and non-linear statistical tests, and also from both station-wise and zone-wise rainfall analyses. Seasonal trend analysis over the 1948–2007 period showed a marked increase in post-monsoon rainfall, where approximately 63% of the meteorological data showed significant and positive trends (no negative trends were found). However, these increasing rainfall trends have accelerated significantly (95% to 90% confidence level) since the 1990s. Furthermore, rainfall is increasing at a higher rate than in the monsoon season. Ahsan
et al. [
12] also reported that post-monsoon rainfall increased by 0.65 mm/day over the period 1960–2010, while Roy
et al. [
22] reported an approximately 8% rainfall increase in the south-west region of Bangladesh. The upward rainfall trend in the monsoon and accelerated trend in the post-monsoon indicate the possibility of wet season extension since the 1990s. Moreover, Shahid [
6] also reported non-significant but increasing trends in post-monsoon rainfall.
The dry seasons (pre-monsoon and winter) are becoming dryer as they experienced downward trends in rainfall between 1948 and 2007. These trends are significant and have been intensifying since the 1990s. Pre-monsoon trends have decreased by −24.3 mm/year and −4.5 mm/year in the exterior and interior zones respectively since the 1990s. Zone-wise rainfall patterns also reflect the station-specific rainfall trends with the exception of Jessore and Satkhira stations. Rainfall trends in the pre-monsoon are not homogenous over the time period, where negative trends were observed between the periods 1948–2007 and 1991–2007, whilst positive trends were observed from 1971 to 2007. In winter, on the other hand, about 36% of stations showed significant and negative trends between 1991 and 2007. Interestingly, the same percentage of stations, but not the same stations, showed significant positive trends from 1971 to 1990.
However, the annual pre-monsoon trend in Bangladesh increased over the period 1958–2007, although only some of the areas in south-west coastal Bangladesh experienced a decreasing trend in the same period [
8,
39]. Our study concentrated on the south-west regions of Bangladesh, where we found decreasing trends in pre-monsoon rainfall except in the Jessore and Satkhira regions. Moreover, annual trends were found to be positive in the period 1947–2007, whereas decreasing trends were mostly observed post-1990s. Results from the analysis of winter rainfall trends comply with those of other studies, e.g., [
23] and Shahid and Khairulmaini [
8] who reported a decreasing winter trend of −0.47 mm/year in the period 1969–2010.
Though we have discussed the spatial variability of rainfall in our results and discussion, conclusion can be drawn from the
Figure 3 and
Figure 4, which shows the spatial rainfall variability for the time period 1948–2007 and 1991–2007. Annual and wet season (monsoon and post-monsoon) rainfalls have increased in all weather stations except Barishal and Faridpur, where dry season (pre-monsoon and winter) rainfalls have followed decreasing trends in all weather stations. Even though, Satkhira and Jessore stations rainfall trends are found positive in the time period 1948–2007, the magnitude is lower compared to the time period 1991–2007.
The 11-year cycle might be indicative of the influence of the solar cycle in the pre-monsoon and monsoon seasons. Post-monsoon and winter rainfall rates show strong significant trends in most stations with no significant cyclicity. This can be explained by the monsoon or bulk rainfall shifting towards the post-monsoon period, indicating the late arrival of the monsoon wind. Furthermore, the last two decades of rainfall trends indicate that winters are becoming drier. These results are consistent with the projections of GCMs (e.g., [
18,
44]) under global temperature increases.
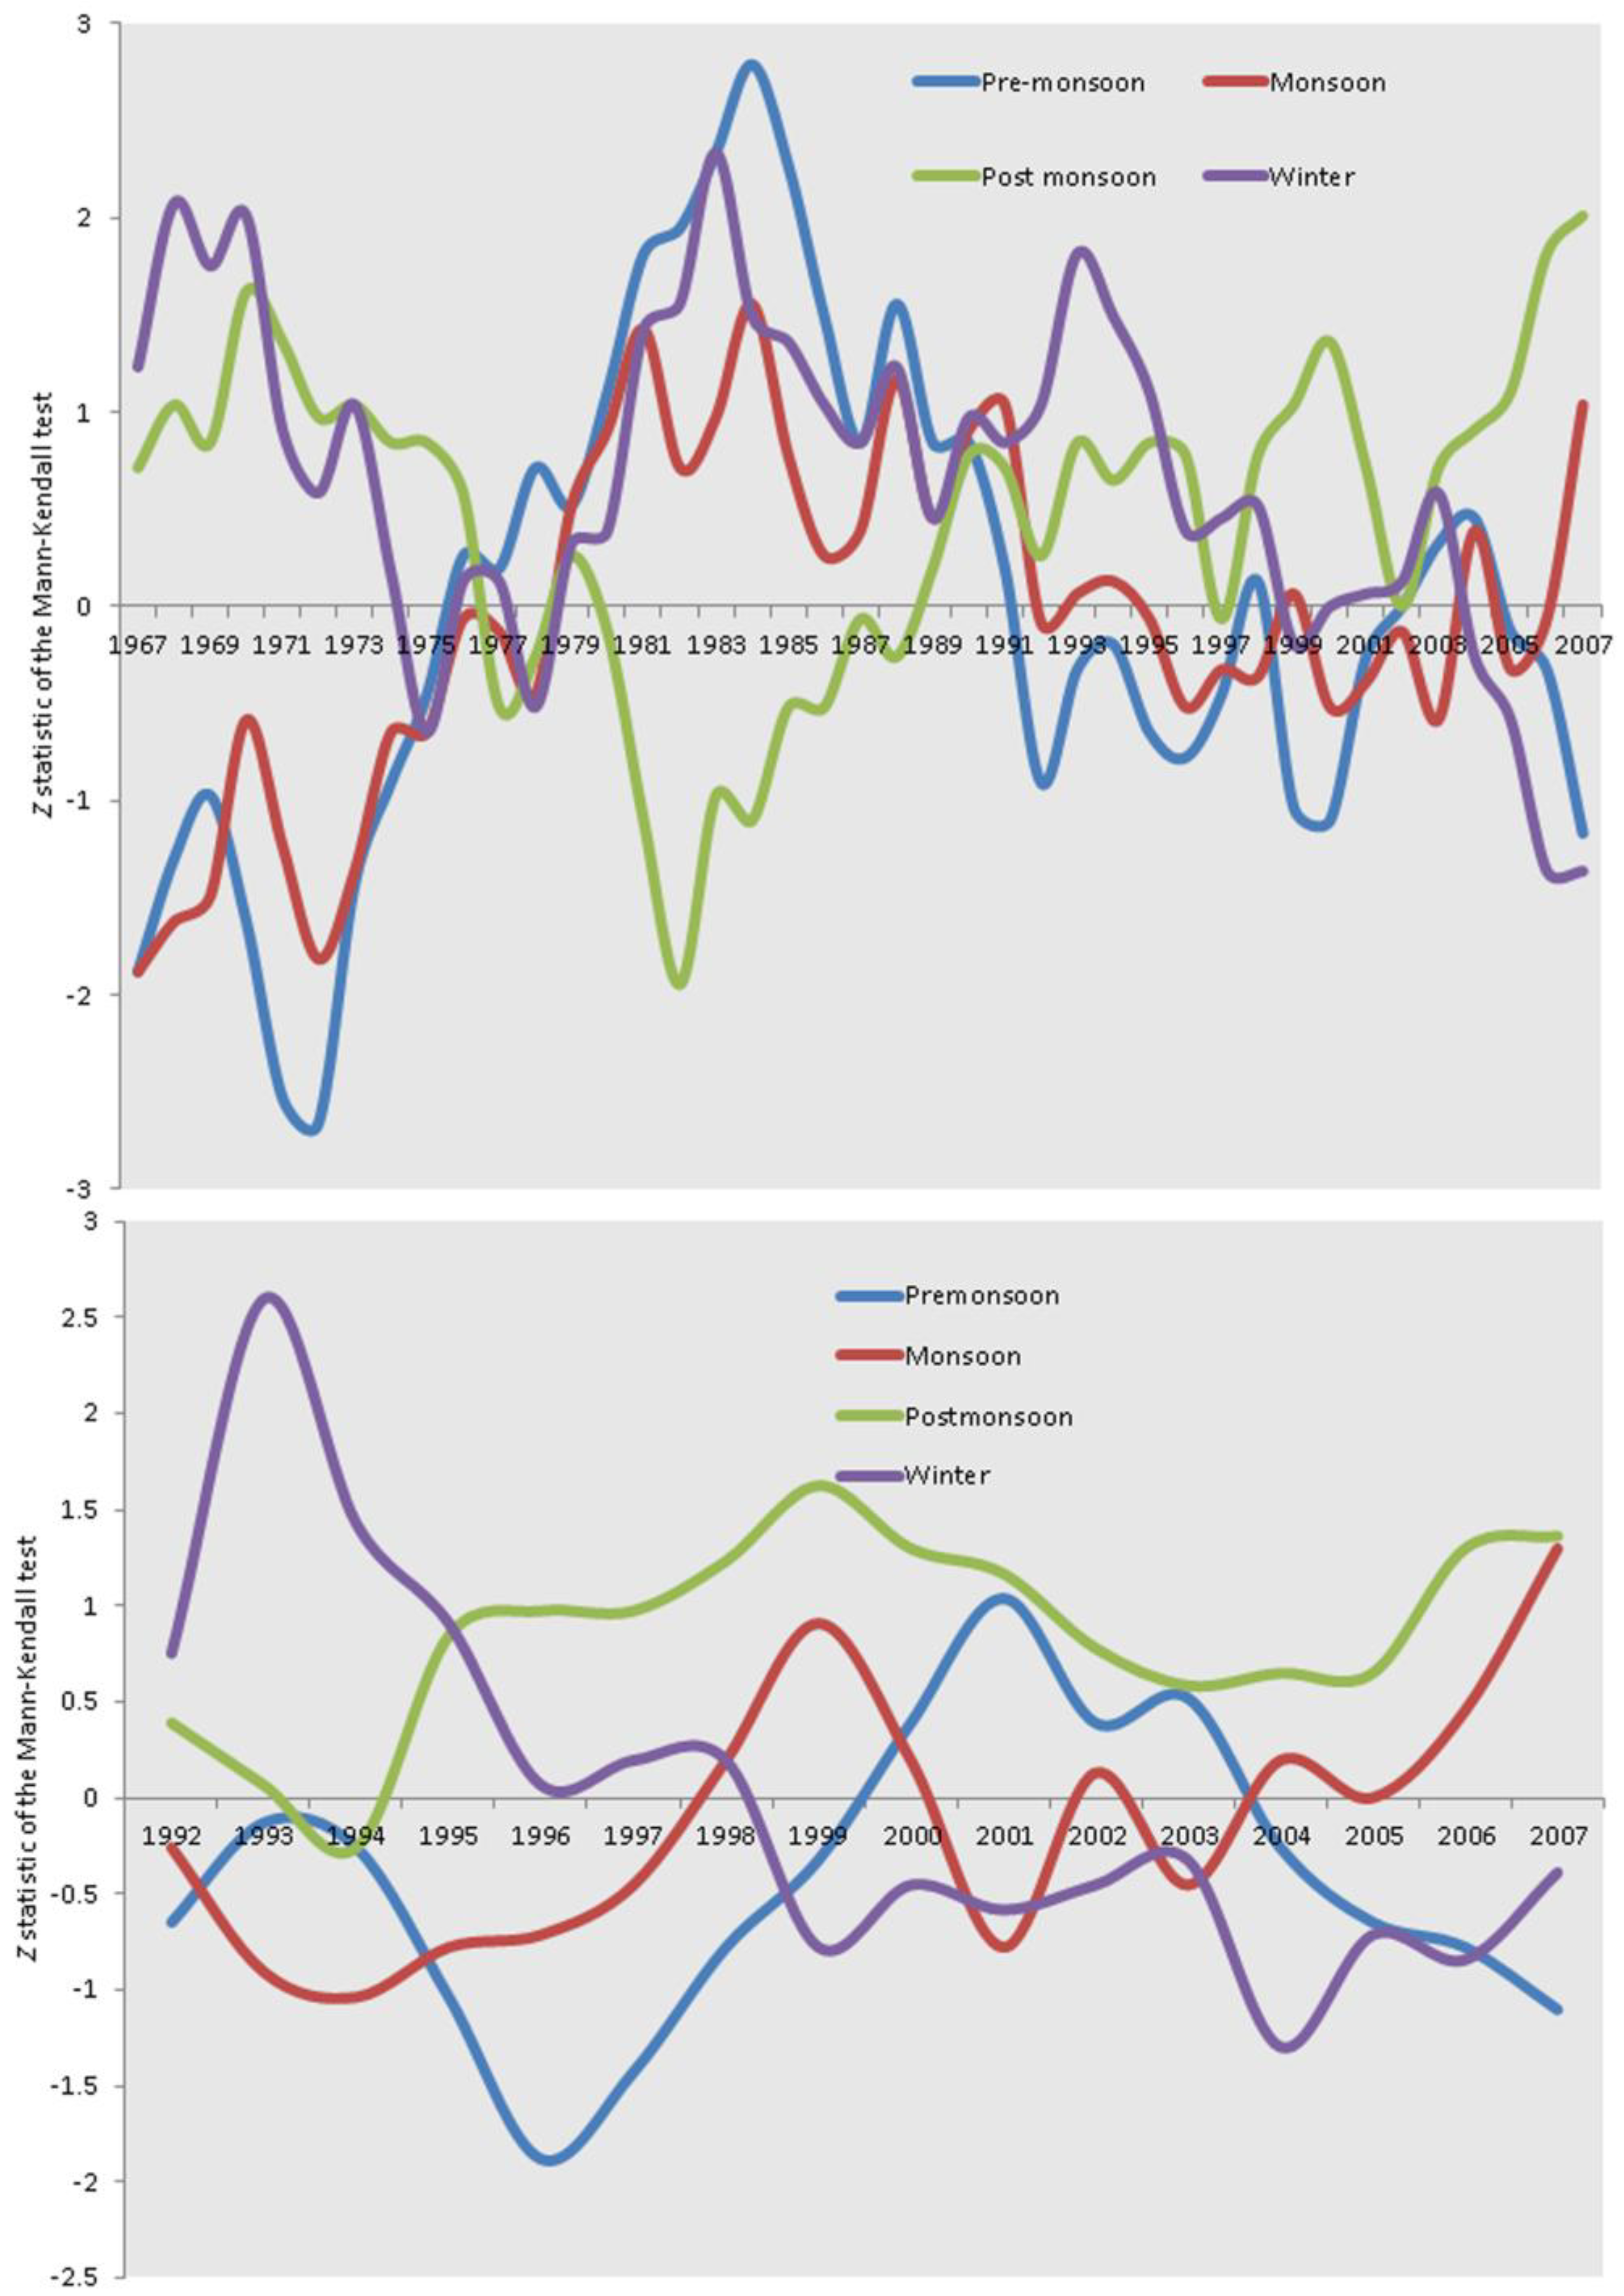
The sequential Mann Kendal test also shows (
Figure 5) the declining trends for pre-monsoon and winter season, whereas, increasing trend for post monsoon season. However, the monsoon rainfall is also variable over the decades and is consistent with the results of cyclicity analysis and trends observation. This also reveals that these trends are mostly following from mid 80s. Though the sequential Mann Kendal test and trends statistics are shown the changes or starting point in trends magnitude from mid 80s, any step change point was not identified through the Lepage test except in Khulna station. However, the change point has been also observed in winter season in most of the weather stations.
The observed declining trend of pre-monsoon rainfall and increasing trend of monsoon rainfall trends could pose stress on local crops production (e.g., Aus, Til), which is already evident [
45] in this region. Moreover, the declining trend in pre-monsoon rainfall coupled with declining trend of water availability [
26] likely to increase irrigation demand, particularly for Boro rice production. The increasing trend of pre-monsoon rainfall in Satkhira region could solve the water scarcity problem, whereas, in Jessore, it could increase water logging problem.
Again, increasing rainfall in the post-monsoon is also a concern for crops such as Jute and Aman paddy. In Addition, This increasing trend in post monsoon rainfall combined with floodwater from outside of the territory suggesting the increasing risk of flood events. However, this increasing trend of post monsoon rainfall could be advantages for implementing technologies (e.g., Rain Water Harvesting (RWH) and Pond Sand Filter (PSF) systems), which could support to solve water scarcity in this region. Moreover, fresh water flushing by heavy rainfall in the post-monsoon, washing away saline water, may leave the land in a more suitable condition for the cultivation of vegetables and other crops.
There is a need to understand rainfall trends, our knowledge of which can be enhanced by further research. The empirical research could include trend detection similar to that carried out in the present study for weather stations across the entire country. Methodology of this study particularly change point analysis and sequential trends could be useful for other trend detection studies (e.g., temperature, water discharges). This could be furthered by the application of different non-parametric tests and, more substantially, the application and detection of thresholds or tipping points which could increase our knowledge in relation to agriculture, livelihood and rainfall. Moreover, palaeo-environmental techniques could be useful to reconstruct historical data to fill long term data gaps and allow the reconstruction of historical rainfall patterns and agriculture in this delta zone.
Figure 5.
Sequential Mann Kendal test results for interior (Top) and exterior (Bottom) zone using 20 years moving window.
Figure 5.
Sequential Mann Kendal test results for interior (Top) and exterior (Bottom) zone using 20 years moving window.


